Embed Size (px)
Citation preview

IndonesiaFood Security Monitoring BulletinSpecial Focus: Impact of El Niño
Volume 2January 2016

Key messages
1. Following a delay in the onset of the monsoon season, rains have started in most of Indonesia. However parts of eastern Indonesia continue to face severe drought. An estimated 3 million Indonesians live below the poverty line in severely drought impacted districts with 1.2 million of these reliant on rainfall for their food production livelihood.
2. Late onset of rains and subsequent delays in planting have two critical cascading effects: extension of the lean season and increased exposure of the second rice planting to peak dry season which increases the probability of crop damage or failure.
3. The delay in the rainy season has slowed progress in planting of the main rice crop for 2016, with significant delays in East and Central Java – key rice producing provinces. Ten and seven percent of rice fields in East Java and Central Java are delayed and may miss the critical window for planting, endangering crops.
4. Delays in the main planting season will extend the lean season with negative impact on vulnerable households. Localized reductions in rice production are expected, raising concerns for large numbers of subsistence farming families in the drought-affected areas.
5. The extended lean season will stretch resources among poorer households who spend a large share of their limited income on food, with prices likely to rise while the next harvest is postponed. In addition, without efforts to accelerate planting immediately daily agricultural wage laborers will continue to have reduced income opportunities.
6. Record high prices of rice are expected to weigh heavily on food access and stress the food and livelihood security situation of the most vulnerable populations.
7. Increased probability of floods in the rainy season may impact food access by disrupting travel networks and presenting hazards including landslides in vulnerable, low socio-economic areas

Introduction
This is the second bulletin in a series on the impact of drought on food security in Indonesia. The first bulletin is available online: http://www.wfp.org/content/indonesia-food-security-monitoring-2015
The first series of maps and analysis in this bulletin continue to monitor the extent of drought in Indonesia from September through December 2015. These analyses are driven by satellite data on rainfall, land-surface temperatures and vegetation growth.
In the next section, the analysis focuses on the effect of drought on the start of crop planting in Java. Using remote sensing techniques, the analysis quantifies where planting is estimated to have started and compares this to previous El Niño years and normal years.
The third section examines the potential socio-economic impact of drought. This part of the analysis is based upon scenarios which may change as the drought continues to evolve. Finally, an outlook section concludes this round of the bulletin.
List of maps and analysis
The bulletin contains the following maps and analyses:
1. Number of days since last rainfall
2. Rainfall anomaly for October – December
3. Historical impact of El Niño on crops
4. Agricultural drought as measured through the Vegetation Health Index
5. Population affected by agricultural drought
6. Delays in planting of rice
7. Rising price of rice
8. Weather outlook

Current extent of drought
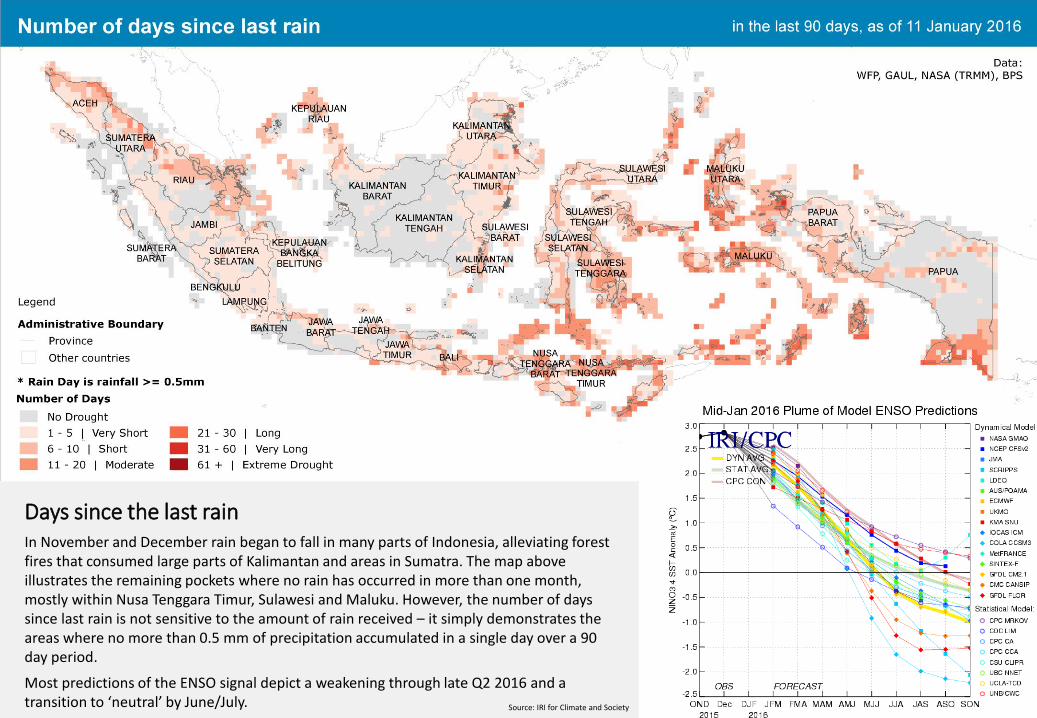
Days since the last rainIn November and December rain began to fall in many parts of Indonesia, alleviating forest fires that consumed large parts of Kalimantan and areas in Sumatra. The map above illustrates the remaining pockets where no rain has occurred in more than one month, mostly within Nusa Tenggara Timur, Sulawesi and Maluku. However, the number of days since last rain is not sensitive to the amount of rain received – it simply demonstrates the areas where no more than 0.5 mm of precipitation accumulated in a single day over a 90 day period.
Most predictions of the ENSO signal depict a weakening through late Q2 2016 and a transition to ‘neutral’ by June/July. Source: IRI for Climate and Society

Comparison to 1997 / 1998 El Niño related drought (Oct-Dec)Rainfall anomaly measures the amount of rain which fell in a given period compared to a long term average. These maps illustrate anomalies in rainfall over a three month period (October-December) compared to a 30 year average for the same period.
These maps show that most of Indonesia has received lower than normal rainfall in 2015 (with several areas facing extreme deficits shown in dark red). However, the current drought is much less severe than the 1997 El Niño event as depicted for the same period in the top map.

Agricultural impact

Historic relationship between El Niño and crop production in Indonesia
Drought related to El Niño is typically more extensive than in normal years, and has stronger negative impacts on the condition of crop lands and the timing of the crop cycle. Using the Vegetation Health Index (VHI) as a measure of drought, the figure on the left illustrates the percentage of crop lands which experienced drought (VHI<35) by season over the past 30 years.
However, a strong El Niño does not always directly impact rice production as the timing of the onset of El Niño conditions and its rate of development influence the timing of rain in relationship to crop cycles. When an El Niño effect starts early and develops quickly, as was the case in 1997/98. the impact on production is lower than an El Niño that begins late and develops slowly, as was the case in 2002/03. With a slow El Niño development, in many areas the rains still occur and farmers have no signal that rainfall in the dry season will not occur. In general, crops planted during the dry season uses about 70% of water from irrigation and 30% from rainfall.
Below-normal rainfall and late onset of the rainy season in Indonesia typically delays the rice crop cycle until sufficient cumulative rainfall has fallen for crops (planting and harvesting) by up to 8 weeks. This delay extends the lean season and subsequently planting and harvesting of the second season crop. Furthermore, the delay exposes the second season crops to a high probability of drought.
El Niño and crop impacts in Indonesia
2009
2006
20042002
1997
1994
1991
El Niño Years: 1987
0
5
10
15
20
25
30
35
40
45
1983 1987 1991 1995 1999 2003 2007 2011 2015
% o
f cr
op
Lan
d w
ith
VH
I <
35
Percentage of Crop Land Affected by Drought
Season 1 Season 2
19941997 2002
20042006
2009
2015
10
10.5
11
11.5
12
12.5
13
13.5
14
14.5
35
40
45
50
55
60
65
70
75
80
1993 1995 1997 1999 2001 2003 2005 2007 2009 2011 2013 2015
Har
vest
ed
are
a h
a, m
illio
ns
Pro
du
ctiv
ity
ton
s, m
illio
ns
Total Annual Paddy Production and Harvested Area
Production Paddy (ton) Harvested Area Rice (ha)

Impact of drought on agriculture
The Vegetation Health Index (VHI) combines two components: deviations in land surface temperature and the extent to which vegetation density varies from normal patterns. The map above depicts stress on vegetation in crop land areas, and can be used to assess potential losses.
Compared to the previous bulletin, which included VHI for August, the geographical extent of agricultural drought in December had decreased. However, extreme drought conditions remain, with concentrations in Nusa Tenggara Barat, Nusa Tenggara Timor, East Java, Sulawesi and Maluku.
Agricultural Drought – Vegetation Health Index December 2015

Population affected by drought
Province District Total district population Population at riskPopulation requiring
assistance
Aceh Kota Subulussalam 73,860 23,623 1,530
Daerah Istimewa Yogyakart Gunung Kidul 707,158 107,003 49,581
Daerah Istimewa Yogyakart Kulon Progo 407,330 98,791 33,819
Gorontalo Boalemo 146,391 34,381 18,979
Gorontalo Gorontalo 367,951 90,901 41,237
Gorontalo Pohuwato 143,030 21,254 5,089
Jawa Tengah Brebes 1,772,737 223,610 52,853
Jawa Tengah Kebumen 1,180,593 149,426 43,312
Jawa Tengah Purbalingga 888,396 163,480 45,368
Jawa Tengah Rembang 614,170 74,312 21,757
Jawa Tengah Wonosobo 773,058 101,433 28,423
Jawa Timur Bangkalan 945,285 211,933 107,433
Jawa Timur Probolinggo 1,131,898 268,120 56,011
Jawa Timur Sampang 932,163 209,177 69,651
Jawa Timur Sumenep 1,066,703 196,951 75,335
Maluku Maluku Tengah 368,278 51,717 6,688
Maluku Seram Bagian Barat 168,773 64,812 17,553
Maluku Seram Bagian Timur 106,775 15,455 1,398
Nusa Tenggara Timur Ende 268,969 21,211 2,227
Nusa Tenggara Timur Kupang 337,604 58,594 38,022
Nusa Tenggara Timur Lembata 129,309 42,107 23,211
Nusa Tenggara Timur Manggarai 314,083 53,585 25,810
Nusa Tenggara Timur Manggarai Timur 268,131 116,567 63,274
Nusa Tenggara Timur Rote Ndao 141,897 30,877 13,406
Nusa Tenggara Timur Sabu Raijua 83,633 25,874 13,244
Nusa Tenggara Timur Sumba Barat 120,027 33,781 26,667
Nusa Tenggara Timur Sumba Barat Daya 312,597 121,626 103,660
Nusa Tenggara Timur Sumba Tengah 67,302 24,229 20,316
Nusa Tenggara Timur Sumba Timur 242,796 10,628 8,270
Nusa Tenggara Timur Timor Tengah Selatan 458,225 124,795 107,640
Nusa Tenggara Timur Timor Tengah Utara 241,867 61,892 44,495
Papua Jayawijaya 204,032 40,077 40,077
Papua Mappi 90,448 56,038 3,334
Papua Mimika 199,069 13,480 -
Papua Barat Manokwari 204,415 32,078 13,478
Papua Barat Raja Ampat 45,248 13,866 1,635
Papua Barat Teluk Bintuni 58,439 5,403 357
Sulawesi Tengah Tojo Una-Una 146,299 9,664 1,525
Total 15,728,936 3,002,751 1,226,665
Economic vulnerability and drought impactedUsing VHI as a measure of drought impact, districts who had more than 50% of crop fields classified as severely or extremely drought impacted over the past three months (October – December) were considered to be highly exposed to drought. Among these districts, those with high economic vulnerability (greater than 20% of the population living below the poverty line) were considered to be high priority areas for interventions.
Within the districts noted above, households who are living in poverty and dependent on agriculture for their income were considered to be the most at risk and in need of assistance. In total, 3 million Indonesians living in these 38 districts will face significant challenges in meeting basic requirements as they already live in poverty. Among these, 1.2 million are in need of assistance as they are dependent on rainfall for their livelihoods as food producing farmers and reside in areas highly impacted by drought.

Rice crop cycles and seasonal change
Risks in shifting crop cyclesThe late planting of paddy fields will delay crop harvesting by 4 to 8 weeks, unless planting of remaining crops for this cycle is accelerated. Subsequent analysis demonstrates cause for concern, particularly in East Java. This delay raises concerns about a cascade effect causing late planting of second season crops and insufficient moisture available for the second growing season in rain fed areas.
Two risks are introduced by shifting rice cycles in most of Indonesia: 1) an extension of the ‘lean’ season and 2) increased exposure of secondary rice to the peak dry season as highlighted above. The extended lean season will stretch resources among poorer households who spend a large share of their limited income on food, with prices likely to rise while the next harvest is postponed. In addition, without efforts to accelerate planting immediately daily agricultural wage laborers will continue to have reduced income opportunities. Preliminary results from a recent household survey led by WFP demonstrated agricultural wage laborers as the most severely impacted by drought with reduced income leading to negative coping behaviors, particularly reduced expenditure on food.
Crops at risk
Jan Feb March Apri l May June July Aug Sept Oct Nov Dec
Dry Dry
Grow
Sow Sow
Dry Rain
Rainy season normal cyc le
Rainy season delayed cyc le
Delays ------------>>
Grow Harvest
Rain Dry Dry
Rain Dry Rain
Harvest Sow
Jan Feb March Apri l May June July Aug Sept Oct Nov Dec
Dry Dry
Grow
Grow
Dry Rain
Dry season normal cyc le
Dry season delayed cyc le
Rain
SowDelays ------------>>
Rain Dry Dry
Sow Harvest
Rain Dry
Harvest

Delay in the start of plantingDrier than normal weather has delayed planting, especially in rain fed areas. The current season, which is also the main growing season, accounts for half of annual corn production and around 45 percent of annual rice production. The late start of rains has delayed paddy field planting in many parts of the country. The map above depicts delays in Java in grey.
Yields of the early-planted crops are expected to be negatively affected, particularly in rain fed areas. Most-affected provinces include West Java, East Java, Central Java, North and South Sulawesi and Lampung, which, together, usually account for close to two-thirds of the country’s annual rice production. The final outcome of the 2016 rice harvest will largely depend on the availability of water supplies for irrigation as approximately 85 percent of total rice area is irrigated.1
1 http://www.fao.org/giews/countrybrief/country.jsp?code=IDN
Start of planting status as of 19 December 2015

Estimates of delays in rice planting
Using satellite imagery to estimate planting statusBy analyzing satellite images over the main growing season, estimates are made per each pixel photographed of whether planting has begun based upon the color spectrum observed. All of Indonesia was analyzed using this approach and then compared to the same period (1 September – 19 December) over historical reference periods including the moderate El Niño year of 2006 and a ‘normal’ year – 2013. At aggregate levels nationally, planting of rice appears on target or better with a total of 3.9 million hectares classified as planted compared to 3.4 million hectares for the same period in 2013.
However, using this approach combined with classification of rain-fed versus irrigated croplands in Java, planting has been delayed. As expected, rainfedrice fields in Java are behind in planting (approximately 85,000 hectares are delayed). However, irrigated rice fields are also behind schedule.
1,037,418
1,443,9131,355,765 1,344,691
217,129
293,366377,770
292,766
2 0 0 6 2 0 0 9 2 0 1 3 2 0 1 5
Total hectares planted in Java(1 Sept - 19 Dec)
Irrigated Rainfed
0
10
20
30
40
50
60
70
29-Aug 14-Sep 30-Sep 16-Oct 1-Nov 17-Nov 3-Dec 19-Dec
Pla
nte
d A
rea
(%)
National

Estimates of delays in rice planting
East and Central Java are delayed in plantingThe chart on the left depicts the number of hectares planted thus far in the main season in provinces with large rice areas (>500,000 hectares) and whether there is a delay in comparison to the same period (1 September – 19 December) in 2013. Delays are significant in Central and East Java. The charts on the right show current planting compared to 2013/2014. At this stage of the current season in 2013, 51% of rice fields were planted in East Java and 61% in Central Java. By comparison, to date in 2015, only 39% of fields have started planting in East Java and 53% in Central Java. Central Java appeared further behind in November, but a significant increase in planting in late November and early December has closed gaps. East Java however remains well behind in planting, with a total of nearly 110,000 hectares delayed for this point in time. Though Nusa Tenggara Timor is not a major rice production area, 15,000 hectares are estimated to be delayed, representing a 33% of rice fields compared to normal.
0
10
20
30
40
50
60
70
29-Aug 14-Sep 30-Sep 16-Oct 1-Nov 17-Nov 3-Dec 19-Dec
Pla
nte
d A
rea
(%)
East Java
0
10
20
30
40
50
60
70
29-Aug 14-Sep 30-Sep 16-Oct 1-Nov 17-Nov 3-Dec 19-Dec
Pla
nte
d A
rea
(%)
Central Java574,403
451,707 489,682
347,684 296,433
77,738
109,876
12,802
-
100,000
200,000
300,000
400,000
500,000
600,000
700,000
Jawa Tengah Jawa Timur Jawa Barat SulawesiSelatan
SumateraSelatan
Hectares currently planted and delayed compared to 2013/14
Currently planted Delayed

Estimates of delays in rice planting
Districts with large areas delayed in plantingThe table above lists districts with more than 4,000 hectares of rice delayed in planting when compared to the same period of observation in 2013 (1-September through 17-December). Spread across key production areas, these districts require significant attention to ensure the delay in planting is not further delayed. At provincial level, East and Central Java are of most concern, however Merauke district in Papua, Gunung Kidul in Yogyakarta, and Pinrang in Sulawesi Selatan also require attention.
Province District Total hectares of rice fields
Hectares planted in main season 2013
Hectares planted in main season 2015
Hectares delayed Percent of rice fields delayed
Jawa Tengah Blora 70,794 41,709 15,239 26,470 63%
Jawa Timur Bojonegoro 77,272 42,371 23,594 18,777 44%
Jawa Tengah Pati 69,114 37,628 22,852 14,776 39%
Jawa Timur Lamongan 84,648 51,703 37,673 14,030 27%
Jawa Tengah Wonogiri 51,273 33,642 20,690 12,952 38%
Jawa Tengah Grobogan 90,863 74,566 63,050 11,516 15%
Jawa Timur Bangkalan 42,771 31,030 19,556 11,474 37%
Jawa Timur Sampang 45,643 34,637 23,596 11,041 32%
Jawa Timur Probolinggo 48,855 27,439 16,742 10,697 39%
Jawa Tengah Rembang 40,349 15,976 6,667 9,309 58%
Papua Merauke 16,219 12,140 2,897 9,243 76%
Jawa Timur Bondowoso 42,801 22,763 13,812 8,951 39%
Jawa Timur Tuban 52,395 31,980 24,068 7,912 25%
Daerah Istimewa Yogyakarta Gunung Kidul 27,970 15,597 7,810 7,787 50%
Jawa Tengah Sragen 48,243 36,736 29,667 7,069 19%
Jawa Timur Gresik 36,454 21,589 16,739 4,850 22%
Sulawesi Selatan Pinrang 48,720 34,501 29,826 4,675 14%
Jawa Barat Garut 45,893 32,948 28,640 4,308 13%
Jawa Timur Situbondo 37,003 15,444 11,154 4,290 28%
Jawa Timur Pacitan 19,378 8,026 3,833 4,193 52%
Jawa Timur Pamekasan 25,872 15,953 11,932 4,021 25%
National 7,777,529 3,359,233 3,907,944 N/A N/A

Rising food prices

Continuing high rice prices
National average retail prices for medium quality rice continued to rise in December to a new nominal record high of 10,673 rupiah per kg. This was the seventh consecutive monthly price increase. Since August, prices have risen by 5.2 percent, while under normal conditions (based on current inflation and past seasonal factors), the increase from August to December would typically have been approximately 1.3 percent. The greater than normal increase in prices during the past few months suggests that supplies are expected to be short, due to drought impact. However prices over the past two months rose approximately in line with expectations suggesting that news of increased imports has tempered rising prices.
In addition to the rising trend, recent prices are also at relatively high levels, even after adjusting for inflation. The price in November, after taking account of inflation and seasonality, is 9.2 percent higher than average prices over the past four years. Furthermore, domestic prices are substantially above world market prices, by approximately 80 percent (after adjusting for quality and marketing and transport costs).
Over the next few months, if prices follow normal seasonal trends and inflation continues at its current annual rate of 3.4 percent, national average retail prices are expected to peak at 11,144 rupiah per kg in February before reducing again in March. However, delays in planting and subsequent harvests may instead lead to further price increases in March.
Rising rice prices
9,000
9,500
10,000
10,500
11,000
11,500
Jul Aug Sep Oct Nov Dec Jan Feb Mar
rup
iah
/ k
g
National rice prices (actual and predicted)
Actual Normal
Predicted (low) Predicted (medium)
Predicted (high)
2,000
4,000
6,000
8,000
10,000
12,000
Jan
-12
Mar
-12
May
-12
Jul-
12
Sep
-12
No
v-1
2
Jan
-13
Mar
-13
May
-13
Jul-
13
Sep
-13
No
v-1
3
Jan
-14
Mar
-14
May
-14
Jul-
14
Sep
-14
No
v-1
4
Jan
-15
Mar
-15
May
-15
Jul-
15
Sep
-15
No
v-1
5
Ru
pia
h p
er k
g
Domestic rice prices versus global averages
Domestic World
Rice prices

Weather outlook

Rainfall anomaly prediction for January - March 2016
These maps are produced by the Indonesian Agency for Meteorology, Climatology and Geophysics (BMKG). They show predictions of rainfall anomaly where yellow represents normal rainfall and orange to dark red shows less than normal rainfall.
Drier than normal conditions are predicted to subsist for most of Indonesia with exceptions in Kalimantan, Sulawesi and parts of Java, Bali, Nusa Tenggara Barat, Nusa Tenggara Timor and Papua. In February, higher than normal rainfall is predicted for much of Indonesia. Following a significant dry period, this may indicate increased flood risk which requires monitoring.

Probability of more than 200 mm of rainfall for January - March 2016
These maps area also produced by BMKG and indicate predictions of rainfall greater than 200 mm per month. In these maps, dark red indicates a higher probability of rainfall greater than 200 mm while dark blue indicates a lower probability and white indicates no chance of rainfall greater than 200 mm. In the previous bulletin, BMKG’s maps depicting greater than 100 mm of rainfall were utilized. However, in the rainy season, these are not sufficient.
In January, low precipitation levels are predicted in North Sumatra, North Kalimantan, Nusa Tenggara Timor and parts of Maluku. By February, BMKG forecasts NTT will have a high probability of rainfall greater than 200 mm. However, in March, rainfall levels will again recede in most across Bali, NTB, NTT and parts of Maluku suggesting a short and delayed rainy season in these areas.

The maps in this bulletin are largely based on satellite data which is the processed and used to create various indicators relating to drought. Rainfall anomaly is a measure of lack of rainfall in a period compared to the average. Data is derived from the University of California, Santa Barbara and used to compute the anomaly. Thresholds for anomaly follow a standard protocol.
TRMM is a global precipitation dataset with high spatial and temporal resolution acquired through NASA on a periodic basis for all of Indonesia. This data is then processed to determine the number of days since the last rainfall (were a day with rainfall is noted as one where more than 0.5mm of precipitation as observed). Each pixel of data (27.5km x 27.5km) is then given a value for the number of days since the last rain. Using a standard classification, also used by the Indonesia Weather and Meteorology Bureau (BMKG), drought level is then determined.
The Vegetation Health Index (VHI), also called the Vegetation-Condition-Temperature Index, is based on a combination of Vegetation Condition Index (VCI) and Temperature Condition Index (TCI). In Indonesia, the VCI is constructed using the Enhanced Vegetation Index (EVI). EVI is used instead of NDVI as it is more sensitive to changes in areas having high biomass, it reduces the influence of atmospheric conditions on vegetation index values, and it corrects for canopy background signals. The VHI is effective enough to be used as proxy data for monitoring vegetation health, drought, moisture, thermal condition, etc.
Data on rainfall dependent agriculture is derived from satellite imagery and then verified by Ministry of Agriculture staff at district level in Indonesia. Rice field plots were also defined via satellite imagery – from the now defunct IKONOS satellite.
State of planting estimates were determined by importing MODISdata into TIMESAT – a program for analyzing time-series satellite sensor data. TIMESAT conducts pixel-by-pixel classification of satellite images to determine whether or not planting has yet begun. This process was followed for all of Indonesia over multiple years in order to evaluate current planting vis-à-vis historical years, including 2013/2014 as a benchmark for a recent normal year.
Identification of districts with high drought risk was created as a function of drought exposure using VHI and vulnerability using poverty. Estimates of population affected and requiring assistance were calculated using estimates of poverty within affected areas and estimates of poor households dependent on production of food crops using SUSENAS data from 2014.
Contributors
This bulletin is produced by a technical working group consisting of the Food Security Agency, the National Institute of Aeronautics and Space (LAPAN), and other agencies/ministries. The bulletin is directed by Professor Rizaldi Boer of the Bogor Agricultural University (IPB). The United Nations World Food Programme and the Food and Agriculture Organization of the United Nations provide technical support including generation of maps and data analysis.
All content within this bulletin is based upon the most current available data. As the drought is a dynamic situation, the current realities may differ from what is depicted in this document.
Methodology

1. The Ministry of Social Affairs doubled the ration of the Rice for Family Welfare program (Rastra) in October and November. To create buffer stocks, the Government has allocated 100mt of rice per district and 200mt of rice per province that can be released upon declaration of emergency.
2. The Government has allocated IDR 3.5 trillion (US$ 258 million) to replenish rice reserves and stabilize the prices of staple foods. Rice imports totaling 1.5 million tons are on-going including 1 million tons from Vietnam and 500,000 from Thailand with delivery expected in March 2016.
3. The Government has also allocated IDR 385 billion (US$ 28.3 million) for forest fire prevention and management. A peat land ecosystem restoration agency (BREG) has been established to review old peat land concession licenses, ban new peatland development and restore 2 million hectares of peatland over the next 5 years.
4. The Ministry of Health is coordinating a national nutrition survey for under 5yr olds, noting that supplementary feeding would be required for districts where wasting is greater than emergency levels of 15 percent. Preliminary results from this survey are expected in February.
1. To help vulnerable households cope with the effect of reduced income coupled with rising food prices, Government of Indonesia should provide cash assistance to poor households dependent on food crop production. Across 38 vulnerable districts, an estimated 1.2 million Indonesians require assistance. Coordination between multiple government agencies, including Ministry of Agriculture, Ministry of Social Affairs and the National Team for the Acceleration of Poverty Reduction is required to refine targeting and identify target households.
2. Delays in planting may have significant effects at national and household level, impacting total production as well as limiting income for farmers. To accelerate planting, particularly in East and Central Java where delays are significant, the Ministry of Agriculture should work directly with farmers and distribute seeds, fertilizer, irrigation, and information aimed at increasing the rate of planting. Improved implementation of the existing Special Program for Acceleration of Rice, Maize, and Soybean Self-Sufficiency (UPSUS) is one means to accelerate planting. The Ministry should monitor current crop conditions and prepare for a delayed harvest. Plans for delayed second season planting should be made to prevent exposing crops to the peak dry season.
3. With dried lands and high levels precipitation expected for much of Indonesia in the coming months, the National Disaster Management Agency (BNPB) must increase its efforts to monitor flood risks.
Response Recommended actions

Center for Food Availability and VulnerabilityAgency for Food SecurityMinistry of Agriculture | Jl. RM Harsono No. 3 Ragunan | Jakarta 12550T. 62-21 7816652 | F. 62-21 7806938
Remote Sensing Application CentreIndonesia National Institute of Aeronautics and SpaceJl. Kalisari No. 8, Pekayon, Pasar Rebo | Jakarta 13710T. 62-21 8710065 | Fax. 62-21 8722733
United Nations World Food ProgrammeWisma Keiai 9th floorJl. Jend Sudirman Kav. 3 | Jakarta 10220T. 62-21 5709004 | F. 62-21 5709001 | E. [email protected]
Food and Agriculture Organization of the United NationsMenara Thamrin Building 7th floorJl. MH. Thamrin Kav. 3 | 10250 JakartaT. 62-29802300 | F. 62-3900282 | E. [email protected]