Embed Size (px)
Citation preview

El Ni~no drought increased canopy turnover in Amazon forests
Veronika Leitold1,2, Douglas C. Morton1 , Marcos Longo3 , Maiza Nara dos-Santos3, Michael Keller3,4,5 and
Marcos Scaranello3
1NASA Goddard Space Flight Center, Greenbelt, MD 20771, USA; 2Department of Geographical Sciences, University of Maryland, College Park, MD 20742, USA; 3EMBRAPA Inform�atica
Agropecu�aria, Bar~ao Geraldo, Campinas, 13083-886, SP, Brazil; 4NASA Jet Propulsion Laboratory, Pasadena, CA 91109, USA; 5USDA Forest Service, International Institute of Tropical
Forestry, Rio Piedras, PR 00926, USA
Author for correspondence:Douglas C. Morton
Tel: +1 301 614 6688
Email: [email protected]
Received: 3 November 2017
Accepted: 11 February 2018
New Phytologist (2018)doi: 10.1111/nph.15110
Key words: allometry, ecosystem models,forest carbon sink, gaps, tropical forestdynamics.
Summary
� Amazon droughts, including the 2015–2016 El Ni~no, may reduce forest net primary pro-
ductivity and increase canopy tree mortality, thereby altering both the short- and the long-
term net forest carbon balance. Given the broad extent of drought impacts, inventory plots or
eddy flux towers may not capture regional variability in forest response to drought.� We used multi-temporal airborne Lidar data and field measurements of coarse woody
debris to estimate patterns of canopy turnover and associated carbon losses in intact and frag-
mented forests in the central Brazilian Amazon between 2013–2014 and 2014–2016.� Average annualized canopy turnover rates increased by 65% during the drought period in
both intact and fragmented forests. The average size and height of turnover events was simi-
lar for both time intervals, in contrast to expectations that the 2015–2016 El Ni~no drought
would disproportionally affect large trees. Lidar–biomass relationships between canopy
turnover and field measurements of coarse woody debris were modest (R2� 0.3), given simi-
lar coarse woody debris production and Lidar-derived changes in canopy volume from single
tree and multiple branch fall events.� Our findings suggest that El Ni~no conditions accelerated canopy turnover in central Amazon
forests, increasing coarse woody debris production by 62% to 1.22Mg C ha�1 yr�1 in
drought years .
Introduction
Tropical rainforests play an important role in the global carboncycle by sequestering atmospheric CO2 in woody biomass (LeQu�er�e et al., 2016). The Amazon is the largest remaining intacttropical forest in the world, and Amazon forests therefore have astrong influence on the magnitude and interannual variability inthe global terrestrial carbon sink (Gatti et al., 2014; Brienenet al., 2015). The net carbon balance of the Amazon also reflectsemissions from growing human pressure in the form of deforesta-tion, degradation and fragmentation (Aguiar et al., 2012; Longoet al., 2016; Brinck et al., 2017; van der Werf et al., 2017). Inrecent years, natural disturbances associated with severe droughtsand widespread forest fires initiated by humans have turned theAmazon from a net carbon sink into a net carbon source (Phillipset al., 2009; Lewis et al., 2011; Gatti et al., 2014; Feldpauschet al., 2016). However, large uncertainties remain regarding themagnitude of carbon fluxes in tropical forests (Pan et al., 2011)and the underlying spatial distribution of carbon stocks acrossthe landscape (e.g. Avitabile et al., 2016; Longo et al., 2016).
An improved understanding of the processes of forest distur-bance and recovery is critical to constrain estimates of currentand future carbon cycling in Amazon forests, including the size
and frequency of turnover events (Lloyd et al., 2009). Forestinventory plots can estimate tree mortality with great precision(Phillips et al., 2009; Brienen et al., 2015; Feldpausch et al.,2016), but plots sample a very small proportion of the Amazonand may not capture landscape-scale processes. At the otherextreme, satellite observations can monitor large forested regions(Chambers et al., 2013; Hansen et al., 2013), but moderate reso-lution (30 m) data retain little sensitivity to small-scale changesin the forest canopy from branch and tree fall events (e.g. Marvin& Asner, 2016). Airborne Lidar data can bridge the scale gapbetween field-based measurements and satellite observations bycollecting three-dimensional information on forest structure overlarge areas (Asner et al., 2013; Esp�ırito-Santo et al., 2014; Hunteret al., 2015). Repeat Lidar measurements of the same forest areasprovide unprecedented detail regarding changes in the forestcanopy over time (Kellner et al., 2009; Andersen et al., 2014;Hunter et al., 2015; R�ejou-M�echain et al., 2015; Marvin &Asner, 2016), leading to a better understanding of the processesgoverning canopy turnover and the associated carbon fluxes.However, Lidar data may not provide definitive evidence for themechanisms that contribute to carbon loss from canopy turnover,including branch fall, tree fall and multiple tree fall disturbances.A combination of field measurements and repeat Lidar data may
No claim to original US Government works
New Phytologist� 2018 New Phytologist Trust
New Phytologist (2018) 1www.newphytologist.com
Research

therefore advance our mechanistic understanding of canopyturnover and carbon cycling in Amazon forests beyond the use ofLidar data alone (e.g., Marvin & Asner, 2016).
Drought impacts on Amazon forest structure depend on theseverity and duration of rainfall deficits. In the short term, soilwater deficits trigger an increase in stomatal closure and leafabscission (Brando et al., 2007, 2014), thereby reducing net pri-mary productivity during drought conditions (Feldpausch et al.,2016; but see Doughty et al., 2015). With increasing droughtseverity, both empirical and experimental studies indicate a posi-tive relationship between drought severity and mortality rates inAmazon forests (Nepstad et al., 2007; Phillips et al., 2009, 2010;da Costa et al., 2010). The timing of mortality responses todrought is uncertain, however. During the 1997–1998 El Ni~nodrought, Williamson et al. (2000) observed a 71% increase inmortality, but this increase was restricted to the drought year(1997). Other long-term plot data also show a single-yearincrease in mortality from droughts across the southern Amazonin 2007 (Brando et al., 2014) and 2010 (Doughty et al., 2015).By contrast, experimental studies suggest a delay betweendrought and tree mortality, especially for large trees, with a peakin mortality following 3 yr of experimental throughfall exclusion(Nepstad et al., 2007; da Costa et al., 2010). In these circum-stances, tissue damage from hydraulic failure may weaken butnot immediately kill canopy trees (Rowland et al., 2015).Drought responses are also species-specific; trees with lower wateruse efficiency are particularly prone to drought-induced mortality(e.g. Phillips et al., 2009; Feldpausch et al., 2016), a trait com-mon to pioneer species found in greater abundance in canopygaps, edges, and secondary or degraded forests.
Branch losses may also contribute to long-term changes inforest structure and productivity following drought conditions,but previous studies provide few constraints on the spatial andtemporal variability in branch loss (Palace et al., 2008). Coarsewoody debris (CWD) from branch and tree falls increased fol-lowing drought in the central Brazilian Amazon (Rice et al.,2004; Brando et al., 2007), yet plots in the Bolivian Amazonshowed no increase in branch loss following the 2010 drought(Doughty et al., 2015). In part, these differences may reflectunderlying regional patterns of branch loss, as documentedacross the western Amazon by Marvin & Asner (2016) in theabsence of drought conditions. Pulses of drought-induced mor-tality and branch loss have pronounced impacts on neighbour-ing trees, with both physical impacts from collateral damageand physiological implications based on the reduction in com-petition for light and water among surviving individuals (daCosta et al., 2018). Repeat airborne Lidar data offer the poten-tial to advance our understanding of regional-scale patterns ofcanopy tree and branch turnover during drought periods.
In this study, we characterized canopy turnover during averageand drought years in the central Brazilian Amazon using a timeseries of high-density, small-footprint airborne Lidar data. Lidardata from 2013, 2014 and 2016 captured turnover dynamicsbefore and immediately following the 2015–2016 El Ni~nodrought across intact and fragmented forests near Santar�em, Par�a.Field surveys of tree mortality and CWD within canopy turnover
events were conducted shortly after the third Lidar collection in2016 to quantify carbon losses associated with canopy turnoverfrom branch fall, tree fall and collateral damage to understoryvegetation. Combined, Lidar and field data provided estimates ofthe spatial and temporal variability in canopy turnover and asso-ciated carbon fluxes from the above-ground biomass to coarsewoody debris pools. Our study specifically addressed the follow-ing four questions: (1) How do canopy turnover rates comparebetween intact and fragmented forests? (2) What are the contri-butions from branch fall, tree fall and multiple tree-fall events tototal canopy turnover? (3) Do average turnover rates in Amazonforests increase during drought events? (4) What are the carbonconsequences, measured as CWD, of canopy turnover in Amazonforests? These analyses offer a critical look at the individual treeand landscape-scale responses to drought conditions identified byrainfall exclusion experiments (Nepstad et al., 2007; da Costaet al., 2010; Rowland et al., 2015) and inventory plots (e.g.Phillips et al., 2010; Feldpausch et al., 2016).
Materials and Methods
Precipitation data
Satellite and meteorological station data suggest that 2015 and2016 were the driest years since 2001 for the Tapaj�os NationalForest (TNF) region near Santar�em, Par�a (Fig. 1, SupportingInformation Fig. S1). Based on data from NASA’s Tropical Rain-fall Measurement Mission (TRMM, monthly 0.25° data productTMPA/3B43, v.7), mean annual precipitation for the TNFregion was 2054 mm yr�1 during 2001–2016 (TRMM, 2011).Estimated precipitation was average or above average in 2013(2342 mm) and 2014 (2000 mm), whereas total precipitationwas below average in both 2015 (1533 mm) and 2016(1862 mm). Maximum cumulative water deficit (MCWD;Arag~ao et al., 2007) peaked in 2015 (�431 mm) compared tothe average annual MCWD for 2001–2016 (�233 mm). Stationdata from Brazil’s National Meteorological Institute (InstitutoNacional de Meteorologia, INMET) station 25 km north of theTNF in Belterra, Par�a (�2.63°, �54.95°), provide a similar esti-mate for the MCWD in 2015 (�478 mm, Fig. S1).
Airborne Lidar data
Lidar data were collected over intact and fragmented forests inthe central Brazilian Amazon near the city of Santar�em, Par�a (seeFig. 1). Data were acquired along two 50 km parallel transects(200 m width, 995 ha area) in September 2013 (t1), June 2014(t2) and March 2016 (t3). The time intervals between Lidar col-lections were 0.75 yr (t1–t2) and 1.83 yr (t2–t3). The ST1 tran-sect covered a section of intact old-growth terra firme forestwithin the TNF. The ST2 transect paralleled the ST1 transect onthe opposite side of the BR-163 highway and covered a range ofdifferent land cover types. Analysis of ST2 data was restricted to12 forest fragments, ranging in size from 23.5 to 80 ha (Table 1).Lidar data were collected with very high average return densities:9.2–10.8 points per m2 (ppm2) in 2013, 39.6–59.9 ppm2 in
New Phytologist (2018) No claim to original US Government works
New Phytologist� 2018 New Phytologist Trustwww.newphytologist.com
Research
NewPhytologist2

2014 and 29.3–33.9 ppm2 in 2016. Higher point densities in thesecond and third Lidar collections provided robust estimates ofcanopy changes based on the increased likelihood of detectingresidual canopy material in turnover areas. Data in the first twosurveys were collected with an Optech ALTM Orion laser scan-ner at 853 m average flight altitude, 11° field of view and 65%flight line overlap. The third survey used an Optech ALTM 3100laser scanner at 650 m average flight altitude, 15° field of viewand 70% flight line overlap. Lidar data in this study are availableonline from the Sustainable Landscapes Brazil Project (https://www.paisagenslidar.cnptia.embrapa.br/webgis/).
Lidar return data from the three collections were merged togenerate a single digital terrain model (DTM) to normalize esti-mated heights of vegetation returns from t1, t2 and t3 data(Hunter et al., 2013). Ground returns were classified using a pro-gressive morphological filter (Zhang et al., 2003). Delaunay tri-angulation was used to create a Triangulated Irregular Network(TIN) of ground hits, and DTM elevations on a 1 m raster gridwere linearly interpolated from the TIN surface (Cook et al.,2013). Canopy height models (CHMs) at 0.5 m spatial resolu-tion were then generated separately for t1, t2 and t3 followingCook et al. (2013) by interpolating canopy height values from a0.5 m TIN surface created from the greatest return height in
every 0.5 m grid cell. Canopy turnover events were identifiedbased on contiguous clusters (≥ 4 m2) with ≥ 3 m height lossesbetween Lidar collections (Fig. 2). Turnover events were analyzedbased on the projected area (m2) and change in canopy volume(m3) between 0.5 m CHM layers for each data collection, withannualized estimates of the number and area of turnover eventsin each study region (ha�1 yr�1) based on the time intervalbetween Lidar collections.
Lidar data from both transects were subdivided to investigatelatitudinal gradients in canopy turnover. The ST1 transect overintact forests was divided into five subsections (ST1a, b, c, d ande) to evaluate north–south gradients in forest structure andtopography (Table 1). On the opposite side of the highway, landcover types within the ST2 transect were evaluated based on con-temporary Landsat 8 surface reflectance imagery (Path 227 Row062, Date 2016-June-30, Source: USGS Earth Explorer, http://earthexplorer.usgs.gov/) as well as Lidar return distributions andcanopy height information. We identified 12 fragments of con-tiguous forest area with Lidar-derived canopy cover ≥ 10%, meancanopy height ≥ 20 m and forest patch width ≥ 20 m (see Fig. 1).Forest fragments were labeled from north to south as FR01 toFR12, and individual fragments ranged in size from 23.5 to80.0 ha (562 ha total area, see Table 1).
Fig. 1 Study area in the central BrazilianAmazon near Santar�em, Par�a, with repeatLidar collections over intact (ST1, yellow) andfragmented (ST2, blue) forest areas. Lidardata were acquired for transects of50 km9 0.2 km in 2013, 2014 and 2016,and field measurements of coarse woodydebris in canopy turnover areas wereconducted in 2016 within a 20 ha subset ofST1 (red outline). The underlying Landsat 8imagery (30 June 2016) depicts closed-canopy Amazon forests in green anddeforested areas for agricultural uses in lightgreen and blue.
No claim to original US Government works
New Phytologist� 2018 New Phytologist TrustNew Phytologist (2018)
www.newphytologist.com
NewPhytologist Research 3

Coarse woody debris measurements
Ground-based measurements of CWD were collected in July2016 within a 20 ha area of the ST1 airborne Lidar coverage inthe TNF (see Fig. 1). The objective of the field survey was tomap and measure downed trees and branches in canopy turnoverevents that were identified using the 2014 and 2016 Lidar canopyheight models (Fig. 2). A high-precision Trimble Geo7X GPSrover with external antenna was used to navigate to the groundlocation of 78 different canopy turnover areas. Within each area,the location and size of all downed trees (diameter at breastheight (DBH), height) and branches (in segments; diameter atboth ends (≥ 1 cm), segment length) were measured and theturnover event was classified according to the nature of the distur-bance (branch, tree, multiple tree fall), physical mechanism ofturnover (uprooted, snapped, broken) and the decay class of thewood (1–5 from least decayed to most decayed, following Kelleret al., 2004). Measurements within each turnover area were usedto estimate carbon losses associated with branch fall, tree fall andmultiple tree fall events and to evaluate predictive relationshipsbetween canopy turnover and carbon losses using Lidar metrics.Additionally, whole-tree measurements of CWD (n = 18) fromtree fall and multiple tree fall turnover areas were compared toexisting allometric equations for above-ground biomass (AGB) intropical forest trees (see Table S1).
The total mass of downed woody material in each field-measured turnover area was estimated using field measurementsof CWD (Table S2). Branch mass was calculated using the vol-ume equation of a truncated cone (assuming circular cross-sections) and a site-level average wood density established for theTNF (0.64 g cm�3, Hunter et al., 2013). Tree mass was calcu-lated using Chave’s Model I moist forest allometry, which isbased on tree DBH, total tree height and wood density (Chaveet al., 2005). For each of the 78 turnover areas, we calculated thetotal amount of CWD measured within the turnover area andcompared field-based estimates of biomass change with differentLidar-derived metrics of canopy changes between 2014 and2016, including the projected area of canopy turnover events andthe change in canopy volume between 2014 and 2016 CHM lay-ers at 0.5 m resolution. For comparison, we also estimatedbiomass change using a Lidar–biomass model developed usingmean top of canopy height (TCH) at 0.25 ha resolution (Longoet al., 2016). Simulations considered biomass changes using onlyheight losses from canopy turnover (Marvin & Asner, 2016) andboth losses and gains in canopy height between 2014 and 2016for 0.25 ha grid cells with CWD measurements for > 75% ofcanopy turnover area (n = 13).
Relationships between field measurements of CWD and Lidarmetrics were used to estimate total carbon losses from canopyturnover in the ST1 transect under two scenarios. In the first, allcanopy turnover was considered branch fall to provide a conser-vative estimate of carbon losses using the relationship betweencanopy volume change (m3) and CWD production from singlebranch fall events. In a second scenario, we used the distributionof Lidar-derived changes in canopy volume from field-measuredturnover events to separate branch fall (≤ 100 m3), single tree fallT
able1Can
opystructure,terrainva
riab
ility
andturnoverdyn
amicsderived
from
repeatLidar
overintact
(ST1)an
dfrag
men
ted(ST2)Amazonforests
Transect
Segmen
t/frag
men
tArea
(ha)
Elev
ation
(m,min–m
ax)
Terrain
slope
(deg
rees,
l�r)
2016Can
opy
heigh(m
,l�r)
CH
Skew
-ness
Turnove
r2013–2
014
(%yr
�1)
Turnove
r2014–2
016
(%yr
�1)
%Δ
Turn-ove
r(%
)
2013–2
014
even
ts(no.ha�
1yr
�1)
2014–2
016
even
ts(no.ha�
1yr
�1)
2013–2
014
mea
nsize
(ha)
2014–2
016
mea
nsize
(ha)
ST1
ST1a
171.2
102–2
09
4.7
�4.4
29.3
�10.4
�0.389
1.89
3.15
66.3
6.5
10.8
28.9
29.3
ST1b
206.0
60–1
48
5.3
�4.8
25.8
�8.7
�0.111
1.73
3.13
80.9
5.6
11.4
30.7
27.5
ST1c
206.0
91–1
92
5.5
�4.9
26.9
�9.3
�0.218
1.68
3.49
107.4
6.0
10.4
27.8
27.7
ST1d
206.0
80–2
09
13.8
�10.1
27.1
�8.3
�0.117
1.80
2.77
54.0
6.3
8.9
28.4
29.4
ST1e
167.0
99–2
57
17.9
�7.9
28.8
�9.2
�0.155
1.87
2.51
34.2
6.9
8.1
26.9
30.8
ST2
FR01
42.7
76–1
39
7.6
�6.4
26.6
�8.1
0.074
1.58
3.46
119.2
5.7
12
27.5
28.9
FR02
24.3
84–1
61
11.0
�7.1
24.9
�7.2
�0.183
1.65
3.98
141.2
5.9
11.7
27.9
34.1
FR03
29.7
112–1
36
2.9
�1.6
23.8
�7.7
�0.211
1.68
3.30
96.8
612.1
27.9
27.3
FR04
42.1
102–1
44
3.8
�2.4
24.9
�8.6
�0.328
1.90
3.35
76.3
6.8
10.7
28.1
31.3
FR05
58.4
66–1
51
5.5
�6.5
21.8
�9.2
0.534
2.46
4.70
91.1
11.1
17
22.1
27.6
FR06
26.6
88–1
48
4.5
�2.7
23.1
�8.6
0.289
2.45
3.66
49.4
10.1
13.9
24.2
26.3
FR07
42.8
57–1
07
5.3
�6.4
24.0
�7.4
�0.082
1.36
2.07
52.3
5.5
9.7
24.8
21.4
FR08
80.0
59–1
15
6.6
�6.5
24.0
�8.0
�0.274
1.62
2.73
68.2
6.1
8.4
26.4
32.4
FR09
73.5
71–1
40
11.0
�10.0
25.0
�7.8
�0.513
2.07
2.17
4.9
8.4
7.9
24.6
27.4
FR10
23.5
74–1
25
10.0
�10.2
26.0
�8.2
�0.031
1.73
2.21
27.7
5.1
834.3
27.8
FR11
76.0
80–2
05
14.0
�10.2
25.4
�8.3
�0.156
2.16
2.80
29.3
8.7
8.8
25.0
31.8
FR12
41.9
115–2
17
13.9
�8.2
25.1
�10.2
0.141
3.06
3.03
�0.8
11.7
10.7
26.2
28.4
New Phytologist (2018) No claim to original US Government works
New Phytologist� 2018 New Phytologist Trustwww.newphytologist.com
Research
NewPhytologist4
or multiple branch fall (100–500 m3), and multiple tree fallevents (≥ 500 m3). Intermediate-sized changes were randomlyassigned with equal probability to either single tree fall or multi-ple branch fall categories to estimate carbon losses.
Results
Forest structure
Parallel Lidar transects in this study captured similar variabilityin terrain elevation and forest characteristics inside and outsidethe TNF (Table 1). Terrain elevation varied between 50 and250 m asl and slope followed a north–south gradient, with moresteeply sloped terrain in the southern sections (13.4° mean slope,STd-e and FR09-12) than northern portions of the transects(5.2° mean slope, STa-c and FR01-08). The distribution ofcanopy heights along the ST1 transect was consistent among seg-ments, with little variation in mean canopy heights. On average,ST2 fragments were shorter than intact forests (24.5 m vs27.8 m). Canopy height distributions were similar for intact ST1segments and most forest fragments in ST2, with tall, closed-canopy profiles (see Table 1). Four of the ST2 fragments (FR01,05, 06 and 12) had more open canopy profiles, with skewedcanopy height distributions that may indicate a history of distur-bance from selective logging or understory fires before the initialLidar collection in 2013 (Longo et al., 2016).
Turnover dynamics
The area of canopy turnover was 65% higher, on average, in thesecond interval for both intact and fragmented forests. Annual-ized rates of canopy turnover for intact forest segments increasedfrom 1.68–1.89% yr�1 (mean 1.79% yr�1) in 2013–2014 to2.51–3.49% yr�1 (mean 3.01% yr�1) between 2014–2016
(Table 1). All five ST1 segments had higher turnover in 2014–2016, with greatest increases in ST1c (107.4%) and ST1b(81.2%). The range of annualized turnover during each intervalwas larger for forest fragments of ST2, but turnover rates alsoincreased between the first (1.36–3.06% yr�1, mean 1.98%yr�1) and second time intervals (2.17–4.70% yr�1, mean 3.12%yr�1). Individual forest fragments in the ST2 transect had morevariable increases in canopy turnover between 2013–2014 and2014–2016; turnover more than doubled in FR01 and FR02,nearly doubled in FR03 and FR05, while turnover rates inFR09 increased only slightly (4.9%) and turnover in FR12 was0.8% lower in the second interval (Table 1).
Increases in turnover between 2013–2014 and 2014–2016showed a strong north–south gradient (Fig. 3a). Terrain slopecontributed to the observed north–south gradient in canopyturnover (Fig. 3b), with larger increases observed in the flatter,northern areas of the study and smaller increases in the southernsections of each transect with more variable terrain. However,broad patterns of terrain variability were not preserved at the scaleof individual turnover events; the distributions of terrain slopewithin areas of canopy turnover were consistent between timeintervals, with no evidence that canopy turnover from branch ortree fall events was more likely on steeper slopes in either timeinterval.
The average number of turnover events increased betweentime periods, but the mean size of canopy changes was similarfor both intervals (Table 1). The density of canopy turnoverevents increased from 6.3 to 10.0 events ha�1 yr�1 in intactforest segments of ST1 and from 7.6 to 10.9 events ha�1 yr�1
in fragmented forest areas along ST2. The average size ofturnover events remained relatively constant in the intact forestsegments (28.5 m2 in t1–t2 vs 28.7 m2 in t2–t3) and increasedslightly in the forest fragments (from 26.6 m2 in t1–t2 to28.7 m2 in t2–t3).
(a) (b) (c)
Fig. 2 An 8 ha subset of the ST1 transect showing canopy turnover events (green outlines) between 2014 (a) and 2016 (b) 0.5 m resolution Lidar canopyheight models (CHMs). (c) Turnover events mapped in the field are shaded purple, and blue dots indicate stem locations for tree fall and multiple tree fallturnover events, including both canopy and understory trees.
No claim to original US Government works
New Phytologist� 2018 New Phytologist TrustNew Phytologist (2018)
www.newphytologist.com
NewPhytologist Research 5

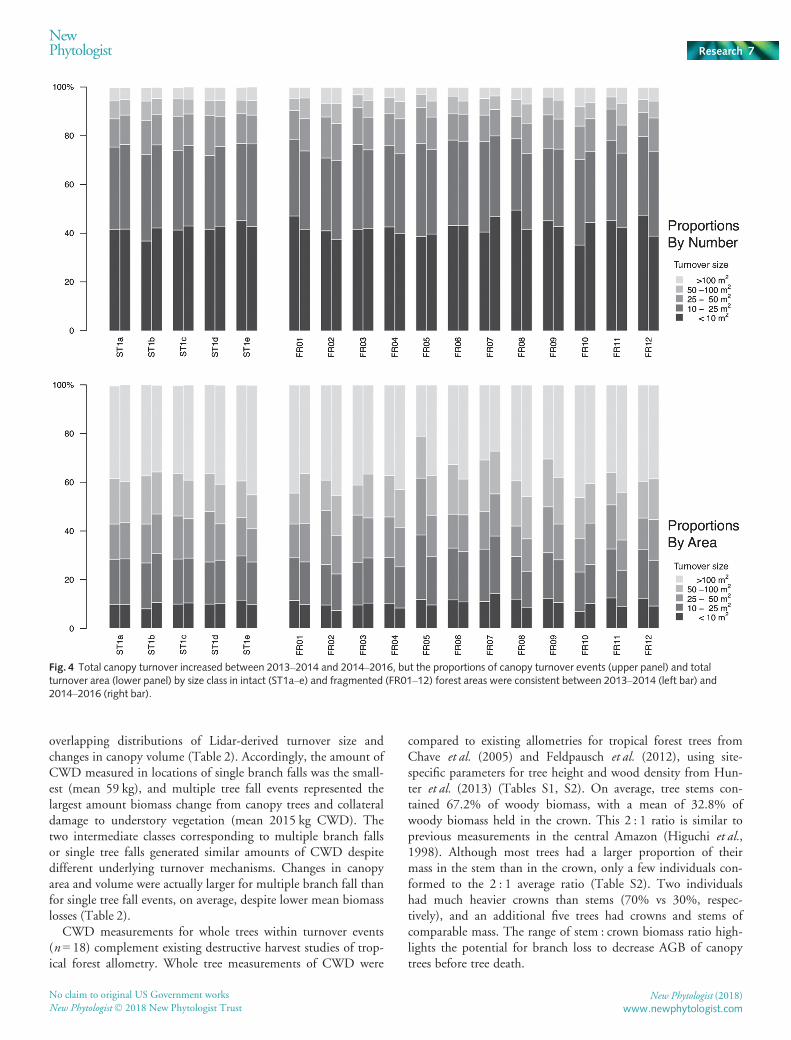
Canopy turnover events were classified into different size cate-gories based on break points in field measurements (Table 2;Fig. 4). Across both intact and fragmented forests, c. 75% ofturnover events were small (< 25 m2), c. 20% were intermediate(25–100 m2) and c. 5% were large (> 100 m2). Large turnoverevents accounted for the largest fraction of the total turnover area(40%), with smaller contributions from intermediate (32%) andsmall (28%) turnover events. Differences in the observed propor-tions between time intervals were small (< 2.7%). Examining allstudy areas, no clear pattern emerged in the size distributions ofturnover events between 2013–2014 and 2014–2016.
Similarly, there was no consistent evidence that taller trees con-tributed a greater proportion of canopy turnover during theinterval (2014–2016) that included the strong El Ni~no drought.The distribution of initial maximum canopy heights within theturnover events in the 2013–2014 and 2014–2016 intervals werelargely consistent (Fig. S2). Within the intact forest transect
(Fig. S2a), only subsections ST1a and ST1d showed a positiveshift in the initial maximum height distributions (Kolmogorov–Smirnov test, P < 0.001 in both segments). Among the forestfragments (Fig. S2b), only FR02 and FR09 showed a statisticallysignificant increase in initial maximum height distributions(Kolmogorov–Smirnov test, P < 0.018 in both fragments).
Coarse woody debris (CWD)
CWD was measured in 78 canopy turnover events within theST1 Lidar transect in 2016 (see Fig. 1). In the field, canopyturnover was classified as single branch fall (n = 20), multiplebranch fall (n = 14), single tree fall (n = 16) and multiple tree fall(n = 28). Based on the area of canopy turnover estimated fromrepeat Lidar, single branch falls were the smallest in size (11.3 m2
on average) and multiple tree falls were the largest (101.1 m2 onaverage), whereas multiple branch falls and single tree falls had
(a) (b)
Fig. 3 Increases in annualized canopy turnover rates between 2013–2014 and 2014–2016 varied by latitude (a) and terrain slope (b) across intact (red) andfragmented forests (blue).
Table 2 Summary of canopy turnover events from repeat Lidar measurements and field surveys of coarse woody debris
Canopy turnoverevents Count
Canopyheight (m) Δ Area (m2) Δ Volume (m3) Δ Biomass (kg)
2014mean
2016mean Min Max Mean SD Min Max Mean SD Min Max Mean SD
Branch fall – single 20 34.7 25.6 4.0 21.3 11.3 4.5 25.4 346.5 110.7 79.3 2.9 432.6 58.8 91.1Branch fall –multiple 14 33.6 24.4 4.0 108.8 23.6 26.5 15.2 1808.0 270.5 434.4 8.1 1347.2 261.9 384.6Tree fall – single 16 25.0 13.3 5.25 47.8 16.0 12.0 51.2 638.4 194.2 186.4 43.4 1048.2 312.7 301.8Tree fall –multiple 28 27.7 16.0 7.0 370.3 101.1 102.8 66.8 6171.2 1397.1 1676.1 40.3 12938.6 2014.8 2905.5All events 78 30.0 19.4 46.7 74.5 618.3 1171.4 849.5 1945.2
Turnover events were classified as branch fall, multiple branch fall, tree fall and multiple tree fall based on field surveys. Changes in canopy area andcanopy volume were derived from differences between the 2014 and 2016 Lidar surveys; biomass change by turnover event class was estimated usingfield measurements.
New Phytologist (2018) No claim to original US Government works
New Phytologist� 2018 New Phytologist Trustwww.newphytologist.com
Research
NewPhytologist6
overlapping distributions of Lidar-derived turnover size andchanges in canopy volume (Table 2). Accordingly, the amount ofCWD measured in locations of single branch falls was the small-est (mean 59 kg), and multiple tree fall events represented thelargest amount biomass change from canopy trees and collateraldamage to understory vegetation (mean 2015 kg CWD). Thetwo intermediate classes corresponding to multiple branch fallsor single tree falls generated similar amounts of CWD despitedifferent underlying turnover mechanisms. Changes in canopyarea and volume were actually larger for multiple branch fall thanfor single tree fall events, on average, despite lower mean biomasslosses (Table 2).
CWD measurements for whole trees within turnover events(n = 18) complement existing destructive harvest studies of trop-ical forest allometry. Whole tree measurements of CWD were
compared to existing allometries for tropical forest trees fromChave et al. (2005) and Feldpausch et al. (2012), using site-specific parameters for tree height and wood density from Hun-ter et al. (2013) (Tables S1, S2). On average, tree stems con-tained 67.2% of woody biomass, with a mean of 32.8% ofwoody biomass held in the crown. This 2 : 1 ratio is similar toprevious measurements in the central Amazon (Higuchi et al.,1998). Although most trees had a larger proportion of theirmass in the stem than in the crown, only a few individuals con-formed to the 2 : 1 average ratio (Table S2). Two individualshad much heavier crowns than stems (70% vs 30%, respec-tively), and an additional five trees had crowns and stems ofcomparable mass. The range of stem : crown biomass ratio high-lights the potential for branch loss to decrease AGB of canopytrees before tree death.
Fig. 4 Total canopy turnover increased between 2013–2014 and 2014–2016, but the proportions of canopy turnover events (upper panel) and totalturnover area (lower panel) by size class in intact (ST1a–e) and fragmented (FR01–12) forest areas were consistent between 2013–2014 (left bar) and2014–2016 (right bar).
No claim to original US Government works
New Phytologist� 2018 New Phytologist TrustNew Phytologist (2018)
www.newphytologist.com
NewPhytologist Research 7

Estimates of AGB from tropical tree allometries were very sen-sitive to height estimates. In general, allometric equations usingexisting diameter–height relationships overestimated the field-measured tree biomass as CWD (Table S1), with only four treeswhere the modeled AGB estimate was lower than field measure-ments of CWD (Fig. S3). Incorporating a local calibration of thediameter–height relationship (Hunter et al., 2013) into the allo-metric equations resulted in lower root mean square error valuesand a higher R2 between measured (CWD) and modeled AGB(see Table S1), but using field measurements of tree height in theallometric models resulted in the smallest mean relative errorwith both the Chave et al. (2005) (14.9%) and the Feldpauschet al. (2012) allometries (12.1%).
CWD from canopy turnover
Changes in canopy height, area and volume were weakly corre-lated with total carbon losses from branch fall, tree fall and multi-ple tree fall events. The modest relationships between biomassand canopy volume changes reflected the wide range of canopyexpressions for branch and tree fall events in tall, multi-layeredAmazon forests (Fig. 5). Separating Lidar–biomass relationshipsby mechanism provided further evidence for the complexity ofCWD production from canopy and understory vegetation fromdifferent turnover classes (Fig. 5b–e). In all four categories ofcanopy turnover, the largest field-measured CWD from canopyturnover generated small changes in canopy volume from repeatLidar acquisitions (Fig. 5b–e). In addition, the slope of the
relationships between field-measured CWD and Lidar-based esti-mates of canopy volume change varied by more than a factor of 2between CWD production from single branch (0.388, R2 = 0.24)and single tree fall events (0.402, R2 = 0.19) and multiple branch(0.903, R2 = 0.31) and multiple tree fall events (0.882,R2 = 0.30). In all cases, the slope (� SE) differed from the rela-tionship between Lidar-derived canopy volume and biomass at0.25 ha resolution using the model developed for TCH fromLongo et al. (2016).
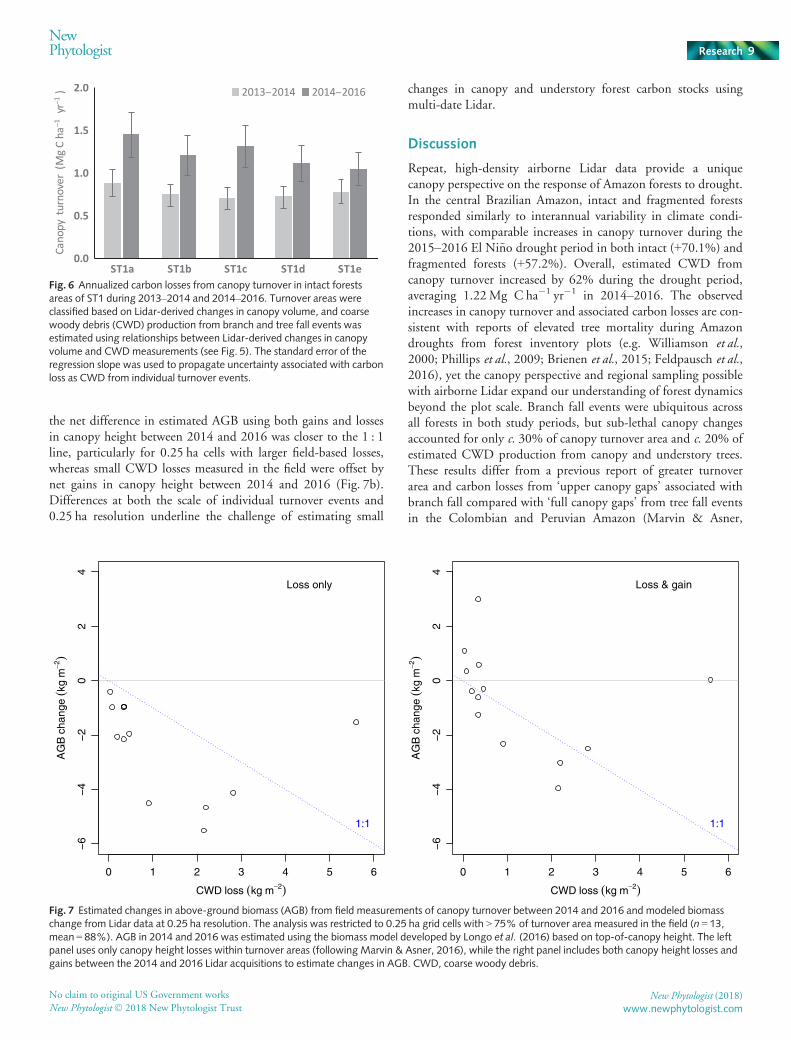
Estimated CWD production in the ST1 transect increasedproportionally to canopy turnover between 2014–2016 and2013–2014 (Fig. 6). Assuming all turnover events were a resultof branch fall (see Fig. 5e) generated a conservative estimate of a63% increase in annualized CWD production from 0.38 to0.61Mg C ha�1 yr�1. Using turnover size to assign events tobranch, treefall and multiple tree fall classes increased the esti-mated CWD production during the drought period by 62%,from 0.76Mg C ha�1 yr�1 in 2013–2014 to 1.22 MgC ha�1 yr�1 in 2014–2016. Importantly, large turnover eventsclassified as single or multiple tree falls accounted for 81.7% and80.3% of estimated carbon losses from canopy turnover in2013–2014 and 2014–2016, respectively.
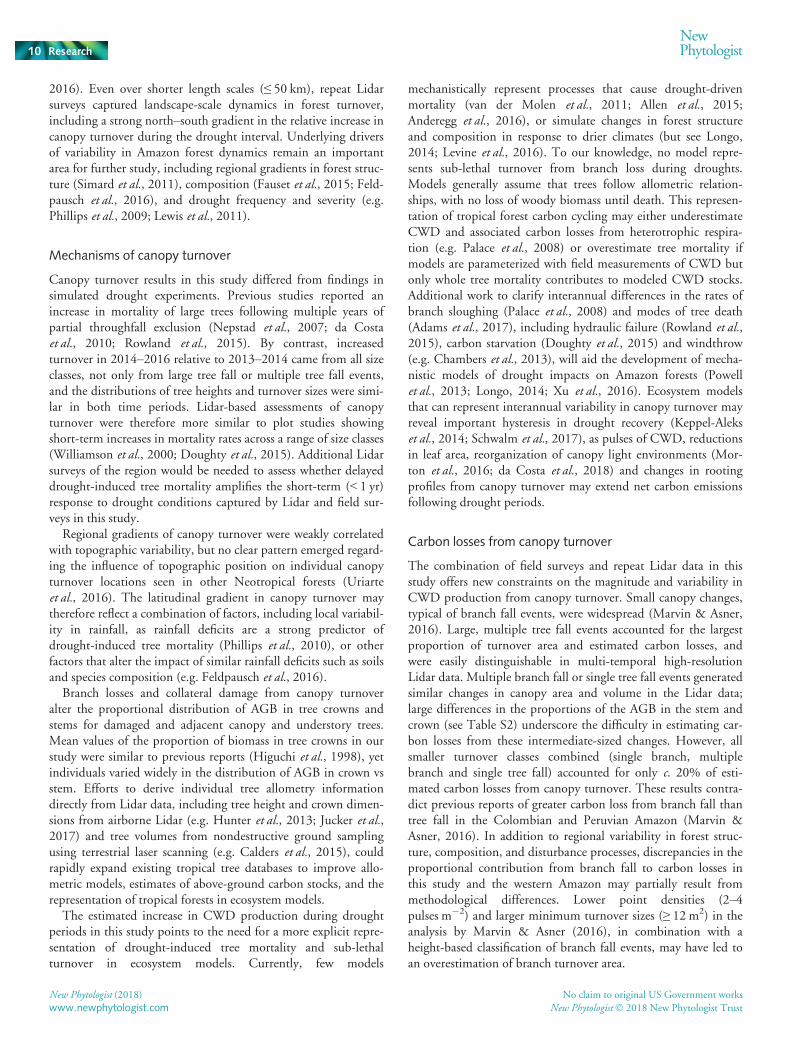
The relationship between field measurements and Lidar-derived estimates of biomass change between 2014 and 2016 wasalso variable at 0.25 ha resolution (Fig. 7). The Marvin & Asner(2016) approach using only canopy height losses to quantifybiomass change overestimated CWD production from field mea-surements in all but one 0.25 ha grid cell (Fig. 7a). By contrast,
0 2000 4000 6000 8000 12 000
020
0040
0060
0080
0012
000
Volume change (m3)
Tota
l bio
mas
s ch
ange
(kg
)
Multiple treeSlope = 0.8818
0 500 1000 1500 2000
050
010
0015
0020
00
Volume change (m3)
Tota
l bio
mas
s ch
ange
(kg
)Multiple branch
Slope = 0.9033
0 500 1000 1500 2000
050
010
0015
0020
00
Volume change (m3)
Tota
l bio
mas
s ch
ange
(kg
)
Single treeSlope = 0.4015
0 100 200 300 400 500
010
020
030
040
050
0
Volume change (m3)
Tota
l bio
mas
s ch
ange
(kg
)
Single branchSlope = 0.3875
0 2000 4000 6000 8000 10 000 12 000
020
0040
0060
0080
0010
000
12 0
00
Volume change (m3)
Tota
l bio
mas
s ch
ange
(kg
)
Multiple tree
Multiple branch
Single tree
Single branch
Fig. 5 Lidar–biomass relationships within canopy turnover events varied by turnover class. Dotted lines indicate the regression relationship between theLidar-based change in canopy volume (m3) and field-measured biomass change, and the standard error of the regression slope is indicated with greyshading. The grey dashed line shows the average Lidar canopy volume–biomass relationship at 0.25 ha resolution for the ST1a transect following Longoet al. (2016).
New Phytologist (2018) No claim to original US Government works
New Phytologist� 2018 New Phytologist Trustwww.newphytologist.com
Research
NewPhytologist8
the net difference in estimated AGB using both gains and lossesin canopy height between 2014 and 2016 was closer to the 1 : 1line, particularly for 0.25 ha cells with larger field-based losses,whereas small CWD losses measured in the field were offset bynet gains in canopy height between 2014 and 2016 (Fig. 7b).Differences at both the scale of individual turnover events and0.25 ha resolution underline the challenge of estimating small
changes in canopy and understory forest carbon stocks usingmulti-date Lidar.
Discussion
Repeat, high-density airborne Lidar data provide a uniquecanopy perspective on the response of Amazon forests to drought.In the central Brazilian Amazon, intact and fragmented forestsresponded similarly to interannual variability in climate condi-tions, with comparable increases in canopy turnover during the2015–2016 El Ni~no drought period in both intact (+70.1%) andfragmented forests (+57.2%). Overall, estimated CWD fromcanopy turnover increased by 62% during the drought period,averaging 1.22Mg C ha�1 yr�1 in 2014–2016. The observedincreases in canopy turnover and associated carbon losses are con-sistent with reports of elevated tree mortality during Amazondroughts from forest inventory plots (e.g. Williamson et al.,2000; Phillips et al., 2009; Brienen et al., 2015; Feldpausch et al.,2016), yet the canopy perspective and regional sampling possiblewith airborne Lidar expand our understanding of forest dynamicsbeyond the plot scale. Branch fall events were ubiquitous acrossall forests in both study periods, but sub-lethal canopy changesaccounted for only c. 30% of canopy turnover area and c. 20% ofestimated CWD production from canopy and understory trees.These results differ from a previous report of greater turnoverarea and carbon losses from ‘upper canopy gaps’ associated withbranch fall compared with ‘full canopy gaps’ from tree fall eventsin the Colombian and Peruvian Amazon (Marvin & Asner,
Fig. 6 Annualized carbon losses from canopy turnover in intact forestsareas of ST1 during 2013–2014 and 2014–2016. Turnover areas wereclassified based on Lidar-derived changes in canopy volume, and coarsewoody debris (CWD) production from branch and tree fall events wasestimated using relationships between Lidar-derived changes in canopyvolume and CWDmeasurements (see Fig. 5). The standard error of theregression slope was used to propagate uncertainty associated with carbonloss as CWD from individual turnover events.
0 1 2 3 4 5 6
−6
−4
−2
02
4
CWD loss (kg m−2)
AG
Bch
ange
(kg
m−2
)
1:1
Loss only
0 1 2 3 4 5 6
−6
−4
−2
02
4
CWD loss (kg m−2)
AG
Bch
ange
(kg
m− 2
)
1:1
Loss & gain
Fig. 7 Estimated changes in above-ground biomass (AGB) from field measurements of canopy turnover between 2014 and 2016 and modeled biomasschange from Lidar data at 0.25 ha resolution. The analysis was restricted to 0.25 ha grid cells with > 75% of turnover area measured in the field (n = 13,mean = 88%). AGB in 2014 and 2016 was estimated using the biomass model developed by Longo et al. (2016) based on top-of-canopy height. The leftpanel uses only canopy height losses within turnover areas (following Marvin & Asner, 2016), while the right panel includes both canopy height losses andgains between the 2014 and 2016 Lidar acquisitions to estimate changes in AGB. CWD, coarse woody debris.
No claim to original US Government works
New Phytologist� 2018 New Phytologist TrustNew Phytologist (2018)
www.newphytologist.com
NewPhytologist Research 9
2016). Even over shorter length scales (≤ 50 km), repeat Lidarsurveys captured landscape-scale dynamics in forest turnover,including a strong north–south gradient in the relative increase incanopy turnover during the drought interval. Underlying driversof variability in Amazon forest dynamics remain an importantarea for further study, including regional gradients in forest struc-ture (Simard et al., 2011), composition (Fauset et al., 2015; Feld-pausch et al., 2016), and drought frequency and severity (e.g.Phillips et al., 2009; Lewis et al., 2011).
Mechanisms of canopy turnover
Canopy turnover results in this study differed from findings insimulated drought experiments. Previous studies reported anincrease in mortality of large trees following multiple years ofpartial throughfall exclusion (Nepstad et al., 2007; da Costaet al., 2010; Rowland et al., 2015). By contrast, increasedturnover in 2014–2016 relative to 2013–2014 came from all sizeclasses, not only from large tree fall or multiple tree fall events,and the distributions of tree heights and turnover sizes were simi-lar in both time periods. Lidar-based assessments of canopyturnover were therefore more similar to plot studies showingshort-term increases in mortality rates across a range of size classes(Williamson et al., 2000; Doughty et al., 2015). Additional Lidarsurveys of the region would be needed to assess whether delayeddrought-induced tree mortality amplifies the short-term (< 1 yr)response to drought conditions captured by Lidar and field sur-veys in this study.
Regional gradients of canopy turnover were weakly correlatedwith topographic variability, but no clear pattern emerged regard-ing the influence of topographic position on individual canopyturnover locations seen in other Neotropical forests (Uriarteet al., 2016). The latitudinal gradient in canopy turnover maytherefore reflect a combination of factors, including local variabil-ity in rainfall, as rainfall deficits are a strong predictor ofdrought-induced tree mortality (Phillips et al., 2010), or otherfactors that alter the impact of similar rainfall deficits such as soilsand species composition (e.g. Feldpausch et al., 2016).
Branch losses and collateral damage from canopy turnoveralter the proportional distribution of AGB in tree crowns andstems for damaged and adjacent canopy and understory trees.Mean values of the proportion of biomass in tree crowns in ourstudy were similar to previous reports (Higuchi et al., 1998), yetindividuals varied widely in the distribution of AGB in crown vsstem. Efforts to derive individual tree allometry informationdirectly from Lidar data, including tree height and crown dimen-sions from airborne Lidar (e.g. Hunter et al., 2013; Jucker et al.,2017) and tree volumes from nondestructive ground samplingusing terrestrial laser scanning (e.g. Calders et al., 2015), couldrapidly expand existing tropical tree databases to improve allo-metric models, estimates of above-ground carbon stocks, and therepresentation of tropical forests in ecosystem models.
The estimated increase in CWD production during droughtperiods in this study points to the need for a more explicit repre-sentation of drought-induced tree mortality and sub-lethalturnover in ecosystem models. Currently, few models
mechanistically represent processes that cause drought-drivenmortality (van der Molen et al., 2011; Allen et al., 2015;Anderegg et al., 2016), or simulate changes in forest structureand composition in response to drier climates (but see Longo,2014; Levine et al., 2016). To our knowledge, no model repre-sents sub-lethal turnover from branch loss during droughts.Models generally assume that trees follow allometric relation-ships, with no loss of woody biomass until death. This represen-tation of tropical forest carbon cycling may either underestimateCWD and associated carbon losses from heterotrophic respira-tion (e.g. Palace et al., 2008) or overestimate tree mortality ifmodels are parameterized with field measurements of CWD butonly whole tree mortality contributes to modeled CWD stocks.Additional work to clarify interannual differences in the rates ofbranch sloughing (Palace et al., 2008) and modes of tree death(Adams et al., 2017), including hydraulic failure (Rowland et al.,2015), carbon starvation (Doughty et al., 2015) and windthrow(e.g. Chambers et al., 2013), will aid the development of mecha-nistic models of drought impacts on Amazon forests (Powellet al., 2013; Longo, 2014; Xu et al., 2016). Ecosystem modelsthat can represent interannual variability in canopy turnover mayreveal important hysteresis in drought recovery (Keppel-Alekset al., 2014; Schwalm et al., 2017), as pulses of CWD, reductionsin leaf area, reorganization of canopy light environments (Mor-ton et al., 2016; da Costa et al., 2018) and changes in rootingprofiles from canopy turnover may extend net carbon emissionsfollowing drought periods.
Carbon losses from canopy turnover
The combination of field surveys and repeat Lidar data in thisstudy offers new constraints on the magnitude and variability inCWD production from canopy turnover. Small canopy changes,typical of branch fall events, were widespread (Marvin & Asner,2016). Large, multiple tree fall events accounted for the largestproportion of turnover area and estimated carbon losses, andwere easily distinguishable in multi-temporal high-resolutionLidar data. Multiple branch fall or single tree fall events generatedsimilar changes in canopy area and volume in the Lidar data;large differences in the proportions of the AGB in the stem andcrown (see Table S2) underscore the difficulty in estimating car-bon losses from these intermediate-sized changes. However, allsmaller turnover classes combined (single branch, multiplebranch and single tree fall) accounted for only c. 20% of esti-mated carbon losses from canopy turnover. These results contra-dict previous reports of greater carbon loss from branch fall thantree fall in the Colombian and Peruvian Amazon (Marvin &Asner, 2016). In addition to regional variability in forest struc-ture, composition, and disturbance processes, discrepancies in theproportional contribution from branch fall to carbon losses inthis study and the western Amazon may partially result frommethodological differences. Lower point densities (2–4pulses m�2) and larger minimum turnover sizes (≥ 12 m2) in theanalysis by Marvin & Asner (2016), in combination with aheight-based classification of branch fall events, may have led toan overestimation of branch turnover area.
New Phytologist (2018) No claim to original US Government works
New Phytologist� 2018 New Phytologist Trustwww.newphytologist.com
Research
NewPhytologist10
Small-area estimation has long been recognized as a challengefor studies of forest carbon stocks using a combination of fieldand Lidar data (e.g. Meyer et al., 2013; Asner & Mascaro,2014; Mauya et al., 2015). Overall, changes in canopy volumeexplained c. 30% of the variability in CWD estimated in thefield. Moving from the scale of individual turnover events tototal changes at 0.25 ha resolution partially balanced problemsof under- and over-estimation of CWD from individualturnover events (see Fig. 7), similar to findings in previousbiomass change studies in tropical forests (Andersen et al., 2014;R�ejou-M�echain et al., 2015). However, increasing the spatialscale does not fundamentally alter the underlying problem – dif-ferent turnover mechanisms do not generate consistent changesin canopy area, canopy volume and CWD. In particular, fieldsurveys in 2016 confirmed that the loss of large canopy treesdoes not always generate a gap in tall, multi-layered Amazonforests, even using gap definitions developed specifically forLidar data (e.g. Hunter et al., 2013; Esp�ırito-Santo et al., 2014;Marvin & Asner, 2016). Average height was > 10 m for allclasses (see Table 2), such that it would be difficult to reliablyseparate branch and tree fall events using a height threshold(Marvin & Asner, 2016).
Our results highlight that Lidar alone may not be sufficient toconstrain small changes in canopy and understory forest carbonstocks, as field measurements provide complementary informa-tion on the mechanisms and total carbon losses from canopyturnover. In particular, differences in drought sensitivity mayalter carbon losses from canopy turnover during drought years, iftrees with lower wood density have higher mortality rates inresponse to soil water deficits (Phillips et al., 2009; Feldpauschet al., 2016). Mortality of smaller trees can also be more easilytracked using inventory plots than airborne Lidar data. It is possi-ble that more frequent Lidar surveys could improve the character-ization of biomass loss from canopy turnover based on changes inforest structure immediately following turnover events, ratherthan the integrated signals of loss and regrowth over the 1–2 yrsampling intervals in this study. Novel methods for routine mon-itoring of canopy dynamics, including autonomous terrestriallaser scanners (Eitel et al., 2016) or frequent flights withunmanned aerial system platforms, may improve the spatial andtemporal sampling of canopy dynamics needed to directly esti-mate carbon losses from remotely sensed estimates of forest struc-ture. More frequent measurements would also aid efforts toattribute pulses of canopy turnover to specific seasons or phe-nomena, including potential interaction between drought andwind events.
Conclusions
Airborne Lidar offers an efficient means to characterize Amazonforest dynamics over large areas. Evidence for large interannualvariability in canopy turnover in Amazon forests, with ≥ 10turnover events ha�1 yr�1 during the 2015–2016 El Ni~nodrought period, suggests that severe drought events alter bothshort- and long-term regional carbon cycling via changes incanopy structure and associated fluxes of CWD. By linking time
series of high-density airborne Lidar data with field measure-ments of CWD, we clarified the mechanisms that contribute toobserved canopy turnover in drought years. Results from thisstudy reaffirm the importance of sub-lethal changes in canopystructure in Amazon forests (Marvin & Asner, 2016), yet ourfindings contradict the previous work by Marvin & Asner (2016)that branch losses contribute a greater proportion of carbon lossesfrom canopy turnover than tree falls. Using high-resolutionrepeat Lidar, we found that multiple tree fall events accountedfor the largest area of canopy change and > 80% of estimated car-bon losses in both sampling intervals. Annualized estimates ofcarbon losses from canopy turnover in both periods (0.76–1.22Mg C ha�1 yr�1) were comparable to long-term estimates ofthe net carbon sink in Amazon forests (Brienen et al., 2015), sug-gesting that interannual variability in canopy turnover con-tributes to changes in the net carbon balance of Amazon forestsduring drought years (e.g. Gatti et al., 2014). Finally, our find-ings also highlight the need to account for both drought-inducedmortality and branch losses in ecosystem models to capture timedelays in net carbon balance and forest productivity followingdrought periods.
Acknowledgements
This research was supported by NASA’s Carbon Monitoring Systemand the Brazilian National Council for Scientific and TechnologicalDevelopment (CNPq, grant 457927/2013-5) and Ciencia semFronteiras Program (award to D.C.M.). Lidar data were acquiredwith support from USAID, the US Department of State,EMBRAPA and the US Forest Service Office of International Pro-grams.M.L. was supported by FAPESP (grant 2015/07227-6).
Author contributions
V.L. and D.C.M. planned and designed the research. V.L. con-ducted fieldwork. M.K. coordinated Lidar data collection. V.L.,D.C.M., M.N.d.S., M.L. and M.S. analyzed and interpretedLidar results. All authors contributed to the preparation of themanuscript.
ORCID
Douglas C. Morton X http://orcid.org/0000-0003-2226-1124Marcos Longo X http://orcid.org/0000-0001-5062-6245
References
Adams HD, Zeppel MJB, Anderegg WRL, Hartmann H, Landh€ausser SM,
Tissue DT, Huxman TE, Hudson PJ, Franz TE, Allen CD et al. 2017. Amulti-species synthesis of physiological mechanisms in drought-induced tree
mortality. Nature Ecology & Evolution 1: 1285–1291.Aguiar APD, Ometto JP, Nobre C, Lapola DM, Almeida C, Vieira IC, Soares
JV, Alvala R, Saatchi S, Valeriano D et al. 2012.Modeling the spatial and
temporal heterogeneity of deforestation-driven carbon emissions: the INPE-
EM framework applied to the Brazilian Amazon. Global Change Biology 18:3346–3366.
No claim to original US Government works
New Phytologist� 2018 New Phytologist TrustNew Phytologist (2018)
www.newphytologist.com
NewPhytologist Research 11

Allen CD, Breshears DD, McDowell NG. 2015.On underestimation of global
vulnerability to tree mortality and forest die-off from hotter drought in the
Anthropocene. Ecosphere 6: 1–55.Anderegg WRL, Martinez-Vilalta J, Cailleret M, Camarero JJ, Ewers BE,
Galbraith D, Gessler A, Grote R, Huang C-y, Levick SR et al. 2016.When a
tree dies in the forest: scaling climate-driven tree mortality to ecosystem water
and carbon fluxes. Ecosystems 19: 1133–1147.Andersen H-E, Reutebuch SE, McGaughey RJ, d’Oliveira MVN, Keller M.
2014.Monitoring selective logging in western Amazonia with repeat Lidar
flights. Remote Sensing of Environment 151: 157–165.Arag~ao LEOC, Malhi Y, Roman-Cuesta RM, Saatchi SS, Anderson LO,
Shimabukuro YE. 2007. Spatial patterns and fire response of recent
Amazonian droughts. Geophysical Research Letters 34: L07701.Asner GP, Kellner JR, Kennedy-Bowdoin T, Knapp DE, Anderson C, Martin
RE. 2013. Forest canopy gap distributions in the southern Peruvian Amazon.
PLoS ONE 8: e60875.
Asner GP, Mascaro J. 2014.Mapping tropical forest carbon: calibrating plot
estimates to a simple Lidar metric. Remote Sensing of Environment 140: 614–624.
Avitabile V, Herold M, Heuvelink GBM, Lewis SL, Phillips OL, Asner GP,
Armston J, Ashton PS, Banin L, Bayol N et al. 2016. An integrated pan-
tropical biomass map using multiple reference datasets. Global Change Biology22: 1406–1420.
Brando PM, Balch JK, Nepstad DC, Morton DC, Putz FE, Coe MT, Silv�erio
D, Macedo MN, Davidson EA, N�obrega CC et al. 2014. Abrupt increases inAmazonian tree mortality due to drought–fire interactions. Proceedings of theNational Academy of Sciences, USA 111: 6347–6352.
Brando PM, Nepstad DC, Davidson EA, Trumbore SE, Ray D, Camargo P.
2007. Drought effects on litterfall, wood productiod and belowground carbon
cycling in an Amazon forest: results of a throughfall reduction experiment.
Philosophical Transactions of the Royal Society of London B 363: 1839–1848.Brienen RJW, Phillips OL, Feldpausch TR, Gloor E, Baker TR, Lloyd J, Lopez-
Gonzalez G, Monteagudo-Mendoza A, Malhi Y, Lewis SL et al. 2015. Long-term decline of the Amazon carbon sink. Nature 519: 344–348.
Brinck K, Fischer R, Groeneveld J, Lehmann S, Dantas De Paula M, P€utz S,
Sexton JO, Song D, Huth A. 2017.High resolution analysis of tropical forest
fragmentation and its impact on the global carbon cycle. NatureCommunications 8: 14855.
Calders K, Newnham G, Burt A, Murphy S, Raumonen P, Herold M, Culvenor
D, Avitabile V, Disney M, Armston J et al. 2015. Nondestructive estimates of
above-ground biomass using terrestrial laser scanning.Methods in Ecology andEvolution 6: 198–208.
Chambers JQ, Negron-Juarez RI, Marra DM, Di Vittorio A, Tews J, Roberts
D, Ribeiro GHPM, Trumbore SE, Higuchi N. 2013. The steady-state mosaic
of disturbance and succession across an old-growth Central Amazon forest
landscape. Proceedings of the National Academy of Sciences, USA 110: 3949–3954.
Chave J, Andalo C, Brown S, Cairns M, Chambers JQ, Eamus D, Folster H,
Fromard F, Higuchi N, Kira T et al. 2005. Tree allometry and improved
estimation of carbon stocks and balance in tropical forests. Oecologia 145:87–99.
Chave J, Condit R, Aguilar S, Hernandez A, Lao S, Perez R. 2004. Error
propagation and scaling for tropical forest biomass estimates. PhilosophicalTransactions of the Royal Society of London B 359: 409.
Cook B, Corp L, Nelson R, Middleton E, Morton D, McCorkel J, Masek J,
Ranson K, Ly V, Montesano P. 2013. NASA Goddard’s Lidar, Hyperspectral
and Thermal (G-LiHT) airborne imager. Remote Sensing 5: 4045–4066.da Costa ACL, Galbraith D, Almeida S, Portela BTT, da Costa M, de Athaydes
Silva Junior J, Braga AP, de Gonc�alves PHL, de Oliveira AAR, Fisher R et al.2010. Effect of 7 yr of experimental drought on vegetation dynamics and
biomass storage of an eastern Amazonian rainforest. New Phytologist 187:579–591.
da Costa ACL, Rowland L, Oliveira RS, Oliveira AAR, Binks OJ, Salmon Y,
Vasconcelos SS, Junior JAS, Ferreira LV, Poyatos R et al. 2018. Standdynamics modulate water cycling and mortality risk in droughted tropical
forest. Global Change Biology 24: 249–258.
Doughty CE, Metcalfe DB, Girardin CAJ, Amezquita FF, Cabrera DG, Huasco
WH, Silva-Espejo JE, Araujo-Murakami A, da Costa MC, Rocha W et al.2015. Drought impact on forest carbon dynamics and fluxes in Amazonia.
Nature 519: 78–82.Eitel JUH, H€ofle B, Vierling LA, Abell�an A, Asner GP, Deems JS, Glennie CL,
Joerg PC, LeWinter AL, Magney TS et al. 2016. Beyond 3-D: the new
spectrum of Lidar applications for earth and ecological sciences. Remote Sensingof Environment 186: 372–392.
Esp�ırito-Santo FDB, Gloor M, Keller M, Malhi Y, Saatchi S, Nelson B, Junior
RCO, Pereira C, Lloyd J, Frolking S et al. 2014. Size and frequency of naturalforest disturbances and the Amazon forest carbon balance. NatureCommunications 5: 3434.
Fauset S, Johnson MO, Gloor M, Baker TR, Monteagudo MA, Brienen RJW,
Feldpausch TR, Lopez-Gonzalez G, Malhi Y, ter Steege H et al. 2015.Hyperdominance in Amazonian forest carbon cycling. Nature Communications6: 6857.
Feldpausch TR, Lloyd J, Lewis SL, Brienen RJW, Gloor M, Monteagudo
Mendoza A, Lopez-Gonzalez G, Banin L, Abu Salim K, Affum-Baffoe K et al.2012. Tree height integrated into pantropical forest biomass estimates.
Biogeosciences 9: 3381–3403.Feldpausch TR, Phillips OL, Brienen RJW, Gloor E, Lloyd J, Lopez-Gonzalez
G, Monteagudo-Mendoza A, Malhi Y, Alarc�on A, �Alvarez D�avila E et al.2016. Amazon forest response to repeated droughts. Global BiogeochemicalCycles 30: 964–982.
Gatti LV, Gloor M, Miller JB, Doughty CE, Malhi Y, Domingues LG, Basso
LS, Martinewski A, Correia CSC, Borges VF et al. 2014. Drought sensitivity
of Amazonian carbon balance revealed by atmospheric measurements. Nature506: 76–80.
Hansen MC, Potapov PV, Moore R, Hancher M, Turubanova SA,
Tyukavina A, Thau D, Stehman SV, Goetz SJ, Loveland TR et al. 2013.High-resolution global maps of 21st-century forest cover change. Science342: 850.
Higuchi N, dos Santos J, Ribeiro R, Minette L, Biot Y. 1998. Biomass da parte
a�erea da vegetac�~ao da floresta tropical �umida de terra-firme da Amazonia
Brasileira. Acta Amazonica 28: 153–166.Hunter MO, Keller M, Morton D, Cook B, Lefsky M, Ducey M, Saleska S, de
Oliveira RC Jr, Schietti J. 2015. Structural dynamics of tropical moist forest
gaps. PLoS ONE 10: e0132144.
Hunter MO, Keller M, Victoria D, Morton DC. 2013. Tree height and tropical
forest biomass estimation. Biogeosciences 10: 8385–8399.Jucker T, Caspersen J, Chave J, Antin C, Barbier N, Bongers F, Dalponte M,
van Ewijk KY, Forrester DI, Haeni M et al. 2017. Allometric equations for
integrating remote sensing imagery into forest monitoring programmes. GlobalChange Biology 23: 177–190.
Keller M, Palace M, Asner GP, Pereira R, Silva JNM. 2004. Coarse woody
debris in undisturbed and logged forests in the eastern Brazilian Amazon.
Global Change Biology 10: 784–795.Kellner JR, Clark DB, Hubbell SP. 2009. Pervasive canopy dynamics produce
short-term stability in a tropical rain forest landscape. Ecology Letters 12:155–164.
Keppel-Aleks G, Wolf AS, Mu M, Doney SC, Morton DC, Kasibhatla PS,
Miller JB, Dlugokencky EJ, Randerson JT. 2014. Separating the influence of
temperature, drought, and fire on interannual variability in atmospheric CO2.
Global Biogeochemical Cycles 28: 1295–1310.Le Qu�er�e C, Andrew RM, Canadell JG, Sitch S, Korsbakken JI, Peters GP,
Manning AC, Boden TA, Tans PP, Houghton RA et al. 2016. Global carbon
budget 2016. Earth System Science Data 8: 605–649.Levine NM, Zhang K, Longo M, Baccini A, Phillips OL, Lewis SL, Alvarez-
D�avila E, Segalin de Andrade AC, Brienen RJW, Erwin TL et al. 2016.Ecosystem heterogeneity determines the ecological resilience of the Amazon to
climate change. Proceedings of the National Academy of Sciences, USA 113:
793–797.Lewis SL, Brando PM, Phillips OL, van der Heijden GMF, Nepstad D. 2011.
The 2010 Amazon drought. Science 331: 554.Lloyd J, Gloor EU, Lewis SL. 2009. Are the dynamics of tropical forests
dominated by large and rare disturbance events? Ecology Letters 12: E19–E21.
New Phytologist (2018) No claim to original US Government works
New Phytologist� 2018 New Phytologist Trustwww.newphytologist.com
Research
NewPhytologist12
Longo M. 2014. Amazon forest response to changes in rainfall regime: results
from an individual-based dynamic vegetation model. PhD thesis, Harvard
University, Cambridge, MA, USA.
Longo M, Keller M, dos-Santos MN, Leitold V, Pinag�e ER, Baccini A, Saatchi
S, Nogueira EM, Batistella M, Morton DC. 2016. Aboveground biomass
variability across intact and degraded forests in the Brazilian Amazon. GlobalBiogeochemical Cycles 30: 1639–1660.
Marvin DC, Asner GP. 2016. Branchfall dominates annual carbon flux across
lowland Amazonian forests. Environmental Research Letters 11: 094027.Mauya EW, Hansen EH, Gobakken T, Bollands�as OM, Malimbwi RE, Næsset
E. 2015. Effects of field plot size on prediction accuracy of aboveground
biomass in airborne laser scanning-assisted inventories in tropical rain forests of
Tanzania. Carbon Balance and Management 10: 10.Meyer V, Saatchi SS, Chave J, Dalling JW, Bohlman S, Fricker GA, Robinson
C, Neumann M, Hubbell S. 2013. Detecting tropical forest biomass dynamics
from repeated airborne Lidar measurements. Biogeosciences 10: 5421–5438.van der Molen MK, Dolman AJ, Ciais P, Eglin T, Gobron N, Law BE, Meir P,
Peters W, Phillips OL, Reichstein M et al. 2011. Drought and ecosystem
carbon cycling. Agricultural and Forest Meteorology 151: 765–773.Morton DC, Rubio J, Cook BD, Gastellu-Etchegorry JP, Longo M, Choi H,
Hunter M, Keller M. 2016. Amazon forest structure generates diurnal and
seasonal variability in light utilization. Biogeosciences 13: 2195–2206.Nepstad DC, Tohver IM, Ray D, Moutinho P, Cardinot G. 2007.Mortality of
large trees and lianas following experimental drought in an Amazon forest.
Ecology 88: 2259–2269.Palace M, Keller M, Silva H. 2008. Necromass production: studies in
undisturbed and logged Amazon forests. Ecological Applications 18: 873–884.Palace M, Keller M. 2008. Necromass production: studies in undisturbed and
logged Amazon forests. Ecological Applications 18: 873–884.Pan Y, Birdsey RA, Fang J, Houghton R, Kauppi PE, Kurz WA, Phillips OL,
Shvidenko A, Lewis SL, Canadell JG et al. 2011. A large and persistent carbon
sink in the world’s forests. Science 333: 988–993.Phillips OL, Arag~ao LEOC, Lewis SL, Fisher JB, Lloyd J, L�opez-Gonz�alez G,
Malhi Y, Monteagudo A, Peacock J, Quesada CA et al. 2009. Drought
sensitivity of the Amazon rainforest. Science 323: 1344.Phillips OL, van der Heijden G, Lewis SL, L�opez-Gonz�alez G, Arag~ao LEOC,
Lloyd J, Malhi Y, Monteagudo A, Almeida S, D�avila EA et al. 2010.Drought–mortality relationships for tropical forests. New Phytologist 187:631–646.
Powell TL, Galbraith DR, Christoffersen BO, Harper A, Imbuzeiro HMA,
Rowland L, Almeida S, Brando PM, da Costa ACL, Costa MH et al. 2013.Confronting model predictions of carbon fluxes with measurements of Amazon
forests subjected to experimental drought. New Phytologist 200: 350–365.R�ejou-M�echain M, Tymen B, Blanc L, Fauset S, Feldpausch TR, Monteagudo
A, Phillips OL, Richard H, Chave J. 2015. Using repeated small-footprint
Lidar acquisitions to infer spatial and temporal variations of a high-biomass
Neotropical forest. Remote Sensing of Environment 169: 93–101.Rice AH, Pyle EH, Saleska SR, Hutyra L, Palace M, Keller M, de Camargo PB,
Portilho K, Marques DF, Wofsy SC. 2004. Carbon balance and vegetation
dynamics in an old-growth Amazonian forest. Ecological Applications 14:55–71.
Rowland L, da Costa ACL, Galbraith DR, Oliveira RS, Binks OJ, Oliveira
AAR, Pullen AM, Doughty CE, Metcalfe DB, Vasconcelos SS et al. 2015.Death from drought in tropical forests is triggered by hydraulics not carbon
starvation. Nature 528: 119.Schwalm CR, Anderegg WRL, Michalak AM, Fisher JB, Biondi F, Koch G,
Litvak M, Ogle K, Shaw JD, Wolf A et al. 2017. Global patterns of droughtrecovery. Nature 548: 202–205.
Simard M, Pinto N, Fisher JB, Baccini A. 2011.Mapping forest canopy height
globally with spaceborne Lidar. Journal of Geophysical Research: Biogeosciences116: G04021.
Tropical Rainfall Measuring Mission, TRMM. 2011. TRMM (TMPA/3B43)
Rainfall Estimate L3 1 month 0.25 degree x 0.25 degree V7. Goddard Earth
Sciences Data and Information Services Center (GES DISC), Greenbelt, MD,
USA, [WWW document] URL https://disc.gsfc.nasa.gov/datacollection/
TRMM_3B43_7.html [accessed January 2018].
Uriarte M, Schwartz N, Powers JS, Mar�ın-Spiotta E, Liao W, Werden LK.
2016. Impacts of climate variability on tree demography in second growth
tropical forests: the importance of regional context for predicting successional
trajectories. Biotropica 48: 780–797.van der Werf GR, Randerson JT, Giglio L, van Leeuwen TT, Chen Y,
Rogers BM, Mu M, van Marle MJE, Morton DC, Collatz GJ et al. 2017.Global fire emissions estimates during 1997–2016. Earth System ScienceData 9: 697–720.
Williamson GB, Laurance WF, Oliveira AA, Delamonica P, Gascon C, Lovejoy
TE, Pohl L. 2000. Amazonian tree mortality during the 1997 El Ni~no
drought. Conservation Biology 14: 1538–1542.Xu X, Medvigy D, Powers JS, Becknell JM, Guan K. 2016. Diversity in plant
hydraulic traits explains seasonal and inter-annual variations of vegetation
dynamics in seasonally dry tropical forests. New Phytologist 212: 80–95.Zhang K, Chen S-C, Whitman D, Shyu M-L, Yan J, Zhang C. 2003. A
progressive morphological filter for removing nonground measurements from
airborne LIDAR data. IEEE Transactions on Geoscience and Remote Sensing 41:872–882.
Supporting Information
Additional Supporting Information may be found online in theSupporting Information tab for this article:
Fig. S1 Estimated total annual precipitation and maximumcumulative water deficit (MCWD; Arag~ao et al., 2007) fromsatellite and meteorological station data capture the 2015–2016El Ni~no drought.
Fig. S2 The distribution of maximum canopy heights withinturnover events was similar between the 2013–2014 and 2014–2016 intervals.
Fig. S3 Relative error between observed tree mass (n = 18) andestimated above-ground biomass from six different allometricmodels (see Table S1).
Table S1 Whole tree measurements from coarse woody debrissurveys in 2016 were compared to predicted above-groundbiomass (AGB) using six allometric equations for tropical foresttrees following methods described by Chave et al. (2004, 2005)
Table S2 Whole tree measurements from coarse woody debrissurveys in canopy turnover areas and estimated above-groundbiomass from allometric models of tropical forest trees (seeTable S1)
Please note: Wiley Blackwell are not responsible for the contentor functionality of any Supporting Information supplied by theauthors. Any queries (other than missing material) should bedirected to the New Phytologist Central Office.
No claim to original US Government works
New Phytologist� 2018 New Phytologist TrustNew Phytologist (2018)
www.newphytologist.com
NewPhytologist Research 13