Embed Size (px)
Citation preview

United StatesDepartment ofAgriculture
EconomicResearchService
EconomicInformationBulletinNumber 56
September 2009
Mark Nord
Prevalence, Severity, and Household Characteristics
Food Insecurity in Households with Children

You can find additional information about ERS publications, databases, and other products at our website.
www.ers.usda.gov/Briefing/FoodSecurity/
Visit Our Website To Learn More!
National Agricultural LibraryCataloging Record:
The U.S. Department of Agriculture (USDA) prohibits discrimination in all its programs and activities on the basis of race, color, national origin, age, disability, and, where applicable, sex, marital status, familial status, parental status, religion, sexual orientation, genetic information, political beliefs, reprisal, or because all or a part of an individual's income is derived from any public assistance program. (Not all prohibited bases apply to all programs.) Persons with disabilities who require alternative means for communication of program information (Braille, large print, audiotape, etc.) should contact USDA's TARGET Center at (202) 720-2600 (voice and TDD).
To file a complaint of discrimination write to USDA, Director, Office of Civil Rights, 1400 Independence Avenue, S.W., Washington, D.C. 20250-9410 or call (800) 795-3272 (voice) or (202) 720-6382 (TDD). USDA is an equal opportunity provider and employer.
Cover photo credit: Shutterstock.
ww
w.er
s.usda.gov
Recommended citation format for this publication:Nord, Mark. Food Insecurity in Households with Children: Prevalence, Severity, and Household Characteristics. EIB-56. U.S. Dept. of Agriculture, Econ. Res. Serv. September 2009
Nord, Mark
Food insecurity in households with children : prevalence, severity, and household characteristics.
(Economic information bulletin; no. 56)
1. Food relief--United States. 2. Poor children--Nutrition--United States.
3. Low-income parents--United States.
4. Food supply--United States--Statistics.
I. United States. Dept. of Agriculture. Economic Research Service.
II. Title.
HV696.F6

United StatesDepartmentof Agriculture
www.ers.usda.gov
A Report from the Economic Research Service
Mark Nord
Food Insecurity in Households with ChildrenPrevalence, Severity, and Household Characteristics
EconomicInformationBulletinNumber 56
September 2009
Abstract
Eighty-four percent of U.S. households with children were food secure throughout 2007, meaning that they had consistent access to adequate food for active, healthy lives for all household members. Nearly 16 percent of households with children were food insecure sometime during the year, including 8.3 percent in which children were food insecure and 0.8 percent in which one or more children experienced very low food security—the most severe food-insecure condition measured by the U.S. Department of Agriculture. Numerous studies suggest that children in food-insecure households have higher risks of health and development problems than children in otherwise similar food-secure households. This study found that about 85 percent of households with food-insecure children had a working adult, including 70 percent with a full-time worker. Fewer than half of households with food-insecure chil-dren included an adult educated past high school. Thus, job opportunities and wage rates for less educated workers are important factors affecting the food security of children. In 2007, Federal food and nutrition assistance programs provided benefi ts to four out of fi ve low-income, food-insecure households with children.
Keywords: Food Security, food insecurity, hunger, children, SNAP, Supplemental Nutrition Assistance Program, WIC, National School Lunch Program
About the Author
Mark Nord is a sociologist in the Food Economics Division, Economic Research Service, U.S. Department of Agriculture.
Acknowledgments
The author thanks Katherine Alaimo of Michigan State University; Minh Wendt of the Economic Research Service, U.S. Department of Agriculture; and an anonymous reviewer for their helpful comments on the report.

iiFood Insecurity in Households with Children: Prevalence, Severity, and Household Characteristics / EIB-56
Economic Research Service/USDA
Contents
Summary. . . . . . . . . . . . . . . . . . . . . . . . . . . . . . . . . . . . . . . . . . . . . . . . . . . iii
Introduction . . . . . . . . . . . . . . . . . . . . . . . . . . . . . . . . . . . . . . . . . . . . . . . . . 1
Food Security and Insecurity: Concepts and 2007 National Statistics . . . . . . . . . . . . . . . . . . . . . . . . . . . . . . . . . . 3
Food-Insecure Households With Children: Levels of Food Insecurity . . . . . . . . . . . . . . . . . . . . . . . . . . . . . . . . . . . . 4
Food Security Among Adults Only . . . . . . . . . . . . . . . . . . . . . . . . . . . . . 4
Low Food Security Among Children . . . . . . . . . . . . . . . . . . . . . . . . . . . . 4
Very Low Food Security Among Children. . . . . . . . . . . . . . . . . . . . . . . . 5
Food Insecurity and Childhood Hunger . . . . . . . . . . . . . . . . . . . . . . . . . . 6
Associations Between Children’s Health and Development and Food Insecurity . . . . . . . . . . . . . . . . . . . . . . . . . 7
Trends in Food Insecurity in Households with Children, 1999-2007 . . . . . . . . . . . . . . . . . . . . . . . . . . . . . . . . . . . . 9
Food Insecurity Among Children in Selected Subpopulations, 2006-07 Average . . . . . . . . . . . . . . . . . . . . . . . . . . . . 11
Household Composition . . . . . . . . . . . . . . . . . . . . . . . . . . . . . . . . . . . . . 12
Race and Hispanic Ethnicity . . . . . . . . . . . . . . . . . . . . . . . . . . . . . . . . . . 13
Household Income . . . . . . . . . . . . . . . . . . . . . . . . . . . . . . . . . . . . . . . . . 14
Residence Relative to Metropolitan Statistical Areas. . . . . . . . . . . . . . . 15
Residence by Census Region . . . . . . . . . . . . . . . . . . . . . . . . . . . . . . . . . 16
Employment and Labor Force Status of Adults in the Household . . . . . 17
Educational Attainment of Adults in the Household . . . . . . . . . . . . . . . 18
Age of Oldest Child . . . . . . . . . . . . . . . . . . . . . . . . . . . . . . . . . . . . . . . . 19
Number of Children in the Household . . . . . . . . . . . . . . . . . . . . . . . . . . 20
Food and Nutrition Assistance Program Participation and Children’s Food Insecurity, 2006-07 Average . . . . . . . . . . . . . . 21
Food Insecurity in Households with Children by State, 2001-2007 Average . . . . . . . . . . . . . . . . . . . . . . . . . . . . . . . . 25
Conclusions. . . . . . . . . . . . . . . . . . . . . . . . . . . . . . . . . . . . . . . . . . . . . . . . . 28
References. . . . . . . . . . . . . . . . . . . . . . . . . . . . . . . . . . . . . . . . . . . . . . . . . . 30
Appendix A. Questions used to assess the food security of households in USDA’s annual food security survey . . . . . . . . . . . . . 32Appendix table B. Findings from selected studies on effects of food insecurity and food insuffi ciency on children’s health . . . . . . . . . . . . . . 34Appendix table C. Incidence of food insecurity in selected subpopulations, 2006-07 average. . . . . . . . . . . . . . . . . . . . . . . . . . . . . . . 40

iiiFood Insecurity in Households with Children: Prevalence, Severity, and Household Characteristics / EIB-56
Economic Research Service/USDA
Summary
Most U.S. households with children have dependable access to adequate food for active, healthy living for both adults and children—they are food secure. However, some households experience periods of food insecurity, including times when children as well as adults are affected. The U.S. Department of Agriculture (USDA) monitors the extent and severity of food insecurity in U.S. households through an annual, nationally representative survey, with special attention to households with children.
What Is the Issue?
Food security is especially important for children because their nutrition affects not only their current health, but also their future health and well-being. Previous studies that used various data sources suggest that children in food-insecure households face elevated risks of health and development problems, compared with children in otherwise similar food-secure house-holds. USDA’s domestic food and nutrition assistance programs improve children’s food security by providing low-income households with access to healthful food, as well as to nutrition education. Knowledge about the extent of food insecurity in households with children—and the household character-istics associated with food insecurity—contributes to effective operation of these and other programs that support the well-being of children. This report describes the prevalence and severity of food insecurity in households with children as of 2007, the trends since 1999, and characteristics of households affected by food insecurity.
What Did the Study Find?
In 2007, 84.2 percent of households with children were food secure throughout the year, meaning that they had consistent access to enough food for active, healthy lives for all household members. The remaining 15.8 percent of households with children were food insecure at some time during the year. In about half of those households, only adults were food insecure, but in 8.3 percent of households with children, one or more of the children were also food insecure at some time during the year. In 0.8 percent of households with children, one or more of the children experienced the most severe food-insecure condition measured by USDA, very low food security, in which meals were irregular and food intake was below levels considered adequate by caregivers.
Job opportunities and wage rates, along with work supports available to working households (such as earned-income tax credits, child care subsidies, and supplemental nutrition assistance), are likely to be key determinants of children’s food security in low-income households. A large majority—about 85 percent—of households with food-insecure children have one or more adults in the labor force, including almost 70 percent with one or more full-time workers. However, fewer than half of households with food-insecure children include an adult with education beyond high school, and only 10 percent include an adult with a 4-year college degree. Thus, employment opportunities and wage levels for less skilled or less educated workers are particularly important factors in the food security of dependent children.

ivFood Insecurity in Households with Children: Prevalence, Severity, and Household Characteristics / EIB-56
Economic Research Service/USDA
In 2006-07, Federal food and nutrition assistance programs provided benefi ts to four out of fi ve food-insecure households with children if the house-hold had an income less than 185 percent of the poverty line. Children in about 70 percent of such households received free or reduced-price school meals, about 40 percent of the households received Supplemental Nutrition Assistance Program (SNAP) benefi ts, and about 20 percent received benefi ts from the Special Supplemental Nutrition Program for Women, Infants, and Children (WIC). Many households received assistance from two or all three of the programs, although one-third reported receiving only free or reduced-price school meals. Low-income households that did not receive assistance from any of the programs were less likely to be food insecure (11 percent) than those that did receive assistance (19 to 32 percent, depending on the mix of programs). This difference suggests that the primary reason for nonpar-ticipation of eligible households is that they feel they do not need food assis-tance, rather than factors such as inadequate program outreach.
Food insecurity among children was more likely in households that had left SNAP during the previous year than in those currently receiving benefi ts. This fi nding suggests that some households leave the program even though their economic resources are not yet adequate to meet their food needs.
How Was the Study Conducted?
Data for the study came from annual food security surveys sponsored by USDA and conducted by the U.S. Census Bureau as supplements to the monthly Current Population Survey. Respondents to the survey were a repre-sentative sampling of the U.S. civilian population and included between 15,000 and 18,000 households with children each year. The food security survey asked one adult respondent in each household a series of questions about experiences and behaviors that indicate food insecurity. The food security status of the household was assessed based on the number of food-insecure conditions reported (such as being unable to afford balanced meals, cutting the size of meals, or being hungry because there was too little money for food). The food security status of children in the household was assessed by responses to a subset of questions about the conditions and experiences of children. Survey respondents also reported whether they had used food and nutrition assistance programs. To provide information on how children’s health and development may be affected by food insecurity, peer-reviewed studies on those topics by other researchers were reviewed and summarized.

1Food Insecurity in Households with Children: Prevalence, Severity, and Household Characteristics / EIB-56
Economic Research Service/USDA
Introduction
Food security—access at all times to enough food for an active, healthy life—is an important foundation for good nutrition and health. Food security is especially important for children because the nutritional content of their diets affects not only their current health, but also their physical, mental, and social development—and thus their future health and well-being.
The U.S. Department of Agriculture (USDA) provides annual statistics on the food security of U.S. households, including summary statistics on house-holds with children by demographic characteristics and income (Nord et al., 2008). The present report gives further detailed information on the food secu-rity of households with children, with a breakdown by additional characteris-tics such as employment, education of adults, and household use of food and nutrition assistance programs (see box “About the Data”).
USDA spends about $60 billion annually on domestic food and nutri-tion assistance programs to ensure access to nutritious, healthful diets for all Americans. Children make up the largest share of the benefi ciaries of those programs. About 50 percent of the recipients of the largest program, the Supplemental Nutrition Assistance Program (SNAP, formerly the Food Stamp Program), are children under 18. The second and third largest programs, the National School Lunch Program and the Special Supplemental Nutrition Program for Women, Infants, and Children (WIC), focus primarily on children. Knowledge about the extent of food insecurity in households with children and the characteristics associated with food insecurity contrib-utes to the effective operation of these and other programs that support the well-being of children.

2Food Insecurity in Households with Children: Prevalence, Severity, and Household Characteristics / EIB-56
Economic Research Service/USDA
About the Data
Data for this study came from annual food security surveys sponsored by USDA and conducted by the U.S. Census Bureau from 1999 to 2007 as supplements to the monthly Current Population Survey (CPS). The surveys were of representative samples of the U.S. civilian population and included between 15,000 and 18,000 households with children each year. (However, about one-fourth of the sample in the 2007 survey was not used for food security estimates because a proposed wording change tested in those households did not perform adequately.) The survey is conducted both by telephone and in person so that households with no telephone are not underrepresented. The food security survey asked one adult respondent in each household a series of questions about experiences and behaviors that indicate food insecurity. The food security status of the household was assessed based on the number of food-insecure conditions reported (such as being unable to afford balanced meals or being hungry because there was too little money for food). The food security questions are presented in Appendix A. The food security status of children in the household was assessed by responses to a subset of questions about the conditions and experiences of children. Survey respondents also reported whether they had used various food and nutrition assistance programs.
Household characteristics (other than food security and receipt of food and nutrition assistance) were calculated from data collected in the labor force section of the CPS. The core CPS collects data on household composition and household income, along with demographic information for each household member and employment information for all persons ages 15 and older.
Weighting factors were calculated by the U.S. Census Bureau so that, when properly weighted, responses to the food security questions are representative at State and national levels. All statistics in this report were calculated by applying the appropriate weights to responses of the surveyed households to obtain nationally representative prevalence estimates.

3Food Insecurity in Households with Children: Prevalence, Severity, and Household Characteristics / EIB-56
Economic Research Service/USDA
Food Security and Insecurity:Concepts and 2007 National Statistics
Food insecurity—the lack of consistent access to adequate food—is an economic and social condition that may result in hunger (a physiological condition) if it is severe or prolonged. USDA differentiates food-insecure households by the severity of food insecurity they have experienced. Food insecurity in households with children is further differentiated by whether it affects only adults or also affects children and by the severity of food insecu-rity among the children.
In 2007, 84.2 percent of households with children were food secure throughout the year (fi g. 1). The remaining 6.2 million households (15.8 percent of households with children) were food insecure at some time during the year.
Parents are often able to maintain normal or near-normal diets and meal schedules for their children even when the parents themselves are food inse-cure. In about half of food-insecure households with children in 2007, only adults were food insecure. However, in about 3.3 million households (8.3 percent of households with children), children, too, were sometimes food insecure. The latter households are referred to in this report as those with food insecurity among children.
In about 323,000 households (0.8 percent of households with children), food insecurity among children was so severe that children’s regular meal patterns were disrupted and food intake was reduced to less than the amount that their caregivers considered adequate. These households are described in USDA reports as having very low food security among children.
Figure 1
Food security status of households with children, 2007
Either adults or children or both were food insecure at some time during the year in 15.8 percent of households with children. In 8.3 percent, children were food insecure (with either low or very low food security) at some time during the year.
Source: Calculated by Economic Research Service using data from the December 2007 Current Population Survey Food Security Supplement.
Food secure throughout the year: 84.2% (33.2 million households)
Food insecurity among adults only: 7.5% (3.0 million households)
Low food security among children: 7.5% (3.0 million households)
Very low food security among children: 0.8% (323,000 households)

4Food Insecurity in Households with Children: Prevalence, Severity, and Household Characteristics / EIB-56
Economic Research Service/USDA
Food-Insecure Households With Children: Levels of Food Insecurity
The severity of food access problems in each category of food insecurity can be gauged by the specifi c conditions reported by households in that category. The food security status of households with children is assessed by adult responses to a series of 18 questions about conditions and behaviors that typi-cally occur in households when they are having diffi culty meeting their food needs. (The questions are listed in Appendix A.) Households reporting three or more indications of food insecurity in response to any of the 18 questions are classifi ed as food insecure. In many of these households, only adults are food insecure.
The food security status of children is assessed by responses of an adult in the household to the eight questions about food-related conditions among children (questions 11-18 in Appendix A). Households that report two, three, or four conditions that indicate food insecurity among children are classifi ed as having low food security among children.1 Those reporting fi ve or more conditions are classifi ed as having very low food security among children. The more general condition, food insecurity among children, includes both categories.
Figure 2 depicts the percentage of households in each food-insecure category that reported each of the eight indicators of food insecurity among children in the 2006 and 2007 food security surveys. (Two years of data were combined to provide more stable and reliable estimates.)
Food Insecurity Among Adults Only
About one-third of households with food insecurity only among adults reported no indications of food insecurity among children. The remaining households in this category—almost two out of three—reported one indicator of food insecurity among children. (Two or more indications are required to classify the household as having food insecurity among children.) The large majority of those reporting one indicator reported the least severe one (i.e., that they had relied on a few kinds of low-cost foods to feed the children because they were running out of money to buy food).
Low Food Security Among Children
Households with low (but not very low) food insecurity among children mainly reported reductions in the quality and variety of children’s meals. Only a minority reported any reduction in the amount of food the children ate, and then usually only a single indication of reduced intake.
1 This specifi cation of the threshold for low food security among children (reports of two or more food-insecure indications) was adopted by USDA to be conceptually consistent with the corresponding threshold for adult/household food insecurity. For the adult and household scales, the thresh-old for food insecurity corresponds with the severity of not being able to afford balanced meals. For the child scale, the threshold corresponds with the severity of not being able to afford to feed chil-dren balanced meals. Low food security among children has been identifi ed in the Current Population Survey Food Security Supplement (CPS-FSS) data, beginning with the December 2006 data, although USDA has not previ-ously published statistics based on the category.

5Food Insecurity in Households with Children: Prevalence, Severity, and Household Characteristics / EIB-56
Economic Research Service/USDA
Very Low Food Security Among Children
Households with very low food security among children all reported multiple indications of reduced food intake. Almost 80 percent reported (along with four other indicators of food-insecure conditions among children) that at some time during the year a child had been hungry, but the household just could not afford more food. Those that did not report that a child had been hungry reported either that a child had skipped a meal or not eaten for a whole day because there was not enough money for food.
1See Appendix A for complete wording of the questions. Source: Calculated by Economic Research Service using Current Population Survey Food Security Supplement data.
Figure 2
Reported conditions in food-insecure households with children, by food security status, 2006-07 average1
0 20 40 60 80 100
Few kinds of low-cost foods for children
Could not feed children balanced meals
Child not eating enough
Cut size of child's meals
Child hungry
Child skipped meals
Child skipped meals in 3+ months
Child did not eat whole day
Any indication of children's food insecurity
Percent
Low or very low food security, adults only
Low food security among children
Very low food security among children
6Food Insecurity in Households with Children: Prevalence, Severity, and Household Characteristics / EIB-56
Economic Research Service/USDA
Food Insecurity and Childhood Hunger
Statistics on food insecurity among children provide important informa-tion about the social and economic context in which childhood hunger may occur, but do not directly indicate the extent of hunger. Although hunger is related to food insecurity, it is a different phenomenon. Food insecurity is a household-level economic and social condition of limited access to food, while hunger is an individual-level physiological condition that may result from food insecurity (National Research Council, 2006). Hunger is, thus, a potential—though not inevitable—outcome of food insecurity.
USDA’s nutrition assistance programs are intended, in part, to prevent or alleviate hunger. Specifi c information about the incidence of hunger would be of considerable interest and might be of value for policy and program design, but collection of precise and useful statistics about hunger is hampered by lack of a consistent meaning of the word and a validated method for measuring it. “Hunger” is understood to refer to conditions across a broad range of severity, from relatively mild food insecurity to “the uneasy or painful sensation caused by lack of food” (one dictionary defi nition of hunger) to prolonged clinical undernutrition (Nord et al., 2009; National Research Council, 2006).
Authoritative guidance on the defi nition and concept of hunger in offi cial statistics was provided by the Committee on National Statistics (CNSTAT) of the National Academies in 2006. An independent panel of experts convened by CNSTAT concluded that in offi cial statistics, resource-constrained hunger (i.e., physiological hunger resulting from food insecurity) “...should refer to a potential consequence of food insecurity that, because of prolonged, involuntary lack of food, results in discomfort, illness, weakness, or pain that goes beyond the usual uneasy sensation” (National Research Council, 2006, p. 48).
Validated methods have not yet been developed to measure the prevalence of resource-constrained hunger in this sense. Such measurement would require collection of more detailed and extensive information on physiological experiences of individual household members than is currently available in nationally representative survey data.

7Food Insecurity in Households with Children: Prevalence, Severity, and Household Characteristics / EIB-56
Economic Research Service/USDA
Associations Between Children’s Health and Development and Food Insecurity
A substantial, rapidly growing body of research has demonstrated associa-tions between children’s health, development, and well-being and measures of food security and food suffi ciency. Food suffi ciency—a condition closely related to food security—was assessed in several Federal surveys before the development of the food security measures, and the measure was used in much of the earlier research on outcomes of inadequate food access.2 Most of the associations that have been studied are with household-level food insecu-rity (or food insuffi ciency), not specifi cally with food insecurity among chil-dren. Causality is diffi cult to establish in these studies, almost all of which used cross-sectional data. But likely confounding conditions, such as income, age, race, and ethnicity, were generally controlled in the analyses, and the fi ndings are consistent with the hypothesis that food insecurity is a risk factor for the problematic outcomes studied.
Findings of 13 studies on child health and development outcomes associ-ated with food insecurity and food insuffi ciency are summarized in appendix table B-1. These studies found the following conditions to be more likely for children in food-insecure or food-insuffi ceint households than for children in otherwise similar food-secure households:
• Poorer health of children, as reported by parents
• More stomach aches, frequent headaches, and colds among children
• Higher hospitalization rates of young children
• Iron defi ciency anemia in young children
• Behavioral problems in 3-year-olds
• Lower physical function in children ages 3-8
• Poorer psychosocial function and psychosocial development in school-age children
• Higher rates of depressive disorder and suicidal symptoms in adolescents
• More anxiety and depression in school-age children
• Higher numbers of chronic health conditions in children
• More “internalizing” behavior problems in children
• Lower math achievement and other achievement gains in kindergarteners
• Lower math and reading gains from kindergarten to third grade
• Lower arithmetic scores and higher likelihood of repeating a grade for children ages 6-11
Findings with regard to food insecurity and children’s weight status are less clear. Most studies have found weak and inconsistent relationships between food insecurity and being overweight in U.S. children. Furthermore, the few statistically signifi cant fi ndings are not in agreement, and fi ndings differ by
2 Prior to the development of the food security measures, the National Health and Nutrition Examination Survey (NHANES) and the Continu-ing Study of Food Intake by Individu-als (CSFII) assessed the adequacy of households’ food access using a single question. Respondents were asked which of three statements best described the food eaten in their household:
“We always have enough to eat.”•
“Sometimes we don’t have enough • to eat.”
“Often we don’t have enough to • eat.”
Households were classifi ed as food suf-fi cient if they reported that they always had enough to eat and food insuffi cient if they reported that they sometimes or often did not have enough to eat.

8Food Insecurity in Households with Children: Prevalence, Severity, and Household Characteristics / EIB-56
Economic Research Service/USDA
age, sex, and race/ethnicity. For example, Bronte-Tinkew et al. (2007) found food insecurity to be positively associated with weight-for-length in children ages 9 to 24 months in the Early Childhood Longitudinal Study-Birth Cohort (ECLS-B), but Rose and Bodor (2006) found the opposite—that kinder-garten children in food-insecure households were less likely to be overweight than their food-secure counterparts in the Early Childhood Longitudinal Study-Kindergarten Cohort (ECLS-K). Increases in weight and BMI from kindergarten to third grade were found to be higher for girls (but not boys) in households with marginal food security or food insecurity (Jyoti et al., 2005). However, in the same ECLS-K sample with fi fth grade data included, Bhargava et al. (2008) found weak and nonsignfi cant negative associa-tions between weight gain and food insecurity. Whitaker and Orzol (2006) also found obesity to be negatively associated with food insecurity among preschool-age children in the Fragile Families and Child Well-Being survey, although the association was not statistically signifi cant. More research is needed to understand the reasons for these inconsistencies, but it seems unlikely that any large general associations exist.

9Food Insecurity in Households with Children: Prevalence, Severity, and Household Characteristics / EIB-56
Economic Research Service/USDA
Trends in Food Insecurity in Households with Children, 1999-2007
The prevalence of food insecurity in households with children increased beginning with the recession in 2001 (fi g. 3).3 It continued to increase in 2002-04 in spite of renewed economic growth and then declined to a level that remained about the same from 2005 to 2007. The pattern for food inse-curity among children was essentially identical to the pattern for all house-hold members.
The prevalence of very low food security among children remained essen-tially unchanged from 1999 to 2006, fl uctuating in the range of 0.5 to 0.7 percent. In 2007, this rate increased to 0.8 percent.
USDA gives particular attention to food insecurity in households with chil-dren with annual household incomes less than 185 percent of the Federal poverty line.4 School-age children in these households are likely to be eligible for free or reduced-price school meals. Most such households are also eligible for benefi ts from the Special Supplemental Nutrition Program for Women, Infants, and Children (WIC) if they include children under the age of 5 or pregnant women.
Prevalence rates of food insecurity for households with annual incomes less than 185 percent of the Federal poverty line were considerably higher—more than twice as high—as those for all households with children. Trends over the period 1999-2007 in low-income households were generally similar to those in all households with children, although changes were somewhat smaller proportionally (fi g. 4).
3 USDA statistics for 2000 also indicated a higher prevalence of food insecurity than in 1999. However, the 2000 survey was conducted in Septem-ber, and surveys conducted in August and September have consistently indi-cated higher prevalence rates than those conducted in April and December. After adjusting for the expected seasonal component, the rate in 2000 was near or below that in 1999.
4 The Federal poverty line for a family of two adults and two children in 2007 was an annual income of $21,027; 185 percent of the poverty line for that family was $38,900.
Source: Calculated by Economic Research Service using Current Population Survey Food Security Supplement data.
Figure 3
Trends in food insecurity of households with children, 1999-2007
0
5
10
15
20
1999 2000 2001 2002 2003 2004 2005 2006 2007
Percent of households
Food insecurity (adults or children)
Food insecurity among children (low or very low food security)
Very low food security among children

10Food Insecurity in Households with Children: Prevalence, Severity, and Household Characteristics / EIB-56
Economic Research Service/USDA
Source: Calculated by Economic Research Service using Current Population Survey Food Security Supplement data.
Figure 4
Trends in food insecurity of households with children with annual incomes less than 185 percent of the Federal poverty line, 1995-2007
Percent of households
Food insecurity among children (low or very low food security)
Food insecurity (adults or children)
Very low food security among children
0
5
10
15
20
25
30
35
40
1999 2000 2001 2002 2003 2004 2005 2006 2007

11Food Insecurity in Households with Children: Prevalence, Severity, and Household Characteristics / EIB-56
Economic Research Service/USDA
Food Insecurity Among Children inSelected Subpopulations, 2006-07 Average
The economic and demographic circumstances of households determine their food security to a great extent. In this section, the prevalence and distri-bution of food insecurity among children is described across nine sets of demographic, economic, and geographic characteristics that past research has found to be associated with food insecurity. Data for these analyses are from the December 2006 and December 2007 Current Population Survey Food Security Supplements. Data from 2 years were aggregated to provide more reliable estimates, especially for small subpopulations.
Three charts are presented for each set of household characteristics:
• A bar chart depicting, for households with each characteristic, the percentage that had food-insecure children and the percentage that had children with very low food security.
• A pie chart showing the distribution of households with food insecurity among children across the characteristics.
• A pie chart showing the distribution of households with very low food security among children across the characteristics.
The numbers on which the graphic presentations in this section are based are presented in appendix table C-1. That table also includes statistics (not presented in the graphics) for the broader category of food insecurity that includes food insecurity among adults as well as children.

12Food Insecurity in Households with Children: Prevalence, Severity, and Household Characteristics / EIB-56
Economic Research Service/USDA
Household Composition
Food insecurity among children was about three times as prevalent in house-holds headed by single women as in households headed by married couples and about twice as prevalent as in those headed by single men (fi g. 5). About half of all households with food insecurity among children and 54 percent of households with very low food security among children were headed by single women. In spite of the lower rate of food insecurity among children in married-couple households, those households were a sizable minority (42 percent) of households with food insecurity among children.
Source: Calculated by Economic Research Service using Current Population Survey Food Security Supplement data.
Figure 5
Prevalence and distribution of food insecurity among children by household composition, 2006-07 average
0 5 10 15 20Percent
Very low food security(children)
Low food security(children)
Prevalence and severity of food insecurity among children
Households with food insecurity among children
Households with very low food security among children
All households with children
Single-male-headed households
7%
Two-parent households
42%
Other households with children
2%
Single-male-headed households
7%
Two-parent households
38%
Other households with children
1%
Two-parent households
Single-female-headed households
Single-male-headed households
Other households with children
Single-female-headed households
54%
Single-female-headed households
49%
13Food Insecurity in Households with Children: Prevalence, Severity, and Household Characteristics / EIB-56
Economic Research Service/USDA
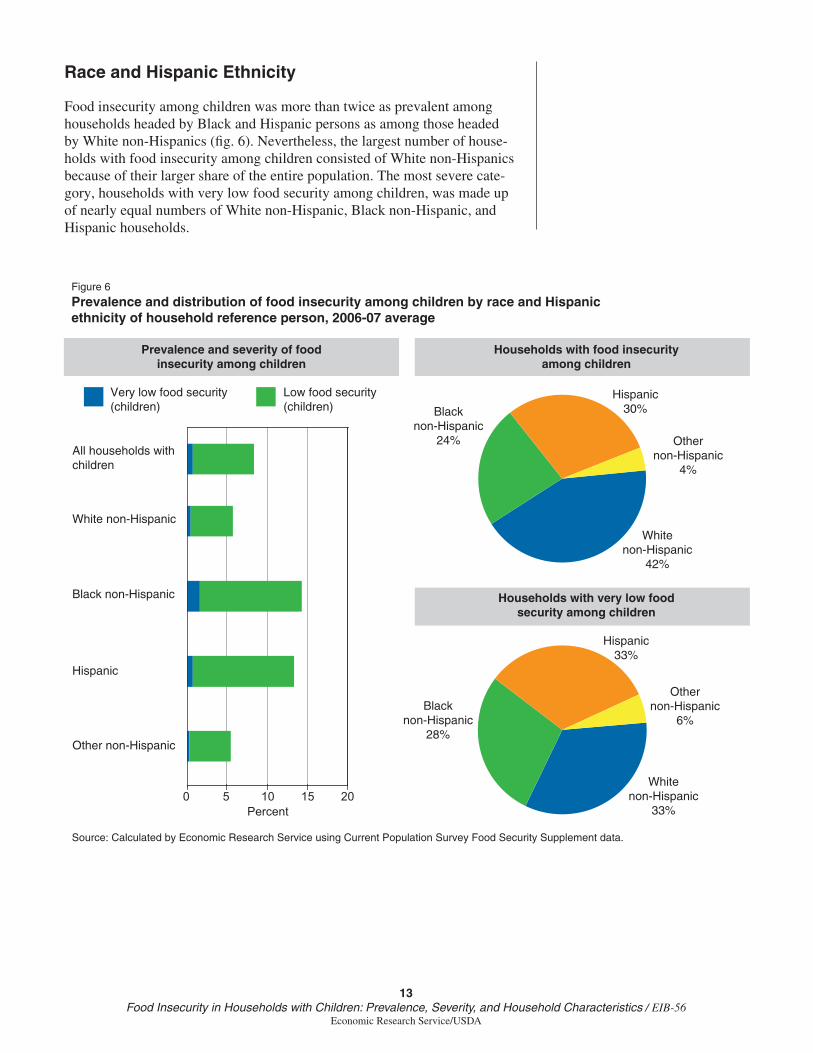
Race and Hispanic Ethnicity
Food insecurity among children was more than twice as prevalent among households headed by Black and Hispanic persons as among those headed by White non-Hispanics (fi g. 6). Nevertheless, the largest number of house-holds with food insecurity among children consisted of White non-Hispanics because of their larger share of the entire population. The most severe cate-gory, households with very low food security among children, was made up of nearly equal numbers of White non-Hispanic, Black non-Hispanic, and Hispanic households.
Source: Calculated by Economic Research Service using Current Population Survey Food Security Supplement data.
Figure 6
Prevalence and distribution of food insecurity among children by race and Hispanic ethnicity of household reference person, 2006-07 average
0 5 10 15 20Percent
Very low food security(children)
Low food security(children)
Prevalence and severity of food insecurity among children
Households with food insecurity among children
Households with very low food security among children
All households with children
White non-Hispanic
Black non-Hispanic
Hispanic
Other non-Hispanic
Black non-Hispanic
24%
Whitenon-Hispanic
42%
Othernon-Hispanic
4%
Hispanic30%
Black non-Hispanic
28%
Whitenon-Hispanic
33%
Othernon-Hispanic
6%
Hispanic33%

14Food Insecurity in Households with Children: Prevalence, Severity, and Household Characteristics / EIB-56
Economic Research Service/USDA
Household Income
About one-quarter of households with annual incomes below the Federal poverty line had food insecurity among children (fi g. 7). They made up 42 percent of all households with food insecurity among children and 44 percent of households with very low food security among children.
The Federal food and nutrition assistance programs may not reach some households with food insecurity among children. Between 37 and 48 percent of households with food insecurity among children (the exact percentage depending on the income of those that did not report income) had annual incomes higher than 130 percent of the poverty line—the income eligibility limit for the Supplemental Nutrition Assistance Program (SNAP; formerly the Food Stamp Program) and for free school meals. Some of these house-holds may have been eligible for those programs because income eligibility is determined by monthly rather than annual income. Nevertheless, it is likely that a large share were not eligible. Between 21 and 32 percent may have been ineligible for WIC or for reduced-price school lunches because their incomes were above 185 percent of the poverty line.
Source: Calculated by Economic Research Service using Current Population Survey Food Security Supplement data.
Figure 7
Prevalence and distribution of food insecurity among children by annual household income, 2006-07 average
Percent
Very low food security(children)
Annual household income
Low food security(children)
Prevalence and severity of food insecurity among children
Households with food insecurity among children
Households with very low food security among children
All households with children
Below poverty line
100-130 percent of poverty line
130-185 percent of poverty line
Above 185 percent of poverty line
Income not reported
0 10 20 30
Above 185 percent of poverty line
21%
100 to 130 percent of poverty line
10%
130 to 185 percent of poverty line
16%
Below poverty line
42%
Income not reported
11%
Above 185 percent of poverty line
16%
100 to 130 percent of poverty line
11%
130 to 185 percent of poverty line
16%
Below poverty line
44%
Income not reported
13%

15Food Insecurity in Households with Children: Prevalence, Severity, and Household Characteristics / EIB-56
Economic Research Service/USDA
Residence Relative to Metropolitan Statistical Areas
Food insecurity among children was somewhat more prevalent in the large cities of Metropolitan Statistical Areas (MSAs) and in nonmetropolitan (largely rural) areas than in the suburban and exurban commuting areas around large cities (fi g. 8).5 About 18 percent of households with food-insecure children were located in nonmetropolitan areas. The remainder were distributed about evenly between large cities of MSAs and the suburban and outlying commuting areas around MSAs. Very low food security among chil-dren was more heavily concentrated in the large cities of MSAs.
5 The food security survey identifi es Metropolitan Statistical Areas (MSAs) and principal cities within them in accordance with standards delineated by the Offi ce of Management and Budget in 2003, based on revised standards developed by the U.S. Census Bureau in collaboration with other Federal agencies. Principal cities include the incorporated areas of the largest city in each MSA and other cities in the MSA that meet specifi ed criteria based on population size and commuting patterns.
Source: Calculated by Economic Research Service using Current Population Survey Food Security Supplement data.
Figure 8
Prevalence and distribution of food insecurity among children by residence relative to Metropolitan Statistical Areas (MSA), 2006-07 average
Percent
Very low food security(children)
Low food security(children)
Prevalence and severity of food insecurity among children
Households with food insecurity among children
Households with very low food security among children
All households with children
In principal city of MSA
In suburbs or outlying areas of of MSA
In MSA, specific location not identified
Not in MSA (i.e., nonmetropolitan)
In principal city of MSA
34%
Not in MSA (i.e., nonmetropolitan)
18%
In MSA, specific location not identified
13%
In suburbs or outlying areas of MSA
35%
0 5 10 15
In principal city of MSA
43%
Not in MSA (i.e., nonmetropolitan)
13%
In MSA, specific location not identified
15%
In suburbs or outlying areas of MSA
29%

16Food Insecurity in Households with Children: Prevalence, Severity, and Household Characteristics / EIB-56
Economic Research Service/USDA
Residence by Census Region
The prevalence of food insecurity in households with children was some-what higher in the South Census Region than in the other regions (fi g. 9). The prevalence of very low food security was higher in the West than in the Midwest. Other differences among regions were in a range that could have resulted from sampling variation.
Source: Calculated by Economic Research Service using Current Population Survey Food Security Supplement data.
Figure 9
Prevalence and distribution of food insecurity among children by Census Region, 2006-07 average
Percent
Very low food security(children)
Low food security(children)
Prevalence and severity of food insecurity among children
Households with food insecurity among children
Households with very low food security among children
West23%
Northeast17%
Midwest19%
South41%
All households with children
0 2 4 6 8 10
Northeast
Midwest
South
West
West30%
Northeast17%
Midwest18%
South35%

17Food Insecurity in Households with Children: Prevalence, Severity, and Household Characteristics / EIB-56
Economic Research Service/USDA
Employment and Labor Force Statusof Adults in the Household
More than two-thirds of households with food insecurity among children had one or more full-time workers, and another 10 percent had one or more part-time workers (fi g. 10). Rates of food insecurity among children were much higher for households with unemployed or disabled adults (and with none employed) than for those with employed adults. Together, the unemployed and disabled categories made up 15 percent of households with food insecu-rity among children and 23 percent of households with very low food secu-rity among children. Both employment opportunities and wage rates for less skilled workers appear to be important determinants of children’s food secu-rity. Of all households with food-insecure children that had a nondisabled adult, only 7 percent had no adult in the labor force (that is, either employed or unemployed and looking for work).
Source: Calculated by Economic Research Service using Current Population Survey Food Security Supplement data.
Figure 10
Prevalence and distribution of food insecurity among children by employment and labor force status of adults in the household, 2006-07 average
Prevalence and severity of food insecurity among children
Households with food insecurity among children
Households with very low food security among children
Percent
Very low food security(children)
Adult employment
Low food security(children)
All households with children
One or more employed full-time
Part-time, no full-time
Unemployed looking for work, none employed
Disabled, none in the labor force
None in labor force, none disabled
0 10 20 30 40
One or more employed full-time
68%
Part-time, no full-time10%
Unemployed looking for work, none employed
7%
Disabled, none in the labor force
8%
None in labor force, none disabled
7%
One or more employed full-time
61%
Part-time, no full-time8%
Unemployed looking for work, none employed
13%
Disabled, none in the labor force
10%
None in labor force, none disabled
8%

18Food Insecurity in Households with Children: Prevalence, Severity, and Household Characteristics / EIB-56
Economic Research Service/USDA
Educational Attainment of Adults in the Household
The percentage of households with food insecurity among children is strongly associated with the education of adults in the households (fi g. 11). Food insecurity was 10 times more prevalent in households in which no adult had completed high school (22 percent) than in households in which an adult had a 4-year college degree (2.3 percent). In 55 percent of households with food insecurity among children and 59 percent of those with very low food security among children, no adult had any education beyond high school.
Source: Calculated by Economic Research Service using Current Population Survey Food Security Supplement data.
Figure 11
Prevalence and distribution of food insecurity among children by educational attainment of most educated adult in the household, 2006-07 average
Prevalence and severity of food insecurity among children
Households with food insecurity among children
Households with very low food security among children
Percent
Very low food security(children)
Most educated adult
Low food security(children)
All households with children
Less than high school
Completed high school (or GED)
Some college (including 2-year degree)
Four-year degree or higher
0 5 10 15 20 25
Less than high school
21%
Completed high school (or GED)
34%
Some college (including
2-year degree)35%
Four-year degree or higher
10%
Less than high school
24%
Completed high school (or GED)
35%
Some college (including
2-year degree)31%
Four-year degree or higher
10%

19Food Insecurity in Households with Children: Prevalence, Severity, and Household Characteristics / EIB-56
Economic Research Service/USDA
Age of Oldest Child
Most parents attempt to shield their children from the more severe effects of food insecurity, even when it means reducing their own food intake. Only about one out of six households with very low food security among adults had very low food security among children (analysis not shown).
Younger children are shielded from food insecurity to a greater extent than older children. The food security survey does not collect information on the food security of each individual child in the household, but the associa-tion of the age of the oldest child with food insecurity in any of the children is evidence of the greater protection afforded to younger children (fi g. 12). Food insecurity among children was about twice as prevalent in households with teenage children as in households in which the oldest child was 4 years old or younger. Very low food security among children was about four times as prevalent in households with teenage children as in households in which the oldest child was 8 years old or younger. Multivariate analysis (not shown) confi rms that this association is largely independent of the number of children in the household and the greater food needs of older children.
Source: Calculated by Economic Research Service using Current Population Survey Food Security Supplement data.
Figure 12
Prevalence and distribution of food insecurity among children by age of oldest child in the household, 2006-07 average
Prevalence and severity of food insecurity among children
Households with food insecurity among children
Households with very low food security among children
Percent
Very low food security(children)
Age of oldest child
Low food security(children)
All households with children
0-4 years
5-8 years
9-12 years
13-15 years
16-17 years
0-4 years12%
5-8 years17%
9-12 years23%
13-15 years26%
16-17 years22%
0 5 10 150-4 years
9%
5-8 years6%
9-12 years22%
13-15 years33%
16-17 years30%

20Food Insecurity in Households with Children: Prevalence, Severity, and Household Characteristics / EIB-56
Economic Research Service/USDA
Number of Children in the Household
Food insecurity among children was more prevalent in larger families, espe-cially in those with three or more children (fi g. 13). The prevalence of very low food security among children was higher in households with one child or with three or more children than in households with two children.
Source: Calculated by Economic Research Service using Current Population Survey Food Security Supplement data.
Figure 13
Prevalence and distribution of food insecurity among children by number of children in the household, 2006-07 average
Prevalence and severity of food insecurity among children
Households with food insecurity among children
Households with very low food security among children
Percent
Very low food security(children)
Low food security(children)
All households with children
1 child
2 children
3 or more children
1 child35%
2 children35%
3 or more children
30%
0 5 10 15
1 child49%
2 children21%3 or more
children30%

21Food Insecurity in Households with Children: Prevalence, Severity, and Household Characteristics / EIB-56
Economic Research Service/USDA
Food and Nutrition Assistance Program Participation and Children’s Food Insecurity, 2006-07 Average
A large majority of food-insecure households with children received assis-tance from one or more of the three largest Federal food and nutrition assis-tance programs: the Supplemental Nutrition Assistance Program (SNAP), formerly called the Food Stamp Program, the National School Lunch Program, and the Special Supplemental Nutrition Assistance Program for Women, Infants, and Children (WIC). Table 1 and fi gure 14 show the preva-lence rates of overall food insecurity and food insecurity among children for low-income households participating in these programs.6
A 30-day measure of food insecurity (covering mid-November to mid-December) is used for these statistics rather than the standard 12-month measure, so that the period over which food security is assessed is more likely to match the period during which program benefi ts were received or not received. The prevalence of food insecurity is lower when assessed over a 30-day period, since some households were food insecure only in earlier months of the year. The prevalence of food insecurity in households with children and with incomes less than 185 percent of the Federal poverty line was 19.6 percent during the 30 days prior to the food security surveys in 2006 and 2007, compared with 35.0 percent that were food insecure at some time during the year (calculated from appendix table C-1). For food insecu-rity among children, the 30-day prevalence was 11.2 percent of households compared with 19.4 percent when assessed over 12 months.
Eighty-one percent of low-income households with food insecurity among children received assistance from one or more of the three largest Federal food assistance programs. About 69 percent received free or reduced-price school meals, including 35 percent that also received benefi ts from SNAP or WIC or both. Many households in this income range were not eligible for all of these programs, and some were not eligible for any of them. About one-third had annual incomes higher than 130 percent of the poverty line (the gross income eligibility limit for SNAP); most of those were income-ineli-gible for SNAP. Households with no children in school were not eligible for free or reduced-price school lunches, and those with no children under age 5 were not eligible for WIC unless a woman in the household was pregnant.
Households that did not receive assistance from any of these programs were generally more food secure then those that did. The prevalence of food inse-curity was lower (10.7 percent) for nonparticipating households than for any of the recipient categories. This probably refl ects the self-selection of the most food-needy households into the programs.
6 Statistics on very low food se-curity among children are not presented by program participation categories due to inadequate sample sizes in some categories. Numbers of households are not reported because about 16 percent of households with children do not report income. Most such households are not asked about participation in food and nutrition assistance programs. The omission of those households would result in understating the numbers of households in the various participation categories. Participation in food and nutrition assistance programs is also underreported in the CPS-FSS, which would further distort estimated numbers of participants.

22Food Insecurity in Households with Children: Prevalence, Severity, and Household Characteristics / EIB-56
Economic Research Service/USDA
Table 1
Prevalence and distribution of food insecurity during the 30-day period ending in mid-December in low-income1 households with children, by receipt of benefi ts from Federal food assistance programs, 2006-07 average
Characteristic
Households with food insecurity among
adults or children
Households with food insecurity among children
(low or very low food security among children)
Prevalence2 Share3 Prevalence4 Share5
Percent
All low-income households with children1 19.6 100.0 11.2 100.0
Received SNAP (food stamps) in past 30 days 28.5 39.3 15.6 37.9
Received free or reduced-price school lunch in past 30 days 25.5 64.6 15.4 68.8
Received WIC in past 30 days 22.9 23.5 10.6 19.0
Multiple-program patterns:
Received SNAP (food stamps) and free or reduced-price school lunch and WIC 25.1 6.1 13.8 5.9
Received SNAP (food stamps) and free or reduced- price school lunch 31.6 22.7 19.2 24.3
Received SNAP (food stamps) and WIC 22.8 4.6 5.4 1.9
Received SNAP (food stamps) only 26.8 5.4 15.2 5.4
Received free or reduced-price school lunch and WIC 25.9 5.9 12.7 5.1
Received free or reduced-price school lunch only 22.1 28.8 14.1 32.4
Received WIC only 19.3 6.7 10.1 6.1
Received benefi ts from one or more of these programs 24.6 80.1 14.3 81.0
Did not receive benefi ts from any of these programs 10.7 19.8 5.8 19.0
1 Analysis was limited to households with children and with annual incomes less than 185 percent of the Federal poverty line. Most house-holds with incomes above that range were not asked whether they received benefi ts from food assistance programs. In 2007, the poverty line for a family of two adults and two children was an annual income of $21,027. 2 Households with food insecurity among adults or children as a percentage of all households with the specifi ed characteristic. 3 Households with the specifi ed characteristic and with food insecurity among adults or children as a percentage of all households with food insecurity among adults or children.4 Households with food insecurity among children as a percentage of all households with the specifi ed characteristic. 5 Households with the specifi ed characteristic and with food insecurity among children as a percentage of all households with food insecurity among children.
Source: Calculated by Economic Research Service using Current Population Survey Food Security Supplement data.

23Food Insecurity in Households with Children: Prevalence, Severity, and Household Characteristics / EIB-56
Economic Research Service/USDA
1Households with annual incomes less than 185 percent of the Federal poverty line. (In 2007, the poverty line for a family of two adults and two children was an annual income of $21,027.)
Source: Calculated by Economic Research Service using Current Population Survey Food Security Supplement data.
Figure 14
Prevalence and distribution of food insecurity among children in low-income1 households during the 30-day period prior to the food security survey, by participation in selected Federal food and nutrition assistance programs, 2006-07 average
Percentage of low-income households with children in which children were food-insecure
Low-income households with food insecurity
Percent
All low-income households with children
SNAP (food stamps; with or without other programs)
WIC (with or without other programs)
Multiple-program patterns:
SNAP and free or reduced-price school lunch, and WIC
SNAP and free or reduced- price school lunch
Free or reduced-price school lunch and WIC
Free or reduced-price school lunch only
SNAP and WIC
SNAP only
WIC only
None of these programs
Free or reduced-price school lunch (with or without other programs)
Free or reduced-price school lunch
and WIC5%
SNAP only5%
WIC only6%
None of these programs
19%
SNAP and free or reduced-price school
lunch, and WIC6%
SNAP and free or reduced-price school
lunch24%
SNAP and WIC2%
0 5 10 15 20
Free or reduced-price school lunch only
33%

24Food Insecurity in Households with Children: Prevalence, Severity, and Household Characteristics / EIB-56
Economic Research Service/USDA
Some households leave SNAP because their economic situation has improved enough for them to cover their food needs without assistance. However, for many SNAP recipients who exit the program, that does not seem to be the case. Households with children that received SNAP earlier in the year, but not in the 30 days prior to the food security survey, were more likely to be food insecure during that 30-day period (35.5 percent; table 2) than those still receiving benefi ts (28.5 percent), and much more likely to be food insecure than low-income households that did not receive SNAP benefi ts at any time during the year (17.6 percent).
Table 2
Prevalence and distribution of food insecurity during the 30-day period ending in mid-December in households with children with annual incomes less than 130 percent of the Federal poverty line,1 by receipt of SNAP (food stamp) benefi ts, 2006-07 average
Characteristic
Households with food insecurity among
adults or children
Households with food insecurity among children
(low or very low food security among children)
Prevalence2 Share3 Prevalence4 Share5
Percent
Received SNAP (food stamps) in past 30 days 28.5 47.0 16.1 45.5
Received SNAP (food stamps) in past 12 months, but not during past 30 days
35.5 12.4 19.6 11.7
Did not receive SNAP (food stamps) at any time in past 12 months
17.6 40.7 10.8 42.8
1 In 2007, the poverty line for a family of two adults and two children was an annual income of $21,027. 2 Households with food insecurity among adults or children as a percentage of all households with the specifi ed characteristic. 3 Households with the specifi ed characteristic and with food insecurity among adults or children as a percentage of all households with food insecurity among adults or children.4 Households with food insecurity among children as a percentage of all households with the specifi ed characteristic. 5 Households with the specifi ed characteristic and with food insecurity among children as a percentage of all households with food insecurity among children.
Source: Calculated by Economic Research Service using Current Population Survey Food Security Supplement data.

25Food Insecurity in Households with Children: Prevalence, Severity, and Household Characteristics / EIB-56
Economic Research Service/USDA
Food Insecurity in Households with Children by State, 2001-2007 Average
Data from nine national surveys (April 2001 and December of each year 2001-07) were combined to provide suffi cient sample sizes (numbers of households interviewed) for reliable State-level estimates (table 3 and fi g. 15). The long time period for these State-level statistics should be kept in mind when interpreting the statistics, as conditions in some States may have changed during the period. Even with data from nine surveys, the prevalence of very low food security among children could not be estimated reliably for some States and is not reported in table 3.7
The prevalence of food insecurity (among adults or children or both) in households with children ranged from 10.1 percent in New Hampshire to 21.5 percent in Texas. Taking into account margins of error due to sampling variation, the prevalence of food insecurity in households with children was below the national average (16.2 percent) in 19 States, above the national average in 13 States and the District of Columbia, and near the national average (i.e., the difference from the national average was not statistically signifi cant) in 18 States. The percentage of households with food insecurity among children ranged from 4.8 percent in New Hampshire to 12.6 percent in Texas.
7 In spite of sizable denomina-tors (all households with children interviewed) in all States, the number of interviewed households with very low food security among children was less than 10 in several States and as few as 3 in some. Estimates based on such small numerators are unreliable because an error in measurement, or the chance selection or omission of a single household in the sample, could change the estimate by a large proportion.

26Food Insecurity in Households with Children: Prevalence, Severity, and Household Characteristics / EIB-56
Economic Research Service/USDA
Table 3Prevalence of food insecurity in households with children by State, 2001-07 average1
StateNumber of households
Households with food insecurity among adults or children (low or
very low food security)
Households with food insecurity among children (low or very low food security among children)
Average 2001-07 Interviewed Prevalence Margin of error2 Prevalence Margin of error2
Number Number Percent Percentage points Percent Percentage points
U.S. total 39,241,000 122,324 16.2 0.22 8.7 0.10AK 95,000 1,890 15.1 1.48 7.4* 0.89AL 617,000 1,610 17.6 1.61 8.5 1.26AR 377,000 1,440 20.8* 2.03 11.2* 1.50AZ 775,000 1,736 18.7* 1.76 9.7 1.21CA 4,868,000 9,287 17.1* 0.80 10.4* 0.62CO 626,000 2,579 14.5* 1.44 8.0 1.06CT 471,000 2,329 11.9* 1.28 6.8* 1.02DC 55,000 969 19.9* 2.13 9.0 1.80DE 112,000 1,655 11.6* 1.47 6.3* 0.96FL 2,065,000 4,432 16.5 1.00 9.3 0.82GA 1,222,000 2,166 18.3* 1.64 9.2 1.25HI 158,000 1,638 13.2* 1.52 6.9* 1.10IA 381,000 2,219 15.9 1.34 7.5* 0.89ID 197,000 1,675 20.1* 2.02 9.7 1.43IL 1,708,000 4,105 13.0* 1.09 7.0* 0.61IN 840,000 2,226 13.0* 1.45 6.2* 1.02KS 367,000 2,068 16.9 1.28 8.8 1.01KY 562,000 1,731 17.8 1.93 8.0 1.11LA 627,000 1,277 17.0 1.48 9.1 1.11MA 809,000 2,007 10.8* 1.19 6.4* 0.91MD 751,000 2,373 11.4* 1.14 6.5* 0.98ME 161,000 2,090 16.0 1.70 7.7* 0.96MI 1,376,000 3,268 15.3 1.51 7.6* 0.87MN 674,000 2,617 11.3* 1.26 5.7* 0.78MO 777,000 2,068 16.1 1.48 8.3 1.18MS 415,000 1,282 20.5* 2.21 11.3* 1.75MT 114,000 1,258 17.9 2.08 8.4 1.28NC 1,125,000 2,471 18.6* 1.85 10.0* 1.22ND 82,000 1,754 10.4* 1.46 5.3* 0.91NE 237,000 2,001 14.8 1.51 7.3* 0.88NH 172,000 2,351 10.1* 1.16 4.8* 0.62NJ 1,182,000 2,790 12.5* 1.21 6.9* 0.95NM 265,000 1,373 20.9* 2.06 12.4* 1.76NV 310,000 2,200 15.1 1.82 8.6 1.12NY 2,511,000 5,336 14.8* 0.97 8.0* 0.54OH 1,545,000 3,713 17.4 1.40 8.2 0.83OK 474,000 1,632 20.0* 1.41 10.5* 1.11OR 454,000 1,726 18.7* 1.66 9.5 0.99PA 1,533,000 3,917 14.7* 1.04 7.2* 0.78RI 138,000 1,988 14.1* 1.79 7.3* 1.26SC 552,000 1,562 17.6 1.61 9.2 1.25SD 100,000 1,961 13.5* 1.59 6.7* 0.99TN 813,000 1,589 18.6* 1.99 8.9 1.36TX 3,269,000 6,123 21.5* 1.40 12.6* 1.09UT 351,000 1,932 18.6* 1.55 9.7 1.25VA 988,000 2,237 11.9* 1.49 6.2* 0.87VT 84,000 1,741 14.2* 2.01 6.4* 1.12WA 829,000 2,213 16.4 1.37 8.5 0.89WI 734,000 2,501 13.2* 1.11 7.1* 0.94WV 224,000 1,511 14.5 1.78 6.5* 1.61WY 69,000 1,707 15.6 1.78 9.0 1.16*Difference from U.S. average was statistically signifi cant with 90-percent confi dence (t > 1.645).1Estimation sample included two surveys in 2001, conducted in April and December. Totals exclude households whose food security status is unknown because they did not give a valid response to any of the questions in the food security scale. These represented about 0.3 percent of all households in each year.2Margin of error with 90-percent confi dence (1.645 times the standard error of the estimated prevalence rate).
Source: Calculated by Economic Research Service using Current Population Survey Food Security Supplement data.

27Food Insecurity in Households with Children: Prevalence, Severity, and Household Characteristics / EIB-56
Economic Research Service/USDA
Source: Calculated by Economic Research Service using Current Population Survey Food Security Supplement data.
Figure 15
Prevalence of food insecurity (adults or children) in households with children, 2001-07 average
Food insecurity below U.S. average
Food insecurity near U.S. average
Food insecurity above U.S. average

28Food Insecurity in Households with Children: Prevalence, Severity, and Household Characteristics / EIB-56
Economic Research Service/USDA
Conclusions
In 2007, 15.8 percent of households with children were food insecure at some time during the year. In about half of those households, only adults were food insecure; in the other half, children were also food insecure. In 0.8 percent of households with children, one or more of the children experienced very low food security. In households with very low food insecurity among children—the most severe food-insecure condition measured by USDA—children’s eating patterns were disrupted and their food intake was reduced below levels considered adequate by caregivers.
A range of studies using different data sources suggests that children living in food-insecure households face elevated risks of problematic health and development outcomes, compared with children in otherwise similar food-secure households.
Findings from this study suggest that job opportunities, wage rates, and work supports (such as earned-income tax credits, child care subsidies, and supplemental nutrition assistance available to working households) are likely to be key determinants of food insecurity in low-income households with children. A large majority of households with food-insecure children—about 85 percent—have one or more adults in the labor force, including almost 70 percent with at least one full-time worker. However, fewer than half of households with food-insecure children include an adult with any educa-tion beyond high school, and only 10 percent include an adult with a 4-year college degree. Thus, employment opportunities and wage rates for less skilled or less educated workers are particularly important factors affecting the food security of children. Work supports and support for education and training may also be important. Income and nutrition supports for workers between jobs could also contribute to food security, as evidenced by the high rate of children’s food insecurity in households with unemployed adults.
In 2006-07, the Federal food and nutrition assistance programs provided benefi ts to four out of fi ve low-income (less than 185 percent of the poverty line) food-insecure households with children. Children in about 70 percent of such households received free or reduced-price school meals, about 40 percent of the households received SNAP (food stamp) benefi ts, and about 20 percent received WIC benefi ts. Many households received assistance from two or all three of the programs, although one-third reported receiving only free or reduced-price school meals. Low-income households that did not receive assistance from any of the programs were less likely to be food insecure (11 percent) than those that did receive assistance (19 to 32 percent, depending on the mix of programs). This difference suggests that program-related factors, such as a lack of program outreach, are not the primary reasons for nonparticipation by eligible households; rather, a large majority of nonparticipants are able to meet their food needs without assistance.
About one in fi ve households with food insecurity among children had annual incomes above 185 percent of the poverty line. Many households with annual incomes in this range may not be eligible to receive free or reduced-price school lunches or assistance from the WIC program, and most are prob-ably not eligible to receive SNAP benefi ts.

29Food Insecurity in Households with Children: Prevalence, Severity, and Household Characteristics / EIB-56
Economic Research Service/USDA
Food insecurity among children was more likely in households that had left SNAP during the previous year than for those currently receiving benefi ts. This suggests that some households leave the program even though their economic resources are not yet adequate to meet their food needs.

30Food Insecurity in Households with Children: Prevalence, Severity, and Household Characteristics / EIB-56
Economic Research Service/USDA
References
Alaimo, Katherine, Christine Olsen, and Edward A. Frongillo. 2002. “Family Food Insuffi ciency, but Not Low Family Income, Is Positively Associated with Dysthymia and Suicide Symptoms in Adolescents,” Journal of Nutrition 132:719-25.
Alaimo, Katherine, Christine M. Olsen, and Edward A. Frongillo Jr. 2001a. “Food Insuffi ciency and American School-Aged Children’s Cognitive, Academic, and Psychosocial Development,” Pediatrics 108(1):44-53.
Alaimo, K., C.M. Olson, E.A. Frongillo Jr., and R.R. Breifel. 2001b. “Food Insuffi ciency, Family Income, and Health in U.S. Preschool and School-Aged Children,” American Journal of Public Health 91(5):781-86.
Alaimo, Katherine, Christine M. Olsen, and Edward A. Frongillo Jr. 2001c. “Low Family Income and Food Insuffi ciency in Relation to Overweight in Children: Is There a Paradox?” Archives of Pediatrics and Adolescent Medicine 155(10):1161-67.
Bhargava, Alok, Dean Jolliffe, and Larry L. Howard. 2008. “Socio-economic, behavioural and environmental factors predicted body weights and household food insecurity scores in the Early Childhood Longitudinal Study—Kindergarten,” British Journal of Nutrition 100(2):438-44.
Bronte-Tinkew, Jacinta, Martha Zaslow, Randolph Capps, Allison Horowitz, and Michelle McNamara. 2007. “Food Insecurity Works through Depression, Parenting, and Infant Feeding to Infl uence Overweight and Health in Toddlers,” Journal of Nutrition 137:2160-65.
Casey, Patrick H., Kitty L. Szeto, James M. Robbins, Janice E. Stuff, Carol Connell, Jeffrey Gossett, and Pippa M. Simpson. 2005. “Child Health-Related Quality of Life and Household Food Security,” Archives of Pediatric and Adolescent Medicine 159:51-56.
Cook, John T., Deborah A. Frank, Carol Berkowitz, Maureen M. Black, Patrick H. Casey, Diana B. Cutts, Alan F. Meyers, Nieves Zaldivar, Anne Skalicky, Suzette Levenson, Tim Heeren, and Mark Nord. 2004. “Food Insecurity Is Associated with Adverse Health Outcomes among Human Infants and Toddlers,” Journal of Nutrition 134:1432-38.
Jyoti, Diana F., Edward A. Frongillo, and Sonya J. Jones. 2005. “Food Insecurity Affects School Children’s Academic Performance, Weight Gain, and Social Skills,” Journal of Nutrition 135:2831-39.
Kleinman, Ronald E., J. Michael Murphy, Michelle Little, Maria Pagano, Cheryl A. Wehler, Kenneth Regal, and Michael S. Jellinek. 1998. “Hunger in Children in the United States: Potential Behavioral and Emotional Correlates,” Pediatrics 101(1):e3.
National Research Council. 2006. Food Insecurity and Hunger in the United States: An Assessment of the Measure. Committee on National Statistics, Panel to Review the U.S. Department of Agriculture’s Measurement

31Food Insecurity in Households with Children: Prevalence, Severity, and Household Characteristics / EIB-56
Economic Research Service/USDA
of Food Insecurity and Hunger, Gooloo S. Wunderlich and Janet L. Norwood (eds.). Washington, DC: The National Academies Press.
Nord, Mark, Margaret Andrews, and Steven Carlson. 2008. Household Food Security in the United States, 2007. ERR-66, U.S. Dept. of Agriculture, Economic Research Service. Available at: www.ers.usda.gov/publications/err66
Nord, Mark, Max Finberg, and James McLaughlin. 2009. “What Should the Government Mean by Hunger?” Journal of Hunger and Environmental Nutrition 4:1-28.
Rose, Donald, and J. Nicholas Bodor. 2006. “Household Food Insecurity and Overweight Status in Young School Children: Results from the Early Childhood Longitudinal Study,” Pediatrics 117:464-73.
Skalicky, Anne, Alan F. Meyers, William G. Adams, Zhaoyan Yang, John T. Cook, and Deborah A. Frank. 2006. “Child Food Insecurity and Iron Defi ciency Anemia in Low-Income Infants and Toddlers in the United States,” Maternal and Child Health Journal 10(2).
Weinreb, Linda, Cheryl Wehler, Jennifer Perloff, Richard Scott, David Hosmer, Linda Sagor, and Craig Gundersen. 2002. “Hunger: Its Impact on Children’s Health and Mental Health,” Pediatrics 110:e41; DOI: 10.1542/peds.110.4.e41.
Whitaker, Robert C., and Sean M. Orzol. 2006. “Obesity Among U.S. Urban Preschool Children: Relationships to Race, Ethnicity, and Socioeconomic Status,” Archives of Pediatric and Adolescent Medicine 160:578-84.
Whitaker, Robert C., Shannon M. Phillips, and Sean M. Orzol. 2006. “Food Insecurity and the Risks of Depression and Anxiety in Mothers and Behavioral Problems in the Preschool-Aged Children,” Pediatrics 118(3):859-68.
Winicki, Joshua, and Kyle Jemison. “Food Insecurity and Hunger in the Kindergarten Classroom: Its Effect on Learning and Growth,” Contemporary Economic Policy 21(2):145-57.

32Food Insecurity in Households with Children: Prevalence, Severity, and Household Characteristics / EIB-56
Economic Research Service/USDA
Appendix A. Questions used to assess the food security of households in USDA’s annual food security survey
“We worried whether our food would run out before we got money to 1. buy more.” Was that often, sometimes, or never true for you in the last 12 months?
“The food that we bought just didn’t last and we didn’t have money to 2. get more.” Was that often, sometimes, or never true for you in the last 12 months?
“We couldn’t afford to eat balanced meals.” Was that often, sometimes, 3. or never true for you in the last 12 months?
In the last 12 months, did you or other adults in the household ever cut 4. the size of your meals or skip meals because there wasn’t enough money for food? (Yes/No)
(If yes to Question 4) How often did this happen—almost every month, 5. some months but not every month, or in only 1 or 2 months?
In the last 12 months, did you ever eat less than you felt you should 6. because there wasn’t enough money for food? (Yes/No)
In the last 12 months, were you ever hungry, but didn’t eat, because there 7. wasn’t enough money for food? (Yes/No)
In the last 12 months, did you lose weight because because there wasn’t 8. enough money for food? (Yes/No)
In the last 12 months did you or other adults in your household ever not 9. eat for a whole day because there wasn’t enough money for food? (Yes/No)
(If yes to Question 9) How often did this happen—almost every month, 10. some months but not every month, or in only 1 or 2 months?
(Questions 11-18 were asked only if the household included children ages 0-18)
“We relied on only a few kinds of low-cost food to feed our children 11. because we were running out of money to buy food.” Was that often, sometimes, or never true for you in the last 12 months?
“We couldn’t feed our children a balanced meal, because we couldn’t 12. afford that.” Was that often, sometimes, or never true for you in the last 12 months?
“The children were not eating enough because we just couldn’t afford 13. enough food.” Was that often, sometimes, or never true for you in the last 12 months?

33Food Insecurity in Households with Children: Prevalence, Severity, and Household Characteristics / EIB-56
Economic Research Service/USDA
In the last 12 months, did you ever cut the size of any of the children’s 14. meals because there wasn’t enough money for food? (Yes/No)
In the last 12 months, were the children ever hungry but you just couldn’t 15. afford more food? (Yes/No)
In the last 12 months, did any of the children ever skip a meal because 16. there wasn’t enough money for food? (Yes/No)
(If yes to Question 16) How often did this happen—almost every month, 17. some months but not every month, or in only 1 or 2 months?
In the last 12 months did any of the children ever not eat for a whole day 18. because there wasn’t enough money for food? (Yes/No)
Coding of Responses
Questions 1-3 and 11-13 are coded as affi rmative (i.e., possibly indicating food insecurity) if the response is “often” or “sometimes.” Questions 5, 10, and 17 are coded as affi rmative if the response is “almost every month” or “some months but not every month.” The remaining questions are coded as affi rmative if the response is “yes.”
Assessing Food Security Status
Households are classifi ed as food insecure if they report three or more indica-tions of food insecurity in response to the entire set of 18 questions.
The food security status of children in the household is assessed by responses to the child-referenced questions, 11-18. Households reporting two or more of these conditions are classifi ed as having food insecurity among children. Households reporting fi ve or more are classifi ed as having very low food security among children.

34Food Insecurity in Households with Children: Prevalence, Severity, and Household Characteristics / EIB-56
Economic Research Service/USDA
Appendix B
Appendix table B-1—Findings from selected studies on the sffects of food insecurity and food insuffi ciency on children’s health, development, and well-being (statistically signifi cant associations, with controls included in the model, are shaded)1
Condition studied Population Finding Data 2 Comments Citation
Weight and BMIChildren in fi rst, third, and fi fth grade
Weak, nonsignifi cant negative association with food insecurity in current period (for boys, girls, and combined).
ECLS-K
Extensively specifi ed dynamic model controlled for weight in previous pe-riod (kindergarten, fi rst, and third grade).
Bhargava et al., 2008
General health (parent-reported)
Children ages 9 and 24 months
Poor or fair health (vs. excellent or good) more likely in food-insecure hh. Main pathway is through parental depression, di-rect effect marginally signifi cant (p=.09), not through measured parenting or feeding practices.
ECLS-B
Could be biased by measurement artifact of parental depression, leading to upward bias on measured food inse-curity and children’s poor health.
Bronte-Tinkew et al., 2007Weight for length
(overweight)
Children ages 9 and 24 months
Higher weight for length in food-insecure hh. Pathway is through parenting practices and infant feeding practices (mainly a measure of breastfeeding).
Structural model may be problematic. Food insecurity associated with better infant feeding practices and marginally signifi cant (p=.07).
Length for ageChildren ages 9 and 24 months
No signifi cant association with food insecurity or mediating variables.
Behavioral problems (problem in one or more of three domains: aggressive, anxious/depressed, inattention/ hyperactivity)
Children age 3 years
Signifi cant behavioral problems 1.6 times more likely in hh with marginal food security among adults and 2.1 times more likely in hh with food-insecure adults. Similar and statistically sig-nifi cant associations with each problem domain individually.
Fragile Fami-lies
Strong results in a large sample. In addition to demographic and eco-nomic controls, mother’s mental health (which could be a confounding measurement factor) was controlled.
Whitaker et al., 2006
Iron defi ciency anemia
Children age 7-36 months
2.5 times more likely in hh with food insecurity among children.
C-SNAP
Sample was small. Should be repeated with larger sample.
Skalicky et al., 2006
Anemia without iron defi ciency
Children age 7-36 months
1.6 times more likely in hh with food insecurity among children, but not statistically signifi cant.
“ “
Change in BMI and weight from kindergarten to third grade
Girls in third grade
Higher in households with marginal food security or insecurity at kindergarten age; higher in households with marginal food security or insecurity in both kindergarten and third grade.
ECLS-KJyoti et al., 2005
Boys in third grade
No statistically signifi cant association.
– Continued

35Food Insecurity in Households with Children: Prevalence, Severity, and Household Characteristics / EIB-56
Economic Research Service/USDA
Appendix table B-1—Findings from selected studies on the sffects of food insecurity and food insuffi ciency on children’s health, development, and well-being (statistically signifi cant associations, with controls included in the model, are shaded)1 (continued)
Condition studied Population Finding Data 2 Comments Citation
Change in BMI and weight from kindergarten to third grade
Girls in third grade
Higher in households with marginal food security or insecurity at kindergarten age; higher in households with marginal food security or insecurity in both kindergarten and third grade.
ECLS-KJyoti et al., 2005
Boys in third grade
No statistically signifi cant association.
Change in math score from kindergarten to third grade
Girls and boys in third grade
Lower in households marginally food secure or food insecure in kindergarten than in households food secure in both kindergarten and third grade.
Change in reading score from kindergarten to third grade
Girls in third grade
Lower in households marginally food secure or food insecure in third grade (or in both kindergarten and third grade) than in households food secure in both periods.
Boys in third grade
No statistically signifi cant association.
Change in social skills as assessed by teachers in kindergarten and third grade
Girls in third grade
Greater improvement in households that transitioned from marginally food secure or food insecure in kindergarten to food secure in third grade than in households food secure in both periods.
Boys in third grade
Smaller improvement (opposite of girls) in households that transitioned from marginally food secure or food insecure in kindergarten to food secure in third grade than in households food secure in both periods.
Unexpected fi nding, and unexpected that boys and girls have opposite patterns.
– Continued

36Food Insecurity in Households with Children: Prevalence, Severity, and Household Characteristics / EIB-56
Economic Research Service/USDA
Appendix table B-1—Findings from selected studies on the sffects of food insecurity and food insuffi ciency on children’s health, development, and well-being (statistically signifi cant associations, with controls included in the model, are shaded)1 (continued)
Condition studied Population Finding Data 2 Comments Citation
Physical function (a subscale of the Pediatric Health-Related Quality of Life measure)
Children age 3-17 years
Physical function of children in food-insecure hh 3.3 points lower (87.4 vs. 90.7 mean for children in food-secure house-holds); association strongest for ages 3-8 years, weaker and not statistically signifi cant for ages 9-11, and near zero for ages 12-17.
Delta NIRICasey et al., 2005
Psychosocial function (a subscale of the Pediatric Health-Related Quality of Life measure)
Children age 3-17 years
Psychosocial function of children in food-insecure hh 3.6 points lower (77.1 vs. 80.7 in food-secure hh); association was strongest for ages 12-17, weaker and not statistically sig-nifi cant for ages 3-8, and near zero for ages 9-11.
Health status (reported by caregiver)
Children age 0-36 months
Fair or poor health (vs. excellent or good) nearly twice as likely in food-insecure hh; no dose-response pattern observed.
C-SNAPCook et al., 2004
Hopitalization since birth
“ “
30% more likely in food-inse-cure hh; dose response: 2.3 times more likely in hh with very low food security.
Hospital admission on day of interview
“ “Not statistically signifi cant; weak negative association in sample.
At risk for growth problems (either low weight for age or weight for height)
“ “Not statistically signifi cant; weak positive association in sample.
Educational achievement—math score in Fall of kindergarten year
Kindergarten-ers
Lower by a half-point (mean math score was 19 points) in marginally secure and food-insecure hh. Some dose response: score 1 point lower in hh with very low food security.
ECLS-KWinicki and Jemison, 2003
Educational achievement—gain in math score from Fall to Spring of kindergarten year
“ “
Lower by 0.4 points (mean gain in math score was 8 points) in marginally secure or food-insecure hh; no dose-response pattern.
– Continued

37Food Insecurity in Households with Children: Prevalence, Severity, and Household Characteristics / EIB-56
Economic Research Service/USDA
Table B-1—Findings from selected studies on the sffects of food insecurity and food insuffi ciency on children’s health, development, and well-being (statistically signifi cant associations, with controls included in the model, are shaded)1 (continued)
Condition studied Population Finding Data 2 Comments Citation
Physical growth—height, weight, BMI, and changes in these from Fall to Spring
Kindergarten-ers
Not statistically signifi cant; associations in the sample weak and inconsistent.
ECLS-KWinicki and Jemison, 2003
Depressive disorder and suicidal symptoms
Adolescents age 15-16
Adolescents in food insuffi cient hh much more likely to have depressive disorder and suicidal symptoms.
NHANESIII
Alaimo et al., 2002
Chronic condition health count
Preschool children
Signifi cantly higher in hh with moderate child hunger.
Worcester, MA survey of homeless and low-income, housed mothers and children
Weinreb et al., 2002
School-age children
Signifi cantly higher in hh with severe child hunger (measured by CCHIP items).3
Internalizing behavior problems (based on Child Behavior Checklist)
Preschool- and school-age children
Signifi cantly higher in hh with severe child hunger, associations positive but weaker and not statistically signifi cant with moderate child hunger.
Anxiety/Depression (based on Child Behavior Checklist)
School-age children
Signifi cantly higher in hh with severe child hunger.
Academic achievement (based on Wechsler Individual Achievement Test Screener)
School-age children
No statistically signifi cant association.
Risk of overweight (weight-for-age higher than 85th percentile on CDC growth chart)
Girls ages 2-7Signifi cantly lower in food-insuffi cient hh.
NHANES IIIAlaimo et al., 2001c
Boys ages 2-7No statistically signifi cant association.
Boys ages 8-16
No statistically signifi cant association.
White non-Hispanic girls ages 8-16
No statistically signifi cant association.
Black non-Hispanic girls ages 8-16
No statistically signifi cant association.
Mexican-American girls ages 8-16
Signifi cantly higher in food-insuffi cient hh.
– Continued

38Food Insecurity in Households with Children: Prevalence, Severity, and Household Characteristics / EIB-56
Economic Research Service/USDA
Table B-1—Findings from selected studies on the sffects of food insecurity and food insuffi ciency on children’s health, development, and well-being (statistically signifi cant associations, with controls included in the model, are shaded)1 (continued)
Condition studied Population Finding Data 2 Comments Citation
Fair or poor health status (vs. excellent or good)
Children age 1-5 years
49 percent more likely in food-insuffi cient hh.
NHANES IIIAlaimo et al., 2001b
Children age 6-16 years
58 percent more likely in food-insuffi cient hh.
Frequent stomach aches
Children age 4-5 years
3 times as likely in food-insuffi -cient hh.
Children age 6-16 years
88 percent more likely in food-insuffi cient hh.
Frequent headaches
Children age 4-5 years
2.5 times as likely in food-insuf-fi cient hh.
Children age 6-16 years
67 percent more likely in food-insuffi cient hh.
Number of colds in previous 12 months
Children age 1-5 years
57 percent more in food-insuf-fi cient hh.
Children age 6-16 years
Moderately strong positive as-sociation in the sample, but not statistically signifi cant.
Number of ear infections in lifetime
Children age 1-5 years
Association weakly positive in sample, but not statistically signifi cant.
NHANES IIIAlaimo et al., 2001b
Children age 6-16 years
Association weakly positive in sample, but not statistically signifi cant.
Iron defi ciency
Children age 1-5 years
Association negative (opposite of expected) in sample, but not statistically signifi cant.
Children age 6-16 years
Association negative (opposite of expected) in sample, but not statistically signifi cant.
Restrictive impairment(1-5 yrs., prevented usual activity; 6-16 yrs., prevented school attendance.)
Children age 1-5 years
Association positive in sample, but not statistically signifi cant.
Children age 6-16 years
Association positive in sample, but not statistically signifi cant.
Cognitive development (two subtests of Weschler Intelligence Scale for Children-Revised)
Children age 6-11 years
No statistically signifi cant as-sociation.
NHANES IIIAlaimo et al., 2001a
Children age 12-16 years
No statistically signifi cant as-sociation.
– Continued

39Food Insecurity in Households with Children: Prevalence, Severity, and Household Characteristics / EIB-56
Economic Research Service/USDA
Appendix table B-1—Findings from selected studies on the sffects of food insecurity and food insuffi ciency on children’s health, development, and well-being (statistically signifi cant associations, with controls included in the model, are shaded)1 (continued)
Condition studied Population Finding Data 2 Comments Citation
Academic develop-ment (two subtests of Wide Range Achievement Test-Revised, repeated grade, days absent)
Children age 6-11 years
Lower arithmetic score and more likely to have repeated a grade in food-insuffi cient hh.
NHANES IIIAlaimo et al., 2001a
Children age 12-16 years
No statistically signifi cant asso-ciation. Associations in sample weak and inconsistent.
Psychosocial development (school absence, professional help for mental health, school suspension, number of good friends, trouble getting along with other children, shyness, or slow to make friends)
Children age 6-11 years
Child in food-insuffi cient hh 89 percent more likely to have seen psychologist or other mental health professional be-cause of an emotional, mental, or behavioral problem.
Children age 6-11 years
Positive association with “dif-fi culty getting along with others” in sample, but not statistically signifi cant.
Children age 12-16 years
Child in food-insuffi cient hh 82 percent more likely to have seen psychologist or other mental health professional be-cause of an emotional, mental, or behavioral problem, 95 per-cent more likely to have been suspended, 74 percent more likely to have diffi culty getting along with others.
Psychosocial dys-function (based on Pediatric Symptom Checklist)
Children ages 6-12
Signifi cantly more likely in households with hungry chil-dren. Aggression and anxiety components particularly strong-ly associated with hunger.
CCHIP4 Pitts-burgh area
Kleinman et al., 1998
1All studies controlled for income, employment, and other household characteristics likely to confound the relationships of interest. 2Data source abbreviations are as follows: ECLS-B, Early Childhood Longitudinal Study-Birth Cohort (National Center for Education Statistics); ECLS-K, Early Childhood Longitudinal Study-Kindergarten Cohort (National Center for Education Statistics); C-SNAP Children’s Sentinel Nutrition Assessment Program, renamed Children’s Healthwatch in 2009; Delta NIRI, Lower Mississippi Delta Nutrition Intervention Research Initiative (consortium of USDA’s Agriculture Research Service, several land-grant universities, and other institutions in the region); Fragile Families, The Fragile Families and Child Wellbeing Study (Princeton University); NHANES III, National Health and Nutrition Examination Survey III (National Center for Health Statistics).3The Weinreb et al. (2002) study used a methodology developed by the Community Childhood Hunger Identifi cation Project (CCHIP). The measure is closely related to the Children’s Food Security Scale based on the HFSSM, and includes many of the same items. Based on the number of food-insecure conditions reported, households are classifi ed as no hunger, adult or moderate child hunger, or severe child hunger.4The Kleinman et al. study used data from a Community Childhood Hunger Identifi cation Project (CCHIP) survey in low-income areas of Pittsburgh and surrounding Allegheny County. Children’s food security status was measured by the same eight questions as in Weinreb et al. (2000; see footnote 3), but categories were labeled as not hungry, at risk for hunger, or hungry.

40Food Insecurity in Households with Children: Prevalence, Severity, and Household Characteristics / EIB-56
Economic Research Service/USDA
Appendix C. Incidence of food insecurity in selected subpopulations, 2006-07 average
Appendix table C-1 provides the statistics that are presented graphically in the main body of the report on food insecurity by selected household charac-teristics. Also included in appendix table C-1 are the corresponding statistics for the broader category of food insecurity that includes households with food insecurity among either adults or children.
For example, out of a total of 26.6 million two-parent households with chil-dren, about 2.7 million were food insecure, comprising 10.3 percent of all two-parent households with children and 44.3 percent of all food-insecure households with children. Children as well as adults were food insecure in about 1.4 million two-parent households (a subset of the 2.7 million that were food insecure), comprising 5.1 percent of two-parent households with chil-dren and 41.5 percent of all food-insecure households with children. Children experienced very low food security at times during the year in 102,000 two-parent households, comprising 0.4 percent of two-parent households with children and 37.6 percent of all households with very low food security among children. This is a more severely food-insecure subset of the house-holds with food insecurity among children.

41Food Insecurity in Households with Children: Prevalence, Severity, and Household Characteristics / EIB-56
Economic Research Service/USDA
Appendix table C-1. Prevalence and distribution of food insecurity in households with children, by selected household characteristics, 2006-07 average
Characteristic
All food security statuses
Food-insecure households (food insecurity among
adults or children)
Households with food insecurity among children
(low or very low food security among children)
Households with very low food security among children
Number(000)
Number(000)
Preva-lence(%)
Share(%)
Number(000)
Preva-lence(%)
Share(%)
Number(000)
Preva-lence(%)
Share(%)
All households with children 39,413 6,194 15.7 100.0 3,293 8.3 100.0 272 0.7 100.0
Household composition:
Two-parent households 26,629 2,745 10.3 44.3 1,367 5.1 41.5 102 .4 37.6
Single-female-headed households
9,515 2,882 30.3 46.5 1,652 17.4 50.2 148 1.6 54.4
Single-male-headed households
2,619 457 17.5 7.4 220 8.4 6.7 19 .7 7.1
Other households with children
650 109 16.7 1.8 53 8.2 1.6 2 .3 .8
Race and Hispanic ethnicity:1
White non-Hispanic 24,305 2,798 11.5 45.2 1,391 5.7 42.2 92 .4 33.7
Black non-Hispanic 5,509 1,440 26.1 23.3 775 14.1 23.5 76 1.4 28.0
Hispanic2 7,053 1,678 23.8 27.1 980 13.9 29.8 89 1.3 32.7
Other non-Hispanic 2,545 277 10.9 4.5 146 5.7 4.4 15 .6 5.6
Annual household income:
Below poverty line3 5,362 2,326 43.4 37.6 1,357 25.3 41.2 119 2.2 43.8
100 to 130 percent of poverty line
1,857 656 35.3 10.6 345 18.6 10.5 31 1.7 11.4
130 to 185 percent of poverty line
4,313 1,055 24.5 17.0 535 12.4 16.3 44 1.0 16.3
Above 185 percent of poverty line
21,306 1,460 6.9 23.6 687 3.2 20.9 43 .2 15.7
Income not reported 6,575 698 10.6 11.3 368 5.6 11.2 35 .5 12.8
Residence relative to Metropolitan Statistical Area:
In principal city of MSA4 10,516 1,987 18.9 32.1 1,112 10.6 33.8 114 1.1 41.9
In suburbs or outlying areas of MSA5 17,140 2,244 13.1 36.2 1,159 6.8 35.2 80 .5 29.4
In MSA, specifi c location not identifi ed
5,455 852 15.6 13.7 440 8.1 13.4 42 .8 15.3
Not in MSA (i.e., nonmetropolitan)
6,303 1,111 17.6 17.9 582 9.2 17.7 36 .6 13.4
– Continued

42Food Insecurity in Households with Children: Prevalence, Severity, and Household Characteristics / EIB-56
Economic Research Service/USDA
Table C-1. Prevalence and distribution of food insecurity in households with children, by selected household characteristics, 2006-07 average (continued)
Characteristic
All food security statuses
Food-insecure households (food insecurity among
adults or children)
Households with food insecurity among children
(low or very low food security among children)
Households with very low food security among children
Number(000)
Number(000)
Preva-lence(%)
Share(%)
Number(000)
Preva-lence(%)
Share(%)
Number(000)
Preva-lence(%)
Share(%)
Census Region:
Northeast 7,067 975 13.8 15.7 549 7.8 16.7 46 0.6 16.9
Midwest 8,641 1,295 15.0 20.9 641 7.4 19.5 48 .6 17.6
South 14,473 2,533 17.5 40.9 1,349 9.3 41.0 97 .7 35.8
West 9,232 1,391 15.1 22.5 754 8.2 22.9 81 .9 29.7
Employment and labor force status of adults:
One or more employed full-time
34,359 4,253 12.4 68.7 2,213 6.4 67.2 168 .5 61.9
Part-time, no full-time 1,993 631 31.7 10.2 344 17.3 10.4 22 1.1 8.2
Unemployed looking for work, none employed
954 450 47.2 7.3 226 23.7 6.9 35 3.6 12.7
Disabled, none in the labor force
871 455 52.2 7.3 270 31.0 8.2 26 3.0 9.7
None in labor force, none disabled
1,236 404 32.7 6.5 239 19.3 7.3 20 1.6 7.5
Education of most highly educated adult:
Less than high school 3,132 1,122 35.8 18.1 688 21.9 20.9 65 2.1 23.7
Completed high school (or GED)
9,339 2,153 23.1 34.8 1,126 12.1 34.2 97 1.0 35.8
Some college (including 2-year degree)
12,244 2,178 17.8 35.2 1,143 9.3 34.7 84 .7 30.8
Four-year degree or higher
14,699 740 5.0 11.9 335 2.3 10.2 26 .2 9.7
Age of oldest child in the household:
0-4 years 7,569 1,029 13.6 16.6 397 5.2 12.1 24 .3 8.9
5-8 years 6,923 1,143 16.5 18.5 554 8.0 16.8 17 .2 6.2
9-12 years 8,614 1,346 15.6 21.7 769 8.9 23.3 59 .7 21.7
13-15 years 8,589 1,451 16.9 23.4 866 10.1 26.3 92 1.1 33.7
16-17 years 7,719 1,225 15.9 19.8 707 9.2 21.5 80 1.0 29.6
– Continued

43Food Insecurity in Households with Children: Prevalence, Severity, and Household Characteristics / EIB-56
Economic Research Service/USDA
Table C-1. Prevalence and distribution of food insecurity in households with children, by selected household characteristics, 2006-07 average (continued)
Characteristic
All food security statuses
Food-insecure households (food insecurity among
adults or children)
Households with food insecurity among children
(low or very low food security among children)
Households with very low food security among children
Number(000)
Number(000)
Preva-lence(%)
Share(%)
Number(000)
Preva-lence(%)
Share(%)
Number(000)
Preva-lence(%)
Share(%)
Number of children in the household:
1 child 16,999 2,389 14.1 38.6 1,156 6.8 35.1 133 0.8 49.0
2 children 14,300 2,073 14.5 33.5 1,137 8.0 34.5 56 .4 20.7
3 or more children 8,114 1,731 21.3 27.9 999 12.3 30.3 82 1.0 30.3
Note: For each characteristic and food security status, “prevalence” means the number of households with the specifi ed food security status and the specifi ed characteristic as a percentage of all households with the specifi ed characteristic. “Share” means the number of households with the specifi ed food security status and the specifi ed characteristic as a percentage of all households with the specifi ed food security status. For example, 10.3 percent of two-parent households were food insecure, and two-parent households made up 44.3 percent of all food-insecure households.1 Race and Hispanic ethnicity is that of the household reference person, i.e., the person in whose name the residence is owned or rented. If residence is jointly owned or rented, any of the owners or lessees may be designated reference person.2 Hispanics may be of any race.3 The poverty line for a family of two adults and two children in 2007 was an annual income of $21,027.4 Households within incorporated areas of the largest cities in each metropolitan area.5 Households in counties (townships in New England) that are densely populated and linked to principal cities of the MSA by daily commuting patterns.
Source: Calculated by Economic Research Service using Current Population Survey Food Security Supplement data.


![UNHCR &AND DISPLACEMENT · energy insecurity’, exacerbated by ‘[d]esertification, drought, flooding, and the growing severity of disasters’.4 People who move in such circumstances](https://img.dokumen.tips/doc/110x75/5e73034e4319c169d568af12/unhcr-and-displacement-energy-insecuritya-exacerbated-by-adesertification.jpg)