Embed Size (px)
DESCRIPTION
Process document outlining the design of a Health Food and Community Center in Philadelphia's Strawberry Mansion Neighborhood. Extensive research of Global, National, and Local food systems informed later design and planning.The design bridges the gap between surrounding residences, an elementary school, and shopping complex by means of a large urban garden. The garden is contained within an architecture that resembles rolling grassy knolls.
Citation preview

The Food Commons At 2803 West Fletcher Designing a Food Access Point in Strawberry Mansion
Logan Dry - Szymanik - Philadelphia University - Fall 2011

ContentsIntent
Project 1- National Food System Research
Project 2- National Food System Traceability
Project 3- National Food System Energy Consumption
Project 4- Identifying Food Access in South Philadelphia
Project 5- Food Access in Strawberry Mansion
Project 6- Locating a Site for Food Accessibility in Strawberry Mansion
Project 7- Creating/Developing Community Food Center Program
Project 8- Identifying 12 Users of the Architecture/Program
Midterm Progress- Initial Ideas
Moving Towards A Resolution
Final- The Food Commons at 2803 West Fletcher Street
The Intent of this compilation is to show the process behind developing architecture from an initially intangible idea, into a fully realized concept. Unlike other semesters, in which predetermined programmatic guidelines and site location was given, this semester provided me with a unique opportunity in which I could design a program and select a site based on research. The initial portion of the project consisted of extensive research in regards to food systems at a Global, National, and Local level. From this research, I was able to determine what food related issues were prevalent in Philadelphia and then develop a program that addressed these issues. From my research I determined that local food access and education was an issue throughout Philadelphia, and in one particular neighborhood, Strawberry Mansion, the problem was particularly severe. In response to the two aforementioned issues, I developed a design whose form, location, and programmatic elements together create a Food Center for the Community. My final proposal, The Food Commons at 2803 West Fletcher Street, is based upon the need for architecture that addresses both physical and social needs of healthy local food in Strawberry Mansion.

Project 1- National Food System ResearchRationale: Research food on at a National Scale in the United States. Research the processes behind various levels of production, processing and delivery of food. Consider the major players involved, the end users and the producers.Also consider the history of this processes, why it developed and at what cost.
As a group we produced an initial set of 3 boards that visually represented the United States National Food system. The boards address issues such as food traceability, food energy, and fossil fuel consumption in regards to food processing. As an initial pass at researching such an immense system, the information regarding the three topics is broad and gives a big picture of some initial problems we identified in the national food system. We found that a great deal of energy was being used to process foods, in turn cutting down on the nutritional value of foodsthemselves. United States Food Traceability
Tracea·bili·ty n. - the ability to verify the history, location, or application of an item by means of documented recorded identification
Processors
Growers
ShippersWholesalers & Brokers
Exports
US Consumers
Retail & Food Service
Farmers’ Markets
Stockers
Cattle Feedlot
Dairy Farms
Slaughter & Processing
Retail & Food Service
Exports
Fishing Fleet Sorting & Weighing
Butchering& Scaling
ProductProcessing
US Consumers
US Consumers
Exports
Retail & Food Service
Exports355,560
S6
Industrial 40,930
MeatScrap36,770
Red Meat 43,680
Poultry 30,742
Eggs 97,060
Milk 155,290
Total Gross Aquaculture480,886
Vegetables 37,920
Fruits: 64,450
Grains 611,340
Waste 20,000
Water Losses111,700
Carps 236,451
Tilapia 174,062
Clams 70,373
Total Gross Crops921,590
Total Gross Meat326,952
Material Flow and W

Stored Grains 68,080
Uses
EdibleFood Supply 455,880
Consumed 359,610
Retail5,450
s
Retail2,136
Waste (Tonnes) Food Energy: ConsumptionConsumption Vs. Production
Transportation
Agriculture
Processing Industry
Household
The United States uses 10 times as much fossil fuel energy to produce our food, than the actual food itself yields in metablic energy-- resulting in a net loss of 8.9 quads of energy per year.
1 Quad of energy is the equivalent of:
- Just over 8 trillion barrels of gasoline, enough to fill 320 million cars.- Enough gasoline to fill 12,000 Olympic sized swimming pools.- The net energy loss of 8.9 quads translates into enough gasoline to fill up
3 trillion cars.
Fossil Fuel Energy Consumed10.3 Quads
31.7%
21.4%
16.4%
13.6%
6.6%
6.6%
3.7%
Packaging Material
Commercial Food Service
Food Retail
13.6%Food Energy Produced
Energy Produced1.4 Quads
Philip Rivera - Logan Dry - Tim Schaefer
Key Facts:-The US uses nearly 10 times as much energy to produce food than the food itself yields.-The Food system can be broken down into 3 components, vegetables and grain, meat and poultry, and fish.-The most waste occurs in the meat and grain industry, due to improper storage, shipping, and displaying in store.-As a whole, we as consumers only eat about 1/3 of the total amount of edible food produced, accounting for a waste of 2/3 of all food produced.

Project 2- National Food System TraceabilityRationale: From the research gathered in the previous three boards, determine a specific aspect of that food system and analyze it in finer detail. Become an expert on the topic matter, and demonstrate an in depth understanding of a specific aspect of that food system as a whole.
As a group we produced an additional set of 3 boards that visually represented the aspect of Food Traceability in regards to the United States National Food system. The aim of these boards was to identify the quantity of food entering the food system in raw form, and the quantity leaving the system to be delivered to us as consumers in an edible form. The overall intent was to determine how quantities of raw product was determined, and how much of this raw product was in turn wasted in the process of becoming edible food supply for livestock as well as human consumption.
Processors2
Growers1
Shippers3
Wholesalers & Brokers5
Exports6
US Consumers8
Major Retail7
Local Markets4
Stockers9
Cattle Feedlot10
Dairy Farms10
Slaughter & Processing11
Retail & Food Service13
Exports12
Fishing Fleet15 Sorting & Weighing16
Butchering& Scaling17
ProductProcessing18
10 US Consumers14
US Consumers21
Exports19
72
14
3
1
9
5
2
Retail & Food Service20
United States Food Traceability
Exports355,56024
Indus40,93
MSc36
Red Meat 43,680
Poultry 30,742
Eggs 97,060
Milk 155,290
Total Gross Aquaculture480,88623
Vegetables 37,920
Fruits: 64,450
Grains 611,340
Wast20,00
Water L111,700
Carps 236,451
Tilapia 174,062
Clams 70,373
Total Gross Crops921,59021
Total Gross Meat326,95222
Raw Product
Raw product25
Exports Indu
Material Flow & Waste (Tonn
Stored Grains 68,08028
strial Uses3027
eatcrap6,770
EdibleFood Supply 455,88030
Consumed 359,610
Retail5,45029
te26 00
Losses* 0
Retail2,136
strial Uses Storage/Retail
Indicates Product that is lost/wasted on way to consumer
* Water Losses refer to water used in the processing of, as well as natural product liquids extracted/disposed of during the entire process.
nes)
22-30 Green, Ken. “Environmental Impacts of Food Production and Consumption.” Manchester Business School. Accessed August 24, 2011. http://www.ifr.ac.uk/waste/reports/DEFRA-Environmental%20Impacts%20of%20Food%20Production%20%20Consumption.pdf.
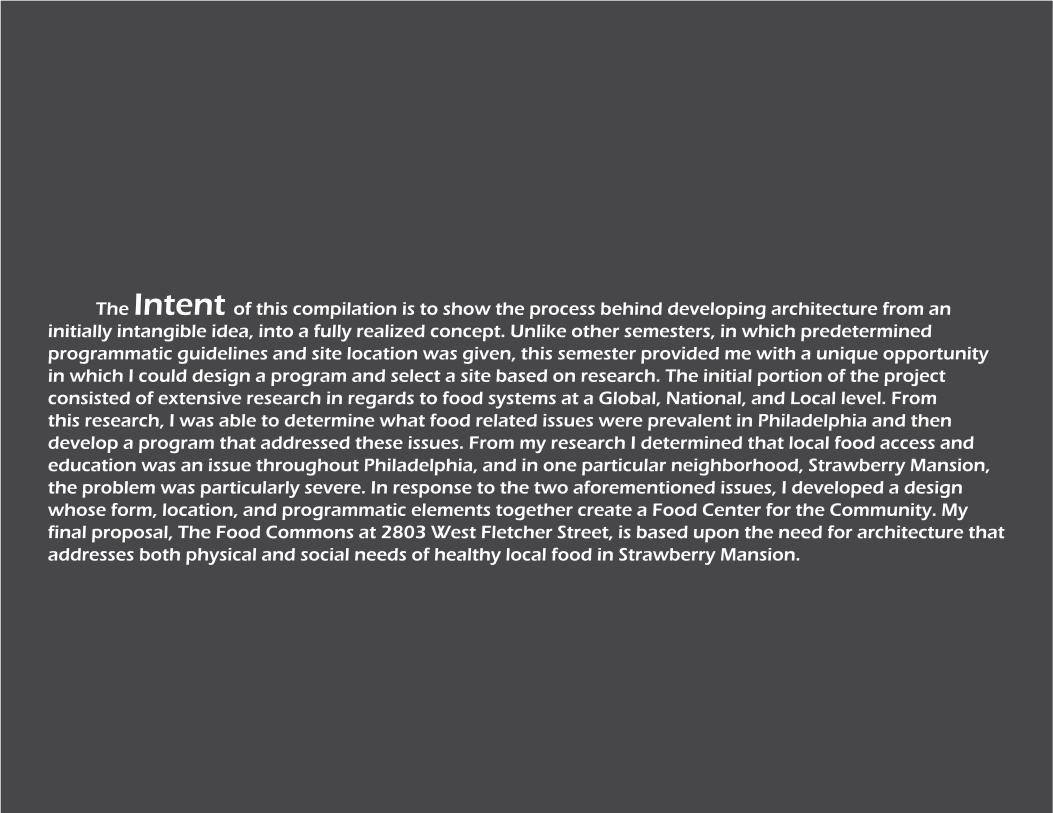
The US food Industry accounts for 22.4 percent of the annual energy budget, a four percent increase from the last five years.31
About 80% of the increase in annual U.S
energy is food related.32 This is primarily due to the demand for processed foods, which are highly labor and energy intensive.
Processing Industry
Transportation
Agriculture
Household31.7%
21.4%
16.4%
13.6%
6.6%
6.6%
3.7%
Packaging Material
Commercial Food Service
Food Retail
Food Production:Fossil Fuel
Energy Consumed33
Energy Produced34
13.6%
80%
20%
U.S. Annual EnergyIncreases
Other industries77.6%
Food Industry22.4%
U.S. Annual Energy Use
Ratio of fossil fuel energy consumed to
food energy produced is 10 : 1
Food Energy: ConsumptionConsumption Vs. Production
31 Canning, Patrick, Ainsley Charles, Sonya Huang, Karen Polenske, and Arnold Waters. “Energy Use in the U.S. Food System.” United States Department of Agriculture. USDA,1 Mar. 2010. Web. 29 Aug. 2011. <www.ers.usda.gov/Publications/err94/err94.pdf >.32 Fossil Fuel and Energy Use, Sustainable Food. Sustainable Table, 2006. Web. 26 Aug. 2011.<http://www.sustainabletable.org/issues/energy/>.33-34 Canning, Patrick, Ainsley Charles, Sonya Huang, Karen Polenske, and Arnold Waters. “Energy Use in the U.S. Food System.” United States Department of Agriculture. USDA,1 Mar. 2010. Web. 29 Aug. 2011. <www.ers.usda.gov/Publications/err94/err94.pdf >.
Key Facts:-Almost 33% of all the fossil fuels used in food production and consumption is used for household cooking and storage.-80% of annual energy increases nationwide are due to an increased energy use in food related energy use.-Transportation of food from the farm to processing plants and then to the stores accounts for almost 15% of overall energy uses.-10:1 ratio of fossil fuel consumed to produce food, versus the amount of caloric energy that we get out of that processed food.
Processed 56%
Fresh 44%
Pre- Heat
Marinate
Apply Rub
Cook
Microwave
Factory Processing
Your Involvement
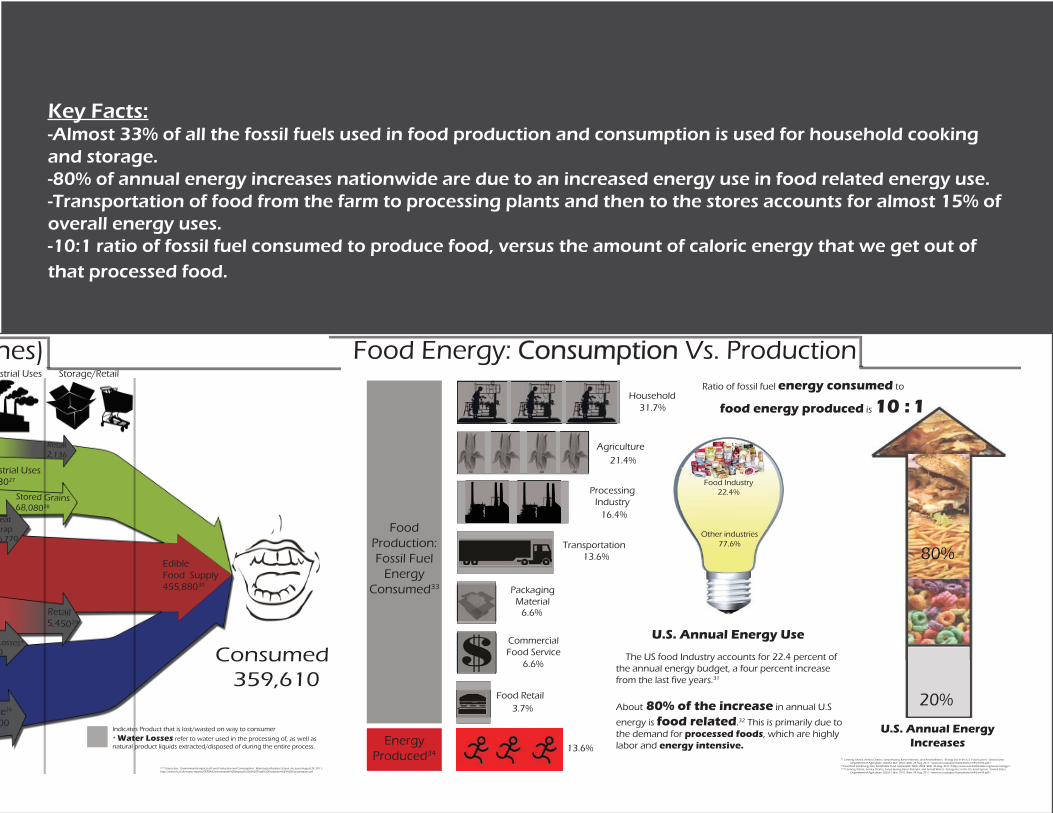
Americans consume 3770 Calories per day in contrast to the recommended amount of 2000 calories38 56% of this calorie intake39 is processed food.
Fresh vs. Processed What’s For Dinner- How Much Time Do You Have?
Considerably less time is spent by the consumer on prep time, however more labor and energy is needed behind the scenes of the processing plant in order to have that microwaveable convenience. ERS estimates that food related energy use in the home increasedby 3.9% per meal between 2002 and 200840. This accounts for cooking, cooling cold storage and disposal.
Americans eat out at a restaurant an average of 4-5 times a week, totaling about 200 meals per year.35
Out of those 200 meals 150 are from fast food.36
These trends yield an annual diet of 56% processed foods.37
Time: 90 Min Time: 6 Min
Lifestyle Influences
35 Canning, Patrick, Ainsley Charles, Sonya Huang, Karen Polenske, and Arnold Waters. “Energy Use in the U.S. Food System.” United States Department of Agriculture. USDA,1 Mar. 2010. Web. 29 Aug. 2011. <www.ers.usda.gov/Publications/err94/err94.pdf >.36-37 Minn, Michael. “Energy Use in American Food Production.” Accessed August 24, 2011. http://michael minn.net/geography/2009-food-energy/2099-05-11-food-energy.pdf.38-39 Calorie Consumption on the Rise in US. US Centers For Disease Control and Prevention, Web.1 Sept. 2011. <http://www.cdc.gov/nchs/pressroom/04news/calorie.htm>.40 Pfeiffer, Dale A. Eating Fossil Fuels. From the Wilderness Publications, 2004. Web. 27 Aug.2011. <http://www.copvcia.com/free/ww3/100303_eating_oil.html>.

Soda: 160 Gal.
Top 5 Processed Foods (Lbs. Consumed per person, per year)41
1. Dairy Products- 298 lbs. 2. Frozen Foods- 143 lbs. 3. Soda- 165 gal. 4. Snacks- 77 lbs. 5. Canned- 47 lbs.
Fertilizer
Irrigation
Farm Equipment
Machinery
Packaging
Cooking
TransportationCooling
20% 13% 10%15% 10%
14% 11% 7%
To show the substantial use of fossil fuels in the production of our food, consider a package of inorganic salad mix coming from California to an East coast consumer.42
Graph shows the positive correlation between the increase in population, processed food demand, and food energy demand.Notice the top 5 processed foods include dairy and frozen meals.
Vegetables Harvested & Packed
Plants Irrigated & Fertilized
Cut, Cleaned, Washed, & Packaged
Fertilizer Produced
Refrigerated Shipping
Store Refrigerated
Consumer Purchases
Industry in Action
41 Center for Sustainable Systems, University of Michigan. 2010. “U.S. Food system Factsheet.” Pub. No. CSS01-06.42 Canning, Patrick, Ainsley Charles, Sonya Huang, Karen Polenske, and Arnold Waters. “Energy Use in the U.S. Food System.” United States Department of Agriculture. USDA, 1 Mar. 2010. Web. 29 Aug. 2011. <www.ers.usda.gov/Publications/ err94/err94.pdf >.

Project 3- National Food System Energy ConsumptionRationale: From the research gathered in the previous three boards, determine a specific aspect of that food system and analyze it in finer detail. Become an expert on the topic matter, and demonstrate an in depth understanding of a specific aspect of that food system as a whole.
Taking the research a step further, we determined that a relationship must exist between food traceability and the energy used throughout each and every process. Through more research into the processes in-volved in the growing and shipping aspects of food in the United States, we determined that a significant amount of fossil fuels are being wasted instead of sensibly used. The point that we tried to convey through these boards is that as consumers we can essentially control the demand for the type of foods we eat. Less processed foods and more fresh food would lead to an overall reduction of fossil fuel use for our foods. Hence, the price of our foods would decrease once they become separated from the high costs of fossils. The board is a compilation of the initial 4-5 weeks of research.
Key Facts:-A home cooked meal takes on average over 60 minutes to prepare, versus a processed TV dinner which takes only about 6 minutes to prepare.-It takes on average 400 barrels of oil to feed a single American for one year, most of this oil being used to store and process our foods.-An inherent link exists therefore between the high costs of fuel and the high costs of our daily food intake. -In the agricultural industry, almost 1/3 of all the fossil fuel use in the industry is used to produce fertilizers that are the spread by gasoline powered farm equipment. -Another 20% of fuel is then used by additional farm equipment that harvests, collects and washes the vegetables for their shipment to the processing plants. - Once the vegetables are at the processing plant, the machinery that washes, chops and packages the veggies are all run on fossil fuels rather than human labor.

Fertilizer12
Field Machinery Operation11
Transportation10
Irrigation9
Raising Livestock8
Crop Drying6
Miscellaneous7
16%16%
13%13%
8%8%
8%8%
5%5%
19%19%
Food related energy accounts for 80% of annual U.S. energy increases-- it also correlates directly with the American lifestyle. The demand for convenient and processed foods is leading to an increased demand in energy used for machine intensive processing, rather than labor intensive preparation in the home. Thus, energy efficiency in regards to food energyis sacrificed for convenience.
Eating America’s Energy
Processing Industry
Transportation
Agriculture
Household31.7%
16.4%
13.6%
6.6%
6.6%
3.7%
Packaging Material
Commercial Food Service
Food Retail
Food Production:Fossil Fuel
Energy Consumed1
Energy Produced2
13.6%
Feeds 1 American for a year
About 80% of the increase in annual
U.S energy is food related.3
31%31%
The U.S. Food Industry accounts for 22.4% of the
annual energy budget.4
Ra
tio o
f fo
ssil
fuel
en
erg
y c
on
sum
ed
to
foo
d e
ne
rgy
pro
du
ced
is1
0 :
1Food Energy Actual vs. Projected
Year
En
erg
y I
n B
TU
s400 Gallons Of Oil400 Gallons Of Oil55
21.4%
124 Gallons76 Gallons64 Gallons52 Gallons32 Gallons32 Gallons20 Gallons
1-2 Canning, Patrick, Ainsley Charles, Sonya Huang, Karen Polenske, and Arnold Waters. “Energy Use in the U.S. Food System.” United States Department of Agriculture. USDA,1 Mar. 2010. Web. 29 Aug. 2011. <www.ers.usda.gov/Publications/err94/err94.pdf >.3 Fossil Fuel and Energy Use, Sustainable Food. Sustainable Table, 2006. Web. 26 Aug. 2011.<http://www.sustainabletable.org/issues/energy/>.4 Canning, Patrick, Ainsley Charles, Sonya Huang, Karen Polenske, and Arnold Waters. “Energy Use in the U.S. Food System.” United States Department of Agriculture. USDA,1 Mar. 2010. Web. 29 Aug. 2011. <www.ers.usda.gov/Publications/err94/err94.pdf >.
5 Cummins, Joe. “GM Food Nightmare Unfolding in the Regulatory Sham.” Institute of Science in Society. Institute of Science in Society, 2008. Web. 26 Aug. 2011.<http://www.i-sis.org.uk/ pdf/GM_Food_Nightmare_Unfolding.pdf>.6-12 Pfeiffer, Dale A. Eating Fossil Fuels. From the Wilderness Publications, 2004. Web. 27 Aug. 2011. <http://www.copvcia.com/free/ww3/100303_eating_oil.html>.
Pre-
Hea
t5
min
Dry R
ub5 m
in
Cook
40 min
Your Involvement
Sear 15 min
Cooling
10 min
Factory Processing
Microwave 4 min
Time: 75 Min Time: 6 Min Fresh Tenderloin vs. Frozen Tenderloin
Considerably less time is spent by the consumer on preperation time, however more labor and energy is needed behind the scenes of the processing plant in order to have that microwaveable convenience.
Logan Dry Philip RiveraTim SchaeferDesign VProfessfor Szymanik

Project 4- Identifying Food Access in South PhiladelphiaThe Built Environment and Food AccessProblem: The built environment inhibits physical food accessibility in Philadelphia. In particular, the urban built environment of South/Southwestern Philadelphia has made physical food access inconvenient, if not next toimpossible.
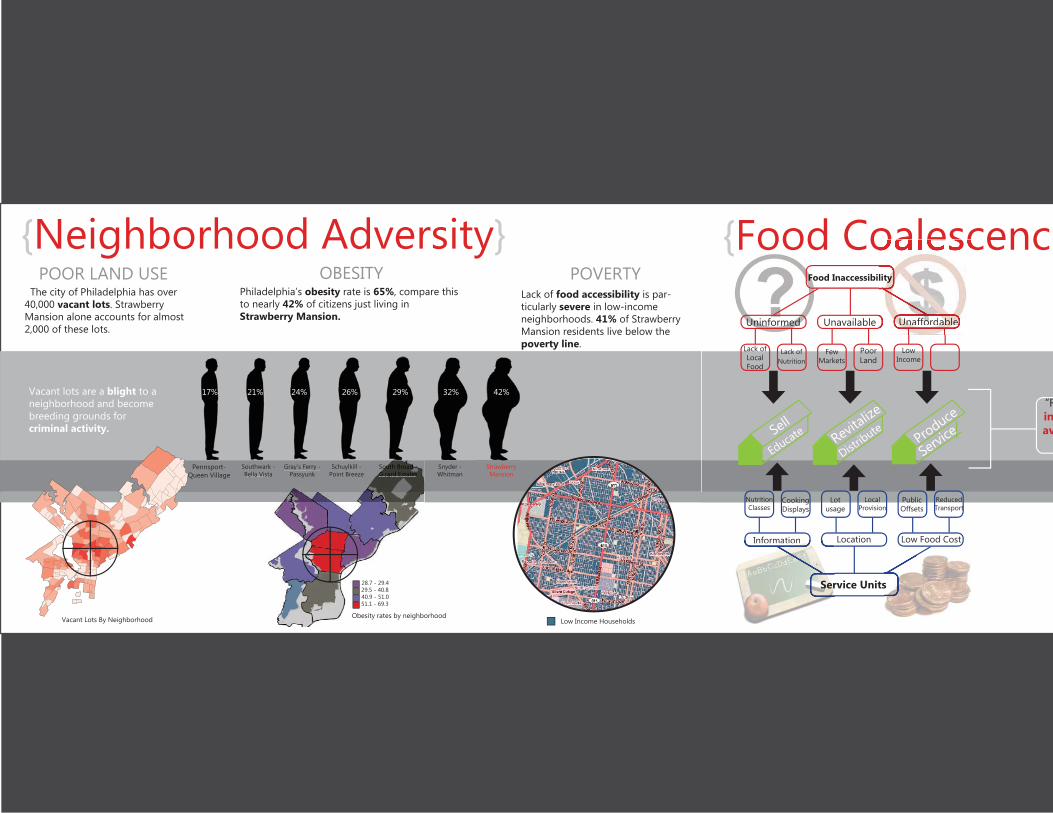
It is estimated that low-income neighborhoods have 30% fewer grocery stores per capita than higher income neighborhood.
“With the second lowest number of supermarkets per capita in the United States, Philadelphia and its residents struggle with the economic, social, and health impact of food retail disinvestment from urban communities.”1
The above figure shows how the placement of supermarkets near the outer limits of neighborhoods has an negative effect on the amount of people it can serve. The amount of people that have access to one or more supermarkets, is roughly proportionate to the number of people that dont have access.
“Neighborhood food environment” affects the amount of fruits and vegetables people eat, and therefore their overall health.”2
The Grocery Gap
Pennsport-Queen Village3
South-wark- Bella Vista4
Snyder-Whitman8South Broad- Girard Estates7
Schuylkill- Point Breeze6
Gray’s Ferry- Passyunk5
17% 21% 24%
24%
26% 29% 32%
Rationale: Once research of food systems on a National, Global and Local level had concluded, it was time to focus on food problems closer to home in Philadelphia.
Research a condition, an organization, and find a problem. Questions to consider: What problem are you going to try to solve? What is the origin of the problem? How can you identify issues? How does the system operate? How many people may your problem address?
A parallel found within research at the Global, National, and Local levels stemmed from the idea of food accessibility, mainly how a consumer can get to food, and how the food gets to the consumer. Approaching the issue of local healthy food access from the perspective of a designer, we had to determine not only the physical effects of creating some type of food centered architecture, but also the social responsibility of creating such architecture that was responsive to whatever location we so decided to put it in. Therefore, the proceeding boards detail the demographics of south Philadelphia in regards to weight, economic status, ethnic background, as well as population trends. The boards also identify some programs already in place by various non profit organizations such as septa and the Food Trust aimed at easing the accessibility problem.
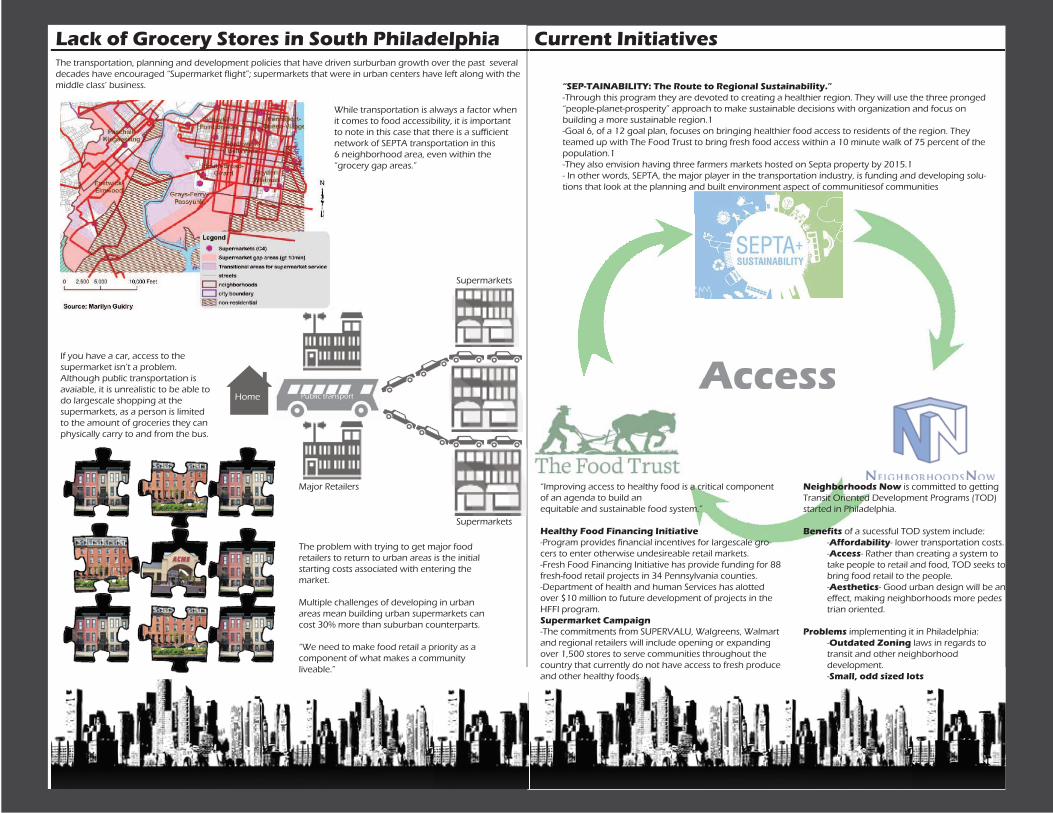
Current Initiatives
Access
Neighborhoods Now is committed to getting Transit Oriented Development Programs (TOD)started in Philadelphia.
Benefits of a sucessful TOD system include: -Affordability- lower transportation costs. -Access- Rather than creating a system to take people to retail and food, TOD seeks to bring food retail to the people. -Aesthetics- Good urban design will be an effect, making neighborhoods more pedes trian oriented.
Problems implementing it in Philadelphia: -Outdated Zoning laws in regards to transit and other neighborhood development. -Small, odd sized lots
“Improving access to healthy food is a critical component of an agenda to build an equitable and sustainable food system.”
Healthy Food Financing Initiative-Program provides financial incentives for largescale gro-cers to enter otherwise undesireable retail markets. -Fresh Food Financing Initiative has provide funding for 88 fresh-food retail projects in 34 Pennsylvania counties.-Department of health and human Services has alotted over $10 million to future development of projects in the HFFI program.Supermarket Campaign-The commitments from SUPERVALU, Walgreens, Walmart and regional retailers will include opening or expanding over 1,500 stores to serve communities throughout the country that currently do not have access to fresh produce and other healthy foods.
“SEP-TAINABILITY: The Route to Regional Sustainability.” -Through this program they are devoted to creating a healthier region. They will use the three pronged “people-planet-prosperity” approach to make sustainable decisions with organization and focus on building a more sustainable region.1 -Goal 6, of a 12 goal plan, focuses on bringing healthier food access to residents of the region. They teamed up with The Food Trust to bring fresh food access within a 10 minute walk of 75 percent of the population.1 -They also envision having three farmers markets hosted on Septa property by 2015.1- In other words, SEPTA, the major player in the transportation industry, is funding and developing solu-tions that look at the planning and built environment aspect of communitiesof communities
The transportation, planning and development policies that have driven surburban growth over the past several decades have encouraged “Supermarket flight”; supermarkets that were in urban centers have left along with the middle class’ business.
Lack of Grocery Stores in South Philadelphia
If you have a car, access to the supermarket isn’t a problem. Although public transportation is avaiable, it is unrealistic to be able to do largescale shopping at the supermarkets, as a person is limited to the amount of groceries they can physically carry to and from the bus.
While transportation is always a factor when it comes to food accessibility, it is important to note in this case that there is a sufficient network of SEPTA transportation in this 6 neighborhood area, even within the“grocery gap areas.”
Home Public transport
Major Retailers
Supermarkets
Supermarkets
The problem with trying to get major food retailers to return to urban areas is the initial starting costs associated with entering the market.
Multiple challenges of developing in urban areas mean building urban supermarkets can cost 30% more than suburban counterparts.
“We need to make food retail a priority as a component of what makes a community liveable.”
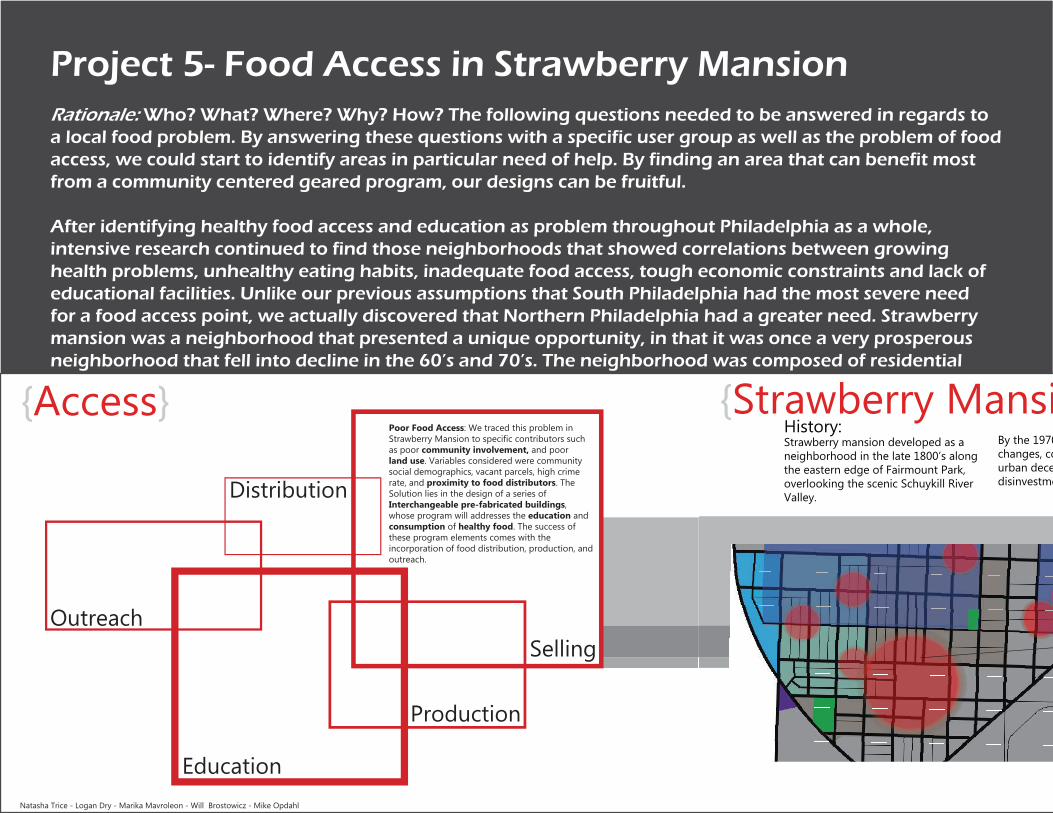
Project 5- Food Access in Strawberry MansionRationale: Who? What? Where? Why? How? The following questions needed to be answered in regards to a local food problem. By answering these questions with a specific user group as well as the problem of food access, we could start to identify areas in particular need of help. By finding an area that can benefit most from a community centered geared program, our designs can be fruitful.
After identifying healthy food access and education as problem throughout Philadelphia as a whole, intensive research continued to find those neighborhoods that showed correlations between growing health problems, unhealthy eating habits, inadequate food access, tough economic constraints and lack of educational facilities. Unlike our previous assumptions that South Philadelphia had the most severe need for a food access point, we actually discovered that Northern Philadelphia had a greater need. Strawberry mansion was a neighborhood that presented a unique opportunity, in that it was once a very prosperous neighborhood that fell into decline in the 60’s and 70’s. The neighborhood was composed of residential
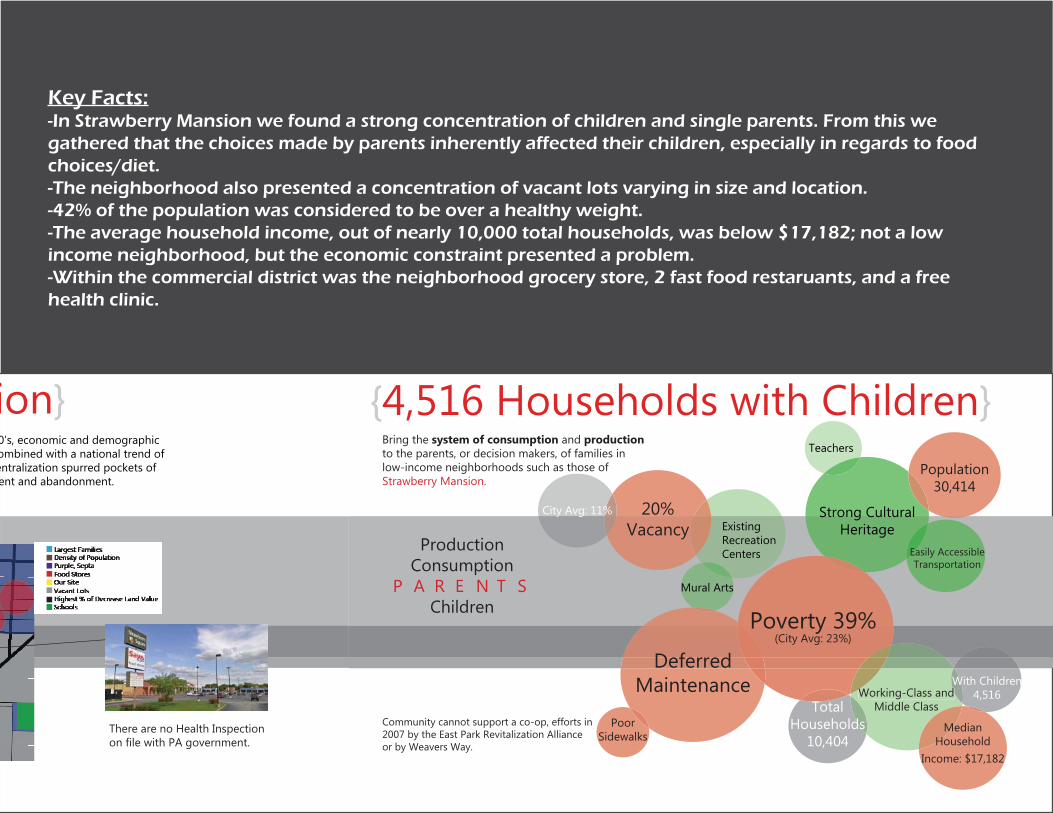
Key Facts:-In Strawberry Mansion we found a strong concentration of children and single parents. From this we gathered that the choices made by parents inherently affected their children, especially in regards to food choices/diet. -The neighborhood also presented a concentration of vacant lots varying in size and location.-42% of the population was considered to be over a healthy weight.-The average household income, out of nearly 10,000 total households, was below $17,182; not a low income neighborhood, but the economic constraint presented a problem. -Within the commercial district was the neighborhood grocery store, 2 fast food restaruants, and a free health clinic.


Project 6- Locate a Site: Food Accessibility in Strawberry Mansion
Rationale: Study the language we architects use to examine communities, then closely examine your neighborhood and the context in which the site exists.
We looked at specific site locations in Strawberry mansion that could support a food access project. It is important to note that the locations were initially selected based upon the size of the site, however after visiting the actual sites, it became clear that size was not the only factor to be considered when choosing a site, moreover the context that surrounded each also played a huge role. The sites at Huntington and 31st were spacious and offered much potential, but there was not a large enough network of people in the surrounding blocks to make such a site viable for a food access project. The sites at Fletcher on the other hand were in a more populated area and that gave the site much more exposure to the local public, as well as those passing through the area.
The area started to gain popularity in the 1890s as migration from
Northern Liberties and Fairmount commenced. Strawberry Mansion had an overwhelmingly Jewish population; home to 60,000 in its heyday. There were four grade schools, but no high school, hospital or police
dept. However, more than 60 businesses existed on 31st
Street beginning at Montgomery Avenue - it was the place to
be (Macy). Strawberry Mansion was filled with culture and booming
with daily activities. So what caused the decline of such an animated and bustling area?
COMMUNITY HISTORY
19922010Vacant lotsToday, the neighborhood has one of the highest
vacancy rates in Philadelphia: out of the city's 26,000 abandoned
units, 1,845 of them are in Strawberry Mansion. Houses are dilapidated and riddled with plumbing and infrastructure problems.
Zoning Data
PubliPubliPrivaPriva
Zoning Residential Mixed Use Commercial Industrial Recreational

2329 North 30th Street 2888 West Fletcher Street
2987 West Fletcher Street 2603 West Huntington Street
R10
C2
C2
R13
icic - Food Provider
ate - Residentialate - Institution
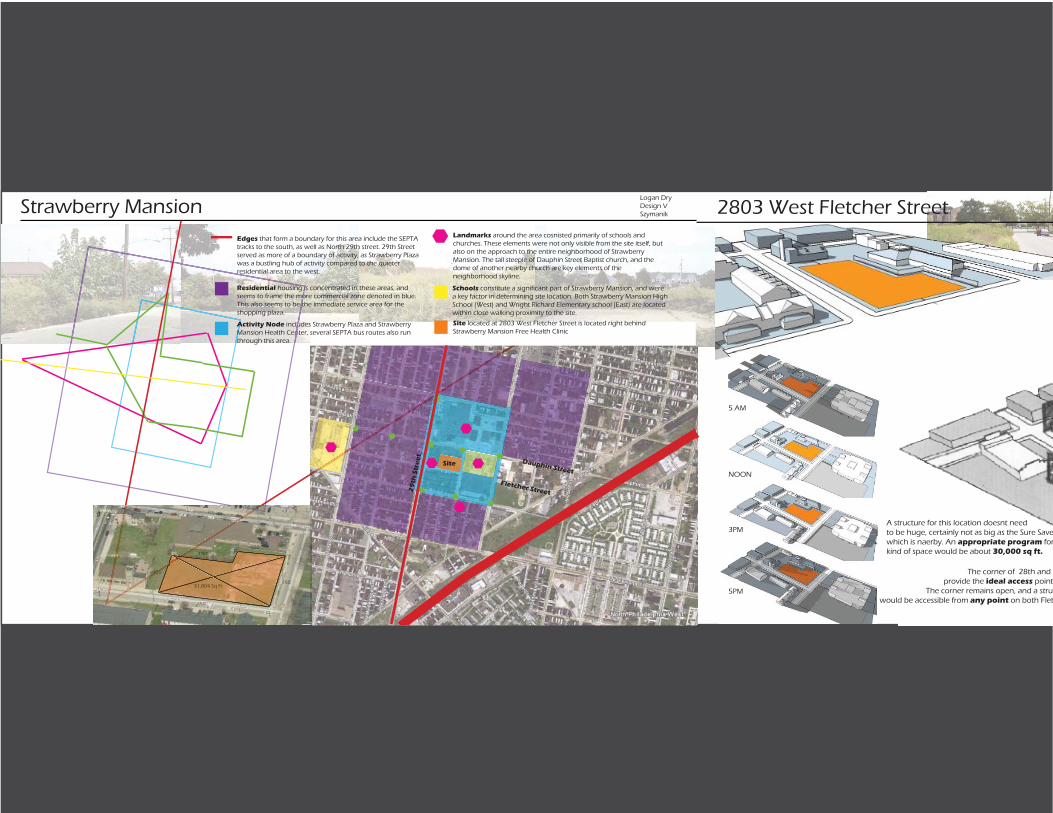
Strawberry MansionEdges that form a boundary for this area include the SEPTA tracks to the south, as well as North 29th street. 29th Street served as more of a boundary of activity, as Strawberry Plaza was a bustling hub of activity compared to the quieter residential area to the west.
Landmarks around the area cosnisted primarily of schools and churches. These elements were not only visible from the site itself, but also on the approach to the entire neighborhood of Strawberry Mansion. The tall steeple of Dauphin Street Baptist church, and the dome of another nearby church are key elements of the neighborhood skyline.
Residential housing is concentrated in these areas, and seems to frame the more commercial zone denoted in blue. This also seems to be the immediate service area for the shopping plaza.
Schools constitute a significant part of Strawberry Mansion, and were a key factor in determining site location. Both Strawberry Mansion High School (West) and Wright Richard Elementary school (East) are located within close walking proximity to the site.
Activity Node includes Strawberry Plaza and Strawberry Mansion Health Center, several SEPTA bus routes also run through this area.
Site located at 2803 West Fletcher Street is located right behind Strawberry Mansion Free Health Clinic
Fletcher Street 29
th S
tre
et
Dauphin Street Site
r
iioottt
uuuuunnnnn
31333 ,88880404040404 SSSqqq FtFtFFt
1010010101000101010101001001010100101010100110010010000101001011 0’0’0’’’0’’0’0’0’0’000000000000000000000
151151111515511511511150’0’00’’’0’0’0’00000
252525252525252252525252525550’0’0’0’0’0’0’0’0’’’’0’0’0’’000000000
15155515151515151151 0’0’0’0’0’000000
101010101010101001 0’0’0’0’0’0000100001010001101011111 000
Logan DryDesign VSzymanik 2803 West Fletcher Street
A structure for this location doesnt need to be huge, certainly not as big as the Sure Savewhich is naerby. An appropriate program forkind of space would be about 30,000 sq ft.
The corner of 28th and Fprovide the ideal access point
The corner remains open, and a strucwould be accessible from any point on both Flet
5 AM
NOON
3PM
5PM

r this
Fletcher streets would to a proposed center.
cture place on the site tcher and 28th Streets.
Division/ Open Corner
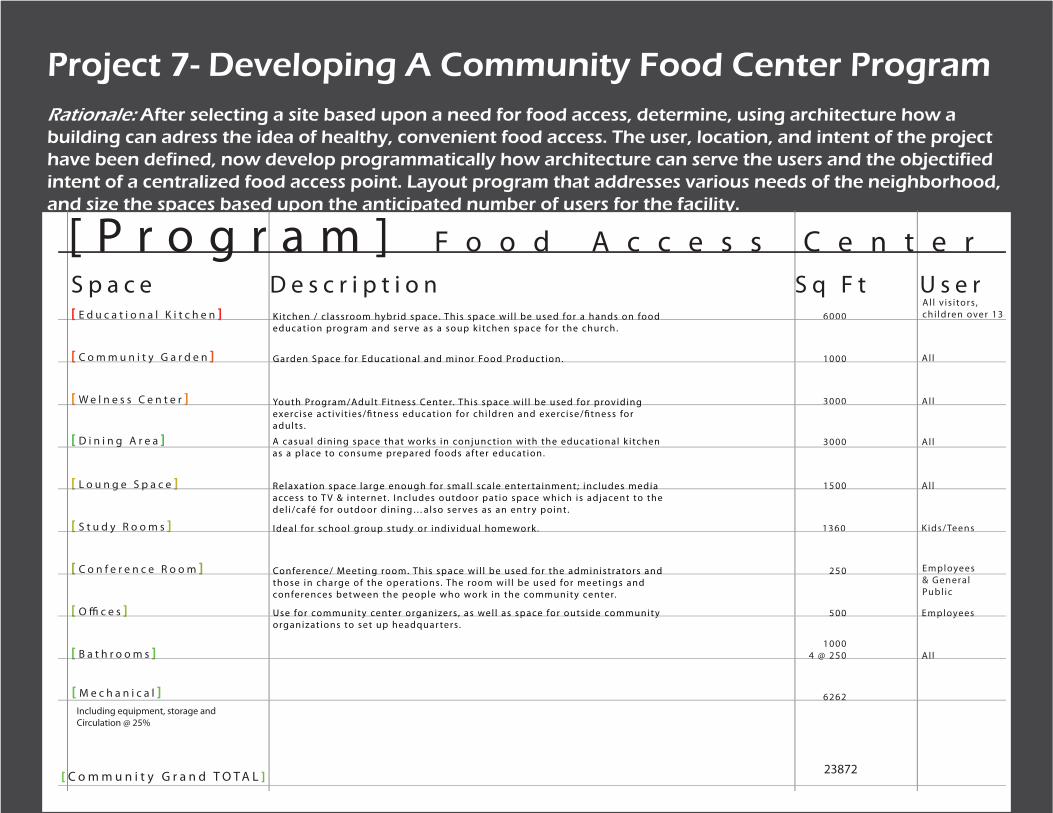
Project 7- Developing A Community Food Center ProgramRationale: After selecting a site based upon a need for food access, determine, using architecture how a building can adress the idea of healthy, convenient food access. The user, location, and intent of the project have been defined, now develop programmatically how architecture can serve the users and the objectified intent of a centralized food access point. Layout program that addresses various needs of the neighborhood, and size the spaces based upon the anticipated number of users for the facility.
S p a c e D e s c r i p t i o n S q F t U s e r[ E d u c a t i o n a l K i t c h e n ]
[ C o m m u n i t y G a r d e n ]
[ W e l n e s s C e n t e r ]
[ L o u n g e S p a c e ]
[ S t u d y R o o m s ]
[ C o n f e r e n c e R o o m ]
[ O ffi c e s ]
F o o d A c c e s s C e n t e r
[ B a t h r o o m s ]
[ D i n i n g A r e a ]
K itchen / c lassroom hybr id space. This space wi l l be used for a hands on food educat ion program and ser ve as a soup k i tchen space for the church.
G arden Space for Educat ional and minor Food Produc t ion.
Youth Program/Adult Fi tness Center. This space wi l l be used for providing exerc ise ac t iv i t ies/fitness educat ion for chi ldren and exerc ise/fitness for adults .
Relaxat ion space large enough for smal l scale enter ta inment ; inc ludes media access to T V & internet . I nc ludes outdoor pat io space which is adjacent to the del i /café for outdoor dining…also ser ves as an entr y point .
Ideal for school group study or indiv idual homework .
Conference/ Meet ing room. This space wi l l be used for the administrators and those in charge of the operat ions. The room wi l l be used for meet ings and conferences bet ween the people who work in the communit y center.
Use for communit y center organizers, as wel l as space for outs ide communit y organizat ions to set up headquar ters.
A casual d ining space that works in conjunc t ion with the educat ional k i tchen as a place to consume prepared foods af ter educat ion.
6000
1000
Al l v is i tors, chi ldren over 13
3000
1500
1360
250
500
10004 @ 250
3000
Al l
Al l
Al l
K ids/Teens
Employees & General Publ ic
Employees
Al l
Al l
[ P r o g r a m ]
1000G arden Space for Educat ional and minor Food Produc t ion.[ y ]
6000K itchen / c lassroom hybr id space. This space wi l l be used for a hands on food [ ]
g
[ ] Youth Program/Adult Fi tness Center. This space wi l l be used for providing 3000 Al l
[ g p ] Relaxat ion space large enough for smal l scale enter ta inment ; inc ludes media 1500 Al l
[ ] Conference/ Meet ing room. This space wi l l be used for the administrators and 250
[ y ] Ideal for school group study or indiv idual homework . 1360 K ids/Teens
[ ] 4 @ 250 Al l
[ ] Use for communit y center organizers, as wel l as space for outs ide communit y 500 Employees
[ M e c h a n i c a l ] 6262Including equipment, storage and Circulation @ 25%
[ C o m m u n i t y G r a n d T O T A L ]23872

The Food Commons Programmatic Analysis- Food Distribution
Distribution & Delivery Outpost
Cafe/ Deli
Farmers Market
Composting Center
Food Distribution Total
Storage SpaceSorting and PackagingLoading DockParking for distribution trucks
Formal Kitchen Preparation AreaEating spaceRestrooms
Net Market spaceCirculationStorage Area for packing
Machinery/Utility areaWaste Storage Bin spaceDistribution/dispersal storage
20001000500500
300 1505002 @ 150
10001000500
5005001000
Sq FtSpace
This area is aimed at being a small scale distribution warehouse of fresh and local food for surrounding corner stores and retailers. The concept of the space is twofold; provide an economic means of viability for the center itself, and distribute free meals as a means of goodwill.
The cafe and deli will serve as another means of viability for the community center. This cafe will be acessible from both inside and outside of the center, making it an alternative choice to KFC and Checkers for a prepared meal choice. Within the center the cafe will be located around the lounge and other main areas for convenient access to a delicious and healthy snack or meal.
Vendors have the option of selling produce seven days a week. The marketspace will be a hybrid between and enclosed and open air market system. Instead of paying a fee for the use of the space, farmers are required to provide the center a predetermined amount of produce to be used in both the cafe and educational kitchen.
Space will consist of small scale composting machine and utility area. Organic waste from within the center, as well as anyone else that brings it, will be turned into compost. This compost can be used within the community garden, and will be distributed to any-one else in the community.
Special notes/adjacenciesUser
Employees
Employees & The Public
Produce Vendors & Public
Employees & The Public
@ 20% circulation
11,700
1250
4000
2500
2000

Project 8- Identifying 12 Users of the Architecture/ProgramRationale: After selecting a site based upon a need for food access, determine what kind of users will actually use a food access center. Given site characteristics and the overall neighborhood, develop 12 possible users and identify the paths they might take to get to the site. Once on the site, map out the paths and portions of the site that the users might take and further develop the program to fit these users needs. For each user create a name, demographic, profession and pinpoint a physical home location. Form there design spaces within the food center that could accommodate a user’s habits and needs.
Circulation Section Circulation Section
Circulation SectionCirculation Section

User interactions & High Activity Nodes
Circles designate areas in which multiple user paths cross. This information can be used not only to determine the physical design of these moments, but also to locate significant program adjacencies as far as convenient access to spaces is concerned.

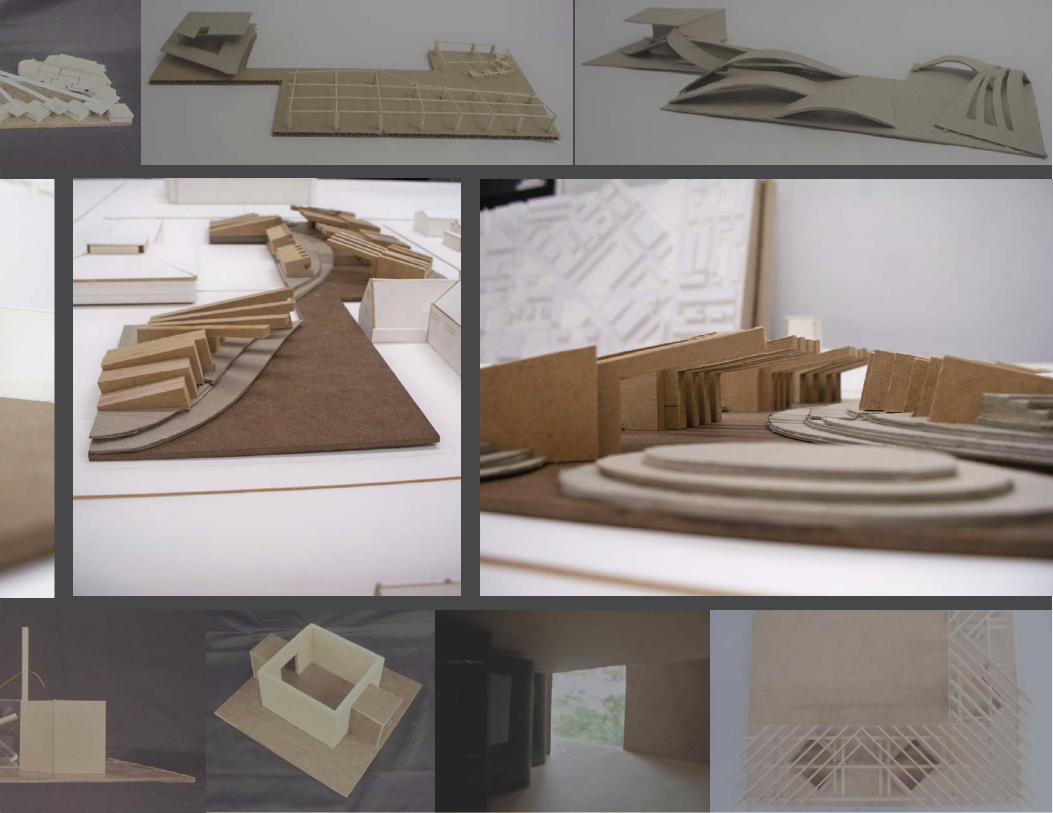
Midterm- Initial IdeasRationale: With the user, site location, and program determined, translate all of this contextual research into architecture. Develop a building that can be placed on the site and responds to the 12 users previously developed, as well as the surrounding context of the neighborhood. The building should take into consideration the aspects of healthy food access and education, as well as designing in such a way that the preceding ideas on food are exemplified.
This was an opportunity for the 5-6 weeks of research to translate into architecture in its roughest and simplest forms. The concepts developed in regards to a building remained mostly in sketch and massing form. I decided based upon the geometry of the site, that my building would exemplify the idea of outdoor space working in conjunction with an open air farmers market. The initial design concept takes into consideration how a complex of small buildings can work together as a whole to emphasize a central outdoor space; this outdoor space could then become a focal point and draw people into the space.

MomentsAmbiguous Circulation
Sectional Perspective 1/4”-1’
Free, or ambiguous circulation allows the user to pass between spaces as they wish, rather than having a processional or defined circulation pathway. I intend to create this moment of indecisiveness by separating program into separate building elements, united by various means of circulation. Therefore, in passing from one element of program to another, the path can change each time.
“Open to more than one interpretation; having a double meaning.”Moments
Framed Views “Specially placed voids that highlight details within a larger composition.”
28th & Fletcher St. Perspective 1/4”-1’
Plan-1/4”-1’
28thhhhh &&&&& FFFFFFFFFFFFFFFFFFFFFFFleeettttcccchhhheeeeerr Stt.. PPeeerrrssspppeeecctttiiivvvveeeeeeeee 1///44444444””-1’
MomentsVisual Connection “In being able to view people, their activities, and use of another space, a
connection of space exists.”
Sectional Perspective 1/4”-1’
The garden as a centralized, connecting space will serve as a way to visually connect seperate areas of the program. Within one space, a user will be able to see activities and people in other spaces across the garden. Hence, the separate elements of program, instead of being solely isolated, will feel unified and part of a larger whole.
MomentsConcentrated Light “A small, concentrated amount of light, in contrast to a dark space, will
draw a user into a space.”
29th St. Sectional Perspective 1/4”-1’
Light, even in a small concentrated amount, gives depth to a space. To the left, the dark space appears to be more flat and less intersting than the lit passageway on the right. The juxtaposition of lighting conditions, shows how the method used in the righ can act as a way to draw people into the center of the building from the street. A tiny amount of bright light can catch the eye and create visual interest against the darker more static spaces.

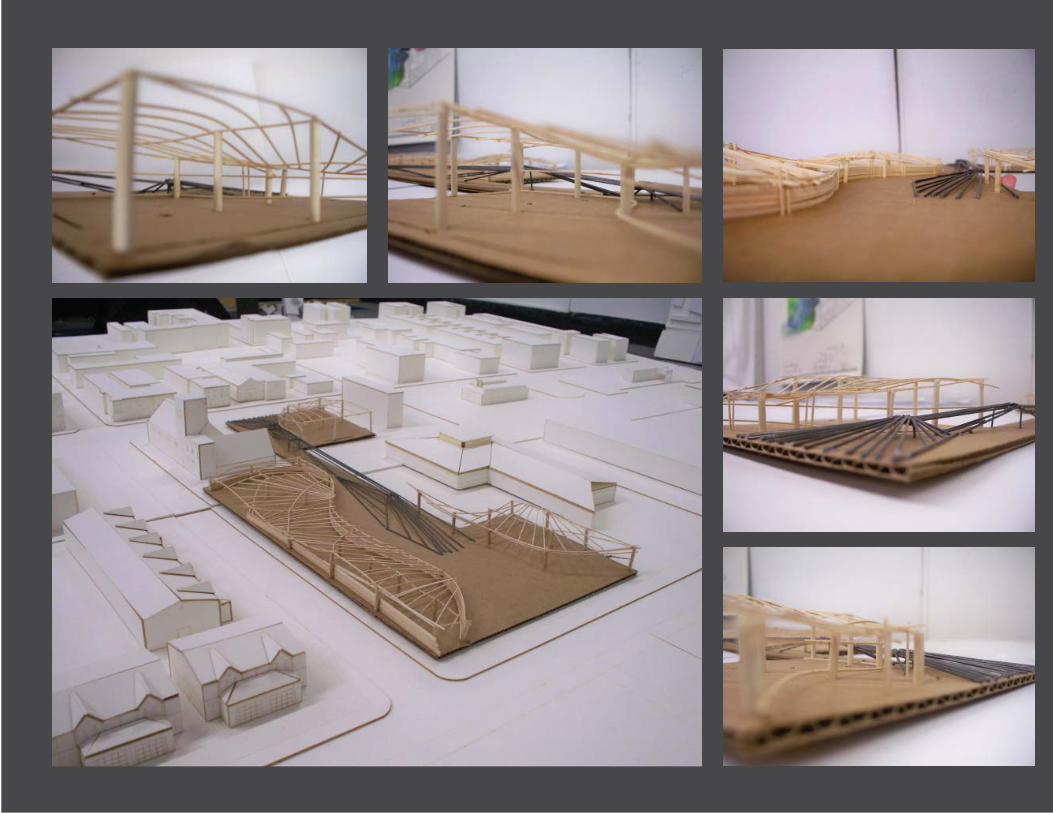
Above: Images represent study models of building massing and programmatic layout on the specific site of 2803 West Fletcher St. in Strawberry Mansion. The ideas expressed were that of free corner, permeability, market threshold, structure, and curvilinear geometry respectively.
Center: Midterm design was the result of countless study models and diagramming in response to a food oriented program in our site at Strawberry Mansion. I wanted to create a building that had no defined entrance, and was focused on a centralized courtyard garden and farmers market.
Below: Conceptual moment models representing ideas on free circulation, market arrangement, framed views, connection of spaces through garden space, and concentrated light respectively.
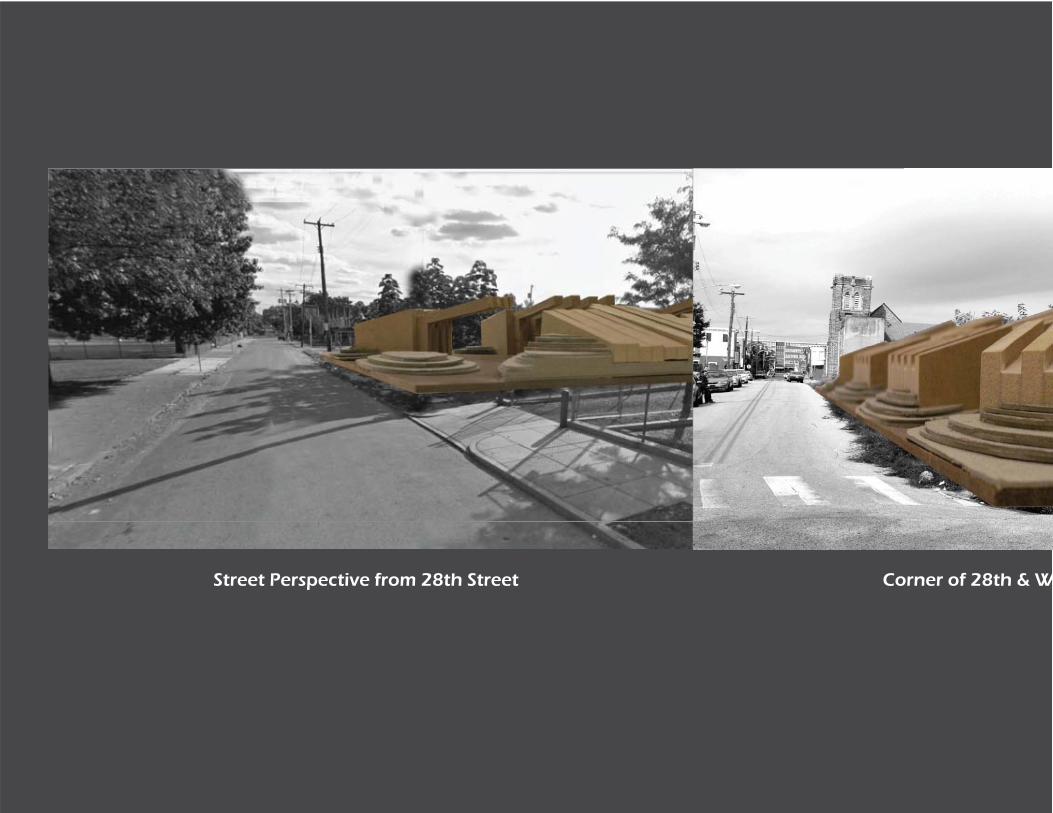
Street Perspective from 28th Street Corner of 28th & W

West Fletcher Streets Church Entry from 29th Street

Moving Towards a ResolutionRationale: Resolve programming issues, and reconsider building form in regards to how it responds to site context. Consider how programmatic placement can work with or against specific areas on the site in regards to attracting users.
Thesis defined: The proposed project intent is to introduce into the community a long term solution that embodies an attractive, contemporary, and affordable approach to food access. The solution includes a healthy food access point, promoting healthy affordable food choices. Incorporated with the food access will be a food education and awareness sector, focused on hands on instruction; this must be engaging for all age groups. Lastly, the element of a twofold food distribution center will provide marketable healthy food for corner stores, as well as community outreach through good will offering of food.
After receiving criticism at the mid review for the form of my building resembling battleships, I decided to revisit my program and layout the pieces in such a way that maintained separate buildings. What I found successful in the midterm design was that by maintaining a few separate buildings, the design was not overbearing on the site. I wanted to experiment with the idea of how landscape could be the driving force to pull someone through the site. What I developed was a “Natural Landscape Ramp” that weaved inside and outside of the various buildings within the complex. At the time this seemed like a good idea, but the geometry of the buildings clashed with the geometry of the ramp...it became too angular and hard lined. At the 3/4 review, I presented an idea with organic buildings, and a geometric ramp centralized in the site.


Initial floor plan after Mid-review...The program is divided into 4 primary buildings with an open air colonnade linking all of the buildings together. In an attempt to establish permeability on the Fletcher street elevation, I added a series of strip glazing that cut through the walls, roof and interior walls. The overall effect however was a choppy and very angular programmatic layout that made for awkward spaces within and entrances.
With the introduction of the landscape ramp in the center of the site, it allowed me to group the program into larger chunks and open up the center of the site for a larger garden space and courtyard. The program was grouped based upon what elements of the program were to be used by specific users. The 29th street portion of the site contained spaces that were meant to attract locals and people from outside the area, areas include a cafe, 2 story lounge and administrative offices. On the 28th street portion of the site, the attraction was for locals and school kids, so items such a farmers market, dining room, educational kitchen and study room. By defining these two user groups it helped me to locate my program and size it appropriately.


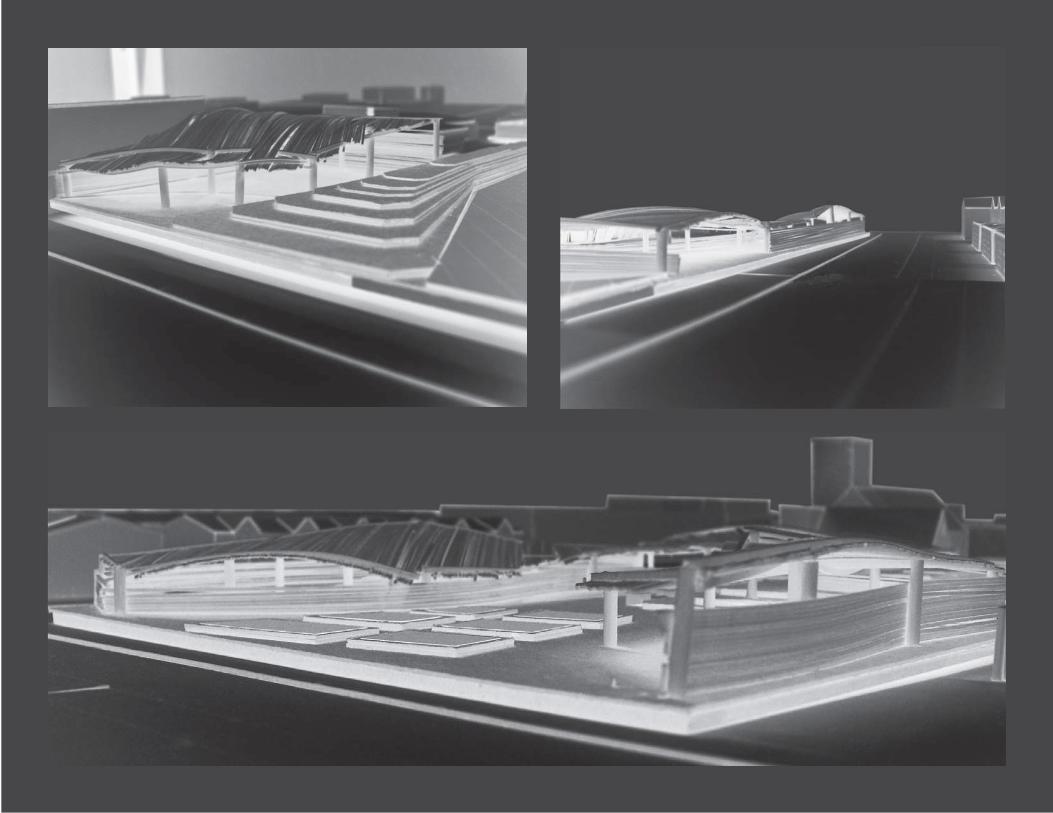
The structure of the roof took on a rolling organic form. The construction was light and very articulate, just as the initial form of the ramp which is represented in the piano wire.

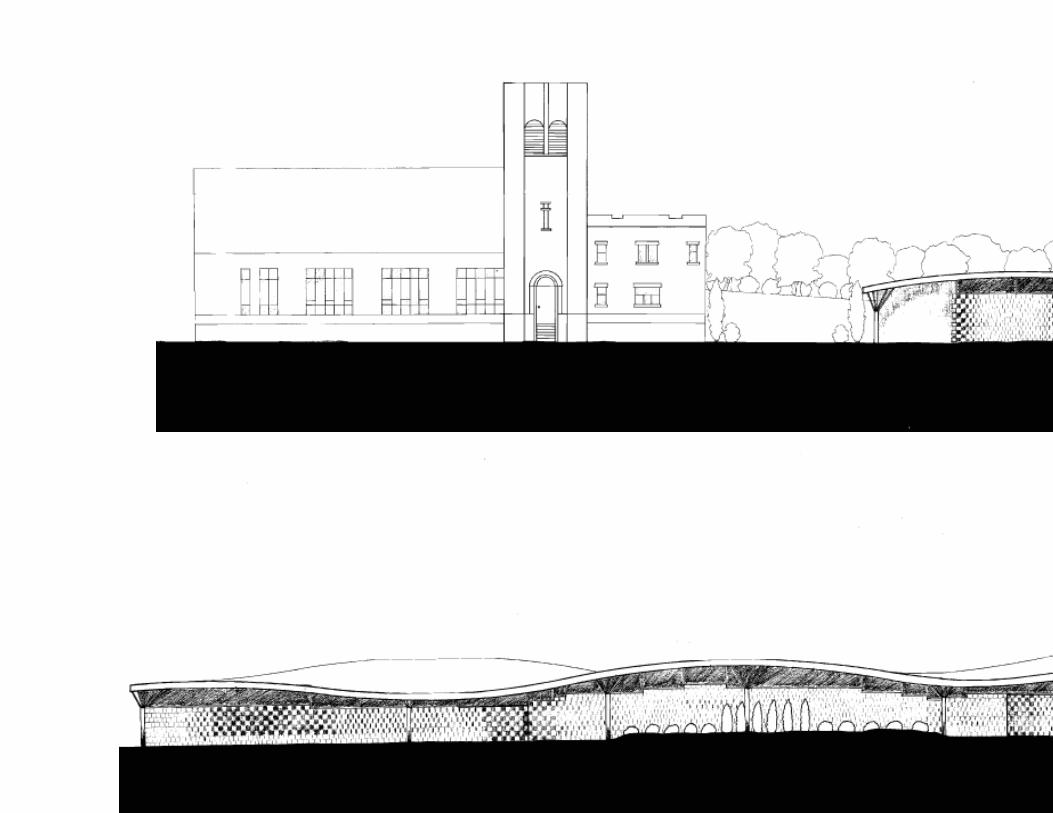
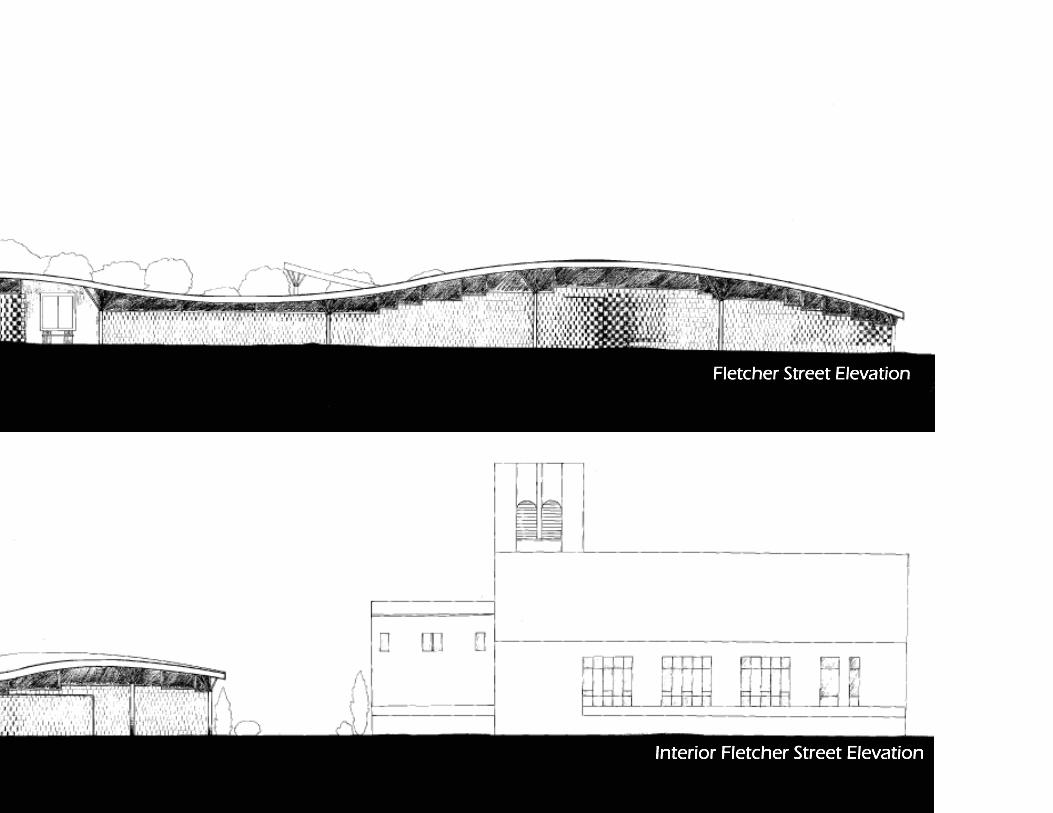
Sketch Elevations based on models

Proportional Sketch Elevations


Facade studies generated by the amount of light needed within each programmatic space. I developed a facade system that provided openings of varying sizes, depending on the amount of light a space needed. Aesthetically I wanted the facade to read as a gradient.

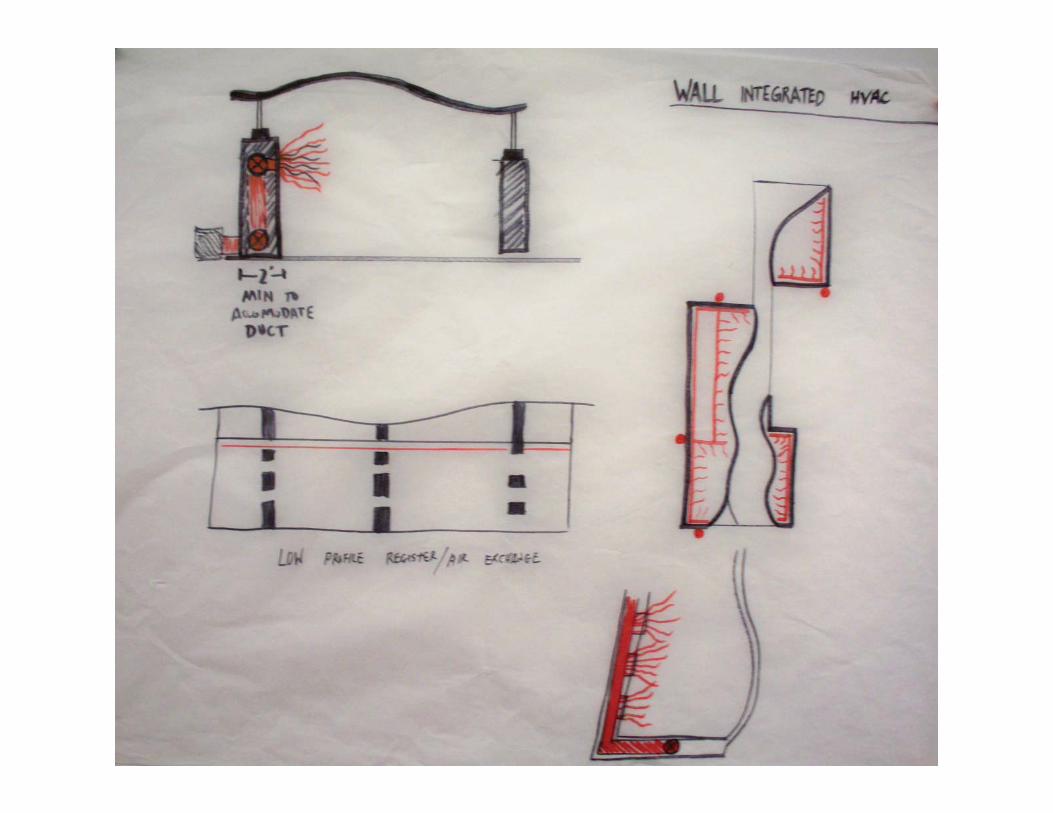
Here I examined some technical building systems that could be used in the complex. Above is a rainwater collection system that would be integrated into grey water use in the building, and irrigation outside for the community garden. To the right is a modular lighting system that would contour to the curved roof line. The lighting would produce a soft ambient glow in the form of indirect up lighting, and would mimic the effects of natural lighting on the interior roof surface. On the next page I located HVAC ducts so that they would not interfere with the glazing and block facade that I later developed.

My initial facade consisted of long wooden strips, which worked with my idea of continual unbreakable facade, however, it inhibited me from integrating fenestration without the fenestration looking choppy and forced.

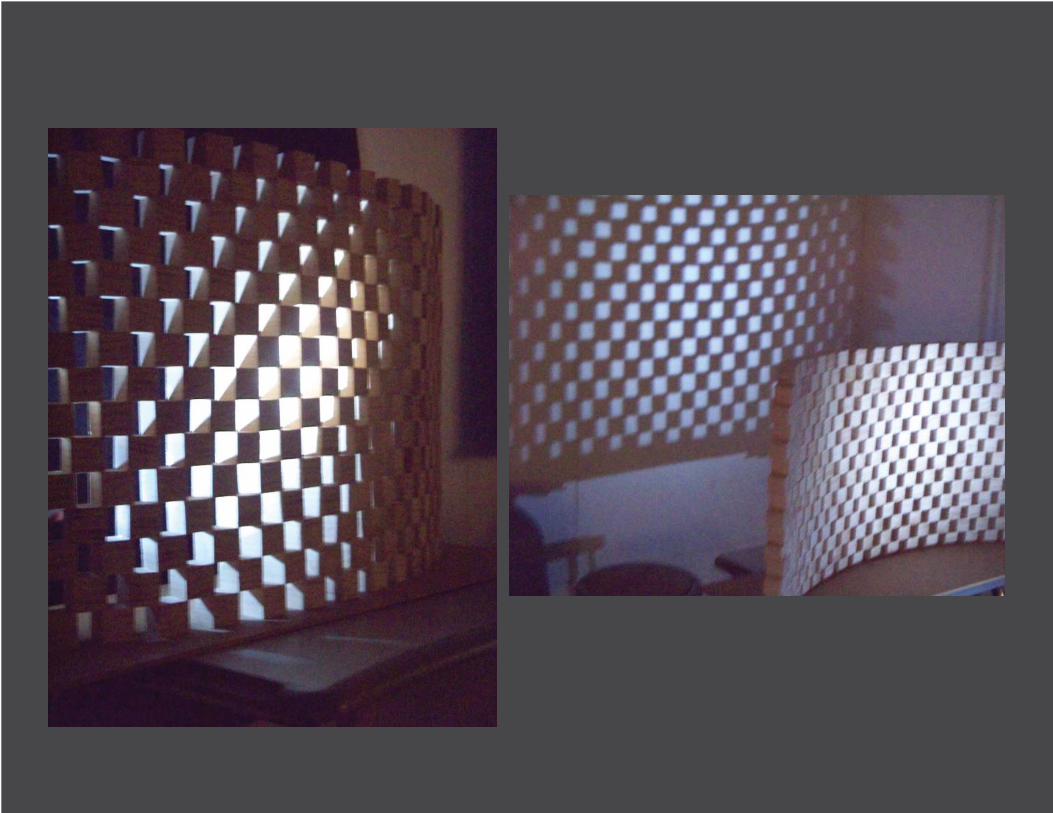
A facade composed of wooden 6”x 6” units was more successful in creating a continuous facade while at the same time inte-grating fenestration. The spacing between the blocks denotes the type of program behind that portion of the facade-- larger spaces indicate a greater need for light and views like in the dining and study room, while areas with no or very minimal spacing are those in which light and views are not needed like in service areas or restrooms.

Final- The Food Commons at 2803 West Fletcher StreetRationale: Final compilation of drawings, models, site context, and presentation to address the aforementioned thesis.
By creating a natural bridge between 28th and 29th streets, users, both local and non-local, will be drawn through the site to the educational garden, the main feature of the program. From here, they will see how the food goes from the garden to the kitchen, then dining and market areas. The landscape articulates a path for all users to follow, linking elements of program centered around the community garden.

2nd Floor Cafe
1st Floor Plan


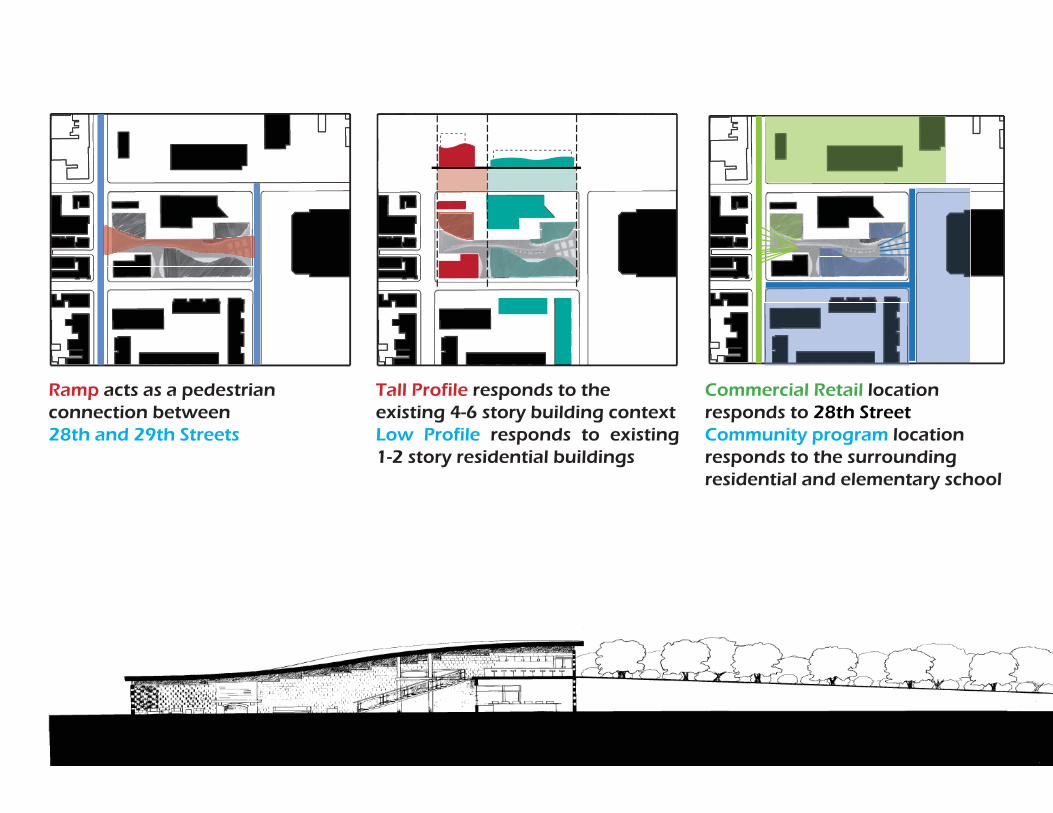
Ramp acts as a pedestrian connection between 28th and 29th Streets
Tall Profile responds to the existing 4-6 story building contextLow Profile responds to existing 1-2 story residential buildings
Commercial Retail location responds to 28th Street Community program location responds to the surrounding residential and elementary school


DLDDR