Embed Size (px)
Citation preview
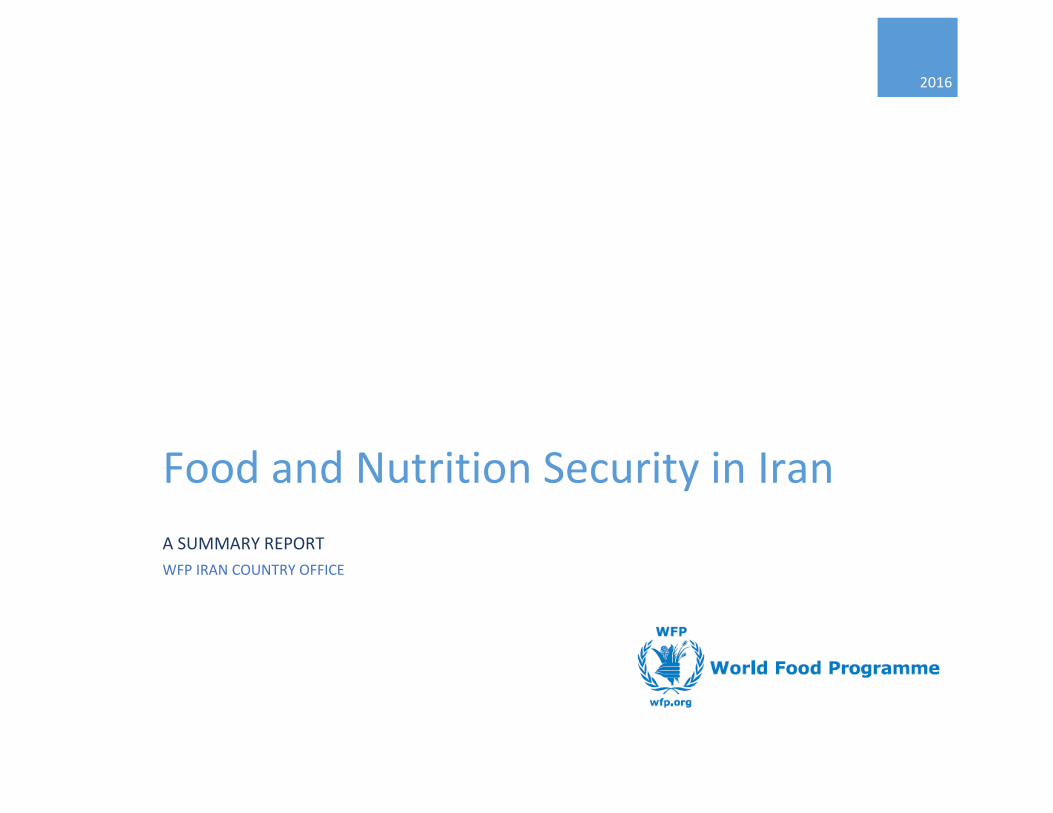
2016
Food and Nutrition Security in Iran
A SUMMARY REPORT
WFP IRAN COUNTRY OFFICE

1
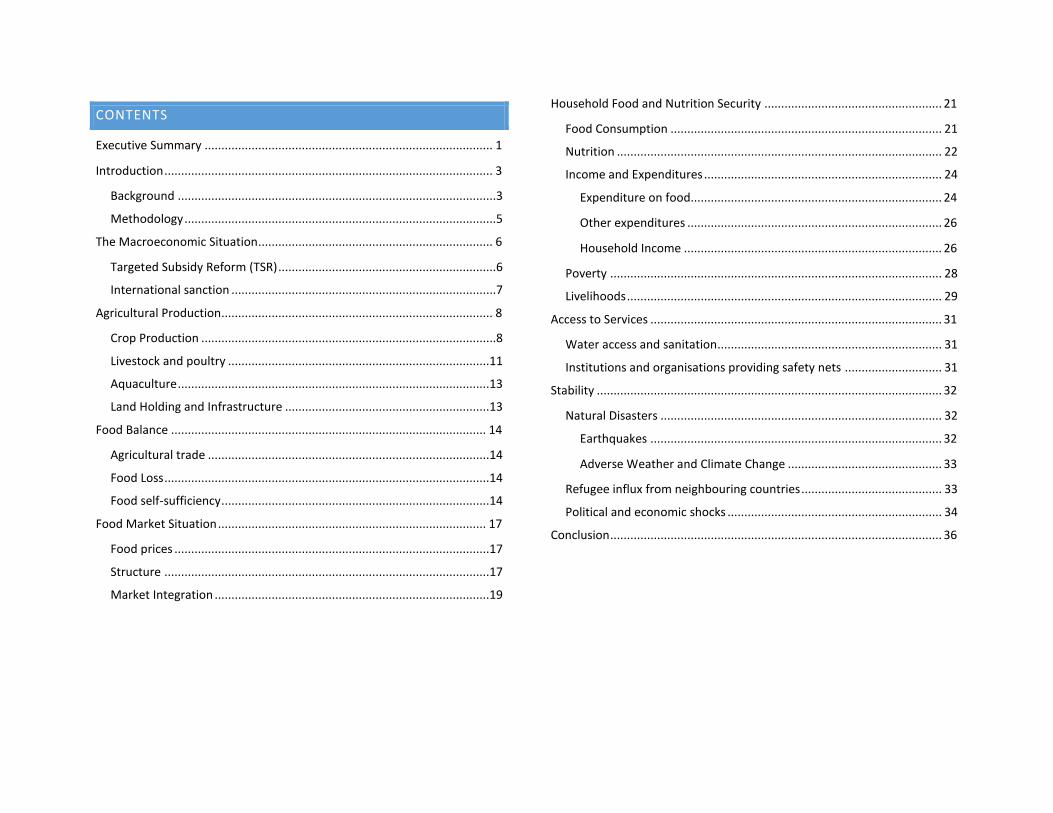
CONTENTS
Executive Summary ...................................................................................... 1
Introduction .................................................................................................. 3
Background ...............................................................................................3
Methodology .............................................................................................5
The Macroeconomic Situation ...................................................................... 6
Targeted Subsidy Reform (TSR) .................................................................6
International sanction ...............................................................................7
Agricultural Production................................................................................. 8
Crop Production ........................................................................................8
Livestock and poultry ..............................................................................11
Aquaculture .............................................................................................13
Land Holding and Infrastructure .............................................................13
Food Balance .............................................................................................. 14
Agricultural trade ....................................................................................14
Food Loss .................................................................................................14
Food self-sufficiency ................................................................................14
Food Market Situation ................................................................................ 17
Food prices ..............................................................................................17
Structure .................................................................................................17
Market Integration ..................................................................................19
Household Food and Nutrition Security ..................................................... 21
Food Consumption ................................................................................. 21
Nutrition ................................................................................................. 22
Income and Expenditures ....................................................................... 24
Expenditure on food........................................................................... 24
Other expenditures ............................................................................ 26
Household Income ............................................................................. 26
Poverty ................................................................................................... 28
Livelihoods .............................................................................................. 29
Access to Services ....................................................................................... 31
Water access and sanitation................................................................... 31
Institutions and organisations providing safety nets ............................. 31
Stability ....................................................................................................... 32
Natural Disasters .................................................................................... 32
Earthquakes ....................................................................................... 32
Adverse Weather and Climate Change .............................................. 33
Refugee influx from neighbouring countries .......................................... 33
Political and economic shocks ................................................................ 34
Conclusion ................................................................................................... 36
List of Figures
Figure 1. USD Exchange Rate (Iranian Rial) ....................................................... 6
Figure 2. Crop Production Trends for six major crops, 1978-2013 (MT) ........... 8
Figure 3. Grain Production (metric ton) and Acreage (hectare) Trends ............ 9
Figure 4. Vegetable Production and Acreage Trends ........................................ 9
Figure 5. Production Trends of Animal Protein Products ................................ 12
Figure 6. Per-capita production livestock and poultry products ..................... 12
Figure 7. Share of Farmers and Land Owned by Farm Size in 2014 ................ 13
Figure 8. Food supply and self-sufficiency rate ............................................... 15
Figure 9. Self-Sufficiency rate (%) – Cereals and Tuber ................................... 15
Figure 10. Self-Sufficiency rate (%) – other foods ........................................... 15
Figure 11. Food supply – kcal contribution of food groups ............................. 16
Figure 12. CPI Trends 2000-2014 .................................................................... 17
Figure 13. Price Trends – Tomatoes by province ............................................ 20
Figure 14. Price Trends – Ploughing irrigated land by province ...................... 20
Figure 15. Share of Food Groups consumed in 2006 & 2012 by Income Decile ............................................................................................................... 21
Figure 16. Share of Food Groups consumed by Income Decile ....................... 22
Figure 17. Annual household expenditure (food and non-food) and food expenditure share .................................................................................. 25
Figure 18. Food expenditure share by province (in 2012, Urban) ................... 25
Figure 19. Non-Food Expenditure (%, average of the years 2000-2012) ........ 26
Figure 20. Provincial contribution to GDP and population ............................. 29
Figure 21. Employees distribution in three main sectors by Province, 2011 .. 30
Figure 22. Unemployment rate by Province, 2013 ......................................... 30
Figure 23. Consumer Price Index Urban and Rural (base year 2000 = 100) .... 34
Figure 24. Monthly changes of urban consumer price index 2012-2014 ........ 35
Figure 25. Urban Consumer Price Index Total and Food, % change between 2007 and 2013 ........................................................................................ 35
Figure 26. Rural Consumer Price Index Total and Food, % change between 2007 and 2013 ........................................................................................ 36
List of Maps
Map 1. Iran Administrative Map ....................................................................... 2
Map 2. Population Map (Landscan 2015) ......................................................... 4
Map 3. Land use map ........................................................................................ 4
Map 4. Grain production in 2013 (MT) ........................................................... 11
Map 5. Per capita grain production in 2011 (kg) ............................................. 11
Map 6. Livestock Production in 2014 .............................................................. 13
Map 7. Road Network and Road Density ........................................................ 19
Map 8. Child Malnutrition ............................................................................... 23
Map 9. Seismic Map of Iran ............................................................................ 33
Map 10. Refugee Population in Iran ............................................................... 34 List of Tables
Table 1. Percent change in production, acreage and yield between 2005 and 2013 ....................................................................................................... 10
Table 2. Share of irrigation and rain-fed acreage and production, Yield ratio of irrigation to rain-fed ............................................................................... 10
Table 3. Food Balance Sheet Iran, 2011 .......................................................... 16
Table 4. Malnutrition among children under five in selected Provinces ......... 23
Table 5. Micronutrient Deficiency Rates (%) ................................................... 24
Table 7. Inflation rates, changes in wage/salary and food basket expenses 2004-2013 .............................................................................................. 27
1
EXECUTIVE SUMMARY
Iran is an upper middle-income country, with the population of 75 million. The population resides predominantly in urban area where seventy-one percent of the total population is found. The country is bordered by seven countries, namely Afghanistan, Armenia, Azerbaijan, Iraq, Pakistan, Turkey and Turkmenistan. The country has the next largest economy in the Middle East, after Saudi Arabia with large reserves of natural gas and crude oil.
Iran has gone through economic downturn over the past years due to prolonged international sanctions. Soring food prices and subsidy cut have directly affected the food security situation among the poor and vulnerable population. The international sanctions have been lifted since 2016, though the positive impacts on the Iranian economy are yet to be materialized.
The country is prone to various food security shock factors. Among others, volatile agricultural production, food price hike, natural disasters like earthquakes, floods and droughts, and political instability of the neighbouring countries would have a negative impact on food security of the population.
This report aims to describe the current food and nutrition security situation and vulnerability factors in Iran, identifying geographical areas of concern and the population groups that would be most adversely affected by food insecurity shocks or relevant risk factors. The report is prepared based on secondary data analysis. It should be noted that access to relevant data and information is limited, and the available data from various sources was not always consistent or complete, which reduces the validity of the report.
Agriculture accounts for some eight percent of GDP, absorbing 19 percent of the labour force. The country is an important agricultural producer, ranking among the top 20 producers in the world for several agricultural commodities. The agricultural production reached its peak in 2007, but suffered from a severe drought in 2008 and the level of production has not recovered fully. Consequently, the country increasingly relies on food import with the self-sufficiency rates hovering around fifty percent lately. The country has a greater potential to increase the agricultural production. Among others, efficient use of water resources, reduction of food loss, and
further improvement on transportation infrastructure are key issues to be addressed to achieve this.
Based on the available data, household food security situation has been stable though the vulnerability to food insecurity has increased over the past years. Food price hike, subsidy cut and high levels of un/under employment due to economic downturn have limited the population’s economic access to nutritious food. Iran is relatively an equal country with a low Gini coefficient, but a number of population is considered to be just above the poverty line, which is to say that a further deterioration would push the vulnerable population into poverty. Micronutrient deficiency, particularly vitamin-D deficiency is prominent among pregnant women and young children.
National social protection/safety-nets systems cover the Iranian citizens, though their coverage has become increasingly limited due to the budget constraints of the government. Subsidy cut that was initiated in 2010 has contributed to escalating the inflation, whereas the income level has not kept up with the price hike, and consequently lowering the population’s purchasing power. It is worth noting that refugee population is among the hardest hit by the cut – they used to have access to staple goods at subsidized prices, which is no longer available, and they are not eligible to benefit from national safety-nets such as targeted cash transfers that have been introduced to compensate the subsidy cut.
The food security and nutrition situation varies by geography and demography. Remote rural provinces with low agricultural production and limited income generating opportunities are more vulnerable to food insecurity. Sistan va Bulchestan province, for instance, scores the worst for all the dimensions of food security – availability, access, utilization and stability. Densely populated urban areas with a high risk of earthquake, including Tehran, deserve a special attention, given that the consequence of any large-scale earthquakes would result in a catastrophic situation that may require international assistance. The poor and vulnerable, refugees are the most vulnerable to economic shocks. Pregnant women and young children are prone to malnutrition, whereas the youth is exposed to a high level of unemployment.
2
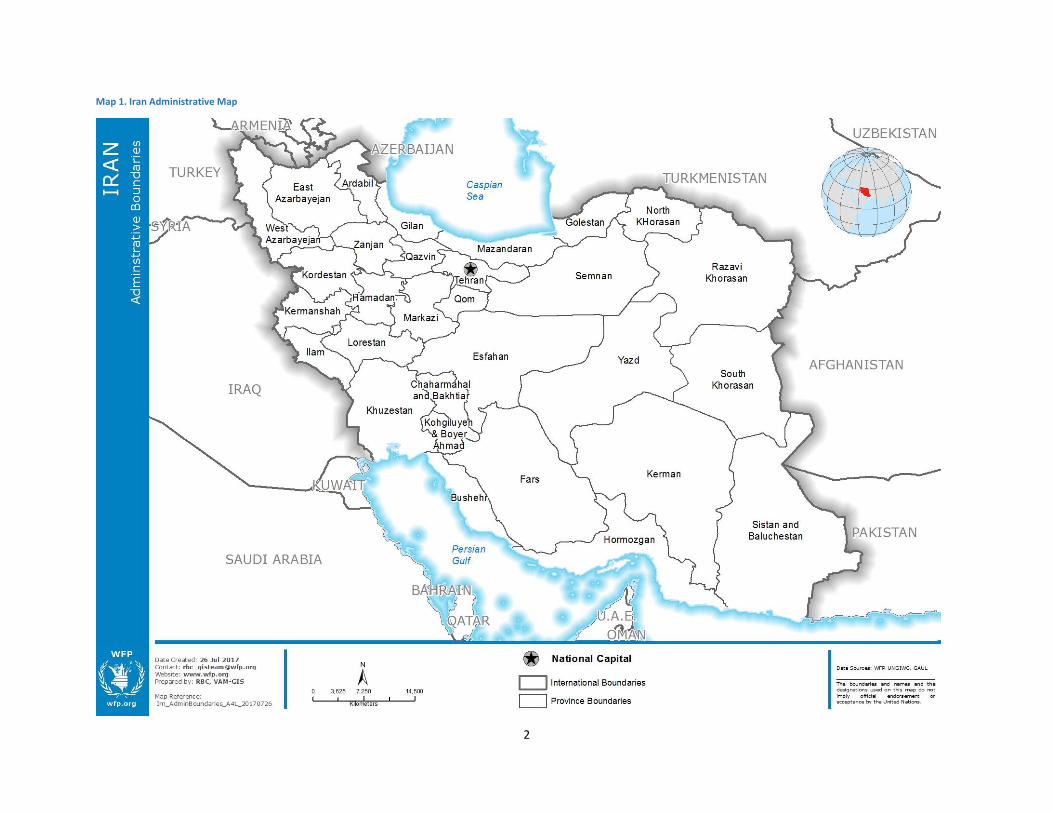
Map 1. Iran Administrative Map
INTRODUCTION
BACKGROUND
Iran is an upper middle-income country, with the population of 75 million. The population resides predominantly in urban area where seventy-one percent of the total population is found. The country is located in the central location in Eurasia, Western Asia and the Strait of Hormuz, bordering Turkmenistan on the north, with Kazakhstan and Russia across the Caspian Sea, on the east by Afghanistan and Pakistan; on the south by the Persian Gulf and the Gulf of Oman; on the west by Iraq; and on the northwest by Armenia, Azerbaijan and Turkey. Iran is divided into 31 provinces, and each province is subdivided into counties (shahrestan). There is a total of 402 counties in the country.
Iran has the next largest economy in the Middle East, after Saudi Arabia. The country has large reserves of natural gas and crude oil and natural gas reserves, which is one of the main source of government revenue. However, due to the international sanctions the hydrocarbon sector is not operating at full capacity.
The last few years the Iranian economy has suffered from low growth combined with high inflation due to several economic shocks. In 2010 the targeted subsidy reform was rolled out, replacing subsides on key staples as petroleum, energy, water and bread with a monthly cash transfers to targeted households. This led to high inflation, which was further elevated by the extension of the international sanction in 2012. On 20 July 2015, the UN voted unanimously to start lifting the sanctions given the successful implementation of the Joint Comprehensive Plan of Action between Iran and the group of G5+1 on Iran’s nuclear programme.
Since the 1980s, Iran has received a number of refugees from Afghanistan and Iraq, hosting one of the largest refugee populations in the world. Since 2002 Iran has cooperated with UNHCR, WFP and the government of Afghanistan to implement a voluntary repatriation plan. After a successful start, the number of voluntary repatriation has fallen to almost nil by 2014. The number of registered refugees is close to one million in 2014, but some estimate the total number of Afghans to be over two million. At the same
time, the escalation of conflicts in the region, both in Afghanistan and the region at large, could cause new waves of refugees. Although Iran has long experience of hosting refugees, its capacities are already stretch to the limit.
Iran has suffered more than 130 earthquakes with a magnitude of 7.5 on Richter scale or above the last seven decades. In the 20th century alone, more than 150,000 human lives have been lost. Several cities, including Teheran, are located in high seismic activity zones. Tehran has been struck by devastating earthquakes several times in the past, with the last earthquake above 7 on Richter scale was in 1830. In response, Iran has developed notable capacity in disaster preparedness, and Disaster Risk Reduction is a high priority at the national level. Nevertheless, a strong earthquake in densely populated urban areas would have disastrous impact, which may go beyond the national response capacity.
WFP Iran has been operational since 1987, providing targeted food assistance to some 30,000 Afghan and Iraqi refugees living in 19 settlements across the country. As part of the Emergency Preparedness activities, WFP has developed the Concept of Operations (CONOPS) for Iran, under two risk scenarios: i) influx of refugees from Afghanistan; and ii) earthquake in urban area. Given the high risk of the two scenarios, a food and nutrition security baseline analysis is to be carried out to better understand the food and nutrition security situation and vulnerability factors in Iran.

4
Map 2. Population Map (Landscan 2015)
Map 3. Land use map

5
METHODOLOGY
The purpose of this report is to provide the information about food security and nutrition situation and vulnerability factors in Iran, identifying geographical areas of concern and the population groups that would be most adversely affected by food insecurity shocks or relevant risk factors.
Secondary data analysis has been performed by a team of consultants led by Hamid Farahanirad who complied a detail report. The summary report has been pulled together by WFP (RBC VAM) with an overall supervision by Negar Gerami, the WFP Iran Country Director.
The report is based on a range of data and reports, focusing primarily on the period since 2000. Notable sources are the followings: official reports from the Statistical Centre of Iran (SCI), the Central Bank of Iran, and the Ministry of Agriculture and Jihad; Iranian Chamber of Commerce and International Industry Associations and Specialized Research Organizations; global datasets available from international organizations such as World Bank and FAO.
It is worth noting that access to micro data was not possible, which limits the exploratory analysis using household survey data. In addition, authors found that the data published by various entities, in some cases, is neither consistent nor complete.
This report follows the Food and Nutrition Security Conceptual Framework, within the context of the Iran. Chapter-2 outlines the macroeconomic situation of Iran, explaining the importance of the Targeted Subsidy Reform and the International Sanctions. Chapter-3 and 4 analyse the issues around food supply - agricultural production, trade, food loss and food balance. Chapter-5 discusses the food market situation. Household food and nutrition security situation is described in Chapter-6, followed by access to services (Chapter-7), and food insecurity shock factors affecting stability (Chapter-8). In the conclusion, findings from the previous chapters are pulled together to identify the vulnerability factors in Iran, highlighting the geographical areas and populations most at risk.
BOX: FOOD AND NUTRITION SECURITY CONCEPTUAL FRAMEWORK
Food security – The state at which all people, at all times, have physical and economic access to sufficient, safe, and nutritious food to meet their dietary needs and food preferences for an active and healthy life (World Food Summit, 1996).
Food and nutrition security cannot be measured by a single indicator. There are different dimensions affecting food security, and all must be taken into account to draw an accurate picture of the food and nutrition security of a country. Food security is defined as follows: “the state at which all people, at all times, have physical and economic access to sufficient, safe, and nutritious food to meet their dietary needs and food preferences for an active and healthy life” (World Food Summit, 1996). The definition of food security considered originally three distinct, but strongly interrelated pillars 1) food availability, 2) food access and 3) food utilization. Following the World Food Summit of 2009, the concept was extended to include the fourth pillar, stability, and it stressed the importance of the nutritional dimension.
This report is prepared following the WFP’s corporate Food and Nutrition Security Conceptual Framework with an attempt to provide a holistic view on food security of Iran, looking at the four dimensions - availability, access, utilization and stability at all levels (i.e. national, subnational and household levels).
6
THE MACROECONOMIC SITUATION
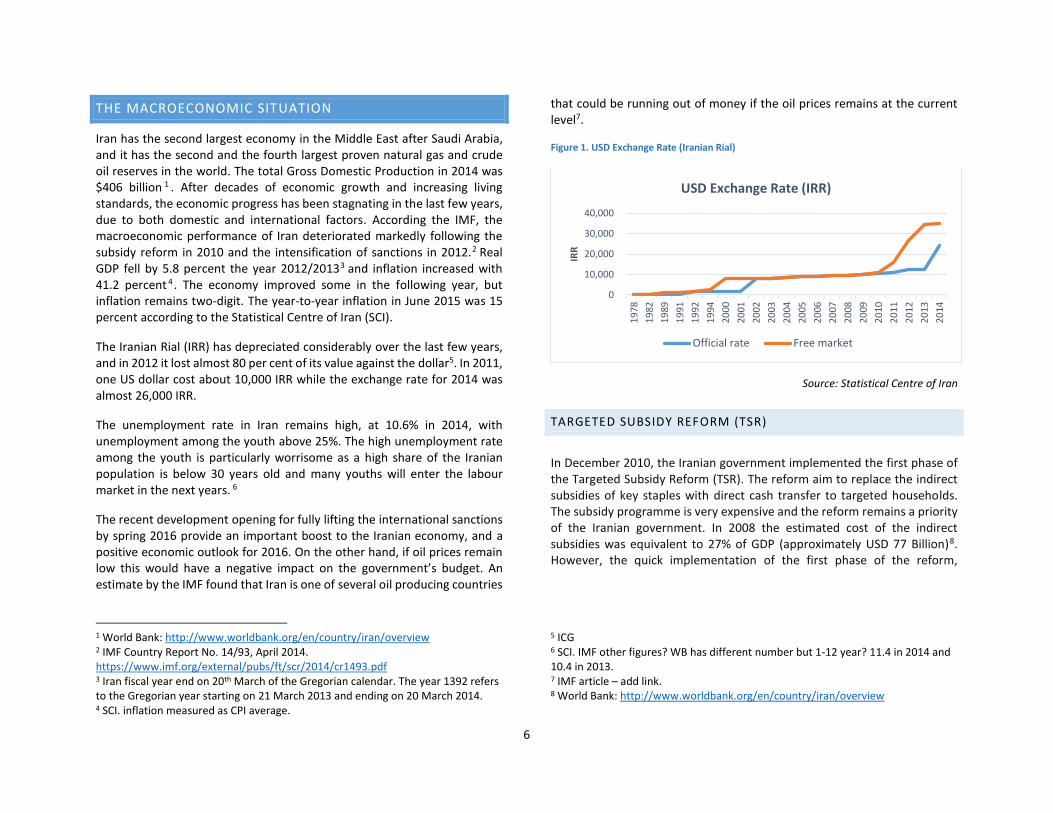
Iran has the second largest economy in the Middle East after Saudi Arabia, and it has the second and the fourth largest proven natural gas and crude oil reserves in the world. The total Gross Domestic Production in 2014 was $406 billion 1 . After decades of economic growth and increasing living standards, the economic progress has been stagnating in the last few years, due to both domestic and international factors. According the IMF, the macroeconomic performance of Iran deteriorated markedly following the subsidy reform in 2010 and the intensification of sanctions in 2012.2 Real GDP fell by 5.8 percent the year 2012/20133 and inflation increased with 41.2 percent 4 . The economy improved some in the following year, but inflation remains two-digit. The year-to-year inflation in June 2015 was 15 percent according to the Statistical Centre of Iran (SCI).
The Iranian Rial (IRR) has depreciated considerably over the last few years, and in 2012 it lost almost 80 per cent of its value against the dollar5. In 2011, one US dollar cost about 10,000 IRR while the exchange rate for 2014 was almost 26,000 IRR.
The unemployment rate in Iran remains high, at 10.6% in 2014, with unemployment among the youth above 25%. The high unemployment rate among the youth is particularly worrisome as a high share of the Iranian population is below 30 years old and many youths will enter the labour market in the next years. 6
The recent development opening for fully lifting the international sanctions by spring 2016 provide an important boost to the Iranian economy, and a positive economic outlook for 2016. On the other hand, if oil prices remain low this would have a negative impact on the government’s budget. An estimate by the IMF found that Iran is one of several oil producing countries
1 World Bank: http://www.worldbank.org/en/country/iran/overview 2 IMF Country Report No. 14/93, April 2014. https://www.imf.org/external/pubs/ft/scr/2014/cr1493.pdf 3 Iran fiscal year end on 20th March of the Gregorian calendar. The year 1392 refers to the Gregorian year starting on 21 March 2013 and ending on 20 March 2014. 4 SCI. inflation measured as CPI average.
that could be running out of money if the oil prices remains at the current level7.
Figure 1. USD Exchange Rate (Iranian Rial)
Source: Statistical Centre of Iran
TARGETED SUBSIDY REFORM (TSR)
In December 2010, the Iranian government implemented the first phase of the Targeted Subsidy Reform (TSR). The reform aim to replace the indirect subsidies of key staples with direct cash transfer to targeted households. The subsidy programme is very expensive and the reform remains a priority of the Iranian government. In 2008 the estimated cost of the indirect subsidies was equivalent to 27% of GDP (approximately USD 77 Billion)8. However, the quick implementation of the first phase of the reform,
5 ICG 6 SCI. IMF other figures? WB has different number but 1-12 year? 11.4 in 2014 and 10.4 in 2013. 7 IMF article – add link. 8 World Bank: http://www.worldbank.org/en/country/iran/overview
0
10,000
20,000
30,000
40,000
19
78
19
82
19
89
19
91
19
92
19
94
20
00
20
01
20
02
20
03
20
04
20
05
20
06
20
07
20
08
20
09
20
10
20
11
20
12
20
13
20
14
IRR
USD Exchange Rate (IRR)
Official rate Free market
7
intertwined with sanctions, had unintentional consequences, among others leading to high inflation.
The first phase of the reform reduced the subsidies of key staples such as petroleum, water, electricity and bread. The price increase of these commodities, led to an increase in general production cost, causing two-digit inflation rates. At the same time, the high inflation and uncertainty about future prices led to stockpiling of commodities, pushing prices up further.
The cut in energy subsidies hit the industrial sector particularly hard. To compensate the industry for the loss of cheap energy, 30 per cent of the reform budget was initially earmarked for them. However, the industry did not receive the promised support, causing a decrease in the domestic production at the same time as the intensification of the sanctions. To ensure sufficient supplies, the government allowed import that made it impossible for Iranian manufacturing companies to compete, leading to layoffs and higher unemployment9.
Initially around 64 million Iranians received the cash transfer of approximately $45 per month, but a more target approach was introduced in 2013, limiting the cash transfer to low-income households. Although the direct cash transfer has been important to poor and large households, particularly in rural areas, it has not been adjusted at the same rate with the inflation.
The TRS also aimed to reduce the consumption of energy. Initially the energy consumption fell significantly, but as the inflation caused a decline in real energy prices the consumption of energy went up again. Energy prices are still heavily subsidised. In 2014, Iran started the implementation of the
9 Crisis Group International. Middle East Report 138, 25 February 2013 “Spider Wed: The Making and Unmaking of Iran Sanction”
second phase of the reform, increasing the price of petroleum with 75%, but the price of petroleum is still far from the target.
INTERNATIONAL SANCTION
In July 2015, the G5+1 (i.e., China, France, Germany, Russia, United Kingdom and United States) and Iran agreed on the Joint Comprehensive Plan of Action (JCPOA). The JCPOA will lead to the lifting of the international sanctions by spring 2016 if implemented successfully.10 This would have a significant impact on the Iranian economy. However, the complexity of the situation and the myriad of sanctions means its successful implementation is not guaranteed.
The international sanction of Iran consists of numerous different legal frameworks which have developed and evolved since the early 1980s. The sanctions have been introduced in several waves, and implemented by different governmental and institutional bodies. The final wave of sanctions started in 2010, with implementation of some of the harshest and far-reaching sanction in 2012. In a February 2013 report from the International Crisis Group, the situation was described as following: “The patchwork of sanctions now imposed on Iran is impressive. It has effectively impaired its main source of income, the export of oil and petroleum products; cut off its banking infrastructure from the global financial system; forced it to engage in inefficient barter deals; and stymied imports of dual-use goods, but also indirectly in some cases basic food staples and medicines”11
One of the priority targets of the sanction has been the gas and oils export, which is the main source of government’s revenue. Iran has the 2nd largest natural gas reserve in the world, and 4th largest crude oil reserve. However, the sanction has reduced Iran’s export as well as production capabilities significantly. The average oil export fell from 2.5 million b/d in 2011 to under 1 million b/d in January 2013. Furthermore, even with the lifting of sanction
10 UNSCR 2231, passed on 20 July 2015, sets out a schedule for suspending and eventually lifting UN sanctions, with provisions to reimpose UN sanctions in case of non-performance by Iran, in accordance with the JCPA. 11 International Crisis Group, p 18.

8
it would take Iran several years to return to the previous production rate of nearly four million barrels a day (b/d).
International financial transaction has been another important target of the sanction which has had a strong impact on the Iranian economy. Although the sanction did allow for transaction for sale of medicine, and exemptions was provided following the earthquake of 2012, the complexity of the sanction has led international banks to avoid all transactions. To stay on the safe side, most international banks were reluctant to carry out transactions with Iranian banks to avoid getting entangled in the sanctions. Consequently, Iran has engaged in barter trade to omit the sanctions.
Under the negotiation for the Joint Plan of Action (JPA), partial lifting of the sanctions was enacted in 2013. This included among other a partial relief of Iran’s oil exports and international bank transactions. Further steps to lift the sanction has been made following the JCPOA in July 2015.
AGRICULTURAL PRODUCTION
Globally, Iran is a significant producer of agricultural products. It is among the top twenty producers for a range of commodities, including wheat (11th), vegetables (6th), chicken (7th), dates (2nd) and potatoes (11th) 12 . Overall, production has been increasing steadily since the late seventies, with a few exceptions 13 . In 2008, severe frost and drought caused a sharp drop in production, particularly for grains and legumes, which has not reached the same level again.
The Ministry of Agriculture Jihad stated goal is for Iran to become self-sufficient for a range of products, including wheat, barley, maize, oil seeds, sugar beet, sugar cane, poultry meat, red meat, milk, eggs. However, comparing 2006 with 2011, the production per capita has fallen in almost all
12 FAO, 2012 data. Appendix. http://faostat.fao.org/site/339/default.aspx 13 (Table 1.2 and graphs)
the agricultural sub-sectors14. Further efforts to strengthen the agricultural production would be needed to achieve self-sufficiency.
CROP PRODUCTION
Crop production has increased over the past decades. The drought in 2008
severely affected the production of grain and industrial crops, and the
production of recent years has not reached the pre-drought level.
Figure 2. Crop Production Trends for six major crops, 1978-2013 (MT)
Source: Ministry of Agriculture Jihad
The main crops in Iran are wheat, barley and maize. Wheat is the most important grain in Iran and accounts for 70 percent of the grain production.
14 Include table. (It would be better to compare with latest data available, 2013, particularly since 2011 also seems to an exceptional year. ISC should have population figures for non-census years as well.
-
100
200
300
400
500
600
700
800
-
5,000
10,000
15,000
20,000
25,000
19
78
19
80
19
82
19
84
19
86
19
88
19
90
19
92
19
94
19
96
19
98
20
00
20
02
20
04
20
06
20
08
20
10
20
12
Legu
me
-Th
ou
san
d M
T
All
oth
er
Cro
ps
-Th
ou
san
d M
T
Production Trends of 6 Crop Groups 1978-2013 (,000 MT)
Grains Industrial crops
Vegetables
Cucurbits Forage Legumes
9
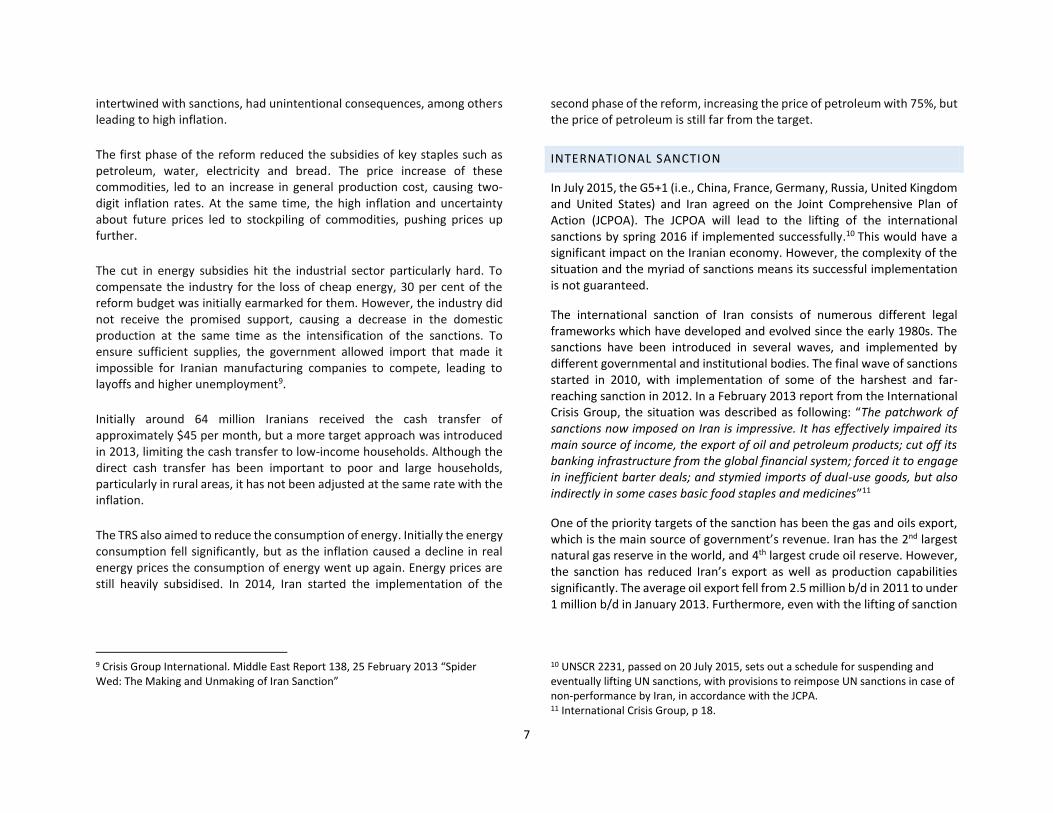
Iran was ranked as the 16th wheat producers in the world in 201315. The Ministry of Agriculture Jihad declared that Iran’s production of wheat fully covered domestic demand in 2006, but the drought in 2008 and the subsequent fall in production made it necessary to resume import of wheat.
Acreage used for grain production has remained between 8,500 and 9,500 hectares since the early 1980s. Figure-3 shows the area used (hectare) and the total production of wheat (metric tons - MT). The increase in production is mainly due to improvements in yield, through modernisation and irrigation, rather than the increase of the cropping area. The table also shows the deep impact of the drought in 2008.
Figure 3. Grain Production (metric ton) and Acreage (hectare) Trends
Source: Ministry of Agriculture Jihad
Industrial crop includes sugar beets, sugar cane, cotton, oilseed and tobacco, of which the two first make up over 90 percent of the production. Industrial crops account for about 16 percent of the total agricultural production in
15 FAO STAT
2013. Almost 98 percent is cultivated by irrigated farming. Due to the drought in 2008, production fell below half the 2007 level by 2009. Since 2010 the production increased significantly, but it remains below the 2007 record harvest.
The most important vegetables in Iran are potatoes (34% of total in volume), tomatoes (34%) and onions. Due to the modernization of the production, including the use of greenhouses for production of tomatoes, the yield has increased significantly.
Figure 4. Vegetable Production and Acreage Trends
Source: Ministry of Agriculture Jihad
The production of cucurbits includes watermelon, melon, and cucumbers. Except for 2008, the production has increased steadily, reaching a record production in 2013 of almost 9 million tons. Almost the entire production comes from irrigated land.
-
2,000
4,000
6,000
8,000
10,000
12,000
-
5,000
10,000
15,000
20,000
25,000
30,000
19
78
19
80
19
82
19
84
19
86
19
88
19
90
19
92
19
94
19
96
19
98
20
00
20
02
20
04
20
06
20
08
20
10
20
12
tho
usa
nd
he
ctar
e
tho
usa
nd
MT
Grain production and acrage (MT, ha)
production Acreage
0
100
200
300
400
500
600
0
2000
4000
6000
8000
10000
12000
14000
16000
18000
19
83
19
85
19
87
19
89
19
91
19
93
19
95
19
97
19
99
20
01
20
03
20
05
20
07
20
09
20
11
20
13
tho
usa
nd
he
ctar
e
tho
usa
nd
MT
Vegetables, production and acrage trend (MT, ha)
production Acreage

10
Forage production includes hay, corn and clover. The annual production has been around 15 million MT since 2005.
The production of legumes, includes peas, beans and lentils, represented less than one percent of the total agricultural production in 2013.
Horticulture crops in Iran includes apples, grapes, oranges, dates and pomegranate. The production has continued to grow every year since 2008, and total production reach almost 16 million MT in 2013.
For several decades, Iran has seen a steady increase in the yield of most
agriculture products. Apart from grains, the yield has continued to increase
after the 2008 drought. Table-1 shows that the yield has fallen significantly
for grains and legumes between 2005 and 2013, while it increases for most
of the commodities. While the decrease in yield explains almost all the
reduction in production of grains, acreage is the main driver in the decrease
of legumes.
Table 1. Percent change in production, acreage and yield between 2005 and 2013
Production Yield Acreage
Grains -25 -20 -7
Legumes -21 -7 -15
Vegetables 10 8 1
Cucurbits 21 17 3
Industrial products -8 37 -33
Fodder 7 14 -6
Garden 28 8 18 Source: Ministry of Agriculture Jihad
Further modernization of the agricultural sector in Iran would increase the yield and the production. Table-2 shows that the yield is much higher for irrigated land compared to non-irrigated land for all commodities. For most commodities, more than 90 per cent of production comes from irrigated
16 https://www.statista.com/statistics/237705/global-wheat-production/ 17 http://www.fao.org/nr/water/aquastat/countries_regions/irn/index.stm
land, with the exceptions of grains and legumes. Even though the yield is almost four times higher using irrigation, as much as 55 and 80 percent of acreage used for grain and legumes production is rainfed.
The world average yield for wheat is 3.01kg in 2012/1316. This is more than twice the yield of non-irrigated production (1.38kg), but also significantly higher than the irrigated wheat production (2.38kg) in Iran. Water shortage is a serious concern in Iran, requiring more efficient use of water in the agricultural sector. According to FAO, the availability of agricultural land is not a major constraint, but rather the availability of water for the development of these lands17.
Table 2. Share of irrigation and rain-fed acreage and production, Yield ratio of irrigation to
rain-fed
Share of acreage% Share of production%
Ratio of irrigation yield to rainfed
Irrigation Rainfed Irrigation Rainfed
Grain 45 55 77 23 4
Legumes 20 80 48 52 4
Vegetables 92 8 96 4 2
Cucurbits 95 5 99 1 4 Industrial Products
81 19 89 11 21
Fodder 86 14 92 8 2
Garden 84 16 92 8 2 Source: Ministry of Agriculture Jihad
The grain production varies by province from the lowest at 79 thousand MT
in Bushehr Province to the highest at 2,086 thousand MT in Kermanshah
Province. Map-4 illustrates the grain production by province in 2013. The
major production areas are distributed in the northern, north-eastern, and
south-eastern provinces. The highest seven provinces, namely Khuzestan,

11
Fars, Mazandaran, Kermanshah, Golestan, Razavi-Khorasan, and Hamadan,
produce more than half of the national grain production.
Per capita grain production is extremely low in the central, southern and the
western provinces (Map-2). Populated urban areas such as Tehran, Isfahan
and Qom, as well as low production provinces including Busher, Hormozgan,
Sistan-va-Baluchestan and Yazd, had lower production per capita. The
lowest per capita grain production was at 31kg in Tehran and the highest in
Ardabil at 477kg. Almost half of the provinces were self-sufficient in the
grain production in 2011.
Map 4. Grain production in 2013 (MT)
Source: Ministry of Agriculture Jihad
Map 5. Per capita grain production in 2011 (kg)
Source: Ministry of Agriculture Jihad
LIVESTOCK AND POULTRY
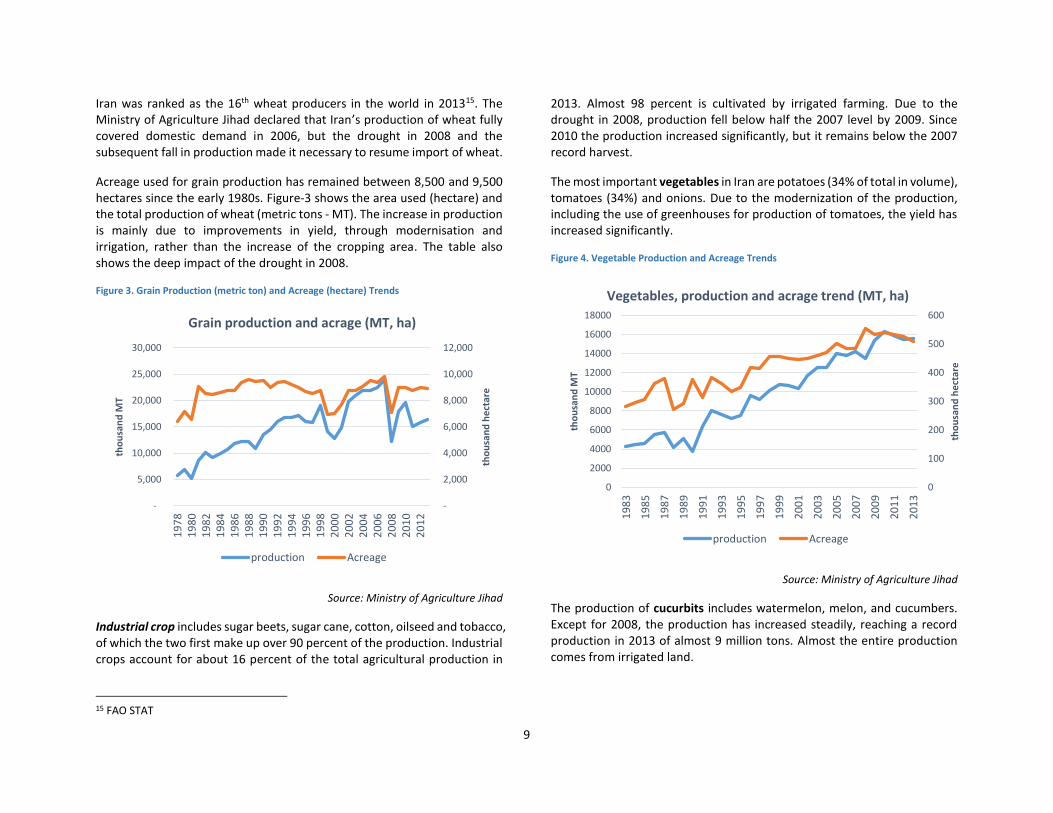
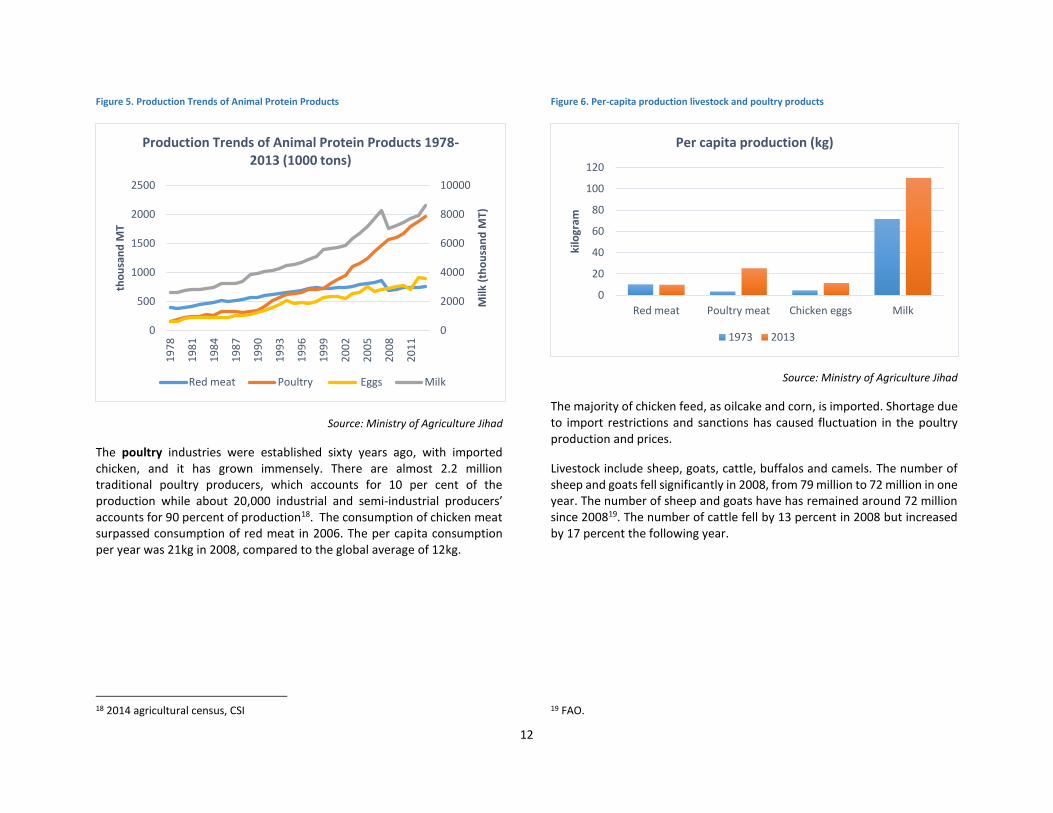
The production of livestock and poultry has increased with an average annual growth rate of 3.8 percent the last forty years. It accounts for 31 percent of the value added in agriculture sector, and 4.5 percent of GDP.
12
Figure 5. Production Trends of Animal Protein Products
Source: Ministry of Agriculture Jihad
The poultry industries were established sixty years ago, with imported chicken, and it has grown immensely. There are almost 2.2 million traditional poultry producers, which accounts for 10 per cent of the production while about 20,000 industrial and semi-industrial producers’ accounts for 90 percent of production18. The consumption of chicken meat surpassed consumption of red meat in 2006. The per capita consumption per year was 21kg in 2008, compared to the global average of 12kg.
18 2014 agricultural census, CSI
Figure 6. Per-capita production livestock and poultry products
Source: Ministry of Agriculture Jihad
The majority of chicken feed, as oilcake and corn, is imported. Shortage due to import restrictions and sanctions has caused fluctuation in the poultry production and prices.
Livestock include sheep, goats, cattle, buffalos and camels. The number of sheep and goats fell significantly in 2008, from 79 million to 72 million in one year. The number of sheep and goats have has remained around 72 million since 200819. The number of cattle fell by 13 percent in 2008 but increased by 17 percent the following year.
19 FAO.
0
2000
4000
6000
8000
10000
0
500
1000
1500
2000
2500
19
78
19
81
19
84
19
87
19
90
19
93
19
96
19
99
20
02
20
05
20
08
20
11
Milk
(th
ou
san
d M
T)
tho
usa
nd
MT
Production Trends of Animal Protein Products 1978-2013 (1000 tons)
Red meat Poultry Eggs Milk
0
20
40
60
80
100
120
Red meat Poultry meat Chicken eggs Milk
kilo
gram
Per capita production (kg)
1973 2013

13
Map 6. Livestock Production in 2014
Source: Ministry of Agriculture Jihad
AQUACULTURE
Traditionally, fish was part of the staple food near the Caspian Sea in the
north and the Persian Gulf and Oman Sea in the south. However, due to
unsustainable fishing and pollution, the production and consumption in
these regions has fallen. Meanwhile, more than thirteen thousand aqua
cultural units have been established across the country, with the majority in
the province of Gilan.
20 Agricultural census 2014, ICS.
LAND HOLDING AND INFRASTRUCTURE
The agricultural system in Iran is a combination of traditional and modern systems, and of small self-sufficiency farms, medium sized and large commercial farms. Seventy-five percent of the farmers own less than 19 percent of agricultural land in 2014. On the other side of the scale, five percent of farmers own about 45 percent of the land 20. More than 2.5 million farmers own less than 5 hectares of land in 2014. Cooperative companies use about 5 percent of the land and commercial companies cover around 14 percent. The latter are mainly located in the province of Khozestan.
Figure 7. Share of Farmers and Land Owned by Farm Size in 2014
Source: Ministry of Agriculture Jihad
Overall, the agricultural infrastructure in Iran’s central and urban areas is good, while it is weaker in remote rural areas. The storage facilities are concentrated in central regions. The total capacity seems sufficient, but some provinces are poorly covered. The general infrastructure in urban areas is well developed, but it is not the case in remote rural areas. In case
05
10152025303540
less than 1 Ha 1-4.9 ha 5-19.9 ha 20-49 ha more than 50ha
pe
rce
nta
ge
Share of farmers and land owned by farm size 2014
Share of landowners share of land
14
of emergencies, roads can be a barrier in event of emergencies, delaying the provision of assistance. The transportation fleet for agricultural products is outdated, contributing to the high food loss/waste.
FOOD BALANCE
AGRICULTURAL TRADE
Iran’s import of agricultural products has grown faster than its export, resulting in a negative and growing trade balance. In 2012, import reached more than 20 million tons, while export remained below 5 million tons. As share of consumption, Iran imports 45 percent of consumed rice, 90 percent of consumed cooking oil, and 50 percent of consumed sugar21.
Until 2008, the value of the exported products in US dollar was almost as
high as the value of imported products, but since 2008 the trade deficit has
increased, reaching $8 billion in 2013.
As a consequence of the sanctions, the majority of Iran’s trade have shifted
from Europe to Asia. The main trading partners in 2011 was China, Iraq, UEA,
India, Afghanistan and Turkey. Trade with China has gone from barely €3
billion in 2002 to over $44 billion in 2011. Because of the sanctions on
financial transactions, Iran has had to resort to barter trade with
international trading partners. Iran has engaged in barter trade with among
other India, exchanging oil for wheat and other products. In addition to
being inefficient, barter trade is more difficult to control and it is linked to
increase in corruption and crime.
As part of the measures to enhance national food security due to sanctions,
price volatilities and climate change, Iran has increased its reserves of wheat
from 3 months to 6 months in 2012.
21 ICR, note 147
FOOD LOSS
According to the Ministry of Agriculture Jihad the total food loss in 2013 was
17.8 percent. The rate of food loss has remained high and is only slightly
lower than the 2003 rate of 18.9 percent. The amount of food loss would be
enough to feed 15 million persons. The reduction of loss would to a large
extend reduce the dependence on food import. Just for wheat, the total loss
and waste in 2013 was 3 million tons, while import in the same year was 4
million tons. The reduction of loss was included as a priority area in the 4th
national development plan for 2005-2009, but further efforts to reduce food
loss would be recommended.
FOOD SELF-SUFFICIENCY
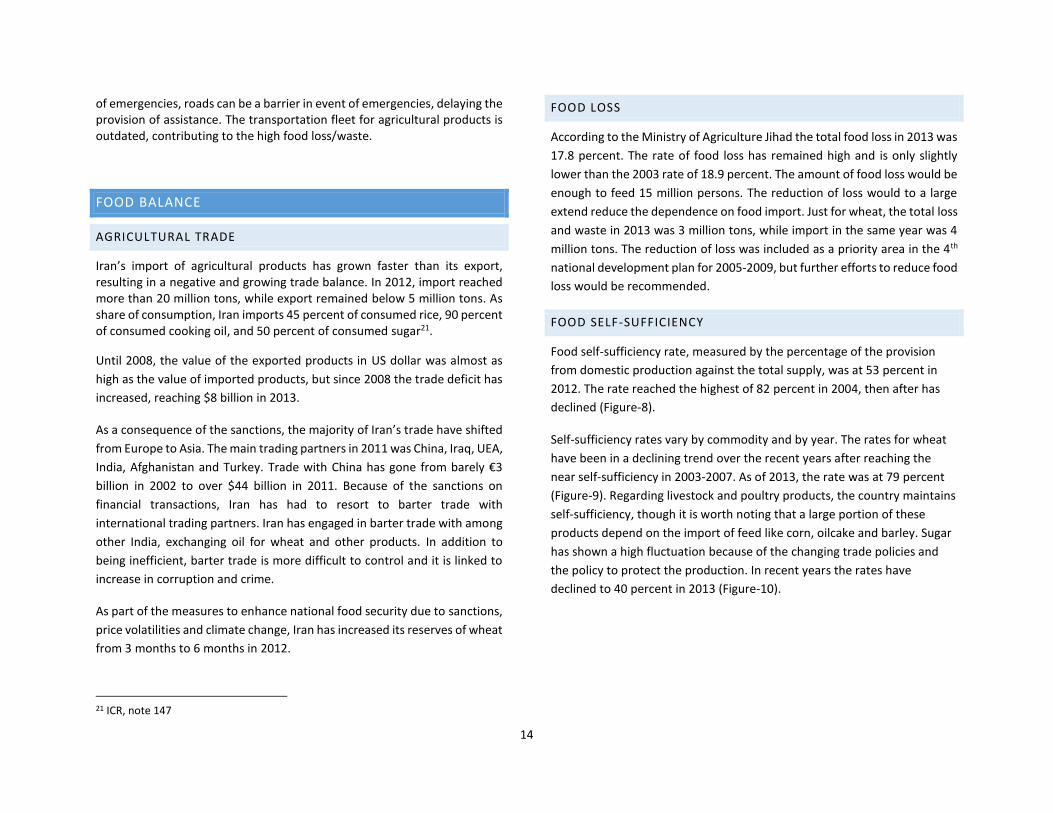
Food self-sufficiency rate, measured by the percentage of the provision
from domestic production against the total supply, was at 53 percent in
2012. The rate reached the highest of 82 percent in 2004, then after has
declined (Figure-8).
Self-sufficiency rates vary by commodity and by year. The rates for wheat
have been in a declining trend over the recent years after reaching the
near self-sufficiency in 2003-2007. As of 2013, the rate was at 79 percent
(Figure-9). Regarding livestock and poultry products, the country maintains
self-sufficiency, though it is worth noting that a large portion of these
products depend on the import of feed like corn, oilcake and barley. Sugar
has shown a high fluctuation because of the changing trade policies and
the policy to protect the production. In recent years the rates have
declined to 40 percent in 2013 (Figure-10).
15
Figure 8. Food supply and self-sufficiency rate
Source: Iran Chamber of Commerce, Industries, and Mines, 2014
Figure 9. Self-Sufficiency rate (%) – Cereals and Tuber
Source: Iran Chamber of Commerce, Industries, and Mines, 2014
Figure 10. Self-Sufficiency rate (%) – other foods
Source: Iran Chamber of Commerce, Industries, and Mines, 2014
Cereals account for almost half of the kcal supply in the Iranian diet, and
eighty percent of the cereals for human consumption is wheat, while the
remaining some twenty percent is rice. Wheat is mostly produced locally
while some 40 percent of rice is imported.
0
1000
2000
3000
4000
0
20
40
60
80
100
pe
rcap
ita
sup
ply
kca
l/d
ay
self
su
ffic
ien
cy (
%)
Food supply and self-sufficiency rate (%)
Self-sufficiency (%) percapita kcal/day
0
20
40
60
80
100
120
140
19
89
19
91
19
93
19
95
19
97
19
99
20
01
20
03
20
05
20
07
20
09
20
11
20
13
Self-sufficiency rate (%) - Cereals and tuber
Wheat Rice Potato
0
20
40
60
80
100
120
140
160
19
89
19
91
19
93
19
95
19
97
19
99
20
01
20
03
20
05
20
07
20
09
20
11
20
13
Self-sufficiency rate (%) - other foods
Sugar Cucurbits Vegetable oil
Red meat Chicken meat Milk

16
Figure 11. Food supply – kcal contribution of food groups
Source: Food Balance Sheet Iran 2011, FAO STAT
Table 3. Food Balance Sheet Iran, 2011
Domestic Supply (1,000 MT) Domestic Utilization (1,000 MT)
Production Import Stock Var. Export Total Food Feed Seed Waste Other Uses
Wheat and products 12,339 75 3,124 362 15,177 11,484 2,200 868 621 4
Rice (Milled Equivalent) 1,832 1,194 - 5 3,021 2,204 734 45 37 2
Barley and products 2,854 823 - - 3,677 48 3,324 121 183
Maize and products 2,747 3,647 1 6 6,388 189 5,862 18 320
Cereals 19,782 5,742 3,125 373 28,276 13,925 12,132 1,053 1,162 6
Source: Food Balance Sheet Iran 2011, FAO STAT
Cereals49%
Sugar & Sweeteners
9%
Vegetable Oils9%
Fruits7%
Vegetables5%
Meat4%
Roots/tuber4%
Pulses3%
Treenuts3%
Milk3%
Animal fats2%
Eggs1%
Other foods1%
その他10%
Food supply - food items kcal share(3,058kcal/day/capita, 2011)
17
FOOD MARKET SITUATION
FOOD PRICES
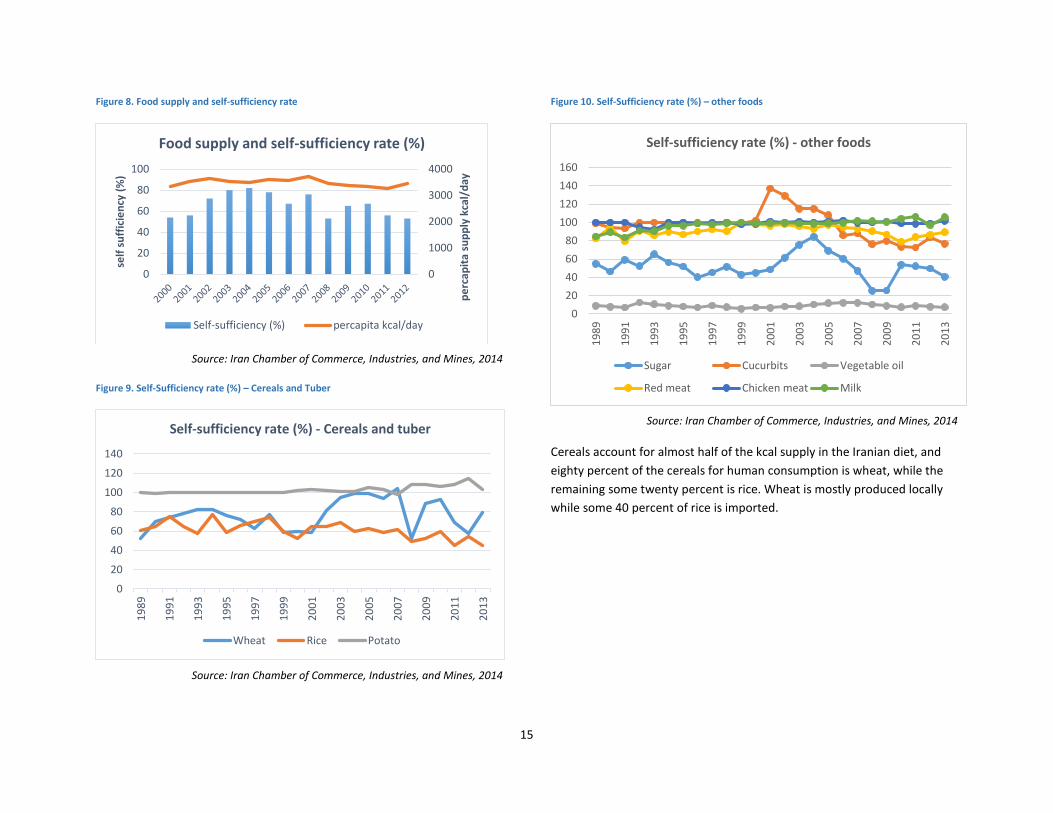
Globally, food prices have seen a strong increase over the last decade, with a price spike in 2008, leading to an international food crisis, followed by a new, but less severe spike in food prices occurred in 2011. According to FAO’s food price index, global food prices have been falling since 201122, which is contrary to the price trend in Iran.
The inflation rate in Iran has been two-digit for the last decade, with year-to year inflation reaching over 40 percent in 2012. Several factors have contributed to the increase in prices, including the introduction of the Targeted Subsidy Reform and the intensification of international sanction. As can be seen in the Figure-12, both general prices and food prices in Iran has increased sharply the last few years, while the figures of the 2014 food prices shows a sign of improvement.
Figure 12. CPI Trends 2000-2014
Source: Statistical Centre of Iran
Following the agreement in July 2015, setting out the schedule for lifting of the sanction, one would expect the prices to stabilise. At the same time, the
22 FAO http://www.fao.org/worldfoodsituation/foodpricesindex/en/
government of Iran is in the process of implementing the second phase of the TSR, gradually reducing subsidies further on important input to the agriculture production.
STRUCTURE
The food market in Iran combines element of free market and government control. Specifically, the government is concerned with key staples such as wheat, milk, rice and chicken, regulating both prices and import. The government exercise its policies through the Economic Council and Consumer and Producers Protection Organization, and regulates import of commodities that are in short supply. In addition, the government’s Trading Cooperation of Iran plays an important role in the purchase, storage and distribution of key food products.
The government is an important input supplier through agricultural cooperatives, and the Ministry of Agricultural Jihad is the main supplier of seeds. In addition to the subsidies on water and energy, the government also subsidies certain inputs, like fertilizers. However, many farms buy additional fertilizers at market price due to limited availability of the subsidized inputs. The inflation adjusted price increase on important inputs as fertilizers, seeds and pesticides between 2008 and 2013 has been very high.
The government is the main purchaser of wheat, although after 2012 the government has allowed a larger share of private actors. Many products, like tomatoes, are only traded on the free market. Middlemen in the food market play important role of setting the prices, especially in big cities like Tehran. Farmers try to maximize the gain through bringing their products directly to wholesalers, and/or agricultural cooperatives. See the Diagram below for the wheat value chain mapping.
0
200
400
600
800
1000
20
00
20
01
20
02
20
03
20
04
20
05
20
06
20
07
20
08
20
09
20
10
20
11
20
12
20
13
20
14
Consumer price index, general and food, 2000=100
CPI CPI food

Wheat Market Structure
LEGEND Enterprise boundary Skipped function Sales of goods in spot market Contract sale Subcontract
Retailing
Bread
making
Exporting
Wheat
processed
Items
trading
Processing
Importing
Agri-inputs (fertilizer, crop protection, vitamins)
importers
Iranian fertilizer & crop protection manufactures
Urban based large Wholesalers
Flour
Mills
Livestock Farms
Agricultural Cooperatives
Industrial units End
Market
Traditional Bakery
Wheat & Wheat processed Items Retailers
Urban based Traders
Farmers
National Market
dMarketNati
Moving retailers
Input retailers
Seed producer
Grain Organization
(Gov. Organization)
Processed Wheat &
bulgur
Agricultural Organization agents
Pasta
making
factories
Food Retailers
International Market
Thresh-
ers
Industrial Bakery
Wheat
Bran
trader
Local based Traders

Municipalities, especially in big and medium cities, have established vegetable and fruit markets in different districts of the cities where commodities are cheaper though the quality is lower than shops. These markets have contributed to an increased competition, forcing the surrounding shops to adjust their prices.
Road network in Iran is good overall, and the quality of the vehicles and storage facilities are the limiting factor for the sale of agricultural products, especially among the smallholder farmers in remote areas. See Map-4 for the road network and road density in Iran.
Map 7. Road Network and Road Density
Source: Statistical Centre Iran
MARKET INTEGRATION
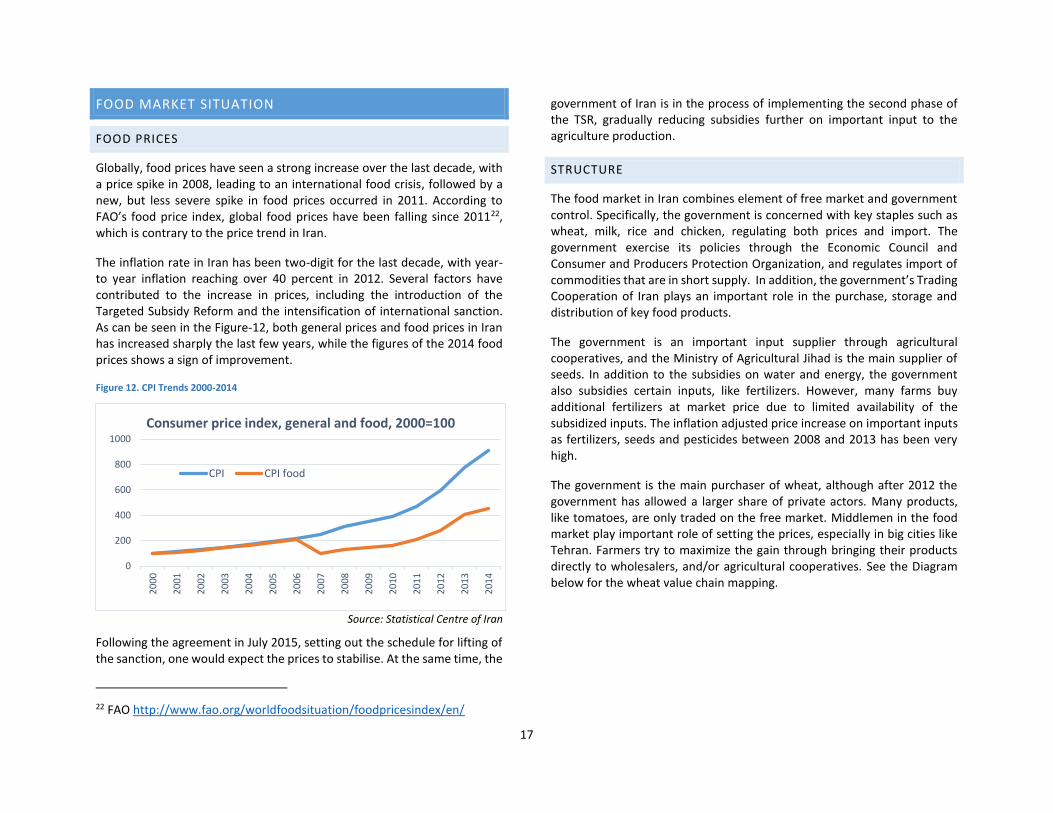
Market integration is a measure to look at whether markets make food available and keep prices stable. Integrated markets can be defined as markets in which prices for comparable goods do not behave independently. Two goods and services are looked at here: gate prices for tomatoes and agricultural wage (ploughing). The Figures indicate that some markets do not seem to be well integrated with the rest of the country, showing a high level of fluctuations that do not follow the national trend (Figures 13, 14). Specifically, in 2012 and 2013, markets were not well integrated for these goods and services.
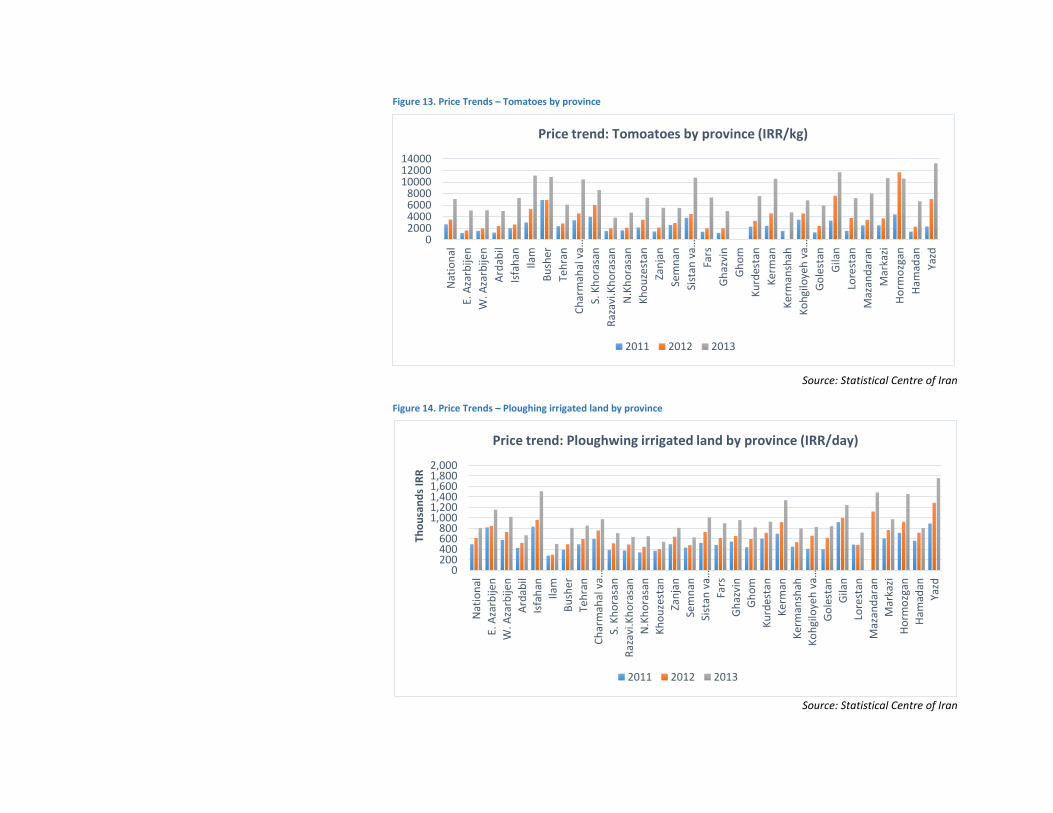
Figure 13. Price Trends – Tomatoes by province
Source: Statistical Centre of Iran
Figure 14. Price Trends – Ploughing irrigated land by province
Source: Statistical Centre of Iran
02000400060008000
100001200014000
Nat
ion
al
E. A
zarb
ijen
W. A
zarb
ijen
Ard
abil
Isfa
han
Ilam
Bu
sher
Teh
ran
Ch
arm
ahal
va…
S. K
ho
rasa
n
Raz
avi.K
ho
rasa
n
N.K
ho
rasa
n
Kh
ou
zest
an
Zan
jan
Sem
nan
Sist
an v
a…
Fars
Gh
azvi
n
Gh
om
Ku
rdes
tan
Ker
man
Ker
man
shah
Ko
hgi
loye
h v
a…
Go
lest
an
Gila
n
Lore
stan
Maz
and
aran
Mar
kazi
Ho
rmo
zgan
Ham
adan
Yazd
Price trend: Tomoatoes by province (IRR/kg)
2011 2012 2013
0200400600800
1,0001,2001,4001,6001,8002,000
Nat
ion
al
E. A
zarb
ijen
W. A
zarb
ijen
Ard
abil
Isfa
han
Ilam
Bu
sher
Teh
ran
Ch
arm
ahal
va…
S. K
ho
rasa
n
Raz
avi.K
ho
rasa
n
N.K
ho
rasa
n
Kh
ou
zest
an
Zan
jan
Sem
nan
Sist
an v
a…
Fars
Gh
azvi
n
Gh
om
Ku
rdes
tan
Ker
man
Ker
man
shah
Ko
hgi
loye
h v
a…
Go
lest
an
Gila
n
Lore
stan
Maz
and
aran
Mar
kazi
Ho
rmo
zgan
Ham
adan
Yazd
Tho
usa
nd
s IR
R
Price trend: Ploughwing irrigated land by province (IRR/day)
2011 2012 2013
HOUSEHOLD FOOD AND NUTRITION SECURITY
FOOD CONSUMPTION
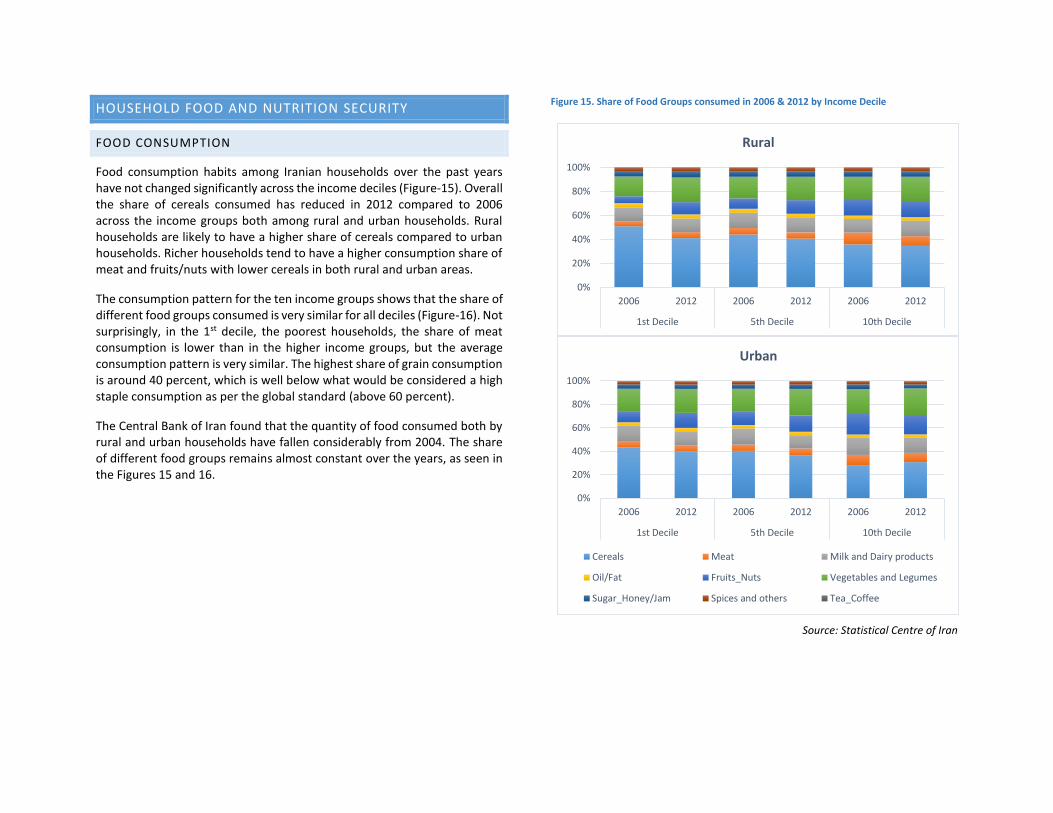
Food consumption habits among Iranian households over the past years have not changed significantly across the income deciles (Figure-15). Overall the share of cereals consumed has reduced in 2012 compared to 2006 across the income groups both among rural and urban households. Rural households are likely to have a higher share of cereals compared to urban households. Richer households tend to have a higher consumption share of meat and fruits/nuts with lower cereals in both rural and urban areas.
The consumption pattern for the ten income groups shows that the share of different food groups consumed is very similar for all deciles (Figure-16). Not surprisingly, in the 1st decile, the poorest households, the share of meat consumption is lower than in the higher income groups, but the average consumption pattern is very similar. The highest share of grain consumption is around 40 percent, which is well below what would be considered a high staple consumption as per the global standard (above 60 percent).
The Central Bank of Iran found that the quantity of food consumed both by rural and urban households have fallen considerably from 2004. The share of different food groups remains almost constant over the years, as seen in the Figures 15 and 16.
Figure 15. Share of Food Groups consumed in 2006 & 2012 by Income Decile
Source: Statistical Centre of Iran
0%
20%
40%
60%
80%
100%
2006 2012 2006 2012 2006 2012
1st Decile 5th Decile 10th Decile
Rural
0%
20%
40%
60%
80%
100%
2006 2012 2006 2012 2006 2012
1st Decile 5th Decile 10th Decile
Urban
Cereals Meat Milk and Dairy products
Oil/Fat Fruits_Nuts Vegetables and Legumes
Sugar_Honey/Jam Spices and others Tea_Coffee

22
Figure 16. Share of Food Groups consumed by Income Decile
Source: Statistical Centre of Iran
NUTRITION
Nutrition is an integral dimension of the food security concept. In addition to sufficient quantity of food, the quality and variety of food is equally important. Indicators of malnutrition or micronutrient deficiency reveal whether the population is properly nourished. A nutritious diet is particularly important in the first 24 months of a child’s life, as well as for pregnant women, to ensure human growth and mental development.
Two large surveys have looked at malnutrition and micro nutrition deficiency in Iran in 2009 and 2012. Both surveys found that malnutrition and micronutrient deficiency was prevalent in some provinces.
MALNUTRITION AMONG CHILDREN UNDER FIVE
Malnutrition among children can be measured by their growth development compared to age, and providing information for monitoring the nutritional
0
10
20
30
40
1stDecile
2nd Decile
3rd Decile
4thDecile
5th Decile
6th Decile
7th Decile
8thDecile
9thDecile
10thDecile
Rural
0
10
20
30
40
1stDecile
2ndDecile
3rdDecile
4thDecile
5th Decile
6thDecile
7th Decile
8thDecile
9th Decile
10thDecile
Urban
Grains Meats vegetables and grain
Milk, dairies, and eggs Fruits sugar, jam and sweets
Oils, fat, and butter
BOX: NATIONAL FOOD BASKET
According to the article 34 of the 5th National Development Plan (2011-2015), Ministry of Health and Medical Education (MHME) is to prepare optimum food basket for different age groups. The latest available food basket composition is presented in the table below.
Food gram/capita/day Food gram/capita/day
Wheat 310
Red meat 38
Rice 95
Poultry and fish 64
Pasta 20
Egg 35
Grains 26
Dairy 250
Potato 70
Vegetable oils 35
Vegetables 300
Sugar 40
Fruits 280
23
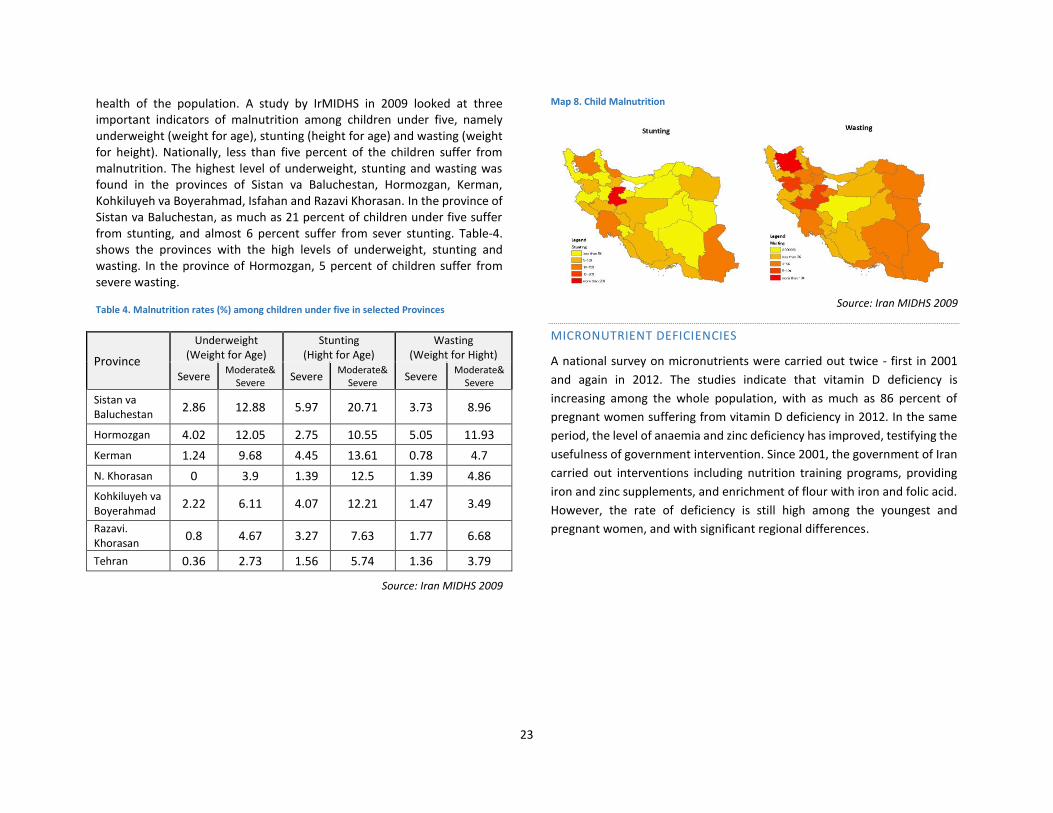
health of the population. A study by IrMIDHS in 2009 looked at three important indicators of malnutrition among children under five, namely underweight (weight for age), stunting (height for age) and wasting (weight for height). Nationally, less than five percent of the children suffer from malnutrition. The highest level of underweight, stunting and wasting was found in the provinces of Sistan va Baluchestan, Hormozgan, Kerman, Kohkiluyeh va Boyerahmad, Isfahan and Razavi Khorasan. In the province of Sistan va Baluchestan, as much as 21 percent of children under five suffer from stunting, and almost 6 percent suffer from sever stunting. Table-4. shows the provinces with the high levels of underweight, stunting and wasting. In the province of Hormozgan, 5 percent of children suffer from severe wasting.
Table 4. Malnutrition rates (%) among children under five in selected Provinces
Province
Underweight (Weight for Age)
Stunting (Hight for Age)
Wasting (Weight for Hight)
Severe Moderate&
Severe Severe
Moderate& Severe
Severe Moderate&
Severe
Sistan va Baluchestan
2.86 12.88 5.97 20.71 3.73 8.96
Hormozgan 4.02 12.05 2.75 10.55 5.05 11.93
Kerman 1.24 9.68 4.45 13.61 0.78 4.7
N. Khorasan 0 3.9 1.39 12.5 1.39 4.86
Kohkiluyeh va Boyerahmad
2.22 6.11 4.07 12.21 1.47 3.49
Razavi. Khorasan
0.8 4.67 3.27 7.63 1.77 6.68
Tehran 0.36 2.73 1.56 5.74 1.36 3.79
Source: Iran MIDHS 2009
Map 8. Child Malnutrition
Source: Iran MIDHS 2009
MICRONUTRIENT DEFICIENCIES
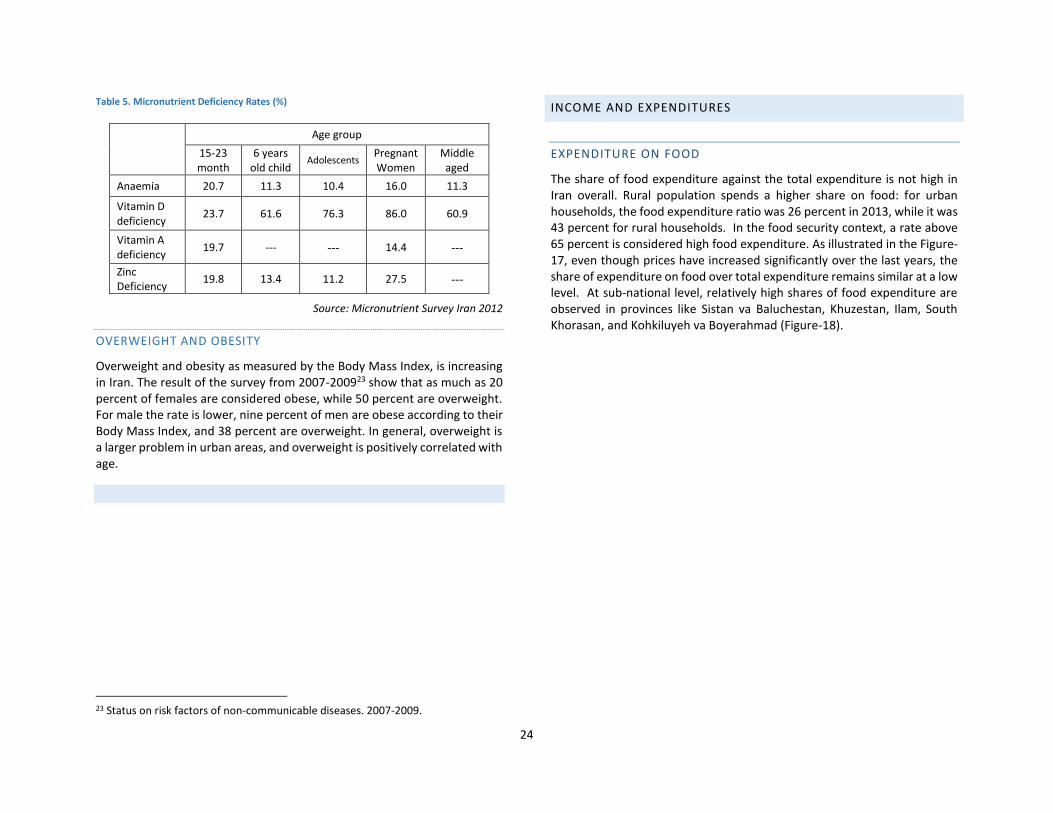
A national survey on micronutrients were carried out twice - first in 2001
and again in 2012. The studies indicate that vitamin D deficiency is
increasing among the whole population, with as much as 86 percent of
pregnant women suffering from vitamin D deficiency in 2012. In the same
period, the level of anaemia and zinc deficiency has improved, testifying the
usefulness of government intervention. Since 2001, the government of Iran
carried out interventions including nutrition training programs, providing
iron and zinc supplements, and enrichment of flour with iron and folic acid.
However, the rate of deficiency is still high among the youngest and
pregnant women, and with significant regional differences.
24
Table 5. Micronutrient Deficiency Rates (%)
Age group
15-23 month
6 years old child
Adolescents Pregnant Women
Middle aged
Anaemia 20.7 11.3 10.4 16.0 11.3
Vitamin D deficiency
23.7 61.6 76.3 86.0 60.9
Vitamin A deficiency
19.7 --- --- 14.4 ---
Zinc Deficiency
19.8 13.4 11.2 27.5 ---
Source: Micronutrient Survey Iran 2012
OVERWEIGHT AND OBESITY
Overweight and obesity as measured by the Body Mass Index, is increasing in Iran. The result of the survey from 2007-200923 show that as much as 20 percent of females are considered obese, while 50 percent are overweight. For male the rate is lower, nine percent of men are obese according to their Body Mass Index, and 38 percent are overweight. In general, overweight is a larger problem in urban areas, and overweight is positively correlated with age.
23 Status on risk factors of non-communicable diseases. 2007-2009.
INCOME AND EXPENDITURES
EXPENDITURE ON FOOD
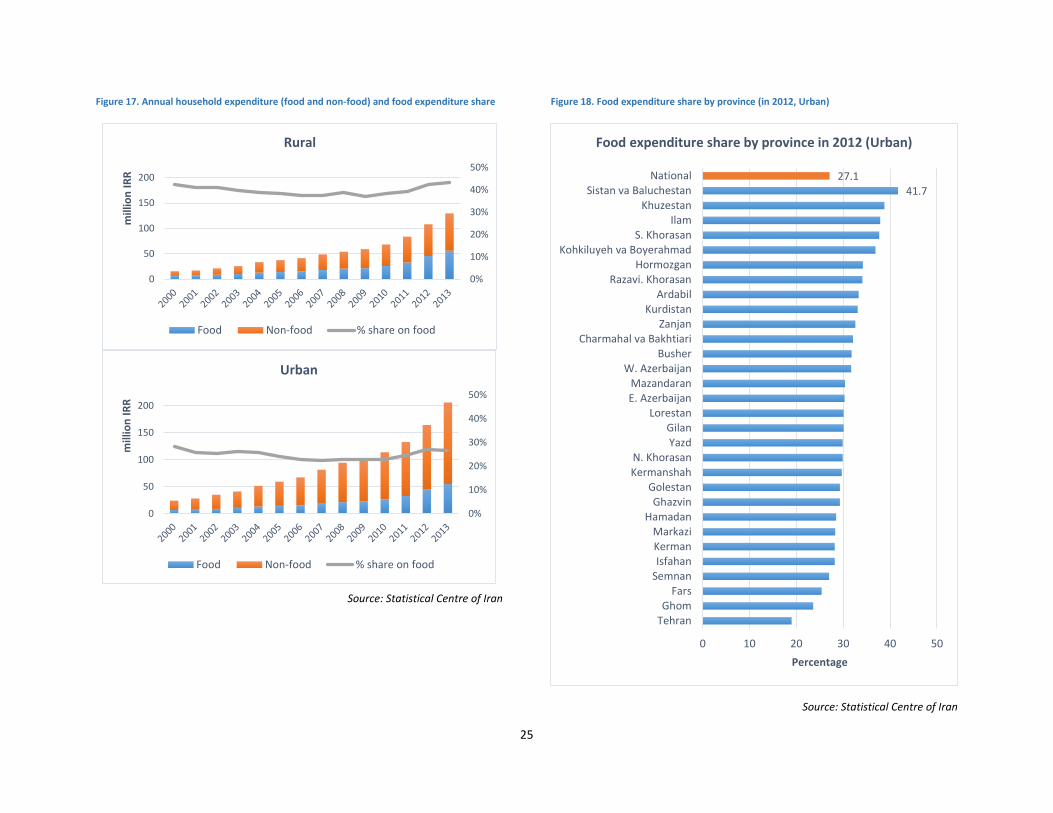
The share of food expenditure against the total expenditure is not high in Iran overall. Rural population spends a higher share on food: for urban households, the food expenditure ratio was 26 percent in 2013, while it was 43 percent for rural households. In the food security context, a rate above 65 percent is considered high food expenditure. As illustrated in the Figure-17, even though prices have increased significantly over the last years, the share of expenditure on food over total expenditure remains similar at a low level. At sub-national level, relatively high shares of food expenditure are observed in provinces like Sistan va Baluchestan, Khuzestan, Ilam, South Khorasan, and Kohkiluyeh va Boyerahmad (Figure-18).
25
Figure 17. Annual household expenditure (food and non-food) and food expenditure share
Source: Statistical Centre of Iran
Figure 18. Food expenditure share by province (in 2012, Urban)
Source: Statistical Centre of Iran
0%
10%
20%
30%
40%
50%
0
50
100
150
200
mill
ion
IR
R
Rural
Food Non-food % share on food
0%
10%
20%
30%
40%
50%
0
50
100
150
200
mill
ion
IR
R
Urban
Food Non-food % share on food
41.727.1
0 10 20 30 40 50
TehranGhom
FarsSemnanIsfahanKermanMarkazi
HamadanGhazvin
GolestanKermanshahN. Khorasan
YazdGilan
LorestanE. AzerbaijanMazandaran
W. AzerbaijanBusher
Charmahal va BakhtiariZanjan
KurdistanArdabil
Razavi. KhorasanHormozgan
Kohkiluyeh va BoyerahmadS. Khorasan
IlamKhuzestan
Sistan va BaluchestanNational
Percentage
Food expenditure share by province in 2012 (Urban)
26
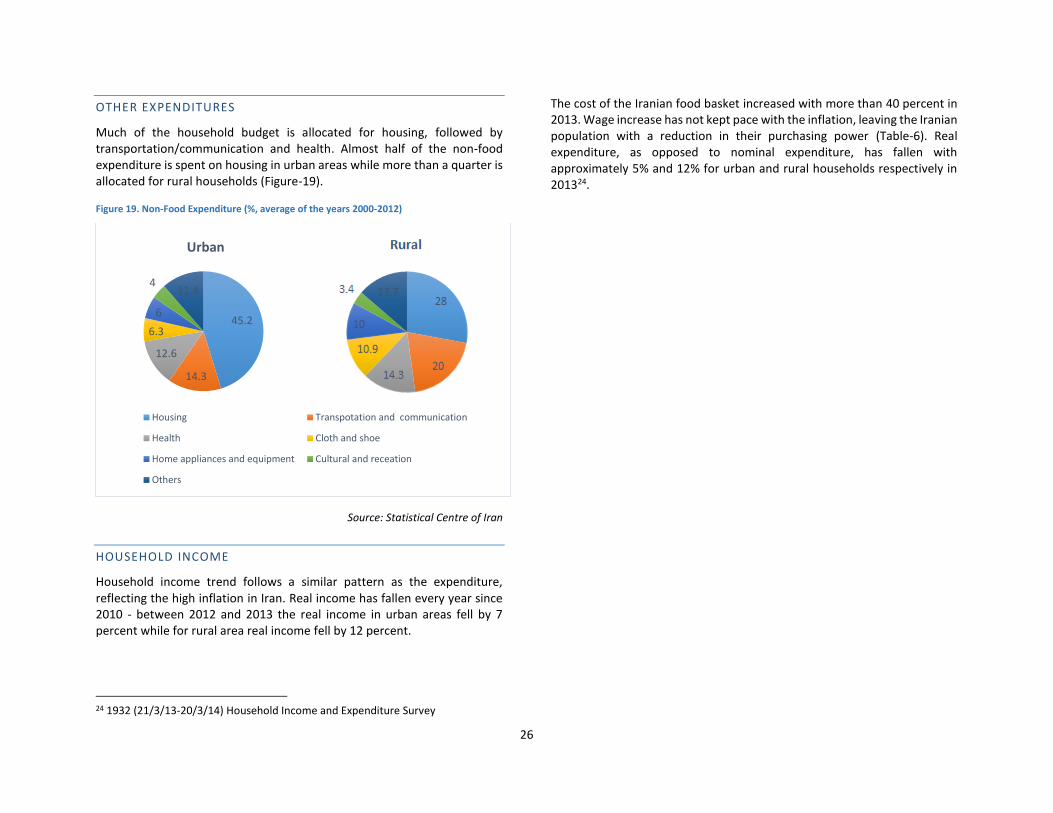
OTHER EXPENDITURES
Much of the household budget is allocated for housing, followed by transportation/communication and health. Almost half of the non-food expenditure is spent on housing in urban areas while more than a quarter is allocated for rural households (Figure-19).
Figure 19. Non-Food Expenditure (%, average of the years 2000-2012)
Source: Statistical Centre of Iran
HOUSEHOLD INCOME
Household income trend follows a similar pattern as the expenditure, reflecting the high inflation in Iran. Real income has fallen every year since 2010 - between 2012 and 2013 the real income in urban areas fell by 7 percent while for rural area real income fell by 12 percent.
24 1932 (21/3/13-20/3/14) Household Income and Expenditure Survey
The cost of the Iranian food basket increased with more than 40 percent in 2013. Wage increase has not kept pace with the inflation, leaving the Iranian population with a reduction in their purchasing power (Table-6). Real expenditure, as opposed to nominal expenditure, has fallen with approximately 5% and 12% for urban and rural households respectively in 201324.
45.2
14.3
12.6
6.3
6
411.4
Urban
Housing Transpotation and communication
Health Cloth and shoe
Home appliances and equipment Cultural and receation
Others

27
Table 6. Inflation rates, changes in wage/salary and food basket expenses 2004-2013
Sources: Ministry of Cooperative, Labor, and Social Welfare, Statistical Centre of Iran, Central Bank of Iran

28
POVERTY
According to the SCI the poverty line in 2010 was 15,300 IRR/day (or approximately USD 1.5). However, many experts believed it should be higher. In 2011, the head of Competition Committee suggested that the poverty line should be at least 41,000 IRR/day.
According to the World Banks estimate for 2010, the number of people living below the poverty line had fallen since 2005. However, they noted that many people lived close to the poverty line. The standard estimate, based on the poverty line of US$2 and US$3, shows that less than one percent of the population live below the poverty line. However, increasing the poverty line to $2.5 and $3.5 per day would increase the share of the population living below the thresholds to about 4-6 %, that is, around 4.5 million persons. Since 2010, all economic indicators point toward a deteriorating situation for low-income households, suggesting the number of people living below or close to the poverty line has increased. The high inflation and reduction in real income hit the poorest household hardest. Although the TSR provide a cash transfer of $45 per person per month for targeted households, the high inflation has diminished its value.
Two studies which have looked at poverty in Iran over the last two decades provides more insight into who are poor and where they live. The first analyses income and expenditure data for households in the period 1991-200725, while the second looks at kilocalories consumed in the period 1989-200926. Some of the key findings of these studies are:
▪ Households where the head of household is either young (below 30), retired or female are more likely to be poor. A household with female head of household is twice as likely to be poor compared to a household with a male head of household. Among the poor household, the share with a retired head of household increased from 8 percent in 1991 to 23 percent in 2007, indicating that this group is getting worse off.
25 Farhad Nili (year)
▪ 25 percent of the poor households were in the provinces of Sistan va Baluchestan, Golestan, North Khorasan and South Khorasan. The same provinces, in addition to Lorestan, also score lowest on the welfare indicator. Tehran score highest on welfare indicators, but it is also the province with the highest rate of welfare disparity.
▪ Poverty is more persistent in rural areas. However, the share of poor living in rural areas compared to urban areas is decreasing, from 60 percent in 1991 to 55 percent in 2007. This also reflect the movement from the countryside to the cities.
▪ There has been a significant fall in poverty between 1989 and 2009. The absolute poverty indicator (below 2294 kcal) fell from 37 percent of urban household in 1989, to 16 percent in 2009, and from 46 percent to 27 percent in rural areas. The same study found that the absolute poverty indicator started to rise again in 2005 and 2006 for rural and urban areas respectively, indicating increase in poverty after a long period of improvement in living standards.
According to the SCI, the Gini Coefficient is 36.50 in 2013 (1392). The figure is slightly lower for rural area compared to urban areas. The Central Bank operates with a slightly higher figure, estimating the Gini Coefficient to be 39.44, while the World Banks estimate for Iran is 37.4 in 2013. Given that a Gini Coefficient of 0 means total equality, while 100 signify total inequality, Iran can be considered to have a quite equal income distribution. For comparison, according to the World Bank, Ukraine had the lowest Gini coefficient in 2013 (24.6), while Honduras had the highest (53.7). Figures for 2011, which includes the Gini Coefficient for 131 countries, ranks Iran as number 54th on equality.
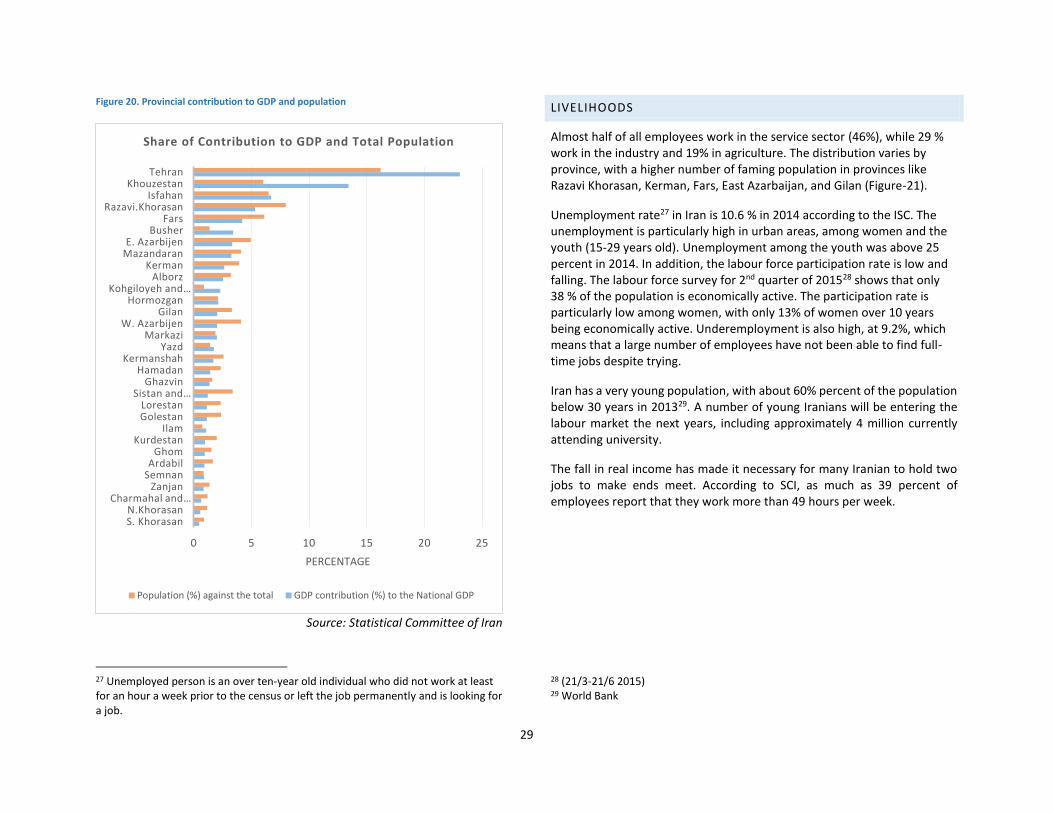
Figure-20 illustrates the percentage contribution to the national GDP in 2011 by province. A large geographical difference in wealth is observed - Tehran contributes almost a quarter of national GDP, followed by Khouzestan (13 percent) and Isfahan (7 percent).
26 Karimi and Arshadi, 2013: QUARTERLY JOURNAL OF THE MARCO AND STRATEGIC POLICIES SPRING 2013 , Volume 1 , Number 1; Page(s)23 To 42
29
Figure 20. Provincial contribution to GDP and population
Source: Statistical Committee of Iran
27 Unemployed person is an over ten-year old individual who did not work at least for an hour a week prior to the census or left the job permanently and is looking for a job.
LIVELIHOODS
Almost half of all employees work in the service sector (46%), while 29 % work in the industry and 19% in agriculture. The distribution varies by province, with a higher number of faming population in provinces like Razavi Khorasan, Kerman, Fars, East Azarbaijan, and Gilan (Figure-21).
Unemployment rate27 in Iran is 10.6 % in 2014 according to the ISC. The unemployment is particularly high in urban areas, among women and the youth (15-29 years old). Unemployment among the youth was above 25 percent in 2014. In addition, the labour force participation rate is low and falling. The labour force survey for 2nd quarter of 201528 shows that only 38 % of the population is economically active. The participation rate is particularly low among women, with only 13% of women over 10 years being economically active. Underemployment is also high, at 9.2%, which means that a large number of employees have not been able to find full-time jobs despite trying.
Iran has a very young population, with about 60% percent of the population below 30 years in 201329. A number of young Iranians will be entering the labour market the next years, including approximately 4 million currently attending university.
The fall in real income has made it necessary for many Iranian to hold two jobs to make ends meet. According to SCI, as much as 39 percent of employees report that they work more than 49 hours per week.
28 (21/3-21/6 2015) 29 World Bank
0 5 10 15 20 25
S. KhorasanN.Khorasan
Charmahal and…Zanjan
SemnanArdabil
GhomKurdestan
IlamGolestanLorestan
Sistan and…Ghazvin
HamadanKermanshah
YazdMarkazi
W. AzarbijenGilan
HormozganKohgiloyeh and…
AlborzKerman
MazandaranE. Azarbijen
BusherFars
Razavi.KhorasanIsfahan
KhouzestanTehran
PERCENTAGE
Share of Contribution to GDP and Total Population
Population (%) against the total GDP contribution (%) to the National GDP

30
Figure 21. Employees distribution in three main sectors by Province, 2011
Source: Statistical Centre of Iran
Figure 22. Unemployment rate by Province, 2013
Source: Statistical Centre of Iran
0% 20% 40% 60% 80% 100%
YazdHamadan
HormozganMarkazi
MazandaranLorestan
GilanGolestan
Kohkiluyeh va BoyerahmadKermanshah
KermanKurdistan
GhomGhazvin
FarsSistan va Baluchestan
SemnanZanjan
KhuzestanN.Khorasan
Razavi.KhorasanS. Khorasan
Charmahal va BakhtiariTehranBusher
IlamIsfahanArdabil
W. AzarbaijanE. Azarbaijan
National
Employees distribution in three main sectors
Agriculture Industry Services Not stated
5.8
6.1
6.5
7.4
7.4
7.7
7.7
7.9
8
8.6
9
9.3
9.6
9.9
9.9
10.3
10.7
10.9
11
11.4
12.3
12.4
13.1
13.3
13.6
13.6
13.8
14.6
16.5
17.1
10.4
0 5 10 15 20
Golestan
Kerman
Yazd
Semnan
Hormozgan
Ghom
Hamadan
Razavi.Khorasan
S. Khorasan
Markazi
Busher
W. Azarbaijan
E. Azarbaijan
Tehran
Zanjan
Ghazvin
Charmahal va Bakhtiari
Isfahan
Mazandaran
Sistan va Baluchestan
Ardabil
N.Khorasan
Khouzestan
Fars
Kurdestan
Gilan
Ilam
Kermanshah
Kohgiloyeh va Boyerahmad
Lorestan
National
percentage
Unemployment rate by Provinces 2013 (%)

31
ACCESS TO SERVICES
WATER ACCESS AND SANITATION
According to the 2011 population and housing census30, majority of the population has access to clean drinking water. As much as 93 percent of the population has water pipes on their premises, and 2 percent has other kind of improved water sources. The use of unimproved water sources is most common in rural area, and in use by about 10 percent of the rural population.
Almost all Iranians have access to improved sanitation facilities. Only one percent of the rural population does still not have improved sanitation facilities.
INSTITUTIONS AND ORGANISATIONS PROVIDING SAFETY NETS
In general, the national social protection and safety-nets systems should cover most of the population. However, not all households are sufficiently covered, and the economic crisis has seen more people living closer to the poverty line. A range of government institutions and NGOs provide different types of support to the Iranian population.
Below is a short description of some of the most important institutions providing support to households:
The Social Security Organization was established in 1975. It provides both medical services and pension funds, and is present in all provinces. It has 68 hospitals and around 280 clinics, in addition to contracts with more than 5,300 therapeutic centers. In 2012, about 50 percent of Iranians were covered by the SSO.
Iran Health Insurance Organization covers about 46 percent of the population according to the census. In addition to government employees, it covers in particular households in rural areas.
30 Housing and population census 2011. SCI.
The State Welfare Organisation provides a range of services and it is running Social Service Centres throughout the country. In addition, it is responsible for the oversight of NGO providing similar services. About 7 percent of the population receives some form of support from the State Welfare Organisation.
The Imam Khomeini Relief Foundation provides support to low income households, mainly through cash transfers but also as loans. According to the population census of 2011, almost 11 percent of the population benefitted from support from this organisation.
The Marty and Isargaran Affairs Foundation is a governmental organization supporting the wounded soldiers from the Iran-Iraq war, as well as the families of the fallen soldiers. The foundation assists about 3 percent of the population according to the 2011 census.
The Red Crescent Society of I.R. Iran has more than 3 million members it can mobilize in the case of disasters. It has proven to be well organised and it is an important contributor in the case of emergencies.
Until 2010, the government subsidised heavily key staples as gasoline, gas, electricity, water and bread. The Targeted Subsidy Reform decreased the general subsidies on staple commodities, while providing a monthly cash transfer to almost all households, covering over 70 million persons in the start. The coverage of the cash transfer has been scaled down to target less well-off households. Only Iranian citizens are eligible for the cash transfer. Refugees from Afghanistan and Iraq, who previously benefitted from the indirect subsidies on staple good, are particularly hard hit by the inflation since 2010. 31
32
STABILITY
Iran is subject to both different types of shocks that affects the food security of the population. Over the past decades the country has been hit by natural disasters like earthquakes, drought and floods, as well as economic shocks and political instability of the neighbouring countries.
NATURAL DISASTERS
EARTHQUAKES
Iran is located in one of the most active seismic regions in the world and has suffered a large number of devastating earthquakes. In the 20th century alone, 22 major earthquakes have claimed over 150,000 human lives and disrupted agricultural and industrial services32. In 2003 an earthquake of moment magnitude 6.6 hit Bam, killing more than 30,000 people. The earthquake levelled the ancient citadel of Arge Bam and left thousands homeless. Poor construction standards and virtual non–adherence to building codes aggravated the damages. The most recent major earthquake hit Iran on 16 April 2013, with a magnitude of 7.8. It was felt all the way to New Delhi, but the damage was less severe because it was deep underground and struck a rural area that is scarcely populated in the Iran-Pakistan border region.
The government of Iran has established notable capacities in disaster preparedness and Disaster Risk Reduction (DRR). In 200x Iran adopted a new legislation on disaster management and the establishment of the National Disaster Management Organization (NDMO) to oversee coordination. In addition, the Iranian Red Crescent Society (IRCS) has long experience and resources to assist in emergencies, and more than 3 million members. While the international community provided assistance in the Bam earthquake of 2003, the government of Iran did not need international assistance for the
32 CONOPS, WFP 2014 33 IACP 2011
2013 earthquake. Generally, the Iranian government is only likely to need international assistance in the case of major earthquakes in urban areas.
According to recent seismological studies developed by IIEES and Code 2800 (Iranian Code for Seismic Resistant Design of Buildings) majority of urban centres in Iran are located in high earthquake risk areas (earthquakes with a magnitude of 6-8 on the Richter scale) 33 . That means there is a considerable risk that Iran will suffer from major earthquake in areas with high population density. The rapid urbanisation combined with inadequately regulation of constructions, increase the number of people at risk in case of a major earthquake34. Map-5 presents the areas with different degrees of earthquake risk – over 90 percent of the country is exposed to the earthquake hazard. Two densely populated cities – Tehran and Karaj, are located in the areas with higher earthquake risks. In Tehran, with a population of more than 11 million and an underground gas pipeline supplying the whole city, the damages caused by an earthquake would be substantial. It is to be noted that Tehran has not been struck by an earthquake with magnitude above 7 since 1830. Other structures at risk include chemical and nuclear plants and oil refineries; damage to these would have enormous and long lasting environmental consequences, especially for groundwater reserves and ecosystems.
34 Following the major earthquake of Gilan and Zanjan provinces in 1990, the Government introduced mandatory earthquake building codes for urban areas.

33
Map 9. Seismic Map of Iran
Source: International Institute of Earthquake Engineering and Seismology
ADVERSE WEATHER AND CLIMATE CHANGE
Iran is exposed to other natural disasters such as landslides, floods and droughts. In the period between 2006 and 2012, more than 600 persons lost their lives due to floods. Vast area of the country, 91 million ha, is prone to floods. The drought in 2008 and the consecutive years have reduced agricultural land, rangeland, and forests, and have resulted in the loss of agricultural production as well as a shortage of drinking water in many urban and rural areas. The inefficient use of water in the agricultural sectors contributes to the water shortage.
According to the simulation results presented in the national communication reports by the Department of Environment, Iran has
experienced the effects of climate change. Precipitation patterns would change – parts of the country, the north-western areas, coastal areas of Sistan and Balchestan, Hormozgan, North Khorasan and north of Fars, is projected to experience an increased rainfall, whereas the rest of the country, specifically in the western and south-western provinces would experience decreased rainfall. The increased rainfall would cause the soil erosion and a higher risk of flooding. Temperature rise would affect the north-east, north-west and central regions of Iran, accelerating the process of soil salinity in the future.
REFUGEE INFLUX FROM NEIGHBOURING COUNTRIES
Iran is the home to one of the largest refugee populations in the world. Since the 1980s, large number of Afghan refugees, and a smaller number of Iraqis, have found shelter in Iran. At the most, more than 2 million Afghans were registered as refugee in Iran. Due to the implementation of several repatriation programmes since 2002, the figure of registered refugees is now below one million. However, the number including illegal refugees from Afghanistan is estimated to be around 2 million. According the population census in 2011, about 1.5 million Afghans live in Iran. Many Afghan population lives in the central regions of Iran, with approximately 32 percent living in Tehran.
The Iranian government has implemented several policies to encourage the repatriation of Afghan refugees. Since 2002, Iran has implemented the Joint Programme for Voluntary Repatriation of Afghan Refugees and Displaced Persons in cooperation with UNHCR and Afghanistan. At the same time, benefits given to registered refugees have been scaled back, they are not eligible for the cash transfer under the TSR, and they have very limited work opportunities. A joint report by UNCHR and WFP in 2008 concluded that “limiting government subsidies would entail serious food insecurity among the Afghan Refugee population. Their coping strategies are stretched to the limit at present… The Afghan Refugee population in Iran is vulnerable and relies heavily on government subsidies to provide food and shelter to their families.” The Afghan refugees are likely to be one of the groups that is hardest hit by the TSR, the inflation and economic downturn.
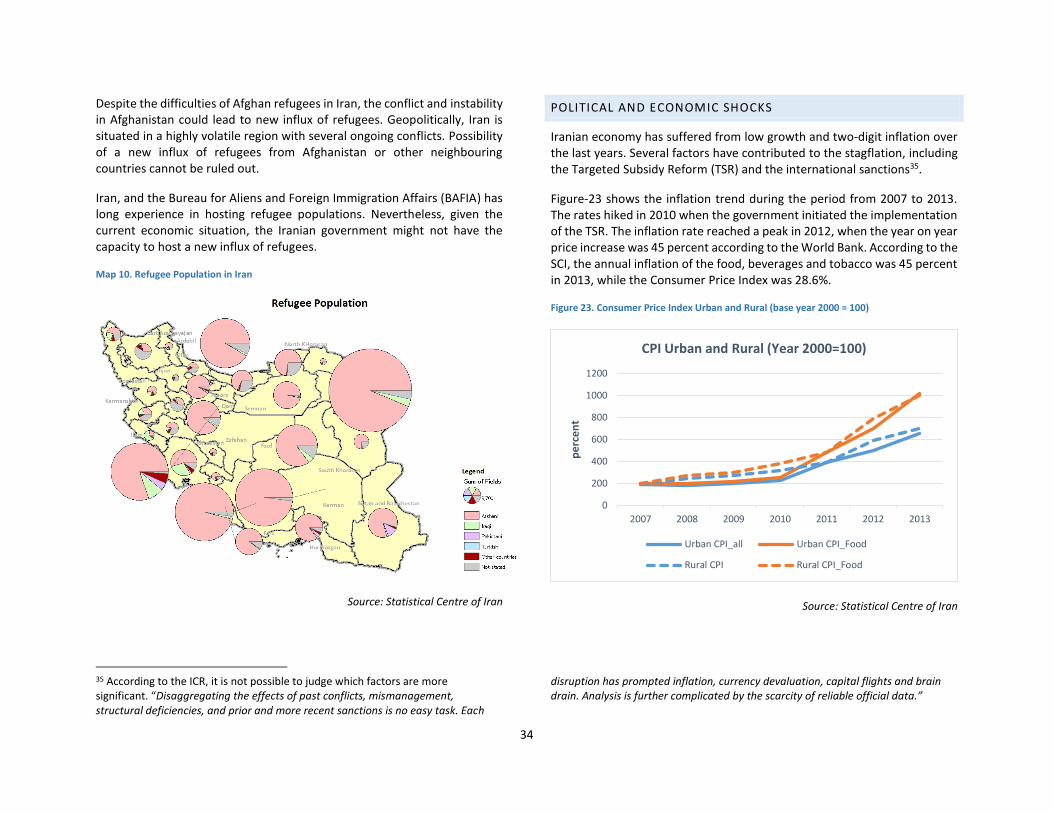
34
Despite the difficulties of Afghan refugees in Iran, the conflict and instability in Afghanistan could lead to new influx of refugees. Geopolitically, Iran is situated in a highly volatile region with several ongoing conflicts. Possibility of a new influx of refugees from Afghanistan or other neighbouring countries cannot be ruled out.
Iran, and the Bureau for Aliens and Foreign Immigration Affairs (BAFIA) has long experience in hosting refugee populations. Nevertheless, given the current economic situation, the Iranian government might not have the capacity to host a new influx of refugees.
Map 10. Refugee Population in Iran
Source: Statistical Centre of Iran
35 According to the ICR, it is not possible to judge which factors are more significant. “Disaggregating the effects of past conflicts, mismanagement, structural deficiencies, and prior and more recent sanctions is no easy task. Each
POLITICAL AND ECONOMIC SHOCKS
Iranian economy has suffered from low growth and two-digit inflation over the last years. Several factors have contributed to the stagflation, including the Targeted Subsidy Reform (TSR) and the international sanctions35.
Figure-23 shows the inflation trend during the period from 2007 to 2013. The rates hiked in 2010 when the government initiated the implementation of the TSR. The inflation rate reached a peak in 2012, when the year on year price increase was 45 percent according to the World Bank. According to the SCI, the annual inflation of the food, beverages and tobacco was 45 percent in 2013, while the Consumer Price Index was 28.6%.
Figure 23. Consumer Price Index Urban and Rural (base year 2000 = 100)
Source: Statistical Centre of Iran
disruption has prompted inflation, currency devaluation, capital flights and brain drain. Analysis is further complicated by the scarcity of reliable official data.”
0
200
400
600
800
1000
1200
2007 2008 2009 2010 2011 2012 2013
pe
rce
nt
CPI Urban and Rural (Year 2000=100)
Urban CPI_all Urban CPI_Food
Rural CPI Rural CPI_Food
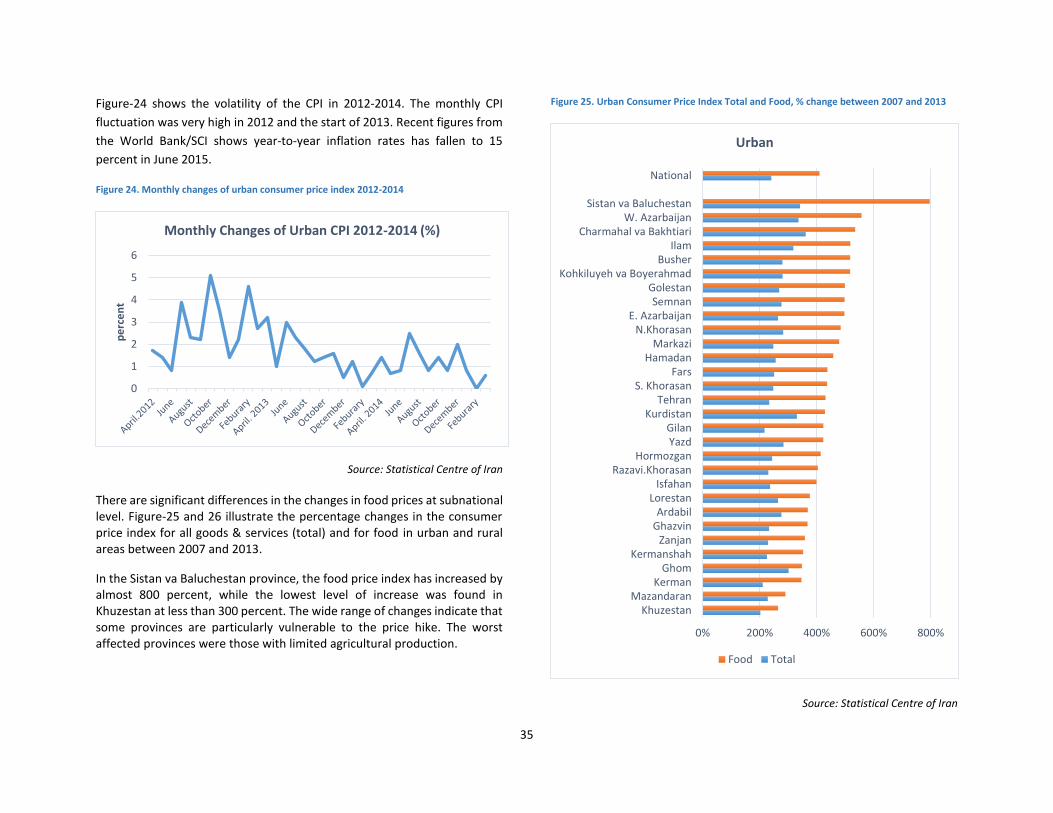
35
Figure-24 shows the volatility of the CPI in 2012-2014. The monthly CPI
fluctuation was very high in 2012 and the start of 2013. Recent figures from
the World Bank/SCI shows year-to-year inflation rates has fallen to 15
percent in June 2015.
Figure 24. Monthly changes of urban consumer price index 2012-2014
Source: Statistical Centre of Iran
There are significant differences in the changes in food prices at subnational level. Figure-25 and 26 illustrate the percentage changes in the consumer price index for all goods & services (total) and for food in urban and rural areas between 2007 and 2013.
In the Sistan va Baluchestan province, the food price index has increased by almost 800 percent, while the lowest level of increase was found in Khuzestan at less than 300 percent. The wide range of changes indicate that some provinces are particularly vulnerable to the price hike. The worst affected provinces were those with limited agricultural production.
Figure 25. Urban Consumer Price Index Total and Food, % change between 2007 and 2013
Source: Statistical Centre of Iran
0
1
2
3
4
5
6
pe
rce
nt
Monthly Changes of Urban CPI 2012-2014 (%)
0% 200% 400% 600% 800%
KhuzestanMazandaran
KermanGhom
KermanshahZanjan
GhazvinArdabil
LorestanIsfahan
Razavi.KhorasanHormozgan
YazdGilan
KurdistanTehran
S. KhorasanFars
HamadanMarkazi
N.KhorasanE. Azarbaijan
SemnanGolestan
Kohkiluyeh va BoyerahmadBusher
IlamCharmahal va Bakhtiari
W. AzarbaijanSistan va Baluchestan
National
Urban
Food Total
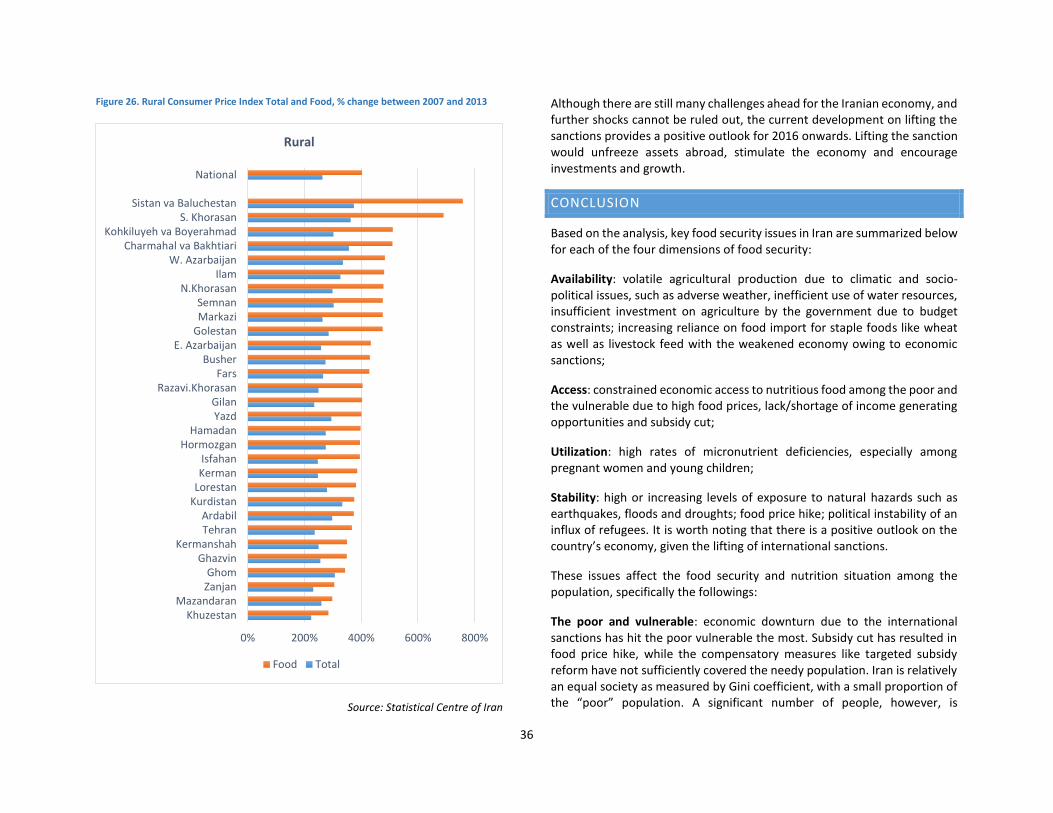
36
Figure 26. Rural Consumer Price Index Total and Food, % change between 2007 and 2013
Source: Statistical Centre of Iran
Although there are still many challenges ahead for the Iranian economy, and further shocks cannot be ruled out, the current development on lifting the sanctions provides a positive outlook for 2016 onwards. Lifting the sanction would unfreeze assets abroad, stimulate the economy and encourage investments and growth.
CONCLUSION
Based on the analysis, key food security issues in Iran are summarized below for each of the four dimensions of food security:
Availability: volatile agricultural production due to climatic and socio-political issues, such as adverse weather, inefficient use of water resources, insufficient investment on agriculture by the government due to budget constraints; increasing reliance on food import for staple foods like wheat as well as livestock feed with the weakened economy owing to economic sanctions;
Access: constrained economic access to nutritious food among the poor and the vulnerable due to high food prices, lack/shortage of income generating opportunities and subsidy cut;
Utilization: high rates of micronutrient deficiencies, especially among pregnant women and young children;
Stability: high or increasing levels of exposure to natural hazards such as earthquakes, floods and droughts; food price hike; political instability of an influx of refugees. It is worth noting that there is a positive outlook on the country’s economy, given the lifting of international sanctions.
These issues affect the food security and nutrition situation among the population, specifically the followings:
The poor and vulnerable: economic downturn due to the international sanctions has hit the poor vulnerable the most. Subsidy cut has resulted in food price hike, while the compensatory measures like targeted subsidy reform have not sufficiently covered the needy population. Iran is relatively an equal society as measured by Gini coefficient, with a small proportion of the “poor” population. A significant number of people, however, is
0% 200% 400% 600% 800%
KhuzestanMazandaran
ZanjanGhom
GhazvinKermanshah
TehranArdabil
KurdistanLorestanKermanIsfahan
HormozganHamadan
YazdGilan
Razavi.KhorasanFars
BusherE. Azarbaijan
GolestanMarkaziSemnan
N.KhorasanIlam
W. AzarbaijanCharmahal va Bakhtiari
Kohkiluyeh va BoyerahmadS. Khorasan
Sistan va Baluchestan
National
Rural
Food Total

37
considered to live just above the poverty line, and they are highly vulnerable to food insecurity shocks.
Refugees: Iran hosts the 4th largest number of refugees in the world. Despite its generous policy towards refugees, the existing national social protection/safety-nets measures do not cover the refugee population. Their economic opportunities tend to be limited due to some restrictions for the type of job that refugees are allowed to be engaged. The refugees are mostly from neighbouring countries like Afghanistan and Iraq, and it is not likely that they would return to their home country in an immediate term. Any further deterioration in those countries may result in a further influx in the future.
Pregnant women and young children: micronutrient deficiencies are most pronounced among these population groups.
Youth: The unemployment rate among the young population is particularly high at above 25 percent, which deserve a special attention given that the country has a high share of the population below 30 years old.
Geographically a higher degree of vulnerability to food insecurity is found in remote rural areas due to structural issues. The province of Sistan va Baluchestan, for instance, scores the worst in all the four dimensions of food security. In addition, densely populated urban areas with a high risk of earthquake would deserve a special attention, given that the potential impacts of earthquakes can be catastrophic to the extent that the country would require international assistance.