Embed Size (px)
Citation preview

Prefatory Note The attached document represents the most complete and accurate version available based on original copies culled from the files of the FOMC Secretariat at the Board of Governors of the Federal Reserve System. This electronic document was created through a comprehensive digitization process which included identifying the best-preserved paper copies, scanning those copies,1
and then making the scanned versions text-searchable.2
Though a stringent quality assurance process was employed, some imperfections may remain. Please note that some material may have been redacted from this document if that material was received on a confidential basis. Redacted material is indicated by occasional gaps in the text or by gray boxes around non-text content. All redacted passages are exempt from disclosure under applicable provisions of the Freedom of Information Act. 1 In some cases, original copies needed to be photocopied before being scanned into electronic format. All scanned images were deskewed (to remove the effects of printer- and scanner-introduced tilting) and lightly cleaned (to remove dark spots caused by staple holes, hole punches, and other blemishes caused after initial printing). 2 A two-step process was used. An advanced optical character recognition computer program (OCR) first created electronic text from the document image. Where the OCR results were inconclusive, staff checked and corrected the text as necessary. Please note that the numbers and text in charts and tables were not reliably recognized by the OCR process and were not checked or corrected by staff.
Content last modified 6/05/2009.

CONFIDENTIAL (FR)
SUPPLEMENT
CURRENT ECONOMIC AND FINANCIAL CONDITIONS
Prepared for theFederal Open Market Committee
By the StaffBoard of Governors
of the Federal Reserve System
March 5, 1971

SUPPLEMENTAL NOTES
The Domestic Economy
Labor market. The labor market eased in February, with
further reductions in employment and hours worked. The labor force
declined even more sharply than employment and unemployment also
declined. The reduction in the labor force amounted to more than
500,000 and was widespread among age and sex groups. The overall
unemployment rate, at 5.8 per cent, was off 0.2 percentage point
from January.
LABOR FORCE, EMPLOYMENT AND UNEMPLOYMENT(Seasonally adjusted in thousands)
Total labor forceArmed forcesCivilian labor forceEmploymentUnemployment
1971Jan. Feb.
86,873 86,3342,976 2,950
83,897 83,38478,864 78,5375,033 4,847
Change Feb.Jan. 1971
-539- 26-513-327-186
1971 from:Feb. 1970
795-3911,186-244
1,430
SELECTED UNEMPLOYMENT RATES(Seasonally adjusted, per cent)
1970 1971Dec. Jan. Feb.
Unemployment rates:Total 6.2 6.0 5.8Men aged 20-24 10.9 10.4 9.7Men aged 25 and over 3.7 3.5 3.4
Women aged 20 and over 5.8 5.7 5.6Teenagers 17.8 17.6 16.7

Nonfarm payroll employment declined by 95,000 in February
to 70.5 million. Employment declines in the goods-producing industries,
totaling about 150,000 were partly offset by moderate increases in
service-type industries, primarily State and local government. After
increasing in December and January, manufacturing employment declined
in February by 74,000 to 18.7 million; except for the period of the
GM strike, this was the lowest level since early 1966. The weakening
of labor demand in manufacturing has been wide-spread and since last
August, prior to the auto strike, manufacturing employment has declined
more than half a million. Although the largest cuts occurred in the
durable goods sector, employment has declined since August in all but
2 of 21 manufacturing industries.
NONFARM PAYROLL EMPLOYMENT(Seasonally adjusted, in thousands)
August 1970 February 1971 Change
Total 70,414 70,514 100
Manufacturing 19,271 18,737 -534Durable goods 1 1 ,1 34 l0)6e3 -451Nondurable goods 8,137 8,054 - 83
Nonmanufacturing:Mining 619 621 2Construction 3,305 3,164 -141Transportation 4,520 4,481 -39Trade 14,912 15,139 227Services and finance 15,191 15,527 336Government 12,596 12,845 249

The average workweek was off 0.2 hours in February for
rank-and-file workers on private nonfarm payrolls and 0.4 hours for
production workers in manufacturing. Workweek declines were wide-
spread, probably reflecting in part the effect of a holiday (Lincoln's
birthday) during the survey week.
Retail sales. Retail sales in February on the basis of
four weeks data, have risen about 3/4 per cent from January. Estimated
durable goods sales are 1/2 per cent and estimated nondurables goods
are nearly 1 per cent. Sales in the general merchandise category
were especially strong and rose nearly 2 per cent.
RETAIL SALES(Per cent change from preceding period, seasonally adjusted)
All storesDurableAutoFurniture & appliance
NondurableFoodGeneral merchandise
GAF
Total less auto, bldg.material, farm
equipment, hardware
1970Dec.
.82.75.4
-4.0.0
1.5-1.2
-1.4
1971Jan.
1.14.58.5
.2- .3- .8
2.0
.7
1971Feb.
.75
.41.4.7.9.6
1.8
1.3
Feb. 1971 from 1970QIV average
2.04.69.9
-1.7.9.7
3.5
1.5
- .2 - .3 .8

The Domestic Financial Situation
Bank credit. Commercial bank credit, adjusted for transfers
of loans between banks and their affiliates (and also for System
matched sale-purchase transactions temporarily outstanding at the end
of February) is now estimated to have increased at a slightly lower
rate during February than that indicated in the Greenbook -- 11.2 per
cent compared with 12.3 per cent (III-5). While total loans and loan
components are unchanged, total investments are estimated to be $400
million lower than originally shown.
The net reduction in investment holdings also reflects some
shift in composition. Holdings of U. S. Treasury securities are now
estimated at a level $100 million above the Greenbook firgure -- or
increasing at an annual rate of 24.7 per cent compared with 22.6 per
cent. On the other hand, holdings of municipal and Federal agency
issues are $500 million below the earlier figure -- or at an annual
rate of 13.6 per cent compared with 20.4 per cent.
Monetary aggregates. Estimates of the growth in monetary
aggregates in February have been revised slightly from those published
in the Greenbook. The aggregates are now estimated to have expanded
at the following annual rates:
M1 (narrowly defined money supply) - 14 per cent
M2 (M1 plus time and savings deposits at commercialbanks other than large CD's) - 21.8 per cent
Adjusted bank credit proxy - 12.9 per cent

Commercial Bank Time and Savings Deposits - 28.0 per cent
Large CD's - 11.3 per cent
Other Time and Savings Deposits - 30.5 per cent
Consumer credit. Consumer instalment credit outstanding
rose $1.0 billion in January, seasonally adjusted annural rate.
Moderate increases occurred in nonautomotive consumer goods credit
and personal loans; auto credit contracted -- although at a reduced
rate -- for the fourth month in a row. On an overall basis, the rate
of increase in instalment credit was considerably larger than the
$0.3 billion advance (annual rate) in December, but was far below the
$4.6 billion increase in January 1970.
Seasonally adjusted extensions of instalment credit moved
up sharply in January and were only slightly below the peak months of
early last summer. The recovery in auto credit that accompanied the
improvement in sales was the primary factor in the rise. Repayments
rose to a new high.
CONSUMER INSTALMENT CREDIT EXTENDED AND REPAID(Seasonally adjusted annual rates, in billions of dollars)
NetExtended Repaid Change
1970: QI 102.2 98.2 4.0QII 104.7 100.1 4.6QIII 106.9 102.8 4.1QIV 102.1 103.6 -1.5
1971: January 107.0 105.9 1.0
-6-
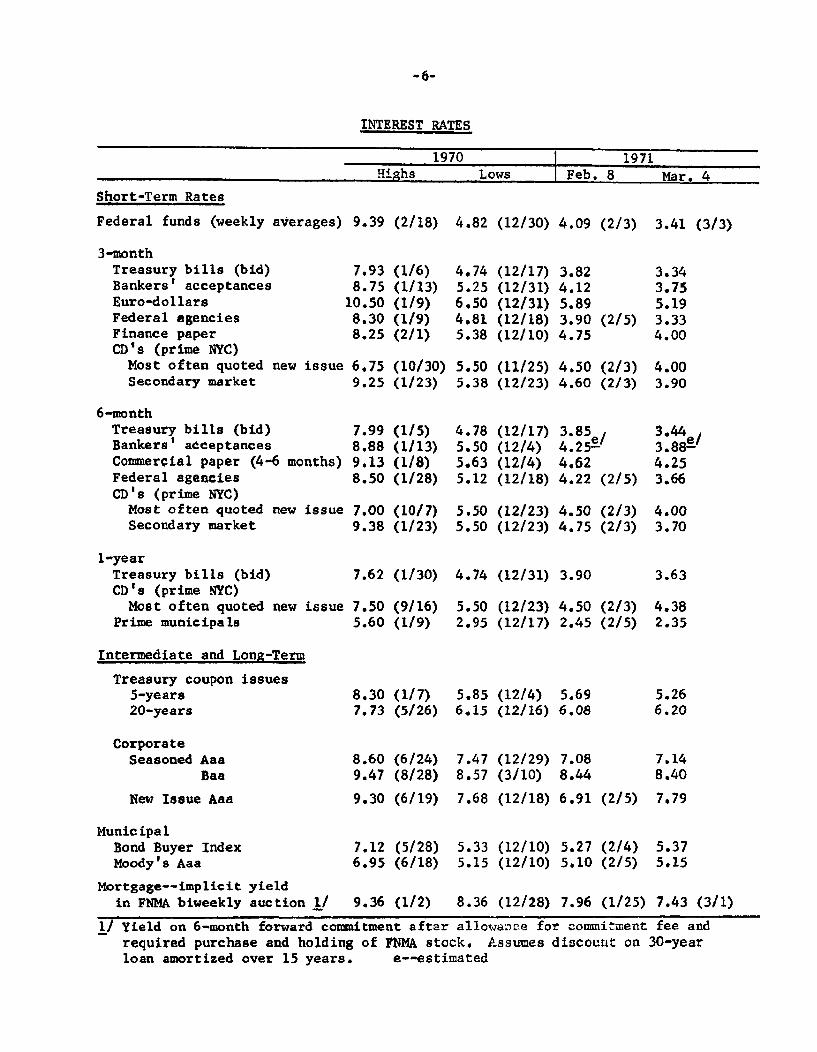
INTEREST RATES
1970 1971
Highs Lows Feb. 8 Mar. 4
Short-Term Rates
Federal funds (weekly averages) 9.39 (2/18) 4.82 (12/30) 4.09 (2/3) 3.41 (3/3)
3-monthTreasury bills (bid)Bankers' acceptancesEuro-dollarsFederal agenciesFinance paperCD's (prime NYC)Most often quoted new issueSecondary market
6-monthTreasury bills (bid)Bankers' acceptancesCommercial paper (4-6 months)Federal agenciesCD's (prime NYC)Most often quoted new issueSecondary market
1-yearTreasury bills (bid)CD's (prime NYC)Most often quoted new issue
Prime municipals
Intermediate and Long-Term
Treasury coupon issues5-years20-years
CorporateSeasoned Aaa
Baa
New Issue Aaa
MunicipalBond Buyer IndexMoody's Aaa
7.938.7510.508.308.25
(1/6)(1/13)(1/9)(1/9)(2/1)
4.745.256.504.815.38
(12/17)(12/31)(12/31)(12/18)(12/10)
3.824.125.893.90 (2/5)4.75
6.75 (10/30) 5.50 (11/25) 4.50 (2/3)9.25 (1/23) 5.38 (12/23) 4.60 (2/3)
7.998.889.138.50
(1/5)(1/13)(1/8)(1/28)
7.00 (10/7)9.38 (1/23)
7.62 (1/30)
7.50 (9/16)5.60 (1/9)
8.30 (1/7)7.73 (5/26)
8.60 (6/24)9.47 (8/28)
9.30 (6/19)
7.12 (5/28)6.95 (6/18)
4.785.505.635.12
(12/17)(12/4)(12/4)(12/18)
3.854.25e !4024.624.22 (2/5)
5.50 (12/23) 4.50 (2/3)5.50 (12/23) 4.75 (2/3)
4.74 (12/31) 3.90
5.50 (12/23) 4.50 (2/3)2.95 (12/17) 2.45 (2/5)
5.85 (12/4) 5.696.15 (12/16) 6.08
7.47 (12/29) 7.088.57 (3/10) 8.44
7.68 (12/18) 6.91 (2/5)
5.33 (12/10) 5.27 (2/4)5.15 (12/10) 5.10 (2/5)
3.343.755.193.334.00
4.003.90
3.443.88e'4.253.66
4.003.70
3.63
4.382.35
5.266.20
7.148.40
7.79
5.375.15
Mortgage--implicit yieldin FNMA biweekly auction 1/ 9.36 (1/2)
1/ Yield on 6-month forward commitment after
8.36 (12/28) 7.96 (1/25) 7.43 (3/1)
allowance for commitment fee andrequired purchase and holding of FNMA stock. Assumes discount on 30-yearloan amortized over 15 years, e--estimated
International Developments
To clarify the references on pages IV-9 and IV-13 to
guilder-dollar swaps by the Netherlands Bank with Dutch commercial
banks, it may be noted that these swaps, unlike those of the Bank
of England, involve spot purchases of dollars by the central bank
with forward sale. The Netherlands Bank's swaps, which began last
October, have facilitated the use of dollar borrowing abroad by
commercial banks to relieve a seasonally tight liquidity position
in the Netherlands. At the maturity of such a swap, the commercial
bank needs to acquire guilders to fulfill its contract. Unless the
central bank decides to make a new swap, the financial market would
be put under renewed strain. Some swaps were in fact rolled over
in January, and in February new swaps were made as seasonal tightness
due to tax payments persisted.

CORRECTIONS:
Page II-30 Table, line 2, used cars, June to September should be
minus 13.2, December 1970 to January 1971 should be minus 24.2.
Page III-9, table for March 1 change 7.48 to 7.43.
Page III-10, line 9 change 7.48 to 7.43.
Page III-10, line 10 change December to November.
Erratum: Page 111-17 line 3 erroneously stated the amount of System
purchases of over 5-year coupon issues since the last meeting at $38
million. The correct number is $381 million.
Appendix A, Page 1, paragraph 3 last line should include ... and a
similar proportion expect a modest increase.

SUPPLEMENTAL APPENDIX A: BANK LENDING PRACTICES SURVEY*
The 125 banks participating in the February 15, 1971, Surveyof Bank Lending Practices generally echoed the same responses reportedin the previous survey. Ample fund availability in connection withsluggish loan demands induced banks to ease further their lendingpolicies in nearly all areas.
Loan Demand
About 65 per cent of the participants had experienced furtherslackening in loan demand and about a third foresaw little improvementover the next three months. Roughly 10 per cent of the respondents,however, had experienced an increase in loan requests and nearly afifth predicted some future strengthening.
Lending Terms and Conditions
As would be expected, core than four-fifths of the panelreported a reduction in interest rates charged since the Novembersurvey. However, about 15 per cent had not indicated altering theirterms despite several general reductions in the prime rate during thethree months covered by the survey. Banks also eased their compensatingbalance requirements and were more flexible in their maturity restraintson term loans. As in the previous survey, bank concern about creditquality has resulted in no relaxation of standards of credit worthiness.
The net responses of banks in reviewing credit lines, shownin Table 2A, indicate a substantial easing in lending policies relativeto the type of customer. New customers in particular were experiencinga much less restrictive atmosphere, and nonlocal customers were reportedto be subject to considerably less screening than had been the case.The dramatic change in lending policies over the past two reports isdemonstrated by the fact that there has been no period since theinitiation of the survey in 1964 in which banks reported this magnitudeof easing in two consecutive surveys.
Lending to Noncaptive Finance Companies
Terms imposed on loans to financial institutions were noteased nearly as much as those on commercial and industrial loans. Onlyabout half of the respondents reported any easing in interest ratesand few banks (less than 10 per cent) had relaxed their enforcement ofbalance requirements. About 25 per cent of the respondents, however,were more willing to establish or enlarge existing credit lines whichreflected a continuation of the pattern reported in November.
*Prepared by Marilyn Barron, Research Assistant, Banking Section,Division of Research and Statistics.

-2-
Willingness to Make Other Types of Loans
Due to the continued weakness in loan demands and increasedfund availability, banks have become much more aggressive in seekingnew loans. More than one-half are more inclined to extend term loansto businesses, although some banks report an interest in loans primarilyof less than five years. Consumer installment loans continue to bequite attractive to most bankers as would be expected. Half of therespondents report continued interest in mortgage loans, especiallyon single-family dwellings. Twenty-five to 30 per cent of theparticipants are more willing to make mortgage loans for multi-familyor other types of structures.
Variation by Size of Bank
No significant differences were evident in the responsesof banks with more than $1 billion in deposits compared with bankswith deposits of less than $1 billion. But the smaller banks appearedto be somewhat less aggressive in soliciting new loans and were alittle more cautious in relaxing their lending policies.
Supplemental responses to the survey underscored the quality-consciousness prevalent at most banks and noted in previous surveys.Some banks did volunteer comments, that despite their highly liquidpositions, they have maintained a "wait and see" attitude and aretrying to keep most of their lending at the shorter end of the maturityspectrum.

NOT FOR QUOTATION OR PUBLICATION TABLE I
QUARTERLY SURVEY OF CHANGES IN BAhK LENDING PRACTICESAT SELECTED LARGE BANKS IN THE U.S. 1/
(STATUS OF POLICY ON FEBRUARY 15, 1971 COMPARED TO THREE MONTHS EARLIER)(NUMBER OF BANKS & PERCENT OF TOTAL BANKS REPORTING)
STRENGTH OF DEMAND FOR COMMERCIAL ANDINDUSTRIAL LOANS (AFTER ALLOWANCE FORBANK'S USUAL SEASONAL VARIATION)
COMPARED TO THREE MONTHS AGO
ANTICIPATED DEMAND IN NEXT 3 MONTHS
LENDING TO NONFINANCIAL BUSINESSES
TERMS ANC CONDITIONS:
INTEREST RATES CHARGED
COMPENSATING OR SUPPORTING BALANCES
STANDARDS OF CREDIT WORTHINESS
MATURITY OF TERM LOANS
REVIEWING CREDIT LINES OR LOAN APPLICATIONS
ESTABLISHED CUSTOMERS
NEW CUSTOMERS
LOCAL SERVICE AREA CUSTOMERS
NONLOCAL SERVICE AREA CUSTOMERS
TOTAL
BANKS PCT
125 100.0
125 100.0
ANSWERINGQUESTION
BANKS PCT
124 100.0
124 100.0
124 100.0
124 100.0
125 100.0
125 100.0
125 100.0
125 100.0
MUCHSTRONGER
BANKS PCT
MUCHFIRMERPOLICY
BANKS PCT
0 0.0
0 0.0
1 0.8
0 0.0
0 0.0
0 0.0
MODERATELYSTRONGER
BANKS PCT
12 9.6
21 16.8
MODERATELYFIRMERPOLICY
BANKS PCT
0 0.0
2 1.6
6 4.8
1 0.8
1 0.8
3 2.4
1 0.8
4 3.2
ESSENTIALLYUNCHANGED
BANKS PCT
31 24.8
62 49.6
ESSENT IALLYUNCHANGEDPOLICY
BANKS PCT
18 14.5
91 73.4
111 89.6
91 73.4
68 54.4
48 38.4
66 52.8
71 56.8
MODERATELYWEAKER
BANKS PCT
72 57.6
39 31.2
MODERATELYEASIERPOLICY
BANKS PCT
61 49.2
31 25.0
6 4.8
30 24.2
49 39.2
64 51.2
52 41.6
46 36.8
PAGE 01
MUCHWEAKER
BANKS PCT
MUCHEASIEROOLICY
BANKS PCT
45 36.3
0 0.0
0 0.0
2 1.6
7 5.6
10 8.0
6 4.8
3 2.4
I/ SURVEY OF LENDING PRACTICES AT 125 LARGE BANKS REPORTING IN THE FEDERAL RESERVE OUARTERLY INTEREST R4TE SURVEYAS OF FEBRUARY 15, 1971.

NOT FOR QUOTATION OR PUBLICATION
FACTORS RELATING TO APPLICANT 2/
VALUE AS DEPOSITOR ORSOURCE OF COLLATERAL BUSINESS
INTENDED USE OF THE LOAN
AN SWER INGQUESTION
BANKS PCT
124 100.0
125 100.0
MUCHFIRMERPOL ICY
BANKS PCT
MODERATEL YFIRMERPCLICY
BANKS PCT
ESSENTIALLYUNC HANGEDPOLICY
BANKS PCT
94 75.9
89 71.2
LENDING TO "NONCAPTIVE" FINANCE COMPANIES
TERMS AND CONDITIONS;
INTEREST RATES CHARGED
COMPENSATING OR SUPPORTING BALANCES
ENFORCEMENT OF BALANCE REQUIREMENTS
ESTABLISHING NEW OR LARGER CREDIT LINES
WILLINGNESS TO MAKE OTHER TYPES OF LOANS
TERP LOANS TO BUSINESSES
CONSUMER INSTALMENT LOANS
SINGLE FAMILY MORTGAGE LOANS
MULTI-FAMILY MORTGAGE LOANS
ALL OTHER MORTGAGE LOANS
PARTICIPATION LOANS WITHCORRESPONDENT BANKS
LOANS TO BROKERS
124 100.0
124 100.0
124 100.0
124 100.0
ANSWERINGQUESTION
BANKS PCT
125 100.0
124 100.0
121 100.0
120 100.0
122 100.0
125 100.0
122 100.0
0 0.0
0 0.0
CONSIDERABLYLESS
WILLING
BANKS PCT
0 0.0
0 0.0
1 0.8
1 0.8
1 0.8
1 0.8
0 0.0
O 0.0
1 0.8
5 4.0
1 0.8
MODERATELYLESS
WILLING
BANKS PCT
1 0.8
0 0.0
0 0.0
0 0.0
0 0.0
O 0.0
O 0.0
57 45.9
117 94.4
109 87.9
70 56.5
ESSENTIALLYUNCHANGED
BA4KS PCT
55 44.0
57 45.9
52 43.0
89 74.2
82 67.2
74 59.2
88 72.1
41 33.1
6 4.8
10 8.1
49 39. 5
MODERATELYMORE
WILL ING
BANKS PCT
66 52.8
56 45.2
53 43.8
27 22.5
35 28.7
47 37.6
31 25.4
26 21.0
0 0.0
0 0.0
2 1.6
CONSIDERABLYMORE
WILLING
BANKS PCT
3 2.4
11 8.9
15 12.4
3 2.5
4 3.3
3 2.4
3 2.5
2/ FOR THESE FACTORS, FIRMER MFANS THE FACTORS WERE CONSIDERED MORE IMPORTANT IN MAKINGCREDIT REQUESTS, AND EASIER MEANS THEY WERE LESS IMPORTANT.
DECISIONS FOR APPROVING
MODERATELYEASIFRPOLICY
BANKS PCT
23 18.5
31 24.8
MUCHEASIERPOL I CY
BANKS PCT
1 0.8
2 1.6
TABLE I (COhTINUED) PAGE 02

NOT FOR QUOTATION OR PUBLICATION TABLE 2
COMPARISON OF QUARTERLY CHANGES IN BANK LENDING PRACTICES AT BANKS GROUPED BY SIZE OF TOTAL DEPOSITS 1/(STATUS OF POLICY ON FEBRUARY 15, 1971, COMPARED TO THREE MONTHS EARLIER)
(NUMBER OF BANKS IN EACH COLUMN AS PER CENT OF TOTAL BANKS ANSWERING QUESTION)
STRENGTH OF OENANO FOR COMMERCIAL ANDINDUSTRIAL LOANS (AFTER ALLOWANCE FORBANK'S USUAL SEASONAL VARIATION)
COMPARED TO THREE MONTHS AGO
ANTICIPATED DEMAND IN NEXT 3 MONTHS
TOTAL
t$ & UNDEROVER $1
100 100
100 100
SIZE OF BANK
MUCHSTRONGER
$1 & UNDEROVER $1
-- TOTL CEPDSITS IN BILLIONS
MODERAT EL YSTRONGER
S1 & UNDEROVER Sl
ESSENTIALLYUt CHAN GED
$1 E UNDEROVER SI
MODERATELYWEAKER
$1 & UNDEROVER $1
MUCHWEAKER
$1 C UNDEROVER 1I
TOTAL
$1 & UNDEROVER $1
LENDING TO NONFINANCIAL BUSINESSES
TERMS ANC CONDITIONS:
INTEREST RATES CHARGED 100 100
COMPENSATING OR SUPPORTING BALANCES 100 100
STANDARDS OF CREDIT WORTHINESS 100 100
MATURITY OF TERN LOANS 100 100
REVIEWING CREDIT LINES OR LOAN APPLICATIONS
ESTABLISHED CUSTOMERS 100 100
NEW CUSTOMERS 100 100
LOCAL SERVICE AREA CUSTOMERS 100 100
NONLOCAL SERVICE AREA CUSTOMERS 100 100
MUCHFIRMER
$1 C UNDEROVER $1
MODERATELYFIRMER
$1 & UNDEROVER $1
ESSENTIALLYUNCHANGED
$1 & UNDEROVER S1
MODERATELYWEAKER
$1 C UNDEROVER $S
0 0 17
2 1 76
60 39 35
MUCHWEAKER
$1 & UNDEROVER $1
38 35
0 0
6 6
9 7
7 3
4 1
1/ SURVEY OF LENDING PRACTICES AT 54 LARGE BANKS (DEPOSITS OF $1 BILLION OR MORE) AND 71 SMALL BANKS (DEPOSITS OF LESS THAN$1 BILLIONI REPORTING IN THE FEDERAL RESERVE QUARTERLY INTEREST RATE SURVEY AS OF FEBRUARY 15, 1971.
PAGE 03

NOT FOR QUOTATION OR PUBLICATION
FACTORS RELATING TO APPLICANT 2/
VALUE AS DEPOSITOR ORSOURCE OF COLLATERAL BUSINESS
INTENDED USE OF THE LOAN
LENDING TO "NONCAPTIVE" FINANCE COMPANIES
TERMS AND CONDITIONS:
INTEREST RATES CHARGED
COMPENSATING OR SUPPORTING BALANCES
ENFORCEMENT OF BALANCE REQUIREMENTS
ESTABLISHING NEW OR LARGER CREDIT LINES
WILLINGNESS TO MAKE OTHER TYPES OF LOANS
TERM LOANS TO BUSINESSES
CONSUMER INSTALMENT LOANS
SINGLE FAMILY MORTGAGE LOANS
MULTI-FAMILY MORTGAGE LOANS
ALL OTHER MORTGAGE LOANS
PARTICIPATION LOANS WITHCORRESPONDBIT BANKS
LOANS TO BROKERS
NUMBERANSWERINGQUESTION
$1 & UNDEROVER $1
100 100
100 100
100 100
100 100
100 100
100 100
NUMBERANSWERINGQUESTION
$1 & UNDEROVER $1
100 100
100 100
100 100
100 100
100 100
100 100
100 100
SIZE OF BANKMUCH
FIRMERPOLICY
Sl & UNDEROVER $1
CONSIDERABLYLESS
MILLI NG
$1 G UNDEROVER $1
-- TOTAL DEPOSITS IN BILLIONSMODERATELY ESSENTIALLY
FIRMER UNCHAN GEDPCLICY POLICY
$1 & UNDEROVER $
MODERATELYLESS
WILLING
t$1 UNDEROVER $1
$1 6 UNDEROVER $1
43 48
92 96
84 91
45 66
ESSENTIALLYUNCHANGED
St & UNDEROVER $1
MOOERATELYEASIERPOLICY
$1 & UNDEROVER $1
MUCHFASIFRPOLICY
$1 E UNDEROVER Sl
23 20
MODERATELYMORE
WILLING
$1 & UNDEROVER SI
0 0 1 46 43 50 55
0 0 47
0 0 45
0 0 71
0 0 60
0 0 59
0 0 57
CONSIDERABLYMORE
WILL ING
$1 E UNDEROVFR $1
4 1
42 48
41 46
29 17
40 20
0 4
4 1
2/ FOR THESE FACTORS, FIRMER MEANS THE FACTORS MERE CONSIDERED MORE IMPORTANT IN MAKINGCREDIT REOUESTS, AND EASIER MEANS THEY MERE LESS IMPORTANT.
DECISIONS FOR APPROVING
TABLE 2 (COMTINUED) PAGE 04

TABLE 2A
NET RESPONSES OF BANKS IN LENDING PRACTICES SURVEYS(In per cent)
Feb. May Aug. Nov. Feb. May Aug. Nov. Feb.1969 1969 1969 1969 1970 1970 1970 1970 1971
Strength of loan demand- / 54.4 60.0 30.6 28.0 -1.6 12.1 16.0 -56.8 -54.4(compared to 3 months ago)
Anticipated demand in next 3 months 49.2 41.8 5.7 8.9 -8.0 11.2 13.6 -32.0 -13.6
LENDING TO NONFINANCIAL BUSINESSES2-
Terms and Conditions
Interest rates charged 86.2 91.0 78.3 49.6 34.4 -12.8 15.2 -73.6 -85.5Compensating or supporting balances 64.3 75.6 68.3 57.6 38.4 18.4 24.8 -0.8 -23.4Standards of credit worthiness 32.8 41.4 40.6 36.0 22.4 20.8 22.4 4.8 0.8Maturity of term loans 30.3 42.3 42.2 35.2 17.6 10.4 14.4 -7.2 -25.0
Reviewing Credit Lines
Established customers 32.5 47.2 51.6 36.8 18.4 5.6 1.6 -32.0 -44.0New customers 61.7 j80.2 81.4 60.8 34.4 17.6 6.4 -40.8 -56.8Local service area customers 30.9 46.7 48.8 32.0 14.4 5.6 -3.2 -33.6 -45.8Nonlocal service area customers 49.5 71.3 68.8 56.5 31.4 22.6 16.1 -16.8 -35.2
Factors Relating to Applicant(Net percentage indicatingmore important)
Value of depositor as source ofbusiness 58.6 67.2 65.0 46.0 29.9 18.5 18.5 -- -14.5
Intended use of loan 54.5 71.6 68.5 39.2 21.6 12.0 9.6 -9.6 -24.0
LENDING TO NONCAPTIVE FINANCE COMPANIES- /
Terms and Conditions
Interest rates charged 53.3 50.8 48.0 19.3 14.5 -16.0 9.7 -41.6 -54.1Compensating or supporting balances 22.9 27.9 35.0 26.7 21.7 6.4 12.1 1.6 - 4.C
Enforcement of balance requirements 29.5 42.6 42.3 34.7 30.7 16.0 23.4 6.4 - 4.1
Establishing new or larger credit lines 54.9 62.4 62.0 48.4 32.2 21.6 22.6 -10.4 -38.7
WILLINGNESS TO MAKE OTHER LOANS 3 /
Term loans to businesses 48.8 64.3 65.9 48.0 21.6 12.8 8.8 -28.8 -54.4Consumer instalment loans 4.2 17.2 26.9 24.2 17.7 -4.1 -- -24.2 -54.1Single-family mortgage loans 30.8 45.5 49.7 30.4 19.7 -8.2 -11.6 -25.6 -55.LMulti-family mortgage loans 40.1 57.5 58.3 36.3 21.8 3.4 -- -12.4 -24.2All other mortgage loans 42.5 62.0 62.5 42.3 22.2 9.9 5.0 -15.4 -31.2Participation loans with correspon-dent banks 18.7 38.4 48.4 31.5 10.6 5.6 -2.4 -9.6 -39.:
Loans to brokers 34.2 40.0 59.3 36.1 20.5 20.3 10.61 -0.9 -27.!
1/ Per cent of banks reporting stronger loan demand minus per cent of banks reportingweaker loan demand. Positive number indicates net stronger loan demand, negative numberindicates net weaker loan demand.2/ Per cent of banks reporting firmer lending policies minus per cent of banks reporting
weaker lending policies. Positive number indicates net firmer lending policies, negativeindicates net easier lending policies.3/ Per cent of banks reporting less willingness to make loans minus per cent of banks morewilling to make loans. Positive number indicates less willingness, negative number indicatesmore willingness.