Embed Size (px)
Citation preview

Prefatory Note
The attached document represents the most complete and accurate version available based on original copies culled from the files of the FOMC Secretariat at the Board of Governors of the Federal Reserve System. This electronic document was created through a comprehensive digitization process which included identifying the best-preserved paper copies, scanning those copies,1 and then making the scanned versions text-searchable.2 Though a stringent quality assurance process was employed, some imperfections may remain.
Please note that this document may contain occasional gaps in the text. These gaps are the result of a redaction process that removed information obtained on a confidential basis. All redacted passages are exempt from disclosure under applicable provisions of the Freedom of Information Act.
1 In some cases, original copies needed to be photocopied before being scanned into electronic format. All scanned images were deskewed (to remove the effects of printer- and scanner-introduced tilting) and lightly cleaned (to remove dark spots caused by staple holes, hole punches, and other blemishes caused after initial printing). 2 A two-step process was used. An advanced optimal character recognition computer program (OCR) first created electronic text from the document image. Where the OCR results were inconclusive, staff checked and corrected the text as necessary. Please note that the numbers and text in charts and tables were not reliably recognized by the OCR process and were not checked or corrected by staff.

CONFIDENTIAL (FR)CLASS II - FOMC
July 6, 1979
SUPPLEMENT
CURRENT ECONOMIC AND FINANCIAL CONDITIONS
Prepared for theFederal Open Market Committee
By the StaffBoard of Governors
of the Federal Reserve System

TABLE OF CONTENTS
THE DOMESTIC NONFINANCIAL ECONOMY
Employment at nonfarm establishments. . . . . . . . .Producer prices . . . . . . . . . . . . . . .Consumer instalment credit outstanding . . . . . . .New capital appropriations of investor owned electric
and gas utilities . . .... ... . . . . . . . .
TABLES:Changes in employment . . . . . ..Selected Unemployment Rates .. . . ..Hourly earnings index . . .. ....Recent changes in producer prices . . .Consumer instalment credit. . . .Capital Appropriations and Expenditures .
THE DOMESTIC FINANCIAL ECONOMY
Commercial paper outstanding . . . ..
ERRATA: ... . .. ........
TABLES:Change in commercial paper outstanding .Commercial bank credit . . . . . .Selected financial market quotations . .
* * .
* * *
* . * . .
* * * * .
* .* *
* *
Monetary aggregates. ... . . . . . . . . . . ....
APPENDIX: ............. . . ... ... . . . . .Chart 1 . . . . . . . . . . . . . . . . . . . . . .Chart 2 ... . . . .. . . . . .... . .....
* *
* .
A-1A-3A-4

SUPPLEMENTAL NOTES
Employment at nonfarm establishments continued to increase at a
rather slow rate in June as the net gain in payroll employment was 97,000.
The average monthly increase in nonfarm employment between March and June
was just 115,000 compared to 325,000 during the preceding three months.
In June, employment increases were concentrated in three major sectors--
services (50,000), construction (30,000), and transportation (45,000),
in which the bulk of the rise is attributable to the return of striking
airline workers. These gains more than offset the 45,000 decline in
manufacturing employment. More than three-quarters of the drop in factory
jobs occurred in the transportation equipment industry; in addition, small
cutbacks in employment were widespread among producers of nondurable goods.
The average workweek in manufacturing edged down 0,1 hour to 40.1 hours.
The household survey, which measures total employment and unem-
ployment, indicated a much larger monthly increase in employment in June
(435,000) than the establishment tally. The household measure, however,
had indicated an unusually sharp decline in April, and last month's
increase still leaves the June level of total employment almost 90,000
below the March reading.
Unemployment declined 155,000 in June with almost the entire drop
among teenagers. As a result, the teenage jobless rate fell sharply,
pulling the over-all unemployment rate down from 5.8 in May to 5.6 percent
in June. (BLS cautions that seasonal adjustment of data for teenagers is

particularly difficult in June, and, therefore, the May to June changes
may be subject to unusual fluctuations.) Unemployment rates for most
adult workers, by contrast, remained in the same narrow range that they
have held for the past year.
The index of average hourly earnings rose at a 5 percent annual
rate in June, bringing the average rate of increase for the second quarter
to a 6-1/2 percent rate. Wage rates in manufacturing and construction
continued to rise at rapid rates in 1979:QII--at rates of 9 percent
and 8 percent respectively. In service-producing industries, however,
wage increases decelerated in the second quarter from first-quarter rates,
which were effected by the January minimum wage adjustment.
Producer prices of finished goods, seasonally adjusted, rose 0.5
percent on average from May to June. The increase, slightly larger than
in May but smaller than in earlier months this year, reflected a further
large decline in prices of consumer finished foods and another sizable
increase in prices of other finished goods. Prices of foods and food
materials at all stages of processing declined in June, and the rate of
increase in prices of nonfood, nonenergy goods slowed somewhat at the
finished and intermediate stages of processing. However, prices of crude
nonfood, nonenergy materials increased very sharply again in June, as did
prices of energy items.

The index of prices for consumer finished goods increased 0.5 percent
in June, somewhat more than the May increase but markedly lower than the
average rise for the first four months of the year. Prices of consumer
finished foods fell 1.2 percent, about the same as in May; most of all of
the June drop was due to lower prices for beef and veal, pork, and processed
poultry. Prices rose for roasted coffee, fruits and vegetables, fish,
eggs, and dairy products. Prices of consumer finished goods excluding foods
showed another sharp increase, 1.4 percent. Prices of consumer nonfood
nondurable goods advanced sharply further; its rise of 2 percent, led by
increases for heating oil and gasoline, was the largest in five years;
also increasing substantially were prices of leather footwear, tires
and tubes, and pharmaceutical preparations. Consumer durables goods prices
increased 0.4 percent, less than in April and May; increases for passenger
cars, precious jewelry, and household flatware were important contributors
to the price rise.
Prices of capital equipment rose 0.5 percent, somewhat less than in
April or May; large increases occurred for railroad equipment, motor
trucks, metal cutting machine tools, and photographic equipment.
Prices of intermediate materials and goods rose 0.9 percent in
June, about the same as in May. Intermediate nonfood goods prices increased
at May's rate of 1 percent, with sharply higher energy-related prices
accounting for a significant part of the advance. Prices of intermediate
materials for foods and feeds declined 0.6 percent last month, following
a 0,7 percent rise in May; this June decline reflected lower prices for animal
fats and oils, refined vegetable oils, flour, and manufactured animal feeds.

Crude materials increased 0.7 percent in price in June, slightly
less than the May increase. Prices of crude nonfood materials rose 3.3
percent, with large increases for iron and steel scrap, crude petroleum,
natural gas, cotton, and natural rubber accounting for most of the rise
in these materials. Prices of crude foodstuffs and feedstuffs fell 1.2
percent further, with declines for livestock and live poultry offsetting
increases, especially for wheat, green coffee, cocoa beans, raw cane sugar,
fluid milk, and corn.
On a commodity basis, average prices of all commodities rose 0.7
percent. Industrial commodities increased 1.2 percent in price, and prices
of farm and food products declined 0.8 percent.
Consumer instalment credit outstanding increased by $3.7
billion in May, after seasonal adjustment, down from a revised $4.0 billion
in April. The advance in May was equivalent to a 16 percent annual rate
of growth, compared with a revised 17 percent in April, 15 percent in the
first quarter, and 19 percent between December 1977 and December 1978. Most
of the slower growth in May was accounted for by commercial banks, where
credit expanded by $1.7 billion in May compared with the revised $2.1
billion in April.
Both credit extended and liquidation of existing debt increased
to new highs in May. Mobile home credit was the only major type that
expanded more in May than in April. Automobile credit, revolving credit,
and the large "other" category all rose less than in April.

New capital appropriations of investor owned electric and
gas utilities declined 32 percent in the first quarter of 1979, after
a 2.0 percent rise in the fourth, according to Confidential data from The
Conference Board. New appropriations net of cancellations, however
declined 63 percent in the first quarter, and were less than in any
quarter in the 1970s except the second quarter of 1977 and the third
quarter of 1978. It should be noted that this net appropriations series
is highly volatile; the mean quarterly change without regard to sign
was 83 percent between the first quarter of 1976 and the fourth quarter
of 1978.
Cancellations of previously approved appropriations of these
utilities increased sharply in the first quarter--particularly by
electric utilities, but total cancellations were not as large as in the
first and third quarters of last year or the second quarter of 1977.
The backlog of unspent appropriations for all utilities fell 3 percent
in the first quarter, and now represents 14.2 months of spending at
current rates--the lowest figure since 1973. Capital expenditures by
utilities rose only 0.7 percent in the first quarter, the smallest
rise since 1976 QIII.

CHANGES IN EMPLOYMENT 1/(Thousands of employees; based on seasonally adjusted data)
1978
Nonfarm payroll employment 2/Strike adjusted
ManufacturingDurableNondurable
ConstructionTrade, Finance and Services
Private nonfarm production workersManufacturing production workers
Total employment 3/Nonagricultural
- - - Average327329
1979QI QII May June
monthly117126
changes - - -
268 97251 85
-36-26-102965
329 -29344 -2
213 60-31 -37
144 436147 360
1/ Changes are from final month of preceding period to final month of periodindicated.
2/ Survey of establishments. Not strike adjusted, except where noted.3/ Survey of households.
SELECTED UNEMPLOYMENT RATES
(Percent; based on seasonally adjusted data)
19791973 1978 QI QII May June
Total, 16 years and older 4.9 6.0 5.7 5.7 5.8 5.6
Teenagers 14.5 17.0 15.8 16.2 16.8 15.320-24 years old 7.8 5.4 8.7 8.8 8.9 8.9Men, 25 years and older 2.5 3.2 3.2 3.2 3.1 3.1Women, 25 years and older 4.0 5.0 4.9 4.9 5.0 4.8
White 4.3 5.2 5.0 4.9 5.0 4.9
Black and other 8.9 11.9 11.4 11.6 11.6 11.3
Fulltime workers 4.3 5.5 5.2 5.2 5.2 5.1
White collar 2.9 3.5 3.4 3.3 3.2 3.4Blue collar 5.3 6.9 6.5 6.7 6.7 6.5
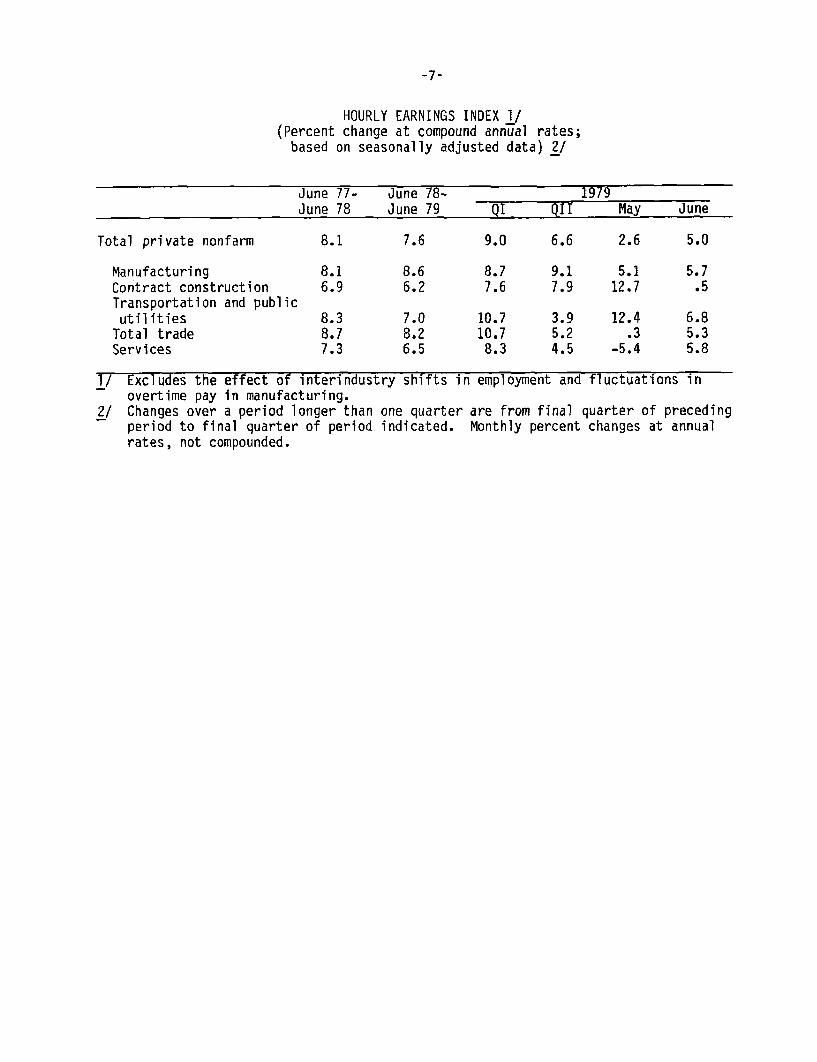
HOURLY EARNINGS INDEX 1/(Percent change at compound annual rates;based on seasonally adjusted data) 2/
June 77- June 78- 1979
June 78 June 79 QI QII May June
Total private nonfarm 8.1 7.6 9.0 6.6 2.6 5.0
Manufacturing 8.1 8.6 8.7 9.1 5.1 5.7Contract construction 6.9 6.2 7.6 7.9 12.7 .5Transportation and publicutilities 8.3 7.0 10.7 3.9 12.4 6.8Total trade 8.7 8.2 10.7 5.2 .3 5.3Services 7.3 6.5 8.3 4.5 -5.4 5.8
1/ Excludes the effect of interindustry shifts in employment and fluctuations inovertime pay in manufacturing.
2/ Changes over a period longer than one quarter are from final quarter of precedingperiod to final quarter of period indicated. Monthly percent changes at annualrates, not compounded.

RECENT CHANGES IN PRODUCER PRICES(Percent change at compound annual rates; based
on seasonally adjusted data)1/
Relativeimportance 1979 1979Dec. 1978 1978 QI QII May June
Finished goods 41.0 9.2 13.7 7.5 4.5 6.2Consumer foods 10.4 11.9 20.1 -10.5 -15.3 -14.5Consumer nonfoods 18.6 8.4 12.9 17.3 15.0 16.6Capital equipment 12.1 8.0 9.8 9.6 7.9 6.1
Materials:Intermediate 2/ 44.8 8.3 13.2 15.1 12.2 11.6Construction 8.3 11.0 11.6 7.0 1.5 6.4
Crude nonfood 4.8 15.6 29.5 21.7 27.5 39.1Crude food 6.8 18.3 30.6 -6.8 -3.4 -14.2
Memorandum:Energy commodities 3/ 11.0 7.1 20.8 58.4 51.1 50.6
1/ Changes are from final month of preceding period to final month of periodindicated. Monthly changes are not compounded.
2/ Excludes intermediate materials for food manufacturing and manufacturedanimal feeds.
3/ Fuels and related products and power. This series is on a commodity basis,while the other data in this table are on a stage of processing basis.

CONSUMER INSTALLMENT CREDIT1/
1978 19791976 1977 1978 QIV QI Apr. May
TotalChange in outstandingsBillions of dollars 21.7 35.3 44.8 46.5 40.4 48.5 44.8Percent 12.6 18.2 19.4 17.9 14.8 17.2 15.7Bank share (percent) 49.8 52.9 53.1 46.2 43.8 50.3 44.5
ExtensionsBillions of dollars 211.0 254.1 298.3 312.9 313.8 322.7 336.3Bank share (percent) 46.1 46.4 47.8 47.2 47.2 48.2 48.2
LiquidationsBillions of dollars 189.4 218.8 253.5 266.4 273.4 274.2 291.5Ratio to disposable income 16.0 16.8 17.5 17.6 17.5 17.2 18.2
Automobile CreditChange in outstandingsBillions of dollars 10.5 15.2 19.6 19.6 18.9 15.8 14.7Percent 18.3 22.5 23.6 20.1 18.5 14.8 13.5
ExtensionsBillions of dollars 63.7 75.6 89.0 92.5 92.4 94.1 98.7
1/ Quarterly and monthly dollar figures and related percent changes are seasonallyadjusted annual rates.

-10-
Capital Appropriations and Expenditures(Percent change, seasonally adjusted)
1978 1979QI QII QIII QI QI
1/Capital Appropriations-Electric Utilities 13.5 -49.1 -29.1 202.5 -65.4Gas Utilities -24.4 87.8 -60.9 165.3 -45.0
Total 9.0 -37.8 -37.1 196.8 -62.6
Capital ExpendituresElectric Utilities 2.3 4.0 2.8 8.3 -0.7Gas Utilities -0.3 2.0 19.5 -0.5 9.6
Total 1.9 3.8 4.9 7.0 0.7
1/ Net of Cancellations.

-11-
The Domestic Financial Economy
Commercial paper outstanding rose by a record $5.0 billion in
June, as all major categories posted sharp gains (see Table). Nonbank-
related financial issuers that directly place their paper increased their
outstandings by $1.8 billion, reflecting in large part the further rise
in automobile dealer inventories during June. Dealer-placed nonbank
financial paper increased sharply also, and commercial paper dealers
reported that this gain was broadly based. Nonfinancial paper outstanding
climbed by $1.1 billion, due to heavy issuance by both public utilities
and industrial corporations. Bank-related issuers boosted their out-
standings by $800 million in June; this category has increased by almost
$2.9 billion since the end of last year.
International Developments:
Errata: Part I, page 1-25, line 13, should read "$185 billion" instead
of $180 billion".

-12-
CHANGE IN COMMERCIAL PAPER(monthly totals or monthly averages, sea.
OUTSTANDINGadj., billions of dollars)
1979 Outstanding
QI QII / Apr. May JuneP/ 6/30/79P /
Total commercial paper 2.4 3.4 1.9 3.4 5.0 101.2
1/Bank-related- 0.2 0.8 0.6 0.9 0.8 18.7Nonbank-related 2.2 2.7 1.3 2.5 4.3 82.5
Financial 1.8 1.8 -0.2 2.3 3.2 58.7Dealer placed 0.6 0.8 0.3 0.7 1.4 12.8Directly placed 1.2 1.0 -0.5 1.6 1.8 45.9
Nonfinancial 0.4 1.0 1.6 0.2 1.1 2.38
1/ Not seasonally adjusted.p/ Preliminary.
NOTE: Components may not add to total due to rounding.
-13-
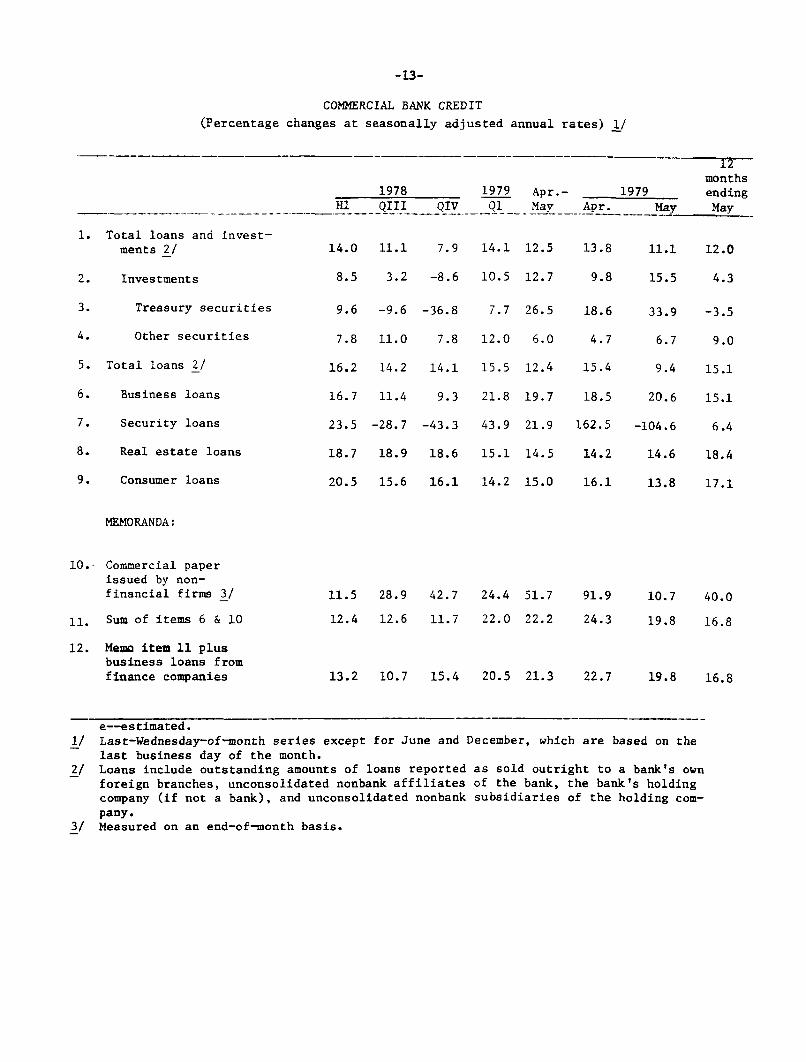
COMMERCIAL BANK CREDIT
(Percentage changes at seasonally adjusted annual rates) 1/
12
months1978 1979 Apr.- 1979 ending
Hl QIII QIV Q1 May Apr. May May
1. Total loans and invest-
ments 2/ 14.0 11.1 7.9 14.1 12.5 13.8 11.1 12.0
2. Investments 8.5 3.2 -8.6 10.5 12.7 9.8 15.5 4.3
3. Treasury securities 9.6 -9.6 -36.8 7.7 26.5 18.6 33.9 -3.5
4. Other securities 7.8 11.0 7.8 12.0 6.0 4.7 6.7 9.0
5. Total loans 2/ 16.2 14.2 14.1 15.5 12.4 15.4 9.4 15.1
6. Business loans 16.7 11.4 9.3 21.8 19.7 18.5 20.6 15.1
7. Security loans 23.5 -28.7 -43.3 43.9 21.9 162.5 -104.6 6.4
8. Real estate loans 18.7 18.9 18.6 15.1 14.5 14.2 14.6 18.4
9. Consumer loans 20.5 15.6 16.1 14.2 15.0 16.1 13.8 17.1
MEMORANDA:
10.- Commercial paper
issued by non-financial firms 3/ 11.5 28.9 42.7 24.4 51.7 91.9 10.7 40.0
11. Sum of items 6 & 10 12.4 12.6 11.7 22.0 22.2 24.3 19.8 16.8
12. Memo item 11 plusbusiness loans fromfinance companies 13.2 10.7 15.4 20.5 21.3 22.7 19.8 16.8
e--estimated.1/ Last-Wednesday-of-month series except for June and December, which are based on the
last business day of the month.2/ Loans include outstanding amounts of loans reported as sold outright to a bank's own
foreign branches, unconsolidated nonbank affiliates of the bank, the bank's holdingcompany (if not a bank), and unconsolidated nonbank subsidiaries of the holding com-pany.
3/ Measured on an end-of-month basis.

-14-
SELECTED FINANCIAL MARKET QUOTATIONS
(percent)
f.nu~L 11
1978 1/
High* Low
1978End of FOMC1 me A - 17
- 1979 z/FOMC
Mar 9'
ChangeJune July End of
9 5 1978710 .r n.*- 2 c 5 1
Short-term ratesFederal funds 1/
Treasury bills3-month6-month1-year
Commercial paper1-month3-month6-month
Large negotiable CDs 4/1-month3-month6-month
Euro-dollars3-month
Bank prime rate
Intermediate- and long-term rates
U.S. Treasury(constant maturity)3-year7-year
20-year
Municipal(Bond Buyer) 5/
Corporate AaaNew issue 6/Recently offered 7/
Primary conventionalmortgages 7/
5/10.25 6.58 10.25 9.96 10.17 10.32 10.33-
9.309.519.62
10.2910.5210.56
10.3610.9611.52
6.166.456.55
6.486.686.70
n.a.6.776.97p
9.269.489.69
10.3210.5510.61
10.2910.8311.44
9.509.499.24
10.0310.1310.15
10.0410.2110.40
9.709.509.16
9.9010.0010.01
10.0210.2110.44
8.758.918.73
9.669.689.63
9.899.94
10.08
9.199.008.73
9.729.669.63
9.819.859.88
+.08 +.16
-.07-.48-.96
-.60-.89-.98
-.48-.98
-1.56
-. 51-. 50-. 43
-.18-.34-. 38
-. 21-. 36-. 56
11.95 7.20 11.69 10.88 10.75 10.69 10.63 -1.06 -.12
11.57 7.75 11.75 11.75 11.75 11.50 11.50 -.25 -.25
9.599.229.00
7.407.728.01
9.599.238.99
6.67 5.58 6.61
9.459.209.12
9.359.159.16
8.968.908.89
8.798.748.79
6.33 6.30 6.18 6.08
9.30 8.61 -- 9.68 9.859.54 8.48 9.51 9.68 9.85
-.80-.49-.20
-.56-.41-.37
-. 53 -. 22
9.48 9 42p -. 09 -.43
10.38 8.98 10.38 10.48 10.73 11.10 11.10 +.72 +.37
Low High End of FOMC FOMC June July End of May8/ 8/ 1978 Apr.17 May 22 25 5 1978 FOMC
Stock pricesDow-Jones Industrial 742.12 907.74 805.01 857.93 845.37 844.25 835.75 +30.74 -9.62NYSE Composite 48.43 60.38 53.62 57.05 56.65 57.90 58.16 +4.54 +1.51AMEX Composite 119.73 176.87 150.56 178.65 181.75 199.73 199.16 +48.6 +17.41NASDAQ (OTC) 102.66 149.53 117.98 132.26 131.90 136.89 137.79 +19.81 +5.89
1/ Daily averages for statement week except where noted,2/ One-day quotes except as noted.3/ Average for statement week ending July 4.4/ Secondary market.5/ One-day quotes for preceding Thursday.6/ Averages for preceding week.7/ One-day quotes for preceding Friday.8/ Calendar week averages.
11 highs were reached at or close to the end of 1978.
rom:MayFOMC

-15-
UPDATED
MONETARY AGGREGATES
(Seasonally adjusted annual rates of growth) 1/
June '781978 1979 to
e- e/ to /HI QIII OIV 01 O11- May June- June 79-
Major monetary aggregates1. M-l (currency plus demand
deposits) 8.0 7.9 4.1 -2.1 7.6 0.7 14.2 4.62. M-2 (M-1 plus time & savings
deposits at CBs, otherthan large CDs) 7.7 9.8 7.6 1.8 8.6 5.4 13,8 7.3
3. M-3 (M-2 plus all depositsat thrift institutions) 8.3 10.3 9.3 4.7 7.8 4.9 11.6 8.3
Bank time and savings deposits4. Total 12.2 11.3 12.3 8.4 1.1 -1.4 0.4 7.55. Other than large negotiable
CDs at weekly reporting banks 7.6 11.0 10.2 4.5 9.3 8.7 13.4 9.26. Savings deposits 2.9 2.9 0.2 -9.6 -3.1 -7.2 7.8 -2.67. Individuals 2/ 2.7 4.1 0.0 -9.4 -2.9 -7.7 6.5 -2.28. Other 3/ 5.2 -10.1 0.0 -10.4 -8.0 8.2 16.3 -6.99. Time deposits 11.7 17.9 18.2 15.6 18.5 19.9 17.3 19.1
10. Small time 4/ 6.8 12.7 15.8 16.5 36.1 35.3 34.8 23.911. Large time 4/ 21.5 26.9 22.4 13.6 -12.1 -10.1 -15.8 10.412. Time and savings deposits sub-
ject to rate ceilings (6+10) 4.7 6.9 7.0 2 2 15.0 11.2 21,0 8.9Deposits at nonbank thrift institutions 5/13. Total 9.2 11.1 11.6 8.8 6.8 4.1 8.4 9.714. Savings and loan associations 9.5 12.3 13.1 11.3 7.8 5.1 9.4 11.315. Mutual savings banks 5.6 6.8 7.8 4.6 3.4 0.8 2.5 5.416. Credit unions 17.0 13.7 10.1 0.8 8.3 4.5 15.6 8.1MEMORANDA: Average monthly changes, billions of dollars17. Total U.S. Govt. deposits 6/ 0.3 1.1 -0.4 -2.0 1.4 1.2 4.4 0.018. Total large time deposits 7/ 3.6 2.9 4.7 1.3 -6.3 -5.3 -7.2 0.719. Nondeposit sources of funds 8/ 0.8 1.4 3.0 2.4 n.a. 1.1 n.a. n.a.
e--estimated. n.a.--not available, p--preliminary.1/ Quarterly growth rates are computed on a quarterly average basis.2/ Savings deposits held by individuals and nonprofit organizations.3/ Savings deposits of business, government, and others, not seasonally adjusted.4/ Small time deposits are time deposits in denominations less than $100,000. Large time
deposits are time deposits in denominations of $100,000 and above excluding negotiableCDs at weekly reporting banks.
5/ Growth rates computed from monthly levels are based on average of current and precedingend-of-month data.
6/ Includes Treasury demand deposits at commercial banks and Federal Reserve Banks andTreasury note balances.
7/ All large time certificates, negotiable and nonnegotiable, at all CBs.8/ Nondeposit borrowings of commercial banks from nonbank sources include Federal funds
purchased and security RPs plus other liabilities for borrowed money (including bor-rowings from the Federal Reserve), gross Eurodollar borrowings, and loans sold, lessinterbank borrowings.

Appendix*
Security RPs of All Commercial
Banks with the Nonbank Public
A monthly series has been developed for security repurchaseagreements (RPs) of all commercial banks. This new series is based ondaily average figures for RPs at 46 money market banks, blown up byusing quarterly estimates of the universe of RPs based on the Call Report.Since the Call collects only the sum of Federal funds and RPs, Federalfunds borrowings from nonbanks are removed using separate data for Federalfunds sold by S&Ls, MSBs and the FHLBB. Data subsequent to the mostrecent Call, which currently is December 1978, should be consideredpreliminary.
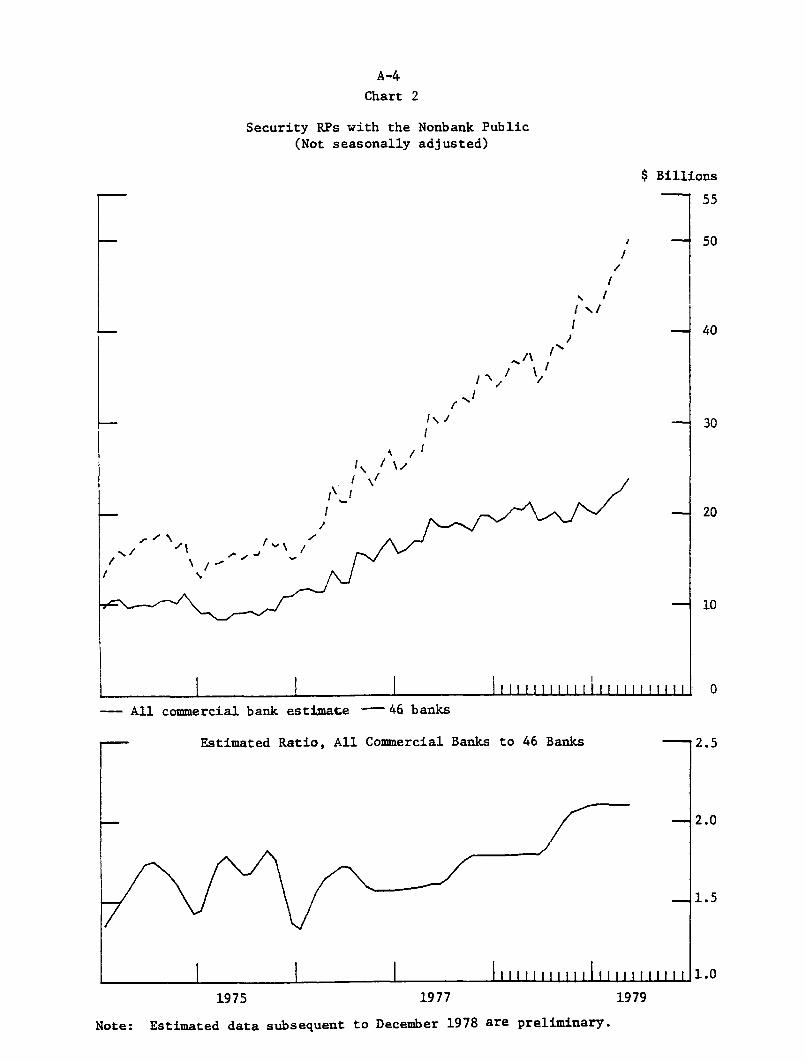
As shown in Chart 1, RPs are estimated to have risen rapidlyin recent years. As shown in the top panel of Chart 2, most of the morerecent growth in RPs has been accounted for by banks other than the46 money center banks, evidently reflecting collateral constraints atthe larger banks and a tendency for other banks to enter the marketmore vigorously in the face of strong loan demands. The estimated ratioof RPs at all commercial banks to RPs at 46 money market banks is shownin the bottom panel of Chart 2.
The quality of the series is highest for the period March1976 through September 1978, the only period for which all the datanecessary to calculate blowup factors are available. Before 1976,the Call Report did not provide information on the sum of Federal fundand RP liabilities (FF/RPs) by type of customer, and consequently FF/RPslent to banks was used to estimate FF/RPs borrowed from banks.1 As ofDecember 1978, the Call Report began collecting FF/RP data only for those424 banks havings assets in excess of $300 million. The universe of FF/RPsborrowed from nonbanks for this Call date was estimated from the averageratio of FF/RPs (excluding interbank) at the 424 reporting banks to FF/RPsat all banks (excluding interbank) on Call Report dates from March 1976through September 1978. The quality of the blowup factors beginning withthe one for December 1978 will depend on the continued stability of thisratio.
* Prepared by Thomas F. Brady, Banking Section.
1/ The Call report instructions define "bank" to include agenciesof foreign banks, stock savings banks, Edge and Agreement Corpora-tions performing a commercial banking business and industrial andprivate banks. Most of these institutions, including agenciesand Edges, do not complete the Call Report. Consequently, FF/RPslent to commercial banks do not equal FF/RPs borrowed from commer-
cial banks. Over the 1976-78 period, FF/RPs borrowed averaged
110 per cent of FF/RPs lent; this ratio was used to estimate in-terbank FF/RPs borrowing before 1976.
2/ Over the 11 Calls ending with September 1978 the ratios were:.895; .896; .898; .912; .916; .921; .915; .912; .919; .916; .912.
The average is .910.

A-2
The 46-bank series for FF/RPs begins in November 1969, andestimates for all commercial banks have been developed back to that month.However, many of the data necessary to calculate blowup factors are unavail-able as one goes further back in time, requiring even further estimation.One judgmental adjustment has been made to the series. The calculatedblowup factor for the first quarter of 1974 has been replaced by theaverage value of the factors that surround it. The calculated factorwas extremely large, and gave rise to what was regarded as an unreasonablylarge increase in RPs.

Chart 1
Estimated Security RPs of AllCommercial Banks with the Nonbank Public
(Seasonally adjusted)
$ Billions
-- 55
- 30
-- 20
I I I II t1 I IIIIII II III II II1975 1977 1979
Note: Data subsequent to December 1978 are preliminary.
\ -
- All commercial
-- Estimu
A-4
Chart 2
Security RPs with the Nonbank Public(Not seasonally adjusted)
$ Billions
55
S - 50
I/I
I */
- 40
/
I/ I
r'
/ - 30
S/
I \!
I -- 1 20I20
bank estimate - 46 banks
ated Ratio, All Commercial Banks to 46 Banks 2.5
2.0
1.5
IIIiii ii,,,11111111iiiwii 1.0
19791975 1977
Note: Estimated data subsequent to December 1978 are preliminary.