Embed Size (px)
Citation preview
Prefatory Note The attached document represents the most complete and accurate version available based on original copies culled from the files of the FOMC Secretariat at the Board of Governors of the Federal Reserve System. This electronic document was created through a comprehensive digitization process which included identifying the best-preserved paper copies, scanning those copies,1
and then making the scanned versions text-searchable.2
Though a stringent quality assurance process was employed, some imperfections may remain. Please note that some material may have been redacted from this document if that material was received on a confidential basis. Redacted material is indicated by occasional gaps in the text or by gray boxes around non-text content. All redacted passages are exempt from disclosure under applicable provisions of the Freedom of Information Act. 1 In some cases, original copies needed to be photocopied before being scanned into electronic format. All scanned images were deskewed (to remove the effects of printer- and scanner-introduced tilting) and lightly cleaned (to remove dark spots caused by staple holes, hole punches, and other blemishes caused after initial printing). 2 A two-step process was used. An advanced optical character recognition computer program (OCR) first created electronic text from the document image. Where the OCR results were inconclusive, staff checked and corrected the text as necessary. Please note that the numbers and text in charts and tables were not reliably recognized by the OCR process and were not checked or corrected by staff.
Content last modified 6/05/2009.
CONFIDENTIAL (FR)
SUPPLEMENT
CURRENT ECONOMIC AND FINANCIAL CONDITIONS
Prepared for theFederal Open Market Committee
By the StaffBoard of Governors
of the Federal Reserve SystemApril 25, 1969

SUPPLEMENTAL NOTES
The Domestic Economy
The BLS estimates a rise of only 0.1 per cent in wholesale
prices of industrial commodities from mid-March to mid-April and of
0.2 per cent in the over-all WPI. These increases represent a distinct
slowdown from the rapid rate of increase in the first three months of
the year. The BLS estimates for April are shown below, with indexes
for February and March:
BLS WHOLESALE PRICE INDEXES(1957-59 = 100)
1969 e/February March Aprile
All commodities 111.1 111.7 111.9
Farm products & processed foods & feeds 110.0 110.7 111.0Farm products 105.0 106.5 105.6Processed foods and feeds 116.3 116.4 117.5
Industrial commodities 111.4 112.0 112.1
The abrupt slowing of the rise for industrial commodities in
April reflected in large part a reversal of the earlier sharp run-up
in lumber and plywood prices. The latter prices declined, on average,
5 per cent, with softwood plywood down 20 per cent. Reduction in these
prices took 0.1 point out of the industrial total. Apart from lumber
and plywood, industrial price increases continued widespread, with
metals up substantially further and with higher prices reported for
gasoline, hides and skins (up 15 per cent), and some paper and machinery
items.
- 2 -
The Domestic Financial Situation
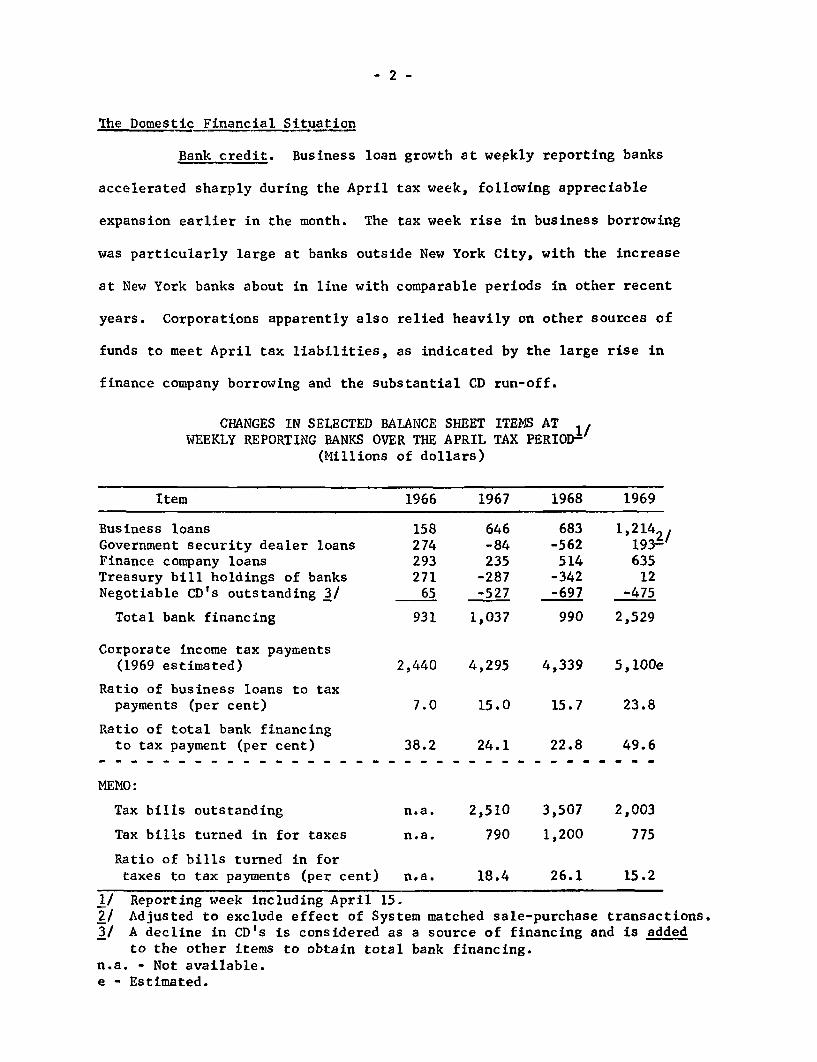
Bank credit. Business loan growth at weekly reporting banks
accelerated sharply during the April tax week, following appreciable
expansion earlier in the month. The tax week rise in business borrowing
was particularly large at banks outside New York City, with the increase
at New York banks about in line with comparable periods in other recent
years. Corporations apparently also relied heavily on other sources of
funds to meet April tax liabilities, as indicated by the large rise in
finance company borrowing and the substantial CD run-off.
CHANGES IN SELECTED BALANCE SHEET ITEMS AT 1,WEEKLY REPORTING BANKS OVER THE APRIL TAX PERIOD-
(Millions of dollars)
Item
Business loansGovernment security dealer loansFinance company loansTreasury bill holdings of banksNegotiable CD's outstanding 3/
Total bank financing
Corporate income tax payments(1969 estimated)
Ratio of business loans to taxpayments (per cent)
Ratio of total bank financingto tax payment (per cent)
MEMO:
Tax bills outstanding
Tax bills turned in for taxes
Ratio of bills turned in fortaxes to tax payments (per cent)
1967
646-84235
-287-527
1,037
1968
683-562514-342-697
990
1969
1,2142/193- /
63512
-475
2,529
2,440 4,295 4,339 5,100e
15.0
24.1
2,510
790
18.4
15.7 23.8
22.8 49.6
3,507
1,200
26.1
2,003
775
15.2
1/ Reporting week including April 15.2/ Adjusted to exclude effect of System matched sale-purchase transactions.3/ A decline in CD's is considered as a source of financing and is added
to the other items to obtain total bank financing.n.a. - Not available.e - Estimated.
- 3 -
President Nixon's tax proposals. With good prospects for
legislative action on the investment credit repeal, new orders for
producers' durable equipment have become abruptly less attractive
beginning April 21. Such a repeal would diminish the average after
tax rate of return on new investment in producers' durable equipment
by an estimated 1 to 2 percentage points. Its effect can also be looked
at as equivalent to a sharp increase in the real price of producers'
durable equipment, on average, perhaps the equivalent of a price increase
of 5 per cent. These estimates allow for the fact that not all equip-
ment investments had been eligible for investment credits and not all
of those that were eligible were getting the maximum 7 per cent credit.
Whatever the magnitude of effect may be on new orders, however,
a major part of equipment outlays for the balance of 1969 will still
reflect orders and projects to which businessmen were already committed
prior to April 21, 1969. Moreover, to the extent that orders were
placed before the cut-off date, the subsequent outlays will still give
rise to investment tax credits. An additional factor that moderates the
restrictive effect on corporate cash flows is the carry-over of past
investment credits that could not be utilized due to ceiling limitations
and that can be recouped with the repeal in effect. Hence, the impact
on corporate cash flows will be very gradual and the staff estimates of
the increase in tax revenues that result from repeal amounts to only
$450 million (on an accrual basis) during calendar year 1969.
By 1970, however, the bite of the investment tax credit
repeal will become larger and the Treasury estimates as much as a
-4-
$1.8 billion revenue effect for fiscal year 1970 and a $3.0 billion
revenue effect in future years.
The proposed halving of the surtax in the January to June
1970 period would have the following revenue effects during fiscal
year 1970 according to staff estimates:
January-June 1970(In millions of dollars)
Corporate income taxes -270
Nonwithheld personal income taxes -180
Withheld personal income taxes -14500
1,950
Additional revenue effects would spill over into fiscal year
1971, due to the normal delays in collections.
Some reforms in tax laws also were proposed mainly in regard
to individual income taxes. Only three of these will be discussed here:
(1) Low income relief. This is obtained through a special
low-income allowance that would be built into the standard tax tables.
The special allowance would be gradually phased out for somewhat higher
income earners until it is phased out completely at income levels about
$1,000 above the poverty line, with the spread between the poverty line
and the cutoff point depending on the number of dependents. Tax payers
at the presently defined poverty income levels would pay practically no
income taxes, instead of the $60 to $120 now collected from them. The
annual cost this proposes is estimated at $665 million.

-5 -
(2) Allocation of deductions. This is the second most impor-
tant reform proposal from the standpoint of size of revenue effect, with
the increase in annual tax collections estimated at $500 million a year
when the provision is in full effect. Tax payers with tax preferred
income in excess of $10,000 would have to allocate their itemized deduc-
tions proportionately as between taxable income and tax preferred income.
Tax preferred income for this purpose includes(a) capital gains,
(b) municipal bond interest, (c) income before deduction of depletion
in excess of cost and accelerated real estate depreciation in excess of
straight line depreciation, (d) income from farming without allowance
for losses that arise from the imprecise cash basis of accounting
farmers are allowed to use, and (e) appreciation in the value of
property given to charity. In short, if a tax payer had half of his
income in the form of tax preferred income, he would have to allocate
half of his itemized deduction to that form of income and thus could
not deduct them from taxable income.
(3) Limit on tax preference. A limit on tax preferences is
also proposed, somewhat similar to the minimum tax plan proposed by the
Treasury Department in the Johnson Administration. The portion of tax
preferred income that exceeds half of a taxpayer's total income would
be made subject to tax at regular tax rates. A $10,000 exemption is
allowed, and of the list of types of tax preferred incomes given under
item 2, capital gains and municipal bond interest would be excluded from
consideration under this proposal, so that only the last three items of the
list would constitute tax preferred income for the purpose of computing the
50 per cent limit. The eventual revenue effect is estimated at $80 million.

-6-
KEY INTEREST RATES
1969Lows Highs April 2 April 24
Short-Term Rates
Federal funds (weekly average)
3-monthsTreasury bills (bid)Bankers' acceptancesEuro-dollarsFederal agenciesFinance paperCD's (prime NYC)
Highest quoted new issueSecondary market
6-monthsTreasury bills (bid)Bankers' acceptancesCommercial paperFederal agenciesCD's (prime NYC)
Highest quoted new issueSecondary market
1-yearTreasury bills (bid)Prime municipals
Intermediate and Long-Term
Treasury coupon issues5-years20-years
CorporateSeasoned Aaa
BaaNew Issue AaaWith call protectionWithout call protection
MunicipalBond Buyer IndexMoody's Aaa
Mortgage--implicit yieldin FNMA weekly auction 1/
5.95 (1/1)
5.916.387.146.086.25
6.006.45
6.046.506.256.32
6.256.50
(3/24)(2/17)(1/2)(3/26)(2/6)
(2/13)
(3/25)(2/17)(1/7)(1/16)
(1/30)
5.86 (1/16)3.90 (1/2)
6.11 (1/20)5.91 (4/14)
6.56 (1/2)7.26 (2/3)
7.05 (1/9)6.90 (2/20)
4.82 (1/23)4.57 (1/2)
7.66 (1/9)
7.63 (4/16)
6.257.008.516.596.50
(1/7)(4/23)(3/19)(4/16)(4/23)
6.007.00 (4/16)
6.427.127.126.60
6.257.00
(1/7)(4/23)(4/23)(2/28)
(4/23)
6.39 (2/27)4.55 (3/20)
6.45 (3/11)6.32 (3/18)
7.00 (3/28)7.64 (3/28)
7.45 (4/9)7.57 (3/21)
5.30 (3/26)5.08 (4/9)
8.17 (3/3)
6.66 (4/2)
6.096.628.416.136.50
6.006.65
6.126.756.886.44
6.256.85
6.154.50
6.326.17
6.997.59
7.28
5.255.00
8.11 (3/31)
6.48 (4/23)
6.107.008.386.496.50
6.006.90
6.097.127.126.58
6.257.00
5.944.05
6.285.96
6.817.49
7.06
5.094.95
8.05 (4/21)
1/ Yield on 6-month forward commitment after allowance for commitment fee andrequired purchase and holding of FNMA stock. Assumes discount on 30-yearloan amortized over 15 years.

- 7-
International Developments
The March trade data, scheduled to be released by the Bureau
of the Census on April 28, will record a sizable trade surplus for the
month both on the Census and balance of payments bases as exports
increased more than imports. For the first quarter, the trade balance
on a Census basis was a deficit at an annual rate of about $1/4 billion.
On a balance of payments basis the trade deficit is now estimated to
be about $1-1/4 billion. Exports were a little higher and imports
somewhat lower than we had expected.
The March figures would indicate that both exports and imports
were somewhat above "normal" in that month, and as the heavier backlog
of exports than of imports is moved out, a sizable export surplus in
the second quarter can be expected.
U.S. foreign trade data for March and the first quarter are
shown below:
(billions of dollars, seasonally adjusted annual rate)
Census basis Balance of Payments basis
Q-1 Jan. Feb. Mar. Q-l Jan. Feb. Mar.
Trade balance -0.3 0.9 -4.3 2.6 -1.3 -0.4 -4.9 1.3
Exports 30.3 25.1 27.6 38.4 29.4 23.9 27.1 37.2
Imports 30.6 24.2 31.9 35.8 30.7 24.3 32.0 35.9
SUPPLEMENTAL APPENDIX: THE UNITED KINGDOM BUDGET FOR FISCAL 1969-70*
The U.K. budget presented to Parliament on April 15 for thefiscal year which began on April 1 is intended to increase the excessof central government revenue over spending and lending from £281 mil-lion in fiscal 1968-69 to £807 million. Tax rate increases in thisyear's budget are to provide £270 million of additional revenue dur-ing this fiscal year, and £340 million a year when fully effective,or a little less than 1 per cent of GNP.
The deflationary effect of the change in total public sec-tor spending and receipts (slated to increase by about 6 and 10 percent, respectively, in current prices) will be greater than that of
the central government alone. Net borrowing by local authorities isexpected to be reduced from £678 million in 1968-69 to about £500 mil-lion in 1969-70. The nationalized industries and public corporationsare expected to show a surplus of over 200 million this fiscal yearcompared to one of less than £100 million in 1968-69.
The Chancellor said that the application of further re-straint in this year's budget is dictated by the failure of the bal-ance of payments to show sufficient improvement. He stated that thebasic balance (current and long-term capital accounts) would soonmove into surplus but, in view of Britain's huge debts, the surplusin the absence of additional restraint would be too small to be con-sidered satisfactory.
The trade figures for March, released shortly before theChancellor presented the budget to Parliament, underscored the un-satisfactory nature of Britain's balance of payments position. Thetrade deficit, on a balance of payments basis, was £52 million inMarch. This was a slight improvement over the £64 million deficitin February, but was still too large to permit a surplus on the over-all current account. Neither exports nor imports changed appreciablyfrom the fourth to the first quarter. The leveling off in total ex-ports was partly due to a 17 per cent decline in shipments to theUnited States because of the dock strike there, but the growth inBritish exports to other areas also markedly slackened in the firstquarter. Furthermore, the stability of imports was also a conse-quence of the U.S. dock strike, imports from the United States de-creasing by about 15 per cent.
* Prepared by Martin J. Kohn, Europe and British CommonwealthSection, Division of International Finance.

SA - 2
The explicitly stated overriding objective of the budgetis to restrain personal consumption, a necessary (though not a suffi-cient) condition of improvement in the balance of payments. Despitea recent slowdown in the U.K. economy, an early resumption of growthis expected; the government in the official forecast which accompa-nied the budget predicted a rise in gross domestic product in con-stant prices of almost 3 per cent from first half 1969 to first half1970. Without the tax changes, Chancellor Jenkins told Parliament,the projected increase would have been 3-1/2 per cent. Growth is tobe export and investment led, with exports of goods and services ex-pected to increase by about 6 per cent and fixed capital investment,private and public, by a little less than 6 per cent. The govern-ment foresees the alternative possibility of an increase in exportsapproaching 10 per cent, an eventuality it predicts would bring abouta 4 per cent rise in national income. Imports of goods and servicesare expected to increase by a little over 3 per cent. The slow grow-ing categories in the official forecast are government current ex-penditures -- 1.3 per cent -- and, slowest of all, consumer expendi-tures -- a shade over 1 per cent.
There are, however, two reasons to question whether thegovernment is taking forceful enough action to limit consumption asplanned. One relates to the nature of the tax changes in the budget.The second -- and more important -- cause of doubt has to do withthe government's reluctance or inability to keep wage increases incheck.
With respect to the budget, some of the increase in taxesdirectly affect consumer goods. For example, the tax on gasolinewas raised. Furthermore, the purchase tax was extended to severalgoods not previously covered. However, about two-thirds of the an-ticipated additional revenue from the tax changes is expected tocome from a rise in the corporate income tax from 42.5 to 45 percent and from a 28 per cent increase, effective May 27, in the selec-tive employment tax (SET). The SET is a fixed amount which employersmust pay per employee on the payroll. Refunds are made to employersin industries -- mostly in manufacturing -- whose development thegovernment wishes to encourage.
At best, the direct effect on consumption of raising thesebusiness taxes is uncertain. At worst, the major impact of boostingbusiness taxes in a period of tight money may be -- incongruously --to discourage private investment to which the government attacheshigh priority.
SA - 3
The heavy reliance on business taxes may be to a large ex-tent politically motivated, reflecting the Labor government's effortsto mollify the party rank and file and the public in general. How-ever, there may be some economic justification in making only sparinguse of higher indirect taxes on consumer goods, insofar as widespread
price rises stemming from such tax hikes could fuel expectations of
further price rises and thus cause a flight from money into goods.This consideration may have played a large role in the government'sdecision to give increased emphasis to voluntary savings schemes(even though the savings ratio did not fall appreciably last yearcompared to 1967). The new savings plan presented by the Chancellorin his budget speech is a contractual savings arrangement -- scheduledto start in October -- under which persons over 16 can, if they saveup to £10 every week, receive a tax-free bonus equal to 20 per centof their accumulated savings. This would be paid at the end of fiveyears as would an additional bonus of equal amount if the savingsare left intact for another two years.
Depending on savings schemes to damp consumption, as theChancellor himself acknowledged, is hazardous, however, because ofthe difficulty in predicting how much new savings, as opposed toswitching from one form of savings to another, such schemes willstimulate.
The main weakness in the government's efforts to hold con-sumption in check, however, relates to incomes policy. The Chancel-lor was sharply critical of the rise in wage earnings last year, as-serting that a slower rate of increase would have permitted a lessstringent budget this year. However, he also acknowledged the vir-tual abandonment of a compulsory incomes policy, announcing thatthe government will allow its current powers to delay price andwage increases for a year to lapse at the end of 1969. Thereafter,the government will revert to the arrangements of 1966, whereby itcan delay such increases for only three months.
The Chancellor did promise that some of the suggested re-forms in the White Paper on industrial relations published in Janu-ary would be implemented immediately. However, the legislation pro-posed by the government last week is a diluted version of the WhitePaper. It omits the key proposal that a strike ballot by the unionbe required in the event of an impending major strike. The govern-ment is supporting enactment of the recommendation that it be em-powered to invoke a 28-day suspension of strikes deemed "unconsti-tutional" or held to have occurred after inadequate prior negotia-tion, but with only mild penalties for violations of such temporarybans on work stoppages.
SA - 4
From the end of 1967 to the beginning of 1969, wage earn-
ings increased by about 8 per cent, compared to a 6 per cent rise in
consumer prices, a development which contributed heavily to the un-
desired rise in consumption last year. Given the government's jetti-
soning of incomes policy and its reluctance or inability to put stronganti-strike laws on the books, the probability that wage increaseswill again outpace price increases by too wide a margin is high.
While no major changes in monetary policy -- on which alarge share of the burden of curtailing consumption appears to rest --were announced in connection with the presentation of the budget lastweek, the Chancellor did lay great stress on restricting monetary andcredit expansion. He threatened further action against the clearingbanks if loans outstanding do not again fall in April, as they didin March. In November, the government directed the banks to reduceloans to the private sector to 98 per cent of the level in November1967. Despite the directive, loans rose from November through Febru-ary. The government will also seek to make government bonds moreattractive to the nonbank public by exempting them from the capitalgains tax. Heavy sales of gilt-edged securities by the public --and also by the banking sector -- last year led the Bank of Englandto give heavy support to gilt-edged prices. This contributed to the6-1/2 per cent growth in the money supply. Finally, in a move de-signed as much to discourage borrowing by individuals as to raiserevenue the Chancellor announced that interest payments will nolonger be tax deductable, except for interest on loans for businesspurposes and on loans for purchase of real estate.
Fred Taylor4/24/69
GREENBOOK SUPPLEMENT
Mortgage market. According to FHA data which have just
become available, home mortgage rates continued to rise in March,
though at a somewhat more moderate pace. In the primary market, the
average contract rate for conventional first mortgages rose only
slightly as usury ceilings tended to artificially hold down these
rates in a number of States. In the secondary market for Government-
underwritten loans, the average yield increase was much smaller than
in either of the two previous months when an adjustment was underway
for the most recent upward shift in the FHA and VA ceiling rate.
Although the yield spread favoring mortgages over new issues of high-
grade corporate bonds narrowed sharply in March, it may have widened
considerably since then in view of the recent sharp decline in bond
yields.
(Rates - Table)
The latest FHA and FNMA field office reports both continue
to indicate that at the current high interest rates, adequate funds
remain available in most regions to accommodate loan demands. In
contrast to the second-half of 1966, lenders have not yet been forced
to employ stricter non-rate mortgage terms as a means of rationing
available credit.
In March, the backlog of outstanding commitments rose again
at all savings and loan associations and New York State mutual savings
banks after adjustment for seasonal variation, reaching a level that
was a fifth above a year earlier, when average housing prices and loan

-2-
amounts were smaller. However, the volume of new commitments approved
by these institutions edged down during the month, according to FRB
derived estimates. The decline in the volume of new commitments
approved apparently resulted, at least in part, from the cautious
attitude of lenders prior to the March-April reinvestment period.
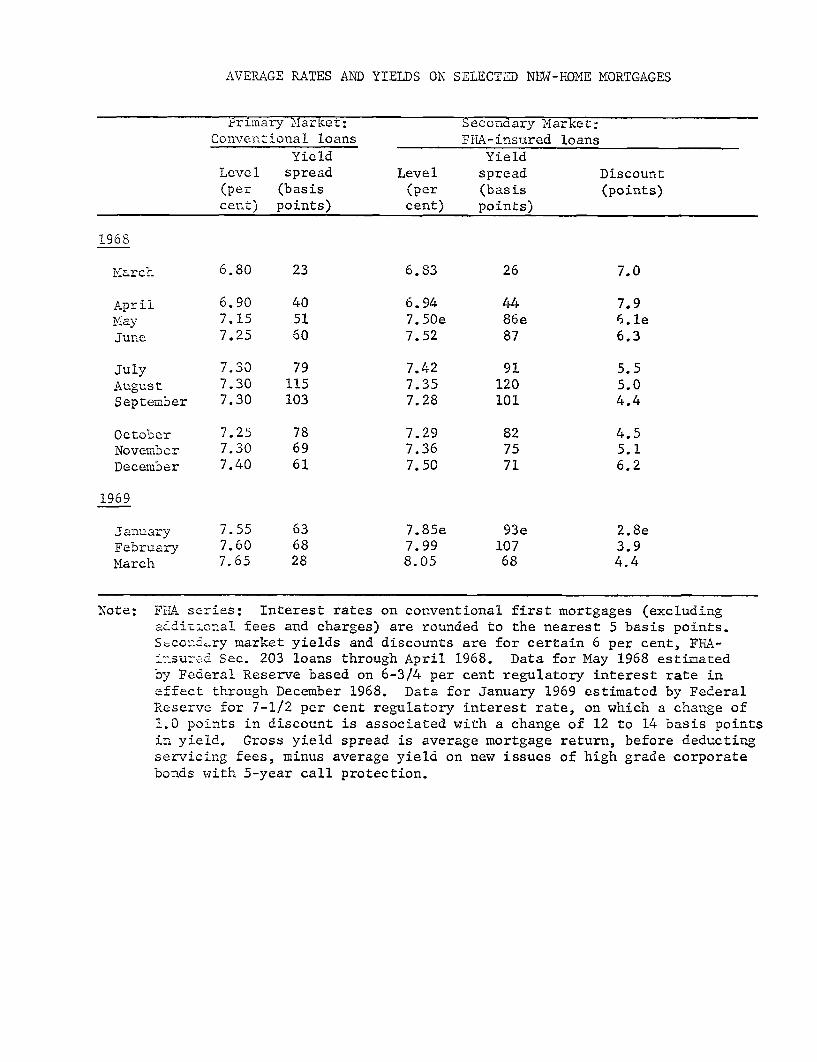
AVERAGE RATES AND YIELDS ON SELECTED NEW-HOME MORTGAGES
Primary Market: Secondary Market:Conventional loans FHA-insured loans
Yield YieldLevel spread Level spread Discount(per (basis (per (basis (points)cent) points) cent) points)
1968
March 6.80 23 6.83 26 7.0
April 6.90 40 6.94 44 7.9May 7.15 51 7.50e 86e 6.1eJune 7.25 60 7.52 87 6.3
July 7.30 79 7.42 91 5.5August 7.30 115 7.35 120 5.0September 7.30 103 7.28 101 4.4
October 7.25 78 7.29 82 4.5November 7.30 69 7.36 75 5.1December 7.40 61 7.50 71 6.2
1969
January 7.55 63 7.85e 93e 2.8eFebruary 7.60 68 7.99 107 3.9March 7.65 28 8.05 68 4.4
Note: FHA series: Interest rates on conventional first mortgages (excludingadditional fees and charges) are rounded to the nearest 5 basis points.Secondary market yields and discounts are for certain 6 per cent, FHA-insured Sec. 203 loans through April 1968. Data for May 1968 estimatedby Federal Reserve based on 6-3/4 per cent regulatory interest rate ineffect through December 1968. Data for January 1969 estimated by FederalReserve for 7-1/2 per cent regulatory interest rate, on which a change of1.0 points in discount is associated with a change of 12 to 14 basis pointsin yield. Gross yield spread is average mortgage return, before deductingservicing fees, minus average yield on new issues of high grade corporatebonds with 5-year call protection.