Embed Size (px)
Citation preview

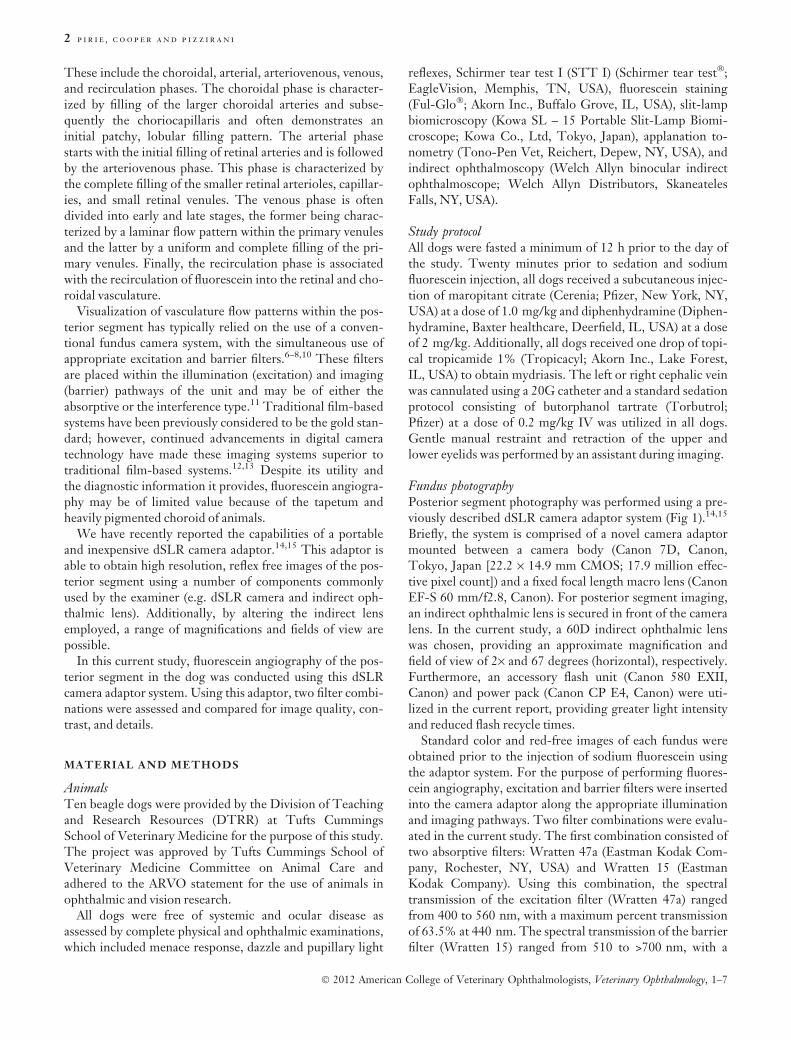
Fluorescein angiography of the canine posterior segment using adSLR camera adaptor
Chris G Pirie,* Johanna Cooper† and Stefano Pizzirani**Department of Clinical Sciences, Tufts Cummings School of Veterinary Medicine, 200 Westboro Rd, North Grafton, MA 01536 USA; and †Department of
Clinical Sciences, Tufts Veterinary Emergency Treatment and Specialties, 525 South St, Walpole, MA 02081 USA
Address communications to:
C. G. Pirie
Tel.: 508 839 5395
Fax: 508 839 7922
e-mail: [email protected]
AbstractPurpose To describe the use of a digital single lens reflex (dSLR) camera adaptor forconducting posterior segment fluorescein angiography in canines.
Methods Ten beagle dogs free of ocular and systemic disease were used. All dogsreceived maropitant citrate (1.0 mg/kg SQ), diphenhydramine (2.0 mg/kg SQ), and
topical 1% tropicamide 20 min prior to sedation using butorphanol (0.2 mg/kg IV).Standard color and red-free fundus images were obtained prior to the administration
of 10% sodium fluorescein (20 mg/kg IV). Image acquisition was performed using adSLR camera (Canon 7D), dSLR camera adaptor, camera lens (Canon 60 mm
macro), and a 60D indirect ophthalmic lens, in addition to an accessory flash (Canon580EXII). Two combinations of excitation and barrier filters were assessed (absorptivevs. interference). Imaging occurred at a rate of 1/s immediately following the
fluorescein bolus for a total of 30 s and then at 1, 2, 3, 4, and 5 min.Results Quality high resolution fluorescein angiographic images of the canine
posterior segment were obtainable. All angiographic phases were identified and timesequences were recorded. Use of interference filters improved image contrast and
transmission properties as compared to absorptive filters. No adverse events werenoted.
Conclusions The described dSLR camera adaptor provides an alternative to existingposterior segment imaging systems capable of performing fluorescein angiography.High resolution image acquisition occurred at a fraction of the cost of established
imaging systems.
INTRODUCTION
Fluorescein angiography is a diagnostic imaging modalitythat provides direct visualization of the retinal and chorio-capillary vasculature, in addition to the choroidal vascula-ture, when the tapetum is absent and minimal choroidalpigment is present. Furthermore, it may be utilized to deter-mine the integrity of the blood ocular barriers.1 Originallydescribed by Novotny and Alvis in 1961, this techniquerelies on the fluorescent properties of sodium fluorescein, alow-molecular-weight dye (376.27 Daltons), whereby lightwithin the visible spectrum is absorbed and re-emitted at adifferent (longer) wavelength.2 The optimal wavelengthrequired to excite sodium fluorescein is dependent on the
pH and concentration of the dye in solution. At a normal pHof 7.4, the most efficient excitation occurs at 485–500 nmwith the resultant emission between 520 and 530 nm.3 Oncein circulation, 20% of the dye is unbound and able to fluo-resce and freely diffuse within the intracellular and extracel-lular spaces. The remaining 80% is protein bound andunavailable.4 Upon entering the eye, the dye readily passesthrough the choriocapillaris and then diffuses into the cho-roidal extracellular space gradually. However, further move-ment is blocked by the normal external and internal bloodretinal barriers, which prevents diffusion through the tightjunctions of the retinal pigment epithelium and retinal vas-culature, respectively.5
The process of fluorescein angiography is dynamic, char-acterized by the flow patterns of the choroidal and retinalvasculature. These patterns have been well characterized inthe dog and are divided into a series of temporal phases.6–9
This study was presented as an abstract at ACVO 2011 Hilton Head,
SC USA.
� 2012 American College of Veterinary Ophthalmologists
Veterinary Ophthalmology (2012) 1–7 DOI:10.1111/j.1463-5224.2012.00995.x
These include the choroidal, arterial, arteriovenous, venous,and recirculation phases. The choroidal phase is character-ized by filling of the larger choroidal arteries and subse-quently the choriocapillaris and often demonstrates aninitial patchy, lobular filling pattern. The arterial phasestarts with the initial filling of retinal arteries and is followedby the arteriovenous phase. This phase is characterized bythe complete filling of the smaller retinal arterioles, capillar-ies, and small retinal venules. The venous phase is oftendivided into early and late stages, the former being charac-terized by a laminar flow pattern within the primary venulesand the latter by a uniform and complete filling of the pri-mary venules. Finally, the recirculation phase is associatedwith the recirculation of fluorescein into the retinal and cho-roidal vasculature.
Visualization of vasculature flow patterns within the pos-terior segment has typically relied on the use of a conven-tional fundus camera system, with the simultaneous use ofappropriate excitation and barrier filters.6–8,10 These filtersare placed within the illumination (excitation) and imaging(barrier) pathways of the unit and may be of either theabsorptive or the interference type.11 Traditional film-basedsystems have been previously considered to be the gold stan-dard; however, continued advancements in digital cameratechnology have made these imaging systems superior totraditional film-based systems.12,13 Despite its utility andthe diagnostic information it provides, fluorescein angiogra-phy may be of limited value because of the tapetum andheavily pigmented choroid of animals.
We have recently reported the capabilities of a portableand inexpensive dSLR camera adaptor.14,15 This adaptor isable to obtain high resolution, reflex free images of the pos-terior segment using a number of components commonlyused by the examiner (e.g. dSLR camera and indirect oph-thalmic lens). Additionally, by altering the indirect lensemployed, a range of magnifications and fields of view arepossible.
In this current study, fluorescein angiography of the pos-terior segment in the dog was conducted using this dSLRcamera adaptor system. Using this adaptor, two filter combi-nations were assessed and compared for image quality, con-trast, and details.
MATERIAL AND METHODS
AnimalsTen beagle dogs were provided by the Division of Teachingand Research Resources (DTRR) at Tufts CummingsSchool of Veterinary Medicine for the purpose of this study.The project was approved by Tufts Cummings School ofVeterinary Medicine Committee on Animal Care andadhered to the ARVO statement for the use of animals inophthalmic and vision research.
All dogs were free of systemic and ocular disease asassessed by complete physical and ophthalmic examinations,which included menace response, dazzle and pupillary light
reflexes, Schirmer tear test I (STT I) (Schirmer tear test�;EagleVision, Memphis, TN, USA), fluorescein staining(Ful-Glo�; Akorn Inc., Buffalo Grove, IL, USA), slit-lampbiomicroscopy (Kowa SL – 15 Portable Slit-Lamp Biomi-croscope; Kowa Co., Ltd, Tokyo, Japan), applanation to-nometry (Tono-Pen Vet, Reichert, Depew, NY, USA), andindirect ophthalmoscopy (Welch Allyn binocular indirectophthalmoscope; Welch Allyn Distributors, SkaneatelesFalls, NY, USA).
Study protocolAll dogs were fasted a minimum of 12 h prior to the day ofthe study. Twenty minutes prior to sedation and sodiumfluorescein injection, all dogs received a subcutaneous injec-tion of maropitant citrate (Cerenia; Pfizer, New York, NY,USA) at a dose of 1.0 mg/kg and diphenhydramine (Diphen-hydramine, Baxter healthcare, Deerfield, IL, USA) at a doseof 2 mg/kg. Additionally, all dogs received one drop of topi-cal tropicamide 1% (Tropicacyl; Akorn Inc., Lake Forest,IL, USA) to obtain mydriasis. The left or right cephalic veinwas cannulated using a 20G catheter and a standard sedationprotocol consisting of butorphanol tartrate (Torbutrol;Pfizer) at a dose of 0.2 mg/kg IV was utilized in all dogs.Gentle manual restraint and retraction of the upper andlower eyelids was performed by an assistant during imaging.
Fundus photographyPosterior segment photography was performed using a pre-viously described dSLR camera adaptor system (Fig 1).14,15
Briefly, the system is comprised of a novel camera adaptormounted between a camera body (Canon 7D, Canon,Tokyo, Japan [22.2 · 14.9 mm CMOS; 17.9 million effec-tive pixel count]) and a fixed focal length macro lens (CanonEF-S 60 mm/f2.8, Canon). For posterior segment imaging,an indirect ophthalmic lens is secured in front of the cameralens. In the current study, a 60D indirect ophthalmic lenswas chosen, providing an approximate magnification andfield of view of 2· and 67 degrees (horizontal), respectively.Furthermore, an accessory flash unit (Canon 580 EXII,Canon) and power pack (Canon CP E4, Canon) were uti-lized in the current report, providing greater light intensityand reduced flash recycle times.
Standard color and red-free images of each fundus wereobtained prior to the injection of sodium fluorescein usingthe adaptor system. For the purpose of performing fluores-cein angiography, excitation and barrier filters were insertedinto the camera adaptor along the appropriate illuminationand imaging pathways. Two filter combinations were evalu-ated in the current study. The first combination consisted oftwo absorptive filters: Wratten 47a (Eastman Kodak Com-pany, Rochester, NY, USA) and Wratten 15 (EastmanKodak Company). Using this combination, the spectraltransmission of the excitation filter (Wratten 47a) rangedfrom 400 to 560 nm, with a maximum percent transmissionof 63.5% at 440 nm. The spectral transmission of the barrierfilter (Wratten 15) ranged from 510 to >700 nm, with a
2 p i r i e , c o o p e r a n d p i z z i r a n i
� 2012 American College of Veterinary Ophthalmologists, Veterinary Ophthalmology, 1–7

maximum percent transmission of 91.1% at >670 nm.16 Thesecond filter combination was comprised of two interferencefilters: MF479-40 (Thorlabs, Newton, NJ, USA) andMF525-39 (Thorlabs). The spectral transmission of theexcitation filter (MF479-40) ranged from 456 to 502 nm,with a maximum percent transmission of 95.2% at 474 nm.The spectral transmission of the barrier filter (MF525-39)ranged from 502 to 550 nm, with a maximum percent trans-mission of 95.7% at 518 nm (http://www.thorlabs.com).The spectral transmission curves of the two filter combina-tions are depicted in Fig. 2. Five dogs were imaged using theabsorptive filter combination, and five dogs were imagedusing the interference filter combination.
Based on previous experience using the current adaptorsystem for posterior segment photography, a shutter speed(1/100) and effective aperture (f/8) were chosen for angio-graphic imaging. To account for the reduced percent trans-mission of light resulting from placement of the filters,
alteration in the ISO setting was made. ISO ranges of400–800 (interference) and 800–1000 (absorptive) were cho-sen based on preliminary in vitro work (data not shown),using diluted fluorescein to an appropriate concentration of0.05 mg/ml for angiographic imaging.17
Fluorescein angiographyPrior to the injection of sodium fluorescein, images of eachfundus were obtained with the excitation and barrier filtersin place. These images served as controls, determining thelevel of background pseudofluorescence.
All angiograms were performed following a rapid intrave-nous bolus of 10% sodium fluorescein (Ak-fluor; AkornInc.) at a dose of 20 mg/kg. All injections were performedmanually during which time the photographic sequence andtimer were initiated simultaneously. Serial images wereobtained using the maximum flash intensity occurring at arate of 1/s for a total of 30 s and at 1, 2, 3, 4, and 5 min.
Figure 1. Schematic diagram of the adaptor system. 15 Note: For conducting fluorescein angiography, placement of filters along the illumination
(excitation filter) and optical (barrier filter) pathway is required. Light emanating from the flash is reflected by a mirror, focused by a series of condens-
ers, and transmitted through the excitation filter and first linear polarizer. A plate beam splitter reflects light into the camera lens, into the indirect
ophthalmic lens, and onto the fundus. Emanating light (e.g., sodium fluorescein) is transmitted through the indirect ophthalmic lens, camera lens,
plate beam splitter, linear polarizer, and barrier filter onto the CMOS sensor of the camera body.
(a) (b)
Figure 2. Spectral transmission curves of filter combinations used in the current study, as compared to the spectral absorption and emission curves
of sodium fluorescein. (a) Absorptive filter combination: Wratten 47A (excitation) and Wratten 15 (barrier). (b) Interference filter combination:
MF479-40 (excitation) and MF525-39 (barrier).
f l u o r e s c e i n a n g i o g r a p h y u s i n g a d s l r c a m e r a a d a p t o r 3
� 2012 American College of Veterinary Ophthalmologists, Veterinary Ophthalmology, 1–7

Fluorescein angiography evaluationMeasurements were taken in accordance with the study byde Schaepdrijver el al.6 and included the dye transit timebetween the injection of sodium fluorescein and the onset ofchoroidal fluorescence (choroidal phase/latency phase), reti-nal arterial, retinal arteriovenous, retinal early venous, andretinal late venous phases. The final imaging results wereevaluated subjectively with respect to exposure, image con-trast, and detail to determine which filter combination andcamera setting(s) resulted in superior image quality.
RESULTS
Animal population and protocol assessmentA total of 10 dogs were enrolled in this study, includingthree spayed females and seven castrated males, with anaverage age and weight of 3.7 ± 0.6 years and 12.3 ± 2.0 kg,respectively. Use of butorphanol resulted in satisfactorysedation for approximately 1 h, allowing necessary handlingand manual positioning of the dogs during the imagingsequence. All dogs maintained a central globe position dur-ing the image sequence. No adverse events were noted fol-lowing the use of 20 mg/kg of 10% sodium fluoresceinintravenously.
Pre-angiographic imagingRepresentative standard color and red-free fundus imagesobtained using the adaptor system are illustrated in Fig. 3.Control photographs obtained prior to the injection ofsodium fluorescein using either filter combination failed todemonstrate evidence of pseudofluorescence in the dogsevaluated.
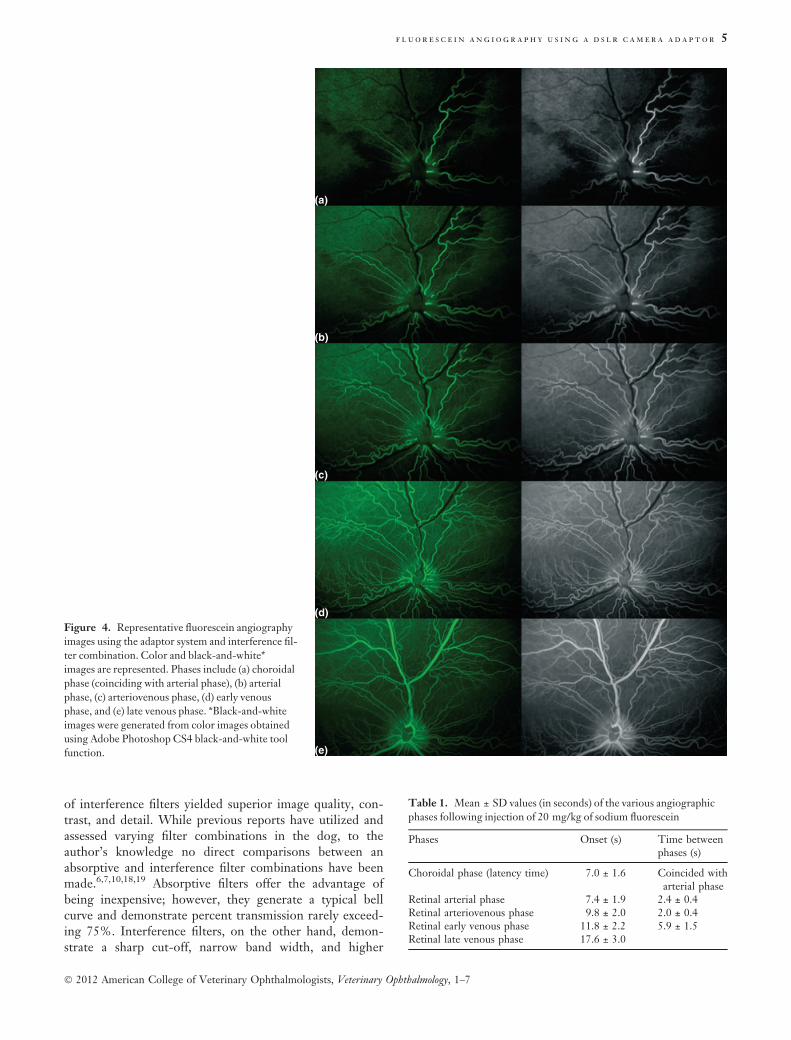
Angiographic imaging and phasesAngiographic phases were divided into choroidal, retinalarterial, retinal arteriovenous, retinal early venous, and reti-nal late venous phases. Representative images of each phaseare demonstrated in Fig. 4. A summary of the mean time,along with the standard deviation (SD), at which each phasewas noted is presented in Table 1. The choroidal phaseoccurred on average 7.0 ± 1.6 s following injection. In threedogs, this phase demonstrated a patchy lobular filling pat-tern, which rapidly became more uniform (Fig 4a). In the
remaining seven dogs, a more uniform pattern was noted,coinciding with the onset of the arterial phase. The retinalarterial phase was noted on average 7.4 ± 1.9 s followinginjection, demonstrating almost simultaneous filling of theperipapillary retinal arterioles (Fig 4b). As previously docu-mented, hyperfluorescence of the retinal arterioles wasnoted as they form an abrupt perpendicular bend surround-ing the optic disk border6 (Fig 4a). The onset of the retinalarteriovenous phase was noted approximately 2.4 ± 0.4 sfollowing the onset of the arterial phase and occurred9.8 ± 2.0 s following injection. This phase was characterizedby filling of the small arterioles, capillaries, and venules(Fig 4c). The onset of the early venous phase, characterizedby lamination of the larger primary venules, occurred11.8 ± 2.2 s following injection and 2.0 ± 0.4 s followingthe arteriovenous phase and lasted on average 5.9 ± 1.5 s(Fig 4d). The late venous phase was noted to occur on aver-age 17.6 ± 3.0 s following injection and characterized bycomplete filling of the primary venules (Fig 4e).
Assessment of filter combinationsRepresentative examples of images obtained using theabsorptive and interference filter combinations are illus-trated in Fig. 5. As demonstrated, the interference filtercombination provided superior image contrast and details,as compared to the absorptive filters. Additionally, becauseof improved percent transmission, lower ISO settings couldbe employed. An ISO setting range of 400–800 was consid-ered appropriate using the interference filters, as comparedto an ISO range of 800–1000 using the absorptive filters.
DISCUSSION
In the current report, we have demonstrated the capabilityof a dSLR camera adaptor to perform fluorescein angiogra-phy in the dog. All angiographic phases were identified andtime sequences were recorded using this system. Imagesobtained were of high resolution and diagnostic quality.Furthermore, this portable system allowed for necessaryalterations in positioning, which may be needed because ofoccasional patient movement during the imaging sequence.
Two filter combinations (absorptive vs. interference) wereassessed and compared in this report. As demonstrated, use
(a) (b)
Figure 3. Representative standard color (a) and red-free (b) fundus images obtained using the adaptor system, in conjunction with a 60D indirect
ophthalmic lens. Red-free image obtained using MF525-39 filter.
4 p i r i e , c o o p e r a n d p i z z i r a n i
� 2012 American College of Veterinary Ophthalmologists, Veterinary Ophthalmology, 1–7
of interference filters yielded superior image quality, con-trast, and detail. While previous reports have utilized andassessed varying filter combinations in the dog, to theauthor’s knowledge no direct comparisons between anabsorptive and interference filter combinations have beenmade.6,7,10,18,19 Absorptive filters offer the advantage ofbeing inexpensive; however, they generate a typical bellcurve and demonstrate percent transmission rarely exceed-ing 75%. Interference filters, on the other hand, demon-strate a sharp cut-off, narrow band width, and higher
(a)
(b)
(c)
(d)
(e)
Figure 4. Representative fluorescein angiography
images using the adaptor system and interference fil-
ter combination. Color and black-and-white*
images are represented. Phases include (a) choroidal
phase (coinciding with arterial phase), (b) arterial
phase, (c) arteriovenous phase, (d) early venous
phase, and (e) late venous phase. *Black-and-white
images were generated from color images obtained
using Adobe Photoshop CS4 black-and-white tool
function.
Table 1. Mean ± SD values (in seconds) of the various angiographic
phases following injection of 20 mg/kg of sodium fluorescein
Phases Onset (s) Time betweenphases (s)
Choroidal phase (latency time) 7.0 ± 1.6 Coincided witharterial phase
Retinal arterial phase 7.4 ± 1.9 2.4 ± 0.4Retinal arteriovenous phase 9.8 ± 2.0 2.0 ± 0.4Retinal early venous phase 11.8 ± 2.2 5.9 ± 1.5Retinal late venous phase 17.6 ± 3.0
f l u o r e s c e i n a n g i o g r a p h y u s i n g a d s l r c a m e r a a d a p t o r 5
� 2012 American College of Veterinary Ophthalmologists, Veterinary Ophthalmology, 1–7

percent transmissions (e.g. almost 100%).11 As illustrated inFig. 2, overlap of the transmission curves is noted with theuse of these absorption filters and not with the interferencefilters. This overlap leads to reduced image contrast betweenfluorescent and nonfluorescent structures. Furthermore,reduced percent transmission of these filters places a greaterdemand on the flash unit required for proper exposure. Inthe current study, this was compensated for by increasingthe ISO settings, a fact that further reduces image qualityowing to increased digital noise (e.g. graininess of theimage).
Fluorescein angiography is a common diagnostic proce-dure performed by human ophthalmologists to assess theintegrity of the blood retinal barriers and monitor diseaseprogression and treatment efficacy. However, its current useand availability in veterinary medicine are limited, primarilyin the clinical research setting. Most published reports areresearch based and focus on experimentally induced infec-tions/immune-mediated disease(s), galactose-induced dia-betes, perfusion alterations and vessel occlusion, laser-induced retinopexy, gene transfer, and retinal implanta-tion.18,20–32 A lesser number of clinical-based reports haveprimarily dealt with blood flow abnormalities seen in variousforms of canine retinopathies. The limited use of this tech-nique is largely a reflection of the high capital cost requiredto obtain the necessary imaging equipment. As such, an idealsystem should be capable of producing diagnostic-qualityimages while not being cost-prohibitive. Furthermore, itshould be easy to manipulate, versatile, light weight, andportable. The dSLR camera adaptor in the current studymay provide a viable inexpensive alternative. Another poten-tial limitation in the clinical setting is the need for sedationand/or general anesthesia. One of the most frequent reasonsfor acquiring poor images during fluorescein angiography ispatient movement.4 As such, proper patient positioning andrestriction is imperative for obtaining a quality imagingsequence. In veterinary medicine, this often translates to aneed for sedation and/or anesthesia. Various sedative/anes-thetic protocols and their benefits and/or side effects havebeen reported in the dog. 6–8,33 In the current study, but-orphanol alone was selected owing to its minimal side effectsand resulted in satisfactory sedation and patient manipula-tion during the image sequence. Furthermore, this protocol
demonstrated no adverse events, and all globes imagedremained in a relatively central position.
This report is an expansion of ongoing work demonstrat-ing further capabilities of a novel dSLR adaptor. This systemis inexpensive, versatile, and portable. As illustrated, it mayprovide a viable alternative to the current available imagingsystems capable of performing fluorescein angiography.
ACKNOWLEDGMENT
This study was supported in part by an internal grant fromTufts Cummings School of Veterinary Medicine.
DISCLOSURE
Chris G Pirie (P), Johanna Cooper (None) Stefano Pizzirani(None).
REFERENCES
1. Berkow JW, Orth DH, Kelley JS. Fluorescein Angiography: Tech-
nique and Interpretation. American Academy of Ophthalmology,
San Francisco, CA, 1991.
2. Novotny HR, Alvis DL. A method of photographing fluorescence
in circulating blood in the human retina. Circulation 1961; 24:
82–86.
3. Pitet G, Amalric P, Hygounenc O. Etude anlytique de la fluores-
cence des solutions de fluoresceinate de sodium. In: FluoresceinAngiography: Proceedings of the International Symposium on Fluorescein
Angiography, Albi 1969 (ed. Amalric P). S Kager, Basel, 1971; 8–11.
4. Johnson RN, McDonald HR, Ai E et al. Fluorescein angiography:
basic principles and interpretation. In: Retina (ed. Ryan SJ). Else-
vier Mosby, Philadelphia, PA, 2005; 873–969.
5. Pinos J. Principles, procedure, and terminology of fundus fluores-
cein angiography. In: Fundus Fluorescein and Indocyanine GreenAngiography (ed. Agarwal A). Slack Inc, Thorofare, NJ, 2007; 17–20.
6. Schaepdrijver LD, Simoens P, Lauwers H. Fluorescein angiogra-
phy of the canine retina. Veterinary & Comparative Ophthalmology
1996; 6: 111–119.
7. Gelatt KN, Henderson JD Jr, Steffen GR. Fluorescein angiogra-
phy of the normal and diseased ocular fundi of the laboratory
dog. Journal of the American Veterinary Medical Association 1976;
169: 980–984.
8. Kommonen B, Koskinen L. Fluorescein angiography of the
canine ocular fundus in ketamine-xylazine anesthesia. Acta Veteri-naria Scandinavica 1984; 25: 346–351.
(a) (b)
Figure 5. Representative images obtained using the absorptive (a) and interference (b) filter combinations. Note the improved contrast and details
obtained using the interference filter combination.
6 p i r i e , c o o p e r a n d p i z z i r a n i
� 2012 American College of Veterinary Ophthalmologists, Veterinary Ophthalmology, 1–7
9. Walde I. The fluorescence angiogram of the normal ocular fun-
dus in the dog and horse. Tierarztliche Praxis 1977; 5: 343–347.
10. Bellhorn RW. Fluorescein fundus photography in veterinary oph-
thalmology. Journal of the Animal American Hospital Association
1973; 9: 227–233.
11. Hyvarinen L, Hochheimer BF, George TW. Evaluation of filters
for fluorescein angiography. In: Fluorescein Angiography: Proceedingsof the International Symposium on Fluorescein Angiography, Albi 1969
(ed. Amalric P). S Karger, Basel, 1971; 72–75.
12. Maberley D, Morris A, Hay D et al. A comparison of digital reti-
nal image quality among photographers with different levels of
training using a non-mydriatic fundus camera. Ophthalmic Epide-
miology 2004; 11: 191–197.
13. Yannuzzi LA, Ober MD, Slakter JS et al. Ophthalmic fundus
imaging: today and beyond. American Journal of Ophthalmology2004; 137: 511–524.
14. Pirie C, Pizzirani S A new approach to digital posterior segment
photography using a camera adaptor (abstract). ARVO 2010.
15. Pirie C, Pizzirani S. Anterior and posterior segment photography.
An alternative approach using a dSLR camera adaptor. Veterinary
Ophthalmology 2011. doi: 10.1111/j.1463-5224.2011.00963.x.
16. Eastman-Kodak Co. Kodak Photographic Filters Handbook. Profes-
sional Photography Division, Eastman Kodak Co, Rochester, NY,
1998; 161.
17. Ossewaarde-Van Norel J, van Den Biesen PR, van De Kraats J
et al. Comparison of fluorescence of sodium fluorescein in retinal
angiography with measurements in vitro. Journal of Biomedical
Optics 2002; 7: 190–198.
18. Kobayashi T, Kubo E, Takahashi Y et al. Retinal vessel changes in
galactose-fed dogs. Archives of Ophthalmology 1998; 116: 785–789.
19. Ono K, Yasuda K, Iwata H et al. Fluorescein angiogram in dia-
betic dogs. Nippon Juigaku Zasshi – Japanese Journal of VeterinaryScience 1986; 48: 1257–1261.
20. Narfstrom K, Vaegan, Katz M et al. Assessment of structure and
function over a 3-year period after gene transfer in RPE65)/)dogs. Documenta Ophthalmologica 2005; 111: 39–48.
21. McLeod DS, D’Anna SA, Lutty GA. Clinical and histopathologic
features of canine oxygen-induced proliferative retinopathy. Inves-tigative Ophthalmology & Visual Science 1998; 39: 1918–1932.
22. Takahashi Y, Wyman M, Ferris F 3rd et al. Diabeteslike prepro-
liferative retinal changes in galactose-fed dogs. Archives of Oph-
thalmology 1992; 110: 1295–1302.
23. Cusick M, Chew EY, Ferris F 3rd et al. Effects of aldose reduc-
tase inhibitors and galactose withdrawal on fluorescein angio-
graphic lesions in galactose-fed dogs. Archives of Ophthalmology2003; 121: 1745–1751.
24. Breitschwerdt EB, Papich MG, Hegarty BC et al. Efficacy of
doxycycline, azithromycin, or trovafloxacin for treatment of
experimental Rocky mountain spotted fever in dogs. AntimicrobialAgents & Chemotherapy 1999; 43: 813–821.
25. Kador PF, Blessing K, Randazzo J et al. Evaluation of the vascu-
lar targeting agent combretastatin a-4 prodrug on retinal neovas-
cularization in the galactose-fed dog. Journal of OcularPharmacology & Therapeutics 2007; 23: 132–142.
26. Yamaki K, Takiyama N, Itho N et al. Experimentally induced
Vogt-Koyanagi-Harada disease in two Akita dogs. Experimental
Eye Research 2005; 80: 273–280.
27. Guven D, Weiland JD, Maghribi M et al. Implantation of an
inactive epiretinal poly(dimethyl siloxane) electrode array in dogs.
Experimental Eye Research 2006; 82: 81–90.
28. Majji AB, Humayun MS, Weiland JD et al. Long-term histologi-
cal and electrophysiological results of an inactive epiretinal elec-
trode array implantation in dogs. Investigative Ophthalmology &Visual Science 1999; 40: 073–081.
29. Le Meur G, Weber M, Pereon Y et al. Postsurgical assessment
and long-term safety of recombinant adeno-associated virus-medi-
ated gene transfer into the retinas of dogs and primates. Archivesof Ophthalmology 2005; 123: 500–506.
30. Le Meur G, Stieger K, Smith AJ et al. Restoration of vision in
RPE65-deficient Briard dogs using an AAV serotype 4 vector that
specifically targets the retinal pigmented epithelium. Gene Therapy
2007; 14: 292–303.
31. Soga K, Fujita H, Andoh T et al. Retinal artery air embolism in
dogs: fluorescein angiographic evaluation of effects of hypoten-
sion and hemodilution. Anesthesia & Analgesia 1999; 88:
1004–1010.
32. Pizzirani S, Davidson MG, Gilger BC. Transpupillary diode laser
retinopexy in dogs: ophthalmoscopic, fluorescein angiographic
and histopathologic study. Veterinary Ophthalmology 2003; 6:
227–235.
33. Martin E, Redondo JI, Molleda JM et al. Effects of sevoflurane,
isoflurane and halotane anaesthesia on fluorescein angiographic
phases of dogs: a comparative study. Journal of Veterinary Medicine
– Series A 2001; 48: 267–275.
f l u o r e s c e i n a n g i o g r a p h y u s i n g a d s l r c a m e r a a d a p t o r 7
� 2012 American College of Veterinary Ophthalmologists, Veterinary Ophthalmology, 1–7