Embed Size (px)
Citation preview

Annual Report 20091
FLSmidth & Co. A/S
Annual Report 2009

Annual Report 20092
Facts about FLSmidth & Co. - a leading supplier of equipment and services to the global cement and minerals industries
A global company with a strong local presence worldwideHead office in Denmark, major engineering centres in India and USA10,664 employees worldwideStrong track record and 128 years of experience
Geographical distribution of employees

Annual Report 20093
Investing in FLSmidth & Co. A/S
2009 2008Total shareholder return : 104% (64%)Pay-out ratio: 22% (DKK 2+5 per share) 0%EPS (diluted) : DKK 31.9 28.8Number of shareholders: 44,800 42,000Market Cap: DKK 19.5bn DKK 9.6bn

Annual Report 20094
Key messages in Annual Report 2009
Historically strong performance 2009 2008– Cash flow from operations (DKK) 2,470m 2,324m– EBIT margin 9.8% 9.5%– Net profit (DKK) 1,664m 1,515m
Proposed dividend DKK 5 per share (on top of DKK 2 already paid in 2009)
Order intake in 2010 is expected to increase in both Cement and Minerals vs. 2009
Expected revenue in 2010: DKK 19-20bn
Expected EBIT margin in 2010: 8-9%

Annual Report 20095
Asset light business model is working well
Engineering house and technology provider
Flexible cost structure (payroll)
Most manufacturing is outsourced(~80-90%)
Low working capital due to prepayments from customers (typically 10-25% of total contract amount upfront)
Low maintenance CAPEX (~2% of revenue at present)
Order related engineering off-shored to India
Increased sourcing from competitive-cost-countries(~25% at present)

Annual Report 20096
Highlights 2009
DKKm 2009 2008 change
Revenue 23,134 25,285 -9%
EBITDA (before special non-recurring items) 2,725 2,911 -6%
EBIT 2,261 2,409 -6%
Profit for the year 1,664 1,515 +10%
Order intake 13,322 30,176 -56%
Order backlog 21,194 30,460 -30%
Net interest bearing receivables /(debt) 1,085 (574)
Working capital 21 207
CFFO 2,470 2,324 +6%
Free cash flow 1,965 1,453 +35%
Investments in R&D 315 268 +18%
Number of employees 10,664 11,510 -7%

Annual Report 20097
Revenue 2009
Revenue in 2009: DKK 23,134m down 9% vs. 2008
Strong order backlog at the beginning of the year provided protection against weak business climate in 2009 resulting in a soft landing
Developing countries accounted for 71% of revenue in 2009 (2008: 67%) – of which BRICs accounted for 28% (2008: 13%)
Cement is still the largest business segment accounting for 56% of revenue in 2009 (2008: 54%)

Annual Report 20098
A strong financial platform
Equity ratio 30%-target reached in 2009
No net debt (End 2009: Net interest bearing receivables DKK 1,085m)
Committed credit facilities extended to 2013Working capital close to zero (End 2009: DKK 21m)
New dividend policy: DKK 7 per share per year
574
1.583
-1000
-500
0
500
1000
1500
2000
Q42007
Q12008
Q22008
Q32008
Q42008
Q12009
Q22009
Q32009
Q42009
(1,0)
(0,5)
-
0,5
1,0
NIBD & Gearing Equity & equity ratioEquity ratioGEARING
NIBD / EBITDANIBD (DKKm) Equity (DKKm)
Net interest bearing receivables
6.627
5.0354.214
0
1.000
2.000
3.000
4.000
5.000
6.000
7.000
Q42007
Q12008
Q22008
Q32008
Q42008
Q12009
Q22009
Q32009
Q42009
0
5
10
15
20
25
30
35Equity ratio target: 30%
Net interest bearing debt

Annual Report 20099
Key strategic focus areas in coming years
Stronger focus in Minerals– Prioritize growth industries– Enhance customer intimacy– Focused technology portfolio
Stronger focus on China and India– Growing regional markets– India: internal sourcing of engineering and back-office– Group Management to be represented in India from
1 July 2009 by Bjarne Moltke Hansen– China: internal and external sourcing of manufactured
components and equipment
Increased activity in Customer Services– New and innovative service concepts– O&M contracts
One Company – One Name – ”One Source”– Subsidiaries and product companies to be named FLSmidth– Branding platform being launched
Annual Report 200910
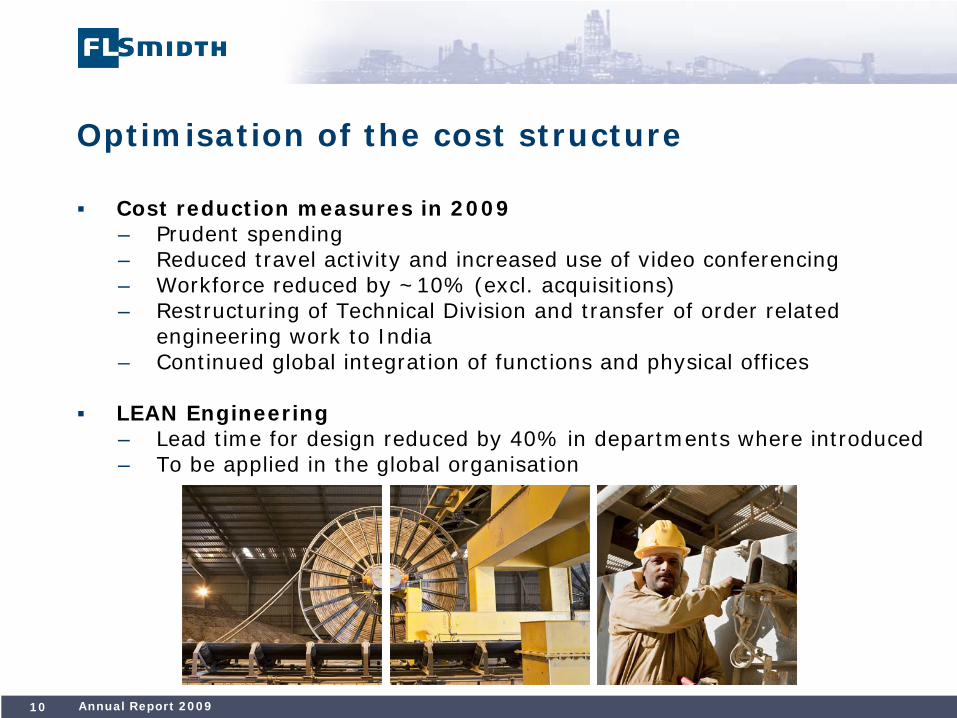
Optimisation of the cost structure
Cost reduction measures in 2009– Prudent spending– Reduced travel activity and increased use of video conferencing– Workforce reduced by ~10% (excl. acquisitions)– Restructuring of Technical Division and transfer of order related
engineering work to India– Continued global integration of functions and physical offices
LEAN Engineering– Lead time for design reduced by 40% in departments where introduced– To be applied in the global organisation

Annual Report 200911
6.535
7.574
6.479
0
1.000
2.000
3.000
4.000
5.000
6.000
7.000
8.000
Q42007
Q12008
Q22008
Q32008
Q42008
Q12009
Q22009
Q32009
Q42009
Revenue (quarterly) EBIT adj.*) (quarterly)
-14% vs. Q4 2008
Satisfactory revenue and margins in 2009
Revenue down 9% yoy– Customer Services revenue up 2% yoy– Traditional seasonal quarterly pattern repeated in 2009
EBIT ratio 9.8% vs. 9.5% in 2008, exceeding own expectations– Positively impacted by improved order execution, higher than expected revenue
and finalisation of projects– Our asset light business model is working!
-10% vs. Q4 2008
*) Adjusted for effect of purchase allocation regarding GL&V Process
DKKm
788
680
873
0
200
400
600
800
1.000
Q42007
Q12008
Q22008
Q32008
Q42008
Q12009
Q22009
Q32009
Q42009
0,0%
2,0%
4,0%
6,0%
8,0%
10,0%
12,0%
DKKm

Annual Report 200912
Development in Cement & Minerals EBITA ratio (Group EBIT excl. Cembrit and purchase price allocations related to GL&V)
3,7%6,3%
9,9%
11,1%10,9%
0
5000
10000
15000
20000
25000
2005 2006 2007 2008 20090,0%
2,0%
4,0%
6,0%
8,0%
10,0%
12,0%
Revenue (Cement & Minerals)
EBITA ratio (Cement & Minerals)
Annual Report 200913
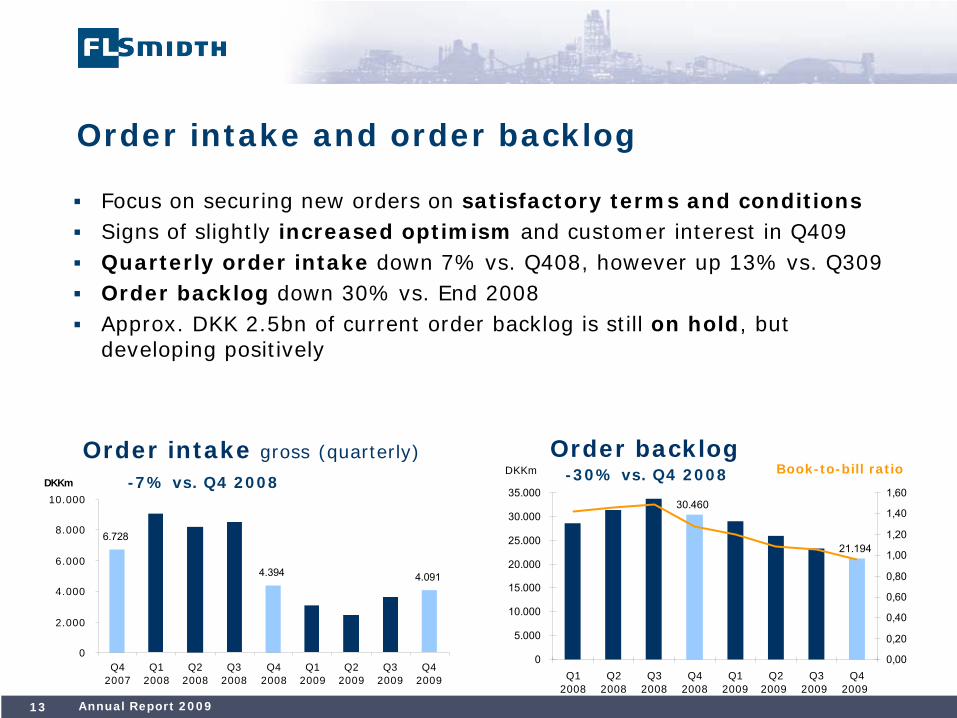
Order intake and order backlog
4.0914.394
6.728
0
2.000
4.000
6.000
8.000
10.000
Q42007
Q12008
Q22008
Q32008
Q42008
Q12009
Q22009
Q32009
Q42009
DKKm
Order intake gross (quarterly) Order backlog
Focus on securing new orders on satisfactory terms and conditionsSigns of slightly increased optimism and customer interest in Q409Quarterly order intake down 7% vs. Q408, however up 13% vs. Q309Order backlog down 30% vs. End 2008 Approx. DKK 2.5bn of current order backlog is still on hold, but developing positively
-7% vs. Q4 2008 -30% vs. Q4 2008 Book-to-bill ratioDKKm
21.194
30.460
0
5.000
10.000
15.000
20.000
25.000
30.000
35.000
Q12008
Q22008
Q32008
Q42008
Q12009
Q22009
Q32009
Q42009
0,00
0,20
0,40
0,60
0,80
1,00
1,20
1,40
1,60

Annual Report 200914
Cash management in 2009 Strong cash-flow generation and working capital under control
167
637835
451614
20721
-800
-600
-400
-200
0
200
400
600
800
1.000
Q42007
Q1 2008
Q22008
Q32008
Q42008
Q12009
Q22009
Q32009
Q42009
DKKm
Working capital
717613
1.281
192
416
939 923
499
(400)
(200)
0
200
400
600
800
1.000
1.200
1.400
Q42007
Q12008
Q22008
Q32008
Q42008
Q12009
Q22009
Q32009
Q42009
DKKm
CFFO
1.392 1.4851.650
1.920 1.893 1.890
1.463
1.802 1.760
0
500
1.000
1.500
2.000
2.500
Q42007
Q1 2008
Q22008
Q32008
Q42008
Q12009
Q22009
Q32009
Q42009
DKKm
Inventories-2% vs. End 2008
Dedicated effort throughout 2009 to reduce trade receivables and inventories, and to optimise trade creditors
Increasing trend in working capital reversed in Q3 and Q4

Annual Report 200915
Cash management focus areas
4.286 4.5484.908
4.333 4.2763.696
4.939 5.063
4.270
0
1.000
2.000
3.000
4.000
5.000
6.000
Q42007
Q1 2008
Q22008
Q32008
Q42008
Q12009
Q22009
Q32009
Q42009
DKKm
3.8034.394 4.424
2.868 3.0763.538
3.0243.1933.330
0
1.000
2.000
3.000
4.000
5.000
6.000
Q42007
Q1 2008
Q22008
Q32008
Q42008
Q12009
Q22009
Q32009
Q42009
DKKmPrepayments (net liability *)-5% vs. End 2008
2.132 2.2392.388 2.467
2.2762.077
2.4642.748
2.421
0
500
1.000
1.500
2.000
2.500
3.000
Q42007
Q1 2008
Q22008
Q32008
Q42008
Q12009
Q22009
Q32009
Q42009
DKKmTrade receivables
-16% vs. End 2008Trade creditors-12% vs. End 2008
*) Prepayments from customers less Prepayments to sub-suppliers
337
582653
207
629
-800
-600
-400
-200
0
200
400
600
800
1.000
Q42007
Q1 2008
Q22008
Q32008
Q42008
Q12009
Q22009
Q32009
Q42009
DKKm
Work-in-progress (net asset)

Annual Report 200916
Cement
Highlights 2009
Revenue down by 5%, whileEBIT was up by 2%, and as such, record high - due to higher than expected revenue, improved order execution and finalisation of projects
Acquisition of EEL Limited India
The largest cement plant in the world, Holcim’s Ste. Genevieve, USA, was successfully commissioned in 2009
200913,059
1,54811.9%
200813,7081,521
11.1%
DKKm YTDRevenueEBITEBIT ratio
Current business environment
Market outlook remains somewhat weak, resulting in intensified price competition
Local business opportunities prevail,particularly in:
- North Africa - India - Indonesia - Latin/South America

Annual Report 200917
Holcim, Ste. Genevieve, Missouri, USA The world’s largest cement production line with a capacity of 12,000 tonnes clinker per day
Designed and delivered by FLSmidth
Facts about Ste. Genevieve
Commissioned in 2009
State-of-the art technology
Largest capacity in the world
Lowest OPEX per tonne ordinary portland cement produced
Complies with most stringent environmental regulations
Annual Report 200918
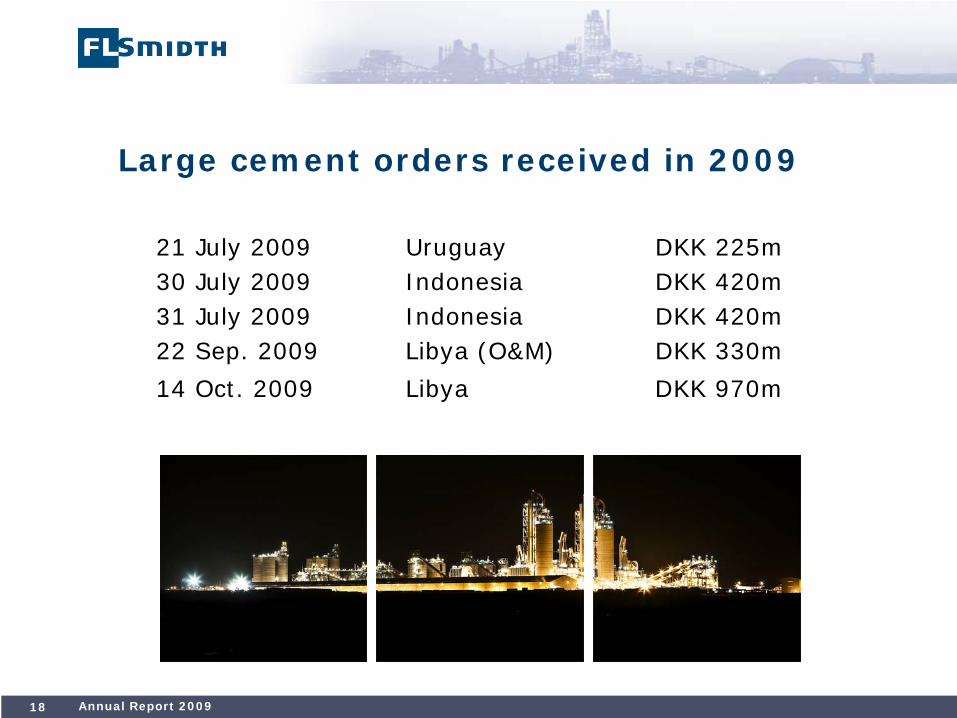
Large cement orders received in 2009
21 July 2009 Uruguay DKK 225m 30 July 2009 Indonesia DKK 420m31 July 2009 Indonesia DKK 420m22 Sep. 2009 Libya (O&M) DKK 330m
14 Oct. 2009 Libya DKK 970m
Annual Report 200919
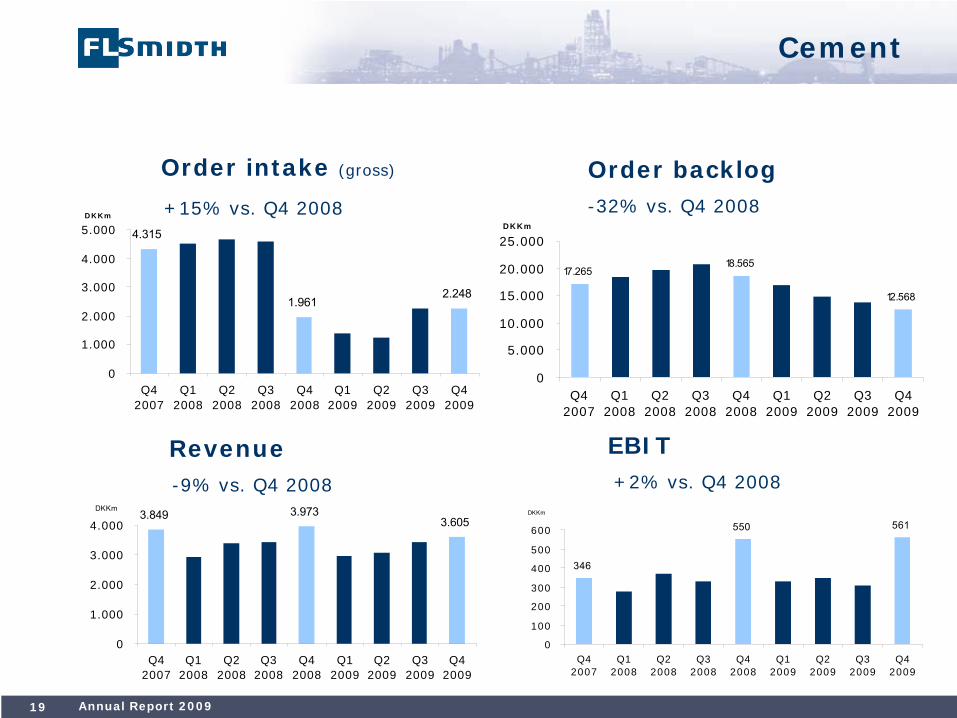
Order intake (gross)
+15% vs. Q4 2008
Order backlog-32% vs. Q4 2008
Revenue-9% vs. Q4 2008
EBIT+2% vs. Q4 2008
Cement
D KKm
2.2481.961
4.315
0
1.000
2.000
3.000
4.000
5.000
Q42007
Q12008
Q22008
Q32008
Q42008
Q12009
Q22009
Q32009
Q42009
DKKm
12.568
18.56517.265
0
5.000
10.000
15.000
20.000
25.000
Q42007
Q12008
Q22008
Q32008
Q42008
Q12009
Q22009
Q32009
Q42009
DKKm
3.6053.9733.849
0
1.000
2.000
3.000
4.000
Q42007
Q12008
Q22008
Q32008
Q42008
Q12009
Q22009
Q32009
Q42009
DKKm
561550
346
0
100
200
300
400
500
600
Q42007
Q12008
Q22008
Q32008
Q42008
Q12009
Q22009
Q32009
Q42009

Annual Report 200920
Expected future average:
~ 60-75 mty
New global contracted cement kiln capacity (excl. of China)
Cement
0
20
40
60
80
100
120
140
160
1990
1991
1992
1993
1994
1995
1996
1997
1998
1999
2000
2001
2002
2003
2004
2005
2006
2007
2008
2009
2010
E
mty
2009: 45 mty
2010E: ~50 mty
Expected future average of 60-75 mty is based on an assumption of 3-4% global GDP (excl. China) and a conservative replacement need of 10 mty per annum

Annual Report 200921
Geographical distribution of new global contracted cement kiln capacity
(excl. China)
38% 3%
21% 2% 15%
0% 0% 21%

Annual Report 200922
Market share 2009 Contracted new kiln capacity globally excl. China

Relationship between cement consumption and GDP per capita
Angola Brazil
China
Denmark
Egypt
Germany
Iran
Italy
Libya
Malaysia
MexicoRussia
Saudi Arabia
Spain
ThailandVietnam USA
France
IndiaIndonesia
Japan
Nigeria
Tyrkey
0
200
400
600
800
1000
1200
1400
- 5.000 10.000 15.000 20.000 25.000 30.000 35.000 40.000 45.000 50.000
Cement consumption per capita (kg per year)
GDP per capita (USD per year)
Emerging markets Steep increase in cement consumption per capita as urbanisation and industrialisation increase
Developed countries Declining cement consumption per capita as the economy matures
Cement

Annual Report 200924
Minerals
20099,037
798895
8.8%9.9%
200810,470
9601,2389.2%
11.8%
DKKm YTDRevenueEBITEBIT adj.EBIT ratioEBIT ratio adj.
Highlights 2009
Order intake considerably lower, although improvement seen in Q409
Revenue down by 14% andEBIT by 17% in 2009
Management focus in 2009:1.Stabilise the business2.Prepare for the future3.Redefine our strategic roadmap
Current business environment
Supported by improved market conditions, the mining industry is taking a more optimistic view on 2010 activities, although still cautious
Announced 2010 Capex budgets are supporting increased business activity
Large inquiry list and improved customer interaction, particularly in coal, iron ore, gold, phosphate and copper

Annual Report 200925
1) Stabilise the business
Order intake and backlog developmentMining companies focused on balance sheet optimisation and cash preservationOnly few large projects became contractsIntensified price competition as a result
Minerals
Order intake (gross)
-25% vs. Q4 2008
Order backlog-31% vs. Q4 2008
DKKm
190725442464
0
1000
2000
3000
4000
5000
Q4 2007
Q12008
Q22008
Q32008
Q42008
Q12009
Q22009
Q32009
Q42009
DKKm
8.777
12.606
8.712
0
5000
10000
15000
Q42007
Q12008
Q22008
Q32008
Q42008
Q12009
Q22009
Q32009
Q42009
+39%

Annual Report 200926
Order intake in 2009
Activity has primarily been within coal and alumina
Demand has primarily been for material handling and separation equipment
India has been the most active market
Major contracts in Q409– India, coal DKK 262m– Vietnam, coal DKK 201m
MineralsBreakdown of large order intake in 2009 (orders>DKK 50m)
1) Stabilise the business

Annual Report 200927
1) Stabilise the business
Backlog execution in 2009Some contracts and shipments were postponed or put on hold, resulting in delayed income recognitionSome normalisation in Q4, resulting in the highest levels of revenue and EBIT compared to previous quarters 2009Several contracts on hold are in process of being revitalized
Minerals
Revenue-22% vs. Q4 2008
EBIT adj. -37% vs. Q4 2008
DKKm
2.332
3.414
2.658
0
1000
2000
3000
4000
Q42007
Q12008
Q22008
Q32008
Q42008
Q12009
Q22009
Q32009
Q42009
DKKm
275
441
277
0
100
200
300
400
500
Q42007
Q12008
Q22008
Q32008
Q42008
Q12009
Q22009
Q32009
Q42009
*) Adjusted for effect of purchase price allocations related to GL&V Process; DKK -24m in Q4 2008 and DKK -24m in Q4 2009

Annual Report 200928
2) Prepare for the future
Actions to reduce costs in 2009 and protect margins going forwardReduction in forceReduced working weekMonitor operational costsImproved utilisation of resources in IndiaImproved sourcing in cost competitive countriesContinued integration with Cement
Acquisitions in 2009Enhanced flowsheet coverage through acquisition of:
Conveyor Engineering, USA(supplier of major bulk material handling systems)
Summit Valley Equipment & Engineering, USA(modular gold and silver extraction plants and equipment)
Minerals

Annual Report 200929
3) Redefine our strategic roadmap
Strategic review with aligned focus and management attention towardsImproved customer intimacySelected growth industriesKey technologiesGrow Customer Services segmentR&D activities directed towards growth industries and key technologies Acquisitions directed towards growth industries Further develop supply chain management Improved internal coordination and communication through delayeringand simplified management structure in place February 2010
Minerals

Mining equipment suppliers
Exploration Development Extraction Material Handling
Crushing, Grinding & Sizing
Separation Refining
Exploration for mineral resources
•Remote sensing
•Geophysical / geochemical tests
•Samples
Feasibility studies
Drilling and modeling of the ore body
Selection of appropriate mining technique
Capital investment in mine infrastructure
Mining of the ore body
Rock breaking
Surface mining
Underground mining
Mined minerals transported to processing site
Use of loaders, trucks, trains, at the face mining systems and conveyors
Materials are crushed and ground to achieve finer particles
Particles sized for optimum recovery of minerals specie
Flotation, leaching, sedimentation and filtration are used to increase the mineral content to an economic level
Refining to increase concentration of minerals further
Key techniques:
•Pyro-metallurgy
•Electro-winning
Source: Morgan Stanley, FLSmidth
FLSmidth MineralsMetso Minerals
Outotec
SandvikAtlas Copco
Boart Longyear
TerexAstec
Komatsu
Joy GlobalCAT
Chinese (var.)
Bucyrus
Furukawa
Typical mining site plant
Annual Report 200931
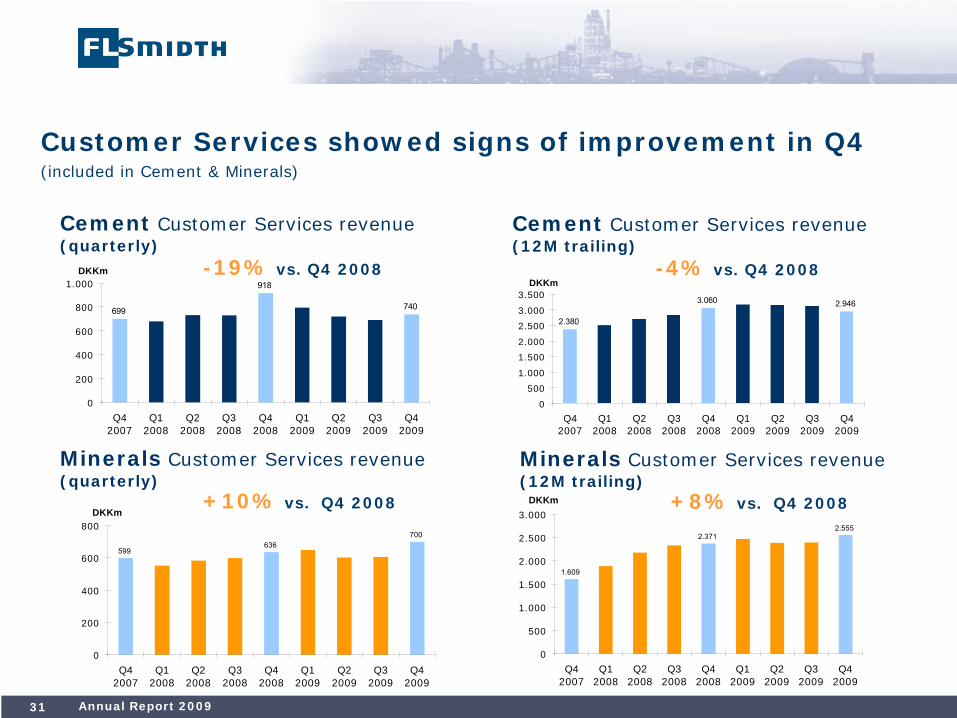
Customer Services showed signs of improvement in Q4(included in Cement & Minerals)
Cement Customer Services revenue (12M trailing)
-4% vs. Q4 2008
2.380
3.060 2.946
0
500
1.000
1.500
2.000
2.500
3.000
3.500
Q42007
Q12008
Q22008
Q32008
Q42008
Q12009
Q22009
Q32009
Q42009
DKKm
1.609
2.3712.555
0
500
1.000
1.500
2.000
2.500
3.000
Q42007
Q12008
Q22008
Q32008
Q42008
Q12009
Q22009
Q32009
Q42009
DKKm
Minerals Customer Services revenue (12M trailing)
+8% vs. Q4 2008
Cement Customer Services revenue (quarterly)
-19% vs. Q4 2008
699
918
740
0
200
400
600
800
1.000
Q42007
Q12008
Q22008
Q32008
Q42008
Q12009
Q22009
Q32009
Q42009
DKKm
599636
700
0
200
400
600
800
Q42007
Q12008
Q22008
Q32008
Q42008
Q12009
Q22009
Q32009
Q42009
DKKm
Minerals Customer Services revenue (quarterly)
+10% vs. Q4 2008

Operation & Maintenance contracts (O&M)
Dedicated work over the past 3 years to establish operation & maintenance of cement and minerals processing plants as a new business area
First Cement O&M contract in Egypt has been in operation for 1 year with very satisfying results
First Minerals Maintenance contract at Los Pelambres in Chile has just celebrated 10 year-anniversary
Negotiations ongoing with several other interested customers
Current contracts
Cement (O&M)
• Egypt (contracted in 2007)
• Libya (contracted in 2009)
Minerals (M)
• Los Pelambres, Chile (prolonged in 2008)
• Collahuasi, Chile (prolonged in 2008)
• Peñasquito, Mexico (contracted in 2008)
Annual Report 200933
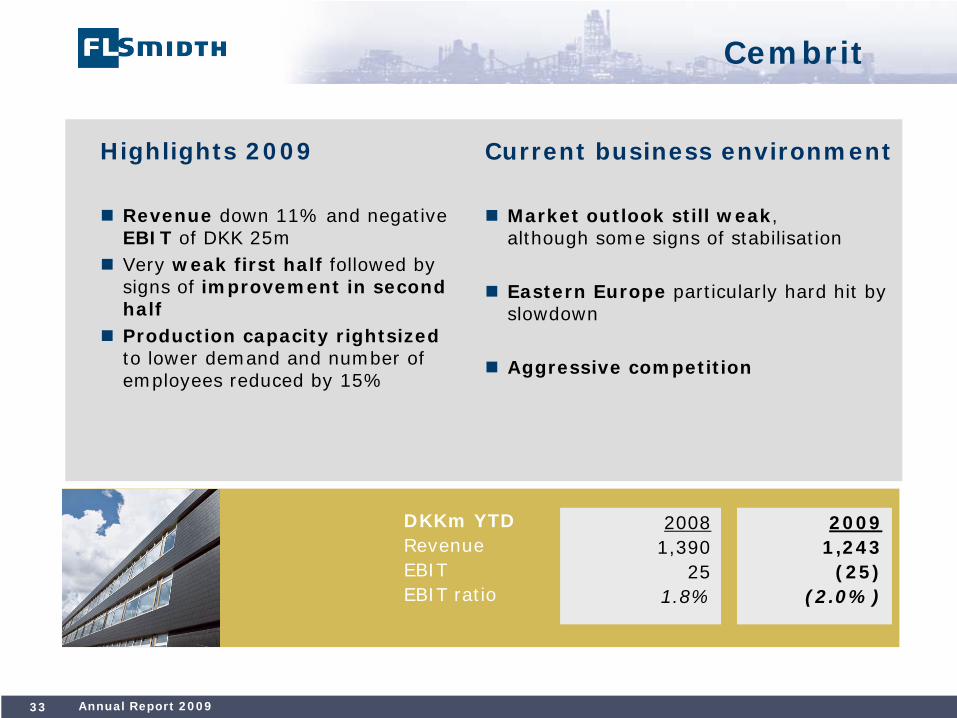
Highlights 2009
Revenue down 11% and negative EBIT of DKK 25mVery weak first half followed by signs of improvement in second halfProduction capacity rightsizedto lower demand and number of employees reduced by 15%
20091,243
(25)(2.0%)
20081,390
251.8%
DKKm YTDRevenueEBITEBIT ratio
Cembrit
Current business environment
Market outlook still weak, although some signs of stabilisation
Eastern Europe particularly hard hit by slowdown
Aggressive competition
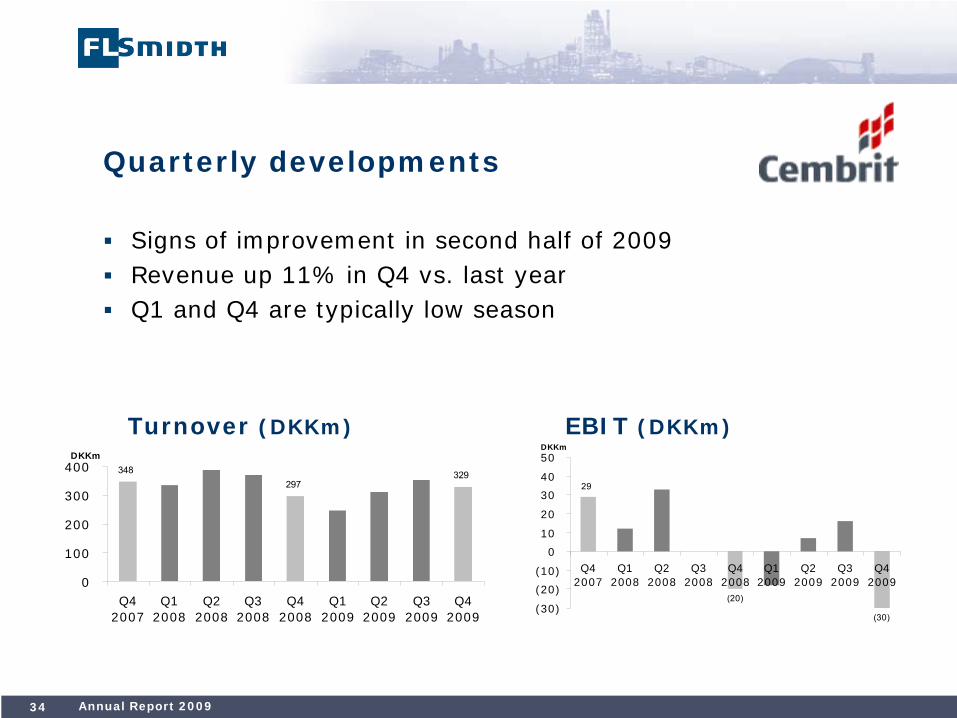
Annual Report 200934
Turnover (DKKm) EBIT (DKKm)
Quarterly developments
DKKm
348297
329
0
100
200
300
400
Q42007
Q12008
Q22008
Q32008
Q42008
Q12009
Q22009
Q32009
Q42009
DKKm
29
(20)
(30)(30)
(20)
(10)
0
10
20
30
40
50
Q42007
Q12008
Q22008
Q32008
Q42008
Q12009
Q22009
Q32009
Q42009
Signs of improvement in second half of 2009Revenue up 11% in Q4 vs. last yearQ1 and Q4 are typically low season

Annual Report 200935
2010 2009■
New cement kiln capacity 50mty 45mty■
Revenue DKK 19-20bn DKK 23,134m■
EBIT-ratio 8-9% 9.8%■
Tax rate 30% 19%■
CFFI (excl. acquisitions) DKK -400m DKK -244m
■
Order intake in both Cement and Minerals is expected to increase in 2010 vs. 2009
Guidance 2010
Revenue EBIT■
Cement DKK 9-10bn ~9%■
Minerals DKK 8-9bn ~9%■
Cembrit DKK ~1.2bn ~2%
Segments
Group

Annual Report 200936
Unchanged long term growth and earnings prospects
Urbanisation and industrialisation in developing countries are expected to continue to generate increasing demand for cement and minerals in future.
In periods of high activity: Expected EBIT ratio: 10-12%
In periods of low activity: Expected EBIT ratio: 8-9%

Annual Report 200937
Concluding remarks
71% of revenue generated in emerging markets
Record high CFFO, EBIT ratio and profits in 2009
Asset light business model is working well
Increased optimism among customers
Strong financial position allows dividend paymentto be increased in 2010
New dividend policy: DKK 7 per share per year
A number of strategic initiatives are ongoing to further enhance the competitive and financial position of FLSmidth

Annual Report 200938
Questions