Embed Size (px)
Citation preview

1
© inspire irpd – a joint project with the University of Applied Sciences St. Gallen
May 14th - 15th, 2013
Flowing Performance of SLS Powders at Elevated
Temperature
May 14th – 15th, 2013 Erfurt, Germany
Felipe Amado, M. Schmid & K. WegenerInspire AG - Institute for Rapid Product Development (irpd)
St. Gallen 9014, Switzerlandwww.inspire.ethz.ch
© inspire irpd – a joint project with the University of Applied Sciences St. Gallen
May 14th - 15th, 2013
Agenda
► Introduction of inspire IrpdOrganization & Core Competences
► SLS Polymer Powder CharacterizationState of the Art & Characterization Methods
► SummaryPrincipal Achievements & Future work
► Experimental Device & MethodologyOperational Principle & Experimental Set up
► Results & AnalysisFlowability - Fluidization at high Tº & SLS correlati on
2
© inspire irpd – a joint project with the University of Applied Sciences St. Gallen
May 14th - 15th, 2013
Introduction
© inspire irpd – a joint project with the University of Applied Sciences St. Gallen
May 14th - 15th, 2013
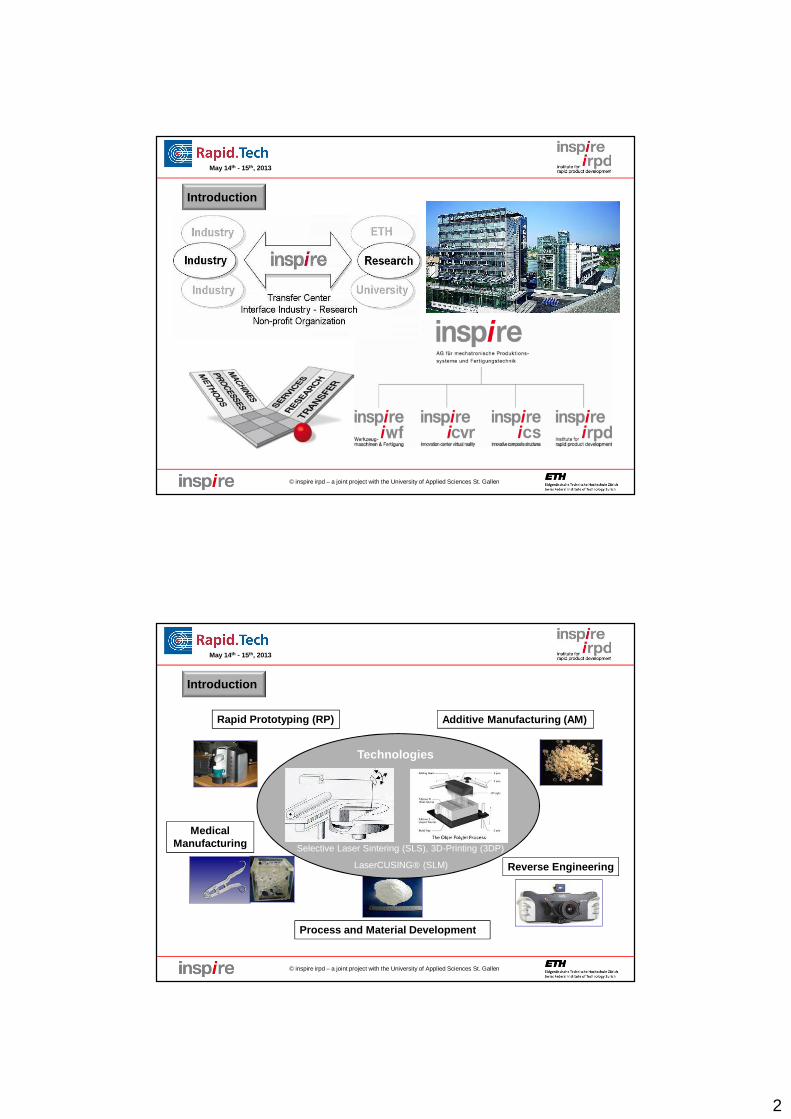
Selective Laser Sintering (SLS), 3D-Printing (3DP)
LaserCUSING® (SLM)
Technologies
Rapid Prototyping (RP) Additive Manufacturing (AM)
Reverse Engineering
MedicalManufacturing
Process and Material Development
Introduction

3
© inspire irpd – a joint project with the University of Applied Sciences St. Gallen
May 14th - 15th, 2013
SLS Polymer Powder Development
According to Dr. M. Schmid (inspire AG, Switzerland)
Absorption(10.6 µµµµm)
© inspire irpd – a joint project with the University of Applied Sciences St. Gallen
May 14th - 15th, 2013
Production Technology
Intrinsic characterization test Non-intrinsic characterization test Author/ Research
Group DSC TG MFI/ Rheo. *Others PSD Particle
Shape Tap/Bulk Density **Others
Powder mixing (polymer, fiber,
beads)
� � � � � � � � [7][10][12]
� � � � � � � � [13][14][15][16]
� � � � � � � � [17]
Melt mixing & cryogenic
grinding/spray drying
� � � � � � � � [18]
� � � � � � � � [19]
� � � � � � � � [11][20]
Dissolution-precipitation
� � � � � � � � [21]
� � � � � � � � [22]
� � � � � � � � [23]
Mechano-chemical alloying/
Solid state
� � � � � � � � [6][8]
� � � � � � � � [9]
� � � � � � � � [24]
Other characterization methods: *FTIR, EDX, XRD, etc.; **Angle Of Repose, Carr Index, etc.
� In general, extrinsic properties are barely reported or just not considered� Trial & error tests dominate over any preliminary characterization� Several authors achieve adequate intrinsic properties for processing, but fail during the
spreading stepSource: Amado et al. 2011
SLS Polymer Powder Characterization

4
© inspire irpd – a joint project with the University of Applied Sciences St. Gallen
May 14th - 15th, 2013
SLS Polymer Powder Characterization
Which system suites the best powder characterization towards SLS?
� Not a general theory for powder behaviour is available � Results provided by each method are strongly dependent upon the
powder stress condition and packing (HR=Bulk/Tap widely used)� In principle all systems present complementary information� More accurate results for systems that emulate the final handling
condition� Temperature effect/variations are not taken into account with standard
methods
Powder Stress State
Compacted
Loose
Measurement ConditionStatic Dynamic
SLS spreading
Test Method Name
Measurement Concept
Characterization Parameters
Measurement Temperature
Measurement Procedure
Fluidimeter Dynamic powder
expansion under vertical fluid flow drag effect
Powder bed expansion height versus
upstream fluid flow
Standard conditions (25ºC) Not specified
Angle of Repose Vertical powder deposition through a funnel / orifice under the gravity effect
Heap or pile angle of repose
Standard conditions (25ºC) DIN ISO 4324
Ring Shear Cell
Quasi-static powder stability on an annular
container under compression and shear
Failure locus of shear force versus normal
pressure
Standard conditions (25ºC) ASTM D6773
Bulk/Tap Density
Powder density ratio between a compacted and
loose state under mechanical tapping
Tap and bulk apparent powder density
Standard conditions (25ºC) ASTM D7481
© inspire irpd – a joint project with the University of Applied Sciences St. Gallen
May 14th - 15th, 2013
Experimental Device & Operational Principle
SLS powder spreading systems: Roller (3DSystems) & Blade (EOS) (adapted from Alscher 2000)
Schematic diagram of rotating and image acquisition system
Powder Stress State
Compacted
Loose
Measurement ConditionStatic Dynamic
SLS spreading
(φ 50 mm)
� Similar dynamic handling� Near stress state condition� Allows adjustments at different processing speeds� Temperature variation range: 30ºC-110ºC

5
© inspire irpd – a joint project with the University of Applied Sciences St. Gallen
May 14th - 15th, 2013
Experimental Device & Indexes
- Drum speed +
Flowability Fluidization
Surface Fractal D :L : length estimate
ε : measurement scale
Test Index Definition
Flowability
AvalancheAngle
Angle obtained from a linear regression of the free surface at the maximum potential energy prior to the start of the powder avalanche occurrence
Surface Fractal
Fractal dimension D obtained from the free surface of the powder. D corresponds to a dimensionless parameter based on the self-similarity concept and constitutes a powder rearrangement indicator
Fluidization
Total Volume Expansion
Ratio
Ratio between the total volume measured inside the drum (expanded volume) and the volume occupied by the powder in the preparation sample container (tap density volume: 25 cc)
Fluidized Volume
Fraction of the total volume that develops a fluidized state defined by quasi-horizontal powder surface inside the drum
© inspire irpd – a joint project with the University of Applied Sciences St. Gallen
May 14th - 15th, 2013
Cumulative Avalanche Angle Distribution
Previous Results: Flowability (Room Temperature)
� Materials with a near spherical shape present the lowest avalanche angle and a narrow distribution (span).
� Powders with a broader particle morphological distribution increase their average value
� A second phase (mixture) has a mayor influence when different particle aspect ratios are present (HST v/s Alumide)
� Highly geometrical distorted particles depict a higher d50 and span
Increase of pile stability
Source: Amado et al. 2011
But what happens at higher
temperetaure?

6
© inspire irpd – a joint project with the University of Applied Sciences St. Gallen
May 14th - 15th, 2013
� SLS Set Up:
� 2 semi-crystalline materials: icoPP (Inspire) & PA2200 (EOS)� Flowability and Fluidization analyses considered� 3 different temperatures for each material were selected:
- icoPP: 30ºC, 45ºC & 60ºC (powder sticks on surface)- PA2200: 30ºC, 70ºC & 110ºC (equipment limitation)
� Drum speed: - Flowability: 10 rpm- Fluidization: 50 rpm - 90 rpm
Experimental Set Up: RPA & SLS Tests
� RPA Heated Set Up:
� DTM Sinterstation 2000 machine� Solid cubes and hollow boxes (powder/sintered dens.)
Dimensions in mm
Solid cube
Hollow box
Upper Layer: Laser Power
variation
Lower Layer: Scan Spacing
variation
Previous work Actual
research
Low Speed
High SpeedLow Feed
Temperature LP variationSS variation
LP variationSS variation
MaterialRoller Speed
[mm/s]Feed
Temperature [ ºC]Part Bed
Temperature [ ºC]
icoPP 90, 180 45, 60 116
PA2200 90, 180 70, 110 171
Constant layer thickness (0.1 mm) & scan speed (5 m/s)
Target: To correlate RPA results with SLS Powder Packing Density
© inspire irpd – a joint project with the University of Applied Sciences St. Gallen
May 14th - 15th, 2013
20 30 40 50 60 70 800
100
200
300
400
500
Avalanche Angle icoPP [deg]
Cum
. A
vala
nche
Cou
nt [
N°]
30°C
45°C60°C
35
40
45
50
55
60
65
30ºC 45ºC 60ºCTemperature [°C]
Ava
lanc
he A
ngle
icoP
P [
deg]
20 30 40 50 60 70 800
100
200
300
400
500
Avalanche Angle PA2200 [deg]
Cum
. A
vala
nche
Cou
nt [
°N]
30°C
70°C110°C
40
50
60
70
30ºC 70ºC 110ºCTemperature [°C]
Ava
lanc
he A
ngle
PA
2200
[de
g]
Results & Analysis: Flowability ( Heated Drum )
� At 30ºC (or close to room temperature) the avalanche angle distribution of icoPP presents a lower median and narrower distribution in comparison to PA2000
� In case of icoPP the avalanche angle distribution remains almost constant with an increase of the drum temperature (no statistically difference between medians at a significance level of 5%)
� In case of PA2200 at the highest temperature the avalanche angle distribution presents a slight increase above its median. However the differences are not statistically significant
PA2200
Avalanche Angle Distribution
icoPP
D50
D50
7
© inspire irpd – a joint project with the University of Applied Sciences St. Gallen
May 14th - 15th, 2013
1 2 3 4 5 60
100
200
300
400
500
Surface Fractal icoPP [/]
Cum
. A
vala
nche
Cou
nt [
N°]
30°C
45°C60°C
2
3
4
5
30ºC 45ºC 60ºCTemperature [°C]
Sur
face
Fra
ctal
icoP
P [
/]
1 2 3 4 5 60
100
200
300
400
500
Surface Fractal PA2200 [/]
Cum
. A
vala
nche
Cou
nt [
°N]
30°C
70°C110°C
1
2
3
4
5
6
30ºC 70ºC 110ºCTemperature [°C]
Sur
face
Fra
ctal
PA
2200
[/]
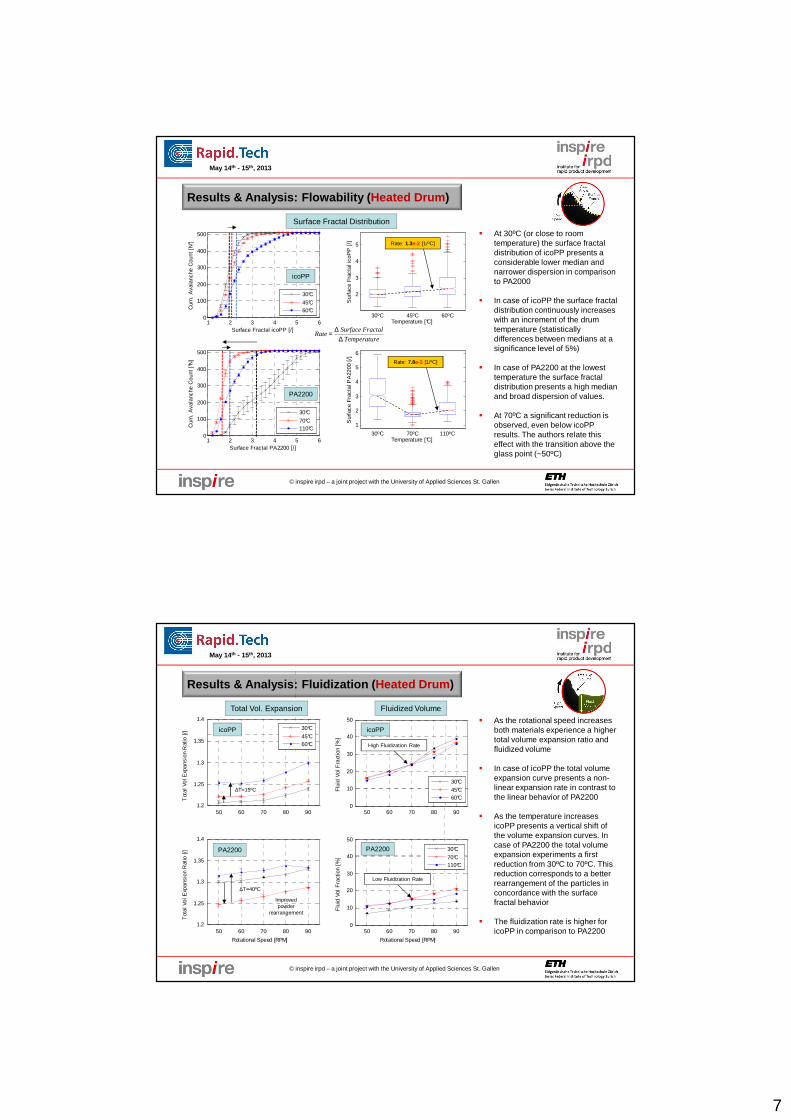
� At 30ºC (or close to room temperature) the surface fractal distribution of icoPP presents a considerable lower median and narrower dispersion in comparison to PA2000
� In case of icoPP the surface fractal distribution continuously increases with an increment of the drum temperature (statistically differences between medians at a significance level of 5%)
� In case of PA2200 at the lowest temperature the surface fractal distribution presents a high median and broad dispersion of values.
� At 70ºC a significant reduction is observed, even below icoPP results. The authors relate this effect with the transition above the glass point (~50ºC)
Results & Analysis: Flowability ( Heated Drum )
icoPP
PA2200
Surface Fractal Distribution
Surface FractalRate
Temperature
∆=∆
Rate: 1.3e-2 [1/ºC]
Rate: 7.8e-3 [1/ºC]
© inspire irpd – a joint project with the University of Applied Sciences St. Gallen
May 14th - 15th, 2013
50 60 70 80 901.2
1.25
1.3
1.35
1.4
Tot
al V
ol E
xpan
sion
Rat
io [/
]
50 60 70 80 900
10
20
30
40
50
Flu
id V
ol F
ract
ion
[%]
50 60 70 80 901.2
1.25
1.3
1.35
1.4
Rotational Speed [RPM]
Tot
al V
ol E
xpan
sion
Rat
io [/
]
50 60 70 80 900
10
20
30
40
50
Rotational Speed [RPM]
Flu
id V
ol F
ract
ion
[%]
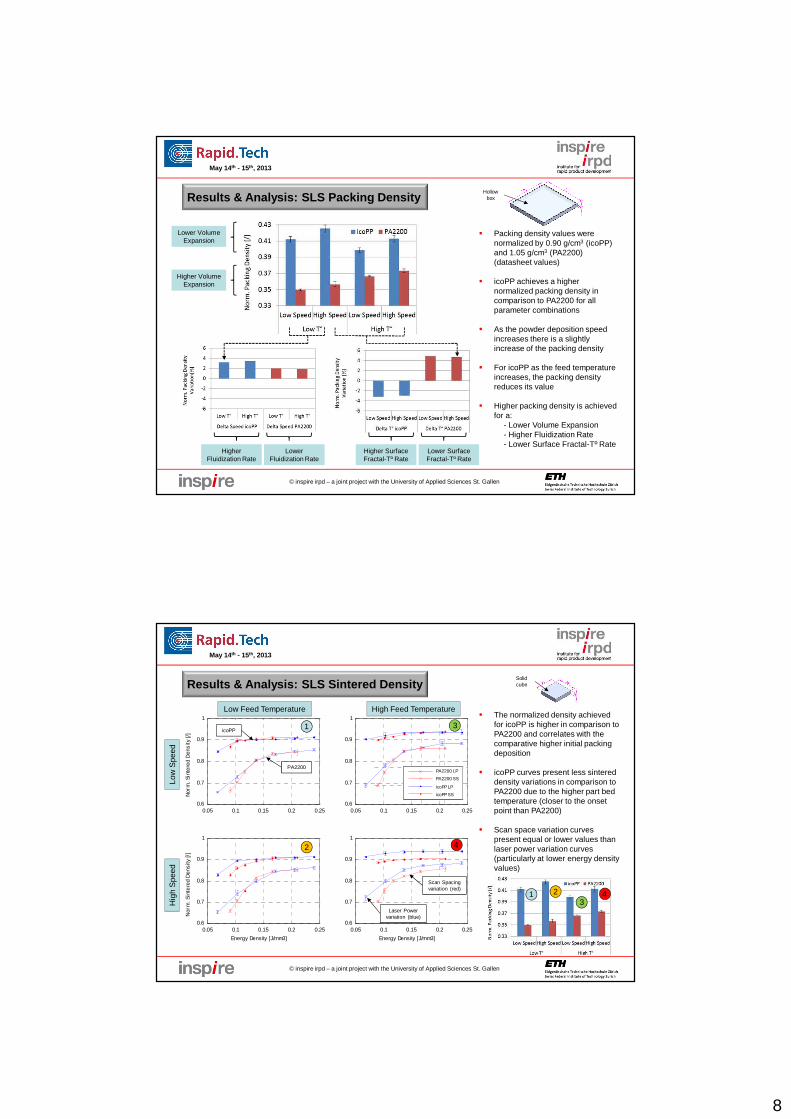
� As the rotational speed increases both materials experience a higher total volume expansion ratio and fluidized volume
� In case of icoPP the total volume expansion curve presents a non-linear expansion rate in contrast to the linear behavior of PA2200
� As the temperature increases icoPP presents a vertical shift of the volume expansion curves. In case of PA2200 the total volume expansion experiments a first reduction from 30ºC to 70ºC. This reduction corresponds to a better rearrangement of the particles in concordance with the surface fractal behavior
� The fluidization rate is higher for icoPP in comparison to PA2200
Results & Analysis: Fluidization ( Heated Drum )
30°C
45°C60°C
icoPP
PA2200
icoPP
PA2200
Total Vol. Expansion Fluidized Volume
Improved powder
rearrangement
∆T=40ºC
∆T=15ºC
High Fluidization Rate
Low Fluidization Rate
30°C
70°C110°C
30°C
45°C60°C
8
© inspire irpd – a joint project with the University of Applied Sciences St. Gallen
May 14th - 15th, 2013
� Packing density values were normalized by 0.90 g/cm3 (icoPP) and 1.05 g/cm3 (PA2200) (datasheet values)
� icoPP achieves a higher normalized packing density in comparison to PA2200 for all parameter combinations
� As the powder deposition speed increases there is a slightly increase of the packing density
� For icoPP as the feed temperature increases, the packing density reduces its value
� Higher packing density is achieved for a:
- Lower Volume Expansion- Higher Fluidization Rate- Lower Surface Fractal-Tº Rate
Results & Analysis: SLS Packing DensityHollow
box
Lower Volume Expansion
Higher Volume Expansion
Higher Fluidization Rate
Lower Fluidization Rate
Higher Surface Fractal-Tº Rate
Lower Surface Fractal-Tº Rate
© inspire irpd – a joint project with the University of Applied Sciences St. Gallen
May 14th - 15th, 2013
0.05 0.1 0.15 0.2 0.250.6
0.7
0.8
0.9
1
0.05 0.1 0.15 0.2 0.250.6
0.7
0.8
0.9
1
Energy Density [J/mm3]
0.05 0.1 0.15 0.2 0.250.6
0.7
0.8
0.9
1
Nor
m. S
inte
red
Den
sity
[/]
0.05 0.1 0.15 0.2 0.250.6
0.7
0.8
0.9
1
Energy Density [J/mm3]
Nor
m. S
inte
red
Den
sity
[/]
� The normalized density achieved for icoPP is higher in comparison to PA2200 and correlates with the comparative higher initial packing deposition
� icoPP curves present less sintered density variations in comparison to PA2200 due to the higher part bed temperature (closer to the onset point than PA2200)
� Scan space variation curves present equal or lower values than laser power variation curves (particularly at lower energy density values)
PA2200 LP
PA2200 SS
icoPP LP
icoPP SS
Low Feed Temperature High Feed Temperature
Low
Spe
edH
igh
Spe
ed
icoPP
PA2200
Solid cube
Scan Spacing variation (red)
Laser Power variation (blue)
Results & Analysis: SLS Sintered Density
2
3
4
1
1 23
4

9
© inspire irpd – a joint project with the University of Applied Sciences St. Gallen
May 14th - 15th, 2013
Summary
� A new powder characterization system has been introduced that emulates a near SLSspreading stress state when the powder is mechanically agitated inside a turning drum atelevated temperatures.
� The commercial powders PA2200 (EOS) and icoPP (Inspire) were studied in detail andthe correlation with the SLS powder packing density was presented.
� New aspects regarding the dynamic powder behavior characterization were analyzedand correlated to SLS process conditions: Avalanche Angle constitutes a first roughinvariant estimator about powder flowability, but Surface Fractal, Volume ExpansionRatio and Fluidized Volume parameters enhance the detailed analysis.
� This research was limited to semi-crystalline materials. Analyses of other thermoplasticmaterials are going to be addressed in the future.
� These results can be used to complement the existing methods to achieve a moreaccurate and detailed understanding about SLS powder suitability and thus reduce thepowder development cycle time.
© inspire irpd – a joint project with the University of Applied Sciences St. Gallen
May 14th - 15th, 2013
Thanks for your attention!
Questions?