Embed Size (px)
Citation preview

Florida State University Libraries
Electronic Theses, Treatises and Dissertations The Graduate School
2013
Accurate and Precise Determination of LowConcentration Iron, Arsenic, Selenium,Cadmium, and Other Trace Elements inNatural Samples by Octopole Collision/Reaction Cell (CRC) Equipped Quadrupole-ICP-MsAngela Dial
Follow this and additional works at the FSU Digital Library. For more information, please contact [email protected]

THE FLORIDA STATE UNIVERSITY
COLLEGE OF ARTS AND SCIENCES
ACCURATE AND PRECISE DETERMINATION OF LOW CONCENTRATION IRON,
ARSENIC, SELENIUM, CADMIUM, AND OTHER TRACE ELEMENTS IN NATURAL
SAMPLES BY OCTOPOLE COLLISION/REACTION CELL (CRC) EQUIPPED
QUADRUPOLE-ICP-MS
By
ANGELA DIAL
A Thesis submitted to the
Department of Earth, Ocean, and Atmospheric Science
in partial fulfillment of the
requirements for the degree of
Master of Science
Degree Awarded:
Spring Semester, 2013

ii
Angela Dial defended this thesis on March 28, 2013.
The members of the supervisory committee were:
William M. Landing
Professor Directing Thesis
Vincent J. M. Salters
Committee Member
Munir Humayun
Committee Member
The Graduate School has verified and approved the above-named committee members, and
certifies that the thesis has been approved in accordance with university requirements.

iii
TABLE OF CONTENTS
List of Tables ................................................................................................................................. iv
List of Figures ..................................................................................................................................v
Abstract ....................................................................................................................................... vi
1. INTRODUCTION .......................................................................................................................1
2. EXPERIMENTAL METHODS ...................................................................................................6
2.1 Reagents, Standards, and Sample Matrix .........................................................................6
2.2 Mass Spectrometry ...........................................................................................................6
2.2.1 Quadrupole-ICP-MS ..............................................................................................6
2.2.2 High Resolution-ICP-MS .......................................................................................8
3. RESULTS AND DISCUSSION ................................................................................................12
3.1 Analytical Figures of Merit .............................................................................................12
3.2 Plasma-based Interferences .............................................................................................16
3.3 Matrix-based Interferences ..............................................................................................20
3.4 Long-term Reproducibility ..............................................................................................24
4. CONCLUSIONS .......................................................................................................................26
REFERENCES ..............................................................................................................................27
BIOGRAPHICAL SKETCH .........................................................................................................30

iv
LIST OF TABLES
1. Plasma and matrix based polyatomic interferences on analytes of interest in their respective
matrix and sample type ............................................................................................................2
2. Instrumental settings of Q-ICP-MS (Agilent® 7500cs) for hot plasma and cool plasma
operations with collision – reaction cell ..................................................................................7
3. Instrumental settings of HR-ICP-MS (Thermo Finnigan® ElementXR) for low and medium
resolution Fe analyses ............................................................................................................11
4. Comparison of 56
Fe matrix blanks (in HNO3 matrix), sensitivity ([Fe]analyte = 1 µg/L; High
Purity Standard), and signal-to-noise (sensitivity/matrix blank) ratios of HR-ICP-MS
(Thermo Finnigan® ElementXR; University of Cambridge) and Q-ICP-MS (Agilent®
7500cs; Florida State University) ..........................................................................................12
5. Analytical figures of merit: sensitivity (cps/µg·L-1
per isotope), limit of detection (LoD, 3σ;
ng/L), and signal-to-noise ratios (S/N) of analytes of interest (51
V, 52
Cr, 55
Mn, 56
Fe, 57
Fe,
58
Ni, 59
Co, 63
Cu, 66
Zn, 75
As, 78
Se, 80
Se, 111
Cd, and 208
Pb) in hot and cool plasma conditions
with reaction mode or collision-reaction mode of CRC operation ........................................13
6. SRM NIST 1643e (Standard Reference Material - trace elements in freshwater) Fe and Cd
concentration data collected over a period of 7 months (Figure 11) .....................................25

v
LIST OF FIGURES
1. HR-ICP-MS (Thermo Finnigan® ElementXR) mass spectra of a 500 µg/L Fe standard
solution in 0.1 M HNO3 in low-resolution (m/∆m = 300) (Fig. 1.A) and medium-resolution
(m/∆m = 4000) (Fig. 1.B) mode ..............................................................................................3
2. Working principle of the Octopole Collision/Reaction Cell in collision and reaction
mode, adapted from the Agilent® 7500cs Operator’s Manual ...............................................5
3. Collision mode (CM) gas flow (He) optimization for 56
Fe (3.A), 78
Se (3.B), and 75
As (3.C) in
hot plasma ................................................................................................................................9
4. Reaction mode (RM) gas flow (H2) optimization for 56
Fe (4.A), 78
Se (4.B), and 75
As (4.C) in
hot plasma ..............................................................................................................................10
5. Comparison of air blank, matrix blank (0.44 M HNO3) and limit of detection (LoD: 3σ) of Fe
in hot and cool plasma mode (red and blue bars, respectively), with and without CRC
operation in RM .....................................................................................................................17
6. Comparison of sensitivities (cps/1 µg·L-1
) and matrix blanks (cps) for 56
Fe (6.A), 75
As (6.C),
78
Se (6.E), and 111
Cd (6.G) in all operating conditions: hot and cool plasma, Reaction Mode
(RM, H2 = 4.7 mL/min) and Collision-and-Reaction Mode (CRM, He = 2.8 mL/min and H2
= 2.0 mL/min) ........................................................................................................................18
7. Standard calibration in 0.44 M HNO3 of 56
Fe (circles with solid lines, y1-axis) and 57
Fe
(squares with dashed lines, y2-axis) operated under hot plasma (red) and cool plasma (blue)
conditions with the CRC in RM (H2 = 4.7 mL/min) .............................................................20
8. 75
As standard calibration in mixed acid (0.048 M HNO3 + 0.045 M HCl) operated under hot
plasma (red) and cool plasma (blue) conditions, with RM (H2 = 4.7 mL/min, circles solid
lines) and CRM (He = 2.8 mL/min and H2 = 2.0 mL/min, squares with dashed lines)
employed ...............................................................................................................................21
9. 95
Mo standard calibration (circles) in 0.44 M HNO3 executed in hot plasma with CRM (He =
3.0 mL/min and H2 = 2.0 mL/min), hot plasma with RM (H2 = 4.7 mL/min), cool plasma
with CRM (He = 2.8 mL/min and H2 = 2.0 mL/min), and cool plasma with RM (H2 =4.8
mL/min) .................................................................................................................................22
10. Comparison of sensitivity calibrations (slopes, cps/µg·L-1
) from a 111
Cd standard in 0.44 M
HNO3, operated in hot and cool plasma (red and blue bars, respectively) with the CRC in
CRM and RM (white and gray regions, respectively) ...........................................................23
11. SRM NIST 1643e (Standard Reference Material - trace elements in freshwater) Fe and Cd
concentration data collected over a period of 7 months ........................................................24

vi
ABSTRACT
An improved method for accurate and precise determination of trace quantity dissolved
metals and metalloids in natural samples by Octopole Collision/Reaction Cell (CRC) equipped
Quadrupole-Inductively Coupled Plasma-Mass Spectrometry (Agilent® 7500cs) is reported. Our
method is optimized for rapid analyses of small volume samples (~250 µL) in a variety of
matrices containing HNO3 and/or HCl. The present study focuses on elements with ICP-MS
plasma- and/or matrix based interferences, in particular 56
Fe (40
Ar16
O+),
75As (
40Ar
35Cl
+),
78Se
(40
Ar38
Ar+), and
111Cd (
95Mo
16O
+). We demonstrate efficient elimination of these polyatomic
interferences via the use of CRC in Reaction Mode (RM; H2 gas) and in Collision-Reaction
Mode (CRM; H2 and He gas). In addition, the efficiency of the instrument was evaluated under
both hot plasma (RF power 1500 Watts) and cool plasma (600 W) conditions. The present
method is optimized to analyze elements with large mass spectrometric interferences at sub parts
per billion level concentrations in a variety of natural samples and matrix compositions. We
report an average external precision of ≤ ~10% for minor (≤ 10 µg·L-1
) elements measured in a
1:100 dilution of NIST 1643e under two different plasma conditions and CRC operational
modes. Our measured concentration values for elements like Fe (99.6 µg/L), Mg (8020 µg/L),
Co (26.99 µg/L), Ni (62.54 µg/L), Cd (7.68 µg/L), Sb (59.6 µg/L), and Pb (19.82 µg/L) with a
large dynamic spread in concentrations in NIST 1643e are within ±12% to ±2% of the accepted /
published values.

1
CHAPTER 1
INTRODUCTION
Accurate and precise determination of trace metals in natural samples is essential to
discern their source, distribution, and role in the environment. Furthermore, this knowledge is
necessary to comprehend the natural biogeochemical cycles of these metals and potential
changes in their natural distribution caused by anthropogenic impacts. The role of transition
metals, such as Mn, Fe, Co, Cu, Ni, Zn, and Cd, as micronutrients in aqueous environments
generates a significant interest in understanding the biogeochemical cycle of these metals in
seawater (Brand et al, 1983; Boyd et al, 2000; Saito et al, 2005; Peers et al, 2005; Coale and
Bruland, 1988; Jones and Murray, 1984; Shaked et al, 2006; Cullen et al, 1999). Iron is of
special interest since it is a limiting factor in biological productivity throughout the world’s
oceans, particularly in high-nutrient low-chlorophyll regions (Johnson et al, 1997). Another
element of interest is Cr, as Cr has variable effects on biological cycles depending on its
oxidation state: chromium (III) is an essential nutrient for many organisms, however chromium
(VI) is highly toxic (Mertz, 1993; Kotaś and Stasicka, 1999). Another application for trace
element studies is the use of metals and metalloids like V, Zn, As, Se, Sb, and Pb as tracers of
anthropogenic pollution (Bruland et al, 1974; Plant et al, 2006; Callender, 2006). Accurate
documentation of these trace elements in the environment is imperative to aid in understanding
how biogeochemical cycles in natural systems operate and how they have been perturbed by
human activity.
Advances in inductively coupled plasma mass spectrometry (ICP-MS) over the past
decade have made it a popular analytical tool for rapid and simultaneous analyses of multiple
elements. However, accurate measurements of trace quantity dissolved metals and metalloids in
natural samples using ICP-MS is limited by the low concentration of elements in samples of
interests; contamination during sample collection, handling, and storage; and sample matrix-
based and ICP-MS plasma-based (mass spectrometer) isobaric and polyatomic interferences.
Moreover, a high first ionization potential (IP-1), volatility in analyte matrix, and surface
adsorption properties of an analyte can further compound the problems by diminishing
sensitivity and increasing the carry over effect between samples (Gaboardi & Humayun, 2009).

2
These analytical challenges are exacerbated with certain trace elements, such as Fe, As, Se, and
Cd, which have plasma- and/or matrix-based polyatomic and/or multiple charged mass
interferences on the major isotopes of the analyte. A representative list of elements of interest
and their major mass interferences from plasma and matrix sources are presented in Table 1.
Isobaric interferences are generally due to Ar, O2, N2, and C based polyatomic molecules
(plasma-based) or metal oxides (matrix-based), which have similar mass-to-charge (m/z) ratios
as the analyte. Additionally, the nature of the sample matrix (complex or simple) can play
important roles in formation of polyatomic interferences. For example, elements like V, Cr, and
As all have Cl-based interferences in the presence of HCl in the matrix (Table 1). In the present
study, rain water samples are analyzed in “dilute aqua regia” (0.048 M HNO3 + 0.045 M HCl)
for stabilization of dissolved trace metals as well as volatile mercury (Landing et al, 1998), a
strategy that increases the range of possible interferences due to chlorine based polyatomic ion
formation.
Table 1. Plasma and matrix based polyatomic interferences on analytes of interest in their
respective matrix and sample type.
Analyte Plasma
Interference
Matrix
Interference Sample Application
51V
35Cl
16O
+ Rainwater
52Cr
40Ar
12C
+
35Cl
16O
1H
+ Rainwater
55Mn
Seawater/Rainwater
56Fe
40Ar
16O
+
Seawater/Rainwater
57Fe
40Ar
16O
1H
+
Seawater/Rainwater
58Ni
Seawater/Rainwater
59Co
Seawater/Rainwater
63Cu
Seawater/Rainwater
66Zn
Seawater/Rainwater
75As
40Ar
35Cl
+ Rainwater
78Se
40Ar
38Ar
+
Rainwater
80Se
40Ar
40Ar
+
Rainwater
111Cd
95
Mo16
O+ Seawater/Rainwater
208Pb
Seawater/Rainwater

3
The success of ICP-MS analyses depends on the ability to overcome matrix- and plasma-
based isobaric, polyatomic, and multiple charged interferences on an analyte. High Resolution-
ICP-MS (HR-ICP-MS) is able to resolve many elements from their mass interferences using a
higher mass resolution defined as the resolving power:
!!"#$% = !
∆!
where m is the analyte’s mass (at 100% peak height) and Δm is the mass difference between the
analyte and interferent peaks (Weyer and Schweiters, 2003). However, HR-ICP-MS methods are
unsuitable for measurements of mass limited samples due to significant decreases in sensitivity
in mass resolution modes (m/Δm) of 2000 or higher. Figure 1 exemplifies this decrease in 56
Fe
sensitivity with increase in mass resolution. For analyses in medium resolution (m/Δm = 4000),
sensitivity is reduced by a factor of 25 from that of low resolution (m/Δm = 300). A Quadrupole-
ICP-MS (Q-ICP-MS) is incapable of resolving analyte peaks from any interference’s using
higher mass resolutions, however a Q-ICP-MS equipped with Collision/Reaction Cell (CRC) can
effectively eliminate the interfering polyatomic molecules by capitalizing on their bigger
collision radius and using energy discrimination (Tanner et al, 2002; Iglesias et al, 2002;
Leonhard et al, 2002; McCurdy & Woods, 2004).
Figure 1. HR-ICP-MS (Thermo Finnigan® ElementXR) mass spectra of a 500 µg/L Fe standard
solution in 0.1 M HNO3 in low-resolution (m/∆m = 300) (Fig. 1.A) and medium-resolution
(m/∆m = 4000) (Fig. 1.B) mode. In low-resolution (Faraday ion detection) the 56
Fe (55.9349
amu) peak is dominated by 40
Ar16
O+ (55.9573 amu) interference. In medium-resolution (Analog
ion detection) a complete peak separation between 56
Fe+ (left) from
40Ar
16O
+ (right) is achieved.
However, there is an order of magnitude decrease in overall sensitivity from low resolution
(56
Fe+ +
40Ar
16O
+ = 1.8 x 10
9) to medium resolution (
56Fe
+ = 1.0 x 10
8,
40Ar
16O
+ = 1.0 x 10
8).

4
In this study, we present an improved method of accurate and precise concentration
determination of elements with plasma- and/or matrix-based polyatomic mass spectrometric
interferences via utilization of an Agilent® 7500cs Q-ICP-MS equipped with an Octopole CRC.
The CRC is an off-axis chamber, 2 mL in volume, with a positive potential bias along the ion
flow path. The CRC can be flooded with low molecular weight gases, such as H2 (reaction mode)
and/or He (collision mode), which can collide with the passing ions of the analyte. Polyatomic
interferences have a larger collision cross section than monatomic analytes of interest, therefore
increasing the collision frequency of the interferent with the H2 and/or He molecules in the CRC.
The choice of gas determines whether the CRC is operated under reaction mode and/or collision
mode. In reaction mode, H2 gas eliminates interferences in two ways: a. by charge transfer –
polyatomic interferent molecules collide with H2 and transfer its charge to the H2 molecule, thus
making it mute to the SEM detector; and b. by mass transfer – the polyatomic interferent reacts
with H2 and bonds with one hydrogen atom, increasing its mass by 1 amu (Figure 2a). In
collision mode, He eliminates interferences by colliding with polyatomic molecules and reducing
their kinetic energy through energy transfer from the interferent to He. This drop in kinetic
energy coupled with the positive energy discrimination of the CRC stops the interferent from
traversing the cell (Figure 2b). This method of energy bias against the polyatomic interferent is
termed kinetic energy discrimination (KED).
In addition to utilizing the Octopole Collision/Reaction Cell to reduce interferences, we
optimized the instrument under hot plasma (1500 Watts) and cool plasma (600 W) conditions.
The cool plasma (~6000 K) reduces the ionization efficiency of elements with high IP-1 (e.g.,
High IP-1: Ar = 15.76 eV and As = 9.81 eV) as compared to hot plasma (~8000 K) conditions. In
the present study, we document the elimination of plasma- and matrix-based polyatomic
interferences with different plasma and CRC settings.

5
Figure 2. Working principle of the Octopole Collision/Reaction Cell in collision and reaction
mode, adapted from the Agilent® 7500cs Operator’s Manual. Polyatomic interference
elimination by charge transfer and atom transfer reactions (reaction mode) are shown in Fig. 2.A.
During atom transfer reactions, the polyatomic mass interferent (40
Ar16
O+) reacts with H2
(reaction gas) and binds one hydrogen atom to the interferent, increasing its mass by one amu.
During charge transfer reactions, the polyatomic interferent transfers its charge to a H2 molecule,
thus becoming mute to the SEM detector. Interference elimination in collision mode, utilizing an
inert gas like He (collision gas), is shown in Fig. 2.B. Polyatomic interferences (40
Ar16
O+) have a
larger ionic radius (effective nuclear volume) than the monatomic analyte of interest (56
Fe),
increasing the collision frequency of the interferent over that of the analyte with the collision gas
(He). More collisions of the interferent leads to greater loss of kinetic energy for the interferent
compared to the monatomic analyte of the same mass. This kinetic energy discrimination against
larger polyatomic interferences stops it from traversing the off-axis CRC. Moreover, in collision
mode, dissociation of polyatomic interferences upon collision with cell gas (He) also eliminates
interference.
Fig. 2A.
Fig. 2B.

6
CHAPTER 2
EXPERIMENTAL METHODS
2.1 Reagents, Standards, and Sample Matrix
All acids, ICP-MS standards, and samples were prepared using 18.3 MΩ·cm MQ water.
We used Optima® (Fisher®) grade nitric and hydrochloric acid for analyte matrix preparation.
Analyte blanks of the water source, acids, and elemental standards were closely monitored
throughout the entire experiment. Accurate molarity of each batch of acid was determined by
titrimetric methods. Samples were analyzed in three different acid matrixes: 0.44 M HNO3 for
general ICP-MS analysis; 1.0 M HNO3 for seawater samples prepared using the method from
Milne et al (2010); and mixed acid (0.048 M HNO3 + 0.045 M HCl) for measurements of trace
metals and mercury in rainwater samples using the method from Landing et al (1998). In
addition, all calibration standards were prepared gravimetrically from High Purity Standards
(HPS). Laboratory supplies used in the present body of work were acid cleaned using reagent
grade 8.0 M HNO3 at sub-boiling temperature.
2.2 Mass Spectrometry
2.2.1 Quadrupole-ICP-MS
Elemental concentrations were determined with an Agilent® 7500cs single collector
Quadrupole-ICP-MS equipped with an Octopole Collision / Reaction Cell (CRC). Depending on
the experiment, the instrument was operated either under hot plasma (1500 W) or cool plasma
(600 W) conditions. The sample introduction for both plasma conditions was done with a
nominal 100 µL/min self-aspirating concentric PFA nebulizer (ESITM
), a Scott-type quartz spray
chamber, a quartz torch with built-in quartz injector (2.5 mm i.d.), and nickel sampler and
skimmer cones. The key differences between the two plasma-operating conditions are the
voltage settings on Extraction lens 1 (EL-1) and Extraction lens 2 (EL-2). Under hot plasma
conditions, optimal sensitivity was achieved with a slightly positive voltage for EL-1 (3.5 to 4.0
V) and a negative voltage for EL-2 (-160 to -150 V). In cool plasma, optimal sensitivity was
obtained in “soft extraction” mode by applying a negative voltage on EL-1 (-180 to -175 V) and
a positive voltage on EL-2 (-5 to 5 V) (Table 2) (Misra & Froelich, 2009).

7
Table 2. Instrumental settings of Q-ICP-MS (Agilent® 7500cs) for hot plasma and cool plasma
operations with collision – reaction cell.
Instrumental Parameter Hot Plasma (1500 W) Cool Plasma (600 W)
Spray Chamber Quartz Quartz
Torch/Injector Quartz/Quartz Quartz/Quartz
Shield Torch Platinum Platinum
Sampler Cone Nickel Nickel
Skimmer Cone Nickel Nickel
Nebulizer ~100 µL/min Concentric (PFA) ~100 µL/min Concentric (PFA)
Spray Chamber Temperature 2 °C 2 °C
Carrier Gas Flow 0.70 to 0.75 L/min 0.60 to 0.65 L/min
Make-up Gas Flow 0.30 to 0.35 L/min 0.17 to 0.22 L/min
Sampling Depth 6.5 to 7.5 mm 7.0 to 8.0 mm
Extraction 1 Lens 3.5 to 4.0 V -180 to -175 V
Extraction 2 Lens -160 to -150 V -5 to 5 V
Reaction Cell H2 = 4.6 to 4.9 mL/min H2 = 4.6 to 4.9 mL/min
Gas Flows He = 0 mL/min He = 0 mL/min
Collision and Reaction H2 = 2.5 to 3.0 mL/min H2 = 2.5 to 3.0 mL/min
Cell Gas Flows He = 2.0 to 2.5 mL/min He = 2.0 to 2.5 mL/min
For daily operation, the ICP-MS was initially tuned under hot plasma (1500 W)
conditions with the CRC disabled. Instrumental sensitivity and stability (%RSD ≤ 1.5%) was
optimized for masses (m/z) 7Li
+,
24Mg
+,
59Co
+,
89Y
+,
140Ce
+, and
205Tl
+. To minimize the
formation of polyatomic interferences, the sampling depth and gas flows were adjusted to have
<2% oxide formation (m/z: 140
Ce16
O+/140
Ce+ or 156/140) and <2.5% doubly charged ion
formation (m/z: 140
Ce++
/140
Ce+
or 70/140). Tuning of the quadrupole (peak resolution, peak
shape, and resolution axis) and detector calibration (pulse to analog counting mode linearity)
were all performed via auto-tune. For cool plasma measurements, the instrument was first
optimized in hot plasma before lowering the forward RF power to 600 W. The instrument was
re-optimized in cool plasma after allowing the vacuum pressure to stabilize for ~15 minutes. In
both plasma modes, the CRC was operated by using H2 gas (reaction mode), He gas (collision
mode), or both He and H2 gas (collision-and-reaction mode). For the present study, only reaction
mode (RM) or collision-and-reaction mode (CRM) are discussed due to their greater efficiency
in reducing plasma- and matrix-based interferences (Feldmann et al, 1999; Iglesias et al, 2002;
8
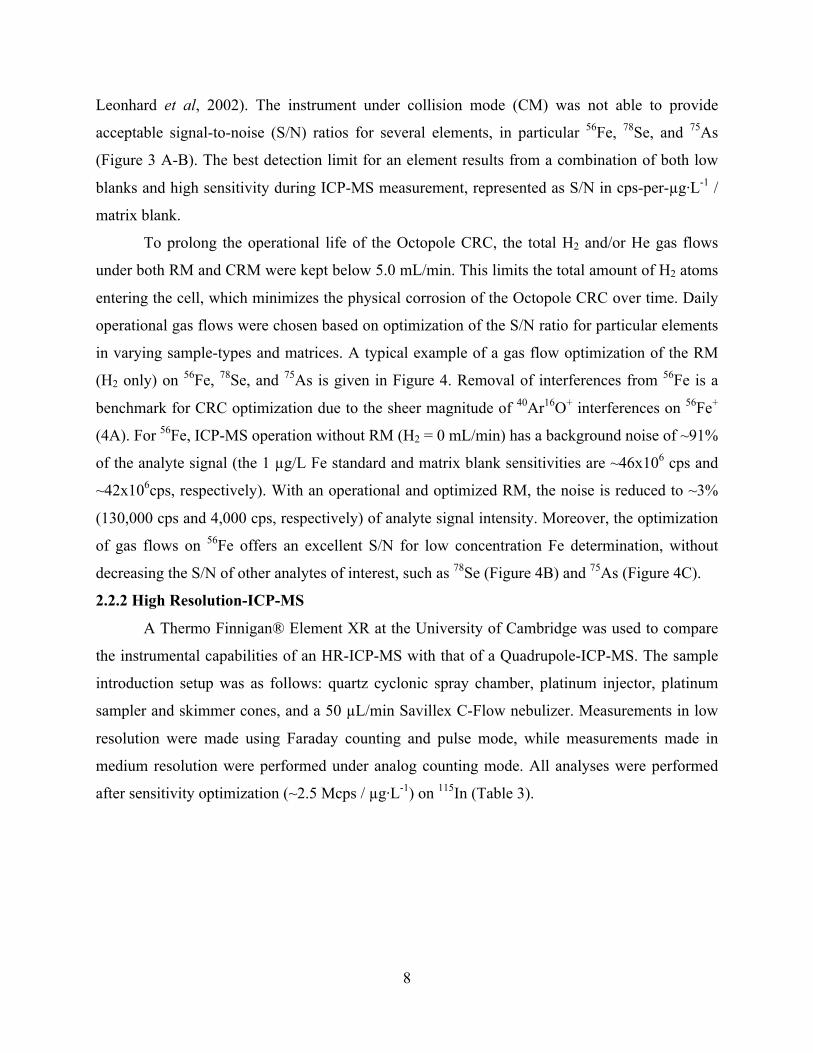
Leonhard et al, 2002). The instrument under collision mode (CM) was not able to provide
acceptable signal-to-noise (S/N) ratios for several elements, in particular 56
Fe, 78
Se, and 75
As
(Figure 3 A-B). The best detection limit for an element results from a combination of both low
blanks and high sensitivity during ICP-MS measurement, represented as S/N in cps-per-µg·L-1
/
matrix blank.
To prolong the operational life of the Octopole CRC, the total H2 and/or He gas flows
under both RM and CRM were kept below 5.0 mL/min. This limits the total amount of H2 atoms
entering the cell, which minimizes the physical corrosion of the Octopole CRC over time. Daily
operational gas flows were chosen based on optimization of the S/N ratio for particular elements
in varying sample-types and matrices. A typical example of a gas flow optimization of the RM
(H2 only) on 56
Fe, 78
Se, and 75
As is given in Figure 4. Removal of interferences from 56
Fe is a
benchmark for CRC optimization due to the sheer magnitude of 40
Ar16
O+ interferences on
56Fe
+
(4A). For 56
Fe, ICP-MS operation without RM (H2 = 0 mL/min) has a background noise of ~91%
of the analyte signal (the 1 µg/L Fe standard and matrix blank sensitivities are ~46x106 cps and
~42x106cps, respectively). With an operational and optimized RM, the noise is reduced to ~3%
(130,000 cps and 4,000 cps, respectively) of analyte signal intensity. Moreover, the optimization
of gas flows on 56
Fe offers an excellent S/N for low concentration Fe determination, without
decreasing the S/N of other analytes of interest, such as 78
Se (Figure 4B) and 75
As (Figure 4C).
2.2.2 High Resolution-ICP-MS
A Thermo Finnigan® Element XR at the University of Cambridge was used to compare
the instrumental capabilities of an HR-ICP-MS with that of a Quadrupole-ICP-MS. The sample
introduction setup was as follows: quartz cyclonic spray chamber, platinum injector, platinum
sampler and skimmer cones, and a 50 µL/min Savillex C-Flow nebulizer. Measurements in low
resolution were made using Faraday counting and pulse mode, while measurements made in
medium resolution were performed under analog counting mode. All analyses were performed
after sensitivity optimization (~2.5 Mcps / µg·L-1
) on 115
In (Table 3).
9
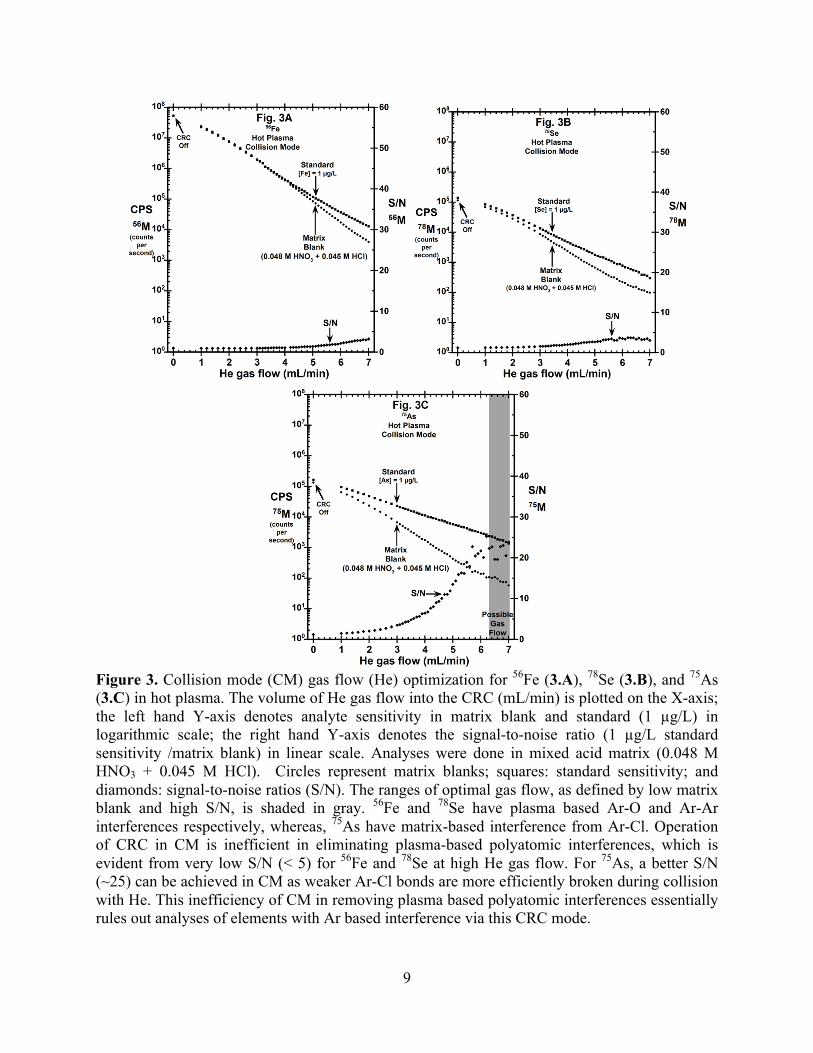
Figure 3. Collision mode (CM) gas flow (He) optimization for
56Fe (3.A),
78Se (3.B), and
75As
(3.C) in hot plasma. The volume of He gas flow into the CRC (mL/min) is plotted on the X-axis;
the left hand Y-axis denotes analyte sensitivity in matrix blank and standard (1 µg/L) in
logarithmic scale; the right hand Y-axis denotes the signal-to-noise ratio (1 µg/L standard
sensitivity /matrix blank) in linear scale. Analyses were done in mixed acid matrix (0.048 M
HNO3 + 0.045 M HCl). Circles represent matrix blanks; squares: standard sensitivity; and
diamonds: signal-to-noise ratios (S/N). The ranges of optimal gas flow, as defined by low matrix
blank and high S/N, is shaded in gray. 56
Fe and 78
Se have plasma based Ar-O and Ar-Ar
interferences respectively, whereas, 75
As have matrix-based interference from Ar-Cl. Operation
of CRC in CM is inefficient in eliminating plasma-based polyatomic interferences, which is
evident from very low S/N (< 5) for 56
Fe and 78
Se at high He gas flow. For 75
As, a better S/N
(~25) can be achieved in CM as weaker Ar-Cl bonds are more efficiently broken during collision
with He. This inefficiency of CM in removing plasma based polyatomic interferences essentially
rules out analyses of elements with Ar based interference via this CRC mode.

10
Figure 4. Reaction mode (RM) gas flow (H2) optimization for 56
Fe (4.A), 78
Se (4.B), and 75
As
(4.C) in hot plasma. The volume of H2 gas flow into the CRC (mL/min) is plotted on the X-axis;
the left hand Y-axis denotes analyte sensitivity in matrix blank and standard (1 µg/L) in
logarithmic scale; the right hand Y-axis denotes the signal-to-noise ratio (1 µg/L standard
sensitivity /matrix blank) in linear scale. Analyses were done in mixed acid matrix (0.048 M
HNO3 + 0.045 M HCl). Circles represent matrix blanks; squares: standard sensitivity; and
diamonds: signal-to-noise ratios (S/N). The ranges of optimal gas flow, as defined by low matrix
blank and high S/N, is shaded in gray. Operation of CRC in RM is efficient in knocking out
plasma and matrix based polyatomic interferences as evident from high S/N (> 30) for 56
Fe, 78
Se
and 75
As at moderate H2 gas flow (4.5 ± 0.5 mL/min). Considering Fe (4.A), the sensitivity
difference between standard and matrix blank is ~9% (~ 46 x 106 cps and 42 x 10
6cps,
respectively) without the CRC in operation, whereas in RM with optimal gas flow, the difference
increases to ~97% (130,000 cps and 4,000 cps, respectively). Moreover, optimizing the CRC on 56
Fe in RM ensures that other analytes of interest (75
As, 78
Se, 111
Cd) had high (≥ 30) S/N. In
addition, during gas flow optimization the lowest acceptable gas flow is chosen to reduce the
amount of H2 gas entering the Octopole CRC, hence minimizing physical degradation of the
CRC.
11
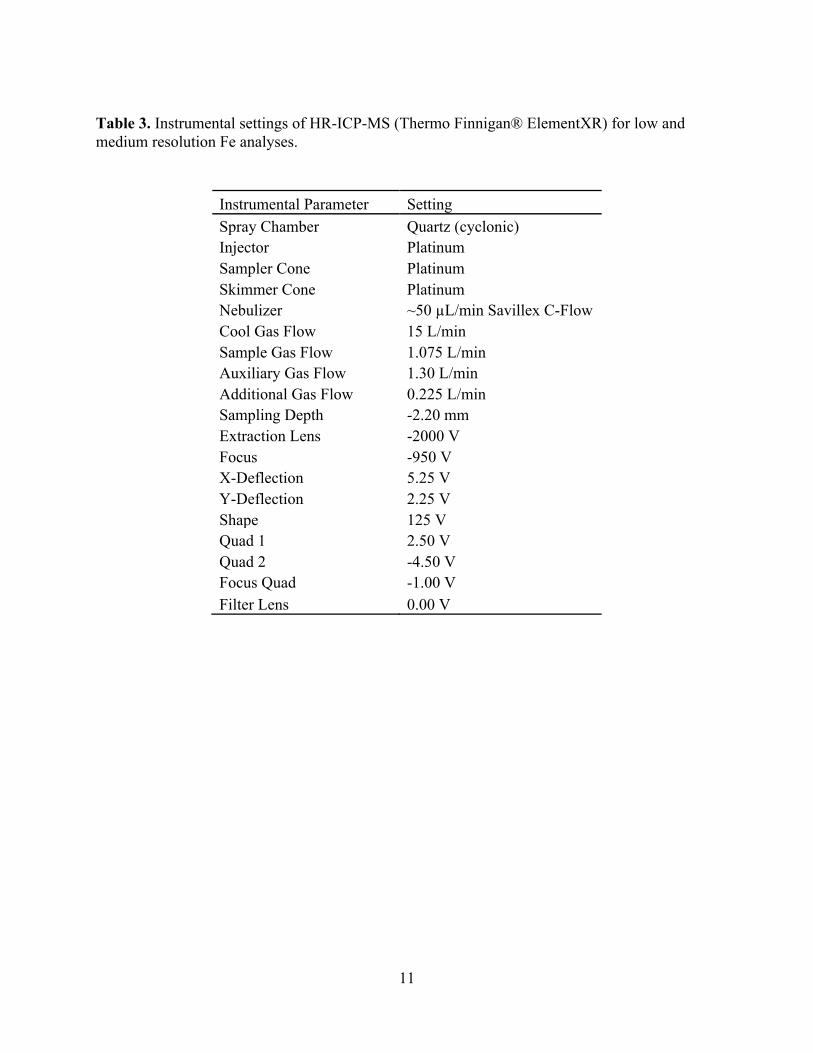
Table 3. Instrumental settings of HR-ICP-MS (Thermo Finnigan® ElementXR) for low and
medium resolution Fe analyses.
Instrumental Parameter Setting
Spray Chamber Quartz (cyclonic)
Injector Platinum
Sampler Cone Platinum
Skimmer Cone Platinum
Nebulizer ~50 µL/min Savillex C-Flow
Cool Gas Flow 15 L/min
Sample Gas Flow 1.075 L/min
Auxiliary Gas Flow 1.30 L/min
Additional Gas Flow 0.225 L/min
Sampling Depth -2.20 mm
Extraction Lens -2000 V
Focus -950 V
X-Deflection 5.25 V
Y-Deflection 2.25 V
Shape 125 V
Quad 1 2.50 V
Quad 2 -4.50 V
Focus Quad -1.00 V
Filter Lens 0.00 V

12
CHAPTER 3
RESULTS AND DISCUSSION
3.1 Analytical Figures of Merit
Direct comparison of HR-ICP-MS and Q-ICP-MS in terms of their sensitivity,
instrumental blanks, and signal-to-noise ratios is limited by the unavailability of these results in
published works. In Table 4 we present a comparative study of 56
Fe figures of merit from the two
types of instruments. The HR-ICP-MS (Thermo Finnigan® Element XR) has high sensitivity
and a comparatively high instrumental blank, resulting in a low signal-to-noise ratio (S/NLow Res =
~1; S/NMed Res = 120). The Quadrupole-ICP-MS is an Agilent® 7500cs which yields a better
signal-to-noise ratio for 56
Fe while utilizing cool plasma and reaction mode (H2 gas only), thus
offering a very low detection limit (S/NCool Plasma, RM = 210).
Table 4. Comparison of 56
Fe matrix blanks (in HNO3 matrix), sensitivity ([Fe]analyte = 1 µg/L;
High Purity Standard), and signal-to-noise (sensitivity/matrix blank) ratios of HR-ICP-MS
(Thermo Finnigan® ElementXR; University of Cambridge) and Q-ICP-MS (Agilent® 7500cs;
Florida State University). Q-ICP-MS was operated under reaction mode (CRC with H2 gas) in
both hot plasma (1500 W) and cool plasma (600 W) conditions.
Instrument Resolution Plasma
Power Matrix Matrix Blanks
(cps) 1 ppb
(cps) Signal/Noise Thermo Finnigan
Element XR Low 1250 W 0.1 M HNO3 ~1x10⁹ ~1x10
9 ~1 Thermo Finnigan
Element XR Medium 1250 W 0.1 M HNO3 6,000 700,000 120
Agilent 7500cs Low 1500 W 0.44 M HNO3 1,300 52,000 40
Agilent 7500cs Low 600 W 0.44 M HNO3 710 150,000 210
Sample analyses by Q-ICP-MS included a full-metal scan of 71 elements, ranging from
mass 7Li to
238U. The Q-ICP-MS was operated under hot and cool plasma conditions, utilizing
reaction mode or collision-and-reaction mode, and with samples in three different matrix
compositions (0.44 M HNO3, 1.0 M HNO3, and mixed acid (0.048 M HNO3 + 0.045 M HCl)).
Table 5 lists the sensitivity in counts-per-second per parts-per-billion (cps/µg·L-1
) per isotope,
limit of detection in parts-per-trillion (ng/L), and signal-to-noise ratio of the major analytes of

13
Table 5. Analytical figures of merit: sensitivity (cps/µg·L-1
per isotope), limit of detection (LoD,
3σ; ng/L), and signal-to-noise ratios (S/N) of analytes of interest (51
V, 52
Cr, 55
Mn, 56
Fe, 57
Fe, 58
Ni, 59
Co, 63
Cu, 66
Zn, 75
As, 78
Se, 80
Se, 111
Cd, and 208
Pb) in hot and cool plasma conditions with
reaction mode or collision-reaction mode of CRC operation. Experiments were conducted using
three different matrices: 0.44 M HNO3 (5.A); 1.0 M HNO3 (5.B); and mixed acid matrix (0.048
M HNO3 + 0.045 M HCl) (5.C). Reported sensitivities are corrected for the percent abundance of
isotope of choice. The isotopic abundance correction of sensitivity allows for a more meaningful
comparison of blanks and instrumental sensitivity for different elements. Table 5.B. compares
the expected minimum (Bruland, 1983; Donat & Bruland, 1995) of a concentrated (20-fold)
seawater sample (Milne et al, 2010) with the optimal LoD (shaded gray) for each element.
Table 5.A. 0.44 M HNO3
Hot Plasma Cool Plasma
Analyte
CRC
Gas
Sensitivity
(cps/µg·L-1
)
LoD
(ng/L) S/N
Sensitivity
(cps/µg·L-1
)
LoD
(ng/L) S/N
51V
H2 16,000 3.0 240 44,000 0.39 1000
He + H2 21,000 1.2 470 53,000 0.34 470
52Cr
H2 16,000 4.5 50 81,000 2.5 560
He + H2 29,000 4.3 55 130,000 4.8 325
55Mn
H2 75,000 3.0 220 190,000 0.95 320
He + H2 52,000 1.0 220 200,000 6.2 605
56Fe
H2 57,000 3.2 40 160,000 0.86 210
He + H2 46,000 3.9 20 170,000 13 75
57Fe
H2 59,000 77 2 170,000 21 10
He + H2 45,000 96 1 180,000 11 12
58Ni
H2 8,000 13 25 37,000 3.3 440
He + H2 15,000 23 40 59,000 2.7 175
59Co
H2 24,000 0.93 700 62,000 0.15 3300
He + H2 29,000 0.95 1000 89,000 0.58 1650
63Cu
H2 3,800 7.6 60 20,000 1.0 270
He + H2 16,000 5.8 50 59,000 7.8 90
66Zn
H2 27,000 6.0 180 30,000 1.9 260
He + H2 23,000 1.6 120 35,000 9.6 17
75As
H2 1,500 3.5 120 860 5.0 80
He + H2 2,600 4.1 180 1,100 4.4 50
78Se
H2 4,200 36 25 2,100 36 20
He + H2 5,000 32 25 2,000 35 17
80Se
H2 4,400 30 14 2,200 34 18
He + H2 5,200 38 5 2,000 74 2
111Cd
H2 100,000 0.62 1500 45,000 0.84 440
He + H2 86,000 0.35 1800 44,000 3.0 235
208Pb
H2 210,000 0.26 1900 97,000 0.35 1700
He + H2 210,000 0.72 1300 115,000 4.6 270

14
Table 5.B. 1.0 M HNO3
Hot Plasma Cool Plasma Expected
Seawater
Minimum
(ng/L) Analyte
CRC
Gas
Sensitivity
(cps/µg·L-1
)
LoD
(ng/L) S/N
Sensitivity
(cps/µg·L-1
)
LoD
(ng/L) S/N
51V
H2 20,000 4.5 90 56,000 1.8 400 23,400
He + H2 23,000 0.082 230 37,000 3.5 210
52Cr
H2 20,000 0.22 60 94,000 0.027 610 3,060
He + H2 31,000 0.19 60 110,000 2.4 255
55Mn
H2 93,000 1.2 140 200,000 1.5 200 81.5
He + H2 57,000 1.7 160 150,000 2.0 640
56Fe
H2 71,000 8.4 30 190,000 4.3 90 20.4
He + H2 50,000 15 20 110,000 7.2 45
57Fe
H2 72,000 94 2 180,000 15 9 ─
He + H2 41,406 135 2 110,000 64 13
58Ni
H2 10,000 3.3 20 38,000 1.1 250 2,040
He + H2 16,000 2.3 40 35,000 11 140
59Co
H2 30,000 0.42 700 67,000 0.14 2100 4.08
He + H2 31,000 0.92 800 57,000 0.42 1500
63Cu
H2 4,800 5.0 30 20,000 6.0 250 510
He + H2 16,000 2.3 50 36,000 42 50
66Zn
H2 28,000 0.50 150 25,000 1.4 170 102
He + H2 22,000 1.4 160 19,000 95 30
75As
H2 160,000 3.1 120 170,000 13 60 20,400
He + H2 170,000 1.9 160 180,000 20 50
78Se
H2 3,800 21 440 710 42 3300 510
He + H2 4,200 14 175 1,200 55 1650
80Se
H2 3,800 25 270 650 110 260 ─
He + H2 4,800 36 90 1,200 702 17
111Cd
H2 110,000 0.30 1300 41,000 0.36 440 1.02
He + H2 86,000 0.38 1900 26,000 3.3 220
208Pb
H2 250,000 0.023 2000 100,000 0.30 1600 5.09
He + H2 230,000 0.27 2200 100,000 0.56 1000

15
Table 5.C. Mixed Acid (0.048M HCl plus 0.045M HNO3)
Hot Plasma Cool Plasma
Analyte CRC Gas
Sensitivity
(cps/µg·L-1
)
LoD
(ng/L) S/N
Sensitivity
(cps/µg·L-1
)
LoD
(ng/L) S/N
51V
H2 16,000 30 1 51,000 39 0
He + H2 19,000 21 3 48,000 148 0
52Cr
H2 16,000 29 5 86,000 5.1 5
He + H2 26,000 0.83 14 130,000 6.8 20
55Mn
H2 82,000 0.13 250 180,000 0.47 300
He + H2 52,000 1.1 230 190,000 0.38 780
56Fe
H2 61,000 14 35 170,000 1.0 150
He + H2 46,000 5.2 20 170,000 11 50
57Fe
H2 64,000 57 2 180,000 11 9
He + H2 45,000 95 2 180,000 11 9
58Ni
H2 8,200 0.83 20 51,000 0.15 720
He + H2 14,000 2.2 40 70,000 1.9 465
59Co
H2 25,000 0.46 870 78,000 0.079 3700
He + H2 27,000 1.1 1100 100,000 0.27 460
63Cu
H2 3,600 16 50 27,000 4.4 150
He + H2 14,000 0.28 30 71,000 15 135
66Zn
H2 36,000 63 50 54,000 0.78 550
He + H2 30,000 57 50 54,000 18 120
75As
H2 1,700 5.8 80 1,600 3.4 50
He + H2 2,900 4.8 55 1,600 8.5 34
78Se
H2 6,700 39 30 2,800 46 30
He + H2 6,300 27 30 4,000 43 30
80Se
H2 6,900 60 4 2,800 49 3
He + H2 6,700 31 3 4,000 30 3
111Cd
H2 133,000 0.088 1600 66,000 1.1 510
He + H2 110,000 0.82 1700 61,000 1.5 285
208Pb
H2 270,000 0.49 500 84,000 0.47 1100
He + H2 250,000 0.80 600 110,000 1.8 690

16
interest (51
V, 52
Cr, 55
Mn, 56
Fe, 57
Fe, 58
Ni, 59
Co, 63
Cu, 66
Zn, 75
As, 78
Se, 80
Se, 111
Cd, and 208
Pb). The
reported sensitivity is corrected for percent abundance per isotope to demonstrate the total cps
for each element, allowing a more accurate comparison of sensitivities between elements and
isotopes. For example, using this scheme of reporting the two isotope pairs of Fe and Se, 56
Fe &
57Fe and
78Se &
80Se have identical sensitivities, within instrumental uncertainty, despite the
major difference in their respective isotopic abundance. In addition, Table 5.B. compares the best
detection limits achieved in the present study with the lowest concentrations (Bruland, 1983;
Donat & Bruland, 1995) from an expected seawater sample that has been pre-concentrated by a
factor of 20 (Milne et al, 2010). The detection limits range from 3 to 3,000 times lower than the
expected concentrations from the pre-concentrated seawater extractions.
The variability in analyte sensitivity in different acid matrices is due to the difference in
viscosities of the sample matrix that affects the sample uptake rate. In addition, elements with
low IP-1 and lighter mass (m < 65 amu) have a higher sensitivity and signal-to-noise ratio in cool
plasma mode versus the heavier elements (m > 65 amu) (Table 5). Based on this observation and
depending on the elemental isotope(s) of interest, the CRC operational mode (RM versus CRM)
was decided. For Fe, use of RM is preferred for 56
Fe as it efficiently eliminates 40
Ar16
O+ and thus
provides the best S/N. However, 57
Fe measurements are optimal with use of CRM as H2 reacts
with 40
Ar16
O+ and
56Fe
+ to create
40Ar
16O
1H
+ and
56Fe
1H
+, respectively, which both interfere with
57Fe. Operation of the CRC in CRM (H2 and He) instead of RM (H2) reduces the total amount of
H2 in the cell and thus minimizes reactions that lead to formation of H2 based polyatomics within
the CRC. Moreover, in CRM, the 40
Ar16
O1H
+ and
56Fe
1H
+ molecules upon formation are
removed through collision with He, thus resulting in a better S/N for 57
Fe (Table 5).
3.2 Plasma-based Interferences
Every isotope of Fe has a plasma-based Ar-polyatomic interference, making it a
challenging element for ICP-MS analyses. Figure 5 compares the limit of detection, blanks, and
air blanks between hot and cool plasma conditions for 56
Fe with and without the CRC in
operation (RM). With the CRC turned off (H2 = 0.0 mL/min), the hot plasma (1500 W)
conditions have a larger matrix blank and limit of detection than the cool plasma (600 W)
conditions. Argon has a very high first ionization potential (15.76 eV, versus Fe IP-1 = 7.87 eV),
therefore Ar is not as efficiently ionized in the weaker cool plasma compared to hot plasma.
Thus, there are fewer Ar based polyatomics in cool plasma with the CRC in RM (H2 = 4.7

17
mL/min), resulting in the 0.44 M HNO3 blanks being ~40% lower than in hot plasma (Figure 5).
With the Ar-based polyatomic interferences drastically reduced in cool plasma, accurate
determination of trace Fe in natural samples can be readily accomplished. For example, surface
seawater ([Fe]SW ≤ 2.7 x 10⁻¹²
mol/L) is concentrated by only a factor of 12-20 via a cation
chelating column in 1 mL of 1.0 M HNO3 (Milne et al, 2010).
Figure 5. Comparison of air blank, matrix blank (0.44 M HNO3) and limit of detection (LoD:
3σ) of Fe in hot and cool plasma mode (red and blue bars, respectively), with and without CRC
operation in RM. Checkered bars represent the LoD (cps), solid bars: matrix blank (cps), and
slashed bars: air blank (dry plasma). The gray region denotes the utilization of the CRC in RM.
In both plasma conditions, the blanks are reduced by ≥3 orders of magnitude in RM. Cool
plasma in RM achieves the lowest matrix blanks and best limit of detection due to fewer Ar-
based polyatomics forming in the plasma. Argon is not as efficiently ionized under cool plasma
(600 W) conditions compared to hot plasma (1500 W) due to its high IP-1 (15.76 eV).
Figure 6A shows the comparison between matrix blanks and sensitivity (per µg/L) for
56Fe under all operating conditions: hot plasma in CRM, hot plasma in RM, cool plasma in
CRM, and cool plasma in RM. In addition, the comparison includes the different acid matrices of
interest: 0.44 M HNO3, 1.0 M HNO3, and mixed acid (0.048 M HNO3 + 0.045 M HCl). In cool
plasma mode, the matrix blanks are generally lower for all acid matrices, especially with use of
RM (Figure 6A). Moreover, the Fe sensitivity is always high in cool plasma, regardless of which
18
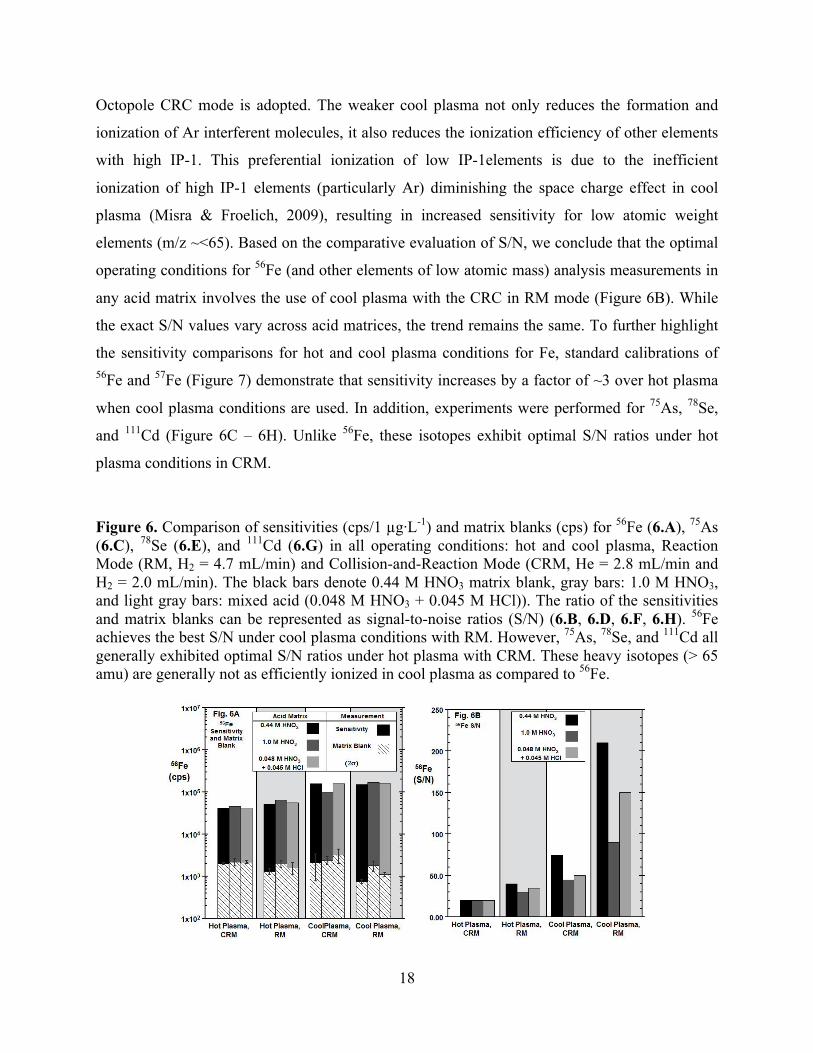
Octopole CRC mode is adopted. The weaker cool plasma not only reduces the formation and
ionization of Ar interferent molecules, it also reduces the ionization efficiency of other elements
with high IP-1. This preferential ionization of low IP-1elements is due to the inefficient
ionization of high IP-1 elements (particularly Ar) diminishing the space charge effect in cool
plasma (Misra & Froelich, 2009), resulting in increased sensitivity for low atomic weight
elements (m/z ~<65). Based on the comparative evaluation of S/N, we conclude that the optimal
operating conditions for 56
Fe (and other elements of low atomic mass) analysis measurements in
any acid matrix involves the use of cool plasma with the CRC in RM mode (Figure 6B). While
the exact S/N values vary across acid matrices, the trend remains the same. To further highlight
the sensitivity comparisons for hot and cool plasma conditions for Fe, standard calibrations of
56Fe and
57Fe (Figure 7) demonstrate that sensitivity increases by a factor of ~3 over hot plasma
when cool plasma conditions are used. In addition, experiments were performed for 75
As, 78
Se,
and 111
Cd (Figure 6C – 6H). Unlike 56
Fe, these isotopes exhibit optimal S/N ratios under hot
plasma conditions in CRM.
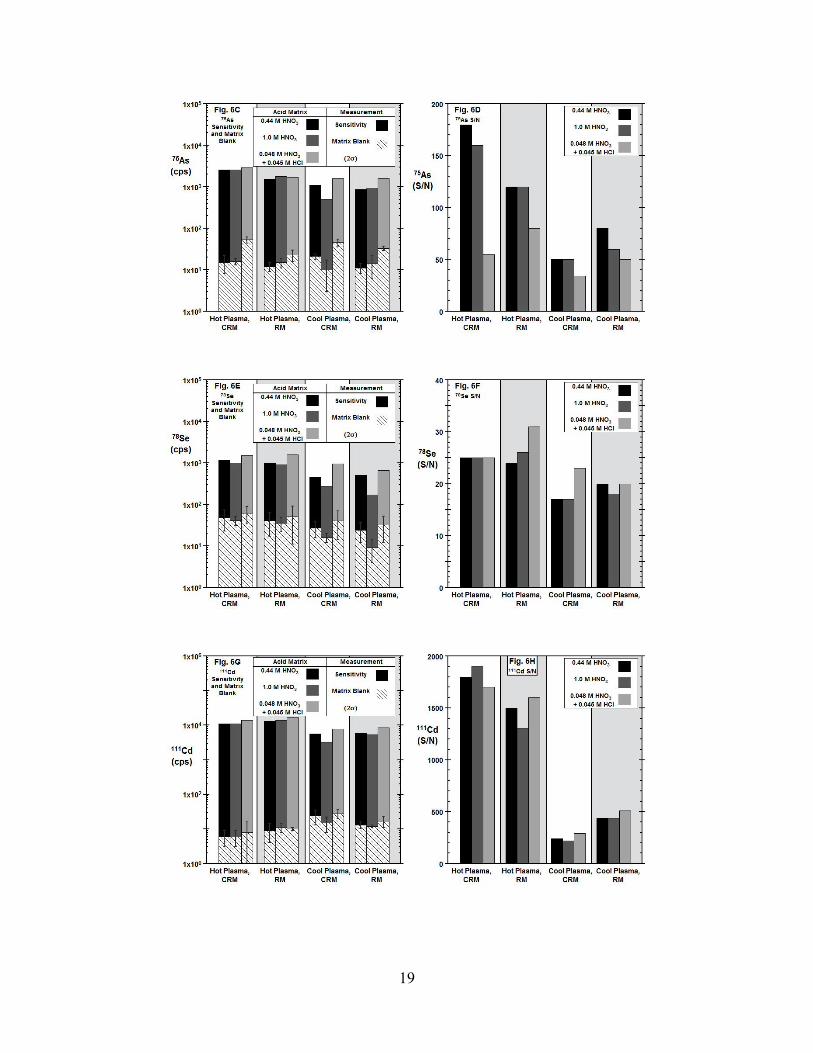
Figure 6. Comparison of sensitivities (cps/1 µg·L-1
) and matrix blanks (cps) for 56
Fe (6.A), 75
As
(6.C), 78
Se (6.E), and 111
Cd (6.G) in all operating conditions: hot and cool plasma, Reaction
Mode (RM, H2 = 4.7 mL/min) and Collision-and-Reaction Mode (CRM, He = 2.8 mL/min and
H2 = 2.0 mL/min). The black bars denote 0.44 M HNO3 matrix blank, gray bars: 1.0 M HNO3,
and light gray bars: mixed acid (0.048 M HNO3 + 0.045 M HCl)). The ratio of the sensitivities
and matrix blanks can be represented as signal-to-noise ratios (S/N) (6.B, 6.D, 6.F, 6.H). 56
Fe
achieves the best S/N under cool plasma conditions with RM. However, 75
As, 78
Se, and 111
Cd all
generally exhibited optimal S/N ratios under hot plasma with CRM. These heavy isotopes (> 65
amu) are generally not as efficiently ionized in cool plasma as compared to 56
Fe.
19
20
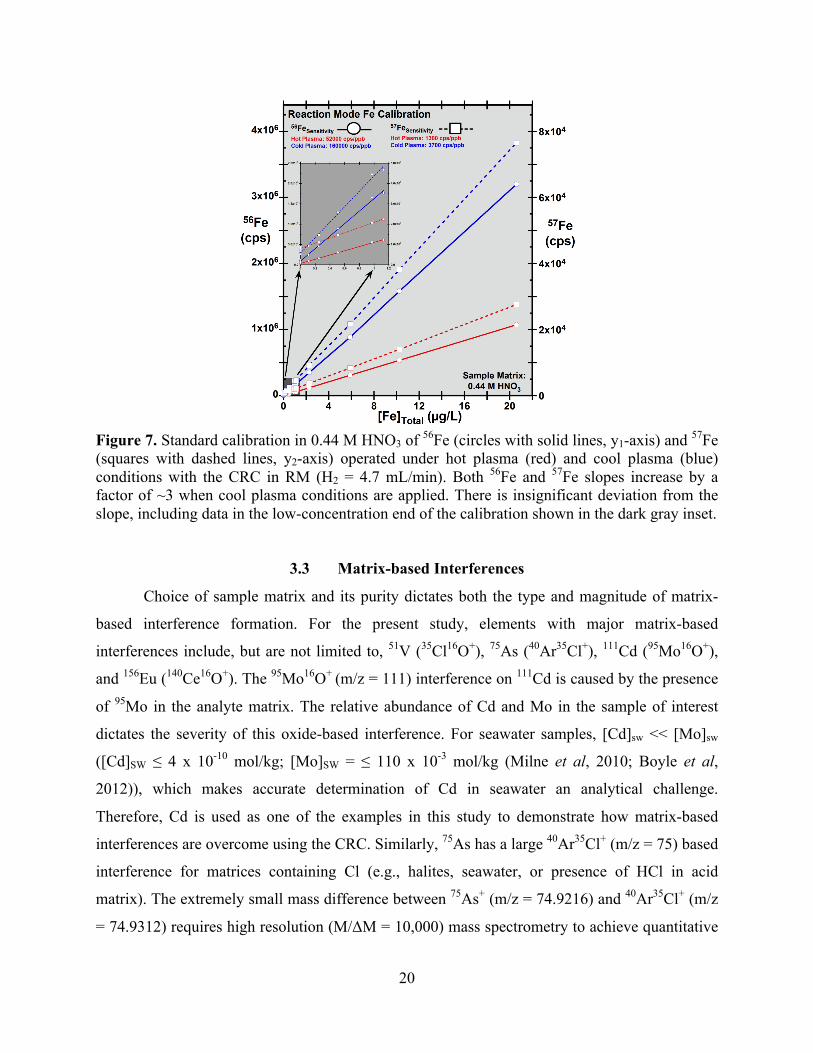
Figure 7. Standard calibration in 0.44 M HNO3 of
56Fe (circles with solid lines, y1-axis) and
57Fe
(squares with dashed lines, y2-axis) operated under hot plasma (red) and cool plasma (blue)
conditions with the CRC in RM (H2 = 4.7 mL/min). Both 56
Fe and 57
Fe slopes increase by a
factor of ~3 when cool plasma conditions are applied. There is insignificant deviation from the
slope, including data in the low-concentration end of the calibration shown in the dark gray inset.
3.3 Matrix-based Interferences
Choice of sample matrix and its purity dictates both the type and magnitude of matrix-
based interference formation. For the present study, elements with major matrix-based
interferences include, but are not limited to, 51
V (35
Cl16
O+),
75As (
40Ar
35Cl
+),
111Cd (
95Mo
16O
+),
and 156
Eu (140
Ce16
O+). The
95Mo
16O
+ (m/z = 111) interference on
111Cd is caused by the presence
of 95
Mo in the analyte matrix. The relative abundance of Cd and Mo in the sample of interest
dictates the severity of this oxide-based interference. For seawater samples, [Cd]sw << [Mo]sw
([Cd]SW ≤ 4 x 10⁻¹⁰
mol/kg; [Mo]SW = ≤ 110 x 10-3
mol/kg (Milne et al, 2010; Boyle et al,
2012)), which makes accurate determination of Cd in seawater an analytical challenge.
Therefore, Cd is used as one of the examples in this study to demonstrate how matrix-based
interferences are overcome using the CRC. Similarly, 75
As has a large 40
Ar35
Cl+ (m/z = 75) based
interference for matrices containing Cl (e.g., halites, seawater, or presence of HCl in acid
matrix). The extremely small mass difference between 75
As+ (m/z = 74.9216) and
40Ar
35Cl
+ (m/z
= 74.9312) requires high resolution (M/ΔM = 10,000) mass spectrometry to achieve quantitative

21
peak separation between the two ions. However, inefficient ionization of As in the plasma (high
IP-1 – 9.81 eV) coupled with usually low abundance in natural samples makes determination of
As by HR-ICP-MS a serious analytical challenge. The application of Octopole CRC quasi-
quantitatively eliminates the polyatomic interference caused by 95
Mo16
O+
and 40
Ar35
Cl+,
rendering accurate and precise analysis of 111
Cd+ and
75As
+ possible without significant loss in
sensitivity (Figure 8).
Figure 8. 75
As standard calibration in mixed acid (0.048 M HNO3 + 0.045 M HCl) operated
under hot plasma (red) and cool plasma (blue) conditions, with RM (H2 = 4.7 mL/min, circles
solid lines) and CRM (He = 2.8 mL/min and H2 = 2.0 mL/min, squares with dashed lines)
employed. Hot plasma with CRM achieves sensitivity that is greater than the other operating
conditions by nearly a factor of ~2. There is insignificant deviation from the slope, including
data in the low-concentration end of the calibration shown in the dark gray inset.
Using single element Mo standards at different concentrations, we performed a series of
95Mo calibrations under all instrumental conditions: hot plasma and cool plasma, with CRM and
RM (Figure 9). Under the different plasma & CRC modes and across the Mo concentration range
of 0.1 µg/L to 2.0 µg/L, the intensity on 111 amu (95
Mo16
O) never exceeded 8 ng/L, which is
comparable to the detection limit of 111
Cd (≤3 ng/L, Table 5A). The formation of 95
Mo16
O+ does
not increase with the concentration of Mo in solution. This lack of mass dependency of the

22
95Mo
16O
+ interference on
111Cd demonstrates the successful removal of matrix-based polyatomic
interferences by Octopole CRC. The maximum instrumental sensitivity for both Cd and Mo are
achieved in hot plasma conditions using CRM (Figure 9 and 10). However, the next best
sensitivity for both elements is achieved in cool plasma with CRM, indicating that the Octopole
CRC setting dictates the sensitivity on Mo and Cd more than the plasma settings (Figure 9 and
10). For Cd analyses, the advantage of CRM over RM is that excess H2 is minimized in CRM.
This reduces the loss of analyte sensitivity that can result from reactions between Mo (or Cd) and
H2.
Figure 9. 95
Mo standard calibration (circles) in 0.44 M HNO3 executed in hot plasma with CRM
(He = 3.0 mL/min and H2 = 2.0 mL/min), hot plasma with RM (H2 = 4.7 mL/min), cool plasma
with CRM (He = 2.8 mL/min and H2 = 2.0 mL/min), and cool plasma with RM (H2 =4.8
mL/min). Measurements of 111 amu (squares) show complete elimination of 95
Mo16
O+ by the
Octopole CRC. The intensity on 111 amu never exceeds 8 ng/L, which is comparable to the
detection limit of 111
Cd (≤3 ng/L, Table 4A). The best sensitivities on 95
Mo is achieved from hot
and cool plasma with CRM while both cool settings in RM achieve very poor sensitivities,
suggesting that the CRC operational mode dominates the sensitivity on Cd more than the plasma
setting.
23
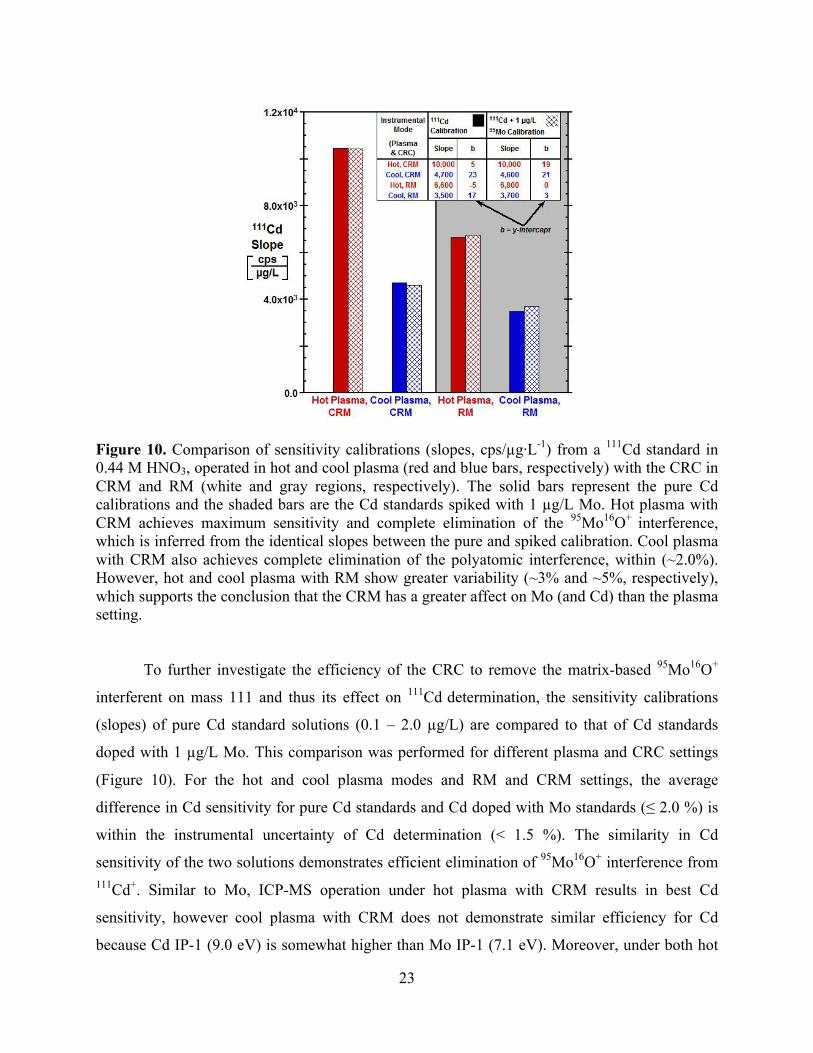
Figure 10. Comparison of sensitivity calibrations (slopes, cps/µg·L-1
) from a 111
Cd standard in
0.44 M HNO3, operated in hot and cool plasma (red and blue bars, respectively) with the CRC in
CRM and RM (white and gray regions, respectively). The solid bars represent the pure Cd
calibrations and the shaded bars are the Cd standards spiked with 1 µg/L Mo. Hot plasma with
CRM achieves maximum sensitivity and complete elimination of the 95
Mo16
O+
interference,
which is inferred from the identical slopes between the pure and spiked calibration. Cool plasma
with CRM also achieves complete elimination of the polyatomic interference, within (~2.0%).
However, hot and cool plasma with RM show greater variability (~3% and ~5%, respectively),
which supports the conclusion that the CRM has a greater affect on Mo (and Cd) than the plasma
setting.
To further investigate the efficiency of the CRC to remove the matrix-based 95
Mo16
O+
interferent on mass 111 and thus its effect on 111
Cd determination, the sensitivity calibrations
(slopes) of pure Cd standard solutions (0.1 – 2.0 µg/L) are compared to that of Cd standards
doped with 1 µg/L Mo. This comparison was performed for different plasma and CRC settings
(Figure 10). For the hot and cool plasma modes and RM and CRM settings, the average
difference in Cd sensitivity for pure Cd standards and Cd doped with Mo standards (≤ 2.0 %) is
within the instrumental uncertainty of Cd determination (< 1.5 %). The similarity in Cd
sensitivity of the two solutions demonstrates efficient elimination of 95
Mo16
O+ interference from
111Cd
+. Similar to Mo, ICP-MS operation under hot plasma with CRM results in best Cd
sensitivity, however cool plasma with CRM does not demonstrate similar efficiency for Cd
because Cd IP-1 (9.0 eV) is somewhat higher than Mo IP-1 (7.1 eV). Moreover, under both hot

24
and cool plasma conditions, greater Cd S/N is achieved in CRM over RM (Figure 10),
demonstrating that choice of the CRC operational mode is more important than selection of
plasma conditions.
3.4 Long-term Reproducibility
To assess the long-term reproducibility of the ICP-MS methods described in this work, an
external Standard Reference Material (NIST 1643e SRM) was analyzed over a period of 7
months (Figure 10) under all operational conditions and acid matrices. The NIST 1643e analyses
were performed at a 1:100 dilution of the original solution ([Fe] ≈ 1 µg/L and [Cd] ≈ 0.07 µ/L) to
match the analyte concentrations in actual samples. The results from the present study ([Fe]Average
= 99.6 ± 7.8 µg/L and [Cd]Average = 6.78 ± 0.83 µg/L; n = 26, ±2σ) are identical, within analytical
uncertainty of the instrument, to the certified values ([Fe]NIST-SRM = 98.1 ± 1.4 µg/L and [Cd]NIST-
SRM = 6.57 ± 0.07 µg/L) (Table 6).
Figure 11. SRM NIST 1643e (Standard Reference Material - trace elements in freshwater) Fe
and Cd concentration data collected over a period of 7 months. The SRM was analyzed at a
1:100 dilution in three different acid matrices (0.44 M HNO3, 1.0 M HNO3, or mixed acid (0.048
M HNO3 + 0.045 M HCl), which is not specified in this graph. Data was obtained under all
instrumental settings: hot plasma (red) and cool plasma (blue), with the CRC in RM (closed
symbols) and CRM (open symbols). The measured averages (black symbols, 2σ error bars) are
compared to the certified NIST 1643e values (green symbols, 2σ error bars).

25
Table 6. SRM NIST 1643e (Standard Reference Material- trace elements in freshwater) Fe and Cd concentration data collected over a period of 7
months (Figure 11). The SRM was analyzed at a 1:100 dilution in three different acid matrices (0.44 M HN03, 1.0 M HN0 3, or mixed acid (0.048 M
HN03 + 0.045 M HCl). The reported data includes operation of the Q-ICP-MS under four different instrumental settings: hot plasma and cool
plasma, and CRC operation in RM and CRM.
Date
J\llle 7th
J\llle 9th
J\llle 13th
J\llle 14th
July 1st
July 19th
July 20th
Sept. 9th
Oct. 14th
Oct. 16th
Oct. 17th
Dec. 15th
Dec. 16th
Dec. 18th
Jan. 16th
Average
Certified Value
Plasma CRC Mode Mode
Cool RM
Acid Matrix
1.0 M HN03
Mixed Acid
[Mg] ± 2cr [Fe] ± 2cr [Co]± 2cr [Ni] ± 2cr [As]± 2cr [Se] ± 2cr [Cd] ± 2cr [Sb] ± 2cr [Pb] ± 2cr
HセMエァ O lI@ HセMエァ O lI@ H セMエァ O l I@ H セMエ ァ O l I@ H セMエ ァ O l I@ HセMエァ O l I@ HセMエァOlI@ HセMエァ O l I@ HセMエァOlI@
8217
8018
n.a.
n.a.
n .a. n.a.
n.a. n.a.
Cool rRM 0.44 M HN0 3 8222
100.3
91.62
99.34
95.98
93.40
101.0
96.87
91.1 6
95.28
100.3
26.37
25.82
28.14
25.43
27.55
26.53
26.01
26.02
26.06
29.21
61.43
61.4 1
64.54
56.45
62.68
62.36
62.78
57.84
56.87
65.14
n.a.
11.18
13.00
12.36
8.52
10.28
12.06
8.22
10.26
13.42
8.54
6.57
6.27
7.21
5.91
7.00
6.54
6.59
6.13
6.37
7. 12
n.a. n.a.
Hot
Hot
Cool
Hot
Hot
Hot
Hot
Hot
Hot
Hot
Hot
Cool
Cool
1.0 M HN03 8768 n.a. n.a. n.a.
Mixed Acid 8343 n.a. n.a. n.a.
RM 0.44 M HN03 7800 n.a. n.a. n.a.
1.0 M HN03 8368 n.a. n.a. n.a.
Mixed Acid 7970 n.a. n.a. n.a.
CRM 0.44 M HN03 8 179 n.a. n .a. n.a.
RM
RM
RM
RM
RM
RM
RM
CRM
RM
RM
CRM
Mixed Acid 9180
1.0 M HN03 8179
0.44 M HN03 7892 ± 45.8
0.44 M HN03 7925 ± 266
0.44 M HN03 8270 ± 302
0.44 M HN03 7865 ± 50.6
0.44 M HN03 7977 ± 857
0.44 M HN03 7825 ± 463
Mixed Acid 8208
0.44 M HN03 8794
Mixed Acid 8040
Mixed Acid 7 439
96.72 26.28
103.0 ± 3.10 28.26 ± 0.68
104.7 ± 0.79 28.88 ± 1.0 I
102.1 ± 6.79 27.43 ± 1.55
101.2 ± 4.60 27.35 ± 0.1 6
102.1 ± 0.73 27.00 ± 0.40
101.0 ± 0.25 27.33 ± 0.31
99.93 28.09
104.8
95.97
98.97
27.52
26.30
25.02
n.a.
58.05 n.a.
63.81 n.a.
64.09 ± 0.18 54.33 ± 0.21
63.10 ± 0.26 52.85 ± 1.33
64.1 4 ± 5.65 58.34 ± 6.26
62.47±0.18 55.36 ± 4.10
62.83 ± 3.32 58.69 ± 0.04
64.08 58.93
66.27
60.93
57.13
54.79
n.a.
n.a.
9.92 6.21
13.90 ± 0.87 6.82 ± 0.22
13.63 ± 0.52 6.88 ± 0.26
12.63 ± 0.77 6.63 ± 0.26
n.a. 7.13 ± 0.04
n.a. 7.24 ± 0.44
n.a. 7.37 ± 0.70
n.a. 6.73
n.a.
n.a.
n.a.
6.37
6.77
7.24
n .a.
n .a.
n .a.
56.76 ± 6.03
58.56 ± 3.31
60.94 ± 0.18
60.46 ± 0.26
61.33 ± 0.05
60.91
59.25
59.30
53.83
n.a.
n.a.
n.a.
19.72 ± 0.52
20.44 ± 0.51
19.68 ± 0.52
19.71 ± 0.12
20.00 ± 0.59
19.83
19.61
20 02
20 .1 2
8 166 ± 773 99.60 ± 7.80 26.98 ± 2.27 61.83 ± 5.82 56.18 ± 4.87 11.28 ± 4.00 6.78 ± 0.83 59.04 ± 4.85 19.90 ± 0.53
8037 ± 83.3 98.10 ± 1.40 27.06 ± 0.28 62.4 1 ± 0.65 60.45 ± 0.63 11 .97 ± 0.12 6.57 ± 0.07 58.30 ± 0.60 19.63 ± 0.20
n
I
2
2
2
2
2
2
I

26
CHAPTER 4
CONCLUSIONS
We present an improved method for accurate and precise determination of trace metals in
natural samples via utilization of an Octopole Collision – Reaction Cell equipped Agilent®
7500cs Quadrupole-ICP-MS. This method focuses on elements with plasma- and/or matrix-
based mass interferences for ICP-MS analysis, such as 56
Fe, 75
As, 78
Se and 111
Cd. The present
method can be applied to samples in matrices with different composition (with or without HCl)
to measure multiple elements in a single analysis across a large dynamic concentration range.
Using the methods described in this study, the relatively low cost for Q-ICP-MS/CRC
instrumentation offers new analytical possibilities in chemical oceanography, environmental
geochemistry, forensic science, and many other fields where difficult sample matrices are
encountered.

27
REFERENCES
Boyd P. W., Watson A. J., Law C. S., Abraham E. R., Trull T., Murdoch R., Bakker D. C. E.,
Bowie A. R., Buesseler K. O., Chang H., Charette M., Croot P., Downing K., Frew R.,
Gall M., Hadfield M., Hall J., Harvey M., Jameson G., Laroche J., Liddicoat M., Ling R.,
Maldonado M. T., McKay R. M., Nodder S., Pickmere S., Pridmore R., Rintoul S., Safi
K., Sutton P., Strzepek R., Tanneberger K., Turner S., Waite A., & Zeldis J. (2000). A
mesoscale phytoplankton bloom in the polar Southern Ocean stimulated by iron
fertilization. Nature, 407, 695-702.
Boyle E. A., John S., Abouchami W., Adkins J. F., Echegoyen-Sanz Y., Ellwood M., Flegal A.
R., Fornace K., Gallon C., Galer S., Gault-Ringold M., Lacan F., Radic A., Rehkamper
M., Rouxel O., SohrinY., Stirling C., Thompson C., Vance D., Xue Z., & Zhao Y.
(2012). GEOTRACES IC1 (BATS) contamination-prone trace element isotopes Cd, Fe,
Pb, Zn, Cu, and Mo intercalibration. Limnol. Oceanogr.: Methods, 10, 653-665.
Brand L. E., Sunda W. G., & Guillard R. R. L. (1983). Limitation of marine phytoplankton
reproductive rates by zinc, manganese, and iron. Limnol. Oceanogr., 28 (6), 1182-1198.
Bruland K. W. (1983) Trace elements in seawater. In: Chemical Oceanography, J. P. Riley and
R. Chester (eds.), Academic Press, London, Vol. 8, 157-220.
Bruland K. W., Bertine K., Koide M., & Goldberg E. D. (1974). History of Metal Pollution in
Southern California Coastal Zone. Environmental Science Technology, 8 (5), 425-432.
Callender E. (2006). Heavy Metals in the Environment—Historical Trends. Treatise of
Geochemistry, Elsevier Pergamom, 9 (3), 67-105.
Coale K. H. & Bruland K. W. (1988). Copper complexation in the Northeast Pacific. Limnol.
Oceanogr., 33 (5), 1084-1101.
Cullen J. T., Lane T. W., Morel F. M. M., & Sherrell R. M. (1999). Modulation of cadmium
uptake in phytoplankton by seawater CO2 concentration. Nature, 402, 165-167.
Donat J. R. & Bruland K. W. (1995). Trace Elements in the oceans. In: Trace Elements in
Natural Waters, Steinnes and Salbu (eds.), CRC Press, Ch. 11, 247-281.
Feldmann I., Jakubowski N., & Stuewer D. (1999). Application of a hexapole collision and
reaction cell in ICP-MS. Park I: Instrumental aspects and operational optimization,
Fresenius J. Anal. Chem., 365, 415-421.
Gaboardi M. & Humayun M. (2009). Elemental fractionation during LA-ICP-MS analysis of
silicate glasses: implications for matrix-independent standardization. J. Anal. At.
Spectrom, 24, 118-1197.

28
Iglesias M., Gilon N., Poussel E., & Mermet J.-M. (2002). Evaluation of an ICP-
collision/reaction cell-MS system for the sensitive determination of spectrally interfered
and non-interefered elements using the same gas conditions. J. Anal. At. Spectrom., 17,
1240-1247.
Kotaś J. & Stasicka Z. (2000). Chromium occurrence in the environment and methods of its
speciation. Environmental Pollution, 107, 263-283.
Johnson K. S., Gordon R. M., & Coale K. H. (1997). What controls dissolved iron concentrations
in the world ocean? Marine Chemistry, 57, 137-161.
Jones C. J. & Murray J. W. (1984). Nickel, cadmium, and copper in the northeast Pacific off the
coast of Washington. Limnol. Oceanogr., 29 (4), 711-720.
Landing W. M., Guentzel J. L., Gill G. A., & Pollman C. D. (1998). Methods for measuring
mercury in rainfall and aerosols in Florida. Atmospheric Environment, 32 (5), 909-918.
Leonhard P., Pepelnik R., Prange A., Yamada N., & Yamada T. (2002). Analysis of diluted sea-
water at the ng L-1
level using an ICP-MS with an octopole reaction cell. J. Anal. At.
Spectrom., 17, 189-196.
McCurdy E. & Woods G. (2004). The application of collision/reaction cell inductively coupled
plasma mass spectrometry to multi-element analysis in variable sample matrices using He
as a non-reactive cell gas. J. Anal. At. Spectrom., 19, 607-615.
Mertz W. (1993). Chromium in Human Nutrition: A Review. The Journal of Nutrition, 123, 626-
633.
Milne A., Landing W., Bizimis M., & Morton P (2010). Determination of Mn, Fe, Co, Ni, Cu,
Zn, Cd, and Pb in seawater using high resolution magnetic sector inductively coupled
mass spectrometry (HR-ICP-MS). Anal. Chim. Acta., 665, 200-207.
Misra S. & Froelich P. N. (2009). Measurement of lithium isotope ratioes by quadrupole-ICP-
MS: application to seawater and natural carbonates. J. Anal. At. Spectrom., 24, 1524-
1533.
Peers G., Quesnel S.-A., & Price N. M. (2005). Copper requirements for iron acquisition and
growth of coastal and oceanic diatoms. Limnol. Oceanogr., 50 (4), 1149-1158.
Plant J. A., Kinniburgh D. G., Smedley P. L., Fordyce F. M., & Klinck B. A. (2006). Arsenic and
Selenium. Treatise of Geochemistry, Elsevier Pergamom, 9 (2), 17-66.
Saito M. A., Rocap G., & Moffett J. W. (2005). Production of cobalt binding ligands in a
Synechococcus feature at the Costa Rica upwelling dome. Limnol. Oceanogr., 50 (1), 279
- 290.

29
Shaked Y., Xu Y., Leblanc K., & Morel F. M. M. (2006). Zinc availability and alkaline
phosphatase activity in Emiliania huxleyi: Implications for Zn-P co-limitation in the
ocean. Limnol. Oceanogr, 51 (1), 299-309.
Tanner S. D., Baranov V. I., & Bandura D. R. (2002). Reaction cells and collision cells for ICP-
MS: a tutorial review. Spectrochimica Acta Part B, 57, 1367-1452.
Wells M. L. & Bruland K. W. (1998). An improved method for rapid preconcentration and
determination of bioactive trace metals in seawater using solid phase extraction and high
resolution inductively coupled plasma mass spectrometry. Marine Chemistry, 63, 145-
153.
Weyer S. & Schwieters J. B. (2003). High precision Fe isotope measurements with high mass
resolution MC-ICP-MS. International Journal of Mass Spectrometry, 226, 355-368.
30
BIOGRAPHICAL SKETCH
EDUCATION:
May 2013 M. Sc. in Chemical Oceanography
Florida State University, Tallahassee, FL
May 2010 B. Sc. in Chemistry
Florida State University, Tallahassee, FL
PRESENTATIONS:
Dial A., Ridgewell C., Kilgore B., Tremaine D.M., Misra, S. & Salters V.J.M. (2012).
Improved analytical method for determination of Mg isotopes: Application to seawater
and natural carbonates. V.M. Goldschmidt, Montreal, QC, Canada; Published in
Mineralogical Magazine, 76 (6), 1650 (2012).
POSTERS:
• Dial A., Misra S., Landing W. M. (2011). Accurate and precise determination of iron
concentrations by ORC equipped Quadrupole-ICP-MS: Application to low concentration
natural samples. ACS, FAME 2011, Palm Harbor, FL.
• Dial A., Misra S., Landing W. M. (2011). Accurate and precise determination of iron
concentrations by ORC equipped Quadrupole-ICP-MS: Application to low concentration
natural samples. Gordon Research Conference 2011, Andover, NH.
PROFESSIONAL MEMBERSHIP:
Geochemical Society