Embed Size (px)
Citation preview

Florida Labor Market and Economic Update
Workforce Estimating ConferenceLabor Market Statistics Center
September 7, 2012

Labor Force ConditionsJuly 2012, Seasonally Adjusted
Source: U.S. Department of Labor, Bureau of Labor Statistics, Local Area Unemployment Statistics Program in cooperation with the Florida Department of Economic Opportunity, Labor Market Statistics Center, released August 17, 2012.
The current state unemployment rate is down from the high rates reported in early 2010 (11.4 percent)
The unemployment rate in the state has been higher than the nation since April 2008
2
Area Labor Force Employment UnemploymentUnemployment
Rate
Year Ago Unemployment
Rate
Florida 9,269,000 8,453,000 816,000 8.8 10.6
United States 155,013,000 142,220,000 12,794,000 8.3 9.1

Unemployment Rates, Florida and the United StatesJanuary 1974 – July 2012, Seasonally Adjusted
Source: U.S. Department of Labor, Bureau of Labor Statistics, Local Area Unemployment Statistics Program in cooperation with the Florida Department of Economic Opportunity, Labor Market Statistics Center, released August 17, 2012.
3
0.0
2.0
4.0
6.0
8.0
10.0
12.0
Ja
n-7
4
Ja
n-7
5
Ja
n-7
6
Ja
n-7
7
Ja
n-7
8
Ja
n-7
9
Ja
n-8
0
Ja
n-8
1
Ja
n-8
2
Ja
n-8
3
Ja
n-8
4
Ja
n-8
5
Ja
n-8
6
Ja
n-8
7
Ja
n-8
8
Ja
n-8
9
Ja
n-9
0
Ja
n-9
1
Ja
n-9
2
Ja
n-9
3
Ja
n-9
4
Ja
n-9
5
Ja
n-9
6
Ja
n-9
7
Ja
n-9
8
Ja
n-9
9
Ja
n-0
0
Ja
n-0
1
Ja
n-0
2
Ja
n-0
3
Ja
n-0
4
Ja
n-0
5
Ja
n-0
6
Ja
n-0
7
Ja
n-0
8
Ja
n-0
9
Ja
n-1
0
Ja
n-11
Ja
n-1
2
Recession
Florida
United States
• 1973 oil embargo• Multi-family housing market
Peak unemployment rate 11.9 percent, May 1975
• 1979 energy crisis• Tight monetary policy• Savings and loan collapse
• Defense spending declines• End of the Gulf War• Airlines deregulation
• IT bubble collapse• 9/11 events• Manufacturing outsourcing
• Oil prices• Housing bubble collapse• Financial crisis
Peak unemployment rate 11.4 percent, January-February 2010
Unemployment Rates in the Ten Most Populous StatesRanked by Unemployment Rate, Seasonally Adjusted
Source: U.S. Department of Labor, Bureau of Labor Statistics, Local Area Unemployment Statistics Program in cooperation with the Florida Department of Economic Opportunity, Labor Market Statistics Center, released August 17, 2012.
State
July 2012(P)Unemployment Rate
(%)
July 2011 Unemployment Rate
(%)
California 10.7 11.9 -1.2North Carolina 9.6 10.7 -1.1Georgia 9.3 10.0 -0.7New York 9.1 8.2 0.9Michigan 9.0 10.6 -1.6Illinois 8.9 10.1 -1.2Florida 8.8 10.6 -1.8Pennsylvania 7.9 8.1 -0.2Ohio 7.2 8.9 -1.7Texas 7.2 8.1 -0.9
Change
4

Nonagricultural EmploymentSeasonally Adjusted
Florida’s jobs grew in July on an annual basis for the 24th consecutive month
Florida has lost 743,400 jobs during the current downturn (March 2007 to July 2012)
Seasonally Adjusted July 2012 July 2011 Change Percent Change
Florida 7,331,400 7,261,500 69,900 1.0%
United States 133,245,000 131,407,000 1,838,000 1.4%
5
Source: U.S. Department of Labor, Bureau of Labor Statistics, Current Employment Statistics Program, released August 17, 2012.Prepared by: Florida Department of Economic Opportunity, Labor Market Statistics Center.

Source: U.S. Department of Labor, Bureau of Labor Statistics, Current Employment Statistics Program, released August 17, 2012.Prepared by: Florida Department of Economic Opportunity, Labor Market Statistics Center.
6
Florida Nonagricultural EmploymentSeasonally Adjusted, 1974-Current
2,000,000
2,500,000
3,000,000
3,500,000
4,000,000
4,500,000
5,000,000
5,500,000
6,000,000
6,500,000
7,000,000
7,500,000
8,000,000
8,500,000
Jan-
74
Jan-
75
Jan-
76
Jan-
77
Jan-
78
Jan-
79
Jan-
80
Jan-
81
Jan-
82
Jan-
83
Jan-
84
Jan-
85
Jan-
86
Jan-
87
Jan-
88
Jan-
89
Jan-
90
Jan-
91
Jan-
92
Jan-
93
Jan-
94
Jan-
95
Jan-
96
Jan-
97
Jan-
98
Jan-
99
Jan-
00
Jan-
01
Jan-
02
Jan-
03
Jan-
04
Jan-
05
Jan-
06
Jan-
07
Jan-
08
Jan-
09
Jan-
10
Jan-
11
Jan-
12
FloridaTotal Nonagricultural Employment, Seasonally Adjusted
January 1974 - Present
Recession Total Nonagricultural Employment, SA

Nonagricultural Employment by IndustryFlorida, July 2012 (Seasonally Adjusted)
Construction4.2%
Manufacturing4.3%
Trade, Transportation, and Utilities
20.7%
Information1.8%
Financial Activities6.6%
Professional and Business Services
14.9%
Education and Health Services15.4% Leisure and
Hospitality13.2%
Other Services4.1%
Total Government14.8%
7
Source: U.S. Department of Labor, Bureau of Labor Statistics, Current Employment Statistics Program, released August 17, 2012.Prepared by: Florida Department of Economic Opportunity, Labor Market Statistics Center.

Professional and Business Services Gained the Most Jobs Over the YearFlorida, July 2011 – July 2012, Seasonally Adjusted
8
Source: U.S. Department of Labor, Bureau of Labor Statistics, Current Employment Statistics Program, released August 17, 2012.Prepared by: Florida Department of Economic Opportunity, Labor Market Statistics Center.
41,600
19,500
17,400
14,900
5,700
1,300
1,100
-4,100
-10,700
-16,900
-20,000 -10,000 0 10,000 20,000 30,000 40,000 50,000
Professional and Business Services
Trade, Transportation, and Utilities
Education and Health Services
Leisure and Hospitality
Financial Activities
Information
Manufacturing
Other Services
Government
Construction
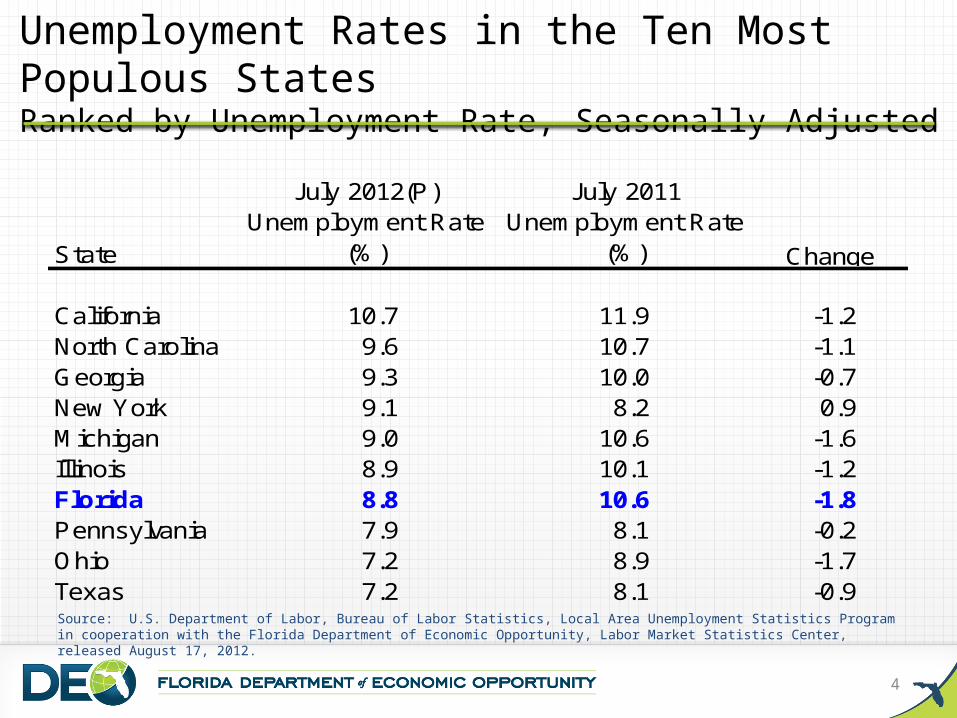
Employment in the Ten Most Populous StatesRanked by Over-the-Year Level Change, Seasonally Adjusted
JulyState 2012P Percent Change Level ChangeCalifornia 14,358,600 2.6% 365,100Texas 10,804,000 2.1% 222,500New York 8,808,500 1.3% 113,300Ohio 5,187,100 2.0% 100,300Florida 7,331,400 1.0% 69,900Michigan 4,004,300 1.5% 59,800Georgia 3,933,800 1.3% 50,800North Carolina 3,956,700 0.9% 36,800Illinois 5,686,900 0.5% 28,600Pennsylvania 5,709,200 0.4% 20,000
July 2011 - July 2012P
9
Source: U.S. Department of Labor, Bureau of Labor Statistics, Current Employment Statistics Program, released August 17, 2012.Prepared by: Florida Department of Economic Opportunity, Labor Market Statistics Center.
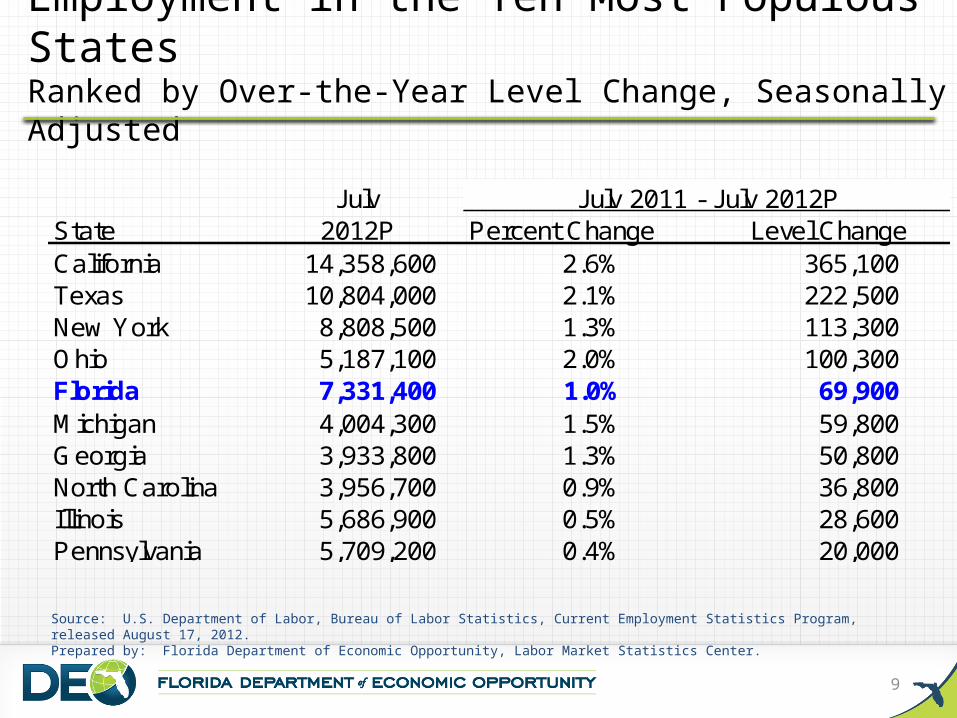
Wages by IndustryFlorida, 2011
Source: Florida Department of Economic Opportunity, Labor Market Statistics Center, Quarterly Census of Employment and Wages Program. Released June 2012.
Industry Average Annual
Wages Total, All Industries $42,311
Information $64,542Financial Activities $59,482Manufacturing $52,373Professional and Business Services $50,822Government $47,823Education and Health Services $44,454Construction $40,873Trade, Transportation, and Utilities $37,751Other Services $29,807Natural Resources and Mining $25,151Leisure and Hospitality $21,824
10

Average Annual Wage
11
1991
1992
1993
1994
1995
1996
1997
1998
1999
2000
2001
2002
2003
2004
2005
2006
2007
2008
2009
2010
2011
$20,000
$25,000
$30,000
$35,000
$40,000
$45,000
$50,000
$42,311
$48,040
Florida
US
Source: Florida Department of Economic Opportunity, Labor Market Statistics Center, Quarterly Census of Employment and Wages Program, in cooperation with the U.S. Department of Labor, Bureau of Labor Statistics, 2011 preliminary.

Real-Time LMI Help-Wanted OnLineOccupations In Demand
12
Note: The * denotes occupations on the new 2013-14 statewide demand occupation list.Source: The Conference Board, Help Wanted OnLine.Prepared by: The Florida Department of Economic Opportunity, Labor Market Statistics Center.
Top Advertised Occupations for Florida-August 2012Online Ads
August 2012Online Ads
August 2011Florida Total Ads 264,253 230,949
Registered Nurses * 17,411 13,053 Retail Salespersons 9,142 7,846 First-Line Supervisors/Managers of Retail Sales Workers * 7,983 6,769 Customer Service Representatives 6,602 5,707 Truck Drivers, Heavy and Tractor-Trailer * 5,078 4,162 First-Line Supervisors/Managers of Food Preparation and Serving Workers * 4,597 4,091 Web Developers 4,396 3,895 Sales Reps, Whlse & Manufacturing, Except Technical and Scientific Products * 4,342 4,325 Computer Systems Analysts 4,068 4,090 Occupational Therapists 3,930 3,708 Executive Secretaries and Administrative Assistants * 3,871 3,459 Physical Therapists 3,743 4,472 Medical and Health Services Managers 3,498 3,105 Telemarketers 3,434 2,840 First-Line Supervisors/Managers of Office and Administrative Support Workers * 3,308 2,874 Insurance Sales Agents * 3,193 2,798 Computer Support Specialists 3,153 2,919 Sales Agents, Financial Services 3,093 2,588 Accountants 3,074 2,628 Sales Representatives, Services, All Other 3,048 2,597

Real-Time LMI Help-Wanted OnLineOccupations In Demand
13
Note: The * denotes occupations on the new 2013-14 statewide demand occupation list.Source: The Conference Board, Help Wanted OnLine.Prepared by: The Florida Department of Economic Opportunity, Labor Market Statistics Center.
Top Advertised Occupations Requiring Post-Secondary and Associate Degrees
Online AdsAugust 2012
Online AdsAugust 2011
Florida Total Ads 264,253 230,949
Registered Nurses * 17,411 13,053 First-Line Supervisors/Managers of Retail Sales Workers * 7,983 6,769 Customer Service Representatives 6,602 5,707 Truck Drivers, Heavy and Tractor-Trailer * 5,078 4,162 First-Line Supervisors/Managers of Food Prep & Serving Workers * 4,597 4,091 Web Developers 4,396 3,895 Sales Reps, Wholesale & Manufacturing, Except Technical & Scientific Products * 4,342 4,325 Computer Systems Analysts 4,068 4,090 Executive Secretaries and Administrative Assistants * 3,871 3,459 First-Line Supervisors/Managers of Office and Administrative Support Workers * 3,308 2,874 Insurance Sales Agents * 3,193 2,798 Computer Support Specialists 3,153 2,919 Sales Reps, Wholesale & Manufacturing, Technical & Scientific Products * 2,559 2,319 Maintenance and Repair Workers, General 2,426 1,870 Network and Computer Systems Administrators 2,293 2,092 Bookkeeping, Accounting, and Auditing Clerks * 2,297 1,785 Computer Software Engineers, Applications 2,215 1,844 First-Line Supervisors/Managers of Non-Retail Sales Workers * 2,187 1,696 Medical Secretaries * 2,014 1,822 General and Operations Managers * 1,920 1,597

Real-Time LMI Help-Wanted OnLineOccupations In Demand
14
Note: The * denotes occupations on the new 2013-14 statewide demand occupation list.Source: The Conference Board, Help Wanted OnLine.Prepared by: The Florida Department of Economic Opportunity, Labor Market Statistics Center.
Top Advertised Occupations Requiring a Bachelor's Degree Online Ads
August 2012Online Ads
August 2011Florida Total Ads 264,253 230,949
Occupational Therapists 3,945 3,708Medical and Health Services Managers * 3,510 3,105Sales Agents, Financial Services * 3,101 2,588Accountants * 3,088 2,629Sales Managers * 2,568 2,245Marketing Managers * 2,305 1,965Financial Managers, Branch or Department * 1,817 1,567Management Analysts * 1,437 1,100Industrial Engineers * 1,313 1,338Public Relations Specialists * 1,202 861Market Research Analysts 1,153 908Human Resources Managers 1,040 716Physician Assistants * 1,016 657Training and Development Specialists 993 796Computer and Information Systems Managers * 919 829Personal Financial Advisors * 897 462Auditors * 798 768Financial Analysts * 714 698Tutors 659 491Mechanical Engineers * 631 679

Real-Time LMI Help-Wanted OnLineOccupations In Demand
15
Note: The * denotes occupations on the new 2013-14 statewide demand occupation list.Source: The Conference Board, Help Wanted OnLine.Prepared by: The Florida Department of Economic Opportunity, Labor Market Statistics Center.
Top Advertised Occupations Requiring a Master's Degree and AboveOnline Ads
August 2012Online Ads
August 2011Florida Total Ads 264,253 230,949
Physical Therapists * 3,776 4,475Speech-Language Pathologists * 1,979 2,062Lawyers * 844 688Family and General Practitioners * 749 963Nurse Practitioners 664 241Pharmacists * 643 833Educational, Vocational, and School Counselors 567 587Mental Health and Substance Abuse Social Workers 557 435Physicians and Surgeons, All Other 487 569Internists, General * 467 624Surgeons * 456 454Operations Research Analysts 402 416Medical Scientists, Except Epidemiologists * 393 323Dentists, General * 315 161Child, Family, and School Social Workers 234 277Health Specialties Teachers, Postsecondary * 204 198Psychiatrists 184 196Art, Drama, and Music Teachers, Postsecondary * 177 173Hospitalists 176 283Medical and Public Health Social Workers 172 186

16
Real-Time LMIHelp Wanted OnLine™
150,000
170,000
190,000
210,000
230,000
250,000
270,000
290,000
0
200,000
400,000
600,000
800,000
1,000,000
1,200,000
Online
ads
Unemployment
Labor Supply vs. Labor Demand
Unemployment (supply)
HWOL Ads (demand)
SOURCE: The Conference Board, Help Wanted OnLine data series.

17
Real-Time LMIHelp Wanted OnLine™
150000
170000
190000
210000
230000
250000
270000
6,700,000
6,900,000
7,100,000
7,300,000
7,500,000
7,700,000
7,900,000
8,100,000
Online
Ads
Employment
Employment vs. Labor Demand
Employment
Online Ads (demand)
SOURCE: The Conference Board, Help Wanted OnLine data series.

Targeted Industry Clusters
CleantechLife SciencesInfotechAviation and AerospaceLogistics and DistributionHomeland Security/DefenseFinancial/Professional Services
– Strategic Areas of Emphasis•Manufacturing•Corporate Headquarters•Emerging Technologies
18

Unemployment Rate(Percent)
Median Earnings (Dollars)
Master’s degree
Bachelor’s degree
Associate degree
Some college, no degree
14.1
9.4
8.7
6.8
4.9
3.6
2.4
2.5
$23,452
$33,176
$37,388
$39,936
$54,756
$65,676
$86,580
$80,652
High-school graduate
Some high-school, no diploma
Professional degree
Doctoral degree
Notes: Unemployment and earnings for workers 25 and older; earnings for full-time wage and salary workers. 2011 Weekly Median Earnings (multiplied by 52 weeks).
Source: Bureau of Labor Statistics, Current Population Survey. March 2012.
Education and Training pay …2011 Annual Average
19

FloridaDepartment of Economic Opportunity
Labor Market Statistics Center
Caldwell BuildingMSC G-020
107 E. Madison StreetTallahassee, Florida 32399-4111
Phone (850) 245-7257
Rebecca [email protected]
www.floridajobs.orgfreida.labormarketinfo.com
www.floridawages.comwww.whatpeopleareasking.com
20