Embed Size (px)
Citation preview

Slide 1
Chapter 4. Estimating and Reducing Labor Costs
Slide 2
Subway – Firm Level Information
Started as Pete’s Super Submarines in Connecticut in 1965
Now, largest sandwich chain with 34,000+ stores in 98 countries
Estimated revenue: $12 Billion (compared to McDonald’s at $23 Billion)
Franchise model – each restaurant is independently owned and operated
Goal: “to become the number one Quick Service Restaurant in the World”
Average revenue per store: $445k (compared to $2.3M at McDonald’s)
Slide 3
Subway – The Franchisee’s Perspective
Relatively inexpensive to open a new store:Start-up costs for a restaurant are $100k to $200kNo cooking, no grills, and no fryolators*Potentially very small stores (as little as 600sqft is possible)Compares to about $1 Million to open a McDonald’s
Franchise model8 percent of revenue as royalty fee 4.5 percent of revenue as a marketing feeInitial franchise fee of $15k
Detailed training and instructions provided by franchiser (Doctor’s Associates)Two week training courseDetailed operations manual
* A kitchen appliance used for deep-frying.

Slide 4
Subway – Assembly Line for Sandwiches
What is the capacity of this line?
What are the costs of direct labor?
What is the labor content?
How would you run this process assuminga demand of 180 sandwiches per hour?

Slide 5
Source of pictures: www.bbc.co.ukwww2.isye.gatech.eduwww.travelpod.com
Job Shop
Batch Process
Worker-paced line
Machine-paced line
Continuous process
Low Volume(unique)
Medium Volume(high variety)
High Volume(lower variety)
Very high volume(standardized)
Utilization of fixed capitalgenerally too low
Unit variable costsgenerally too high
Examples from History:· In the matrix above, history has forced all industries to go down the diagonal· Examples: Eye Surgery, vehicle production, financial services
The Product Process Matrix and the Industrialization of Work(Figure 2.13)

Slide 6
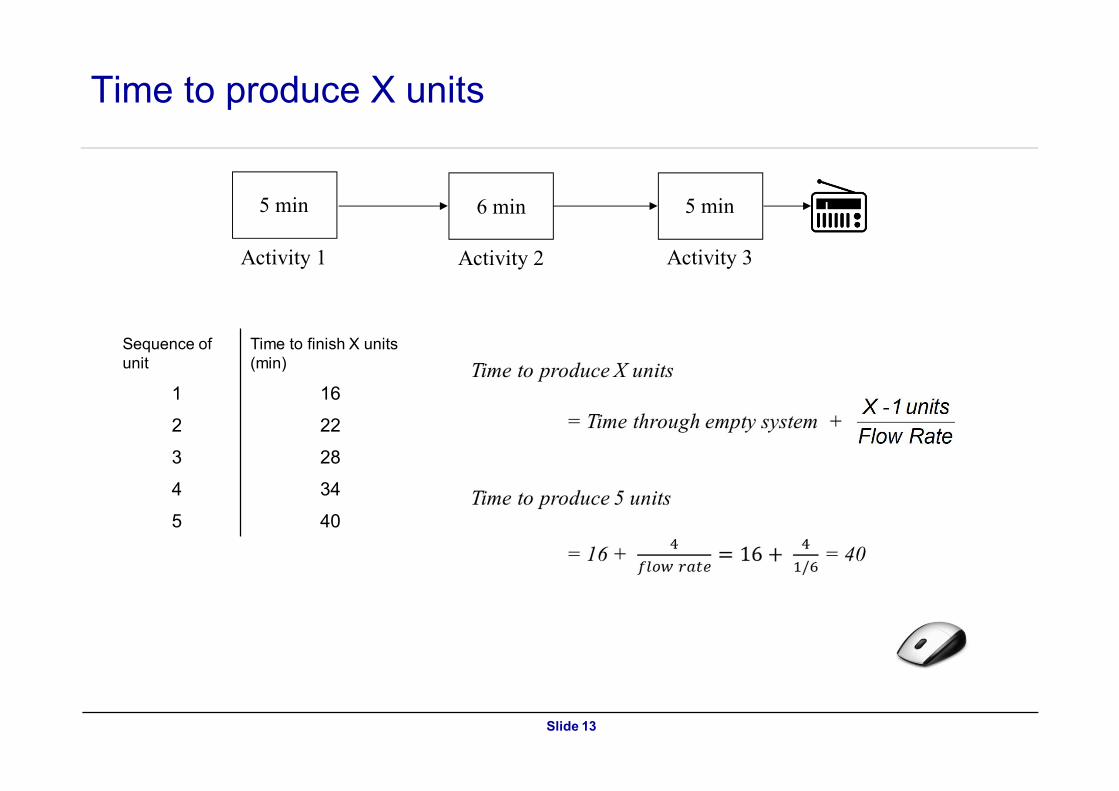
How Long Does it Take to Produce X units? (R=flow rate = 1/cycle time or takt time)
• Time to Produce X units = X/R if system has a “full pipeline (WIP)”
• Time to produce X units = Time through an empty system +
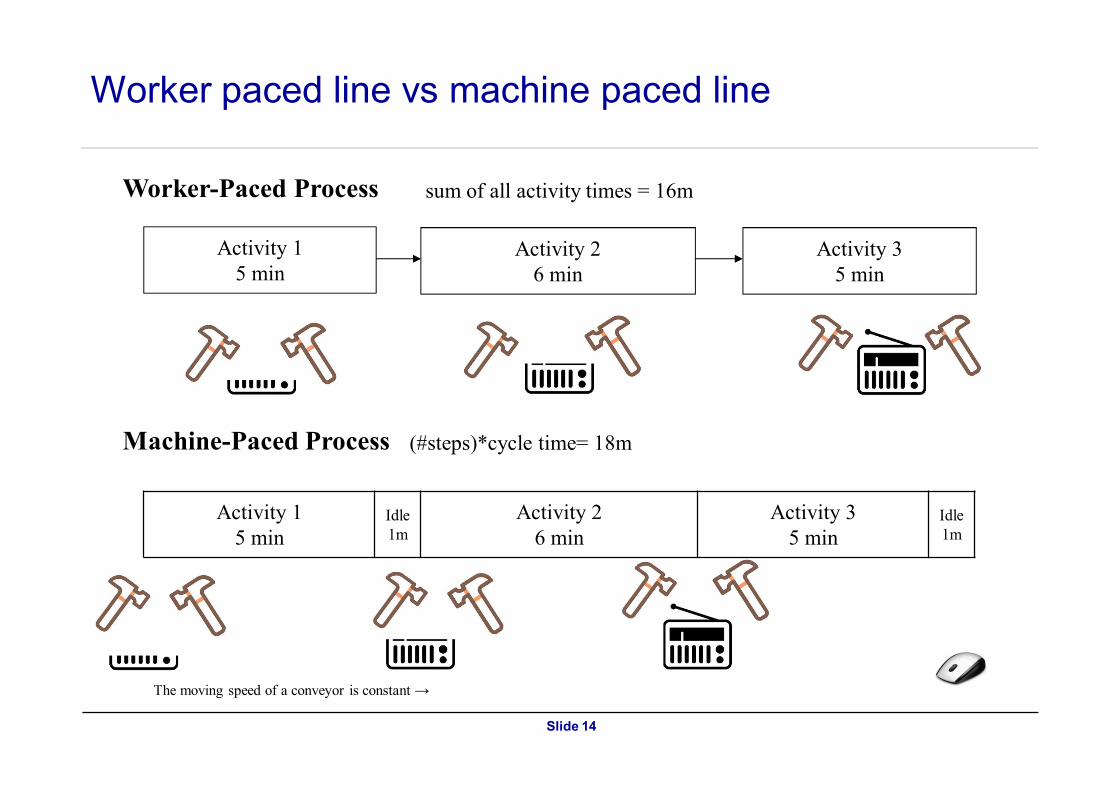
- worker-paced line: Time through an empty system is the sum of all activity times- machine-paced line: Time through an empty system =(#steps) * cycle time
RateFlow
units1-X
Machine Paced Process and Worker Paced Process:How Long Does it Take to Produce X units?
Machine-Paced Process
Worker-Paced Process
No fundamental difference in productivity (except potential savings in handling time)
Machine paced process forces a common takt / eliminates inventory pile-up
Source of pictures: www.bbc.co.ukwww2.isye.gatech.eduwww.travelpod.com

Slide 7
How Long Does it Take to Produce X units with a continuous-flow process?
• Time to produce X units = Time through an empty system +
Machine Paced Process and Worker Paced Process:How Long Does it Take to Produce X units?
Slide 8
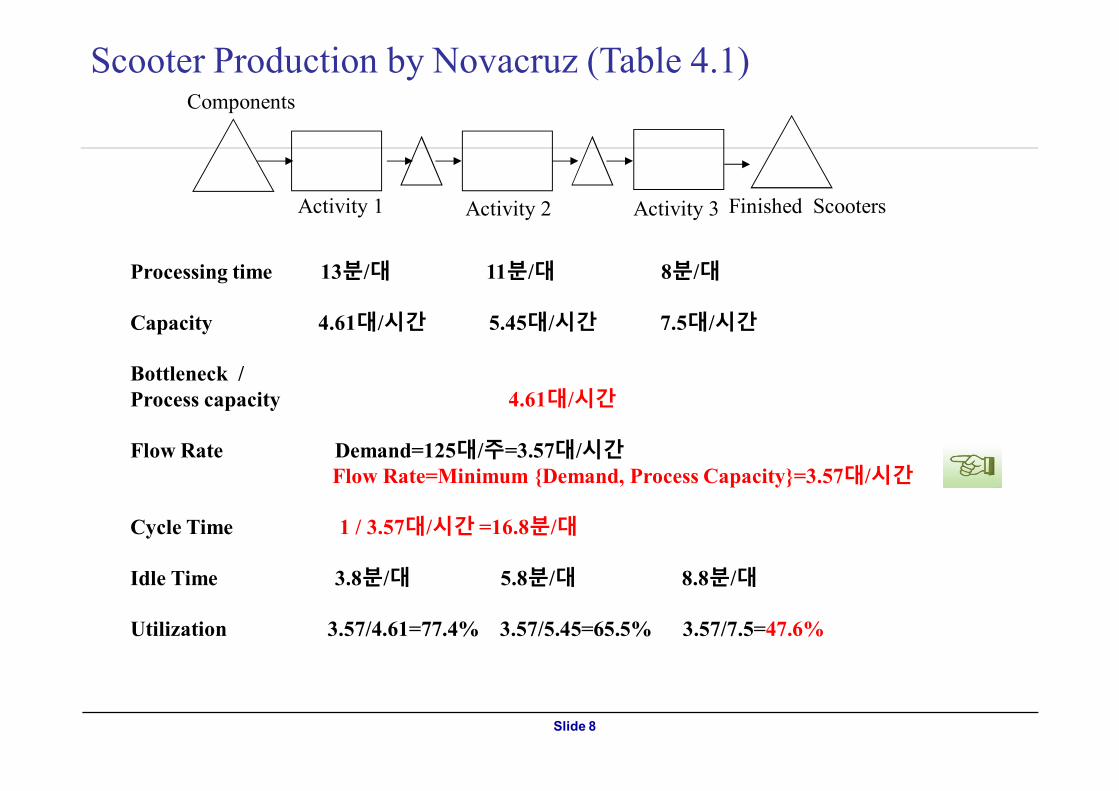
Scooter Production by Novacruz (Table 4.1)Components
Activity 1 Activity 2 Activity 3 Finished Scooters
Processing time 13분/대 11분/대 8분/대
Capacity 4.61대/시간 5.45대/시간 7.5대/시간
Bottleneck / Process capacity 4.61대/시간
Flow Rate Demand=125대/주=3.57대/시간Flow Rate=Minimum {Demand, Process Capacity}=3.57대/시간
Cycle Time 1 / 3.57대/시간 =16.8분/대
Idle Time 3.8분/대 5.8분/대 8.8분/대
Utilization 3.57/4.61=77.4% 3.57/5.45=65.5% 3.57/7.5=47.6%
Slide 9
a1
Act
ivit
y T
ime
a2
a3
a4
1 2 3 4
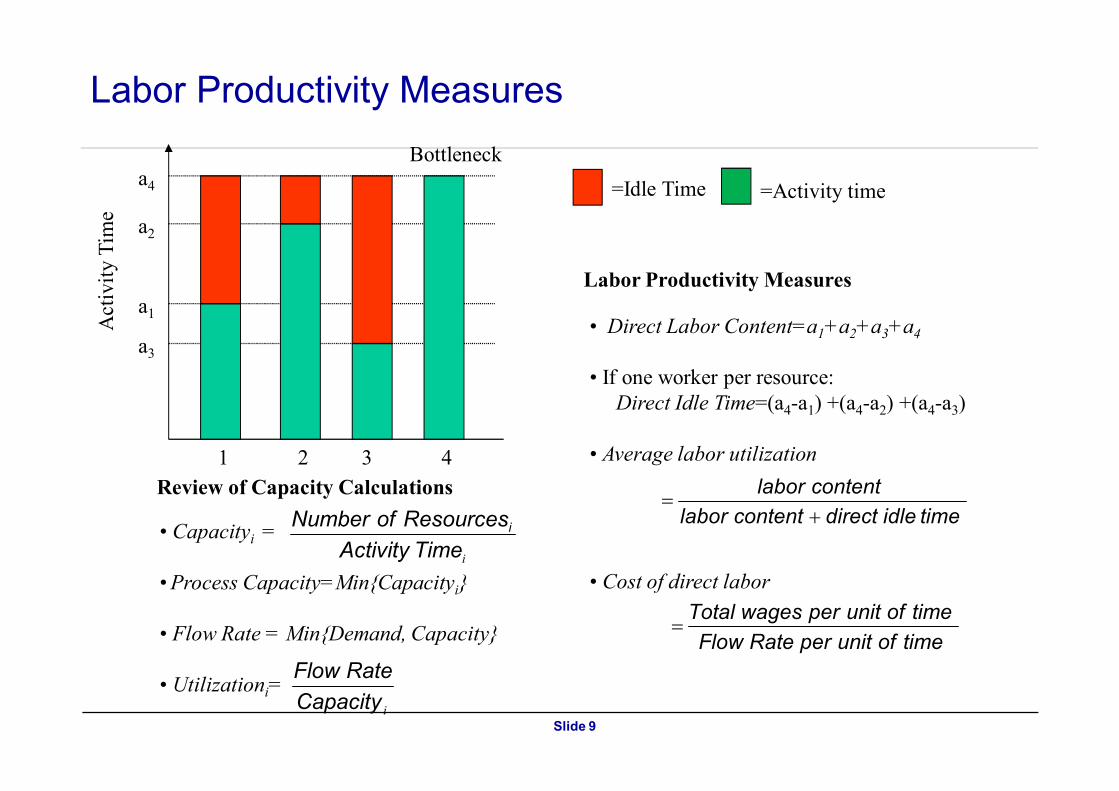
Bottleneck
=Idle Time
• Capacityi =
• Process Capacity=Min{Capacityi}
• Flow Rate = Min{Demand, Capacity}
• Utilizationi=
Review of Capacity Calculations
iCapacity
RateFlow
iTimeActivity
ResourcesofNumber itimeidledirectcontentlabor
contentlabor
+=
timeofunitperRateFlow
timeofunitperwages Total=
• Direct Labor Content=a1+a2+a3+a4
• If one worker per resource:Direct Idle Time=(a4-a1) +(a4-a2) +(a4-a3)
• Average labor utilization
• Cost of direct labor
Labor Productivity Measures
Labor Productivity Measures
=Activity time

Slide 10
Line Balancing and Staffing to Demand
43
30
Takt43
Time
1 2 3
Operator
Time
Operator
19 2116
33
27
1 2 3 4 5
43 s
econ
ds43
sec
onds
30 s
econ
ds
116
sec
ond
s
5
4
3
1
2
3
2
1
Labor content: 116 seconds / unit
Demand: 670 units per day
Work 8h shifts
8h=3600*8sec=28,800 sec/shift
Takt: 28,800sec / 670units=43 sec/unit
Target manpower== 2.7 ⇒ round up
• With waste in the current process, we can either increase capacity or reduce the number of operators• Better to leave all idle time concentrated on the last operator as opposed to spreading it equally• Staffing to demand: start with the takt time and design the process from there
116 sec/unit43 sec/unit
Toyota ⇒Multi-function Worker ⇒ Flexible Cycle Time
Slide 11
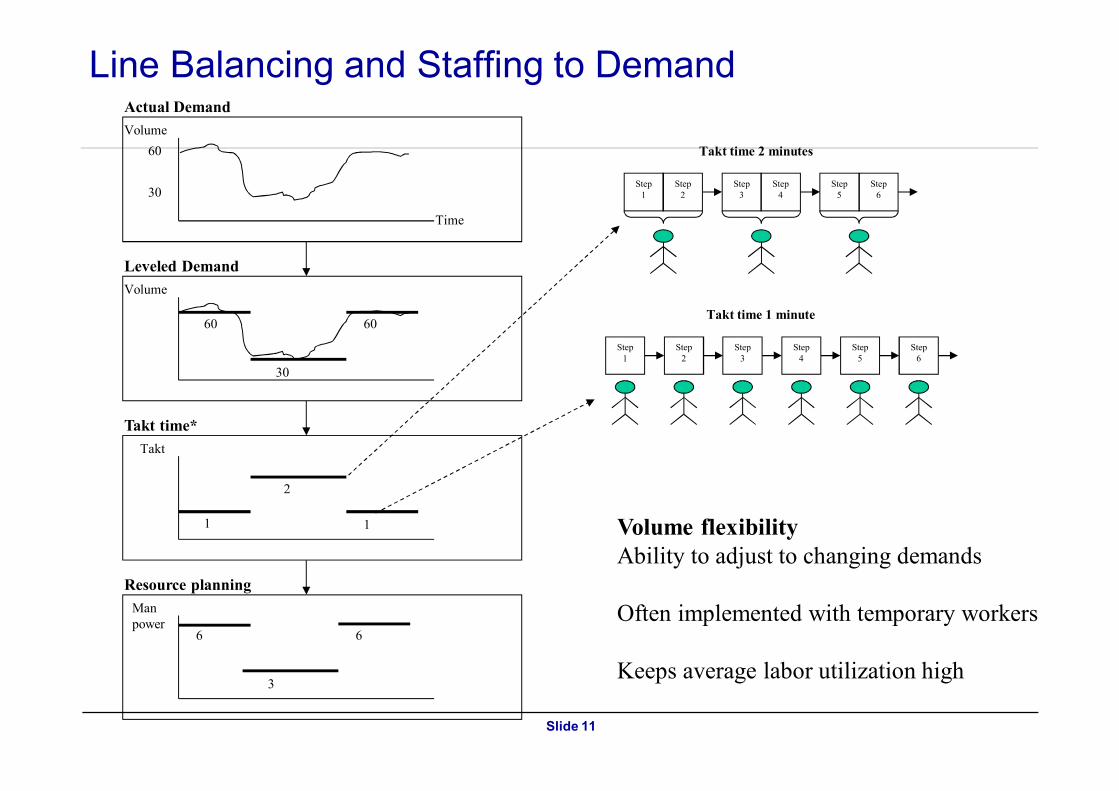
Line Balancing and Staffing to DemandActual Demand
Time
Volume
60
30
Leveled Demand
Volume
Takt time*
Takt
Resource planning
Manpower
60 60
30
1 1
2
6 6
3
Takt time 1 minute
Step1
Step2
Step3
Step4
Step5
Step6
Takt time 2 minutes
Step1
Step2
Step3
Step4
Step5
Step6
Volume flexibilityAbility to adjust to changing demands
Often implemented with temporary workers
Keeps average labor utilization high

Slide 12
Line Balancing and Labor Productivity: Summary
Labor Productivity is key for cost and for revenue reasons
Work has become increasingly standardized (process driven)
Improve productivity by:
Staffing to demand (increases utilization, avoids lost demand)Balancing the line (increases utilization, frees up capacity)Standardization of work / careful design
⇒ Reducing labor content⇒ Lower skilled labor (lower wages)⇒ Enables replication (growth / flexibility)
Toyota ⇒Multi-function Worker ⇒ Flexible Cycle Time
Slide 13
Time to produce X units
Activity 1 Activity 2 Activity 3
5 min 6 min 5 min
Sequence of unit
Time to finish X units(min)
1 16
2 22
3 28
4 34
5 40
RateFlow
units1-X
Slide 14
Worker paced line vs machine paced line
Worker-Paced Process
Machine-Paced Process
Activity 15 min
Activity 26 min
Activity 35 min
sum of all activity times = 16m
(#steps)*cycle time= 18m
Activity 15 min
Idle1m
Activity 26 min
Activity 35 min
Idle1m
The moving speed of a conveyor is constant →
Slide 15
timeofunit per RateFlow
timeofunit per wagesTotal=
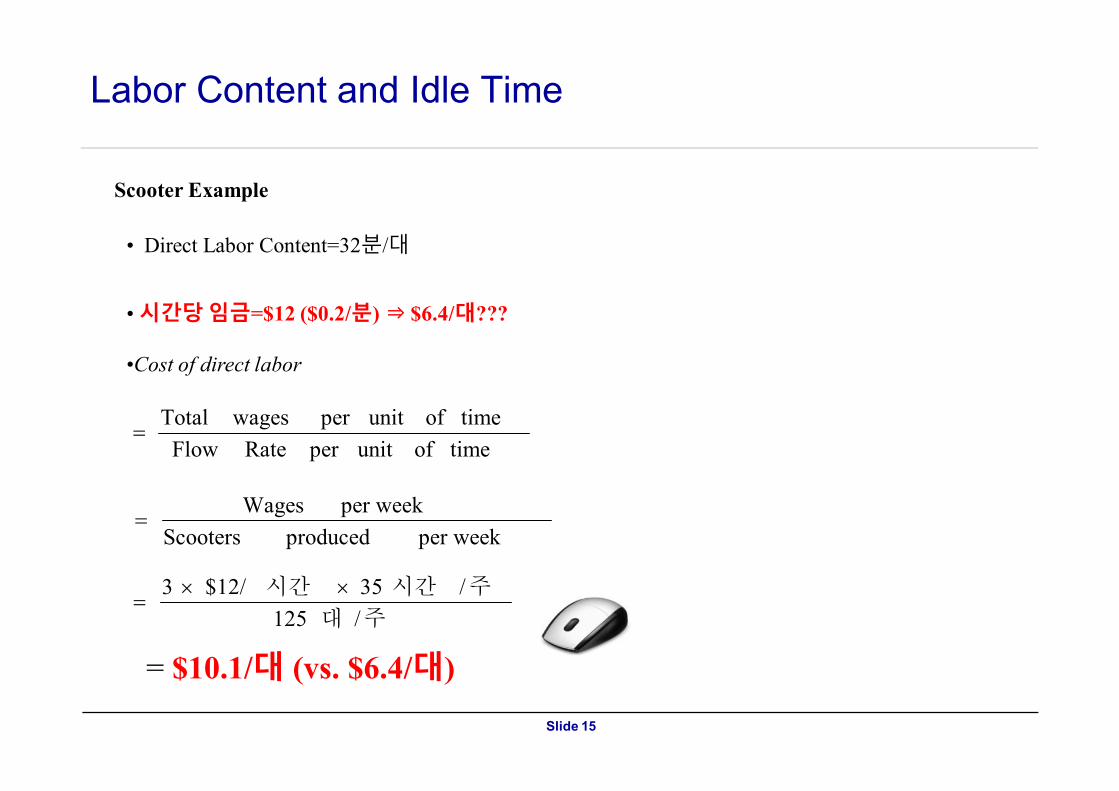
• Direct Labor Content=32분/대
• 시간당임금=$12 ($0.2/분) ⇒ $6.4/대???
•Cost of direct labor
Scooter Example
Labor Content and Idle Time
per week producedScooters
per week Wages=
주대
주시간시간
/125
/35$12/3 ´´=
= $10.1/대 (vs. $6.4/대)