Embed Size (px)
Citation preview

Florida-Brazil Processing Linkages
August 11, 1997
Economic and Market Research Department Florida Department of Citrus
Working Paper Series 97-1

Florida-Brazil Processing Linkages
Prepared by: Economic and Market Research Department Florida Department of Citrus
August 11, 1997
EMRD Working Papers are generally speeches and research reports to the Florida Citrus Commission and other industry organizations. The content focuses on research results and industry implications. Technical details of the analytical models are presented in other professional and EMRD publication outlets.


i
TABLE OF CONTENTS Page List of Tables ............................................................................................................ ii
List of Exhibits......................................................................................................... iii
Introduction................................................................................................................1
Cargill Citro America, Inc. ........................................................................................2
S.A. Louis Dreyfus et Cie ..........................................................................................2
Cutrale Citrus Juices U.S.A., Inc. ..............................................................................3
Citrosuco Paulista S.A. ..............................................................................................3
Other Foreign Investors .............................................................................................4
Size of Florida-Brazil Processing ..............................................................................4
Orange-Juice Production, Price, Import and Export Trends......................................7
Possible Motivation of Brazil Purchases of Florida Processing................................9
Arbitrage ..................................................................................................................11
Cost Efficiency and Orange-Juice Prices.................................................................13
Quality of Bulk FCOJ ..............................................................................................14
Duty Drawback ........................................................................................................16
Florida Equalization Tax, and Seal of Approval and Sunshine Tree Programs ......18
Pattern of FCOJ Prices Across International Markets .............................................20
Florida Orange Land Values ....................................................................................22
Summary and Conclusions ......................................................................................23

ii
List of Tables Table Page 1 Brazilian FCOJ Exports by Destination..............................................25 2 Relationships Between International NFC Orange-Juice
Prices and Florida Orange Values.............................................26 3 Relationships Between Santos, Brazil and Selected U.S.
NFC Orange-Juice Prices..........................................................27 4 Cost of Delivering FCOJ to Europe: Brazil-to-Florida-to-
Europe Delivery with Duty Drawback .....................................28 5 Prices and Cost of Delivering FCOJ to Europe: Brazil-to-
Florida-to-Europe Delivery with Duty Drawback Versus Brazil-to-Europe Delivery ........................................................29
6 Prices and Costs of Delivering FCOJ to Alternative Markets:
Standard Grade A Product, with 93 Score................................30 7 Prices and Costs of Delivering FCOJ to Alternative Markets:
Standard Grade A Product, with 93 Score, Under Alternative Demand Conditions ...............................................31
8 Prices and Costs of Delivering Standard Grade A, 96 Score
FCOJ to Alternative Markets ....................................................32

iii
List of Exhibits Exhibit Page 1 FDOC Tax Paid Processed Oranges from Florida Fruit
Aggregate Share for Cargill, Minute Maid and Winter Garden...........................................................................33
2 FDOC Tax Paid Orange-Juice Imports Aggregate Share for
Cargill, Minute Maid and Winter Garden.................................33 3 FDOC Tax Paid Processed Oranges from Florida Fruit and
Imports Aggregate Cargill, Minute Maid and Winter Garden...........................................................................34
4 FDOC Tax Paid Processed Orange Boxes Florida-Grown
Versus Imports ..........................................................................34 5 FDOC Tax Paid Processed Orange Shares Florida-Grown
Versus Imports ..........................................................................35 6 Florida Orange-Juice Production ........................................................35 7 Aggregate Florida and Brazil Orange-Juice Production Versus
Florida Bulk FCOJ Price...........................................................36 8 Florida Orange-Juice Imports Versus Exports....................................36 9 Florida Versus Brazil Cost of FCOJ ...................................................37 10 South and Central Florida Mature Orange Land Values Versus
Orange On-Tree Prices..............................................................37 11 FCOJ Nearby Futures Average Price Versus FCPA Average
Final and Intermediate Price for Oranges Used in FCOJ .........38

Florida-Brazil Processing Linkages*
Introduction
This report examines Florida-Brazil processing linkages (referred to as the linkage(s) in this
report) and implications for Florida citrus growers. Data are provided on the relative size of the
linkage to date. Fundamental trends in orange-juice production, prices, imports and exports are
reviewed to keep possible impacts of the linkages in proper perspective. Why international
investment in Florida processing has been occurring is discussed in the context of fundamental
trends in the orange-juice industry and globalization of the market. Discussion of arbitrage is
provided to help explain determination of orange-juice prices under various situations that may
occur as a result of the linkage. Potential impacts of the linkage on trading orange-juice are
examined with respect to duty drawback and the Florida equalization tax. Also, possible grower-
price impacts related to processing costs, transportation costs and marketing channels are
considered. Lastly, how the Florida Sunshine Tree and Seal of Approval programs may fare under
the linkage is discussed.
Three companies—Cargill Citro America, Inc. (Cargill), S.A. Louis Dreyfus et Cie
(Dreyfus), and Cutrale Citrus Juices U.S.A., Inc. (Cutrale)—have processing plants in both Florida
and Brazil. Also, the Brazilian firm Citrosuco Paulista S.A. (Citrosuco) and Alcoma Packing
Company, Inc. recently reached an agreement where Alcoma will process oranges for Citrosuco.
Introductory background information on these four processing companies follows. Each of these
*Prepared by Mark G. Brown, Senior Research Economist, Economic and Market Research Department, Florida
Department of Citrus, Gainesville, FL, August 11, 1997, Working Paper 97-1.

companies trades orange juice on an international scale; Cargill, Dreyfus and Citrosuco are also
major traders of other commodities.
Cargill Citro America, Inc.
Cargill owns the former Citrus-Hill processing facility in Frostproof, as well as two
processing facilities in São Paulo, Brazil, one in Chile and one in Pakistan. They trade bulk frozen
concentrated orange juice (FCOJ) and own two bulk tanker ships for transporting FCOJ to world
markets. Cargill is a U.S.-based company with headquarters in Minnesota.
In addition to orange juice, Cargill trades a wide variety of food commodities including
vegetable oils, corn and flour milling products, various fruits and fruit juice concentrates, cocoa and
chocolate products, rice, malt, soy proteins, egg products, beef, pork, chicken, turkey and others.
They are involved in the production of fertilizer, steel manufacturing and financial trading. Cargill’s
total sales were $56 billion in 1995, and its food sales were $18.7 billion in 1996, ranking third
among the world’s top food companies.
S.A. Louis Dreyfus et Cie
Dreyfus owns the Winter Gardens Citrus Products processing facility, along with two
processing facilities in São Paulo. They also lease a processing plant in the Brazilian state of
Sergipe. Dreyfus is a trader of bulk FCOJ.
Besides orange juice, Dreyfus trades such commodities as grains, oilseeds and their by-
products, sugar, coffee and cocoa. They are also involved in ship owning, natural gas, energy,
electricity, manufacturing, petroleum by-products, real estate, and international finance. The
headquarters for the Dreyfus group is in Paris, France. In recent years, Dreyfus average annual sales
have exceeded $20 billion.

vi
Cutrale Citrus Juices U.S.A., Inc.
Cutrale, a subsidiary of Sucocitrico Cutrale, Ltda., Brazil, owns the former Minute Maid
processing plants in Auburndale and Leesburg. Cutrale has an agreement with Coca-Cola Foods to
supply orange juice for Coca-Cola’s Minute Maid products. Orange-juice production by Cutrale
Citrus Juices U.S.A., Inc. in excess of Coke’s needs is marketed independently by Cutrale.
Sucocitrico Cutrale, Ltda. owns five processing facilities in São Paulo and uses three tanker ships.
Cutrale is one of the largest growers and processors of citrus products in the world. They produce
about 25 to 30 million boxes of oranges from over 100,000 acres in Brazil.
Citrosuco Paulista S.A.
Citrosuco and Alcoma Packing Company, Inc. recently reached an agreement where Alcoma
will process (toll pack) oranges for Citrosuco, providing them with a supply of Florida orange juice
and a more viable base to sell orange juice in the U.S. market. Citrosuco is one of the world’s
largest orange-juice processors and a major bulk FCOJ trader with four bulk tanker ships. Citrosuco
is part of the Fisher group, one of the largest conglomerates in Brazil. In addition to orange-juice
processing, the Fisher Group is involved in orange, apple and cattle production, shipping, offshore
oil platform support, computer paper manufacturing, real estate and finance. The Fisher group is the
largest Brazilian apple producer, with 20,000 acres in production, and is one of the largest Brazilian
orange producers, with 80,000 acres in production.
Alcoma processing facilities may eventually be sold to Juice Farms, Inc., a part of the Fisher
group.
vii
Other Foreign Investors
In addition to the foregoing, several other foreign concerns have invested in the Florida citrus
industry. Japanese concerns have invested in Silver Springs Citrus Cooperative and Glico Fruits
U.S.A. Corporation, and a French concern has invested in Caulkins Indiantown Citrus Co. The
Canadian-controlled Seagram’s company owns Tropicana and another Canadian concern owns Sun
Pac Foods, Inc.
Size of Florida-Brazil Processing
The magnitude of Florida-Brazil processing linkage is reflected by the percentage or share of
FDOC tax-paid processed orange boxes accounted for by Cargill, Coca-Cola Minute Maid (Cutrale),
and Winter Garden Citrus Products (Dreyfus) in recent years. Since Cutrale and Dreyfus became
Florida processors in the past year, the shares for the processing facilities that they purchased are
examined. The aggregate shares for Cargill, Coke and Winter Garden, for the 1991-92 through
1995-96 seasons, are shown in Exhibits 1 through 3. In the last several seasons, the share of tax-
paid Florida-grown processed oranges accounted for by these three companies has been roughly
20% (Exhibit 1), while the import share has been somewhat higher at about 25% (Exhibit 2). The
share of tax-paid Florida-grown oranges and imports in total, accounted for by these three
companies, has been about 20% (Exhibit 3), following the share for Florida-grown oranges.1
1 Alcoma’s share of the tax-paid processed oranges (Florida-grown and imports) over the period from 1991-92
through 1995-96 lies within the range of the individual company shares for Cargill, Dreyfus and Cutrale, providing a rough indication of the potential size that Citrosuco could have in the Florida processing industry in upcoming years. The amount of Alcoma’s processing capacity that will be used to process Citrosuco’s oranges is not known.

viii
Exhibits 4 and 5 show that most tax-paid processed orange boxes were Florida grown and
that this category is growing while imports are declining. In 1995-96, Florida oranges accounted for
91% of the tax-paid processed oranges with imports accounting for the remaining 9%. Assuming
Florida’s orange production continues to grow over time, the trend toward fewer imports is expected
to continue.
Although the foregoing data on recent orange processing provide an indication of the size of
the linkage to date, it should be noted that the linkage may increase in upcoming years. Expansion
of the linkage through additional acquisitions of Florida processing facilities and/or expansion of
existing processing facilities may occur. Dreyfus and Cutrale plan to expand their processing and
storage capacity, and Dreyfus has expressed an interest in acquiring additional processing capacity
both in Florida and Brazil. Florida processing companies experiencing recent financial difficulties
may be possible future acquisitions.
The size of the linkage also depends on how widely or narrowly the product market is
defined. Above, the size of the linkage has been measured relative to the Florida orange-juice
market. Data on the share of FDOC tax-paid processed oranges accounted for by the linkage are
based on oranges used in the production of FCOJ and not-from-concentrate orange juice (NFC), as
well as a small portion of canned single-strength orange juice. Since the Florida-Brazil linked
processing companies are primarily producers of bulk FCOJ, the historic tax-paid data may not
reflect the size of the linkage in the bulk FCOJ segment of the Florida industry. In 1995-96, Florida
bulk FCOJ movement was 66% of total Florida orange-juice movement (bulk FCOJ movement was
784 million SSE gallons, while total orange-juice movement was an estimated 1188 million SSE
gallons). To the extent Florida-Brazil processing companies are mainly bulk FCOJ producers, the
above mentioned aggregate linkage share of 20% of Florida orange-juice processing could translate

ix
into as much as 30% of Florida bulk FCOJ business (20%/66%). Since many of the Florida
processing companies experiencing financial difficulties are bulk FCOJ producers, acquisition of
such companies by linkage companies could make the linkage’s share of Florida’s bulk FCOJ
business significantly larger, possibly having market performance implications.
The more companies in a market and the more equally sized they are, the less likely any
single company or small group of companies can influence a market. In a competitive market, there
are a large number of firms, with no firms able to control the market price. In the short run, based on
the relatively modest size of the linkage to date, as reflected by the above aggregate Cargill-Dreyfus-
Cutrale shares of Florida orange processing, the linkage may not result in a less competitive Florida
industry than existed before the changes in processing ownership. (Discussion here on the aggregate
size of the linkage is not meant to imply that involved companies have been behaving jointly or any
less independently than other processing firms.) In the long run, competitive behavior, regardless of
ownership of processing facilities, becomes more difficult to ascertain. If the Florida processing
industry, and in particular the bulk FCOJ segment, becomes more concentrated with fewer
companies operating at larger scales, the industry’s competitive behavior might be affected. A
concentrated processing industry might negatively impact grower prices to the extent large
processing companies take advantage of their bargaining position (few processors against many
growers) to obtain relatively low fruit prices. However, such noncompetitive behavior could be a
violation of U.S. antitrust law.
It should also be noted that the Florida or U.S. orange-juice market is not an isolated market.
The U.S. market is part of a larger world orange-juice market where Brazil is the largest producer.
The Brazilian orange-juice processing industry is relatively concentrated with four firms having over

x
70% of the capacity according to trade sources.2 This level of concentration suggests that the
actions of these firms can have a major impact on the orange-juice market in Brazil, which in turn
would impact the broader world market and Florida3.
Orange-Juice Production, Price, Import and Export Trends
This section provides background information to help keep Florida-Brazil processing
linkages in proper perspective with fundamental trends in the orange-juice market. Some long-run
trends in the orange-juice market, such as production increases and associated price decreases, may
continue regardless of the linkages. Trends in the orange-juice market themselves may also underlie
some of the investment in the Florida citrus industry by Brazil and others.
2The four largest Brazil processors have about 80% of the capacity based on a report entitled “Production and
Marketing of Orange and Concentrate - Brazil,” by AntonioAmaro, Economist, Instituto de Economia Agricola, São Paulo, Brazil, presented at the National Juice Products Association/Citrus Economists and Allied Professionals Economic Outlook Conference, New Orleans, Louisiana, October 29-30, 1996.
3Despite the market influence that the larger Brazil processors may have, in the long run, the world orange-juice market seems to have tended toward competitive behavior, reflecting the underlying supply and demand conditions. For example, in the mid 1980's, Florida suffered through several severe freezes which cut Florida orange-juice production almost in half. As a result, FOB orange-juice prices and grower orange returns increased; in turn, the higher prices stimulated plantings in both Florida and Brazil, which has led to increased production and lower FOB and grower prices. These types of responses are typical of a competitive market—given FOB demand for orange juice tends to be inelastic, recent FOB price decreases, by themselves, tend to lower industry revenue, the opposite result that would be expected in a noncompetitive market where a company (monopoly) or group of companies (oligopoly) maximizes profits.

xi
Since the freezes of the last decade, Florida’s orange-juice production has increased from
569.3 million SSE gallons in 1984-85 to an estimated 1,392.1 million SSE gallons in 1996-97, an
increase of 144.5% (Exhibit 6). Brazil’s orange-juice production also increased from 1,091.7
million SSE gallons in 1984-85 to an estimated 1,587.6 million SSE gallons in 1996-96, a 45.4%
increase. In aggregate, Florida and Brazil orange-juice production increased from 1,661.0 to 2,979.7
million SSE gallons over this period, a 79.4% increase. The increase in Florida and Brazil
production has been a significant factor underlying the 29% decrease in the Florida bulk FCOJ price
from $1.64 per pound solids (PS) in 1984-85 to $1.16 per PS in 1995-96; the real CPI deflated price
decreased from $1.52/PS to $.72/PS, a 52.6% decrease (Exhibit 7).
As Florida orange-juice production has increased, U.S. orange-juice import needs have
decreased while U.S. orange-juice exports have increased (Exhibit 8). With increases in Florida
orange production expected in upcoming years (see Florida Citrus Production Trend, 1997-98
Through 2006-07, March 1997, FDOC report by the Economic and Market Research Department),
Florida orange-juice production could increase substantially (Exhibit 6), resulting in further
decreases in U.S. orange-juice imports and increases in U.S. orange-juice exports. Florida has been
a net importer of orange juice. However, in upcoming years, Florida may become a net exporter.
Some imports for blending needs will probably occur even if Florida orange-juice production
reaches the higher levels expected in the upcoming years.
It should be noted that, to the extent Brazil exports less orange juice to the U.S., Brazil can
be expected to export more to other world markets such as Europe, which by itself would put
downward pressure on prices in those markets. The allocation of Brazil, Florida and other country
orange juice to world markets is determined by the strengths of demands in the U.S. and various
world markets and the structure of world transportation and tariff costs.

xii
As a result of the above trends, Florida has been able to supply an increasing share of the
U.S. orange-juice market in recent years. The trends in U.S. production and imports suggest that, in
upcoming years, Florida may be in a dominant supply position in the U.S. market for an “all Florida”
program. The Florida-Brazil linkage to date will probably not change these fundamental trends.
In examining orange-juice market trends, Brazil’s production situation also needs to be
considered. There appears to be a degree of uncertainty with regard to Brazil’s future orange-juice
production. Brazil has 250 million orange trees (Cutrale, Citrosuco and Cargill own roughly 11, 8.5
and 2.1 million orange trees, respectively; Dreyfus does not own any orange trees at present, but, as
part of its strategy to diversify its fruit supplies, plans to invest in about 2 million trees in Brazil), of
which 216 million are bearing and 34 million are non-bearing, suggesting Brazil orange and orange-
juice production, like Florida’s, could also increase substantially in the upcoming years. However, a
significant number of Brazil’s orange trees have been infected with citrus clorosis variegated
(CVC), which may limit production in the long run. Another factor that could limit production is
future low grower prices; low prices may result in reduced fertilizer usage and grove care. Hence,
the long-run trend in Brazil orange-juice production is less clear.
Possible Motivation of Brazil Purchases of Florida Processing
The trends toward increased Florida orange-juice production and less U.S. orange-juice
imports, by themselves, may have been important factors in international investments in Florida
processing. Purchases of Florida processing facilities may have been motivated, in part, by a desire
to maintain or secure U.S., as well as other North American, customers. In the 1980's, Brazil
established a large customer base in the U.S. market, representing from 51% to 73% of its total

xiii
orange-juice exports from 1983-84 to 1986-87 (Table 1). However, as a result of increases in
Florida orange-juice production, U.S. demand for Brazil orange-juice has been trending down, with
Brazil in danger of losing their U.S. customers (in 1995-96, Brazil shipments were 266 million SSE
gallons versus an average of 459 million SSE gallons from 1983-84 to 1993-94). The Florida-Brazil
linkages that have been established provide the companies involved with a means to continue to
supply the U.S. and other North American markets. Whereas previously some North American
customers may have been supplied with product containing a relatively large share of Brazilian juice
on average, they can now be supplied from Florida with Florida-grown orange juice or product with
a higher share of Florida juice.
Growth in not-from-concentrate (NFC) orange juice in the U.S. and, more generally, the
world may also be a factor underlying international investment in Florida processing, with some
companies positioning themselves to participate in this growing market segment. As a result of
transportation costs and the U.S. tariff, Brazil is at a cost disadvantage in supplying NFC to the U.S.
(Table 2); hence, little Brazilian NFC has been exported to the U.S. Brazil’s cost disadvantage is
smaller for delivery of product to the Northeast U.S., compared to delivery to Florida, as the Florida-
to-Northeast and Santos-to-Northeast transportation costs are similar. The NFC prices and costs in
Table 2 are based on storage in drums, and transportation by drums (in the case of overseas
shipments) and tanker trucks (in the case of Florida-to-Northeast U.S. shipments). However, it
should be noted that the NFC business is in a period of change involving storage in tank farms, and
overseas transportation in Scholle bags and stainless steel containers, which could vary costs from
those in Table 2. For example, based on using Scholle bags and in-processing-season shipments,
Brazil can net substantially more in the U.S. as shown in Table 3, suggesting that Brazil can be
competitive in the Northeast U.S., at least during their processing season which is the opposite of
xiv
Florida’s processing season (note that, during Brazil’s season, Florida is incurring out-of-season
expenses such as drum and storage costs as shown in Table 2).
Growth in the NFC segment of the U.S. market is partly at the expense of the retail FCOJ
market segment, so that the downward trend in the U.S. import demand for FCOJ is partly related to
a declining U.S. retail FCOJ market. The largest U.S. retail market segment is reconstituted or from-
concentrate (FC) chilled orange juice; a large portion of bulk FCOJ, whether from Florida or Brazil,
is made into FC product in Florida or in reprocessing facilities and dairies near major markets to
achieve transportation cost savings. The FC segment of the U.S. market has shown less growth than
the NFC segment. Based on Nielsen scantrack data, 1995-96 (1990-91) U.S. retail volume sales for
FCOJ, NFC, FC and canned single-strength orange juice, in retail stores doing $4 million or greater
business, were 197.7 (279.7), 205.7 (122.8), 315.4 (289.5) and 7.2 (8.3) million single- strength-
equivalent gallons, respectively.
In general, investors in the world orange-juice business can not ignore the U.S. market as it
is the largest orange-juice market in the world with consumption estimated at roughly 1.4 billion PS
in 1995-96. Assuming for illustrative purposes a 3% return and a FOB price of $1.00/PS, a firm that
can obtain 10% to 20% of the U.S. market might receive a $4.2 to $8.4 million annual return. Such
potential returns alone may motivate international investment in Florida processing.
Arbitrage
As indicated above, the firms with Florida-Brazil processing linkages are major traders of
bulk orange juice, with two of the firms also being large traders of a number of other commodities.
Companies that operate on such a scale tend to be very efficient in trading. An important
mechanism for achieving efficiency in trading is arbitrage.

xv
Arbitrage is the buying and selling of a good in two different markets to take advantage of
price differences between the markets. An arbitrager buys a commodity at a low price in one market
and sells it at a high price in another market, making a profit equal to the price difference. The
process of arbitrage is important for bringing supply and demand into equilibrium across markets.
(Arbitrage can occur spatially across markets in different regions, as well as temporally across time,
as in the case of futures markets.) For example, suppose a Florida processor can buy orange-juice
(OJ) pounds solids (PS) from growers at a delivered-in price of $.90/PS. (The processor would buy
round oranges which, when processed, would yield a given amount of PS.) Assume the cost of
processing is $.17/PS and the Florida FOB (processing plant) price is $1.07/PS. Suppose now that a
European customer is willing to pay $1.25/PS FOT (free-on-truck, duty not paid) delivered to
Europe and the transportation cost is $.13/PS. For this transaction, the processor would incur costs
of $1.20/PS ($.90/PS paid to the grower plus $.17/PS processing cost plus $.13/PS transportation)
but would receive $1.25/PS, making a profit of $.05/PS. Hence, a deal is made; others seeing profits
can be made through arbitrage would be expected to make similar deals. Notice the result of such
arbitrage. The increased buying of Florida PS tends to increase the Florida grower and FOB prices
(or, alternatively stated, taking Florida OJ PS out of the U.S. market tends to increase the Florida
prices), while putting additional PS in Europe tends to decrease the price there. Arbitrage would be
expected to continue until the grower-Europe FOT price spread decreases to the point where profits
can no longer be made. This occurs when the price spread equals the processing plus transportation
costs. For example, the Florida grower price might increase to $.93/PS while the Europe FOT price
might decrease to $1.23/PS, with the $.30/PS differential equaling the processing and transportation
cost.

xvi
Arbitrage may also involve both the importing and exporting of orange juice. For example,
assume that, as a result of quality differences, the FOB Santos price for Brazil FCOJ is $.66/PS,
while the FOT Europe price for Florida FCOJ is $.90/PS. Assuming a transportation cost of
delivering Brazilian FCOJ to a Florida plant of $.09/PS (ocean tanker ship and inland
transportation), along with the U.S. tariff of $.315/PS and the Florida equalization tax of $.03/PS, the
cost of Brazilian FCOJ delivered to a Florida plant would be $1.095/PS (Table 4). Further,
assuming a transportation cost of delivering FCOJ to Europe of $.09/PS (ocean tanker ship and
inland transportation), along with a duty drawback credit of $.312/PS (99% of tariff; see “Duty
Drawback”), the cost of delivering FCOJ to Europe would be $.873 ($1.095/PS+$.09/PS-$.312/PS).
Since the Europeans are willing to pay $.90/PS for Florida FCOJ, a profit of $.027/PS can be made
when Florida FCOJ is substituted for the imported Brazilian FCOJ (see “Duty Drawback”).
If transportation costs to Europe were higher than $.117/PS, say due to the use of drums as
opposed to tanker ships (see “Cost Efficiency and Price”), the arbitrage profit would disappear and
trade would not occur. As Florida processing companies use drums and Brazil-Florida linked
companies may use tanker ships, linkage companies enjoy a competitive advantage over Florida
processors in supplying FCOJ to Europe. Brazil linked companies may also be in an advantageous
position for profiting from such transactions to the extent they own the outstanding duty drawback
credits in existence.
Cost Efficiency and Orange-Juice Prices
As indicated above, the Florida grower price for processed oranges depends on processing
and transportation costs. Under competitive conditions, the grower price is the processor FOB price

xvii
minus processing and transportation costs. The sum of the latter costs are referred to as the margin
between FOB and grower levels. Under competitive behavior, reductions in the FOB-grower margin
can be expected to be passed on to the grower. For example, suppose processor transportation costs
are reduced by using bulk tanker ships, as opposed to drums. Initially, lower transportation costs
can be expected to result in increased profit for the processor through arbitrage as in the above
example. The profitability of using tanker ships might then lead processors to increase their Florida,
tanker-based business which could then result in an increase in sales of Florida PS in foreign
markets, an increase in demand for Florida oranges and an increase in the Florida grower price.
Since the linkages make several cost-efficient bulk tanker ships available for transporting Florida
orange juice, this cost efficiency could benefit Florida growers. However, if competitive behavior
does not prevail, there is no guarantee that growers will receive better prices, and bulk-tanker-ship-
based profits could be pocketed by the processor.
Similarly, other linkage cost efficiencies could be beneficial to Florida growers. Processing
cost reductions may be achieved in general management and through economies of scale.
Economies of scale involving running larger volumes of fruit through a processing plant may spread
out costs, resulting in a decrease in the average processing cost/PS. As a result of linkage
companies, as well as other Florida companies, striving to operate at cost-efficient levels, processing
competition for oranges may increase, putting upward pressure on grower prices.
Quality of Bulk FCOJ
FCOJ has a number of quality attributes, including Brix, acid, ratio, viscosity, color and
flavor. These attributes can be important for determining the FOB bulk price for FCOJ. Whereas
xviii
Florida processors may have a demand for color for blending or viscosity for institutional products,
and may be willing to pay a premium for Brazil FCOJ with appropriate color or viscosity;
customers around the world may be willing to pay a premium for other attributes that can best be
supplied by Florida.
Over the course of a season, the quality of FCOJ available for sale may vary in both Florida
and Brazil. For example, at the beginning of the Florida season, the FCOJ produced from early and
midseason oranges may not have satisfactory color. Likewise, during the period before the start of a
new Brazilian processing season, the remaining Brazil FCOJ in storage may not have the attributes
that a buyer might demand. Such quality differences in Florida and Brazil FCOJ over the course of a
season provide linkage companies with opportunities to increase market (allocation) efficiency;
gains in efficiency as such, in turn, may benefit Florida growers.
For example, during the course of a season, a Brazilian customer, somewhere in the world,
may demand products with attributes that cannot be satisfactorily supplied by Brazil at that point in
time, but could be supplied by Florida; but Florida might not supply this customer simply because
the customer channel has not been developed. However, a company with joint Florida and Brazil
investments might be able to satisfy such demand, supplying the demanded Florida product. Such a
sale would increase the demand for Florida oranges, tending to put upward pressure on grower
prices.
Hence, Florida-Brazil companies may be able to better match world demand for various
quality orange juice with world supplies, which tend to vary in quality over time and from one
production region to another. Quality is related to seasonality and given Florida and Brazil have
opposite seasons, a linkage concern tends to have access to a product with a wider range of quality
to satisfy consumer demands.

xix

xx
Duty Drawback
Duty drawback is a trading provision which allows the tariff on an imported good to be
largely canceled when that good is re-exported. Drawback is important for the Florida citrus
industry, helping Florida compete in international markets. With linkage firms being major
international traders of orange juice, drawback is an important part of their business transactions.
A duty or tax on an imported good which is used to produce another good increases the
production cost and, hence, the (break-even) sales price of that good, and puts the producer at a
competitive disadvantage in export markets where other producers are not subject to the duty. To
enable U.S. industries to compete more effectively in foreign markets, the U.S. Government offers a
refund or drawback on duty collected on imported goods which are eventually exported, after being
changed in some manner. Drawback reduces costs of imported goods by the amount of the duty
paid (actually, cost is reduced 99% with 1% of the duty used to defray Customs costs). Drawback
provisions of various kinds have been offered in the U.S. since the first drawback law was enacted
under the Tariff Act of 1789.
A drawback provision of the Tariff of 1930, known as the Smoot-Hawely tariff, is
particularly important for the Florida orange-juice industry. The provision referred to as the
“substitution drawback law” allows a producer to collect drawback when commercially equivalent
domestic product is substituted for imported product in manufacturing the exported good. The
domestic substitute product must be “of the same kind and quality”4 as the imported product, and the
exported product must be ”new and different.”5
4For orange juice, the requirement of “same kind and quality” has been interpreted such that domestic
concentrated orange juice of Grade A quality, or reconstituted orange juice of Grade A quality, can be substituted for imported Grade A concentrated orange juice. Fresh orange juice or not-from-concentrate (NFC) orange juice cannot

xxi
The U.S. imposes separate tariffs on imports of frozen concentrated orange juice (FCOJ) and
single-strength orange juice (SSOJ)—more precisely, the separate tariffs levels are for concentrated/
reconstituted product versus NFC product. For 1997, the tariff for FCOJ is $.324 per single-
strength-equivalent (SSE) gallon, while the tariff for SSOJ is $.185/SSE gallon. The General
Agreement on Tariffs and Trade (GATT) reduces the FCOJ tariff by slightly less than a penny per
year until 2000 and thereafter, when the tariff will be $.298/SSE gallon; the single-strength-orange-
juice tariff will be reduced to $.17 per SSE gallon in 2000 and thereafter.
The tariff represents a major part of the cost of importing orange juice (Exhibit 9). Without
the duty drawback, the cost of exporting FCOJ from the U.S. in 1997 would be $.31/PS higher,
making Florida orange juice less competitive in foreign markets.
However, for a company to claim drawback, it must have imported orange juice. As
indicated above, U.S. orange-juice imports are trending downward; if this trend continues, there will
be less duty drawback to claim in upcoming years. Nevertheless, some drawback will probably be
available regardless of Florida’s orange-juice production level, as imports for blending needs can be
expected. Drawback credits can be carried for three years.
substitute for imported concentrated orange juice—Customs has ruled that NFC orange juice may differ in such qualities as color and taste depending on the type of orange juice, its maturity and season. Domestic NFC orange juice, however, could be substituted for imported NFC orange juice.
5For the orange-juice industry, the requirement that the drawback claimant manufacture a “new and different” product is also noteworthy. For instance, Customs does not consider that diluting concentrated orange juice with water results in a “new and different” product. Similarly, blending of imported concentrated orange juice with another orange juice does not satisfy the requirement. For these cases, the “new and different” requirement could, for example, be satisfied by adding essential oils and flavoring components to the blends.
xxii
Imports for blending could increase in upcoming years, to the extent that linkage, as well as
other, processors are able to take advantage of world demands and supplies for specific quality
orange-juice blends. Normally, it would not be economical to import Brazil product and then re-
export the same or substitute Florida product, say to Europe. Although drawback might be used to
cancel the U.S. tariff, transportation costs and the equalization tax would make the cost of Brazil-to-
Florida-to-Europe delivery substantially more than Brazil-to-Europe delivery (Table 5). In some
cases, however, Brazil-to-Florida-to-Europe delivery may be profitable if Europe pays a premium
price, say for Florida attributes, that covers the additional cost (see “Arbitrage”).
Florida Equalization Tax, and Seal of Approval and Sunshine Tree Programs
Orange-juice imports into the State of Florida are subject to the Florida equalization tax
which is equivalent to what Florida growers pay to the Florida Department of Citrus for advertising,
promotion, scientific research, regulatory, and market and economic research activities. The
equalization tax, like duty drawback, puts Florida orange juice and its closest substitute, imported
orange juice, on equal footing, bearing the same cost with respect to the Florida tax. The
equalization tax helps prevent imports from receiving a free ride (benefit from the demand created
by Florida advertising and promotion programs plus research activities, without contributing to the
cost of the programs) in the U.S. orange-juice market. The level of the Florida grower tax and
equalization tax is now about $.03/PS.
In the post-freeze period, with the U.S. being a large orange-juice importer, a substantial
amount of the imports went to areas outside Florida. The Florida equalization tax was not collected

xxiii
on these imports, unless the importer chose to participate in the Florida Seal of Approval program6;
if the equalization tax was not paid, one could argue these imports received a free ride as they still
benefitted from the demand created from Florida advertising.
Despite the declining trend in U.S. orange-juice imports to perhaps blending needs, it is not
clear how Brazilian imports to areas outside Florida may trend in upcoming years7, and to what
extent the free rider problem will exist. The share of U.S. orange-juice imports that enter the U.S.
outside of Florida (e.g., the Northeast) could increase, as a result of transportation cost savings and
avoidance of the equalization tax (Table 6).
The volume of U.S. orange-juice imports outside Florida may be important for the Florida
Seal of Approval program. Imports outside Florida not paying the Florida equalization tax can not
participate in the Seal of Approval program. Whether an importer pays this tax to participate in the
Seal of Approval Program will depend on the role this program plays in the company’s marketing
strategies. As previously discussed, in general, companies in the orange-juice business seem to have
recognized the opportunities offered by trading various differentiated product, in which case, the
differentiation offered by the Florida Seal of Approval Program may be an important part of their
marketing strategies.
6 In the past, to participate in the Florida Seal of Approval program, 70% to 85% (depending on the crop size)
or greater of a company’s orange juice had to have been tax paid (with respect to the Florida equalization tax). Hence, some imports need not have been tax paid to have participated in the Florida Seal of Approval program. For the future, however, the Florida Citrus Commission is expected to adopt new ruling requiring 100% of a company’s orange juice be tax paid.
7The extent of this possible decline may depend on the volume of orange-juice imports from Mexico, as a large portion of these imports may not enter Florida.

xxiv
To the extent Florida orange-juice production grows (Exhibit 6) and imports continue to
decline (Exhibit 8), the Florida Sunshine Tree Program, promoting 100% Florida orange juice, can
be expected to be in a more dominant market position in upcoming years. At some point, the U.S.
may become a net exporter of orange juice. If the expected growing supply of orange juice from
Florida has sufficient quality (e.g., adequate color) to be packaged as premium product, an increased
share of the market could be covered by the Florida Sunshine Tree Program. However, whether or
not this occurs will depend on the extent companies in the orange-juice business recognize the
opportunities offered by differentiation through the Florida Sunshine Tree Program and find this
program to be an important part of their marketing strategies.
Pattern of FCOJ Prices Across International Markets
When a company sells orange juice in different international markets, the prices in these
markets tend to differ by transfer costs (transportation and tariff costs including offsetting
drawback); on the other hand, when a company does not sell orange juice in different international
markets, the prices in these markets will generally not follow this rule. As supply/demand
conditions change over time and/or product quality varies, the market price equilibriums change; in
one period a company could ship product to a market and in another it might not; or the company
may ship product with one set of attributes but not product with another set.
Tables 6 through 8 show hypothetical prices and costs across markets—the tables differ by
assumed market prices; variation in prices is assumed to be related to product quality and time.
These examples assume transportation is by tanker truck or ship. It is also assumed that duty
drawback is collected; however, these examples do not consider Brazil’s potential profit from using

xxv
duty drawback and the associated impact on market prices (for an example of how Brazil may use
duty drawback, see Table 4 and discussion in “Arbitrage”). In Table 6, Brazil sells in the Northeast
U.S., Europe and Asia, but not in Florida; while Florida only sells in the U.S. markets (Florida and
the Northeast). The FOB/FOT prices in Florida, the Northeast U.S., Europe and Asia are assumed
to be $.80/PS, $.84/PS, $.53/PS and $.56/PS, respectively. At these prices, Brazil sells in the
Northeast U.S., Europe and Asia because it nets the same price, $.46/PS, in each of these market;
Brazil does not supply Florida as it only nets $.37/PS in this market. Florida only supplies the U.S.
because it can sell all its orange juice of this quality in the U.S. at a price that nets more than could
be netted in Europe or Asia.
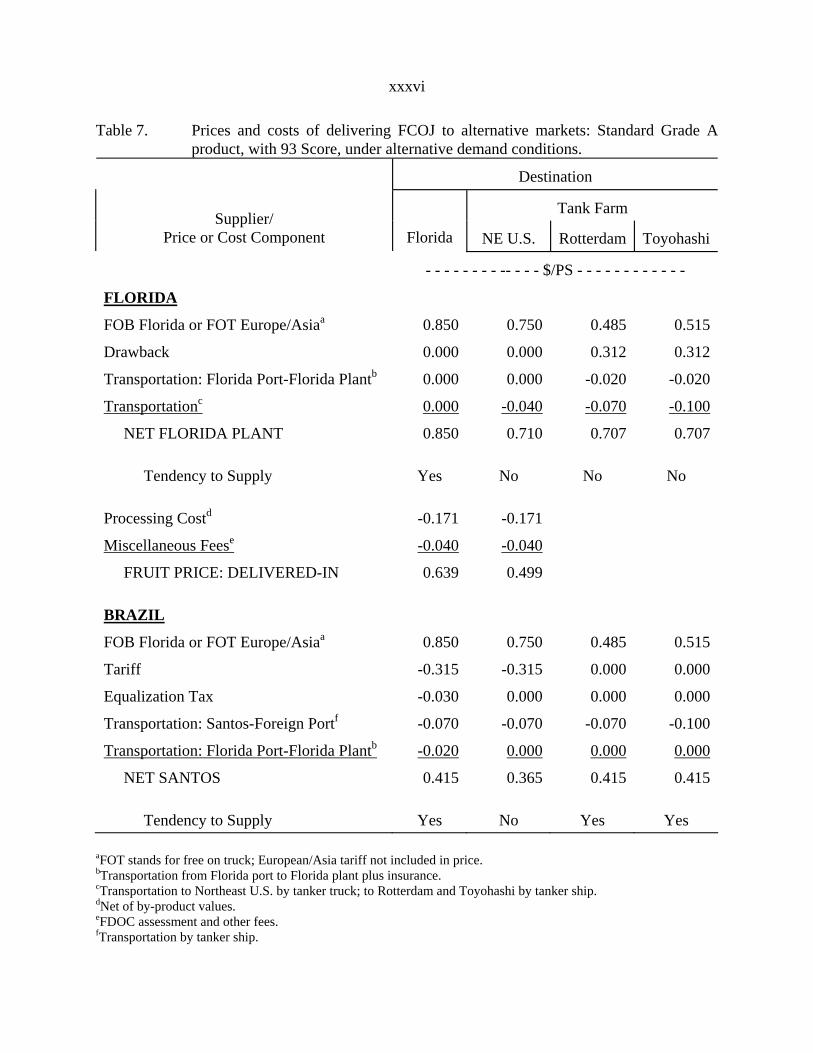
Table 7 assumes stronger Florida prices and weaker Northeast U.S. prices, compared to those
in Table 6 (e.g., the strong Florida prices might be a result of demand for color). Given the prices in
Table 7, Florida product is only sold FOB Florida plant, while Brazil product is sold in Florida,
Europe and Asia, but not in the Northeast U.S.
Table 8 shows hypothetical prices for a higher quality orange juice with specific attributes in
demand. In this case, Florida orange juice is sold in both domestic and international markets,
assuming duty drawback is collected under the “substitution drawback law,” allowing Florida
product to be substituted for imported product. Alternatively, Brazil sells in Europe and Asia, but
not in the U.S. This example is not meant to imply that Brazil does not sell high-quality orange juice
in the U.S. market. In fact, a large amount of Brazilian exports to the U.S. is high-quality orange
juice with specific attributes demanded in the U.S.
Tables 6 through 8 can also be used to illustrate how transportation costs may be critical for
trade to occur. For example, although a Florida-based company would trade in all markets using
tanker ships based on Table 8, it would not be inclined to trade using drums which would increase

xxvi
the transportation cost from $.07/PS to $.13/PS. The use of tanker ships essentially enlarges the
world market for Florida orange juice of this quality.
Estimated grower prices are also shown in Tables 6 through 8. Focusing on Table 8, the
grower delivered-in price would be $.74/PS for premium product. This example assumes that the
cost savings from using tanker ships to transport Florida juice is passed on to the grower (see “Cost
Efficiency and Orange-Juice Prices”). Similarly, reductions in processing costs due to economies of
scale or the introduction of cost saving measures may have a positive impact on grower returns.
These results depend on competitive behavior.
Florida Orange Land Values
The possible impacts of the Florida-Brazil processing linkage on grower returns may also
apply to orange land values. Orange land values and grower returns, as reflected by the orange on-
tree price, tend to move together (Exhibit 10). Likewise, grower returns as reflected by the fruit
price for oranges used in FCOJ tend to follow FOB orange-juice prices as reflected by the FCOJ
futures price (Exhibit 11). As discussed in “Orange-Juice Production, Price, Import and Export
Trends,” since the mid 1980s, a major determinant of FOB orange-juice prices and, hence, orange
grower returns and land values seems to have been the level of orange-juice production (Exhibit 7),
varying from freeze reduced levels of the last decade to recent post-freeze high levels. Although the
linkage may impact grower returns and land values, fundamental supply, as well as possibly
demand, conditions may have more dominating impacts.

xxvii
Summary and Conclusions
The Florida-Brazil processing linkages may result in production and transportation cost
efficiencies due to the use of tanker ships for exporting bulk product, economies of scale in
processing larger volumes of fruit and general processing expertise. The linkages may also result in
increased marketing efficiencies by better matching world demands for Florida orange juice with
Florida supplies. Both production/transportation and marketing efficiencies could benefit Florida
growers by putting upward pressure on grower prices.
However, it is difficult to predict the long-run impact of the Florida-Brazil linkage, by itself,
on grower returns, as fundamental orange-juice supply and demand trends are likely to be the
dominant determinant of grower returns. For example, changes in Florida and/or Brazil orange-juice
production, or changes in world demand, such as expansion of trade into existing and new markets,
could have a much stronger impact on prices than the linkage.
The Florida-Brazil processing linkage represents roughly 20% of processing activity in
Florida (the percentage would be somewhat larger when including the processing that Alcoma is
expected to do for Citrosuco). This is a relatively modest share of the Florida processing industry,
suggesting that the size of the linkage to date, may not result in a significant change in the
competitive behavior of the industry. However, if through acquisition or expansion of existing
processing facilities the Florida orange-juice industry were to become more concentrated in the
future, regardless of processing ownership, competitive behavior may be a concern. When facing a
few processing companies, Florida orange growers would be in a less advantageous bargaining
position for determining fruit prices.

xxviii
Finally, linkage companies, although bulk orange-juice producers, do not seem to view
Florida orange juice as a single commodity. To the extent that these companies recognize the
marketing opportunities for different types of orange juice, including perhaps “all-Florida” orange
juice, they may find that an “all-Florida” orange-juice program plays a role in their marketing
strategies.

xxix
Table 1. Brazilian FCOJ exports by destination.
Season
U.S. Canada
Europe
Japan
Korea
Other
Total
- - - - - - - - - - - - - - - - - - - - million SSE gallons - - - - - - - - - - - - - - - - - - - -
1983-84
424.36
35.78
312.73
50.00
822.88
1984-85
704.94
58.25
148.67
48.79
960.73
1985-86
453.00
32.59
278.48
56.95
821.02
1986-87
564.55
39.54
395.53
98.39
1,098.13
1987-88
315.76
91.88
385.47
29.48
822.56
1988-89
390.16
64.95
344.52
63.25
862.86
1989-90
492.42
60.50
507.89
76.05
1,136.86
1990-91
354.29
70.60
559.26
59.33
34.73
23.30
1,101.56
1991-92
435.55
30.78
660.36
57.39
60.46
28.92
1,273.54
1992-93
416.29
35.95
846.10
72.70
44.23
40.27
1,455.61
1993-94
497.95
8.12
753.25
88.86
49.96
49.72
1,447.77
1994-95
302.63
2.30
892.27
134.13
66.72
50.04
1,448.06
1995-96
266.32
2.83
1,002.65
94.02
37.40
54.04
1,457.23

xxx
Table 2. Relationships between international NFC orange-juice prices and Florida orange values.a
Destination
Supplier/ Price or Cost Component
Florida
NE U.S.
Rotterdam
Toyohashi
- - - - - - - - - - - - - - - $/gallon - - - - - - - - - - - - - - -
FLORIDAb FOB Florida or FOT Europe/Asiac,d,e 1.350 1.750 1.750 2.310 Drum -0.200 -0.200 -0.200 -0.200 Storagef -0.200 -0.200 -0.200 -0.200 Crush -0.050 -0.050 0.000 0.000 Transportation: Plant-Port 0.000 0.000 -0.050 -0.050 Transportationg 0.000 -0.400 -0.400 -0.960 NET FLORIDA PLANT 0.900 0.900 0.900 0.900 Tendency to Supply Yes Yes Yes Yes Processing Costh -0.120 -0.120 -0.120 -0.120 Miscellaneous Feesi -0.040 -0.040 -0.040 -0.040 FRUIT PRICE: DELIVERED-IN 0.740 0.740 0.740 0.740 BRAZILj FOB Florida or FOT Europe/Asiac,d,e 1.350 1.750 1.750 2.310 Drum -0.200 -0.200 -0.200 -0.200 Storagef -0.200 -0.200 -0.200 -0.200 Transportation: Port-Santos -0.080 -0.080 -0.080 -0.080 Transportation: Santos-Foreign Port -0.400 -0.400 -0.400 -0.960 Transportation: Port-Plant -0.050 -0.050 0.000 0.000 Crush -0.050 -0.050 0.000 0.000 Tariff -0.186 -0.186 0.000 0.000 Equalization Tax -0.031 0.000 0.000 0.000 NET SANTOS 0.154 0.585 0.870 0.870 Tendency to Supply No No Yes Yes
aAssumes business in drums; alternative business involving tank farms, Scholle bags (not frozen) and stainless steel containers would result in different costs. bStored frozen in drums; transported as liquid in tanker trucks to Northeast U.S., and transported frozen to Rotterdam and Toyohashi. cFOT stands for free on truck. dFOB and FOT prices include average storage costs in Florida. eFOT price does not include European/Asia tariff, and storage and crushing costs at destination. fAssumes 3.5 months storage in drums. gTransportation to Northeast U.S. by tanker truck; to Rotterdam and Toyohashi, in drums by ship. hNet of by-product values. iFDOC assessment and other fees.
xxxi
jStored and transported frozen in drums.

xxxii
Table 3. Relationships between Santos, Brazil and selected U.S. NFC orange-juice prices.a
Destination Supplier/
Price or Cost Component
Florida
Northeast U.S.
- - - - - - - $/gallon - - - - - - - BRAZIL
FOB Florida or FOT Europe/Asiab,c,d
1.350
1.750
Scholle Bag
-0.060
-0.060
Transportation: Plant-Santos
-0.080
-0.080
Transportation: Santos-Foreign Port
-0.300
-0.300
Transportation: Port-Plant
-0.050
-0.050
Tariff
-0.186
-0.186
Equalization Tax
-0.031
0.000
NET SANTOS
0.644
1.075
Tendency to Supply
No
Maybe
aAssumes business in Scholle bags (not frozen). bFOT stands for free on truck. cFOB and FOT prices include average storage costs in Florida. dFOT price does not include European/Asia tariff, and storage and crushing costs at destination.

xxxiii
Table 4. Cost of delivering FCOJ to Europe: Brazil-to-Florida-to-Europe delivery with duty drawback.
Cost Component
Tanker Ship
Drums
- - - $/pound solids - - -
Santos Price
0.660
0.660
Transportation: Santos-Florida Port/Rotterdama
0.070
0.070
Transportation: Florida Port-Florida Plantb
0.020
0.020
Equalization Tax
0.030
0.030
U.S. Tariff
0.315
0.315
Drawbackc
-0.312
-0.312
Transportation: Florida Port-Florida Plantb
0.020
0.020
Transportation: Florida-Europed
0.070
0.130
TOTAL COST
0.873
0.933
aTransportation by tanker ship. bTransportation from Florida port to Florida plant plus insurance. cDrawback is 99% of U.S. tariff. dTransportation by tanker ship/drum.

xxxiv
Table 5. Prices and cost of delivering FCOJ to Europe: Brazil-to-Florida-to-Europe delivery with duty drawback versus Brazil-to-Europe delivery.
Price or
Cost Component
Santos-to- Florida-to- Rotterdam
Santos-to- Rotterdam
- - - - - - - - - - $/PS - - - - - - - - - -
FOT Rotterdama
0.700
0.700
Transportation: Santos-Florida Port/Rotterdamb
-0.070
-0.070
Transportation: Florida Port-Florida Plantc
-0.020
0.000
Equalization Tax
-0.030
0.000
U.S. Tariff
-0.315
0.000
Duty Drawbackd
0.312
0.000
Transportation: Florida Port-Florida Plantc
-0.020
0.000
Transportation: Florida-Europeb
-0.070
0.000
NET SANTOS
0.487
0.630
aFOT stands for free on truck; European tariff not included in price. bTransportation by tanker ship. cTransportation from Florida port to Florida plant plus insurance. dDuty drawback is 99% of U.S. tariff.

xxxv
Table 6. Prices and costs of delivering FCOJ to alternative markets: Standard Grade A product, with 93 Score.
Destination
Tank Farm
Supplier/ Price or Cost Component
Florida
NE U.S.
Rotterdam
Toyohashi
- - - - - - - - -- - - - $/PS - - - - - - - - - - - -
FLORIDA
FOB Florida or FOT Europe/Asiaa
0.800
0.840
0.525
0.555
Drawback
0.000
0.000
0.312
0.312
Transportation: Florida Port-Florida Plantb
0.000
0.000
-0.020
-0.020
Transportationc
0.000
-0.040
-0.070
-0.100
NET FLORIDA PLANT
0.800
0.800
0.747
0.747
Tendency to Supply
Yes
Yes
No
No
Processing Costd
-0.171
-0.171
Miscellaneous Feese
-0.040
-0.040
FRUIT PRICE: DELIVERED-IN
0.589
0.589
BRAZIL
FOB Florida or FOT Europe/Asiaa
0.800
0.840
0.525
0.555
Tariff
-0.315
-0.315
0.000
0.000
Equalization Tax
-0.030
0.000
0.000
0.000
Transportation: Santos-Foreign Portf
-0.070
-0.070
-0.070
-0.100
Transportation: Florida Port-Florida Plantb
-0.020
0.000
0.000
0.000
NET SANTOS
0.365
0.455
0.455
0.455
Tendency to Supply
No
Yes
Yes
Yes
aFOT stands for free on truck; European/Asia tariff not included in price. bTransportation from Florida port to Florida plant plus insurance. cTransportation to Northeast U.S. by tanker truck; to Rotterdam and Toyohashi by tanker ship. dNet of by-product values. eFDOC assessment and other fees. fTransportation by tanker ship.
xxxvi
Table 7. Prices and costs of delivering FCOJ to alternative markets: Standard Grade A product, with 93 Score, under alternative demand conditions.
Destination
Tank Farm
Supplier/ Price or Cost Component
Florida
NE U.S.
Rotterdam
Toyohashi
- - - - - - - - -- - - - $/PS - - - - - - - - - - - -
FLORIDA
FOB Florida or FOT Europe/Asiaa
0.850
0.750
0.485
0.515
Drawback
0.000
0.000
0.312
0.312
Transportation: Florida Port-Florida Plantb
0.000
0.000
-0.020
-0.020
Transportationc
0.000
-0.040
-0.070
-0.100
NET FLORIDA PLANT
0.850
0.710
0.707
0.707
Tendency to Supply
Yes
No
No
No
Processing Costd
-0.171
-0.171
Miscellaneous Feese
-0.040
-0.040
FRUIT PRICE: DELIVERED-IN
0.639
0.499
BRAZIL
FOB Florida or FOT Europe/Asiaa
0.850
0.750
0.485
0.515
Tariff
-0.315
-0.315
0.000
0.000
Equalization Tax
-0.030
0.000
0.000
0.000
Transportation: Santos-Foreign Portf
-0.070
-0.070
-0.070
-0.100
Transportation: Florida Port-Florida Plantb
-0.020
0.000
0.000
0.000
NET SANTOS
0.415
0.365
0.415
0.415
Tendency to Supply
Yes
No
Yes
Yes
aFOT stands for free on truck; European/Asia tariff not included in price. bTransportation from Florida port to Florida plant plus insurance. cTransportation to Northeast U.S. by tanker truck; to Rotterdam and Toyohashi by tanker ship. dNet of by-product values. eFDOC assessment and other fees. fTransportation by tanker ship.

xxxvii
Table 8. Prices and costs of delivering Standard Grade A, 96 Score FCOJ to alternative markets.
Destination
Tank Farm
Supplier/ Price or Cost Component
Florida
NE U.S.
Rotterdam
Toyohashi
- - - - - - - - -- - - - $/PS - - - - - - - - - - - -
FLORIDA
FOB Florida or FOT Europe/Asiaa
0.950
0.990
0.728
0.758
Drawback
0.000
0.000
0.312
0.312
Transportation: Florida Port-Florida Plantb
0.000
0.000
-0.020
-0.020
Transportationc
0.000
-0.040
-0.070
-0.100
NET FLORIDA PLANT
0.950
0.950
0.950
0.950
Tendency to Supply
Yes
Yes
Yes
Yes
Processing Costd
-0.171
-0.171
-0.171
-0.171
Miscellaneous Feese
-0.040
-0.040
-0.040
-0.040
FRUIT PRICE: DELIVERED-IN
0.739
0.739
0.739
0.739
BRAZIL
FOB Florida or FOT Europe/Asiaa
0.950
0.990
0.728
0.758
Tariff
-0.315
-0.315
0.000
0.000
Equalization Tax
-0.030
0.000
0.000
0.000
Transportation: Santos-Foreign Portf
-0.070
-0.070
-0.070
-0.100
Transportation: Florida Port-Florida Plantb
-0.020
0.000
0.000
0.000
NET SANTOS
0.515
0.605
0.658
0.658
Tendency to Supply
No
No
Yes
Yes
aFOT stands for free on truck; European/Asia tariff not included in price. bTransportation from Florida port to Florida plant plus insurance. cTransportation to Northeast U.S. by tanker truck; to Rotterdam and Toyohashi by tanker ship. dNet of by-product values. eFDOC assessment and other fees. fTransportation by tanker ship.

xxxviii
0.00%
5.00%
10.00%
15.00%
20.00%
25.00%
14.74% 22.40% 23.12% 21.58% 19.30%Season
Shar
e
1991-92 1992-93 1993-94 1994-95 1995-96Share
Exhibit 1. FDOC Tax Paid Processed Oranges From Florida Fruit Aggreagte Share for Cargill, Minute Maid and Winter Garden
0.00%
10.00%
20.00%
30.00%
40.00%
22.19% 21.61% 35.25% 24.63% 26.59%Season
Shar
e
1991-92 1992-93 1993-94 1994-95 1995-96Share
Exhibit 2. FDOC Tax Paid Orange Juice ImportsAggreagte Share for Cargill, Minute Maid and Winter Garden

xxxix
0.00%
10.00%
20.00%
30.00%
16.48% 22.27% 25.31% 22.00% 19.99%Season
Shar
e
1991-92 1992-93 1993-94 1994-95 1995-96Share
Exhibit 3. FDOC Tax Paid Proc. Oranges From Florida Fruit and ImportsAggreagte Cargill, Minute Maid and Winter Garden
0
50
100
150
200
250
127.783 173.167 163.373 198.353 193.17438.765 34.893 35.913 32.112 20.262
Season
Milli
on B
oxes
1991-92 1992-93 1993-94 1994-95 1995-96FloridaImports
Exhibit 4. FDOC Tax Paid Processed Orange BoxesFlorida-Grown Versus Imports

xl
0.00%
20.00%
40.00%
60.00%
80.00%
100.00%
76.72% 83.23% 81.98% 86.07% 90.51%23.28% 16.77% 18.02% 13.93% 9.49%
Season
Perc
ent
1991-92 1992-93 1993-94 1994-95 1995-96FloridaImports
Exhibit 5. FDOC Tax Paid Processed Orange SharesFlorida-Grown Versus Imports
0
500
1000
1500
2000
Season
Milli
on S
SE G
allo
ns
1974-75 1980-81 1986-87 1992-93 1998-99 2004-05
Actual
Forecast
Exhibit 6. Florida Orange-Juice Production

xli
1000
1500
2000
2500
3000
3500
0.5
1
1.5
2
2.5
Season
Milli
on S
SE G
allo
ns
1982-831983-84
1984-851985-86
1986-871987-88
1988-891989-90
1990-911991-92
1992-931993-94
Production
Price
Price/CPI
Exhibit 7. Aggregate Florida & Brazil OJ ProductionVersus Florida Bulk FCOJ Price
0
200
400
600
800
Season
Milli
on S
SE G
allo
ns
1974-75 1977-78 1980-81 1983-84 1986-87 1989-90 1992-93 1995-96
Imports
Exports
Exhibit 8. Florida OJ Imports Versus Exports

xlii
0
0.2
0.4
0.6
0.8
1
1.2
0.34 0.14 0.32 0.17 0.00 0.00 0.03 1.000.23 0.11 0.15 0.15 0.09 0.31 0.03 1.08
Item
$/P
S
Grower Capital Pick&Haul Process. Transport. Tariff FL. Tax Tot. FOBFloridaBrazil
Exhibit 9. Florida Vs. Brazil Cost of FCOJ
6
8
10
12
14
3
4
5
6
7
8
9.14 10.21 8.65 9.60 10.91 11.87 13.35 11.27 10.76 9.05 8.10 7.48 7.468.63 8.48 8.47 8.79 10.55 11.80 12.20 10.77 10.25 8.80 7.82 7.25 6.775.75 7.10 3.94 5.22 7.58 7.41 6.21 5.89 5.93 3.48 4.09 3.56 4.63
Year
$100
0/A
cre
$/Bo
x
1984 1985 1986 1987 1988 1989 1990 1991 1992 1993 1994 1995 1996SouthCentralOn-Tree
Exhibit 10. South and Central Florida Mature Orange Land Values Versus Orange On-Tree PricesSource: John Reynolds et al., U. of Fl., Food & Resource Econ. Dept.

xliii
60
80
100
120
140
Week Ending
Cent
s/Po
und
Solid
s
931203 940520 941104 950421 951006 960322 960906 970221
Futures
Fruit
Exhibit 11. FCOJ Nearby Futures Average Price Versus FCPAAverage Final and Intermediate Price for Oranges Used in FCOJ