Embed Size (px)
Citation preview

1
Flood modeling can make a difference: Disaster risk-reduction and
resilience-building in urban areas
Jorge A. Ramirez1, Umamaheshwaran Rajasekar2, Dhruvesh P. Patel3, Tom J. Coulthard4, Margreth
Keiler1
1University of Bern, Institute of Geography, Bern, Switzerland 5 2TARU Leading Edge Pvt. Ltd., New Delhi, India 3School of Technology, Pandit Deendayal Petroleum University, Gujarat, India 4School of Environmental Sciences, University of Hull, Hull, United Kingdom
Correspondence to: Jorge A. Ramirez ([email protected])
Abstract. Surat, India is a coastal city with a population of approximately 4.5 million people that lies on the banks of the river 10
Tapi and is located 100 km downstream from the Ukai dam. Given Surat’s geographic location the city is repeatedly exposed
to flooding caused by large emergency dam releases into the Tapi river combined with high tide water levels. Flood events of
this type occur twice a decade, but their frequency and magnitude may increase due to the urbanization, encroachment in flood
plain and climate change. A first step towards strengthening resilience in Surat requires a robust method for mapping flood
exposure at fine spatial resolution. Here, in this study we have developed such a method for Surat using a reduced-complexity 15
hydrodynamic model to simulate flooding, but is easily transferable to other urban locations. Our method features three distinct
phases that involve: 1) modelling dam release discharge from the Ukai dam arriving at Surat, 2) modelling flooding within
Surat caused by the combination of dam release and tides, and, 3) identifying Surat critical infrastructure, population, and
income groups exposed to flooding. Our flood model of Surat utilizes topography produced using elevation data collected from
an extensive survey. Within the city we have modelled flood scenarios that represent the uncertainty in flood peak discharge 20
and duration resulting from possible climate change. These scenarios include catastrophic conditions that flood 50% of the
city and expose > 60% of the population and critical infrastructure to deep flooding. Finally, we highlight how our modelling
has contributed to changes in flood risk management within the city following a major flood and resulted in actions that have
increased community resilience to flood hazard.
1 Introduction 25
Recent efforts in hydrology have highlighted the need to consider the impact that society has on flooding (Baldassarre et al.,
2013; Di Baldassarre et al., 2015). Of importance is determining the combination of physical processes and human dynamics
that create conditions leading to flood disasters and increased human exposure to flooding. Physical processes can include
long-term climatic changes that increase the occurrence of short-term extreme precipitation events triggering flash floods
within rivers. Likewise changes in population, land use, and economics can encourage settlements within floodplains and 30
Hydrol. Earth Syst. Sci. Discuss., doi:10.5194/hess-2016-544, 2016Manuscript under review for journal Hydrol. Earth Syst. Sci.Published: 18 November 2016c© Author(s) 2016. CC-BY 3.0 License.

2
subsequently create the need for flood protection measures (e.g. dams, levees, canals) that significantly alter river processes
(Wohl et al., 2015). Globally these societal pressures are most apparent in urban areas that are undergoing rapid development
(Seto et al., 2011) and an expected 60% increase in population (4 to 6 billion) by 2050 (United Nations, 2015). This projected
urban expansion will mostly occur in Asia, specifically in locations with dense populations and low topography susceptible to
flooding (Güneralp et al., 2015; Jongman et al., 2012). For these reasons there is an urgent need to estimate flood exposure in 5
Asian urban cities as well as translate these estimates into actions to reduce exposure and disaster risk to urban inhabitants and
critical infrastructure.
One method to estimate flood exposure are computer models that generate predictions of flood inundation that can be spatially
overlaid on maps of population, critical infrastructure, and income groups. For example, recent advances in reduced-10
complexity flood models (Bates et al., 2010; Coulthard et al., 2013a) with simplified physics have shown promise in estimating
flood depths, extent and velocity in urban areas (Fewtrell et al., 2011; Ramirez et al., 2016; Sampson et al., 2014). These
models are particularly suited for data sparse locations, with large spatial extents (> 500 km2), and urban topography
represented by fine spatial resolution (≤ 30 m) digital elevation models (DEMs). Moreover, open source software and the low
computational overhead needed for such reduced-complexity modelling facilitates the generation of multiple model runs that 15
produce flood maps representing ensemble simulations of various flood scenarios. As such, flood exposure estimated with
reduced-complexity models can explore uncertainty stemming from environmental forcings that result in various flood return
periods and duration. Herein we use a freely available, reduced-complexity flood model to estimate flood exposure for the first
time in a large, densely populated city in northwest India where human intervention (e.g. dam and levee construction) and
demands on the hydrological cycle (e.g. water for irrigation) has contributed towards multiple catastrophic floods. Like many 20
urban areas, flood mapping and exposure assessment in our study site is challenged by the scarcity of available data, in this
paper methods to gather such data and forecast flood inundation using open-source software are presented. An important part
of this research is how results from our model have directly motivated changes in the way local authorities are preventing
future floods and increasing the resilience of the city.
2 Data and methods 25
2.1 Study site
In India, the National Disaster Management Authority has provided guidelines that specify that all cities prone to flood have
a detailed flood preparedness plan prepared at the ward level (city administrative unit). These efforts are intended to “minimise
vulnerability to floods and consequent loss of lives, livelihood systems, property and damage to infrastructure and public
utilities” (National Disaster Management Authority, 2008). Recent enforcement has led cities to compile a database of resource 30
inventory which includes tools and equipment needed for response post flooding. Surat, is one of these cities, and is located in
the northwest of India near the Arabian Sea and is a major port, industrial, and commercial center (Fig. 1c). Surat is the seventh
Hydrol. Earth Syst. Sci. Discuss., doi:10.5194/hess-2016-544, 2016Manuscript under review for journal Hydrol. Earth Syst. Sci.Published: 18 November 2016c© Author(s) 2016. CC-BY 3.0 License.

3
largest city in India with an area of 325,000 km2 and a population of 4.5 million. From 1990-2014 the city underwent
considerable urban development within the Tapi river floodplain that resulted in a 170% increase in urban land cover (Misra
and Balaji, 2015). Upstream from Surat the Tapi river has an approximate length of 634 km up to the origin and a catchment
area of 62,000 km2 (Fig. 1a). The catchment lies within a highly variable rainfall zone where 90% of the annual rainfall is
received during the monsoon months (June to October) and an average annual rainfall of 830 mm (Kale and Hire, 2004). In 5
order to address the problem of flooding in Surat, storing water for summer irrigational needs, and hydropower the government
of India constructed the Ukai dam on the river Tapi in 1971 (Fig. 1b). The multi-purpose nature of the dam forces the irrigation
authorities to conserve water to the maximum allowable capacity of the reservoir during the monsoon. Thus, any extreme
rainfall experienced at the end of the monsoon leads to unplanned releases of water from the reservoir that may cause flooding
100 km downstream within Surat. As such, since the construction of the dam floods in Surat are socio-natural hazards 10
(Birkmann et al., 2013) because flood events are caused by the combination of natural phenomena (e.g. rainfall) and man-
made causes (e.g. dam mismanagement). Over the past half century the city has experienced on average two floods per decade
that were caused by dam releases. This includes catastrophic flood in the years of 1994, 1998 and 2006. The most recent flood
in August 2006 was the result of intense rainfall in the Tapi catchment that led to a 15 day dam release with a peak discharge
near 25,000 m3 s-1 (avg. discharge= 9,300 m3 s-1, low flow = 640 m3 s-1). During this catastrophic flood 75% of the city was 15
flooded, an estimated 40% of the city inhabitants received no warning about the dam release, human deaths totalled 300 and
damages exceeded 3 billion USD (Bhat et al., 2013; Patel and Srivastava, 2013). Since 2006 embankments alongside the river
have been raised and no major floods have occurred, but the effectiveness of these embankments is questionable because future
climate change within the Tapi basin during the monsoon season is expected to have a 30% increase in rainfall (Mishra and
Lilhare, 2016) and increased occurrence of extreme rainfall events (200-350 mm/day) (Bhat et al., 2013; Deshpande et al., 20
2016). These climatic changes may result in a 75% increase stream flow for the Tapi river (Mishra and Lilhare, 2016) and
subsequently result in unprecedented emergency dam releases that produce flooding in Surat. Although climate change will
be a major driver of future flooding in Surat, likewise urban flood risk will also be strongly dependent on the increase of urban
expansion in the city stemming from socio-economic changes (Güneralp et al., 2015). Foreseeing future flood disasters,
activities have been developed by the Surat Municipal Corporation and a commissioner that supervises flood management 25
activities with the support from ward level engineers. One effort enacted in Surat to prepare for flooding was the production
of flood maps that did not previously exist for the city wards. In the next section we present flood simulations that were
commissioned to understand the extent and magnitude of impact of different quantity of water released from the dam.
2.2 Modelling
Our modelling of flood in Surat featured two distinct hydrodynamic modelling stages. In stage one, we modelled dam release 30
from the Ukai dam and the flow of water within the Tapi to the eastern boundary of Surat. Afterwards, the second stage of
modelling used the outputs from stage one to drive a flood model of Surat that also included tidal effects on the river. In both
modelling stages CAESAR-Lisflood models were used. CAESAR-Lisflood model is the outcome of merging the CAESAR
Hydrol. Earth Syst. Sci. Discuss., doi:10.5194/hess-2016-544, 2016Manuscript under review for journal Hydrol. Earth Syst. Sci.Published: 18 November 2016c© Author(s) 2016. CC-BY 3.0 License.
4
landscape evolution model (Coulthard et al., 2013a) with the latest model version of Lisflood-FP (Bates et al., 2010).
CAESAR-Lisflood is a storage cell model, where a DEM represents the landscape and water is stored at the raster cell
locations. Water is routed over the landscape in two dimensions (2D) from raster cell to cell using a simplification of the
shallow water equations (Bates et al., 2010). CAESAR-Lisflood is open source, has low computational demands, low data
requirements and has been used to replicate fluvial (Coulthard et al., 2013a, 2013b) and storm surge (Ramirez et al., 2016; 5
Skinner et al., 2015) flooding. The model operates on inexpensive PC hardware, is parallelised to utilise multiple processor
cores and is driven by a GUI front end making model set up and operation simpler. These model characterises make CAESAR-
Lisflood ideally suited for exploring the uncertainty in dam releases resulting from future climatic changes within the Tapi
basin. We have developed dam release scenarios with different flood peak discharge and duration and estimate the resulting
flood exposure within Surat. 10
For the first stage of modelling we developed a CAESAR-Lisflood hydrodynamic model at a spatial resolution of 30 m cell
size (2.2 million raster cells), of the Tapi river from the Ukai dam to Surat (Fig. 1b). This DEM contains 79 km of the river
length and nearly 15 km of floodplain on either side of the river. The hydrodynamic model uses topographic information
collected by the Shuttle Radar Topography Mission (SRTM) between February 11-22, 2000 (Jarvis et al., 2008). During this 15
time the Tapi river was under low flow conditions (mean discharge = 129 m3 s-1) and the imaged river reach elevation values
downstream from the Kakrapar weir sufficiently characterized the river channel (Fig. 1b). River channel elevation values
upstream from the Kakrapar weir to the Ukai dam contained the elevation of the water level behind the weir. To better represent
the river bed these elevations were replaced with values that were calculated using the bed slope (m = 0.0006) of the river
downstream from the weir. Vegetation heights in the SRTM DEM can affect flood model results (Baugh et al., 2013; Wilson 20
et al., 2007) but a ‘Bare-Earth’ SRTM DEM at 30 m resolution does not exist. Using a 90 m spatial resolution ‘Bare-Earth’
SRTM DEM (O’Loughlin et al., 2016) and the original 90 m SRTM DEM we estimated the mean vegetation height of our
DEM was 1.3 m. We concluded that vegetation effects would be minimal at our site and chose not to correct the DEM for
these artefacts.
25
The flow of water between raster cells in CAESAR-Lisflood requires a roughness coefficient per cell (Manning’s n) to
represent landscape resistance. Throughout the river floodplain a 30 m spatial resolution land cover map (Yu et al., 2013) was
acquired and roughness coefficients were applied to each land use class using values reported in Alfieri et al. (2014). Channel
roughness was determined by calibrating the model using the September 22-26, 2013 Ukai dam release (Fig. 2a) that produced
minimal amounts of flooding in Surat. For the calibration the modelled reach was extended 22 km downstream to the nearest 30
gauging station which is not affected by tides (Singanpur weir (Fig. 1c)). Channel roughness values representing the sandy
bed of the Tapi (Kale and Hire, 2004) were trialled (Manning’s n = 0.01, 0.02, 0.03 (Fisher and Dawson, 2003)) and the
observed hydrograph recorded at the weir was reasonably replicated by the model using a channel roughness of 0.02 (Fig. 2a).
Hydrol. Earth Syst. Sci. Discuss., doi:10.5194/hess-2016-544, 2016Manuscript under review for journal Hydrol. Earth Syst. Sci.Published: 18 November 2016c© Author(s) 2016. CC-BY 3.0 License.
5
Using this channel roughness the root mean squared error between observed and modelled water levels at the weir was 0.39
m.
Synthetic Ukai dam outflows were based on the outflow of August 4-12, 2006 that produced catastrophic flooding in Surat. A
nonlinear regression was performed on this dam outflow time series to produce an idealized dam outflow at 10 min time steps 5
(Fig. 2b). Multiplication factors were applied to the idealized dam outflow to produce synthetic dam outflows with all
combinations of outflow durations (2, 3, 4, 5, 6 days) and estimated return periods (5, 10, 25, 50, 100, 250 year) for the Tapi
river (Rakhecha and Clark, 2002) (Fig. 2b). A total of 30 dam outflow scenarios were produced with each scenario consisting
of two days of base flow (2000 m3 s-1) to develop initial hydraulic conditions, followed by a period of dam release, and
concluding with two days of base flow. For each scenario discharge arriving near Surat (western edge of the DEM) was 10
collected every 10 minutes to produce a hydrograph that served as input into the second stage of modelling.
For the second stage of modelling a separate CAESAR-Lisflood hydrodynamic model was developed to estimate flooding
within Surat. An accurate flood assessment of Surat required a representation of the bare earth that did not include the elevation
of urban infrastructure and vegetation heights. A high resolution DEM (e.g LIDAR quality) did not exist for the city so 15
topographic data of the city was produced by undertaking an elevation survey of Surat using a differential global positioning
system (DGPS). The city was intensively surveyed to acquire point elevations of hydrologically important topographic features
that included streets, depressions, peaks, and river embankments. In total 6,219 point elevations were acquired during this
ground survey with a horizontal accuracy of ± 30 cm and vertical accuracy of ± 30 cm. Additionally, 172 river bed cross-
sections were obtained from the irrigation department to represent the river bed elevations. Outside of the city limits, where 20
the survey was not preformed, elevation information was obtained from a 30 m SRTM DEM and converted into point vector
GIS (Geographic Information System) format. Using DigitalGlobe high-resolution imagery (30 cm pixel size) locations
surveyed consisting of bare ground or roads were used to determine the elevation difference between SRTM and survey data
locations (n = 48). This vertical offset was applied to the survey data and transformed all the survey elevation values into the
SRTM vertical datum (EGM96). Survey points, river cross-sections and the surrounding SRTM values were interpolated 25
together using the ordinary kriging method (ESRI ArcMap 9.3) to produce a high resolution DEM (30 m) of Surat, surrounding
peri-urban areas and the Tapi river bed (~1 million raster cells) (Fig. 1c). Overall this DEM encompasses an area of 835 km2
and contains 45 km of the Tapi river commencing near the eastern boundary of Surat and ending in the Arabian Sea. Channel
roughness of the first modelling stage was also used in the hydrodynamic models of Surat (n = 0.02). We chose to represent
Surat’s urban-fabric and the peri-urban areas with roughness values based on land cover classes (Alfieri et al., 2014) from a 30
30 m spatial resolution land cover map (Yu et al., 2013). Ideally we would have calibrated the roughness of the city and
floodplain by replicating an observed flood extent, but this data does not exist for the DEM we have developed because
embankments within the city have been raised and a major flood has not occurred since the construction of these embankments.
Hydrol. Earth Syst. Sci. Discuss., doi:10.5194/hess-2016-544, 2016Manuscript under review for journal Hydrol. Earth Syst. Sci.Published: 18 November 2016c© Author(s) 2016. CC-BY 3.0 License.

6
Flood models of Surat were driven by 10 min temporal resolution discharge from the output from the first stage of modelling
and this discharge was added to the upstream end of the Surat reach (Fig. 1c). Additionally, the effect of tides on the river was
simultaneously modelled in all Surat flood simulations. Tidal fluctuations at Surat were modelled using the WebTide tidal
prediction model (Dupont et al., 2002) that produces tidal heights for a particular time period using tidal harmonic constants
of major tidal constituents pre-calculated from a tidal ocean model. Tidal predictions of 5 min temporal resolution for Surat 5
were calculated with WebTide for the years between 2010-2015 and monsoon months when emergency dam releases are more
likely to occur (August, September and October). From this time series a subset spanning 240 hrs (10 days) was extracted
containing the maximum high tide of 3.1 m and a maximum tidal range of 5.9 m. Tidal fluctuations were reproduced in the
model by gradually raising and lowering water levels at two nearshore locations west of Surat (Fig. 1c) and this produced a
tide that advanced upstream the lower portion of the Tapi river. For each flood model maximum high tide coincided with peak 10
discharge arriving at Surat and the combination of these factors produced worst-case flood conditions for the city. Each Surat
flood model was set up using the same parameterization and tidal inputs, but the upstream dam release inputs were different.
Model output per flood scenario consisted of a map of maximum flood water depths at each DEM location and this map also
delineated the maximum flood extent for each flood scenario. Preliminary model flood maps were approved by municipality
flood experts, and this served as qualitative validation of the flood model extents and water depths. 15
In our study flood exposure was defined as the extent to which critical infrastructure, people, and income groups are
geographically located in areas prone to deep flooding (≥ 0.75 m). We chose to analyse flood exposure at these depths because
they result in extreme conditions that are threatening to life (waist deep water) and property (ground floor inundation) (World
Bank, 2011). Geographically our analysis of flood exposure included Surat and locations beyond the city limits. Herein we 20
made a distinction between critical infrastructure that is related to transport and rescue/intervention and both datasets were
analysed separately. Main roads and railroads comprised transport infrastructure, whilst fire stations, police stations, hospitals,
and water tanks were regarded as rescue/intervention infrastructure (Fig. 3a). Locations of rescue/intervention infrastructure
were mapped through questionnaire based field surveys using a global positioning system, whilst transport infrastructure was
obtained from existing maps. Exposure to people was made using a map of spatially distributed population estimates from 25
2015 (Fig. 3b) at the spatial resolution of 100 m2 (Gaughan et al., 2013). Lastly, we investigated the relationship between flood
exposure and monetary income using a map of neighbourhoods with different income levels (Fig. 3c). Income groups were
mapped through a detailed physical survey which was conducted over 100 transects across the city and questionnaire based
survey conducted across 400 households along these transects to capture their capacity and vulnerability information. A geo-
location and building typology based association technique was used to spatially identify areas which are similar to the 100 30
transects based on their proximity to the surveyed sample and physical characteristics. Land use polygons within the
neighbourhood having similar characteristics were assigned similar rankings. Flood exposure analysis was performed using
the modelled Surat maximum water depth maps resulting from each of the 30 dam release scenarios with different return
Hydrol. Earth Syst. Sci. Discuss., doi:10.5194/hess-2016-544, 2016Manuscript under review for journal Hydrol. Earth Syst. Sci.Published: 18 November 2016c© Author(s) 2016. CC-BY 3.0 License.

7
periods and flood duration. These flood maps were spatially overlaid on the maps of critical infrastructure, population and
income group, and the percentage of each metric at each location with inundation ≥ 0.75 m was calculated.
A disaster management cycle for flood hazard summarizes processes and actions taken by government, businesses and the
community to reduce the consequences of flooding. Disaster management cycles include phases for mitigation, preparedness, 5
response, and recovery (Keiler et al., 2010; Vasilescu et al., 2008). Mitigation minimizes the effect of flooding and may include
raising community awareness about floods or constructing flood protection measures. Preparedness involves the development
of plans to respond to flooding and may include the implementation and operation of a flood early warning system. The
response phase encompasses actions taken after a flood event to reduce the effects of flooding on the community and consists
of rescue efforts and the delivery of aid. A recovery phase is an extended period after the event where the community rebuilds. 10
We use this disaster management cycle to identify phases where our modelling has made tangible contributions to flood risk
reduction and resilience building after the 2006 Surat flood.
3 Results
Figure 4 are dam outflows and the resulting city flood hydrographs produced by the dam outflow model (model stage 1). In
all of the simulations a quantity of the dam outflow was lost to the topographically flat, expansive, floodplain between the 15
Ukai dam and Surat and this attenuated/distorted the rising limb of the resulting flood hydrograph. Overall this section of river
acted as a buffer or store that reduced the amount of water arriving in the city by 1-4%. The buffering capacity of the floodplain
was greatest when dam out flows were high and of long duration, and these conditions resulted in extensive amounts of flooding
on either side of the river. An important result from the modelled dam outflow was the duration of time required for the flood
to crest the embankments after a dam release. Embankments in the city were constructed to contain floods of 17,000 m3 s-1 and 20
it was assumed that discharge greater than this would produce flooding within the city. Using this flood threshold, on average
all modelled dam releases flooded the city between 10-14 hrs (average = 11 hrs). This information provides the minimum
amount of flood warning that can be given to the city inhabitants after a dam release has been performed. Furthermore, all
model runs indicated that after maximum dam outflow between 14-33 hrs (average = 26 hrs) elapsed before maximal discharge
conditions occurred near Surat. This time lag was greatest for dam release scenarios with combined long durations and high 25
peak discharges.
Figure 5 are maps produced by the city flood model (model stage 2) and represent maximum flood depths and spatial extents
for a subset of the flood scenarios. Here it can be determined that changes in flood return period (Fig. 5 a,d,g) caused greater
amounts of flooding (extent and depths) than increases in flood duration (Fig. 5 g,h,i). It is apparent that the city levees are 30
effective at preventing flooding at the lowest return period (1:5 yr), but limited amounts of flooding still occurred in the west
part of the city (Fig. 5 g,h,i). Levees are less effective at containing floodwaters at return periods ≥ 50 yrs, with extensive
Hydrol. Earth Syst. Sci. Discuss., doi:10.5194/hess-2016-544, 2016Manuscript under review for journal Hydrol. Earth Syst. Sci.Published: 18 November 2016c© Author(s) 2016. CC-BY 3.0 License.
8
amounts of flooding in the city and peri-urban area. The worst case scenario of a 1:250 yr flood lasting six days resulted in
50% of the study being flooded (Fig. 5c) and nearly all of the flood depths were considered deep (≥ 0.75 m). Large flood
extents and deep water depths do not always translate in to high levels of exposure unless flooding spatially coincides with
critical infrastructure and residential locations. Figure 6 illustrates that an overall increase in flood return period results in
greater exposure than increases in flood duration. For each sector analysed exposure continues to be elevated (28-48%) for a 5
flood equivalent to the catastrophic 2006 flood event (1:25 yr return period, 5 day duration), regardless of the construction of
new embankments. Specifically, reoccurrence of the 2006 event would flood (water depths ≥ 0.75 m) 29% of the city’s
population (~713,000 people), 29% of the transportation network, and 37% of the hospitals, police/fire stations, and water
tanks. Rare, but plausible, extreme events (1:250 yr return period, flood duration of 6 days) shockingly inundated 60% of the
population (~1.5 million people), 60% of the rescue/intervention, and 60% of the transportation network. Unexpectedly, the 10
newly constructed flood protection does not eliminate flooding and exposure from low return period events (1:5 yr, 2-4 days
duration). For example, the smallest flood modelled (1:5 yr, 2 day duration) can potentially expose ~ 100,000 people to deep
flooding. Regarding exposure and income level (Fig. 6 d,e,f), model results suggested that low income communities are less
exposed than, moderate and high income communities.
15
Using the disaster management cycle (mitigation, preparedness, response, and recovery) our flood maps and exposure
assessment contributed to several phases reducing flood risk reduction in Surat. Within the mitigation phase our flood maps
and exposure assessment have contributed to the reduction of the impact of flooding by instigating changes within the
operational protocols of the urban local body and attitudinal change amongst the citizens especially the vulnerable population.
The floods maps are currently being used to strengthen the city disaster management plan and resource allocation during 20
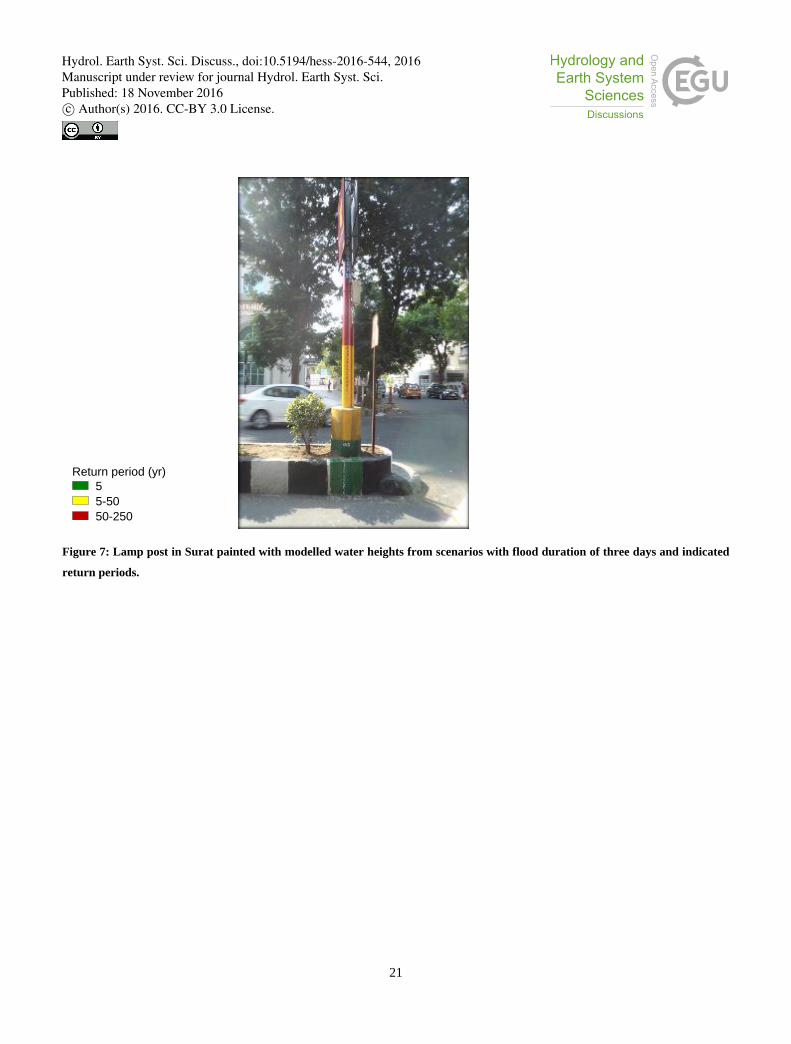
monsoon preparedness. The results from the flood model were also used for demarcating possible flood depths on public lamp
posts across the city (Fig. 7). The demarcation raised awareness of flooding by providing information to people on the extent
of inundation for specific quantities and durations of water released from the dam. This flood depth information is particularly
important to Surat’s immigrants, which comprises the majority of the population. Between 2001 and 2011 the city’s population
increased by over 70% (India, 2011) due to pull migration, where people come to the city from both within the state of Gujarat 25
and from other states such as Bihar and Odisha in search of employment. Many of these immigrants who come to the city
choose residences in areas which are more vulnerable to flooding. Such choice is usually influenced by the cost and rarely is
information on flood levels at these locations available. The painting of lamp posts throughout the city with potential flood
heights from the model provides dual benefits to the citizens. Firstly, migrants and visitors to the city will be aware of areas
which are prone to the floods. Thereby they will make informed decisions while choosing their place of residence. Since the 30
implementation of the painted lamp posts this has already started impacting the real estate within the city. Many people now
are re-considering their choice to invest in buildings which are highly vulnerable to the floods. Secondly, the marking also act
as communication posts during an event. The markings help people internalize the technical information which are
disseminated during the event by the different government agencies. For example, if a dam release occurs for a specific return
Hydrol. Earth Syst. Sci. Discuss., doi:10.5194/hess-2016-544, 2016Manuscript under review for journal Hydrol. Earth Syst. Sci.Published: 18 November 2016c© Author(s) 2016. CC-BY 3.0 License.
9
period, any resident can look at the lamp post near their residence and get information on the extent of inundation which is
likely to occur in the surroundings. Contextualized information provided to different communities across the city will not only
help citizens prepare for the flood hazard but will also help others in low risk zones to remain calm. This leads to less city wide
panic, reduced traffic congestion and reduced social unrest before the event. In addition to the painted lamp posts, flood maps
produced by the model are currently being used by Municipal Corporation engineers and their ward level representatives for 5
their monsoon preparedness activities which includes public awareness program on flood risk reduction.
Within the preparedness phase flood maps generated from the model are being used for preparing flood risk management
plans that include: 1) highlighting key locations for helicopters to drop food and medical supplies, 2) locate health care units
which may require evacuation in case of flooding, 3) identify buildings which are to be used as safe shelters, 4) determine 10
critical infrastructure that needs to be protected and 5) more importantly identification of vulnerable locations where there will
be a need for prioritized communication for evacuation. The flood maps are currently being used as a part of a larger End to
Early warning system which was established under the Asian Cities Climate Change Resilience Network (ACCCRN) and
currently being maintained by the Surat Municipal Corporation and Surat Climate Change Trust. Shortly after a dam release,
within the response phase, the exposure information will provide city officials with an overall estimate of population and 15
infrastructure that are likely to be affected by flooding. The depth of the flooding as modeled using multiple simulations will
help them in prioritizing their response actions. Usually high priority is given to slums (informal and formal settlements) where
the water depth will be more than 2 m. Also all other settlements including middle income and high income communities are
informed through public address system to initiate evacuation. Previously, there used be a city wide announcement of warning
and alerts followed by deployment of resources across all areas based on the administrative boundaries. With the help of the 20
flood maps, the city government can provide contextual warning and allocate their resources on select areas depending upon
the extent of the possible impact. Additionally modelled flood maps will be used to locate communities that require immediate
evacuation. During the recovery phase model output is not useful, instead resource allocation usually happens post field
investigation of actual damage.
4 Discussion 25
Our modelling approach used a 2D hydrodynamic model to estimate the quantity and velocity of water arriving at Surat and
represents an improvement over previous studies investigating flooding in Surat using one dimensional (1D) approaches
(Timbadiya et al., 2014a, 2014b). While 1D models can adequately predict water levels that are confined to a river channel, a
1D model’s performance deteriorates when water spreads onto the floodplain and flow becomes 2D. As such, our 2D
implementation provides an advantage over 1D models by better replicating the important process whereby flood wave 30
attenuation, loss of water, occurs from the dam to the city when water spreads onto the floodplain (Fig. 4). Further
improvements can be made to our models by including processes that replicate infiltration to the floodplain subsurface. In our
Hydrol. Earth Syst. Sci. Discuss., doi:10.5194/hess-2016-544, 2016Manuscript under review for journal Hydrol. Earth Syst. Sci.Published: 18 November 2016c© Author(s) 2016. CC-BY 3.0 License.
10
simulations flood discharge conveyed across the floodplain accounted for a loss of 1-4% of the water arriving in Surat, but
these values are more than likely conservative losses of water because infiltration was not modelled. As such greater flood
attenuation and less flooding in Surat could be attained with a model that accounts for infiltration occurring on the floodplain.
Regarding flow velocity, our model was able to replicate well the amount of time it takes for flooding to commence in Surat
after a major dam release (> 17,000 m3 s-1). For example, during the 2006 flood the dam release flood wave took approximately 5
10 hrs to arrive in Surat, and our model estimated 12 hrs for a dam release of similar peak discharge and duration.
Uncertainty in the flood maps produced by CAESAR-Lisflood could be traced back to error in data sources and model
processes. The principal source of uncertainty in CEASAR-Lisflood’s output is produced by error in the topographic data that
subsequently affects the flood wave movement. For example the smallest elevation error, obstruction, or artefact in the DEM 10
could divert water to locations that do not experience flooding. In our city flood model topographic error was minimized by
not using a DEM that contained land features (buildings and vegetation), but instead, a bare surface representation of the city
was developed from a high resolution ground survey. We find that this method of generating a bare surface DEM is effective
for urban environments where LIDAR quality topographic data is not available or feasible. Although the DEM created is of
superior quality (vertical and horizontal accuracy) than the commonly used 30 m SRTM DEM, more extensive surveying is 15
needed to achieve greater spatial resolution (< 10 m). Of particular importance is the need to accurately represent the city
embankments within the DEM and model output suggests that embankments were adequately represented in the DEM because
all city models do not commence breaching embankments until discharge exceeds the established flood warning level for the
city (~ 17,000 m3 s-1).
20
A secondary factor producing uncertainty in the city model output is error in surface friction values that were used to represent
the restriction of flow over land features. Although the finest spatial resolution (30 m) land cover data available was used to
infer surface friction values for Surat, it is possible that classification error in the land cover resulted in incorrect setting of
some surface friction values. Ideally channel roughness for this model would be calibrated, but observed flood extents and
water depths do not exist to calibrate the floodplain friction for the city. These data are not available because no major flood 25
has occurred since the construction of the embankments. Regardless, in order to partially account for the uncertainty in
floodplain friction and resulting spatial extent of flooding we present 30 possible dam release driven floods. Additional
uncertainty in model output can result from physical processes that are not developed within CAESAR-Lisflood. Several of
these processes include infiltration and storm drains. These additional model processes may reduce the amount of flooding
within the city, but their implementation would require significant model development (e.g. groundwater interactions) that is 30
beyond the scope of this study.
High levels of flood exposure at low return periods (1:10 yr) for rescue and intervention infrastructure can be explained by the
locations of hospitals and police stations which are proximate to the river channel (< 2 km) at locations where embankments
Hydrol. Earth Syst. Sci. Discuss., doi:10.5194/hess-2016-544, 2016Manuscript under review for journal Hydrol. Earth Syst. Sci.Published: 18 November 2016c© Author(s) 2016. CC-BY 3.0 License.
11
first breach and flood the city. Likewise high exposure of population with relatively small floods can be explained by higher
population densities (230 people/100 m2) near the breaching of levees within the core of the city. Our results suggest that low
income neighbourhoods have less exposure than high and middle income neighbourhoods. For example, low income groups
are highly exposed (> 40%) to deep flooding when dam releases approach return periods > 1:50 yr, while similar exposure is
experienced by high and middle income groups with return > 1:25 yr. Lower exposure to low income groups is explained by 5
the locations of these neighbourhoods in the floodplain which are distant to the channel in comparison to high and middle
income neighbourhoods. Although our assessment suggests that low income groups have lower exposure to deep flooding it
is important to highlight that these groups are most vulnerable to flood disasters. For example, in Surat few low income groups
have flood insurance and 75% of low income groups have employment that results in income instability after a flood disaster
due to damage to industry and disruption to production (Bhat et al., 2013; Jha et al., 2012). While our flood exposure 10
assessment takes into account potential changes in climate and resulting floods, the model does not consider socio-economic
changes (e.g. population dynamics, land use change) in Surat. As such the exposure results presented here are current estimates
of exposure and future exposure estimates will require model development that considers interactions between biophysical and
socio-economic factors (e.g. land use change) affecting flood exposure and vulnerability in urban areas.
15
The modelled flood maps are currently being used by the urban local body within their monsoon preparedness activities and
city disaster management plan. During an event, the maps will be used for providing contextual warning to the communities
based on their risk profile. Also poor and vulnerable communities which are at relatively high risk can be prioritised for
evacuation. During the disaster, the maps will help in identifying helicopter drop locations for food and medical supplies. The
lamp post marking based on flood inundation maps have created large scale awareness amongst the communities. The flood 20
maps are currently part of the end to end early warning system established in Surat. The dam release information (alerts) can
now be used by the citizens to contextualize their action plans based on the possible level of inundation for a given release as
indicated within the markings on the lamp post. During time periods without flooding, citizens especially the migrants can use
this information before they choose to buy real estate or choose to relocate to a new neighbourhood. This action over time will
indirectly affect the value of the real estate developments in flood plains and thereby influencing the local economy to move 25
towards risk informed development.
5. Conclusion
This study demonstrates how an inexpensive reduced-complexity modelling approach can be used to map flooding and flood
exposure in large urban areas. The flood model demonstrates how the combined low computational overhead and low data 30
requirements of CAESAR-Lisflood enabled the generation of the first flood maps for Surat that explore the uncertainty in
flood peak discharge and duration resulting from possible climate change. These scenarios include catastrophic conditions that
flood 50% of the city and expose > 60% of the population and critical infrastructure to deep flooding. Overall, modelled floods
and exposure estimates demonstrate the ineffectiveness of the new embankments to protect the city from flooding as low return
Hydrol. Earth Syst. Sci. Discuss., doi:10.5194/hess-2016-544, 2016Manuscript under review for journal Hydrol. Earth Syst. Sci.Published: 18 November 2016c© Author(s) 2016. CC-BY 3.0 License.

12
period and duration floods are not entirely contained. Within this study flood exposure estimated for the city’s critical
infrastructure and population provides a synoptic view of potential exposure to deep flooding resulting from dam releases
scenarios. In Surat we found that flood maps and exposure estimates were applied within the phases of the risk management
cycle and was strongly supported by decision makers that were willing to address the problem of flooding and invest in
resilience building for the city. The local government used information produced by models to adapt and develop risk reduction 5
and resilience building strategies for flood risk with low-cost measures.
Acknowledgements. This paper is a part of larger project titled "Establishment of End to End Early Warning System in Surat".
We would like to thank Asian Cities Climate Change Resilience Network (ACCCRN) and Rockefeller foundation for funding
the study. Our gratitude to Surat Municipal Corporation and Surat Climate Change Trust (SCCT) for their support in execution 10
and mainstreaming the modelling results as a part of their flood preparedness. Special thanks to the project team comprising
of G. K. Bhat, Lalit Dashora, Tejas Patel, Noor Hassan, Mehul Patel and Hardik Prajapati. This project was supported by the
University of Bern, Institute of Geography, Risk and Resilience Cluster.
References
Alfieri, L., Salamon, P., Bianchi, A., Neal, J., Bates, P. and Feyen, L.: Advances in pan-European flood hazard mapping, 15
Hydrol. Process., 28(13), 4067–4077, doi:10.1002/hyp.9947, 2014.
Baldassarre, G. Di, Viglione, A., Carr, G., Kuil, L., Salinas, J. L. and Blöschl, G.: Socio-hydrology: conceptualising human-
flood interactions, Hydrol. Earth Syst. Sci., 17(8), 3295–3303, 2013.
Di Baldassarre, G., Viglione, A., Carr, G., Kuil, L., Yan, K., Brandimarte, L. and Blöschl, G.: Debates—Perspectives on socio-
hydrology: Capturing feedbacks between physical and social processes, Water Resour. Res., 51(6), 4770–4781, 2015. 20
Bates, P. D., Horritt, M. S. and Fewtrell, T. J.: A simple inertial formulation of the shallow water equations for efficient two-
dimensional flood inundation modelling, J. Hydrol., 387(1–2), 33–45, doi:http://dx.doi.org/10.1016/j.jhydrol.2010.03.027,
2010.
Baugh, C. A., Bates, P. D., Schumann, G. and Trigg, M. A.: SRTM vegetation removal and hydrodynamic modeling accuracy,
Water Resour. Res., 49(9), 5276–5289, 2013. 25
Bhat, G. K., Karanth, A., Dashora, L. and Rajasekar, U.: Addressing flooding in the city of Surat beyond its boundaries,
Environ. Urban., 0956247813495002, 2013.
Birkmann, J., Cardona, O. D., Carreño, M. L., Barbat, A. H., Pelling, M., Schneiderbauer, S., Kienberger, S., Keiler, M.,
Alexander, D., Zeil, P. and others: Framing vulnerability, risk and societal responses: the MOVE framework, Nat. hazards,
67(2), 193–211, 2013. 30
Coulthard, T. J., Neal, J. C., Bates, P. D., Ramirez, J., de Almeida, G. A. M. and Hancock, G. R.: Integrating the LISFLOOD-
FP 2D hydrodynamic model with the CAESAR model: implications for modelling landscape evolution, Earth Surf. Process.
Hydrol. Earth Syst. Sci. Discuss., doi:10.5194/hess-2016-544, 2016Manuscript under review for journal Hydrol. Earth Syst. Sci.Published: 18 November 2016c© Author(s) 2016. CC-BY 3.0 License.
13
Landforms, 38(15), 1897–1906, doi:10.1002/esp.3478, 2013a.
Coulthard, T. J., Ramirez, J. A., Barton, N., Rogerson, M. and Brücher, T.: Were Rivers Flowing across the Sahara During the
Last Interglacial? Implications for Human Migration through Africa, PLoS One, 8(9), e74834 [online] Available from:
http://dx.doi.org/10.1371/journal.pone.0074834, 2013b.
Deshpande, N. R., Kothawale, D. R. and Kulkarni, A.: Changes in climate extremes over major river basins of India, Int. J. 5
Climatol., 2016.
Dupont, F., Hannah, C. G., Greenberg, D. A., Cherniawsky, J. Y. and Naimie, C. E.: Modelling system for tides for the
Northwest Atlantic coastal ocean, Fisheries and Oceans Canada., 2002.
Fewtrell, T. J., Neal, J. C., Bates, P. D. and Harrison, P. J.: Geometric and structural river channel complexity and the prediction
of urban inundation, Hydrol. Process., 25(20), 3173–3186, doi:10.1002/hyp.8035, 2011. 10
Fisher, K. and Dawson, H.: Reducing uncertainty in river flood conveyance, Rough. Rev. Proj. W5A-057.
DEFRA/Environment Agency, 2003.
Gaughan, A. E., Stevens, F. R., Linard, C., Jia, P. and Tatem, A. J.: High Resolution Population Distribution Maps for
Southeast Asia in 2010 and 2015, PLoS One, 8(2), e55882, doi:10.1371/journal.pone.0055882, 2013.
Güneralp, B., Güneralp, \.Inci and Liu, Y.: Changing global patterns of urban exposure to flood and drought hazards, Glob. 15
Environ. Chang., 31, 217–225, 2015.
India, R. G.: Census of India, 2011, India, Provisional Popul. Total. Pap., 1, 2011.
Jarvis, A., Reuter, H. I., Nelson, A. and Guevara, E.: Hole-filled seamless SRTM data V4, Int. Cent. Trop. Agric., 2008.
Jha, A. K., Bloch, R. and Lamond, J.: Cities and flooding: a guide to integrated urban flood risk management for the 21st
century, World Bank Publications., 2012. 20
Jongman, B., Ward, P. J. and Aerts, J. C. J. H.: Global exposure to river and coastal flooding: Long term trends and changes,
Glob. Environ. Chang., 22(4), 823–835, 2012.
Kale, V. S. and Hire, P. S.: Effectiveness of monsoon floods on the Tapi River, India: role of channel geometry and hydrologic
regime, Geomorphology, 57(3–4), 275–291, doi:http://dx.doi.org/10.1016/S0169-555X(03)00107-7, 2004.
Keiler, M., Knight, J. and Harrison, S.: Climate change and geomorphological hazards in the eastern European Alps, Philos. 25
Trans. R. Soc. London A Math. Phys. Eng. Sci., 368(1919), 2461–2479, 2010.
Mishra, V. and Lilhare, R.: Hydrologic sensitivity of Indian sub-continental river basins to climate change, Glob. Planet.
Change, 139, 78–96, doi:http://dx.doi.org/10.1016/j.gloplacha.2016.01.003, 2016.
Misra, A. and Balaji, R.: Decadal changes in the land use/land cover and shoreline along the coastal districts of southern
Gujarat, India, Environ. Monit. Assess., 187(7), 1–13, 2015. 30
National Disaster Management Authority: Management of floods: national disaster management guidelines. [online] Available
from: http://www.ndma.gov.in/images/guidelines/flood.pdf, 2008.
O’Loughlin, F. E., Paiva, R. C. D., Durand, M., Alsdorf, D. E. and Bates, P. D.: A multi-sensor approach towards a global
vegetation corrected SRTM DEM product, Remote Sens. Environ., 182, 49–59,
Hydrol. Earth Syst. Sci. Discuss., doi:10.5194/hess-2016-544, 2016Manuscript under review for journal Hydrol. Earth Syst. Sci.Published: 18 November 2016c© Author(s) 2016. CC-BY 3.0 License.

14
doi:http://dx.doi.org/10.1016/j.rse.2016.04.018, 2016.
Patel, D. P. and Srivastava, P. K.: Flood hazards mitigation analysis using remote sensing and GIS: correspondence with town
planning scheme, Water Resour. Manag., 27(7), 2353–2368, 2013.
Rakhecha, P. R. and Clark, C.: The probable maximum flood at the Ukai and Lakhwar dam sites in India, in The Extremes of
the Extremes: Extraordinary Floods, edited by A. Snorrason, H. P. Finnsdottir, and M. E. Moss, p. 283, International Assn of 5
Hydrological Sciences., 2002.
Ramirez, J. A., Lichter, M., Coulthard, T. J. and Skinner, C.: Hyper-resolution mapping of regional storm surge and tide
flooding: comparison of static and dynamic models, Nat. Hazards, 82(1), 571–590, doi:10.1007/s11069-016-2198-z, 2016.
Sampson, C. C., Fewtrell, T. J., O’Loughlin, F., Pappenberger, F., Bates, P. B., Freer, J. E. and Cloke, H. L.: The impact of
uncertain precipitation data on insurance loss estimates using a flood catastrophe model, Hydrol. Earth Syst. Sci., 18(6), 2305–10
2324, doi:10.5194/hess-18-2305-2014, 2014.
Seto, K. C., Fragkias, M., Güneralp, B. and Reilly, M. K.: A meta-analysis of global urban land expansion, PLoS One, 6(8),
e23777, 2011.
Skinner, C. J., Coulthard, T. J., Parsons, D. R., Ramirez, J. A., Mullen, L. and Manson, S.: Simulating tidal and storm surge
hydraulics with a simple 2D inertia based model, in the Humber Estuary, U.K, Estuar. Coast. Shelf Sci., (0), -, 15
doi:http://dx.doi.org/10.1016/j.ecss.2015.01.019, 2015.
Timbadiya, P. V, Patel, P. L. and Porey, P. D.: A 1D--2D Coupled Hydrodynamic Model for River Flood Prediction in a
Coastal Urban Floodplain, J. Hydrol. Eng., 20(2), 5014017, 2014a.
Timbadiya, P. V, Patel, P. L. and Porey, P. D.: One-dimensional hydrodynamic modelling of flooding and stage hydrographs
in the lower Tapi River in India, Curr. Sci., 105(5), 708–716, 2014b. 20
United Nations: World Urbanization Prospects: The 2014 Revision., 2015.
Vasilescu, L., Khan, A., Khan, H. and others: Disaster management cycle--a theoretical approach, Manag. Mark., (1), 43–50,
2008.
Wilson, M., Bates, P., Alsdorf, D., Forsberg, B., Horritt, M., Melack, J., Frappart, F. and Famiglietti, J.: Modeling large-scale
inundation of Amazonian seasonally flooded wetlands, Geophys. Res. Lett., 34(15), n/a–n/a, doi:10.1029/2007GL030156, 25
2007.
Wohl, E., Lane, S. N. and Wilcox, A. C.: The science and practice of river restoration, Water Resour. Res., 51(8), 5974–5997,
2015.
World Bank: India Vulnerability of Kolkata Metropolitan Area to Increased Precipitation in a Changing Climate. [online]
Available from: https://openknowledge.worldbank.org/handle/10986/2818, 2011. 30
Yu, L., Wang, J. and Gong, P.: Improving 30 m global land-cover map FROM-GLC with time series MODIS and auxiliary
data sets: a segmentation-based approach, Int. J. Remote Sens., 34(16), 5851–5867, doi:10.1080/01431161.2013.798055,
2013.
Hydrol. Earth Syst. Sci. Discuss., doi:10.5194/hess-2016-544, 2016Manuscript under review for journal Hydrol. Earth Syst. Sci.Published: 18 November 2016c© Author(s) 2016. CC-BY 3.0 License.

15
Figure 1: (a) Tapi river catchment and extent of stage one and stage two models (in red). (b) DEM of Tapi river from the Ukai dam
to Surat and (c) DEM of Surat. Location of Tapi catchment and study area within India (inset).
5
10
a
b
c
Tapi river
Tapi river
Surat
Elevation (m)
341
-13
water inputs
weir
dam
city limit
India
Ukai dam
Singanpur
Kakrapar
Hydrol. Earth Syst. Sci. Discuss., doi:10.5194/hess-2016-544, 2016Manuscript under review for journal Hydrol. Earth Syst. Sci.Published: 18 November 2016c© Author(s) 2016. CC-BY 3.0 License.

16
Figure 2: (a) Observed and modelled hydrograph at Singanpur weir. (b) Synthetic Ukai dam outflows and idealized 2006 flood (in
black).
dis
charg
e (
m2 s
-1)
time (hours)
wa
ter
leve
l (m
)
2
3
4
5
6
time (days)
a
b Flood duration (days)
Observed
Modelled
retu
rn p
erio
d (y
r)
Hydrol. Earth Syst. Sci. Discuss., doi:10.5194/hess-2016-544, 2016Manuscript under review for journal Hydrol. Earth Syst. Sci.Published: 18 November 2016c© Author(s) 2016. CC-BY 3.0 License.

17
Figure 3: Surat (a) critical infrastructure, (b) population, and (c) income groups (all maps at same scale).
5
city limit
Income group
low
medium
high
city limit
airport
fire station police station hospital water tank
roads railroad
city limit
a b
c
Population
(people/100m2)
0-3
3-6
6-50
50-229
Hydrol. Earth Syst. Sci. Discuss., doi:10.5194/hess-2016-544, 2016Manuscript under review for journal Hydrol. Earth Syst. Sci.Published: 18 November 2016c© Author(s) 2016. CC-BY 3.0 License.

18
Figure 4: (a) Ukai dam outflows (in black) and discharge arriving at Surat (in red) for floods with durations of (a) 2, (b) 3, (c) 4, (d)
5, (e) 6 days.
5
10
a b
c d
e
time (days)
time (days)
dis
charg
e (
m2 s
-1)
Dam outflow Discharge at Surat
Hydrol. Earth Syst. Sci. Discuss., doi:10.5194/hess-2016-544, 2016Manuscript under review for journal Hydrol. Earth Syst. Sci.Published: 18 November 2016c© Author(s) 2016. CC-BY 3.0 License.

19
Figure 5: Maximum water depths and spatial extent for Surat floods from dam outflows of different duration and return period (see
inset bottom left). Percentage of flood extent indicated.
City limit
Water depth (m)
0-1
1-2
2-4
4-6
6-16
a b c
d e f
g h i
35% 43% 50%
18% 31% 34%
4% 8% 9%
Hydrol. Earth Syst. Sci. Discuss., doi:10.5194/hess-2016-544, 2016Manuscript under review for journal Hydrol. Earth Syst. Sci.Published: 18 November 2016c© Author(s) 2016. CC-BY 3.0 License.

20
Figure 6: Exposure to very high flood depths (≥ 0.75m) for (a) rescue & intervention, (b) transportation, (c) population, (d) low
income neighbourhoods, (e) medium income neighbourhoods, and (f) high income neighbourhoods. Asterisk indicates duration and
return period of the 2006 flood.
5
Exposure (%) 4-20 20-40 40-60
≥60
a b
c d
e f
* 2006 flood
Hydrol. Earth Syst. Sci. Discuss., doi:10.5194/hess-2016-544, 2016Manuscript under review for journal Hydrol. Earth Syst. Sci.Published: 18 November 2016c© Author(s) 2016. CC-BY 3.0 License.
21
Figure 7: Lamp post in Surat painted with modelled water heights from scenarios with flood duration of three days and indicated
return periods.
Return period (yr) 5 5-50 50-250
Hydrol. Earth Syst. Sci. Discuss., doi:10.5194/hess-2016-544, 2016Manuscript under review for journal Hydrol. Earth Syst. Sci.Published: 18 November 2016c© Author(s) 2016. CC-BY 3.0 License.