Embed Size (px)
Citation preview

NASA Technical Memorandum 4538
Flight-Determined Engine Exhaust Characteristics of an F404 Engine in an F-18 Airplane
Kimberly A. Ennix, Frank W. Burcham, Jr., and Lannie D. Webb
October 1993

NASA Technical Memorandum 4538
Kimberly A. Ennix, Frank W. Burcham, Jr., and Lannie D. Webb
Dryden Flight Research FacilityEdwards, California
National Aeronautics and Space Administration
Office of Management
Scientific and Technical Information Program
1993
Flight-Determined Engine Exhaust Characteristics of an F404 Engine in an F-18 Airplane

FLIGHT-DETERMINED ENGINE EXHAUST CHARACTERISTICS OF AN F404 ENGINE IN AN F-18 AIRPLANE
Kimberly A. Ennix*Frank W. Burcham, Jr.**
Lannie D. Webb***NASA Dryden Flight Research Facility
Edwards, California
Abstract
Personnel at the NASA Langley Research Center(NASA-Langley) and the NASA Dryden Flight ResearchFacility (NASA-Dryden) have recently completed a jointacoustic flight test program. Several types of aircraft withhigh nozzle pressure ratio engines were flown to satisfy atwofold objective. First, assessments were made of sub-sonic climb-to-cruise noise from flights conducted at vary-ing altitudes in a Mach 0.30 to 0.90 range. Second, usingdata from flights conducted at constant altitude in a Mach0.30 to 0.95 range, engineers obtained a high-quality noisedatabase. This database was desired to validate the Air-craft Noise Prediction Program and other system noiseprediction codes. NASA-Dryden personnel analyzed theengine data from several aircraft that were flown in the testprogram to determine the exhaust characteristics. Theanalysis of the exhaust characteristics from the F-18 air-craft will be reported in this paper. This paper presents anoverview of the flight test planning, instrumentation, testprocedures, data analysis, engine modeling codes, andresults.
Nomenclature
A8 exhaust nozzle physical area at the throat, in2
AE8 exhaust nozzle effective throat area, in2
AE9 exhaust nozzle effective area at the exit plane, in2
ANOPP Aircraft Noise Prediction Program
*Aerospace Engineer. **Chief, Propulsion and Performance Branch. AIAA Associate Fellow.***Aerospace Engineer. Member AIAA. Copyright © 1993 by the American Institute of Aeronautics and Astro-nautics, Inc. No copyright is asserted in the United States under Title 17,U.S. Code. The U.S. Government has a royalty-free license to exercise allrights under the copyright claimed herein for Governmental purposes. Allother rights are reserved by the copyright owner.
FG gross thrust, lb
HSCT high-speed civil transport
M9 nozzle exit Mach number
Mjet fully expanded jet Mach number
M∞ free-stream Mach number
NPR nozzle pressure ratio, P8/Pamb
P8 total pressure at the exhaust nozzle throat, psia
PLA power lever angle, deg
Pamb ambient pressure, psia
Ps9 static pressure at the exit plane, psia
T8 total temperature at the exhaust nozzle throat, °R
V9 nozzle exit velocity, ft/sec
Vjet fully expanded jet velocity, ft/sec
V∞ free-stream velocity, ft/sec
W8 mass flow rate at the exhaust nozzle throat, lb/sec
Introduction
Environmental issues are a significant concern con-fronting the designers of future high-speed civil transport(HSCT) airplanes. It has been determined that a substan-tial market will exist for HSCT aircraft if designers meetkey environmental issues, one of which is noise. TheHSCT aircraft must keep takeoff, climb-to-cruise, andlanding noise levels within the Federal Aviation Regula-tion, part 36, Stage III community noise standards.1
The HSCT design concept will likely have supersoniccruise speeds between Mach 2.00 and 2.50. Engines capa-ble of efficient flights at speeds above Mach 2.00 willlikely have the thermodynamic cycle of a turbojet or avery-low-bypass turbofan.2 These engines have high

nozzle pressure ratios (NPRs) and jet velocities, whichraises concern not only for takeoff and landing noise, butalso for climb-to-cruise noise, extending from the airportfor a distance of up to 50 miles.
To determine the predicted noise of HSCT aircraft,acoustic codes such as ANOPP (Aircraft Noise PredictionProgram)3 are used. These codes were developed usingdata acquired from engines with NPRs and flight speedslower than those planned for HSCT aircraft.
To better understand the acoustic characteristics ofengines representative of HSCT designs and to enhancecurrent noise prediction codes, personnel at NASA Lan-gley Research Center (NASA-Langley) and NASA Dry-den Flight Research Facility (NASA-Dryden) haveconducted joint flyover acoustic testing to acquire data.4
The test objective was first, to assess subsonic climb-to-cruise noise using aircraft with high NPR engines and sec-ond, to obtain an improved noise database to validateANOPP and other system noise prediction codes. TheNASA-Dryden personnel conducted the flyover tests anddetermined the engine exhaust characteristics. TheNASA-Langley personnel made the acoustic measure-ments, performed the correlations between the engineexhaust characteristics and acoustic data, and updated theANOPP code.
The flight study consisted of a series of flights overmicrophone arrays using several types of aircraft. In thesubsonic climb portion of the study, the flight matrix con-sisted of flyovers at intermediate power at altitudes from3800 to 32,000 ft and Mach numbers from 0.30 to 0.95.For the ANOPP evaluation flyovers, the test points wereconducted at a constant altitude and Mach number. Aground static acoustic test was also conducted to estab-lish acoustic levels with no forward velocity.
For all of the tests, the measured engine data werecollected and later analyzed by an F404-GE-400 in-flightthrust code. The code predicted the engine exhaust char-acteristics of exhaust velocity and Mach number, whichcannot be directly obtained from the measured enginedata.
This paper describes the F-18 airplane, the F404engine, the flight test program, and the methods used tocalculate the engine exhaust properties. In addition, thepaper presents the exhaust velocity and Mach number datafor the climb-to-cruise, ANOPP validation, and groundtests.
Aircraft Description
F-18 Aircraft
Figure 1 shows an F-18 aircraft (McDonnell DouglasCorp., St. Louis, Missouri and Northop Corp., Newbury
Park, California) during one of the test runs. This super-sonic, high-performance fighter has excellent transonicmaneuverability and is powered by two F404-GE-400(General Electric Co., Lynn, Massachusetts) afterburning,turbofan engines.5 Both engines are mounted closetogether in the aft fuselage. The standard F-18 mainte-nance data recorder was used onboard the aircraft torecord a limited number of airplane and engineparameters.
Engine Description
The F404-GE-400 is a two-spool, low-bypass, axial-flow turbofan with afterburner. The engine consists of athree-stage fan driven by a single-stage, low-pressure tur-bine and a seven-stage, high-pressure compressor drivenby a single-stage, high-pressure turbine. Variable geome-try is incorporated into the fan and high-pressure compres-sor and the nozzle is a convergent–divergent nozzle.6 It isequipped with an engine control unit (ECU) where idlepower is 35° power lever angle (PLA) and intermediate(maximum nonafterburning) power is 102° PLA. It pro-duces NPRs similar to those expected of an HSCT engineapplication.
Test Procedures
Ground Track
The flight tests were flown over the Rogers Dry Lakewhich is adjacent to NASA-Dryden. Located at an ele-vation of 2300 ft, this dry lakebed provides a flat, interfer-ence-free area for acoustic testing. Figure 2 shows theapproximate location of the microphone array placedalong the “fly-by” line on the northeast side of the lakebed.This area was ideal for tracking because of its close prox-imity to the NASA-Dryden radar site. Using the groundtrack and distance displayed in the control room, the pilotswere guided down the ground track and over the acousticarray. Flight conditions such as altitude or Mach numberneeded to be kept as constant as possible to get good quan-titative runs. There were 95 recorded F-18 flyovers.
Flight Procedures
The flight tests were conducted in two segments: sub-sonic climb to cruise and ANOPP validation. A single-exhaust jet was desired so the acoustics tests would haveone distinct noise source. For the twin-engine F-18 air-craft both engines were used to set up the initial conditionsbefore the beginning of a maneuver. On call from the con-trol room, the pilot stabilized the speed and altitude of theaircraft. The left engine was throttled back to idle whilethe right test engine was operated at intermediate power.This procedure simulated the effect of a single engine. Forthe ANOPP validation segment the test engine was
2

operated at the power required to maintain level flight.The F-18 maintenance recorder was activated by the pilotand operated for 35 sec to record aircraft and engine dataduring the run. Table 1 shows the flight matrix for theclimb-to-cruise and ANOPP validation segments of theflight test.
Climb-to-Cruise Test Matrix
The flight matrix for the climb-to-cruise segment con-sisted of level flight accelerations at various Mach num-bers and altitude to simulate points along a expectedHSCT climb profile. Altitudes varied from 3800 to 32,500ft and speeds ranged from Mach 0.30 to 0.90. The aircraftflew with the right test engine at the intermediate powersetting to maximize NPR.
ANOPP Validation Test Matrix
The ANOPP evaluation segment was flown at a con-stant altitude of 3800 ft (1500 ft above the ground) withspeeds ranging from Mach 0.30 to 0.95. Power settings onthe test engine varied depending on what was required tomaintain constant flight speed or Mach number andaltitude.
Ground Test
In addition to the flight testing, static ground testswere conducted with the aircraft tied down on the thruststand pad at the US Air Force Flight Test Center atEdwards, California. The test matrix consisted of PLAsfrom idle to intermediate power at 0.1 increments inengine pressure ratio. The F-18 onboard recorder mainte-nance tape was run for 35 sec at each power setting torecord the engine data. Temperature, wind speed, andwind direction were also recorded. The tests were con-ducted with the wind speeds below 5 kts.
Engine Exhaust Characteristics
Jet-mixing and shock cell noise are the two primarysources of noise for takeoffs and subsonic climbs.7 Thesenoise sources are primarily affected by the aircraft veloc-ity, the exhaust exit Mach number and velocity, and theNPR. For acoustic analysis, engine exhaust characteristicsare often defined at the nozzle exit and an assumed fullyexpanded jet. Jet-mixing noise is a function of the differ-ence between the fully expanded jet velocity (Vjet) and thefree-stream velocity (V∞). Shock cell noise is a functionof the difference between the fully expanded jet Machnumber (Mjet) and the nozzle exit Mach number (M9). Asyou approach the point where M9 = Mjet and V∞ = Vjet, theshock cell noise and jet-mixing noise are diminished.Nozzle exit velocity (V9) and M9 are based on the aero-
thermodynamic characteristics of the flow at the nozzleexit plane (Fig. 3).
F404 In-Flight Thrust Code
Data obtained from the engine during the flight andground tests included compressor speed, compressor dis-charge pressure, fan speed, fuel flow, inlet temperature,turbine discharge temperatures, turbine discharge pres-sure, and nozzle area ratio. Measured engine dataobtained from the flight tests do not directly give the val-ues of M9, V9, Mjet, and Vjet needed for acoustic analysiswith the ANOPP prediction code. As a result, the mea-sured engine data must be input into the engine perfor-mance codes to obtain the desired engine exhaustcharacteristics.
The F404-GE-400 in-flight-thrust performance code8
was developed by the General Electric Co. for the USNavy. This code models the engine as a gas generator anduses the measured engine parameters as input. The perfor-mance code calculates the following parameters through-out the flight envelope: gross thrust (FG), V9, Vjet, M9,Mjet, NPR, exhaust nozzle effective exit area to effectivethroat area ratio (AE9/AE8), exhaust nozzle static exitpressure to ambient pressure ratio (Ps9/Pamb), exhaustnozzle throat total temperature (T8), and exhaust nozzlethroat mass flow rate (W8). The exhaust nozzle exit massflow rate (W9) and total temperature (T9) are assumed tobe equal to W8 and T8, respectively.
The following assumptions are used in the in-flightthrust code. Steady one-dimensional isentropic flow isassumed between the throat and the nozzle exit. Based onthe resulting nozzle static exit pressure (Ps9), the flowwill be overexpanded (Ps9 < Pamb), fully expanded (Ps9= Pamb), or underexpanded (Ps9 > Pamb). Mjet
is basedon the point where the flow is fully expanded (Ps9 =Pamb) and it is a function of NPR. M9 is a function ofnozzle area ratio. Once M9 and Mjet
are determined, V9and Vjet are then calculated. V9 represents the actualexhaust exit velocity while Vjet represents the ideal fullyexpanded jet exhaust velocity. If the actual exhaust veloc-ity were fully expanded, V9 would match Vjet.
Results and Discussion
Climb-to-Cruise Test Results
Figure 4 shows the effect of Mach number on F404engine exhaust characteristics for climb-to-cruise tests atintermediate power. Figure 4(a) shows the relationshipbetween Vjet and V9 and the free-stream Mach number(M∞). Each point on the curve represents a differentaltitude in the climb-to-cruise matrix. At the beginning ofthe climb profile when the altitude is approximately 3800ft and M∞ ≈ 0.30, the nozzle is overexpanded (V9 > Vjet).
3
The point where the data crosses, M∞ ≈ 0.85 and Vjet = V9,indicates that the nozzle is fully expanded. When theclimb profile reaches an altitude of approximately32,300 ft and M∞ ≈ 0.90, the nozzle is underexpanded(V9 < Vjet). Overall, V9 varies from V9 ≈ 2750 ft/sec up toa maximum of V9 ≈ 2800 ft/sec, and then drops to a valueof V9 ≈ 2750 ft/sec, while Vjet varies from 2300 to 2900 ft/sec.
Figure 4(b) shows Mjet and M9 as a function of M∞.Mjet and M9 follow the same trends with Mach numberand altitudes as Vjet and V9. The values of M9 varybetween 1.69 up to a maximum of M9 ≈ 1.80, and thendrop to M9 ≈ 1.70. The values of Mjet vary between Mjet ≈1.35 up to a maximum of Mjet ≈ 1.76. Above M∞ ≈ 0.85,the difference between the two values is significantlyreduced. Table 2 lists other parameters of interest for theclimb-to-cruise test. The maximum nozzle pressure ratiowas 5.24.
ANOPP Validation Test Results
Figure 5 shows the effect of Mach number on F404engine exhaust characteristics for ANOPP validation testsat a level altitude of 3800 ft. Figure 5(a) shows theexhaust velocities V9 and Vjet with respect to M∞. Thepower setting (PLA) of the test engine was set at the level(shown in parentheses) necessary to maintain constantMach number in level flight while the other engineremained at idle. The power settings varied from partialpower (75°) at the lower speeds, to intermediate power(102°) at the higher speeds. As in Fig. 4, both V9 and Vjetwere plotted as a function of M∞; however, no crossoveroccurred because at this low altitude the nozzle is overex-panded for this M∞ range. The values of V9 varied fromV9 ≈ 2550 ft/sec up to a maximum of V9 ≈ 2900 ft/sec,while Vjet varied between Vjet ≈ 1900 to 2650 ft/sec.
Figure 5(b) shows a plot of exhaust Mach numbersM9 and Mjet with respect to M∞. This set of data alsoshows a steady trend of increased M9 and Mjet without anycrossover of the data. The two curves do converge towardeach other indicating that a fully expanded nozzle condi-tion may occur at a higher M∞. The values of M9 wereM9 ≈ 1.70 to 1.80 while Mjet varied from Mjet ≈ 1.15 to1.60. Table 3 shows additional parameters of interest forthe ANOPP validation test.
Ground Test Results
For the ground static tests the effect of PLA on F404engine exhaust characteristics is shown in Fig. 6. Figure6(a) shows V9 and Vjet plotted against PLA for the groundtests. The values of V9 varied from V9 ≈ 2500 to 2800 ft/sec with increasing PLA. Vjet varied from Vjet ≈ 1800 to2200 ft/sec. Figure 6(b) shows the relationship of
PLA to exhaust Mach numbers M9 and Mjet. The values ofM9 varied between M9 ≈ 1.71 to 1.74 and Mjet variedbetween Mjet ≈ 1.08 to 1.30. The data for the exhaustMach numbers show a trend similar to the exhaustvelocities in Fig. 6(a). Additional data for the groundtests are listed in Table 4.
The data in the tables and figures are typical pointstaken from the many runs conducted in the study. Theymatched the desired altitudes and Mach numbers shown inthe flight matrix in Table 1. The data were selected fromtest points with stable engine conditions. These pointswere not averaged. The overall results show that theengine exhaust characteristics of interest for the acoustictest vary with M∞, altitude, and PLA. Tables 2, 3, and 4show that from the climb-to-cruise, ANOPP validation,and ground tests the peak V9 values were approximately2800 to 2900 ft/sec.
Concluding Remarks
A series of acoustic tests were conducted, first, todetermine climb-to-cruise noise of aircraft with high noz-zle pressure ratios and second, to validate the AircraftNoise Prediction Program (ANOPP). An F-18 airplane,with the F404-GE-400 engine installed, was flown over arange of flight speeds and altitudes. From these tests, theengine data were analyzed to determine their exhaust char-acteristics. The flight tests produced a large engineexhaust characteristics database that was correlated withacoustic data and used to upgrade the ANOPP code. Thisnew database will aid in the design of future high-speedcivil transport (HSCT) aircraft.
In summary, the climb-to-cruise test conditions atintermediate power produced engine exhaust conditionsthat varied from overexpanded to underexpanded. Thenozzle exit velocities ranged from approximately 2750 ft/sec up to a maximum of approximately 2800 ft/sec, andthen dropped to a value of approximately 2750 ft/sec. Thenozzle exit Mach numbers ranged between Mach 1.69 upto a maximum of Mach 1.81 and then dropped to a valueof Mach 1.70. The maximum nozzle pressure ratio was5.24. For the ANOPP validation test points, the exhaustconditions were overexpanded and nozzle exit velocityranged from approximately 2550 to 2900 ft/sec. Nozzleexit Mach numbers ranged from approximately Mach 1.70to Mach 1.81. For the ground test conditions, nozzle exitvelocity varied from 2500 to 2800 ft/sec. Nozzle exitMach number remained fairly constant at Mach 1.70 overthe range of power levels tested. For the three tests:climb-to-cruise, ANOPP, and the ground run, at intermedi-ate power, maximum nozzle exit velocities were approxi-mately 2800 to 2900 ft/sec and nozzle exit Mach numberwas approximately Mach 1.70.
4

References
1United States, Federal Aviation Administration,Code of Federal Regulations—Aeronautics and Space,vol. 14, pts. 1 to 59, Washington, DC, rev. Jan. 1, 1992.
2Vachal, John D., "High-Speed Civil TransportResearch and Technology Needs," SAE 901925, SAEAerospace Technology Conference and Exposition, Oct.1990, pp. 1824–1831.
3Whitehead, Allen H., Jr., "Overview of AirframeTechnology in the NASA High-Speed Research Program,"AIAA-91-3100, Sept. 1991.
4Kelly, J.J. and M.R. Wilson, "Signal Processing ofJet Noise From Flyover Test Data," AIAA-93-0736, Jan.1993.
5Powel, S.F., IV, "On the Leading Edge: CombiningMaturity and Advanced Technology on the F404 TurbofanEngine," ASME, Transactions, J. of Engineering for GasTurbines and Power, vol. 113, Jan. 1991, pp. 1–10.
6Walton, James T. and Frank W. Burcham, Jr.,Exhaust-Gas Pressure and Temperature Survey of F404-GE-400 Turbofan Engine, NASA TM-88273, 1986.
7Preisser, J.S., R.A. Golub, J.M. Seiner, and C.A.Powell, "Supersonic Jet Noise: Its Generation, Prediction,and Effects on People and Structures," SAE 1990 Transac-tions, J. of Aerospace, sec. 1, vol. 99, pt. 2, 1990,pp. 1833–1847. (Also available as SAE 901927, 1990.)
8F404 In-Flight Thrust Calculation Deck, Programno. 83112, General Electric Co., Aug. 1983.
5

Clim
b to
cru
ise
AN
OPP
Alti
tude
, ft (
mea
n se
a le
vel)
Free
-str
eam
Mac
h nu
mbe
r
Tes
t mat
rix
3,80
0
7,30
0
12,3
00
22,3
00
32,3
00
0.30
0.60
0.65
0.75
0.90
Alti
tude
, ft (
mea
n se
a le
vel)
3800
3800
3800
3800
3800
Free
-ste
am M
ach
num
ber
0.30
0.40
0.65
0.75
0.95
Tabl
e 1.
Flig
ht m
atri
x fo
r cl
imb-
to-c
ruis
e po
ints
and
AN
OPP
val
idat
ion.
102
102
102
102
102
0.32
0.61
0.68
0.77
0.89
3,8
50
7,2
92
12,3
24
22,3
31
32,3
07
127.
6
132.
7
116.
6
89.
2
66.
4
1.43
0
1.49
0
1.47
0
1.39
0
1.36
0
9125
.0
9703
.2
8810
.1
7380
.7
5726
.0
2744
.00
2871
.51
2861
.18
2779
.82
2749
.14
2305
.0
2388
.3
2465
.6
2679
.2
2796
.0
2.93
0
3.09
0
3.37
5
4.42
0
5.24
0
1687
.0
1683
.6
1689
.6
1687
.2
1682
.9
274.
6
298.
3
293.
4
261.
5
251.
2
0.53
9
0.53
1
0.58
8
0.86
8
1.07
1
1.69
1.81
1.80
1.73
1.70
1.34
0
1.39
6
1.45
9
1.64
4
1.75
9
Thr
ottle
, de
gM
∞A
ltitu
de,
ftN
PRT
8, °
R
W8,
lb
/sec
A8,
in2
AE
9/A
E8
Ps9
/ P
amb
FG
, lb
M9
V9,
ft/s
ecM
jet
Vje
t,
ft/s
ec
Clim
b-to
-cru
ise
poin
ts
Tabl
e 2.
Pri
mar
y da
ta a
ssoc
iate
d w
ith c
limb-
to-c
ruis
e te
st p
oint
s.
6

75
80
100
102
0.34
0.61
0.80
0.92
3745
3800
3795
3845
92.
82
107.
05
163.
51
177.
54
1.38
0
1.35
0
1.48
8
1.45
9
530
4.8
711
9.2
1267
2.6
1428
9.3
2543
.98
2621
.38
2896
.83
2867
.34
1887
.81
2183
.69
2555
.67
2649
.41
2.24
4
2.78
2
3.65
8
4.13
6
1423
.5
1542
.9
1718
.7
1713
.0
249.
2
245.
3
303.
3
297.
2
0.44
0
0.77
8
0.62
8
0.73
7
1.72
2
1.69
2
1.81
1
1.78
7
1.15
1
1.31
7
1.51
5
1.55
9
Thr
ottle
, de
gM
∞A
ltitu
de,
ftN
PRT
8, °
R
W8,
lb
/sec
A8,
in2
AE
9/A
E8
Ps9
/ P
amb
FG
, lb
M9
V9,
ft/s
ecM
jet
Vje
t,
ft/s
ec
AN
OPP
poi
nts
Tabl
e 3.
Pri
mar
y da
ta a
ssoc
iate
d w
ith A
NO
PP v
alid
atio
n te
st p
oint
s.
80
87
92
102
– –
–
– –
–
– –
–
– –
–
2350
2350
2350
2350
91.
3
100.
7
110.
1
120.
6
1.24
1.28
1.28
1.32
4978
.5
6121
.9
7326
.3
8717
.7
2542
.60
2629
.35
2701
.63
2784
.81
1800
.7
1998
.0
2176
.3
2252
.6
2.05
5
2.33
0
2.61
0
2.72
0
1437
.3
1527
.8
1622
.1
1671
.9
249
249
249
264
0.41
3
0.46
5
0.52
0
0.52
0
1.71
1.71
1.70
1.74
1.08
1.18
1.27
1.30
Thr
ottl
e,
deg
M∞
Alt
itud
e,
ftN
PR
T8,
°R
W
8,
lb/s
ecA
8,
in2
AE
9/A
E8
Ps9
/ P
amb
FG
, lb
M9
V9,
ft/s
ecM
jet
V jet,
ft/s
ec
Gro
und-
test
poi
nts
Tabl
e 4.
Pri
mar
y da
ta a
ssoc
iate
d w
ith g
roun
d-te
st p
oint
s.Ta
ble
4. P
rim
ary
data
ass
ocia
ted
with
gro
und-
test
poi
nts.
7

Fig. 1 F-18 aircraft powered by two F404-GE-400 engines.
Fig. 2 Ground-tracking and array layout at Rogers Dry Lake, Edwards, California.
Array location
Typical ground data trajectory
Not to scale
Radar site
NASA Dryden
Fly-by-line
North
920747
*
8
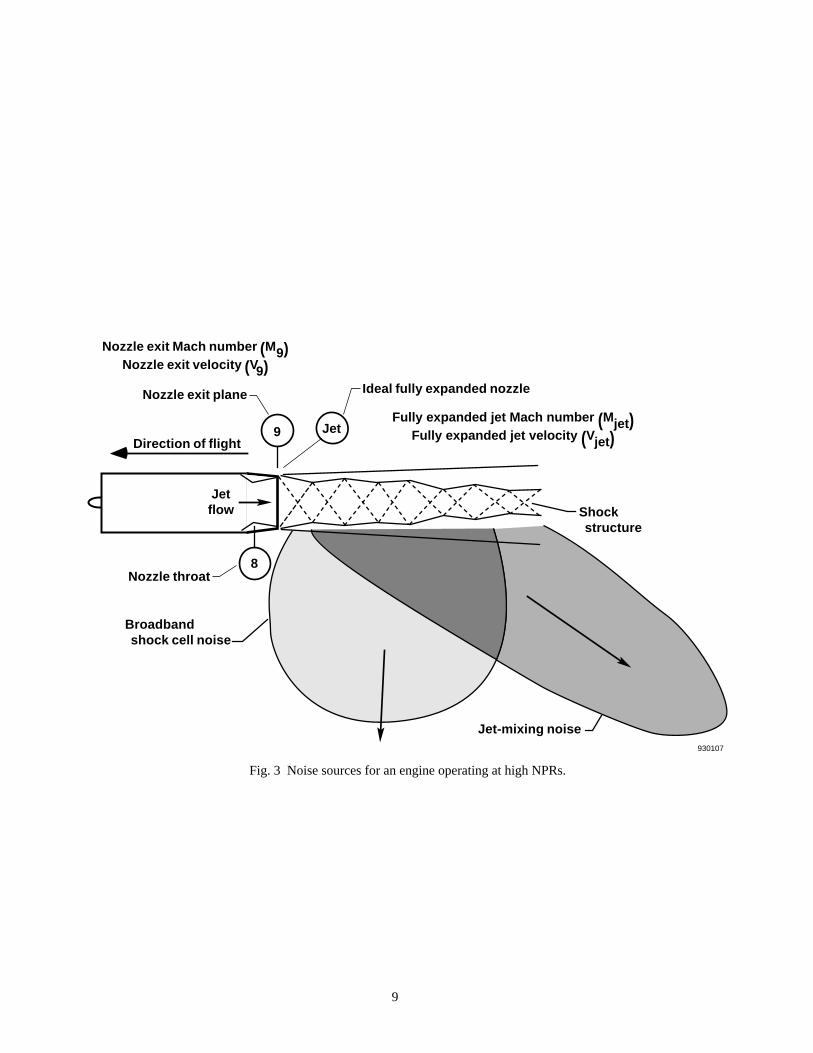
Fig. 3 Noise sources for an engine operating at high NPRs.
Jet-mixing noise
Direction of flight
Broadband shock cell noise
9
Nozzle exit plane Ideal fully expanded nozzle
Fully expanded jet Mach number (Mjet) Fully expanded jet velocity (Vjet)
Jet flow Shock
structure
930107
Nozzle exit Mach number (M9) Nozzle exit velocity (V9)
8
Jet
Nozzle throat
9

(a) Nozzle exit and fully expanded jet velocity.
(b) Nozzle exit and fully expanded jet Mach number.
Fig. 4 Effect of Mach number and altitude on exhaust characteristics for climb-to-cruise test points, PLA setting atintermediate.
Free-stream Mach number930108
1.0
Exhaust velocity,
ft/sec
3000
2900
2800
2700
2600
2500
2400
2300
2200.9.8.7.6.5.4.3.2
3800 ft
7300 ft
12,300 ft
22,300 ft
32,300 ft
Nozzle exit velocity (V9) Fully expanded jet velocity (Vjet)
Free-stream Mach number930109
1.0.9.8.7.6.5.4.3.2
Exhaust Mach
number
1.9
1.8
1.7
1.6
1.5
1.4
1.3
Nozzle exit Mach number (M9) Fully expanded jet Mach number (Mjet)
3800 ft7300 ft
12,300 ft
22,300 ft
32,300 ft
10

(a) Nozzle exit and fully expanded jet velocity.
(b) Nozzle exit and fully expanded jet Mach number.
Fig. 5 Effect of Mach number on F404 engine exhaust characteristics for ANOPP test points, PLA setting at power forlevel flight (as noted).
Free-stream Mach number930110
1.0.9.8.7.6.5.4.3
Exhaust velocity,
ft/sec
3000
2800
2600
2400
2200
2000
1800
Nozzle exit velocity (V9) Fully expanded jet velocity (Vjet) Power lever angle(PLA)
(75°)
(80°)
(100°)
(102°)
Free-stream Mach number930111
1.0.9.8.7.6.5.4.3
Exhaust Mach
number
2.0
Nozzle exit Mach number (M9) Fully expanded jet Mach number (Mjet) Power lever angle (PLA)
1.8
1.6
1.4
1.2
1.0
(75°)
(80°)
(100°)(102°)
11

(a) Nozzle exit and fully expanded jet velocity.
(b) Nozzle exit and fully expanded jet Mach number.
Fig. 6 Effect of PLA on F404 engine exhaust characteristics for ground static test points, 2300-ft altitude.
Power lever angle930112
1101009080
Exhaust velocity,
ft/sec
2800
70
2600
2400
2200
2000
1800
Intermediate power
Nozzle exit velocity (V9) Fully expanded jet velocity (Vjet)
Power lever angle930113
1101009080
Exhaust Mach
number
1.8
70
Nozzle exit Mach number (M9) Fully expanded jet Mach number (Mjet)
1.6
1.4
1.2
1.0
Intermediate power
12

REPORT DOCUMENTATION PAGE Form ApprovedOMB No. 0704-0188
Public reporting burden for this collection of information is estimated to average 1 hour per response, including the time for reviewing instructions, searching existing data sources, gathering and maintaining the data needed, and completing and reviewing the collection of information. Send comments regarding this burden estimate or any other aspect of this col-lection of information, including suggestions for reducing this burden, to Washington Headquarters Services, Directorate for Information Operations and Reports, 1215 Jefferson Davis Highway, Suite 1204, Arlington, VA 22202-4302, and to the Office of Management and Budget, Paperwork Reduction Project (0704-0188), Washington, DC 20503.
1. AGENCY USE ONLY (Leave blank) 2. REPORT DATE 3. REPORT TYPE AND DATES COVERED
4. TITLE AND SUBTITLE 5. FUNDING NUMBERS
6. AUTHOR(S)
8. PERFORMING ORGANIZATION REPORT NUMBER
7. PERFORMING ORGANIZATION NAME(S) AND ADDRESS(ES)
9. SPONSORING/MONOTORING AGENCY NAME(S) AND ADDRESS(ES) 10. SPONSORING/MONITORING AGENCY REPORT NUMBER
11. SUPPLEMENTARY NOTES
12a. DISTRIBUTION/AVAILABILITY STATEMENT 12b. DISTRIBUTION CODE
Unclassified—Unlimited Subject Category 07
13. ABSTRACT (Maximum 200 words)
14. SUBJECT TERMS 15. NUMBER OF PAGES
16. PRICE CODE
17. SECURITY CLASSIFICATION OF REPORT
18. SECURITY CLASSIFICATION OF THIS PAGE
19. SECURITY CLASSIFICATION OF ABSTRACT
20. LIMITATION OF ABSTRACT
NSN 7540-01-280-5500 Standard Form 298 (Rev. 2-89)Prescribed by ANSI Std. Z39-18298-102
Prepared as AIAA-93-2543 for presentation at the AIAA/SAE/ASME/ASEE 29th Joint Propulsion Conference and Exhibit, Monterey, California, June 28–30, 1993.
Flight-Determined Engine Exhaust Characteristics of an F404 Engine in an F-18 Airplane
WU 537-03-20
Kimberly A. Ennix, Frank W. Burcham, Jr., and Lannie D. Webb
NASA Dryden Flight Research FacilityP.O. Box 273Edwards, California 93523-0273
H-1910
National Aeronautics and Space AdministrationWashington, DC 20546-0001 NASA TM-4538
Personnel at the NASA Langley Research Center (NASA-Langley) and the NASA Dryden Flight Research Fa-cility (NASA-Dryden) have recently completed a joint acoustic flight test program. Several types of aircraft withhigh nozzle pressure ratio engines were flown to satisfy a twofold objective. First, assessments were made of sub-sonic climb-to-cruise noise from flights conducted at varying altitudes in a Mach 0.30 to 0.90 range. Second, us-ing data from flights conducted at constant altitude in a Mach 0.30 to 0.95 range, engineers obtained a high-quality noise database. This database was desired to validate the Aircraft Noise Prediction Program and other sys-tem noise prediction codes. NASA-Dryden personnel analyzed the engine data from several aircraft that wereflown in the test program to determine the exhaust characteristics. The analysis of the exhaust characteristics fromthe F-18 aircraft will be reported in this paper. This paper presents an overview of the flight test planning, instru-mentation, test procedures, data analysis, engine modeling codes, and results.
Acoustics, Climb to cruise, Engine exhaust characteristics, Environmental impact
AO3
15
Unclassified Unclassified Unclassified Unlimited
October 1993 Technical Memorandum
Available from the NASA Center for AeroSpace Information, 800 Elkridge Landing Road, Linthicum Heights, MD 21090; (301)621-0390


![Determination of the combustion · combustion and explosion characteristics of dusts [2, 3]. For correct use of the characteristics, it is important to know how they are determined](https://img.dokumen.tips/doc/110x75/5fb6e562fe425e2cba76389f/determination-of-the-combustion-combustion-and-explosion-characteristics-of-dusts.jpg)