Embed Size (px)
Citation preview

Flexural Behavior of Post-tensioned Lightweight ConcreteContinuous One-Way Slabs
Keun-Hyeok Yang1), Yongjei Lee2),* , and Dae-Bong Joo3)
(Received January 7, 2016, Accepted September 9, 2016, Published online October 14, 2016)
Abstract: In this experimental study, six post-tensioned light weight concrete (LWC) continuous one-way slabs were tested in the
following manner: the flexural behaviors of the members were compared with the calculations from the existing standards. The test
also examined the effect of prestressing in tendons and proper prestress conditions to reduce the deflection and crack width, and to
enhance the flexural capacity and ductility of LWC members. Flexural capacity and stress increments in unbonded tendons of the
specimens were compared with those of the simply supported normal and the lightweight concrete members. The suggested safety
limit from the American Concrete Institute (ACI) regulation on the maximum capacity and the stress incremental in unbonded
tendons were also compared with the test results under simple and continuous supporting conditions.
Keywords: post-tensioned, continuous one-way slab, lightweight concrete, flexural capacity.
1. Introduction
Due tomanywell-known advantageous aspects, researchershave investigated the possibility of light weight concrete(LWC) as a replacement for normal weight concrete (NWC)for structural components. A comparative study on the frac-ture properties of high-strength concrete with normal aggre-gate and lightweight aggregate was conducted (Tang et al.2008). Through the study, the critical stress intensity factorand critical crack tip opening displacement for the double-parameters model and the fracture energy for a fictitious crackmodel were examined. Since LWC possesses thermal insu-lation capacity, it can enhance energy consumption efficiencyfor commercial and residential heating and cooling systems(Chandra and Berntsson 2003; Kayali 2008). For example,using LWC as a structural material may reduce the overallenergy consumption of buildings (Yang 2010). Consequently,LWC has been gathering attention as a potential constructionmaterial to minimize long-term carbon dioxide (CO2) emis-sions. On one hand, LWC has shown disadvantages in struc-tural performance due to its relatively low Young’s modulusand tensile resistance capacity causing larger deformationsand crack width in concrete. By the way, prestressing is highlyeffective in minimizing cracks and controlling deflections ofconcrete flexural members (Collins and Mitchell 1991).
Introducing a prestressing force to the LWC flexural memberscan compensate for the reduced serviceability of themembers,producing considerable synergistic advantages in structuraland environmental aspects. Therefore, a prestressed concretesystem with LWC is recognized as a decent solution for cre-ating a suitable structure that can decrease the consumption ofthe natural resources and reduction in the enormous amount ofCO2 emitted from construction and residual environments(Chandra and Berntsson 2003; Oh and Choi 2004).Most of the research using prestressed concrete flexural
members has been conducted with normal weight concrete(NWC) (Warwaruk et al. 1962; Harajli and Kanj 1990;Campbell and Chouinard, 1991; Chakrabrti 1995; Mainsekarand Senthil 2006; Lou and Xiang 2007; Ellobody and Bailey2008; Cai et al. 2009). Yang and Mun (2013) initiatedexperimental studies on the flexural capacity of post-ten-sioned LWC beams. They found the stress increase in theunbonded strands (Dfps) at the ultimate strength of the post-tensioned LWC beam was higher than that of the post-ten-sioned NWC beams under same reinforcing index values.This indicates that the ACI 318-11 provisions for Dfps wouldbe unconservative for post-tensioned LWC members.Currently, most codes and recommendations, including
American Concrete Institute standards (ACI Committee 3182011), evaluate the flexural behaviors of the post-tensionedconcrete members based on studies with NWC; therefore,there could be a question about how to evaluate the flexuralbehavior of post-tensioned LWC members. As it is wellknown, LWC has lower stiffness than NWC. LWC alsoshows many different material properties from NWCincluding creep and drying shrinkage deformation. Theflexural behaviors of post-tensioned LWC members aredistinguished from those of NWC in bending strength,ductility and stress in unbonded strands.
1)Department of Architectural Engineering, Kyonggi
University, Suwon 16227, Korea.2)YG Engineering & Architects, Seoul 06125, Korea.
*Corresponding Author; E-mail: [email protected])4M Engineering Co., Naju-si, Korea.
Copyright � The Author(s) 2016. This article is published
with open access at Springerlink.com
International Journal of Concrete Structures and MaterialsVol.10, No.4, pp.425–434, December 2016DOI 10.1007/s40069-016-0169-0ISSN 1976-0485 / eISSN 2234-1315
425

One of the most important factors in the design of post-tensioned flexural members is to evaluate the stress incre-mental in unbonded tendons to which the sectional straincompatibility condition is not applicable. The stress increasein unbonded tendons is suggested by the member compati-bility condition based upon the test results using simplysupported NWC beams (ACI Committee 318 2011; Yanget al. 2013). However, when it comes to the LWC, insuffi-cient data have been provided to assure the safety of theexisting models and current design standards. For safedesign of post-tensioned LWC beams, the effects of vari-ables on the stress incremental in unbonded tendons must bestudied under both simple and continuous support condi-tions. Therefore, the bond reduction coefficients of plastichinge length proposed to evaluate stress increase in unbon-ded tendon need to be adjusted in LWC members becausethe proposed equations are empirically derived using limitedtest data from the NWC members. However, available testresults and information are very rare for LWC flexuralmembers.In this experimental study, six post-tensioned LWC con-
tinuous one-way slabs were tested. For each test parameter,the crack developments, failure modes, load–displacementrelation, and load-tendon stress relationship were measured.The ultimate stress and stress incremental of the tendonswere compared to the calculation results using the existingstandards; ACI 318-11, AASHTO (1998) and CAN3-A23-M94. The stress increments of the tendons were also com-pared to the previous NWC test data generated by Lim et al.(1999). The flexural behaviors of the members were com-pared using calculations derived from the existing standards(ACI, AASHTO, and CAN3). The tests also examined theeffect of prestressing in tendons and proper prestress pro-cedures to reduce the deflection and crack width, and toenhance the flexural capacity and ductility of LWC mem-bers. Flexural capacity and stress increment in unbondedtendons of the specimens were compared to those of thesimply supported normal and the LWC members. The sug-gested safety limit from the ACI regulation on the maximumcapacity and the stress incremental in unbonded tendons
were also compared to the test results under simple andcontinuous supporting conditions.
1.1 Significance of ResearchThis research provides meaningful test results on the
behaviors of the post-tensioned continuous lightweightslabs. Here, the applicability of the stress incrementalequations for unbonded tendons suggested by design stan-dards was evaluated. The stress increments in unbondedtendons were also reviewed under simple and continuoussupport conditions. Authors believe the results can providebasic data for development of a future design manual ofpost-tensioned continuous lightweight concrete slabs.
2. Experimental Program
2.1 SpecimensSix LWC one-way continuous slab specimens post-ten-
sioned with unbonded tendons were prepared for flexuraltests, as shown in Table 1. The nomenclature for eachspecimen is shown in Fig. 1. Each specimen had threesupports with two spans. Two critical parameters affectingthe stress increase in unbonded tendons were considered inexperiments: span-to-effective tendon depth ratio (L/dp) inGroup 1; and steel ratio in member section (qs) in Group 2.As known well from the study by Mojtahedi and Gamble
(1978), L/dp of the concrete member can affect the stress intendons. ACI 318 equation (18-4) overestimates Dfps inNWC members when L/dp is greater than 35. In this study, L/dp varies from 25, 35, and 45 to evaluate the stress changesin tendons. It was Warwaruk et al. (1962) who conducted an
Table 1 Specimen details (unit: mm).
Group Specimen Load Type b h L (onespan)
L/dp PPR qs qp fpe/fpu e
1 S-L/dp-25 Uniform 600 125 2400 25 0.792 0.00247 0.00206 0.6 33.1
S-L/dp-35 3400 35
S-L/dp-45 4300 45
2 S-PPR-0.5 0.884 0.00123 33.2
S-PPR-1.0 0.792 0.00247 33.1
S-PPR-1.5 0.718 0.00370 32.9
b member width, h member height, e eccentricity of prestressing strands, qs ratio of steel, qp ratio of tendon, dp effective depth of prestressingstrands.
PPR (partial prestressing ratio) = Apfpe/(Apfpe ? Asfy), where fpe effective prestress, Ap sectional area of prestressing steel, fy yield stress ofsteel, As sectional area of steel.
Fig. 1 Specimen nomenclature.
426 | International Journal of Concrete Structures and Materials (Vol.10, No.4, December 2016)

experiment about the loading pattern for the first time.Harajli and Kanj (1990) found the length of the plastichinges of beams, as well as the stress in tendons, can bechanged according to the loading patterns. When it comes tocontinuous slabs, a uniform loading method has been sug-gested for ideal member behaviors (Burns et al. 1978), so theuse of uniformly distributed loading was applied in this test.Group 1 consists of three continuous one-way slabs
receiving uniformly distributed load whose L/dp ranges from
25, 35 and 45. The ACI 318-11 requires at least 0.4 %reinforcement of the cross section between the flexural ten-sion face and center of gravity of gross section (Act). Threeslabs in Group 2 receiving uniformly distributed load havethree different qs’s with the same span and the L/dp; half ofthe ACI requirement (S-PPR-0.5), same with the require-ment (S-PPR-1.0), and 50 % more than the requirement(SPPR-1.5). In all specimens, identical three-strand tendonswith 2050 MPa tensile strength were used. D10 and D6
(a) (b)
(c)
P/8P/8 P/8P/8 P/8P/8 P/8P/8
Load Cell
300kN Oil-Jack
Load cellOil jack
Hinge and loading plate
Loading beam
Load cell LVDT(2000kN)
Hinge(lp=100mm) Load cell
(1000kN)
Roller(lp=50mm)Load cell
(1000kN)LVDT ¥ Õ6mm Strand
tendon
L=2400,3400,4300mmL/4L/4 L/4 L/8L/8
L=2400,3400,4300mm
Fig. 2 Test setup a actuator and specimen b loading points and support c load cell and LVDT.
(a)
(b)
(c)
Fig. 3 Loading points and supports of a specimen S-L/dp-25, b specimen S-L/dp-35, c specimen S-L/dp-45 and specimen S-PPR.
International Journal of Concrete Structures and Materials (Vol.10, No.4, December 2016) | 427

rebars were used as reinforcing steel. The effective prestressof tendon (fpe) was 60 % of its ultimate stress (fpu). Theconcrete compressive strength was 35 MPa. See Figs. 2 and3 for their configurations.The mixtures of LWC for the test are listed in Table 2, and
the material properties of lightweight aggregates are listed inTable 3. Test results of lightweight concrete mixture areshown in Table 4. The designed compressive strength of theready-mixed concrete using lightweight aggregates was35 MPa for all specimens. Artificially expanded clay gran-ules with maximum sizes of 20 and 5 mm were used forlightweight coarse and lightweight fine aggregates, respec-tively. The lightweight fine aggregates were replaced withlocal natural sand by as much as 30 % by volume in order tocontrol the continuous grading. The average dry density of
the mixed LWC was approximately 1770 kg/m3. Themechanical properties of the steel reinforcing bars are listedin Table 5. The tensile strength and equivalent yield strength(fpy) of the low relaxation three-wire mono-strand were 2050and 1852 MPa, respectively. The equivalent yield strength ofthe strand was calculated using measured nonlinear stress–strain curves according to ASTM A 416 (American Societyfor Testing and Materials 1996). The yield strengths of themild reinforcing bars with diameters of 10 and 6 mm were446 and 475 MPa, respectively.
2.2 Test Procedure and MeasurementEach continuous one-way slab specimen was supported on
hinges at both ends and on a roller at the center. The uniformload was applied by universal testing machine (UTM) at a
Table 2 Mixture proportions of lightweight concrete.
W/C (%) VG Unit weight (kg/m3)
Water Cement Light fineaggregate
Sand Light coarseaggregate
37 0.573 181 542 311 230 554
W/C water-cement ratio, VG apparent density ratio of coarse aggregate.
Table 3 Material properties of lightweight aggregates.
Aggregates Max. size (mm) Specific gravity Unit weight(kg/m3)
Finenessmodulus
Absorption (%) Void ratio (%)
1 day 14 days
Coarse 19 1.80 931 3.365 11.8 14.29 48
Fine 4 1.80 1105 1.838 15.9 18.53 39
2 1.30 978 2.458 19.1 24.3 25
Table 4 Lightweight concrete mixture test results.
No. Slump(mm)
Compressive strength (MPa) Splitting tensilestrength
Modulus of rupture Modulusof
elasticity(MPa)
1 day 3 days 7 days 28 days 56 days 92 days fsp(MPa)
fspffiffiffiffi
fckp fr
(MPa)
frffiffiffiffi
fckp Ec
1 220 4.9 15.1 30.4 36.7 38.7 39.3 3.19 0.53 2.81 0.46 11,614
2 230 4.7 13.5 24.1 29.2 30.5 31.9 2.62 0.49 3.15 0.58 13,442
3 242 5.2 16.7 29.4 35.2 38.5 39.3 2.53 0.47 2.91 0.49 11,280
Table 5 Material properties of steels.
Area (mm2) Yield strain Yield strength(MPa)
Tensile strength(MPa)
Young’s modulus(MPa)
Elongation (%)
Anchoring plate – – 402 480 – –
Tendon (3 strands) 19.89 0.01000 1852 2050 201,319 5.7
Mild bar
D10 71.00 0.00279 446 639 214,976 18.4
D6 31.60 0.00282 475 500 171,121 3.9
428 | International Journal of Concrete Structures and Materials (Vol.10, No.4, December 2016)

(a) Group 1
(b) Group 2
Fig. 4 Section details and arrangement of reinforcing bars in specimens.
Specimen S-L/dp=45 is identical with S-PPR-1.0 of Group 2
(a) Group 1
(b) Group 2
S-L/d p=3573 73 55
67557047 67
768080
4360
70
80 476060
76 60646868 68
4975 60
60 6075
70 70
7064
76
7171
7947
2447 45
354568 75
S-L/d p=25100
12011593
119
84
90121
849384
67
113
84
100
90
108115108 110 121 121
12183
75 100 1086380
100
S-PPR-0.5
S-PPR-1.0
S-PPR-1.5 44
44 44
44
43 43 4343
40
48 48 48 4848
48
48 48 4848
40 4040
4040
50 5131 46
4936
40
4736
48
4747 47
555555 55
48 40
4025
3036 48
1515
2035
4849
6464
5064 50 564850 48
544853
48374258 64
533853 58
5034 34
5053
54 61573840
50595940
52
3459
59 6153
52
3461
6152 55
655556 56
6456 52
31
5250 26
555950
3840
34 3630
36 3531 30
353829
3029
3429 34 34 34 35 35
2928
283530
2537
Fig. 5 Crack development of each group.
International Journal of Concrete Structures and Materials (Vol.10, No.4, December 2016) | 429

rate of 2.5 mm per minute. Linear variable differentialtransducers (LVDTs) were installed beneath the specimens atthe loading points to measure the vertical deflection (Fig. 2).The 200 kN capacity load cells were installed on both endsof specimens to trace the stress incremental in unbondedtendons. The loading points and supports of each specimenare described in Fig. 3 and the section details are shown inFig. 4. The crack width was measured from where the firstcracks appeared until the reinforcing steels yielded. Electri-cal resistance strain gages were attached to the surface of theconcrete and the steel to check how the strain changes,especially when concrete reached its ultimate strain (0.003).Concrete strain gages were installed on both compressiveand tensile area of the center and the edges of specimens.Wire strain gages were installed on rebars at intervals of d/2.All data from the UTM, load cells, and gages were collectedinto a data logger and saved in a computer. Through theprocess, the following information was obtained: crackdevelopment pattern and failure mode; load–displacementrelationship; load-reaction relationship; load-tendon stress;flexural capacity; flexural ductility; and curvature-prestressloss.
3. Test Results
3.1 Crack Propagation and Failure ModeCrack propagation patterns were marked in Fig. 5. No
diagonal crack was found; that means in this test, that flex-ural behavior was dominant. The maximum momentoccurred at the center supports of the slabs; therefore, crackswere initiated at the upper parts of the center supports(negative moment region) and then developed at the lowerparts of mid-spans (positive moment region). Due to thereinforcing steels, the cracks maintained the same intervalsto each other, propagating towards the middle of the spans.Upon reaching maximum loading, cracks also achieved theirmaximum width at the center of the spans, while cracks atthe supporting areas stopped developing prior to that stage.When the simultaneous compressive fracture and dramaticflexural strength reduction was achieved the test was ter-minated. The crack happened at the same position of themembers regardless of the L/dp. The major cracks propa-gated until the peak loading was reached and then com-pressive fractures were triggered. With the higher L/dp, thecracks distributed more broadly. In all specimens, only alittle more crack propagations were observed after the peakloading. In Group 2, specimen S-PPR-0.5 reinforced lessthan S-PPR-1.5 showed fewer number of cracks althoughtheir width were bigger. That means specimens with morereinforcing steels are advantageous in control of crack width,although more fine cracks are expected.
3.2 Load–Deflection RelationshipIn Group 1, as the L/dp increased from 25 to 45, the ultimate
load was reduced by 44 %, while the deflection at the ultimateloads was increased (Table 6). Initial crack strength (Pcr) andyield strength (Py) also dropped as the L/dp increased. As
Table
6Te
stresu
lts.
Specimen
Pcr(kN)
Py(kN)
Pn(kN)
Vn(kN)
Dcr(m
m)
Dy(m
m)
Dn(m
m)
f ps(M
Pa)
Df ps
(MPa)
Df ps-
ACI
(MPa)
Df ps-
EXP/
Df ps-
ACI
Pn-ACI
(kN
m)
Pn-EXP/
Pn-ACI
Mcr
(kN
m)
g cr
xM
n
(kN
m)
g nM
n-EXP/
Mn-
ACI
Mid
Edge
Mid
Edge
Mid
Edge
Group
1
S-L/d
p-25
61.7
65.7
80.9
89.8
254.5
77.2
50.1
5.6
13.0
48.8
1613
358
256
1.40
214.5
1.19
14.77
0.0401
0.114
26.98
0.0732
1.35
S-L/d
p-35
23.5
46.1
37.8
64.2
155.5
48.3
29.4
11.8
31.1
85.3
1788
505
256
1.97
155.9
1.00
14.68
0.0398
0.123
26.29
0.0713
1.32
S-L/d
p-45
14.7
30.4
46.6
43.3
111.1
33.2
22.3
11.6
36.8
165.8
1669
430
132
3.25
120.7
0.92
12.25
0.0332
0.116
21.68
0.0588
1.22
Group
2
S-PPR-0.5
14.7
28.4
25.7
24.4
75.9
23.9
14.1
29.1
14.0
95.8
1540
285
132
2.16
97.5
0.78
11.46
0.0311
0.095
14.68
0.0398
0.97
S-PPR-1.0
14.7
30.4
46.6
43.3
111.1
33.2
22.3
11.6
36.8
165.8
1669
430
132
3.25
120.7
0.92
12.25
0.0332
0.116
21.68
0.0588
1.22
S-PPR-1.5
25.5
33.3
34.1
55.0
129.9
40.9
24.0
16.7
57.5
113.6
1655
400
132
3.03
131.8
0.99
13.43
0.0365
0.130
26.82
0.0728
1.32
Pcrcracking
load,P
yyielding
load,P
nultimateload,V
nforceatfailed
span,D
cr,D
y,Dndeflection
atthefirstfl
exuralcrack,atyielding
ofmildlongitudinaltensilereinforcem
ent,andattheultimatestate,respectively,f
ps,Df psstress
ofprestressing
strandsandits
increase,Pn-ACIultimateload
predictedby
ACI,Pn(ExP
)ultimateload
byexperiment,g c
rcracking
mom
entcapcity(=M
cr/f0 c�b
w�h
2),g n
ultimatemom
entcapcity(=M
n/f0 c�b
w�h
2),x
reinforcingindex
¼Apf psþAsf y
bdef0 c
��
.
430 | International Journal of Concrete Structures and Materials (Vol.10, No.4, December 2016)

shown in Fig. 6a, as L/dp increased, the maximum flexuralstrength of the slabs decreased and the ductility increased. InGroup 2, as shown in Fig. 6b, specimen S-PPR-1.0 showedexcellent ductility while specimen S-PPR-0.5 reinforced withthe least number of reinforcement among Group 2 specimensshowed compressive fracture after the reinforcement yielding.Specimen S-PPR-1.5 which is reinforced with 50 % moresteel than required was less ductile than S-PPR-1.0with 17 %higher ultimate load.
3.3 Stress of Unbonded Prestressing TendonsThe relationship of the load and the unbonded prestressing
tendon stress was almost identical to that of the load–de-flection. Even after reaching the ultimate loading, the tendonstresses increased continuously to bear the tension stressuntil the member failure. Figure 7a shows the effect of the L/dp on the load-tendon stress relationship. As the L/dpincreased, the ultimate stress in tendons decreased. Fig-ure 7b shows the effects of the qs on the load-tendon stress
Fig. 6 Load-deflection relationship for each group.
Fig. 7 Load-tendon stress relationship for each group.
Table 7 Comparison of experiments and standards for ultimate stress increment of unbonded tendons.
Specimen Experimental Dfps� �
exp
.
Dfps� �
pre
fps (MPa) Dfps (MPa) ACI AASHTO CAN3
S-L/dp = 25 1613 358 1.38 1.14 0.66
S-L/dp = 35 1760 505 3.79 2.28 1.32
S-L/dp = 45 1669 430 3.22 2.45 1.42
S-PPR-0.5 1540 285 2.14 1.58 0.92
S-PPR-1.0 1669 430 3.22 2.45 1.42
S-PPR-1.5 1655 400 2.99 2.34 1.34
International Journal of Concrete Structures and Materials (Vol.10, No.4, December 2016) | 431
relationship. All specimens in Group 2 showed similar stressincrements until the initial crack happened. The maximumstress of S-PPR-1.0 was higher than S-PPR-0.5, even higherthan S-PPR-1.5. The measured stress increase in unbondedtendons was higher than that from ACI and AASHTO(Table 7).
3.4 Cracking and Ultimate Moment CapacitiesThe normalized cracking capacities, gcr =Mcr/(f
0c�bw�h2)
and the ultimate moment capacities, gn =Mn/(f0c�bw�h2) of the
specimens are listed in Table 6. The gcr decreased as the L/dpratio increased in Group 1, and a higher gn was developedwith an L/dp ratio of 25 than those with an L/dp ratio of 35 or45. In Group 2, gn increased in proportion to the qs.In Fig. 7, the ultimate moment of the specimens, (Mn)Exp
is compared with the corresponding value predicted by theACI 318-11 design procedure, (Mn)Pre. The safety of theACI 318-11 provision is significantly dependent on thereinforcing index (x) and the loading type, but it is inde-pendent of the L/dp ratio. However, a moment capacityreduction was observed in the S-L/dp-45 of Group 1(Fig. 8a). When qs is half of the requirement, the (Mn)Exp/(Mn)Pre is less than unit (Fig. 8b).
4. Comparison with Standards
In Table 7, the stress in prestressing steel (fps) and itsincrement (Dfps) of each specimen are listed. Also, theexperimental results were compared to the standards.The mean and standard deviation of the ratios of the
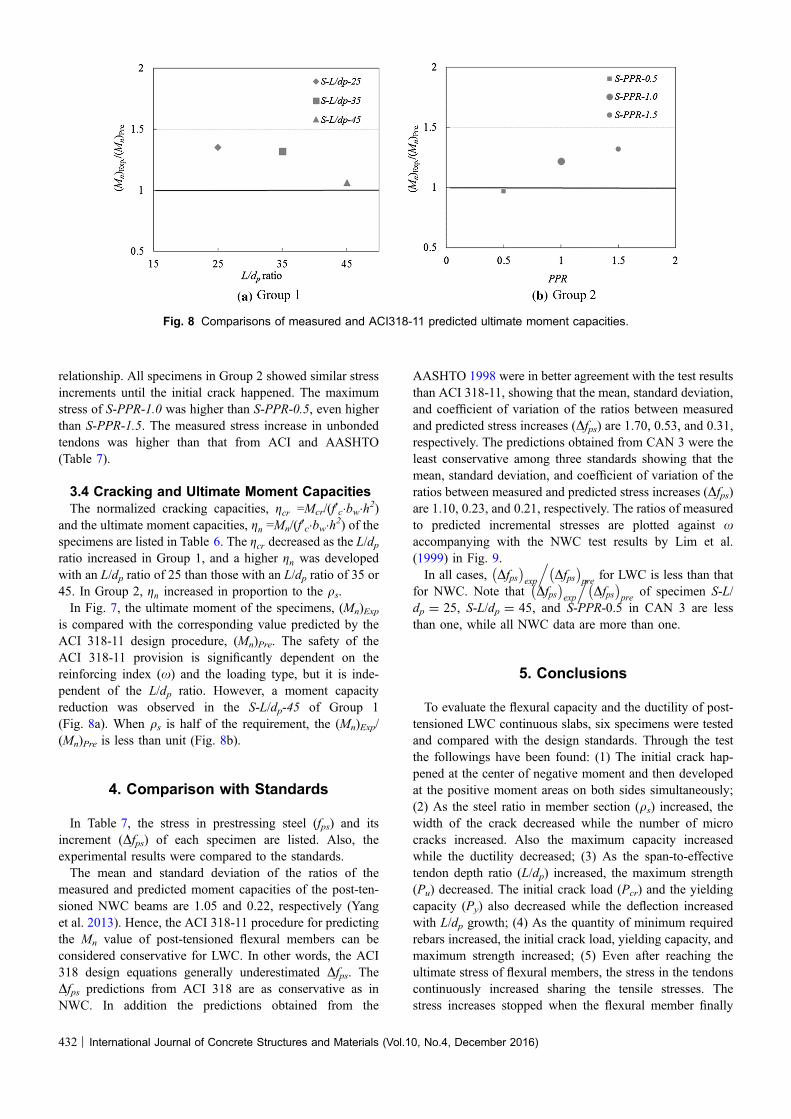
measured and predicted moment capacities of the post-ten-sioned NWC beams are 1.05 and 0.22, respectively (Yanget al. 2013). Hence, the ACI 318-11 procedure for predictingthe Mn value of post-tensioned flexural members can beconsidered conservative for LWC. In other words, the ACI318 design equations generally underestimated Dfps. TheDfps predictions from ACI 318 are as conservative as inNWC. In addition the predictions obtained from the
AASHTO 1998 were in better agreement with the test resultsthan ACI 318-11, showing that the mean, standard deviation,and coefficient of variation of the ratios between measuredand predicted stress increases (Dfps) are 1.70, 0.53, and 0.31,respectively. The predictions obtained from CAN 3 were theleast conservative among three standards showing that themean, standard deviation, and coefficient of variation of theratios between measured and predicted stress increases (Dfps)are 1.10, 0.23, and 0.21, respectively. The ratios of measuredto predicted incremental stresses are plotted against xaccompanying with the NWC test results by Lim et al.(1999) in Fig. 9.In all cases, Dfps
� �
exp
.
Dfps� �
prefor LWC is less than that
for NWC. Note that Dfps� �
exp
.
Dfps� �
preof specimen S-L/
dp = 25, S-L/dp = 45, and S-PPR-0.5 in CAN 3 are lessthan one, while all NWC data are more than one.
5. Conclusions
To evaluate the flexural capacity and the ductility of post-tensioned LWC continuous slabs, six specimens were testedand compared with the design standards. Through the testthe followings have been found: (1) The initial crack hap-pened at the center of negative moment and then developedat the positive moment areas on both sides simultaneously;(2) As the steel ratio in member section (qs) increased, thewidth of the crack decreased while the number of microcracks increased. Also the maximum capacity increasedwhile the ductility decreased; (3) As the span-to-effectivetendon depth ratio (L/dp) increased, the maximum strength(Pu) decreased. The initial crack load (Pcr) and the yieldingcapacity (Py) also decreased while the deflection increasedwith L/dp growth; (4) As the quantity of minimum requiredrebars increased, the initial crack load, yielding capacity, andmaximum strength increased; (5) Even after reaching theultimate stress of flexural members, the stress in the tendonscontinuously increased sharing the tensile stresses. Thestress increases stopped when the flexural member finally
Fig. 8 Comparisons of measured and ACI318-11 predicted ultimate moment capacities.
432 | International Journal of Concrete Structures and Materials (Vol.10, No.4, December 2016)

ruptured; (6) As the L/dp increased, the stresses in tendonsdecreased. That means L/dp is a critical factor affecting thetendon stresses; (7) In all specimens, before the initial crack,no stress change was observed in the tendons. After initialcrack happened, the tendon stresses increased gradually asthe applied load was increased; (8) With fewer rebars, thestress-increasing rate in the tendons was relatively high. TheACI standard evaluated the stress increment conservatively.The expected stress increase in unbonded tendon espe-
cially by ACI and AASHTO were less than the test results inall specimens. In other words, the normalized flexuralcapacity of the post-tensioned LWC slabs was higher thanthe predictions based on the ACI code provision. The
differences were not negligible quantity so it may causeoverdesign.
Open Access
This article is distributed under the terms of the CreativeCommons Attribution 4.0 International License(http://creativecommons.org/licenses/by/4.0/), which per-mits unrestricted use, distribution, and reproduction in anymedium, provided you give appropriate credit to the originalauthor(s) and the source, provide a link to the CreativeCommons license, and indicate if changes were made.
References
AASHTO. (1998). AASHTO LRFD Bridge Design Specifica-
tions. Washington D.C: American Association of State
Highway and Transportation officials.
ACI Committee 318. (2011). Building code requirements for
structural concrete (ACI 318-11) and commentary (ACI
318R-11). Farmington Hills, MI: American Concrete
Institute.
ASTM A 416. (1996). Standard specification for steel strand,
uncoated seven-wire for prestressed concrete. West Con-
shohocken: American Society for Testing and Materials.
Au, F. T. K., & Du, J. S. (2004). Prediction of ultimate stress in
unbonded prestressed tendons. Magazine of Concrete
Research, 56(1), 1–11.
Burns, N. H., Charney, F. A., & Vine, W. R. (1978). Tests of
one-way post-tensioned slabs with unbonded tendons. PCI
Journal, pp. 66–81.
Cai, J., Li, G., Yang, C., & Lin, F. (2009). Tests on unbonded
posttensioned concrete flat plate with T-shaped column
connections. Advances in Structural Engineering, 9(5),
671–685.
Campbell, T. I., & Chouinard, K. L. (1991). Influence of non-
prestressed reinforcement on the strength of unbonded
partially prestressed concrete members. ACI Structural
Journal, 88(5), 546–551.
Canadian Standards Association (Can3-A23-M94) (1994) De-
sign of Concrete Structures for Buildings.
Chakrabarti, P. R. (1995). Ultimate stress for unbonded post-
tensioning tendons in partially prestressed beams. ACI
Structural Journal, 92(6), 689–697.
Chandra, S., & Berntsson, L. (2003). Lightweight aggregate
concrete: Science, technology and applications. Norwich,
NY: Noyes Publications.
Collins, M. P., & Mitchell, D. (1991). Prestressed concrete
structures. Upper Saddle River, NJ: Prentice-Hall.
Ellobody, E., & Bailey, C. G. (2008). Behavior of unbonded
posttensioned one-way concrete slabs. Advances in Struc-
tural Engineering, 11(1), 107–120.
Harajli, M. H. (2006). On the stress in unbonded tendons at
ultimate: Critical assessment and proposed changes. ACI
Structural Journal, 103(6), 803–812.
Fig. 9 Comparisons of measured and predictions for Dfps.
International Journal of Concrete Structures and Materials (Vol.10, No.4, December 2016) | 433

Harajli, M. H. & Kanj, M. (1990). Experimental and analytical
study of the behavior of concrete beams prestressed with
unbonded tendons, Report No. CE/FSEL 90-02, University
of Oklahoma, Norman, OK.
Kayali, O. (2008). Fly ash lightweight aggregates in high per-
formance concrete. Construction and Building Materials,
22(12), 2393–2399.
Lim, J. H., Moon, J. H., & Lee, L. H. (1999). Experimental
examination of influential variables on unbonded tendon
stresses. Journal of Korea Concrete Instititute, 11(1),
209–219.
Lou, T. J., & Xiang, Y. Q. (2007). Effects of ordinary tension
reinforcement on the response of beams with unbonded
tendons. Advances in Structural Engineering, 10(1),
95–109.
Manisekar, R., & Senthil, R. (2006). Stress at ultimate in
unbonded post tensioning tendons for simply supported
beams: A state-of-the-art review. Advances in Structural
Engineering, 9(3), 321–335.
Mojtahedi, S., & Gamble, W. (1978). Ultimate steel stress in
unbonded prestressed concrete. Journal of Structural
Division, ASCE, 104(ST7), 1159–1165.
Naaman, A. E., & Alkhairi, F. M. (1991). Stress at ultimate
unbonded post-tensioned tendons. ACI Structural Journal,
88(6), 683–692.
Oh, B. H., & Choi, Y. C. (2004). State-of-the-arts of prestressed
concrete structures. Magazine of the Korea Concrete
Institute, 16(1), 12–21.
Ozkul, O., Nassif, H., Tanchan, P., & Haraili, M. (2008).
Actional approach for predicting stress in beams with
unbonded tendons. ACI Structural Journal, 105(3),
338–347.
Tang, W. C., Lo, T. Y., & Chan, W. K. (2008). Fracture prop-
erties of normal and lightweight high-strength concrete.
Magazine of Concrete Research, 60(4), 237–244.
Warwaruk, J., Sozen, M. A., & Siess, C. P. (1962). Investigation
of prestressed reinforced concrete for highway bridges,
part III: Strength and behavior in flexure of prestressed
concrete beams, Bulletin No. 464, Engineering Experiment
Station, University of Illinois, Urbana, IL.
Yang, K. H. (2010). Tests on lightweight concrete deep beams.
ACI Structural Journal, 107(6), 663–670.
Yang, K. H., & Mun, J. H. (2013). Flexural capacity and stress
in unbonded tendons of post-tensioned lightweight concrete
beams. Advances in Structural Engineering, 16(7),
1297–1310.
Yang, K. H., Mun, J. H., & Kim, G. H. (2013). Flexural behavior
of post-tensioned normal-strength lightweight concrete one-
way slabs. Engineering Structures, 56, 1295–1307.
434 | International Journal of Concrete Structures and Materials (Vol.10, No.4, December 2016)