Embed Size (px)
Citation preview
FLEET PROCUREMENT ANALYSIS TOOL USER GUIDE
A TOOL DESIGNED TO EVALUATE THE FINANCIAL VIABILITY AND ENVIRONMENTAL IMPACT OF LIGHT-DUTY FLEET VEHICLE
PROCUREMENTS
ATLAS PUBLIC POLICY WASHINGTON, DC USA
PUBLISHED OCTOBER 2017 VERSION 1.08
Fleet Procurement Analysis Tool User Guide
Atlas Public Policy 2
CONTENTS
ABOUT THE FLEET PROCUREMENT ANALYSIS TOOL ...................................................................................... 3
OVERVIEW OF THE TOOL STRUCTURE ........................................................................................................... 4
Advanced Procurement Comparison Analsysis .......................................................................................... 5
GETTING STARTED ......................................................................................................................................... 6
Step 1: Opening the Tool ........................................................................................................................... 6
Step 2: Initial Settings Tab .......................................................................................................................... 6
Step 3: Inputs Tab ...................................................................................................................................... 7
Step 4: Results Tab ..................................................................................................................................... 9
Step 5: Financial And Environmental Modelling ...................................................................................... 12
DATA MANAGEMENT ................................................................................................................................... 13
APPENDIX A : INPUT FIELDS DESCRIPTIONS ................................................................................................. 14
Market Inputs .......................................................................................................................................... 14
Vehicle Inputs .......................................................................................................................................... 15
Vehicle Procurement Inputs .................................................................................................................... 17
EV Infrastructure Inputs .......................................................................................................................... 19
APPENDIX B : VERSION HISTORY .................................................................................................................. 20
Fleet Procurement Analysis Tool User Guide
Atlas Public Policy 3
ABOUT THE FLEET PROCUREMENT ANALYSIS TOOL
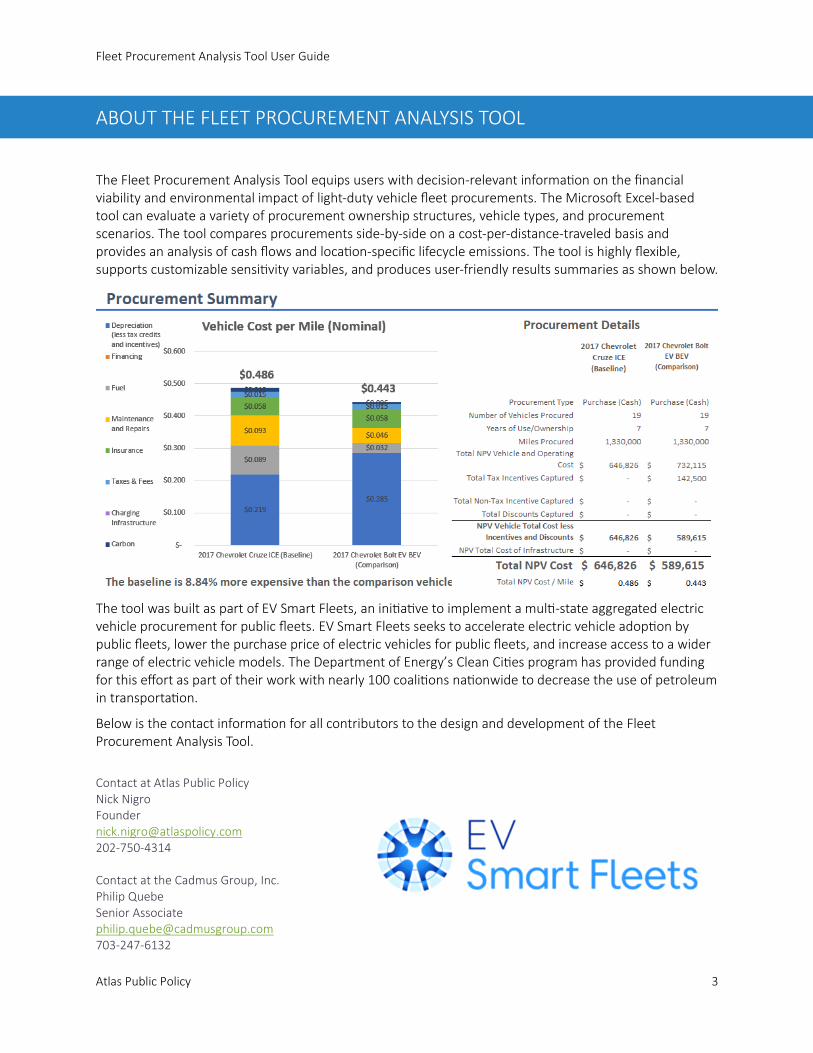
The Fleet Procurement Analysis Tool equips users with decision-relevant information on the financial viability and environmental impact of light-duty vehicle fleet procurements. The Microsoft Excel-based tool can evaluate a variety of procurement ownership structures, vehicle types, and procurement scenarios. The tool compares procurements side-by-side on a cost-per-distance-traveled basis and provides an analysis of cash flows and location-specific lifecycle emissions. The tool is highly flexible, supports customizable sensitivity variables, and produces user-friendly results summaries as shown below.
The tool was built as part of EV Smart Fleets, an initiative to implement a multi-state aggregated electric vehicle procurement for public fleets. EV Smart Fleets seeks to accelerate electric vehicle adoption by public fleets, lower the purchase price of electric vehicles for public fleets, and increase access to a wider range of electric vehicle models. The Department of Energy’s Clean Cities program has provided funding for this effort as part of their work with nearly 100 coalitions nationwide to decrease the use of petroleum in transportation.
Below is the contact information for all contributors to the design and development of the Fleet Procurement Analysis Tool.
Contact at Atlas Public Policy Nick Nigro Founder [email protected] 202-750-4314 Contact at the Cadmus Group, Inc. Philip Quebe Senior Associate [email protected] 703-247-6132
Fleet Procurement Analysis Tool User Guide
Atlas Public Policy 4
OVERVIEW OF THE TOOL STRUCTURE
The Fleet Procurement Analysis Tool was built using Microsoft Excel and is contained in a standalone Excel workbook. It is divided into five functional areas, as follows:
• Initial Settings (Grey tab)
• Inputs (Green tab)
• Results (Dark blue tab)
• Financial Model (Light blue tab)
• Environmental Model (Light blue tab)
User inputs in the Initial Settings and Inputs sections are color-coded as follows:
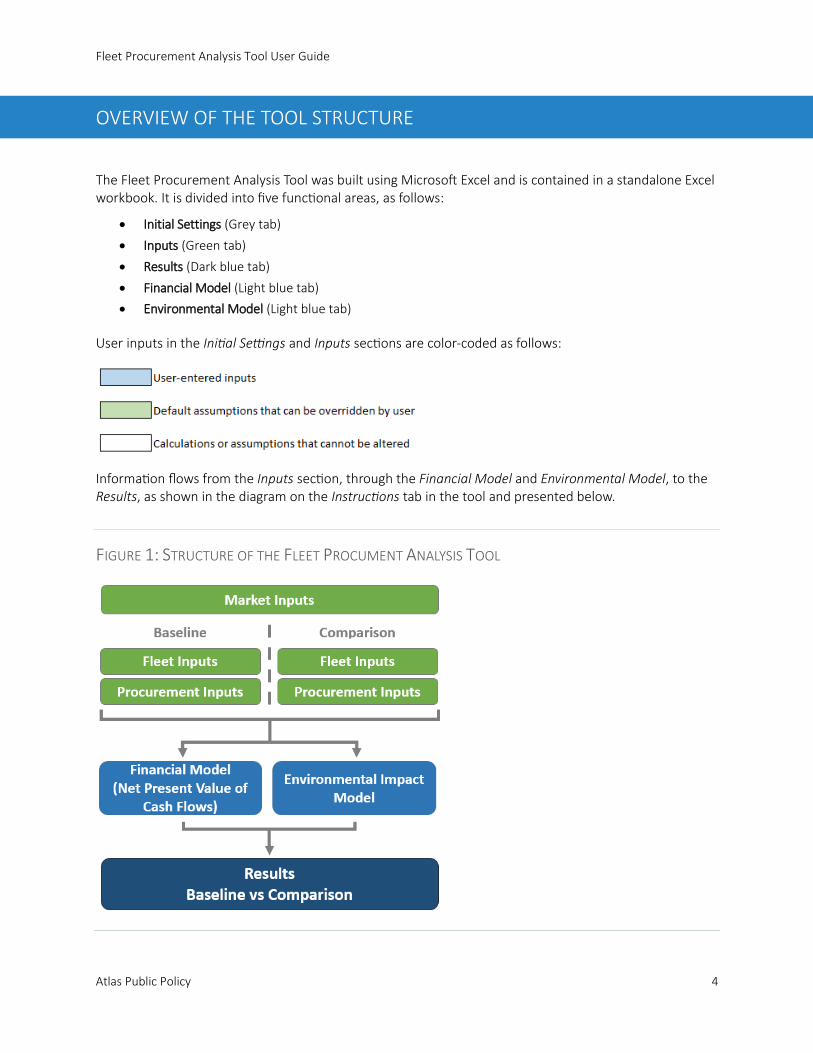
Information flows from the Inputs section, through the Financial Model and Environmental Model, to the Results, as shown in the diagram on the Instructions tab in the tool and presented below.
FIGURE 1: STRUCTURE OF THE FLEET PROCUMENT ANALYSIS TOOL
Fleet Procurement Analysis Tool User Guide
Atlas Public Policy 5
ADVANCED PROCUREMENT COMPARISON ANALSYSIS
The tool analyzes a potential vehicle procurement and compares it side-by-side with a baseline procurement. This way, you can assess the viability of a future procurement by comparing it to a past or alternative procurement. The tool supports the financial analysis of several ownership structures, from basic cash or loan purchases to sophisticated leasing structures.
More information on leasing structures can be found online at http://www.investopedia.com/terms/c/capitalleasemethod.asp.
The following are the ownership structures that the tool supports:
• Purchase (Cash): Vehicles purchased with cash
• Purchase (Loan): Vehicles purchased with debt financing
• FMV (Closed-End) Lease: Vehicles leased with Fair Market Value lease structure. Vehicles not
purchased at end of lease term.
• FMV (Closed-End) Lease w/ Cash Purchase: Vehicles leased with Fair Market Value lease structure.
Vehicles purchased at end of lease term with cash.
• FMV (Closed-End) Lease w/ Loan Purchase: Vehicles leased with Fair Market Value lease structure.
Vehicles purchased at end of lease term with debt financing.
• TRAC (Open-End) Lease: Vehicles leased with Terminal Rental Adjustment Clause lease structure.
Vehicles not purchased at end of lease term.
• TRAC (Open-End) Lease w/ Cash Purchase: Vehicles leased with Terminal Rental Adjustment Clause
lease structure. Vehicles purchased at end of lease term with cash.
• TRAC (Open-End) Lease w/ Loan Purchase: Vehicles leased with Terminal Rental Adjustment Clause
lease structure. Vehicles purchased at end of lease term with debt financing.
• Tax-Exempt Lease Purchase (Cash): Vehicles leased with tax-exempt lease-purchase structure. Vehicles
purchased at end of lease term with cash, typically a nominal amount ($1).
In addition to choosing an ownership structure, you can also customize inputs to incorporate fleet specific usage and costs, the vehicle pricing structure, incentives and discounts, and optional electric vehicle charging infrastructure.
Fleet Procurement Analysis Tool User Guide
Atlas Public Policy 6
GETTING STARTED
STEP 1: OPENING THE TOOL
To open the tool, double click on the file entitled “Fleet Procurement Analysis Tool.xlsm” Make sure to enable macros by clicking the “Enable Content” button that appears in the yellow bar at the top of the screen. Enabling macros is essential for the tool to behave as designed.
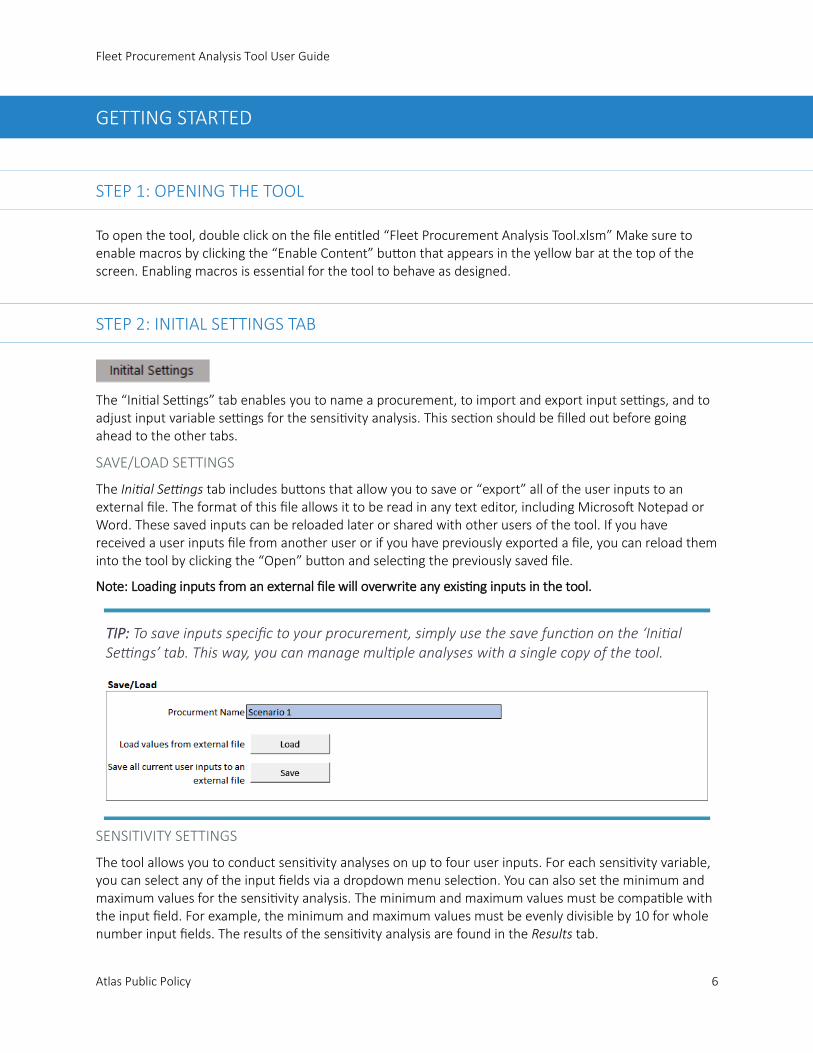
STEP 2: INITIAL SETTINGS TAB
The “Initial Settings” tab enables you to name a procurement, to import and export input settings, and to adjust input variable settings for the sensitivity analysis. This section should be filled out before going ahead to the other tabs.
SAVE/LOAD SETTINGS
The Initial Settings tab includes buttons that allow you to save or “export” all of the user inputs to an external file. The format of this file allows it to be read in any text editor, including Microsoft Notepad or Word. These saved inputs can be reloaded later or shared with other users of the tool. If you have received a user inputs file from another user or if you have previously exported a file, you can reload them into the tool by clicking the “Open” button and selecting the previously saved file.
Note: Loading inputs from an external file will overwrite any existing inputs in the tool.
SENSITIVITY SETTINGS
The tool allows you to conduct sensitivity analyses on up to four user inputs. For each sensitivity variable, you can select any of the input fields via a dropdown menu selection. You can also set the minimum and maximum values for the sensitivity analysis. The minimum and maximum values must be compatible with the input field. For example, the minimum and maximum values must be evenly divisible by 10 for whole number input fields. The results of the sensitivity analysis are found in the Results tab.
TIP: To save inputs specific to your procurement, simply use the save function on the ‘Initial Settings’ tab. This way, you can manage multiple analyses with a single copy of the tool.
Fleet Procurement Analysis Tool User Guide
Atlas Public Policy 7
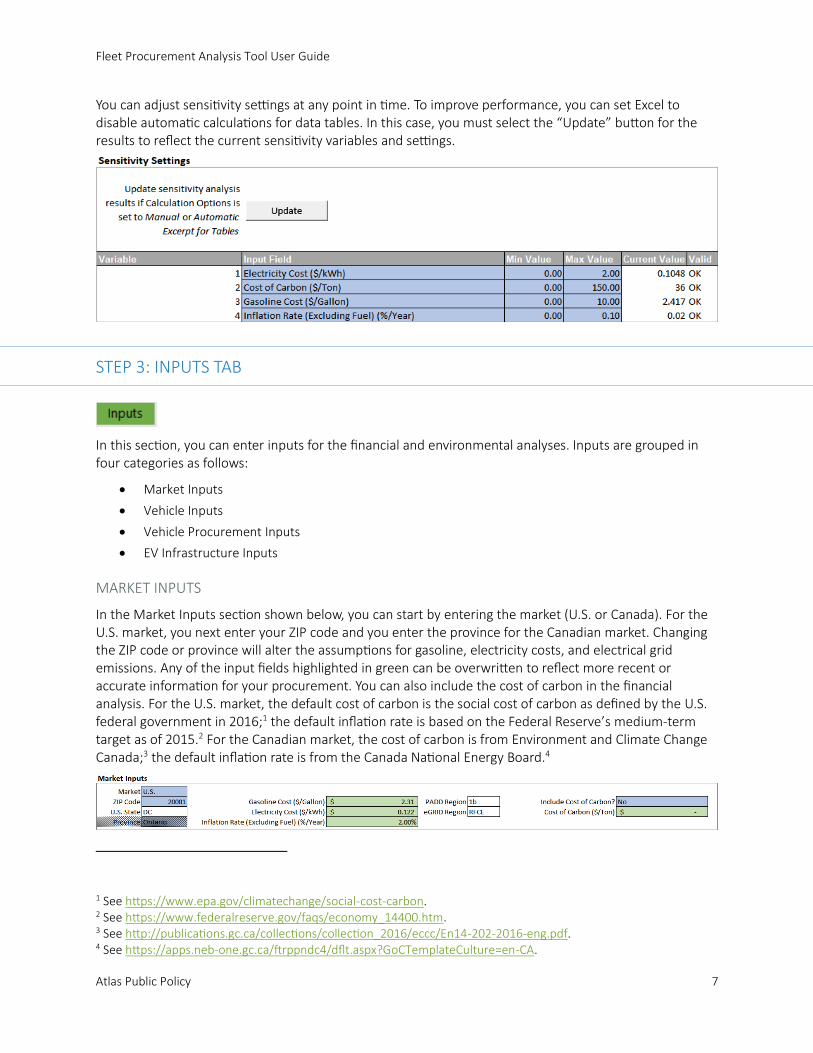
You can adjust sensitivity settings at any point in time. To improve performance, you can set Excel to disable automatic calculations for data tables. In this case, you must select the “Update” button for the results to reflect the current sensitivity variables and settings.
STEP 3: INPUTS TAB
In this section, you can enter inputs for the financial and environmental analyses. Inputs are grouped in four categories as follows:
• Market Inputs
• Vehicle Inputs
• Vehicle Procurement Inputs
• EV Infrastructure Inputs
MARKET INPUTS
In the Market Inputs section shown below, you can start by entering the market (U.S. or Canada). For the U.S. market, you next enter your ZIP code and you enter the province for the Canadian market. Changing the ZIP code or province will alter the assumptions for gasoline, electricity costs, and electrical grid emissions. Any of the input fields highlighted in green can be overwritten to reflect more recent or accurate information for your procurement. You can also include the cost of carbon in the financial analysis. For the U.S. market, the default cost of carbon is the social cost of carbon as defined by the U.S. federal government in 2016;1 the default inflation rate is based on the Federal Reserve’s medium-term target as of 2015.2 For the Canadian market, the cost of carbon is from Environment and Climate Change Canada;3 the default inflation rate is from the Canada National Energy Board.4
1 See https://www.epa.gov/climatechange/social-cost-carbon. 2 See https://www.federalreserve.gov/faqs/economy_14400.htm. 3 See http://publications.gc.ca/collections/collection_2016/eccc/En14-202-2016-eng.pdf. 4 See https://apps.neb-one.gc.ca/ftrppndc4/dflt.aspx?GoCTemplateCulture=en-CA.
Fleet Procurement Analysis Tool User Guide
Atlas Public Policy 8
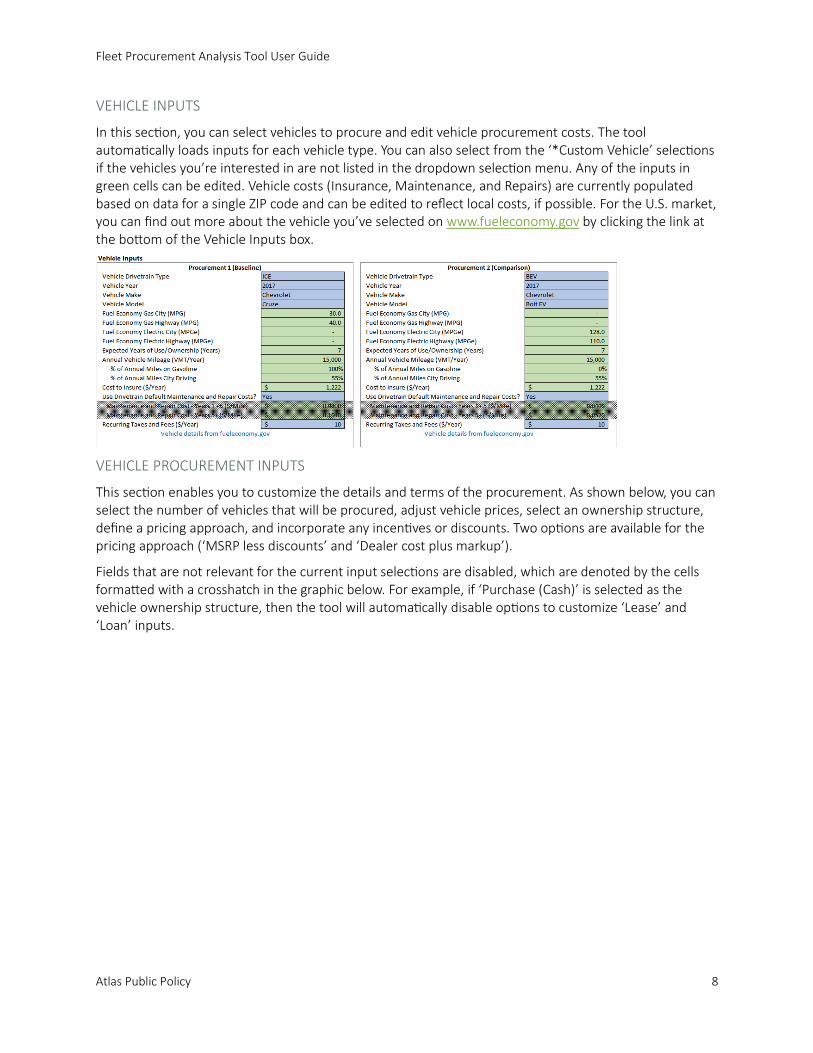
VEHICLE INPUTS
In this section, you can select vehicles to procure and edit vehicle procurement costs. The tool automatically loads inputs for each vehicle type. You can also select from the ‘*Custom Vehicle’ selections if the vehicles you’re interested in are not listed in the dropdown selection menu. Any of the inputs in green cells can be edited. Vehicle costs (Insurance, Maintenance, and Repairs) are currently populated based on data for a single ZIP code and can be edited to reflect local costs, if possible. For the U.S. market, you can find out more about the vehicle you’ve selected on www.fueleconomy.gov by clicking the link at the bottom of the Vehicle Inputs box.
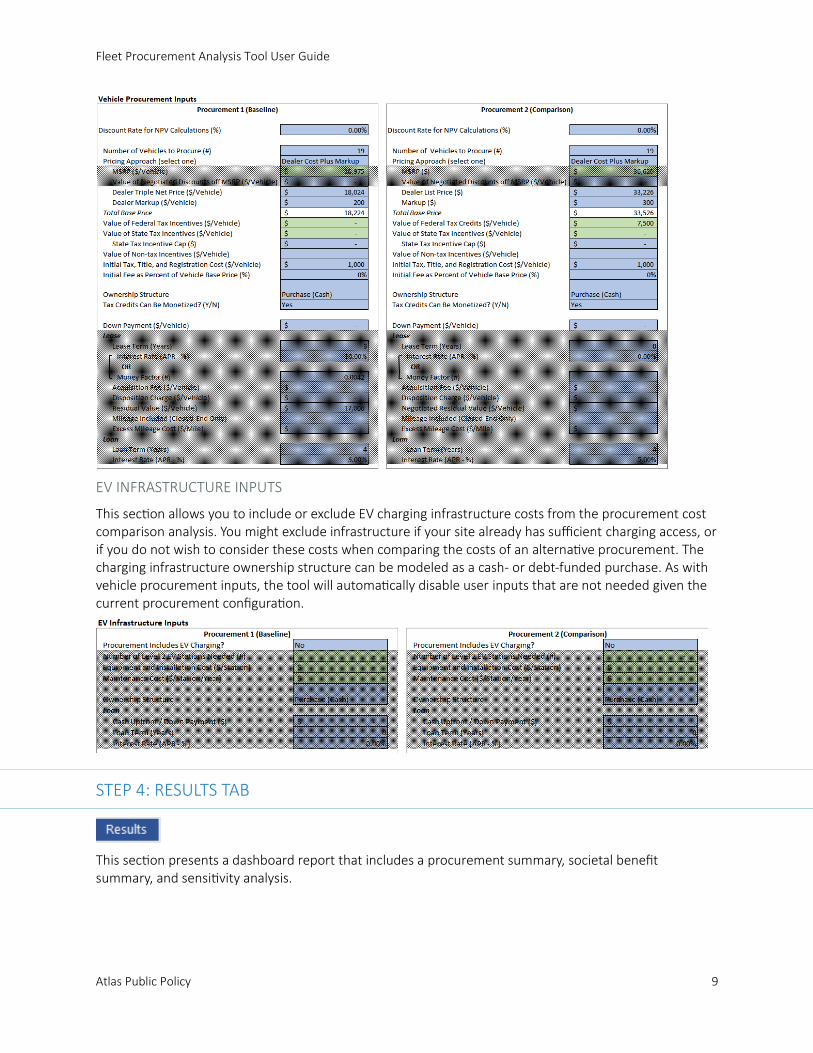
VEHICLE PROCUREMENT INPUTS
This section enables you to customize the details and terms of the procurement. As shown below, you can select the number of vehicles that will be procured, adjust vehicle prices, select an ownership structure, define a pricing approach, and incorporate any incentives or discounts. Two options are available for the pricing approach (‘MSRP less discounts’ and ‘Dealer cost plus markup’).
Fields that are not relevant for the current input selections are disabled, which are denoted by the cells formatted with a crosshatch in the graphic below. For example, if ‘Purchase (Cash)’ is selected as the vehicle ownership structure, then the tool will automatically disable options to customize ‘Lease’ and ‘Loan’ inputs.
Fleet Procurement Analysis Tool User Guide
Atlas Public Policy 9
EV INFRASTRUCTURE INPUTS
This section allows you to include or exclude EV charging infrastructure costs from the procurement cost comparison analysis. You might exclude infrastructure if your site already has sufficient charging access, or if you do not wish to consider these costs when comparing the costs of an alternative procurement. The charging infrastructure ownership structure can be modeled as a cash- or debt-funded purchase. As with vehicle procurement inputs, the tool will automatically disable user inputs that are not needed given the current procurement configuration.
STEP 4: RESULTS TAB
This section presents a dashboard report that includes a procurement summary, societal benefit summary, and sensitivity analysis.
Fleet Procurement Analysis Tool User Guide
Atlas Public Policy 10
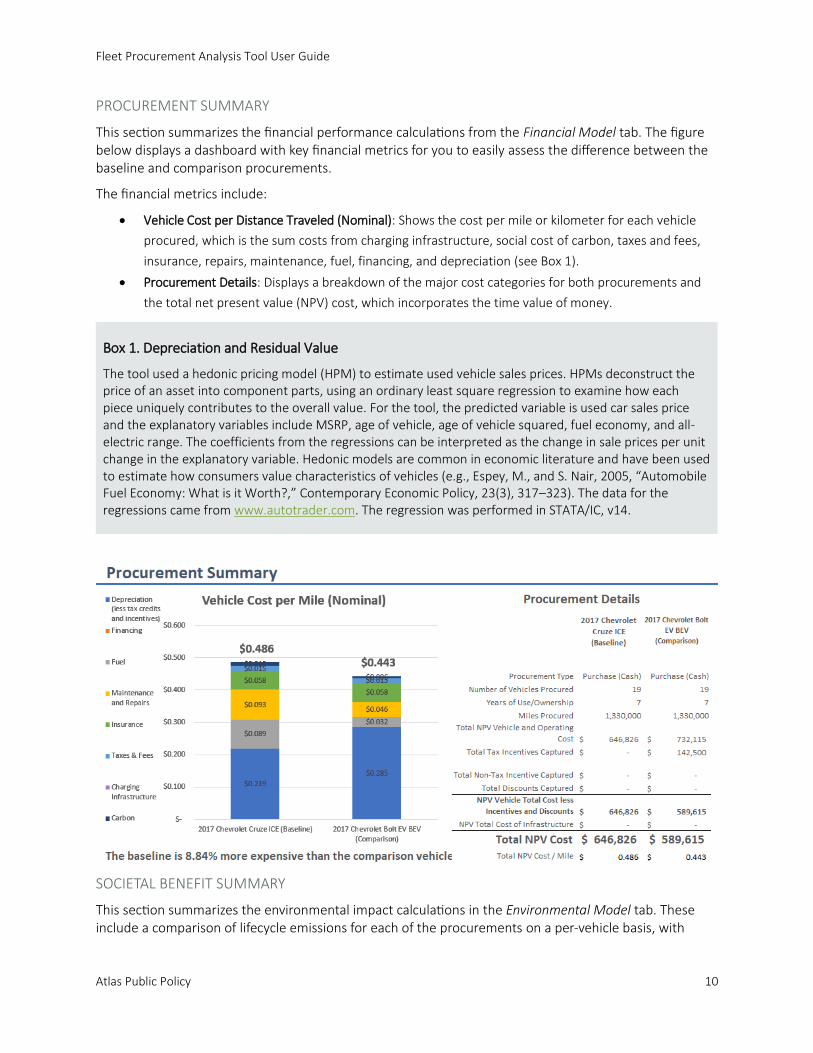
PROCUREMENT SUMMARY
This section summarizes the financial performance calculations from the Financial Model tab. The figure below displays a dashboard with key financial metrics for you to easily assess the difference between the baseline and comparison procurements.
The financial metrics include:
• Vehicle Cost per Distance Traveled (Nominal): Shows the cost per mile or kilometer for each vehicle
procured, which is the sum costs from charging infrastructure, social cost of carbon, taxes and fees,
insurance, repairs, maintenance, fuel, financing, and depreciation (see Box 1).
• Procurement Details: Displays a breakdown of the major cost categories for both procurements and
the total net present value (NPV) cost, which incorporates the time value of money.
Box 1. Depreciation and Residual Value
The tool used a hedonic pricing model (HPM) to estimate used vehicle sales prices. HPMs deconstruct the price of an asset into component parts, using an ordinary least square regression to examine how each piece uniquely contributes to the overall value. For the tool, the predicted variable is used car sales price and the explanatory variables include MSRP, age of vehicle, age of vehicle squared, fuel economy, and all-electric range. The coefficients from the regressions can be interpreted as the change in sale prices per unit change in the explanatory variable. Hedonic models are common in economic literature and have been used to estimate how consumers value characteristics of vehicles (e.g., Espey, M., and S. Nair, 2005, “Automobile Fuel Economy: What is it Worth?,” Contemporary Economic Policy, 23(3), 317–323). The data for the regressions came from www.autotrader.com. The regression was performed in STATA/IC, v14.
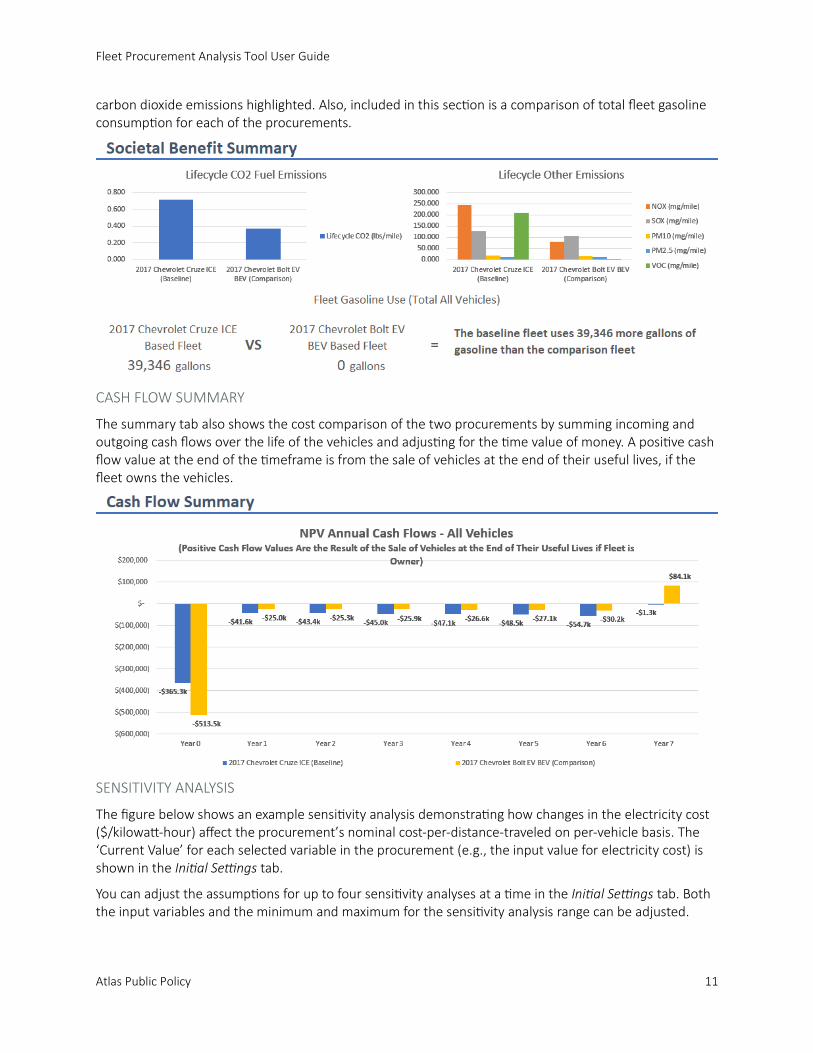
SOCIETAL BENEFIT SUMMARY
This section summarizes the environmental impact calculations in the Environmental Model tab. These include a comparison of lifecycle emissions for each of the procurements on a per-vehicle basis, with
Fleet Procurement Analysis Tool User Guide
Atlas Public Policy 11
carbon dioxide emissions highlighted. Also, included in this section is a comparison of total fleet gasoline consumption for each of the procurements.
CASH FLOW SUMMARY
The summary tab also shows the cost comparison of the two procurements by summing incoming and outgoing cash flows over the life of the vehicles and adjusting for the time value of money. A positive cash flow value at the end of the timeframe is from the sale of vehicles at the end of their useful lives, if the fleet owns the vehicles.
SENSITIVITY ANALYSIS
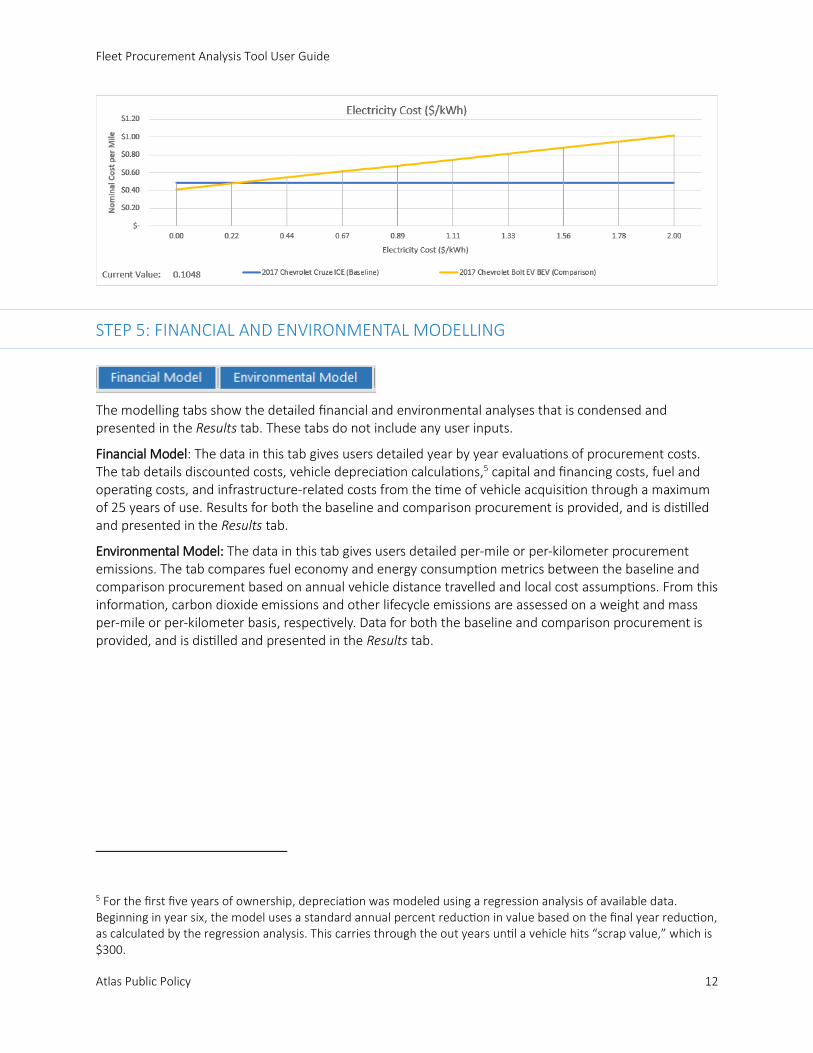
The figure below shows an example sensitivity analysis demonstrating how changes in the electricity cost ($/kilowatt-hour) affect the procurement’s nominal cost-per-distance-traveled on per-vehicle basis. The ‘Current Value’ for each selected variable in the procurement (e.g., the input value for electricity cost) is shown in the Initial Settings tab.
You can adjust the assumptions for up to four sensitivity analyses at a time in the Initial Settings tab. Both the input variables and the minimum and maximum for the sensitivity analysis range can be adjusted.
Fleet Procurement Analysis Tool User Guide
Atlas Public Policy 12
STEP 5: FINANCIAL AND ENVIRONMENTAL MODELLING
The modelling tabs show the detailed financial and environmental analyses that is condensed and presented in the Results tab. These tabs do not include any user inputs.
Financial Model: The data in this tab gives users detailed year by year evaluations of procurement costs. The tab details discounted costs, vehicle depreciation calculations,5 capital and financing costs, fuel and operating costs, and infrastructure-related costs from the time of vehicle acquisition through a maximum of 25 years of use. Results for both the baseline and comparison procurement is provided, and is distilled and presented in the Results tab.
Environmental Model: The data in this tab gives users detailed per-mile or per-kilometer procurement emissions. The tab compares fuel economy and energy consumption metrics between the baseline and comparison procurement based on annual vehicle distance travelled and local cost assumptions. From this information, carbon dioxide emissions and other lifecycle emissions are assessed on a weight and mass per-mile or per-kilometer basis, respectively. Data for both the baseline and comparison procurement is provided, and is distilled and presented in the Results tab.
5 For the first five years of ownership, depreciation was modeled using a regression analysis of available data. Beginning in year six, the model uses a standard annual percent reduction in value based on the final year reduction, as calculated by the regression analysis. This carries through the out years until a vehicle hits “scrap value,” which is $300.
Fleet Procurement Analysis Tool User Guide
Atlas Public Policy 13
DATA MANAGEMENT
The Data tab contains the source data for all fields automatically populated in the tool. None of this data is updated automatically. The tool directly references cells in this tab and you should use caution when editing these data. Editing default data fields, which are shaded in light green, is best done directly on the Inputs tab. Data will be updated in the tool whenever possible.
Fleet Procurement Analysis Tool User Guide
Atlas Public Policy 14
Appendix A: Input Fields Descriptions
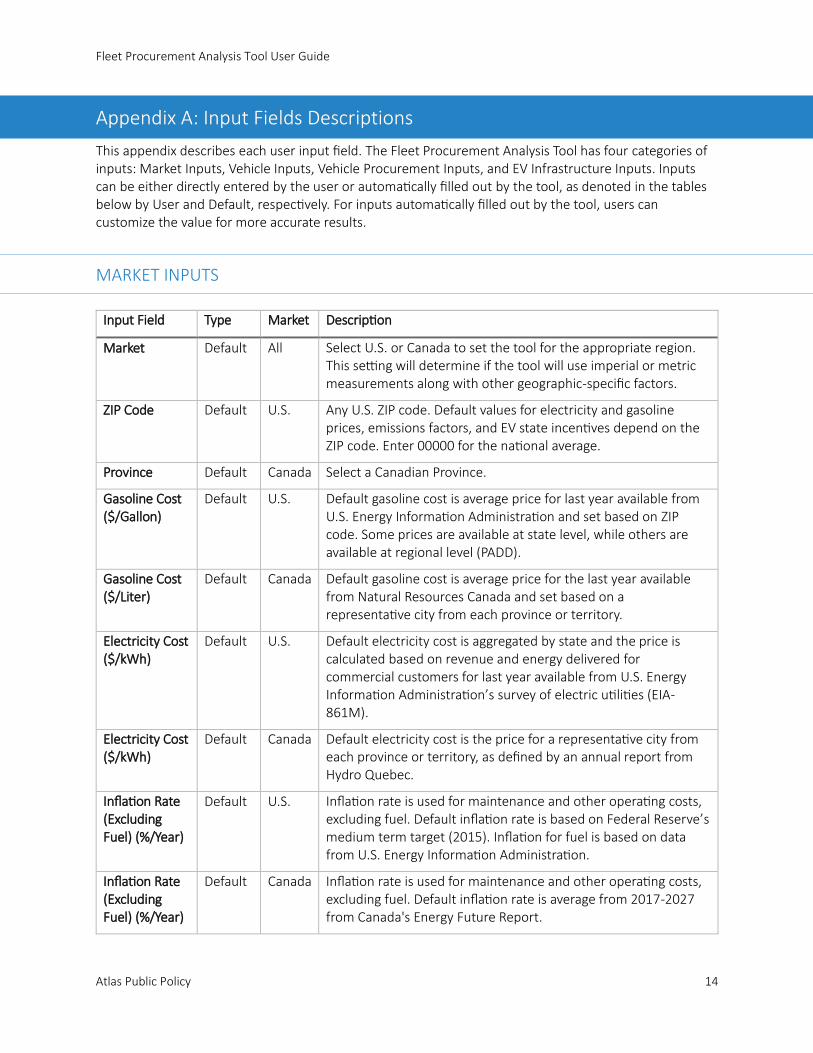
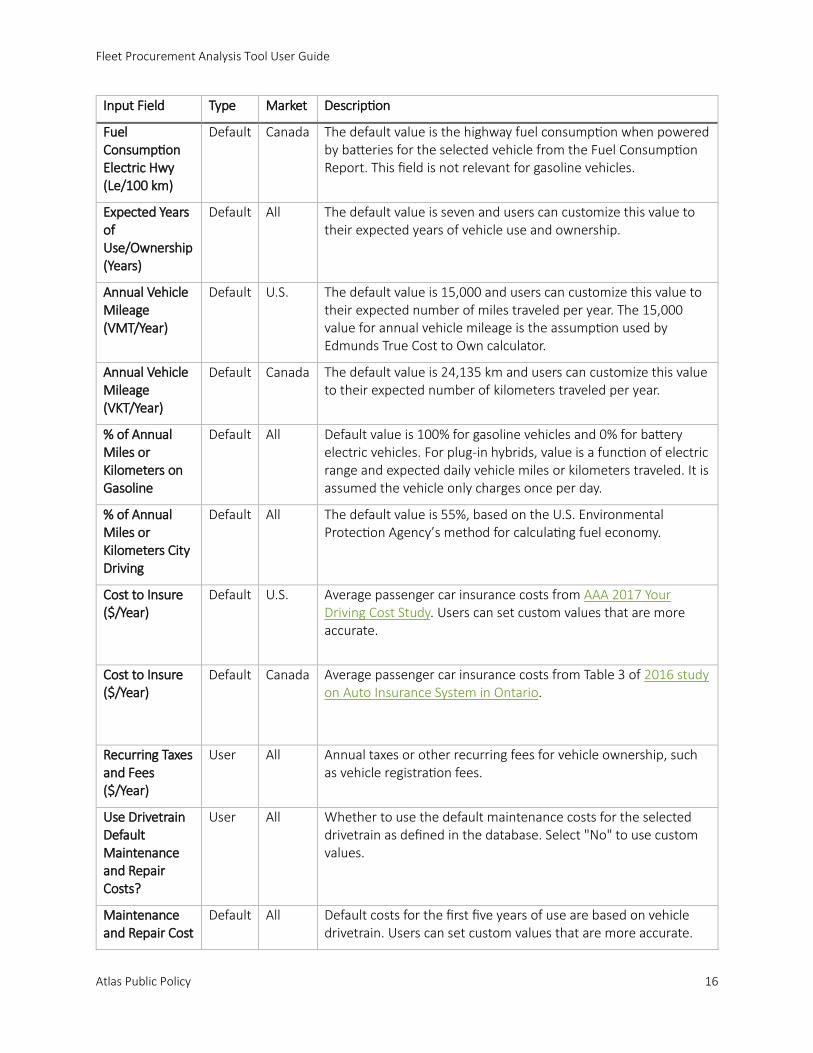
This appendix describes each user input field. The Fleet Procurement Analysis Tool has four categories of inputs: Market Inputs, Vehicle Inputs, Vehicle Procurement Inputs, and EV Infrastructure Inputs. Inputs can be either directly entered by the user or automatically filled out by the tool, as denoted in the tables below by User and Default, respectively. For inputs automatically filled out by the tool, users can customize the value for more accurate results.
MARKET INPUTS
Input Field Type Market Description
Market Default All Select U.S. or Canada to set the tool for the appropriate region. This setting will determine if the tool will use imperial or metric measurements along with other geographic-specific factors.
ZIP Code Default U.S. Any U.S. ZIP code. Default values for electricity and gasoline prices, emissions factors, and EV state incentives depend on the ZIP code. Enter 00000 for the national average.
Province Default Canada Select a Canadian Province.
Gasoline Cost ($/Gallon)
Default U.S. Default gasoline cost is average price for last year available from U.S. Energy Information Administration and set based on ZIP code. Some prices are available at state level, while others are available at regional level (PADD).
Gasoline Cost ($/Liter)
Default Canada Default gasoline cost is average price for the last year available from Natural Resources Canada and set based on a representative city from each province or territory.
Electricity Cost ($/kWh)
Default U.S. Default electricity cost is aggregated by state and the price is calculated based on revenue and energy delivered for commercial customers for last year available from U.S. Energy Information Administration’s survey of electric utilities (EIA-861M).
Electricity Cost ($/kWh)
Default Canada Default electricity cost is the price for a representative city from each province or territory, as defined by an annual report from Hydro Quebec.
Inflation Rate (Excluding Fuel) (%/Year)
Default U.S. Inflation rate is used for maintenance and other operating costs, excluding fuel. Default inflation rate is based on Federal Reserve’s medium term target (2015). Inflation for fuel is based on data from U.S. Energy Information Administration.
Inflation Rate (Excluding Fuel) (%/Year)
Default Canada Inflation rate is used for maintenance and other operating costs, excluding fuel. Default inflation rate is average from 2017-2027 from Canada's Energy Future Report.
Fleet Procurement Analysis Tool User Guide
Atlas Public Policy 15
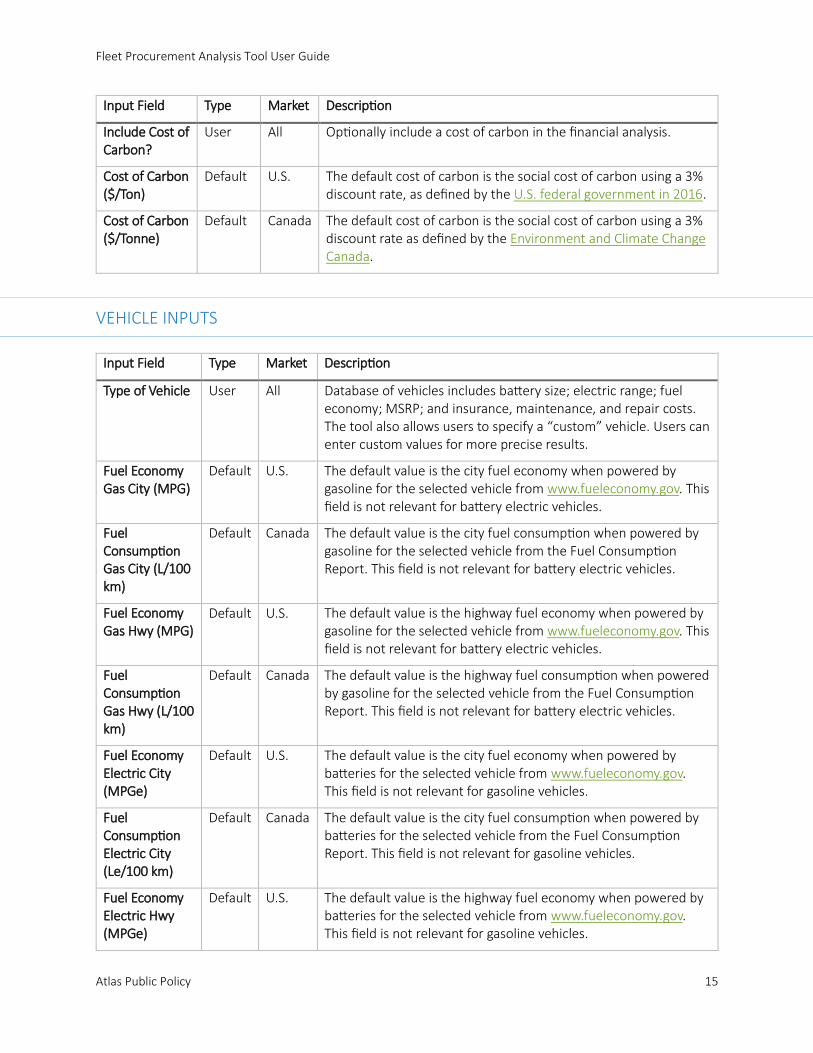
Input Field Type Market Description
Include Cost of Carbon?
User All Optionally include a cost of carbon in the financial analysis.
Cost of Carbon ($/Ton)
Default U.S. The default cost of carbon is the social cost of carbon using a 3% discount rate, as defined by the U.S. federal government in 2016.
Cost of Carbon ($/Tonne)
Default Canada The default cost of carbon is the social cost of carbon using a 3% discount rate as defined by the Environment and Climate Change Canada.
VEHICLE INPUTS
Input Field Type Market Description
Type of Vehicle User All Database of vehicles includes battery size; electric range; fuel economy; MSRP; and insurance, maintenance, and repair costs. The tool also allows users to specify a “custom” vehicle. Users can enter custom values for more precise results.
Fuel Economy Gas City (MPG)
Default U.S. The default value is the city fuel economy when powered by gasoline for the selected vehicle from www.fueleconomy.gov. This field is not relevant for battery electric vehicles.
Fuel Consumption Gas City (L/100 km)
Default Canada The default value is the city fuel consumption when powered by gasoline for the selected vehicle from the Fuel Consumption Report. This field is not relevant for battery electric vehicles.
Fuel Economy Gas Hwy (MPG)
Default U.S. The default value is the highway fuel economy when powered by gasoline for the selected vehicle from www.fueleconomy.gov. This field is not relevant for battery electric vehicles.
Fuel Consumption Gas Hwy (L/100 km)
Default Canada The default value is the highway fuel consumption when powered by gasoline for the selected vehicle from the Fuel Consumption Report. This field is not relevant for battery electric vehicles.
Fuel Economy Electric City (MPGe)
Default U.S. The default value is the city fuel economy when powered by batteries for the selected vehicle from www.fueleconomy.gov. This field is not relevant for gasoline vehicles.
Fuel Consumption Electric City (Le/100 km)
Default Canada The default value is the city fuel consumption when powered by batteries for the selected vehicle from the Fuel Consumption Report. This field is not relevant for gasoline vehicles.
Fuel Economy Electric Hwy (MPGe)
Default U.S. The default value is the highway fuel economy when powered by batteries for the selected vehicle from www.fueleconomy.gov. This field is not relevant for gasoline vehicles.
Fleet Procurement Analysis Tool User Guide
Atlas Public Policy 16
Input Field Type Market Description
Fuel Consumption Electric Hwy (Le/100 km)
Default Canada The default value is the highway fuel consumption when powered by batteries for the selected vehicle from the Fuel Consumption Report. This field is not relevant for gasoline vehicles.
Expected Years of Use/Ownership (Years)
Default All The default value is seven and users can customize this value to their expected years of vehicle use and ownership.
Annual Vehicle Mileage (VMT/Year)
Default U.S. The default value is 15,000 and users can customize this value to their expected number of miles traveled per year. The 15,000 value for annual vehicle mileage is the assumption used by Edmunds True Cost to Own calculator.
Annual Vehicle Mileage (VKT/Year)
Default Canada The default value is 24,135 km and users can customize this value to their expected number of kilometers traveled per year.
% of Annual Miles or Kilometers on Gasoline
Default All Default value is 100% for gasoline vehicles and 0% for battery electric vehicles. For plug-in hybrids, value is a function of electric range and expected daily vehicle miles or kilometers traveled. It is assumed the vehicle only charges once per day.
% of Annual Miles or Kilometers City Driving
Default All The default value is 55%, based on the U.S. Environmental Protection Agency’s method for calculating fuel economy.
Cost to Insure ($/Year)
Default U.S. Average passenger car insurance costs from AAA 2017 Your Driving Cost Study. Users can set custom values that are more accurate.
Cost to Insure ($/Year)
Default Canada Average passenger car insurance costs from Table 3 of 2016 study on Auto Insurance System in Ontario.
Recurring Taxes and Fees ($/Year)
User All Annual taxes or other recurring fees for vehicle ownership, such as vehicle registration fees.
Use Drivetrain Default Maintenance and Repair Costs?
User All Whether to use the default maintenance costs for the selected drivetrain as defined in the database. Select "No" to use custom values.
Maintenance and Repair Cost
Default All Default costs for the first five years of use are based on vehicle drivetrain. Users can set custom values that are more accurate.
Fleet Procurement Analysis Tool User Guide
Atlas Public Policy 17
Input Field Type Market Description
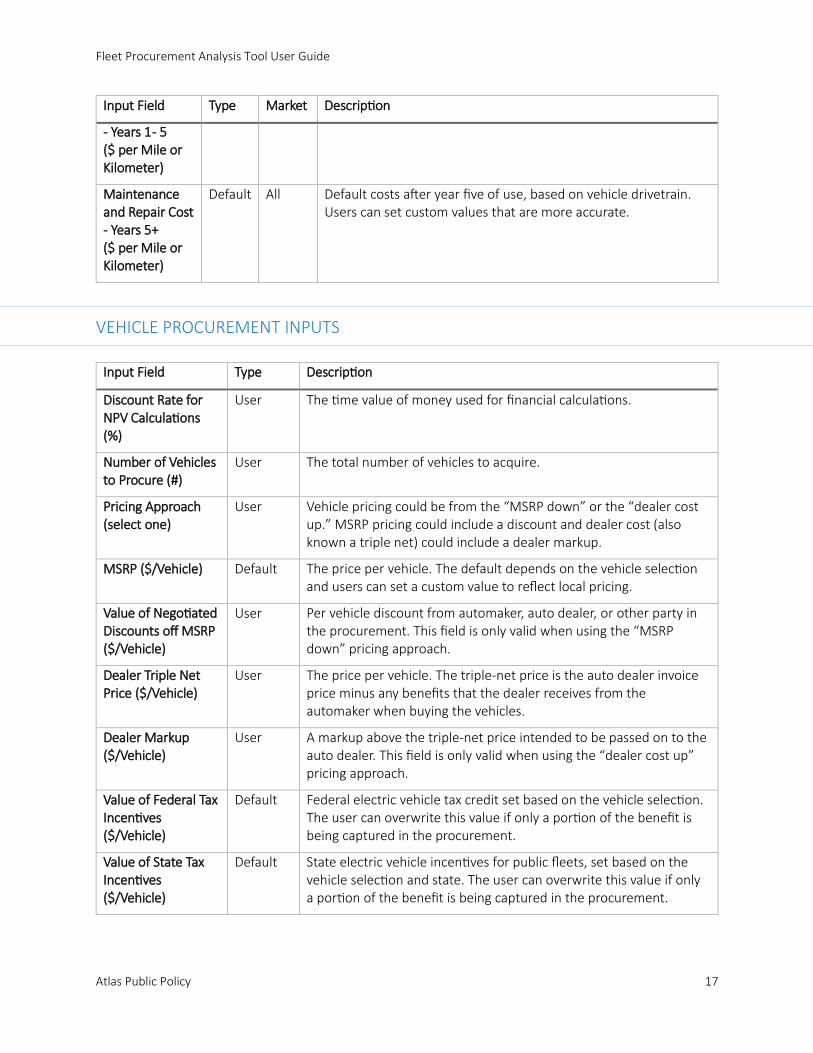
- Years 1 - 5 ($ per Mile or Kilometer)
Maintenance and Repair Cost - Years 5+ ($ per Mile or Kilometer)
Default All Default costs after year five of use, based on vehicle drivetrain. Users can set custom values that are more accurate.
VEHICLE PROCUREMENT INPUTS
Input Field Type Description
Discount Rate for NPV Calculations (%)
User The time value of money used for financial calculations.
Number of Vehicles to Procure (#)
User The total number of vehicles to acquire.
Pricing Approach (select one)
User Vehicle pricing could be from the “MSRP down” or the “dealer cost up.” MSRP pricing could include a discount and dealer cost (also known a triple net) could include a dealer markup.
MSRP ($/Vehicle) Default The price per vehicle. The default depends on the vehicle selection and users can set a custom value to reflect local pricing.
Value of Negotiated Discounts off MSRP ($/Vehicle)
User Per vehicle discount from automaker, auto dealer, or other party in the procurement. This field is only valid when using the “MSRP down” pricing approach.
Dealer Triple Net Price ($/Vehicle)
User The price per vehicle. The triple-net price is the auto dealer invoice price minus any benefits that the dealer receives from the automaker when buying the vehicles.
Dealer Markup ($/Vehicle)
User A markup above the triple-net price intended to be passed on to the auto dealer. This field is only valid when using the “dealer cost up” pricing approach.
Value of Federal Tax Incentives ($/Vehicle)
Default Federal electric vehicle tax credit set based on the vehicle selection. The user can overwrite this value if only a portion of the benefit is being captured in the procurement.
Value of State Tax Incentives ($/Vehicle)
Default State electric vehicle incentives for public fleets, set based on the vehicle selection and state. The user can overwrite this value if only a portion of the benefit is being captured in the procurement.
Fleet Procurement Analysis Tool User Guide
Atlas Public Policy 18
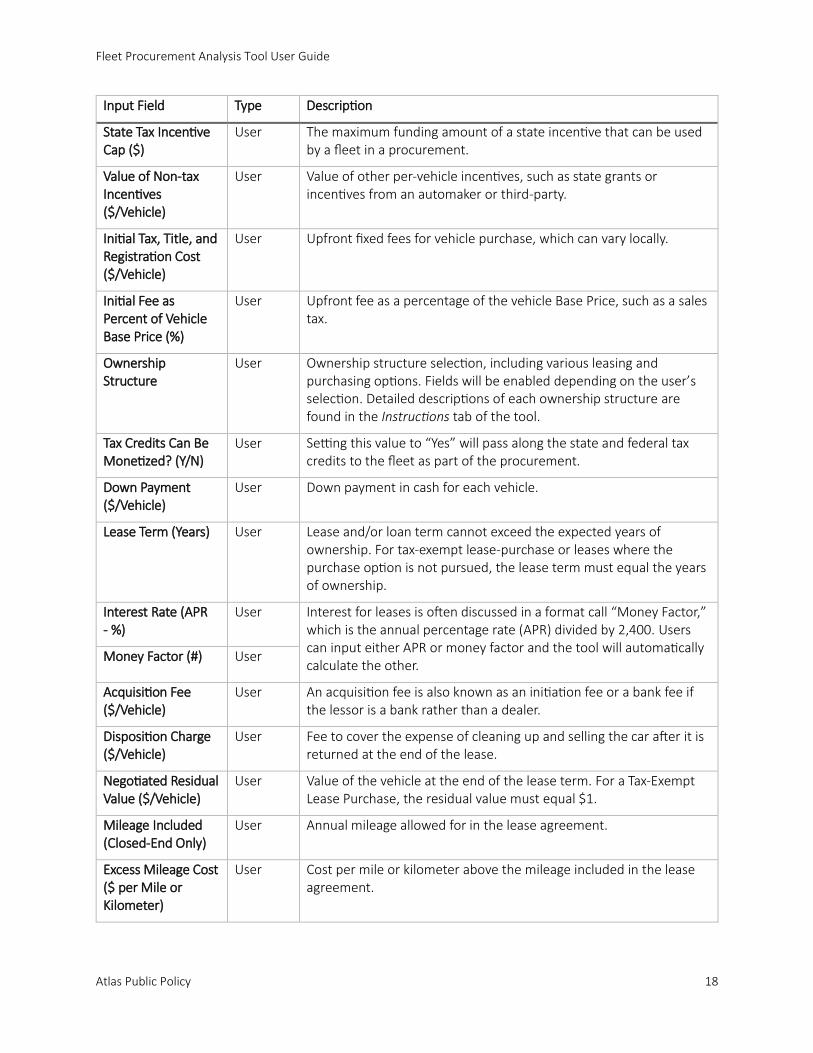
Input Field Type Description
State Tax Incentive Cap ($)
User The maximum funding amount of a state incentive that can be used by a fleet in a procurement.
Value of Non-tax Incentives ($/Vehicle)
User Value of other per-vehicle incentives, such as state grants or incentives from an automaker or third-party.
Initial Tax, Title, and Registration Cost ($/Vehicle)
User Upfront fixed fees for vehicle purchase, which can vary locally.
Initial Fee as Percent of Vehicle Base Price (%)
User Upfront fee as a percentage of the vehicle Base Price, such as a sales tax.
Ownership Structure
User Ownership structure selection, including various leasing and purchasing options. Fields will be enabled depending on the user’s selection. Detailed descriptions of each ownership structure are found in the Instructions tab of the tool.
Tax Credits Can Be Monetized? (Y/N)
User Setting this value to “Yes” will pass along the state and federal tax credits to the fleet as part of the procurement.
Down Payment ($/Vehicle)
User Down payment in cash for each vehicle.
Lease Term (Years) User Lease and/or loan term cannot exceed the expected years of ownership. For tax-exempt lease-purchase or leases where the purchase option is not pursued, the lease term must equal the years of ownership.
Interest Rate (APR - %)
User Interest for leases is often discussed in a format call “Money Factor,” which is the annual percentage rate (APR) divided by 2,400. Users can input either APR or money factor and the tool will automatically calculate the other.
Money Factor (#) User
Acquisition Fee ($/Vehicle)
User An acquisition fee is also known as an initiation fee or a bank fee if the lessor is a bank rather than a dealer.
Disposition Charge ($/Vehicle)
User Fee to cover the expense of cleaning up and selling the car after it is returned at the end of the lease.
Negotiated Residual Value ($/Vehicle)
User Value of the vehicle at the end of the lease term. For a Tax-Exempt Lease Purchase, the residual value must equal $1.
Mileage Included (Closed-End Only)
User Annual mileage allowed for in the lease agreement.
Excess Mileage Cost ($ per Mile or Kilometer)
User Cost per mile or kilometer above the mileage included in the lease agreement.
Fleet Procurement Analysis Tool User Guide
Atlas Public Policy 19
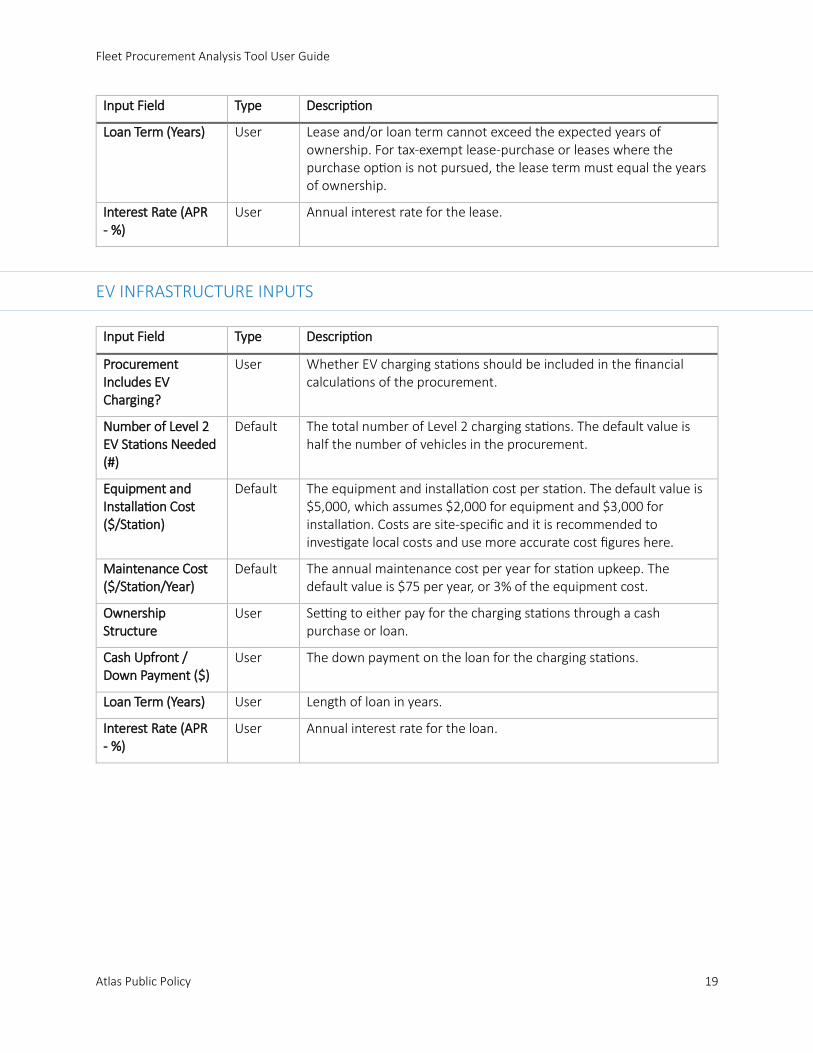
Input Field Type Description
Loan Term (Years) User Lease and/or loan term cannot exceed the expected years of ownership. For tax-exempt lease-purchase or leases where the purchase option is not pursued, the lease term must equal the years of ownership.
Interest Rate (APR - %)
User Annual interest rate for the lease.
EV INFRASTRUCTURE INPUTS
Input Field Type Description
Procurement Includes EV Charging?
User Whether EV charging stations should be included in the financial calculations of the procurement.
Number of Level 2 EV Stations Needed (#)
Default The total number of Level 2 charging stations. The default value is half the number of vehicles in the procurement.
Equipment and Installation Cost ($/Station)
Default The equipment and installation cost per station. The default value is $5,000, which assumes $2,000 for equipment and $3,000 for installation. Costs are site-specific and it is recommended to investigate local costs and use more accurate cost figures here.
Maintenance Cost ($/Station/Year)
Default The annual maintenance cost per year for station upkeep. The default value is $75 per year, or 3% of the equipment cost.
Ownership Structure
User Setting to either pay for the charging stations through a cash purchase or loan.
Cash Upfront / Down Payment ($)
User The down payment on the loan for the charging stations.
Loan Term (Years) User Length of loan in years.
Interest Rate (APR - %)
User Annual interest rate for the loan.
Fleet Procurement Analysis Tool User Guide
Atlas Public Policy 20
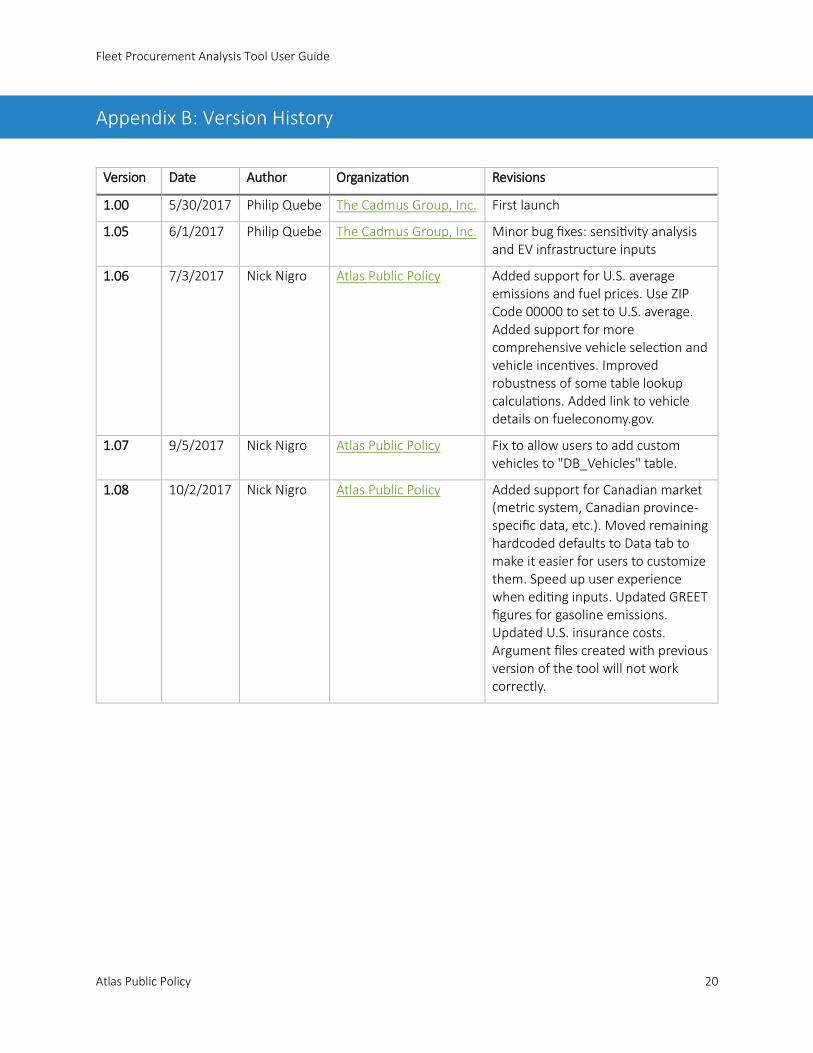
Appendix B: Version History
Version Date Author Organization Revisions
1.00 5/30/2017 Philip Quebe The Cadmus Group, Inc. First launch
1.05 6/1/2017 Philip Quebe The Cadmus Group, Inc. Minor bug fixes: sensitivity analysis and EV infrastructure inputs
1.06 7/3/2017 Nick Nigro Atlas Public Policy Added support for U.S. average emissions and fuel prices. Use ZIP Code 00000 to set to U.S. average. Added support for more comprehensive vehicle selection and vehicle incentives. Improved robustness of some table lookup calculations. Added link to vehicle details on fueleconomy.gov.
1.07 9/5/2017 Nick Nigro Atlas Public Policy Fix to allow users to add custom vehicles to "DB_Vehicles" table.
1.08 10/2/2017 Nick Nigro Atlas Public Policy Added support for Canadian market (metric system, Canadian province-specific data, etc.). Moved remaining hardcoded defaults to Data tab to make it easier for users to customize them. Speed up user experience when editing inputs. Updated GREET figures for gasoline emissions. Updated U.S. insurance costs. Argument files created with previous version of the tool will not work correctly.