Embed Size (px)
Citation preview

FLASHRELATE: Extracting Relational Data fromSemi-Structured Spreadsheets Using Examples
Daniel W. BarowyUniversity of Massachusetts Amherst
Sumit Gulwani Ted HartBenjamin Zorn
Microsoft Research{sumitg, ted.hart, ben.zorn}@microsoft.com
AbstractSpreadsheets store a tremendous amount of important data.One reason spreadsheets are so successful is that they areboth easy to use and allow users great expressiveness instoring and manipulating their data. This flexibility comesat a price, as presentation elements are often combined withthe underlying data model. As a result, many spreadsheetscontain data in ad-hoc formats. These formats complicatethe use of traditional relational tools which require data ina normalized form. Normalizing data from these formats isoften tedious or requires programming, and often, a user mayprefer the original presentation.
We describe an approach that allows users to easily ex-tract structured data from spreadsheets without program-ming. We make two contributions. First, we describe a noveldomain specific language called FLARE that extends tra-ditional regular expressions with spatial constraints. Sec-ond, we describe an algorithm called FLASHRELATE thatcan synthesize FLARE programs from user-provided positiveand negative examples. Using 43 benchmarks drawn bothfrom a standard spreadsheet corpus and from Excel user-helpforums, we demonstrate that correct extraction programs canbe synthesized quickly from a small number of examples.Our approach generalizes to many data-cleaning tasks onsemi-structured spreadsheets.
Categories and Subject Descriptors CR-number [subcat-egory]: third-level
Keywords Program Synthesis, Domain Specific Languages,Heuristic Search, Spreadsheets
1. IntroductionThere are an estimated 500 million Microsoft Excel usersworldwide [24]. It is thus not surprising that a tremendousamount of important data is stored in spreadsheets.
As with other document types such as text files and webpages, spreadsheets combine their data model and view. Thisflexibility gives the spreadsheet creator a large degree offreedom in encoding their data. It also complicates the useof powerful database tools (e.g., relational queries) which
expect data in a particular form. Although spreadsheets aretabular and ostensibly tables, end-users may organize theirdata in any two-dimensional form that they find convenient.
This problem is widespread. Recent research suggeststhat the vast majority of spreadsheets available on the webcannot be trivially converted to database relations [6]. Weargue that the cause is due to the multidimensionality of data.Representing multidimensional data in a two-dimensionalspreadsheet presents a fundamental problem for users, sinceadditional dimensions need to be projected into a 2D grid.Spreadsheet authors often solve this problem by craftingclever encodings of their data.
While expert users might recognize when database tech-nologies might be more appropriate, they do so becausethese technologies facilitate automatic processing. In con-trast, spreadsheets allow compact and intuitive visual rep-resentations of data better suited for human understanding.Since these representations vary from spreadsheet to spread-sheet, each unique encoding must be decoded if they are tobe used with more powerful data tools.
The conflating of presentation information with data iscommonplace in many domains. The recognition that non-experts are unlikely to embrace data management tools de-signed for automatic processing has lead to the developmentof numerous domain-specific technologies for data extrac-tion. Scripting languages like Perl, Awk, and Python havebeen designed to support string processing in text files. Webtechnologies like XQuery, HTQL, XSLT, and SXPath can beused to extract data from webpages. There are no such toolsfor spreadsheets.
Example To make our contributions more concrete, we re-fer to the example showing in Fig. 1(a), a real spreadsheettaken from the EUSES corpus [11]. The spreadsheet showstimber harvests by country and year. It also packs data abouta particular country into value/year pairs within a row, ap-pending comments to the far right. The original author prob-ably structured the data in this form to avoid having the datain a long thin column, which would be harder to read.
Consider the steps that a programmer must undertake tocompute the average harvest in 1950 from this representa-
FLASHRELATE 1 2014/4/23

A B C D E . . . R1 value year value year Comments2 Albania 1,000 1950 930 1981 FRA 13 Austria 3,139 1951 3,177 1955 FRA 34 Belgium 541 1947 601 19505 Bulgaria 2,964 1947 3,259 1958 FRA 16 Czech . . . 2,416 1950 2,503 1960 NC
. . .(a)
A B C D1 Albania 1,000 1950 FRA 12 Albania 930 1981 FRA 1
. . .
5 Austria 3,139 1951 FRA 36 Austria 3,177 1955 FRA 3
. . .
9 Belgium 541 194710 Belgium 601 1950
. . .(b)
Figure 1: (a) A semi-structured spreadsheet with two example tuples highlighted. The first tuple (red) represents the timberharvest (per 1000 hectares) for Albania in 1950. The second tuple (blue) represents the timber harvest for Austria in 1950. (b)An extracted relational table with the same two tuples highlighted as in Fig. 1a
tion. The spreadsheet author’s encoding, while perhaps eas-ier to read, makes this task a challenge. The first thoughtof such a programmer might be to convert the data into aform better suited to performing the computation, like therelational table shown in Fig. 1(b). One approach would beto use a scripting language like Perl or Visual Basic to de-fine regular expressions that would match the elements ineach column. For example, one could match country nameswith an alphanumeric pattern, years with 4-digit patterns,etc. Having done this, matches would be spatially collatedto form tuples, and tuples collated to form a table. We showone such program in Fig. ??.
Problem Statement The problem that we address in thispaper is how to enable ordinary spreadsheet users, who donot have programming skills, to convert ad hoc data for-mats into relational ones. The strategy we use to achievethis goal has two parts. 1) We present a domain-specific lan-guage (DSL) called FLARE for extracting relevant data fromspreadsheets in a relational format. 2) We also present analgorithm called FLASHRELATE that automatically gener-ates FLARE programs from a small number of user-providedpositive and negative examples of tuples in the desired out-put table, greatly simplifying the process of automated dataextraction.
FLARE Query Language FLARE describes the regular ge-ometric structure of ad-hoc encodings to map spreadsheetdata into relational tables. The design of FLARE is inspiredby scripting languages with regular expression capabilities,which have enabled developers with to extract relational datafrom text files, such as server logs. Spreadsheets representanother major source of semi-structured data. Without sup-porting code, regular expressions and other string-matchingtools are not expressive enough to capture relational in-formation encoded in spreadsheets. These structures, suchas hierarchical data, become complex geometric structureswhen projected into a two-dimensional grid.
FLARE converts ad hoc stuctures into relational onesso that relational tools can use them. FLARE declarativelyspecifies the structure of ad-hoc encodings in the form of
constraints. Data that matches these constraints are automat-ically converted into relational tables.
FLARE has two kinds of constraints. Constraints overthe text within a spreadsheet cell are referred to as cellconstraints and are composed of regular expressions. Cellconstraints represent valid classes of values in a relationaltable, i.e., a relational column. Constraints between cellsare referred to as spatial constraints and are composed ofgeometric relationships. Spatial constraints represent validgeometric relationships between values that belong in thesame relational tuple.
Taken together, these two kinds of constraints form a di-rected constraint graph over the spreadsheet. Vertices consistof cell constraints while edges consist of spatial constraints.The cells matched by a traversal of this graph produce a setof relational tuples in the desired output table. We show asample FLARE query and corresponding constraint graph inFig. 3. Intuitively, one can think of this graph as an invariantgeometric structure that, when translated over a spreadsheet,indicates which cells form a relational tuple.
FLASHRELATE Synthesis Algorithm Programmatic so-lutions to data extraction suffer two key limitations. First,the expertise required to use these tools is often particularto specific document types. Second, and more significantly,they require knowledge of programming. The first aspectcreates challenges even for programmers, while the secondaspect puts these solutions out of reach of the vast majorityof end users. As a result, users are either unable to leverageaccess to rich data or have to resort to manual copy-and-paste, which is both time-consuming and error-prone.
FLASHRELATE is a complementary technology thatbridges the expertise gap between ordinary end-users andsophisticated new query languages like FLARE. FLASHRE-LATE infers the correct set of constraints from a small num-ber of examples given by the user and outputs an appropriateFLARE program.
Example 1: Returning to our example in Fig. 1, we showhow a FLARE program can concisely extract the neces-sary relational table. Recall that the user would like to
FLASHRELATE 2 2014/4/23
Function Extract () As Collection
...
Set Tuples = New Collection ’Results
rYear.Pattern = "^19[0 -9]{2}$" ’Year Patt.
rValue.Pattern = "^[0 -9]+$" ’Value Patt.
’Search for Tuples
For Each ws In Worksheets
For Each cell In ws.UsedRange
x = cell.Column
y = cell.Row
x_rt = x + 1
If rYear.Test(cell.Value) _
And rValue.Test(_
ws.Cells(y, x_rt).Value) Then
Dim tupleCoords
tupleCoords = Array(ws.Index , x, _
y, x_rt , y)
Tuples.Add (cellCoords)
End If
Next
Next
Extract = Tuples
End Function
Figure 2: A Visual Basic program that performs the desiredextraction in Example 1. Variable declarations were omittedfor space reasons. The equivalent FLARE program, shownin Fig. 3a, declaratively specifies the extraction and is muchsimpler.
compute the average timber harvest for 1950. The FLAREprogram shown in Figure 3 performs this extraction. Oncethe data is in the desired form, the desired result can becomputed trivially with the following SQL query: SELECTAVG(column 1) FROM FlareTable WHERE column 2 =
1950.Despite the difficulty of computing the result from the
original structure, a typical person would have no troubleunderstanding the spreadsheet. Numerous geometric cuesguide a person’s eye to the right location. For example,timber harvest values are always located under a headingtitled “value.” Year values are always located to the rightof the timber value. Country names are always located tothe far left. Although other geometric information may beused to perform the same task, these three invariants aresufficient to extract the desired tuple. FLARE makes use ofthese intuitive geometric concepts to concisely express thedesired extraction.
In Figure 3(a), Node constraints identify the two columnsin the desired relation, (1) the value, and (2) the year, labeledwith column IDs 1 and 2, respectively. Node constraintsare based on regular expressions. The first Node constraintincludes an extra contextual constraint, called an anchor,that requires the presence of a second, contextual cell. In thisprogram, that additional cell must contain the string “value”somewhere above Node 1 in the input spreadsheet.
Note that Node 2 is a strict superset of Node 1. How then,are “value” cells to be distinguished from “year” cells? Edge
Node(1, “^[0-9]+$”, Anchor(“value”, Vert(*), Horiz(0)))Node(2, “^[0-9]+$”, ⊥)Edge (1, 2, Vert(0), Horiz(1), Select(All, All))
(a)
2 1 *
(b)
Figure 3: (a) FLARE program for first example extractiontask with (b) schematic illustration. Node constraints areshown as dots, Edge constraints are shown as solid arrows,and Anchor constraints are shown with a dashed arrow andanchor symbol. Edge s and Anchors of non-constant lengthare labeled with a Kleene star. Node numbers correspond toattribute IDs in the desired relational tuple.
Node(3, “^[a-zA-Z ]+$”, ⊥)Node(4, “^[a-zA-Z ]+$”, ⊥)Edge (3, 1, Vert(0), Horiz(*), Select(All, All))Edge (2, 4, Vert(0), Horiz(*), Select(All, All))
(a)
2 1 3 * * *
4 (b)
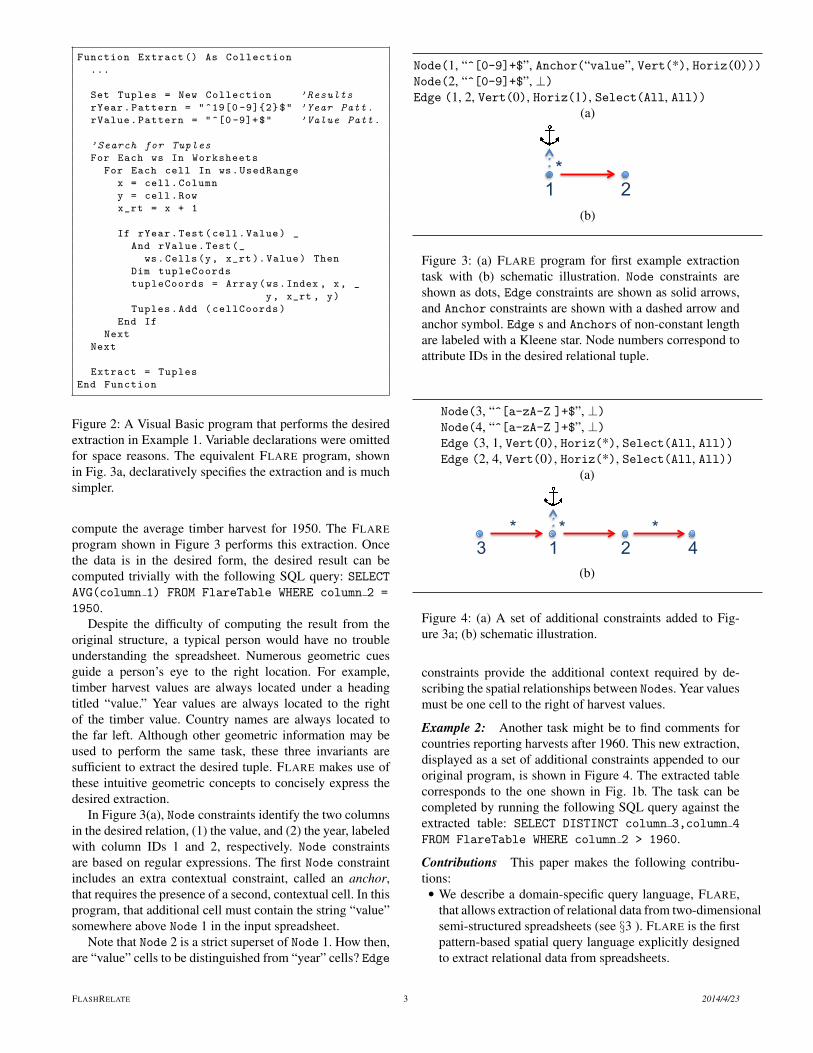
Figure 4: (a) A set of additional constraints added to Fig-ure 3a; (b) schematic illustration.
constraints provide the additional context required by de-scribing the spatial relationships between Nodes. Year valuesmust be one cell to the right of harvest values.
Example 2: Another task might be to find comments forcountries reporting harvests after 1960. This new extraction,displayed as a set of additional constraints appended to ouroriginal program, is shown in Figure 4. The extracted tablecorresponds to the one shown in Fig. 1b. The task can becompleted by running the following SQL query against theextracted table: SELECT DISTINCT column 3,column 4
FROM FlareTable WHERE column 2 > 1960.
Contributions This paper makes the following contribu-tions:• We describe a domain-specific query language, FLARE,
that allows extraction of relational data from two-dimensionalsemi-structured spreadsheets (see §3 ). FLARE is the firstpattern-based spatial query language explicitly designedto extract relational data from spreadsheets.
FLASHRELATE 3 2014/4/23
• We present an algorithm, FLASHRELATE, that syn-thesizes FLARE programs given a small number ofuser-provided positive and negative examples (see §4 ).FLASHRELATE’s effectiveness (in speed and number ofrequired examples) is dictated by its efficient constraintsearch.
• We empirically evaluate the expressiveness of the FLAREand the effectiveness of FLASHRELATE against a setof 43 real-world spreadsheets drawn from the EUSEScorpus and from Excel user help forums [11, 16]. Weshow that the FLASHRELATE algorithm is able to syn-thesize correct FLARE programs from examples in all butone case. Only a small number of examples are required(see §5 ). FLASHRELATE rarely takes longer than 2 sec-onds.
2. Related WorkMuch recent research considers the problem of extract-ing structured data from unstructured or semi-structuredsources, including documents on the web (e.g, [4, 9, 21, 22]).
Extracting Data from the Web Another important relatedbody of work focuses on extracting relational data from dataon the web. SXPath [22] is a query language, like FLARE,that uses a combination of spatial relations and path expres-sions to extract data from complex web documents. SXPathuses intuitive spatial relations in describing patterns to avoidqueries that involve complex, non-intuitive deep path ex-pressions. SXPath, like FLARE, includes spatial primitivesin its queries, but does not attempt to synthesize programsin the query language from examples, as we do. SILA [21]defines a spatial DOM abstraction (PDOM) and proposesan algorithm for automatically extracting data records fromdeep web pages based on the PDOM. While, like FLASHRE-LATE, SILA attempts to extract records from spatially struc-tured data, it does so algorithmically, and not by defining adomain-specific query language. For overviews of the rangeof approaches taken to web data extraction, see Ferrera etal. [9] and Cafarella et al. [4]
Extracting Data from Spreadsheets The research mostclosely related to FLASHRELATE is the concurrently-developed SENBAZURU project, which, like FLASHRE-LATE, seeks to extract relational data from spreadsheets [5,6]. While the project goals are similar, the approach takenby FLASHRELATE is very different. SENBAZURU attemptsto automatically infer hierarchical structure in spreadsheetsby creating a classifier that identifies data frames in the docu-ment and another classifier that infers the intended hierarchybased on a set of predefined features. In contrast, FLASHRE-LATE uses positive and negative output examples to synthe-size a program in a domain-specific language of our owndesign. FLASHRELATE can be used to perform arbitrary ex-traction tasks from arbitrary spreadsheets, provided that reg-ular syntactic and spatial structure is present.
Cunha et al. [7] also consider extracting relational datafrom spreadsheets, but their focus is on recovering the truerelational schema from the spreadsheet data. We believe thata user might have in mind many different task-dependentschemas for a single spreadsheet, as the example in theintroduction illustrates. Instead, FLASHRELATE crafts anextraction program that returns precisely those tuples thatthe user wants based a set of user-supplied examples.
Query Synthesis by Examples The view synthesis prob-lem [8, 26] aims to find the most succinct and accurate queryfor a given database view. There are two key differences withour work: (i) View synthesis techniques infer a relation frommultiple single-dimensional relational tables, while we in-fer a relation from a single, two-dimensional semi-structuredspreadsheet. Such spreadsheets are often used to encodemultiple dimensions in ad-hoc ways. (ii) View synthesistechniques infer a relation from a large representative exam-ple view, while we infer a transformation from a set of fewexample rows, an important usability aspect for end-users.
Programming by Examples The area of programming byexamples [18] (PBE) is gaining renewed interest [14] be-cause of its revolutionary potential to enhance productiv-ity of millions of end-users. Gulwani et al. have developedprogramming-by-example techniques for automating repet-itive data manipulation tasks related to structured spread-sheet tables [15]. These include syntactic string transforma-tions [13], semantic string transformations [25], and tablelayout transformations [16]. Of these, the most closely re-lated work is that of [16]. The following are some key dif-ferences with our work: (i) We address a different class ofspreadsheet tasks, namely transforming semi-structured datainto structured relational data. (This facilitates application ofprior work on manipulating structured relational data usinginput-output examples.) For instance, [16] cannot handle anyof the transformation tasks associated with our new bench-mark examples. (ii) The synthesis techniques used are com-pletely different. Prior work uses a class of techniques calledversion-space algebras, while we perform heuristic search.(iii) The user interaction is quite different. Prior work takesas input multiple input-output examples, while our techniquetakes as input multiple positive/negative examples of tuplesin the desired output table.
Quicksilver [19] is another recent PBE technology forstructured relational data. It synthesizes relational algebraqueries over strictly relational tables, while we focus on adifferent class of spreadsheet tasks, namely extracting rela-tional tuples from semi-structured spreadsheets. QuickSil-ver cannot handle any of the transformation tasks associatedwith our benchmark examples.
Manipulation of Semi-Structured Data The PADS projectsimplifies ad hoc data-processing tasks for programmers bydeveloping domain-specific languages for describing dataformats in text files and learning algorithms for inferring
FLASHRELATE 4 2014/4/23

such formats using annotations [10]. The learned format canthen be used by programmers to implement custom data-analysis tools. PADS focuses on parsing and manipulatingsemi-structured data in text files or log files while we focuson semi-structured data in spreadsheets.
Learning Theory Angluin presented a classical algorithmfor learning regular expressions or finite state automatasfrom positive and negative examples [2]—an equivalenceoracle produces a counterexample that exhibits disequiva-lence of the current hypothesis with the intended one, anda membership oracle labels that counterexample as eitherpositive or negative. Our work learns a more sophisticatedconcept, namely a two-dimensional query involving regularexpressions from positive/negative examples. In our case, itis the end-user who plays the role of both equivalence andmembership oracles, providing a positive or negative tuplerow(s) in each interaction.
Two-Dimensional Grammars The formal methods com-munity has done a lot of work on defining picture gram-mars [12, 23], which extend classical grammars for gen-erating strings into two-dimensional space, using conceptslike two-dimensional regular expressions [3, 20] and au-tomata [17]. These works focus on theoretical analysisof two-dimensional grammars, specifically decidability andcomplexity of classical problems for these novel languages.In contrast, a FLARE program is specifically designed formatching relational tuples. Furthermore, we address theproblem of synthesizing the desired program from few posi-tive/negative examples.
Header Inference [1] describes a system that automati-cally infers header information in spreadsheets by exploitingspecial layout or formatting attributes, such as sub-headers,footers, filler cells (blank cells or cells with some specialcharacters to aid visual readability of table content). Ourwork also leverages the presence of such layout or format-ting constraints in spreadsheets; however our use of this in-formation is not heuristic in nature—users provide examplesfor tuple extraction and we learn a specific pattern-based log-ical query for accomplishing the intended task.
3. Flare LanguageThe goal of a FLARE program is to transform a semi-structured spreadsheet I into an n-ary relational table. Thesyntax and formal semantics of FLARE are shown in Fig. 5.A spreadsheet I is a two-dimensional collection of strings.A cell c is a pair of x and y coordinates that can be usedto index I (as in I[c]). We use the term Cells(I) to de-note all cells in the used range of the spreadsheet I . Ann-ary relational table is a set of n-ary tuples of strings.Each such tuple can also be represented as a map from tu-ple attribute indices {1, . . . , n} to spreadsheet strings (as in{1 7→ s1, 2 7→ s2, . . . , n 7→ sn}).
A FLARE program ρ consists of a set of n nodes and aset of directed edges that form a tree shape. These nodes andedges are labeled with descriptions that form the criteria forextracting relational tuples from the input sheet. Each nodein P corresponds to a unique tuple attribute index i from theoutput relational table. It is associated with a cell constraintα (denoted by CellConstraint(i)) that is a Boolean con-straint over spreadsheet cells. Each directed edge in P cor-responds to an ordered pair of tuple attribute indices j and kfrom the output relational table. Each such edge is associatedwith two kinds of constraints: (a) a spatial constraint β (de-noted by SpatialConstraint(j, k)), which is a Booleanconstraint over an ordered pair of spreadsheet cells andchecks horizontal/vertical orientation of the two cells. (b) aselect constraint γ (denoted by SelectConstraint(j, k)),which filters a set of cells with respect to another cell basedon some distance related tags. We discuss the precise syntaxand semantics of these different kinds of constraints later inthis section. We use the term Root(ρ) to denote the tupleattribute index corresponding to the root node in the treestructure formed by the nodes and edges in ρ.
In order to define a constructive semantics for a FLAREprogram ρ, we introduce a recursive function F (j, k, c) thattakes as input an edge identifier (i.e., a pair of tuple attributeindices j and k) and a cell c and returns a set of m-tuples,where m is the number of nodes reachable from the corre-sponding edge.F (j, k, c) is computed in three steps: (i) Compute the set
C ′ of all cells that simultaneously satisfy both the spatialrelationship to c with SpatialConstraint(j, k) and thecell pattern CellConstraint(k). (ii) FilterC ′ to that subsetC ′′ that satisfies the SelectConstraint(j, k) relationshipwith c. (iii) For each c′′ ∈ C ′′, compute the cross productof singleton c′′ with the result of the recursive invocation ofF along each outgoing edge from nodes with tuple attributeindex k and cell c′′ (i.e., F (k, ki, c′′), where ki belongs tothe set of children of node k (denoted by Children(ρ, k))),and return their union.
The execution of a program ρ on an input spreadsheetI proceeds as follows: (i) Compute the set C of all cellsthat satisfy the cell constraint CellConstraint(`), where` is the tuple attribute index associated with the root node ofprogram- ρ. (ii) For each c ∈ C, compute the cross productof singleton c with the result of recursive invocations of Falong the outgoing edges from the root node and cell c (i.e.,F (`, ki, c)), and return their union.
A cell constraint Cell(r,O) consists of a regular expres-sion r, namely a Boolean constraint over strings, and an an-chor constraint O, namely a Boolean constraint over cells.An anchor constraint Anchor(r,β), which consists of a reg-ular expression r and a spatial constraint β, asserts that thereexists a cell c′ whose content matches r and that is relatedto the argument cell using the spatial constraint β. Anchorconstraints can be thought of as a special case of the spatial
FLASHRELATE 5 2014/4/23

Program ρ := {Ni}i ∪ {Ei}iNode N := Node(j, α)
Edge E := Edge(j, k, β, γ)
Cell Constraint α := Cell(r,O)
Spatial Constraint β := Spatial(v,h)
Vertical Constraint v := Vert(q)∣∣ >
Horiz. Constraint h := Horiz(q)∣∣ >
Quantity q := . . .∣∣ -2
∣∣ -1∣∣ 0 ∣∣ 1 ∣∣ 2 ∣∣ . . .∣∣ - ∗
∣∣ ∗Select Constraint γ := Select(T1, T2)
Type T := All∣∣ NearX ∣∣ NearY∣∣ FarX∣∣ FarY
Anchor Constraint O := Anchor(r,β)∣∣ ⊥
(a)
Cell: (N, N)Spreadsheet: Cell→ String
Program: Spreadsheet→ n-tuple setCell/Anchor Constraint: Cell→ Bool
Spatial/Vert/Horiz Constraint: (Cell, Cell)→ BoolSelect Constraint: (Cell, Cell set)→ Cell set
(b)
Node(j, r,O) ≡ Node(j, Cell(r,O))
Edge(j, k, v, h, γ) ≡ Edge(j, k, Spatial(v, h), γ)
Anchor(r, v, h) ≡ Anchor(r, Spatial(v, h))
All ≡ Select(All, All)
(c)
[[ρ]] I = {{(` 7→ I[c])} ∪ σ1 ∪ . . . ∪ σd | c ∈ C, σi ∈ F (`, ki, c)}where C = {c | [[α]] c, c ∈ Cells(I)}, ` = Root(ρ)
α = CellConstraint(`), {k1, . . . , kd} = Children(ρ, `)
F (j, k, c) = {{(k 7→ I[c′′])} ∪ σ1 ∪ . . . ∪ σd | c′′ ∈ C ′′, σi ∈ F (k, ki, c′′)}where C ′′ = [[γ]] (c, C ′), C ′ = {c′ | [[β]] (c, c′) ∧ [[α]] c′},α = CellConstraint(k), β = SpatialConstraint(j, k)
γ = SelectConstraint(j, k), {k1, . . . , kd} = Children(ρ, k)
[[Cell(r,O)]] (I, c) = [[r]] I[c] ∧ [[O]] (I, c)
[[Spatial(v, h)]] (c, c′) = [[v]] (c, c′) ∧ [[h]] (c, c′)
[[Horiz(q)]] (c, c′) = (fst(c)− fst(c′)) ∈ Range(q)
[[Vert(q)]] (c, c′) = (snd(c)− snd(c′)) ∈ Range(q)
where Range(-∗) = {−1,−2,−3, . . .}Range(∗) = {1, 2, 3, . . .}Range(i) = {i}
[[>]] (c, c′) = true
[[Select(T1, T2)]] (c, C) = [[T2]] (c, [[T1]] (c, C))
[[All]] (c, C) = C
[[NearX]] (c, C) = argminc′∈C
|fst(c)− fst(c′)|
[[Anchor(r,β)]] I, c = ∃c′ ([[r]] I[c′] ∧ [[β]] (c, c′))
[[⊥]] (I, c) = true
[[r]] s = true iff regular expression rmatches string s
(d)
Figure 5: (a) Syntax and (b) types of a FLARE program ρ. We refer to ∗ as a Kleene star. (c) For notational convenience, we usethe shorthand syntax on the left to denote the expressions on the right. (d) Semantics of a FLARE program ρ on spreadsheet I .x, y, and z are Coordinates. c is a Cell. C is a set of Cells. a and b are integers, and v is a Boolean.
and cell constraints. Anchor constraints serve as a Booleanpredicate but do not extract a column in the output tuple.
A spatial constraint Spatial(v, h) consists of a pair ofconstraints: a vertical constraint v, and a horizontal con-straint h. Both forms are Boolean constraints over a pair ofcells and check whether the two cells have the specified ver-tical and horizontal orientation, respectively. Both forms areparameterized by a quantity argument q. Kleene (“*”) quan-tities can match any cell in a particular direction, whereasconstant quantities only match cells in a particular location.
The select constraint γ consists of a pair of enumeratedType tags that control the behavior of Kleene quantities.A tag Type is either All, NearX, NearY, FarX, or FarY,each of which is a filter over a set of cells C with respect toanother cell c. In particular, the tag NearX selects those cells
from C that have the shortest horizontal distance from thecell c. Other tags are defined similarly. A select constraintwill typically contain at most one constraint in each direction(i.e., at most one of NearX and FarX, and at most one ofNearY and FarY).
3.1 Program ExecutionIn this section, we walk through the execution of a FLAREprogram and discuss our early experience writing programsfor extracting data from spreadsheets. Because FLAREbuilds on regular expressions, the additional concepts wepresent are relatively easy to learn.
For our example, we return to the input spreadsheetshown in Fig. 1a and the desired relational table output
FLASHRELATE 6 2014/4/23
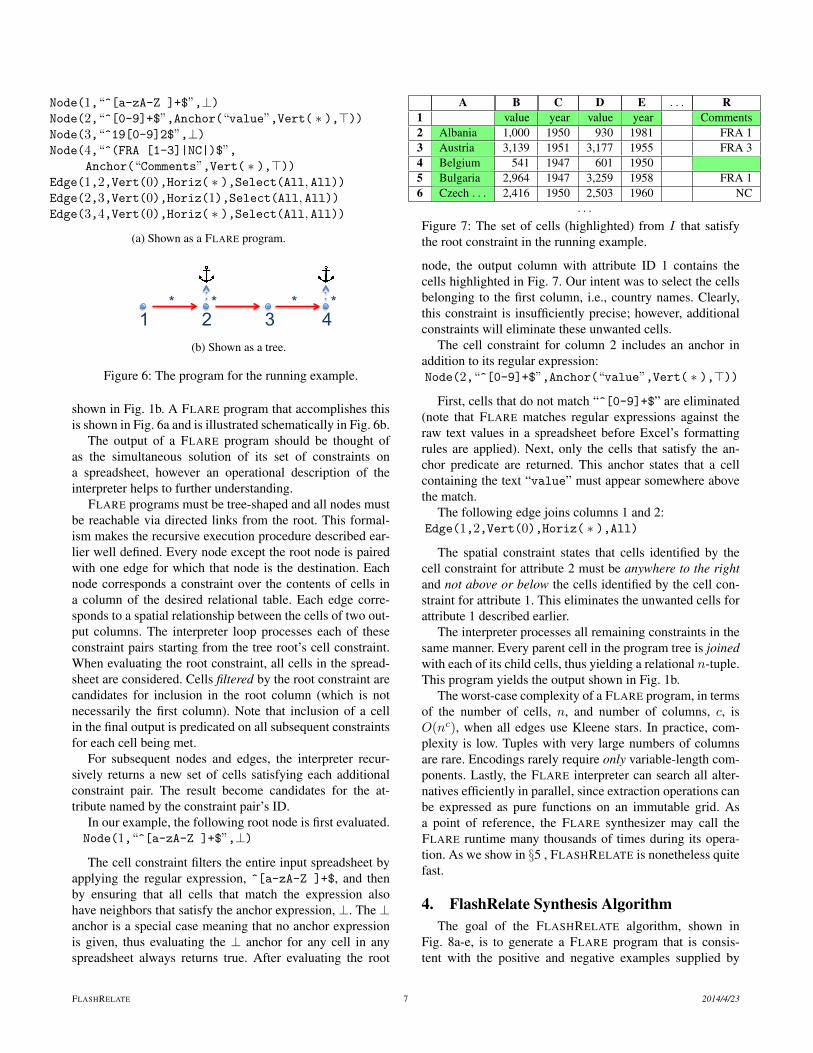
Node(1,“^[a-zA-Z ]+$”,⊥)Node(2,“^[0-9]+$”,Anchor(“value”,Vert( ∗ ),>))Node(3,“^19[0-9]2$”,⊥)Node(4,“^(FRA [1-3]|NC|)$”,
Anchor(“Comments”,Vert( ∗ ),>))Edge(1,2,Vert(0),Horiz( ∗ ),Select(All, All))Edge(2,3,Vert(0),Horiz(1),Select(All, All))Edge(3,4,Vert(0),Horiz( ∗ ),Select(All, All))
(a) Shown as a FLARE program.
3 2 1 * * *
4 *
(b) Shown as a tree.
Figure 6: The program for the running example.
shown in Fig. 1b. A FLARE program that accomplishes thisis shown in Fig. 6a and is illustrated schematically in Fig. 6b.
The output of a FLARE program should be thought ofas the simultaneous solution of its set of constraints ona spreadsheet, however an operational description of theinterpreter helps to further understanding.
FLARE programs must be tree-shaped and all nodes mustbe reachable via directed links from the root. This formal-ism makes the recursive execution procedure described ear-lier well defined. Every node except the root node is pairedwith one edge for which that node is the destination. Eachnode corresponds a constraint over the contents of cells ina column of the desired relational table. Each edge corre-sponds to a spatial relationship between the cells of two out-put columns. The interpreter loop processes each of theseconstraint pairs starting from the tree root’s cell constraint.When evaluating the root constraint, all cells in the spread-sheet are considered. Cells filtered by the root constraint arecandidates for inclusion in the root column (which is notnecessarily the first column). Note that inclusion of a cellin the final output is predicated on all subsequent constraintsfor each cell being met.
For subsequent nodes and edges, the interpreter recur-sively returns a new set of cells satisfying each additionalconstraint pair. The result become candidates for the at-tribute named by the constraint pair’s ID.
In our example, the following root node is first evaluated.Node(1,“^[a-zA-Z ]+$”,⊥)
The cell constraint filters the entire input spreadsheet byapplying the regular expression, ^[a-zA-Z ]+$, and thenby ensuring that all cells that match the expression alsohave neighbors that satisfy the anchor expression, ⊥. The ⊥anchor is a special case meaning that no anchor expressionis given, thus evaluating the ⊥ anchor for any cell in anyspreadsheet always returns true. After evaluating the root
A B C D E . . . R1 value year value year Comments2 Albania 1,000 1950 930 1981 FRA 13 Austria 3,139 1951 3,177 1955 FRA 34 Belgium 541 1947 601 19505 Bulgaria 2,964 1947 3,259 1958 FRA 16 Czech . . . 2,416 1950 2,503 1960 NC
. . .
Figure 7: The set of cells (highlighted) from I that satisfythe root constraint in the running example.
node, the output column with attribute ID 1 contains thecells highlighted in Fig. 7. Our intent was to select the cellsbelonging to the first column, i.e., country names. Clearly,this constraint is insufficiently precise; however, additionalconstraints will eliminate these unwanted cells.
The cell constraint for column 2 includes an anchor inaddition to its regular expression:Node(2,“^[0-9]+$”,Anchor(“value”,Vert( ∗ ),>))
First, cells that do not match “^[0-9]+$” are eliminated(note that FLARE matches regular expressions against theraw text values in a spreadsheet before Excel’s formattingrules are applied). Next, only the cells that satisfy the an-chor predicate are returned. This anchor states that a cellcontaining the text “value” must appear somewhere abovethe match.
The following edge joins columns 1 and 2:Edge(1,2,Vert(0),Horiz( ∗ ),All)
The spatial constraint states that cells identified by thecell constraint for attribute 2 must be anywhere to the rightand not above or below the cells identified by the cell con-straint for attribute 1. This eliminates the unwanted cells forattribute 1 described earlier.
The interpreter processes all remaining constraints in thesame manner. Every parent cell in the program tree is joinedwith each of its child cells, thus yielding a relational n-tuple.This program yields the output shown in Fig. 1b.
The worst-case complexity of a FLARE program, in termsof the number of cells, n, and number of columns, c, isO(nc), when all edges use Kleene stars. In practice, com-plexity is low. Tuples with very large numbers of columnsare rare. Encodings rarely require only variable-length com-ponents. Lastly, the FLARE interpreter can search all alter-natives efficiently in parallel, since extraction operations canbe expressed as pure functions on an immutable grid. Asa point of reference, the FLARE synthesizer may call theFLARE runtime many thousands of times during its opera-tion. As we show in §5 , FLASHRELATE is nonetheless quitefast.
4. FlashRelate Synthesis AlgorithmThe goal of the FLASHRELATE algorithm, shown in
Fig. 8a-e, is to generate a FLARE program that is consis-tent with the positive and negative examples supplied by
FLASHRELATE 7 2014/4/23

SYNTH(I, P,N)
1 for each column index i2 AN [i] = LearnN (I, P, i)3 for each pair of column indices i, j such that i 6= j4 AE [i, j] = LearnE(I, P, i, j)5 return SEARCH(∅, N,AN ,AE)
(a)
SEARCH(CP , N,AN ,AE)1 if |CP | = NUMCOLS2 if
⋃(α,β)∈CP
Negate(α) ∪ Negate(β) = N
3 return CP4 else return FAILURE5 else6 CE = {E | E ∈ CP}7 pairs = {(N , E) | N ∈ AN [i], E ∈ AE [i, j]
s.t. G′ = (V,CE ∪ {E}) is loop-freeand i, j ∈ [1 . . .NUMCOLS]}
8 pairs ′ = RANKP(pairs)9 k = 0
10 while k < |pairs ′|11 C ′
P = SEARCH(CP ∪ {pairs ′[k]}, N)12 if C ′
P = FAILURE13 k = k + 114 else15 return C ′
P16 return FAILURE
(b)
LEARNN (I, P, i)
1 A = set of predefined constraints2 AN = ∅3 for each constraint α ∈ A4 if ∀ tuples p ∈ P, [[α]] (I, p[i]) = true5 AN = AN ∪ {Node(i, α)}6 return AN
(c)
LEARNE(I, P, i, j)1 AE = ∅2 V = LEARNQUANT(I, P, i, j, TRUE)3 H = LEARNQUANT(I, P, i, j, FALSE)4 for each {v, h | v ∈ V, h ∈ H}5 β = Spatial(v,h)6 for each γ ∈ ENUMSELECT7 AE = AE ∪ {Edge(i,j,β,γ)}8 return AE
(d)
LEARNQUANT(I, P, i, j, vert)
1 ∆ = ∅2 Q = ∅3 λ = Vert if vert otherwise Horiz
4 φ = snd if vert otherwise fst5 for each p ∈ P6 ∆ = ∆ ∪ {λ(φ(p[j])− φ(p[i]))}7 if ∀δ1, δ2 ∈ ∆, δ1 = δ28 Q = any δ ∈ ∆9 if ∀δ ∈ ∆, δ ≥ 0
10 Q = Q ∪ {λ(∗)}11 else if ∀δ ∈ ∆, δ ≤ 012 Q = Q ∪ {λ(−∗)}13 else return FAILURE14 return Q
(e)Figure 8: FLASHRELATE’s program synthesis procedures. (a) is the top-level procedure. (b) is the program search procedure.(c) is a subroutine for learning node constraints from positive examples. (d) is a subroutine for learning edge constraints frompositive examples. ENUMSELECT is a macro that enumerates the set of all possible select constraints. (e) learns the directionand amount of spacing between examples.
the user. A FLARE program is a set of cell and spatial con-straints, which as we described earlier, represent verticesand edges in a constraint graph. We thus frame the prob-lem of finding a correct program as a search over all validsets of these constraints that satisfy the positive and negativeexamples.
While FLARE can produce programs that represent arbi-trary disconnected directed acyclic graphs (DAGs), we limitthe FLASHRELATE’s capabilities to producing connected di-rected trees. We do this for two reasons: 1) all of the encod-ings that we have examined thus far can be encoded in thetree-shaped subset of FLARE, and 2) this formulation allowsus to reduce the problem of finding a satisfying program tothat of finding a spanning tree. Thus FLASHRELATE’s pro-
gram search procedure, shown in Fig. 8b, is modeled on arecursive formulation of Kruskal’s spanning tree algorithm.
We also employ a number of heuristics in FLASHRE-LATE. Note that there may be many constraint graphs thatsatisfy the examples given by the user. While all of theseprograms are correct with respect to the user’s examples,not all of them are what the user wants. Inferring user de-sires from incomplete specifications is a difficult problem.Our heuristics are thus employed to accomplish two goals:1) they guide the search toward constraints more likely to becreated by users, and 2) speed the search by
4.1 DefinitionsWe use the following terms in Fig. 8. Let P be a set of user-provided tuples representing desired program outputs, from
FLASHRELATE 8 2014/4/23

this point on referred to as positive examples. Let N be aset of user-provided tuples representing undesired programoutputs, from this point on referred to as negative examples.NUMCOLS is defined as the number of attributes in a tuplein P .
Let V be the set of attribute IDs, where each ID representsa position in the desired relational output tuple in P . Let Ebe the complete set of directed edges, each edge referredto by a pair of attribute IDs (i, j). Let G = (V,E) be thecomplete digraph over the attributes in P . The followingtwo expressions also signify a shorthand for the negativetuples excluded by a cell constraint and spatial constraint,respectively:
Negate(α) ≡ {n ∈ N | n /∈ [[α]] (I, c),∀c ∈ I}Negate(β) ≡ {n ∈ N | n /∈ [[β]] (c, c′),∀c, c′ ∈ I, c 6= c′}
4.2 AlgorithmInformally, the synthesizer must perform the followingtasks, given P and N :1. Using positive examples, determine which cell con-
straints are possible (Fig. 8c). See §4.2.1 .2. Using positive examples, determine which spatial con-
straints are possible (Fig. 8d). See §4.2.2 .3. Identify a combination of cell and spatial constraints that
excludes all negative examples (Fig. 8b). See §4.2.3 .We discuss a number of implementation details that make
FLASHRELATE’s search procdure efficient in §4.2.4 .
Example We discuss a single round of synthesis using thealgorithm shown in Fig. 8 by way of a running example, thespreadsheet shown in Fig. 9a. The desired relational outputis shown in Fig. 9b.
FLASHRELATE is intended to be used in the followinginteractive manner:1. The user calls FLASHRELATE with a sample tuple (a
positive example) from the desired relation over data inthe spreadsheet. FLASHRELATE returns a program to theuser.
2. If the program extracts the relational table that the userwanted, the user is done. Otherwise, the user points out adiscrepancy between the extracted table and the intendedtable with one of the following actions:• If the extracted table is missing a tuple, the user pro-
vides a new positive example and calls FLASHRE-LATE again (step 2).
• If the extracted table contains an undesired tuple,the user provides a new negative example and callsFLASHRELATE again (step 2).
Note that while users must provide at least one new posi-tive or negative example during each round of the proceduredescribed above for the algorithm to synthesize an improvedFLARE program, they are not limited to providing only a sin-gle new example.
Suppose our user starts the process by providing the fol-lowing positive example to the synthesizer, the first tuple inthe desired table:
Deerfield 130 Central St. Joe M.
Note that this positive example also encodes the follow-ing information, a map from each tuple attribute index tospreadsheet coordinates.
1 −→ (1, 2) 2 −→ (2, 2) 3 −→ (3, 2)
FLASHRELATE uses both representations. The first rep-resentation describes the contents of a tuple; the second rep-resentation describes the spatial relationships between at-tributes in a tuple.
4.2.1 Step 1: Determine cell constraintsThe FLASHRELATE synthesizer constructs cell constraintsfrom regular expressions. A regular expression comes fromone of two places: 1) it is dynamically constructed from asmall set of standard character class tokens (EmptyCellTok,WhiteSpaceTok, AlphaTok, NumTok, and PunctTok), or2) it comes from a small collection of commonly occurringstring patterns that we identified while studying spreadsheetsin the EUSES corpus. This strategy has been used by oth-ers [13] in research for learning string programs.
Regular expression learning algorithms are outside thescope of this paper, but the topic is well-studied [2]. Thus,the primary focus in this paper is in learning geometricpatterns (see §4.2.2 ). FLASHRELATE is designed to workwith any learning procedure that can learn from a set ofpositive string examples.
Since cell constraints may also include anchor con-straints, we use the following simple anchor synthesis scheme.Given a set of positive example cells for attribute i, theanchor synthesizer searches each cell’s neighbors for asimilarly-located common string. If such a common neigh-bor is discovered, an Anchor is added as a possibility for theappropriate cell constraint. In practice, we find that emptycells are frequently used as anchors by the synthesizer.
Line 1 in Fig. 8a calls LearnN (Fig. 8c) for each the setof strings corresponding to each attribute ID i in the set ofpositive examples. LearnN eliminates those constraints thatdo not match all of the strings associated with i.
Returning to our example, if the synthesizer is given theset of regular expressions shown in Fig. 10, LearnN returnsthe constraints shown in Fig. 11.
4.2.2 Step 2: Determine spatial constraintsLine 3 in Fig. 8a calls LearnE (Fig. 8d) for each pair ofattribute indices (i, j) in P . LearnE finds all possible spatialconstraints that satisfy the observed spatial layout betweencolumns from positive examples.
For each positive example p, LearnE calculates the deltafor the cells (lines 2-3) p[i] and p[j]. Each delta is the dis-tance in either the horizontal or vertical direction, expressedas a number of cells, between p[i] and p[j].
FLASHRELATE 9 2014/4/23

1 2 31 Town Address Owner2 Deerfield 130 Central St. Joe M.3 10 Whately Ave. Mary L.4 TOTAL 25 Amherst 10 North Pleasant St. Bob O.6 55 Westman Lane Claudia S.7 2 Rectangle Ct. Alyssa B.8 TOTAL 39 Hadley 5 Rocky Rd. Greg S.
10 34 Godell Rd. Omar L.11 TOTAL 2
1 2 31 Deerfield 130 Central St. Joe M.2 Deerfield 10 Whately Ave. Mary L.3 Amherst 10 North Pleasant St. Bob O.4 Amherst 55 Westman Lane Claudia S.5 Amherst 2 Rectangle Ct. Alyssa B.6 Hadley 5 Rocky Rd. Greg S.7 Hadley 34 Godell Rd. Omar L.
Figure 9: (a) An input spreadsheet. (b) The desired relational table. Note that missing fields have been inserted and headers andsummary rows have been removed.
^[0-9]+$ ^[a-z]+$
^[A-Z]+$ ^[A-Z][a-z]+$
^[0-9]+ [a-zA-Z. ]+$ ^[a-zA-Z. ]+$
Figure 10: The example uses the above set of regular expres-sions.
{ Node(1, ^[A-Z][a-z]+$,⊥) }{ Node(2, ^[0-9] [a-zA-Z. ]+$,⊥) }{ Node(3, ^[a-zA-Z. ]+$,⊥) }
Figure 11: Candidate cell constraints after calling LearnN .
Edge(1, 2, Vert(0), Horiz(1)), Select(All, All))Edge(1, 2, Vert(0), Horiz( ∗ )), Select(All, x))Edge(1, 2, Vert( ∗ ), Horiz(1)), Select(y, All))Edge(1, 2, Vert( ∗ ), Horiz( ∗ )), Select(y, x)). . .
Figure 12: Candidate Edge constraints from the run-ning example. Only the constraints for attribute pair(1, 2) are shown, x ∈ {NearX, FarX, All}, and y ∈{NearY, FarY, All} for space reasons.
Node(1, ^[A-Z][a-z]+$,⊥)Node(2, ^[0-9] [a-zA-Z. ]+$,⊥)Node(3, ^[a-zA-Z. ]+$,⊥)Edge(1, 2, Vert(0), Horiz(1)), Select(All, All))Edge(2, 3, Vert(0), Horiz(1)), Select(All, All))
Figure 13: The program synthesized given a single positiveexample.
Deerfield 130 Central St. Joe M.Amherst 10 North Pleasant St. Bob O.Hadley 5 Rocky Rd. Greg S.
Figure 14: Program output after running the synthesis algo-rithm with a single positive example.
Given the set of deltas derived from all the positive ex-amples for i and j, the set falls into one of more of the fol-lowing classes. We use delta class information when callingEdge constructors to generate spatial constraints.
1. All the deltas represent a fixed distance, and the set ofdeltas is a bijective relation from p[i] to p[j]. This classproduces constant-length quantity values for Vert() orHoriz() constructors.
2. Delta distances vary, and the set of deltas is a bijective re-lation from p[i] to p[j]. This class produces Kleene (“*”)quantities for Vert() and Horiz() constructors and“match-single” select type tags (NearX, FarX; NearY,FarY).
3. Delta distances vary, and the set of deltas is not a bijec-tive relation from p[i] to p[j]. Specifically, one or moredistinct p[i] maps to two or more p[j]. This class pro-duces Kleene (“*”) quantities for Vert() and Horiz()
constructor and “match-all” select type tag (All).We also use delta class information when pruning for
efficiency reasons (see 4.2.4, “Pruning”). The set of possiblespatial constraints inferred for ID pair (1, 2) for our singlepositive example is shown in Fig. 12.
4.2.3 Step 3: Find a satisfying set of constraintsNext FLASHRELATE searches for a set of constraints thatsatisfy its negative examples (Fig. 8a). As shown in Fig. 8b,there are five essential steps in this recursive procedure:1. Exclude (Node, Edge) constraint pairs that would intro-
duce a loop into the program graph given the current setof chosen constraints (line 7).
2. Call RankP to rank constraint pairs (line 8). We discussRankP in §4.2.4 .
3. Choose a constraint pair (line 10).4. Recursively choose the next pair of constraints (line 11).5. If constraints have been found for all the attributes in
the relation, ensure that the program excludes all of thenegative examples (line 2) and return the program. If not,backtrack (line 4).We define here some additional terms used in Fig. 8.
Lines 6-16 represent the algorithm’s implementation of non-deterministic choice. Each iteration of the while loop rep-resents a choice point. CE denotes the a set of chosen edgesat a particular choice point. CP denotes the set of chosenconstraint pairs (α, β) at the same choice point where α is
FLASHRELATE 10 2014/4/23

a Node(j, r,O) constraint and β is an Edge(j, k, v, h, γ)constraint. pairs denotes the set of all valid constraint pairsat the same choice point.
The search space may contain numerous solutions. Thealgorithm is free to choose any correct program that excludesall of the negative examples. The implementation of RankPdetermines which pair of constraints the search ultimatelychooses. We discuss these implementation choices in §4.2.4.
In our example, suppose the synthesizer chooses the pro-gram shown in Fig.13. Since, in our example, the user hasprovided no negative examples, the chosen program triviallysatisfies the criteria on line 2 in Fig. 8. Were this not thecase, the search would backtrack and consider a differentconstraint pair.
The output of this program is shown in Fig. 14. While allof the extracted tuples are correct, the output is missing rowswith omitted towns in the original spreadsheet (Fig. 9a). Theuser’s next step is to add another positive example (e.g., the2nd tuple in Fig. 9b) and call the synthesis algorithm again(Fig. 8a). This procedure continues until the user is satisfiedwith the output of the algorithm. We omit these additionaluser-interactions for brevity.
4.2.4 Implementation DetailsThe efficient operation of the synthesis algorithm dependson three key implementation ideas:1. Pruning of the search space, for efficient search.2. Ranking schemes for synthesizer search choices.3. Choice of data structures.
Pruning Constant-length spatial constraints can be ruledout when the geometric form has been shown to vary. In ourexample in Fig. 9, all Edge constraints containing Vert(0)for (1, 2) can be ruled out because the cell in the secondcolumn in the second tuple (“10 Whately Ave.”) is not aconstant-length distance vertically from the first cell (“Deer-field”). In the first tuple, the vertical distance is zero; in thesecond the distance is 1.
Match-single spatial constraints can also be ruled out insome cases. In the same example mentioned above, it isnot possible for the Edge constraint for (1, 2) to contain aSelect() with the tags NearY or FarY. This is because it ispossible to match two different cells (“130 Central St.” and“10 Whately Ave”) for attribute 2 from the starting cell forattribute 1 (“Deerfield”).
Ranking FLASHRELATE often has a number of alterna-tive constraints to choose. The balance of specific vs generalconstraints is important because it impacts both the speedof the synthesizer and the number of examples required bythe user. Favoring specific constraints may make the searchfast, because they are more likely to rule out negative exam-ples. However, specific constraints may also mean that theuser must provide more positive examples before the correctprogram is found. Conversely, favoring general constraints
may fail to exclude negative examples, causing the searchto backtrack frequently, resulting in a slow search. Generalconstraints may require a user to provide more negative ex-amples.
We tend to favor more specific programs over more gen-eral programs. This enables users to focus on what theywant, instead of what they don’t want, which we believe tobe more natural. This design choice also allows for fastersearch. We rank constraint pairs by the following schemes,in this order:1. R1 Constraints that exclude large numbers of negative
examples are favored over constraints that exclude few.This scheme ensures that the search favors constraintsthat exclude negative examples.
2. R2 Specific spatial constraints are favored over generalspatial constraints. This scheme implies that multiplepositive examples are required to learn non-constant-length spatial constraints.
3. R3 Straighter programs are favored over ones with morebends. This simplifies programs.
4. R4 We consider the cells above and to the left of positiveexamples to be implicit negative examples.
Data Structures The effect of a constraint on a spreadsheetis a set of cells. We represent node matches as a bit vector(using .NET’s BigInteger struct). Likewise, we representedge matches as a mapping from cell coordinates to bit vec-tors. In both cases, the length of the bit vector correspondsto the number of cells in the spreadsheet, and the coordinateof a given index in the bit vector is determined by a map-ping function, f . In the bit vector, a “1” at index i meansthat the constraint matched a cell at coordinate f(i) in thespreadsheet; a “0” indicates no match.
This representation is efficient for three reasons: 1)Matches are stored efficiently. For Node constraints, onlyone bit per cell is required. 2) Questions such as “does thisconstraint satisfy all positive examples?” can be answered inconstant time using bit vector arithmetic. For this purpose,we bitwise-AND the effect of a constraint with the bit vec-tor representing the positive examples. If the resulting bitvector equals the positive example bit vector, then answeris yes, otherwise no. 3) Operations requiring bit-countingcan be done in O(# bits set) using Wegner’s bit-countingalgorithm [27]. Bit-counting is frequently used in our rank-ing schemes to count the number cells matching a particularcriteria.
We are able to evaluate partial programs efficiently duringsearch using a dynamic programming scheme by cachingthe effect of each constraint on the input spreadsheet. Lastly,partial program evaluation can largely happen in parallel andbefore the synthesizer runs (i.e., offline). With a large set ofconstraints, this is especially beneficial, as the system canprocess constraints in the background before users invokethe program synthesizer.
FLASHRELATE 11 2014/4/23

5. EvaluationIn this section, we evaluate the design of FLARE andFLASHRELATE on a variety of real-world spreadsheets. Thepurpose of this evaluation is to answer the following ques-tions:1. It is possible to manually write FLARE programs to per-
form a diverse set of extraction tasks?2. Can FLASHRELATE automatically infer equivalent pro-
grams for the same set of tasks as in question 1?3. How effective are our heuristics at reducing the execu-
tion time and number of examples required by the syn-thesizer?
5.1 Benchmark Spreadsheets and TasksTo evaluate FLASHRELATE, we assembled a collection of 43benchmarks using spreadsheets taken from other work onreorganizing spreadsheet tables, from our own microbench-marks for testing purposes, and from a large spreadsheet cor-pus created for research purposes.
Benchmark Selection Our evaluation considers two setsof benchmarks1. The first set of benchmarks were borrowedfrom prior work [16] that examined 51 table-transformationprograms from Excel user-help forums. Despite the appar-ent complexity of these tasks, we found to our surprisethat nearly half (22) of the transformations were straight-forward relational extraction tasks in FLARE. To round outour evaluation with more difficult tasks, we assembled a sec-ond set of benchmarks by searching the EUSES spreadsheetcorpus [11] for spreadsheets with complex ad-hoc encod-ings. This second set of benchmarks was chosen specificallyto test our synthesis algorithm against challenging extrac-tion tasks. We also supplemented this second set with syn-thetic benchmarks known to present challenges to our syn-thesizer. As a measure of the complexity of the extractointask for each benchmark, we note the number of variable-length Edge constraints that appear in our ground truth pro-grams (“k*” in 16).
Expressiveness To evaluate the expressiveness of FLARE,we manually wrote a correct Flare program for each bench-mark and extracted the resulting output table. In the courseof this effort, we found that the FLARE language is expres-sive enough to extract the desired tuple from all of multi-dimensional data patterns we observed. We conclude that,independent of our ability to synthesize a FLARE program,FLARE is an effective tool for expressing data extractiontasks against semi-structured data projected into a two-dimensional grid.
Synthesizer Experiments Using our ground truth pro-grams, we compare the results of the FLASHRELATE syn-thesis algorithm to evaluate its effectiveness. Recall that syn-thesis depends on providing a set of positive and negativeexamples to the synthesis algorithm as described in §4 .
1 All benchmarks will be made available online.
The following method is intended to simulate a user in-teracting with FLASHRELATE. The relational table extractedby the ground truth query represents the user’s desired ex-traction output; we call this the oracle. After each invocationof the FLASHRELATE algorithm by our simulated user witha set of examples, we determine whether the synthesizedprogram is correct by comparing its output against the or-acle. When the FLASHRELATE output differs, the user findsthe first tuple that deviates from the oracle by scanning theextracted table from top to bottom. Deviant tuples come intwo forms: 1) if a tuple from the oracle is missing from theprogram output, it is a positive example; 2) if a tuple fromthe program output does not appear in the oracle, it is a neg-ative example. We repeat this process until the synthesizereither finds a program whose output matches the oracle orwe time-out. 10 minutes was chosen as the maximum totalduration of the task as we felt that typical users longer waittimes intolerable.
In our experiments, we consider 5 algorithm configura-tions to understand the benefit of our ranking choices. In allcases, regular expressions come from a small corpus (< 100)of common patterns combined with the regular expressiongenerator described in § 4. Each configuration examines theeffect of adding a ranking scheme to the FLASHRELATE al-gorithm. Experiment configurations are: 1) all rankings, 2)R1, R2, and R3, 3) R1 and R2, 4) R1, and 5) no rank-ing. For each ranking scheme, R# refers to the proceduredescribed in §4.2.4 (Ranking).
5.2 ResultsFig. 15a shows the total time it takes to synthesize our43 benchmarks. The y-axis shows the running time of thesynthesis algorithm in cases where it succeeded. The axisis truncated at 60 seconds since, with ranking, most bench-marks succeed well before that time.
In the best case (all rankings), the algorithm failed to finda solution within 10 minutes for only 1 out of 43 bench-marks. When synthesis found a correct solution, more than80% of the benchmarks completed in less than 10 secondstotal. Per-iteration time is extremely fast: typically a useronly has to wait 1.6 seconds (median: 0.6 seconds).
Fig. 15b shows the number of examples (iterations) re-quired to synthesize the correct result. Users only need toprovide an average of 3.5 positive examples (median: 3 pos-itive examples) and 2.0 negative examples (median: 1 neg-ative example). Without ranking, the algorithm is signifi-cantly slower, and fails to find a solution more often beforea timeout occurs (for 13 total timeouts). Without ranking,the algorithm also requires many more examples: an aver-age of 3.0 positive and 13.7 negative examples (medians:3 positive; 9 negative). We conclude that without ranking,sometimes very general solutions are generated (matchingtoo many cells) and thus numerous negative examples arerequired to sufficiently narrow the selection.
FLASHRELATE 12 2014/4/23

0
10
20
30
40
50
60
0 10 20 30 40 50 60 70 80 90 100
# of Secon
ds
% benchmarks synthesized in ≤ Y total seconds
all
R1,R2,R3
R1,R2
R1
none
0
5
10
15
20
25
30
35
40
0 10 20 30 40 50 60 70 80 90 100
# of Examples
% of benchmarks requiring ≤ Y examples
all
R1,R2,R3
R1,R2
R1
none
(a) (b)
Figure 15: (a) Total benchmark synthesis times with ranking and without ranking schemes. Lower numbers are better. Forexample, none (no heuristics) succeeded on roughly 60% of the benchmarks before the timeout whereas all succeeded on allbut one. (b) Number of examples required to successfully synthesize a program with and without ranking schemes. Lowernumbers are better. Generally, all required fewer examples than the other heuristics.
pre worst pos # # # # pre worst pos # # # #(sec) (sec) + neg k* col rec cells (sec) (sec) + neg k* col rec cells
hg ex2 0.1 5.7 3+2 0 9 14 270 h8d62ck 0.2 2.7 5+5 2 8 62 864hg ex3 0.0 0.2 2+2 0 2 15 168 02rise 0.0 5.0 4+1 0 12 6 175hg ex4 0.0 0.2 2+1 1 2 6 9 03-1-report 0.1 0.4 6+1 4 4 177 702hg ex5 0.0 0.2 2+1 0 2 92 128 03PFMJOUR 0.1 2.0 3+2 1 7 10 288hg ex6 0.0 0.3 5+2 2 3 9 68 1213 0.1 1.0 3+2 4 4 116 350hg ex7 0.0 19.9 3+1 0 17 3 171 1214 1.7 0.9 5+2 3 3 62 162hg ex8 0.0 1.1 5+4 3 5 250 240 2003FinalPop 0.5 0.2 3+2 1 2 191 1113hg ex9 0.0 0.1 1+1 0 1 8 8 3 4 0.2 1.3 3+4 1 5 68 522hg ex10 0.0 0.2 2+1 1 2 20 30 3q2000 0.9 19.3 4+1 0 19 5 3780hg ex11 0.0 0.3 3+3 2 3 19 42 3yrsegment 0.1 1.7 3+1 2 5 55 750hg ex12 0.1 1.9 3+1 0 9 3 252 4q03fax 0.2 0.9 7+3 2 3 186 1394hg ex13 0.0 0.5 4+2 4 4 5 63 act3 23 0.0 0.7 3+4 3 3 24 175hg ex17 0.0 0.4 1+1 0 4 16 160 act4 023 0.1 0.6 4+3 2 4 222 312hg ex18 0.0 2.0 3+2 0 6 3 28 Appen4-5 TO TO NA 3 4 99 1020hg ex26 0.0 0.4 1+1 0 4 4 16 ascap 2000 0.3 0.8 5+1 0 6 168 252hg ex29 0.0 4.0 1+1 0 9 3 60 ascap 2001 0.1 0.8 5+1 2 6 39 1037hg ex35 0.6 6.4 4+1 0 14 36 2786 e-learning 0.2 2.2 8+15 4 6 127 522hg ex36 0.0 0.8 1+1 0 6 3 36 Favorite 0.0 0.3 3+3 2 3 36 68hg ex37 0.0 2.0 1+1 0 10 5 55 historical 0.3 1.3 10+1 3 4 251 1911hg ex39 0.1 0.2 2+2 0 2 49 146 Staircase 0.0 0.3 3+2 2 3 3 9hg ex40 0.0 8.9 1+1 0 12 1 12 Table 201 0.2 4.9 7+1 4 9 45 540hg ex41 0.1 3.2 7+1 2 10 171 840
Figure 16: Benchmarks from [16] are shown on the left while benchmarks from [11] are shown on the right. pre (sec) is theprecomputation time; worst (sec) is the duration of the longest iteration; pos+neg is the number of positive and negativeexamples required for synthesis; # k* is the number of Kleene stars in the ground truth program, a measure of its complexity;# col is the number of columns in the output table; # rec is the number of records in the output table; # cells is the numberof cells in the used range of the input spreadsheet. TO indicates that the synthesis algorithm timed-out after 10 minutes. Weabbreviate file names for compactness.
Table 16 summarizes the time and number of examplesrequired by the algorithm with all rankings enabled as wellas benchmark complexity.
We find that FLASHRELATE is quite successful at syn-thesizing the appropriate program quickly and with a small
amount of user effort. Furthermore, while one rankingscheme sacrifices a slightly higher speed for fewer itera-tions (R4), which we consider to be an acceptable tradeoff,generally our ranking schemes reduce both the number ofexamples required and the time the user has to wait.
FLASHRELATE 13 2014/4/23

5.3 Experimental SetupWe evaluated synthesis on typical end-user hardware. Ourtest machine was a AMD Phenom II X4 940 quad-coredesktop machine running at 3GHz with 4GB of RAM.FLASHRELATE was written in a mix of F# and C# as aMicrosoft Excel 2010 VSTO.NET plugin for Windows 8.
5.4 Future WorkUsers sometimes use other encodings, like color or type-face formatting. While FLARE does not currently supportconstraints based on these attributes, they are a straight-forward extension to our work. Combining FLASHRELATEwith other program synthesis techniques would allow endusers to handle ad-hoc in-cell encodings [15].
6. ConclusionThe flexibility of spreadsheets allows users to combine datadefinitions and data views, providing expressiveness at theexpense of utility. The ad-hoc structure of such spreadsheetsmakes it challenging to leverage existing tools (for dataanalysis, etc.) that require data to be present in a standardrelational format. We present FLARE, the first language toallow users to express relational extraction queries againstsemi-structured, two-dimensional spreadsheet data. FLAREis much like a two-dimensional AWK. We also presentFLASHRELATE, an algorithm for the automatic synthesis ofFLARE programs from user-provided positive and negativeexamples. Using EUSES and other spreadsheet benchmarks,we show that we can often synthesize programs that userswant, making FLARE accessible to non-experts.
A video demonstration of FLASHRELATE is available at:http://tinyurl.com/oz72quh
References[1] R. Abraham and M. Erwig. Header and unit inference for
spreadsheets through spatial analyses. In VL/HCC, pages165–172, 2004.
[2] D. Angluin. Learning regular sets from queries and counterex-amples. Inf. Comput., 75(2):87–106, 1987.
[3] M. Anselmo, D. Giammarresi, and M. Madonia. Regular ex-pressions for two-dimensional languages over one-letter al-phabet. In Developments in Language Theory, Lecture Notesin Computer Science. 2005.
[4] M. J. Cafarella, A. Halevy, and J. Madhavan. Structured dataon the web. CACM, 54(2):72–79, 2011.
[5] Z. Chen and M. Cafarella. Automatic web spreadsheet datextraction. In SSW’13, 2013.
[6] Z. Chen, M. Cafarella, J. Chen, D. Prevo, and J. Zhuang. Sen-bazuru: a prototype spreadsheet database management sys-tem. PVLDB, 6(12):1202–1205, 2013.
[7] J. Cunha, J. Saraiva, and J. Visser. From spreadsheets torelational databases and back. In PEPM 2009, pages 179–188. ACM, 2009.
[8] A. Das Sarma, A. Parameswaran, H. Garcia-Molina, andJ. Widom. Synthesizing view definitions from data. In ICDT,2010.
[9] E. Ferrara, P. De Meo, G. Fiumara, and R. Baumgartner. Webdata extraction, applications and techniques: a survey. arXivpreprint arXiv:1207.0246, 2012.
[10] K. Fisher and D. Walker. The PADS project: an overview. InICDT, 2011.
[11] M. I. Fisher and G. Rothermel. The EUSES SpreadsheetCorpus: A shared resource for supporting experimentationwith spreadsheet dependability mechanisms. In 1st WEUSE,pages 47–51, 2005.
[12] D. Giammarresi, F. Venezia, and A. Restivo. Two-dimensionallanguages, 1997.
[13] S. Gulwani. Automating string processing in spreadsheetsusing input-output examples. In POPL, 2011.
[14] S. Gulwani. Synthesis from examples: Interaction models andalgorithms. In SYNASC, 2012.
[15] S. Gulwani, W. Harris, and R. Singh. Spreadsheet data ma-nipulation using examples. CACM, Aug 2012.
[16] W. R. Harris and S. Gulwani. Spreadsheet table transforma-tions from examples. In PLDI, 2011.
[17] J. Kari and C. Moore. Rectangles and squares recognized bytwo-dimensional automata. Theory Is Forever, 2004.
[18] H. Lieberman. Your Wish Is My Command: Programming byExample. Morgan Kaufmann, 2001.
[19] E. Lu, R. Bodik, and B. Hartmann. Quicksilver: Auto-matic Synthesis of Relational Queries. Technical ReportUCB/EECS-2013-68, UC-Berkeley, May 2013. URLhttp://www.eecs.berkeley.edu/Pubs/TechRpts/
2013/EECS-2013-68.html.
[20] O. Matz. Regular expressions and context-free grammars forpicture languages. In STACS, 1997.
[21] E. Oro and M. Ruffolo. Sila: a spatial instance learningapproach for deep webpages. In CIKM 2011, pages 2329–2332. ACM, 2011.
[22] E. Oro, M. Ruffolo, and S. Staab. Sxpath: extending xpathtowards spatial querying on web documents. PVLDB, 4(2):129–140, 2010.
[23] M. Pradella, A. Cherubini, and S. C. Reghizzi. A unifyingapproach to picture grammars. Information and Computation,209(9), 2011.
[24] T. Register. Microsoft feeds excel to supercomputer, Nov.2009. URL http://www.theregister.co.uk/2009/11/
18/sc09_microsoft_excel_hpc/.
[25] R. Singh and S. Gulwani. Learning semantic string transfor-mations from examples. PVLDB, 5, 2012.
[26] Q. T. Tran, C.-Y. Chan, and S. Parthasarathy. Query by output.In SIGMOD, 2009.
[27] P. Wegner. A technique for counting ones in a binary com-puter. Commun. ACM, 3(5):322–, May 1960. ISSN 0001-0782. . URL http://doi.acm.org/10.1145/367236.
367286.
FLASHRELATE 14 2014/4/23