Embed Size (px)
Citation preview

A ... , � • • . I ',
, l:,;,.1,
f;, .,�-�"' IR-!11 I '1:� '
·=• · �Ii -,.,: I - •. . -,
ARLENE BARRERA AUDITOR-CONTROLLER
April 7, 2020
TO:
FROM:
SUBJECT:
C O UN TY O F LOS A NGE L ES
DEPARTMENT OF AUDITOR-CONT ROLLER
KENNETH HAHN HALL OF ADMINISTRATION 500 WEST TEMPLE STREET, ROOM 525 LOS ANGELES, CALIFORNIA 90012-3873
PHONE: (213) 974-8301 FAX: (213) 626-5427
Supervisor Kathryn Barger, Chair Supervisor Hilda L. Solis Supervisor Mark Ridley-Thomas Supervisor Sheila Kuehl Supervisor Janice Hahn
Arlene Barrera {!(\.f.JW{_ __ .hAuditor-Controller · 'f fVYV
FISCAL YEAR 2018-19 SINGLE AUDIT REPORT
Attached is the County of Los Angeles's (County) Single Audit Report (Report) for Fiscal Year 2018-19. The audit was performed by the independent accounting firm Macias Gini & O'Connell LLP. Federal law requires the County to have an annual audit of all expenditures that were funded by federal assistance received by the County. This year, the audit covered expenditures of approximately $2. 7 4 billion.
The Report identifies a number of areas with internal control weaknesses and where County departments are not in compliance with federal assistance requirements. County departments are in general agreement with the auditors' findings and have taken, or will take, corrective action. The Report also includes the statuses of the prior year's audit findings. In most cases, the prior year recommendations have been implemented or are in progress.
To comply with federal reporting requirements, we submit this Report to the State Controller and federal clearinghouse agency. It is subject to further review and follow-up action by the State Controller and/or federal agencies that provided the funding to the County.
If you have any questions please contact me, or your staff may contact Elaine Boyd at (213) 974-8321 or [email protected].
AB:CY:EB H:\Financial Reporting\GRANTS\2018-2019\Final\FY 18-19 Single Audit Board Transmittal Letter.docx
Attachment
c: Sachi A. Hamai, Chief Executive Officer Celia Zavala, Executive Officer, Board of Supervisors Audit Committee Each Department Head Countywide Communications
Help Conserve Paper - Print Double-Sided ''To Enrich Lives Through Effective and Caring Service"
a COUNTIID., http://census.lacounty.gov

COUNTY OF LOS ANGELES
BASIC FINANCIAL STATEMENTS AND
SINGLE AUDIT REPORTS
For the Year Ended June 30, 2019

COUNTY OF LOS ANGELES BASIC FINANCIAL STATEMENTS AND SINGLE AUDIT REPORTS
FOR THE YEAR ENDED JUNE 30, 2019
Table of Contents Page Independent Auditor’s Report ................................................................................................ 1 Management’s Discussion and Analysis (Required Supplementary Information – Unaudited) ............................................................................................................................. 4 Basic Financial Statements
Government-wide Financial Statements: Statement of Net Position ......................................................................................... 25 Statement of Activities .............................................................................................. 26
Fund Financial Statements: Balance Sheet – Governmental Funds ..................................................................... 28 Reconciliation of the Balance Sheet of Governmental Funds to the
Statement of Net Position ..................................................................................... 30 Statement of Revenues, Expenditures and Changes in Fund Balances –
Governmental Funds ............................................................................................ 32 Reconciliation of the Statement of Revenues, Expenditures and Changes in
Fund Balances of Governmental Funds to the Statement of Activities ................ 34 Statement of Revenues, Expenditures and Changes in Fund Balance –
Budget and Actual on Budgetary Basis: General Fund ................................................................................................ 35 Fire Protection District ................................................................................... 36 Flood Control District .................................................................................... 37 LA County Library ......................................................................................... 38 Regional Park and Open Space District ....................................................... 39 Mental Health Services Act ........................................................................... 40
Statement of Net Position – Proprietary Funds ........................................................ 42 Statement of Revenues, Expenses and Changes in Net Position –
Proprietary Funds .................................................................................................. 44 Statement of Cash Flows – Proprietary Funds ......................................................... 46 Statement of Fiduciary Net Position – Fiduciary Funds ............................................ 50 Statement of Changes in Fiduciary Net Position – Fiduciary Funds ......................... 51 Statement of Net Position – Discretely Presented Component Units ....................... 52 Statement of Activities – Discretely Presented Component Units ............................ 53
Notes to the Basic Financial Statements ......................................................................... 55 Required Supplementary Information – Unaudited:
Schedule of the County’s Proportionate Share of the Net Pension Liability and Related Ratios – Last Ten Fiscal Years ....................................................... 158
Schedule of County’s Pension Contributions - Last Ten Fiscal Years ....................... 158 Schedule of the County’s Proportionate Share of the Net RHC OPEB Liability –
Last Ten Fiscal years .......................................................................................... 160 Schedule of County’s RHC OPEB Contributions - Last Ten Fiscal Years ................. 160 Schedule of Changes in the Total LTD OPEB Liability and Related Ratios –
Last Ten Fiscal Years ......................................................................................... 162
Single Audit:
Schedule of Expenditures of Federal Awards .................................................................. 165 Notes to Schedule of Expenditures of Federal Awards .................................................... 175 Independent Auditor’s Report on Internal Control Over Financial Reporting
and on Compliance and Other Matters Based on an Audit of Financial

COUNTY OF LOS ANGELES BASIC FINANCIAL STATEMENTS AND SINGLE AUDIT REPORTS
FOR THE YEAR ENDED JUNE 30, 2019
Statements Performed in Accordance With Government Auditing Standards ........... 179 Independent Auditor’s Report on Compliance for Each Major Federal Program
and Report on Internal Control Over Compliance Required by the Uniform Guidance .................................................................................................................... 181
Schedule of Findings and Questioned Costs ................................................................... 185 Status of Prior Years’ Findings ......................................................................................... 201
Supplementary Information: Community Services Block Grant Supplementary Schedules of Revenue and
Expenditures .............................................................................................................. 217 Supplementary Schedule of Expenditures of Federal and State Awards Granted
by California Department of Aging ............................................................................. 222

www.mgocpa.com
Macias Gini & O’Connell LLP 700 South Flower St., Suite 800 Los Angeles, CA 90017
1
Independent Auditor’s Report
The Honorable Board of Supervisors County of Los Angeles, California
Report on the Financial Statements
We have audited the accompanying financial statements of the governmental activities, the business-type activities, the aggregate discretely presented component units, each major fund, and the aggregate remaining fund information of the County of Los Angeles, California (County), as of and for the year ended June 30, 2019, and the related notes to the financial statements, which collectively comprise the County’s basic financial statements as listed in the table of contents.
Management’s Responsibility for the Financial Statements
Management is responsible for the preparation and fair presentation of these financial statements in accordance with accounting principles generally accepted in the United States of America; this includes the design, implementation, and maintenance of internal control relevant to the preparation and fair presentation of financial statements that are free from material misstatement, whether due to fraud or error.
Auditor’s Responsibility
Our responsibility is to express opinions on these financial statements based on our audit. We did not audit the financial statements of the Los Angeles County Development Authority (LACDA) (discretely presented component unit), the Los Angeles County Children and Families First – Proposition 10 Commission (First 5 LA) (discretely presented component unit) and the Los Angeles County Employees Retirement Association (LACERA), which represent the following percentages of the assets, net position/fund balances, and revenues/additions of the following opinion units.
Opinion Unit Assets
Net Position/ Fund
Balances Revenues/Additions Aggregate discretely presented component units
100% 100% 100%
Aggregate remaining fund information
70% 73% 11%
Those statements were audited by other auditors whose reports have been furnished to us, and our opinion, insofar as it relates to the amounts included for LACDA, First 5 LA, and LACERA is based solely on the reports of the other auditors. We conducted our audit in accordance with auditing standards generally accepted in the United States of America and the standards applicable to financial audits contained in Government Auditing Standards, issued by the Comptroller General of the United States. Those standards require that we plan and perform the audit to obtain reasonable assurance about whether the financial statements are free from material misstatement.

2
An audit involves performing procedures to obtain audit evidence about the amounts and disclosures in the financial statements. The procedures selected depend on the auditor’s judgment, including the assessment of the risks of material misstatement of the financial statements, whether due to fraud or error. In making those risk assessments, the auditor considers internal control relevant to the entity’s preparation and fair presentation of the financial statements in order to design audit procedures that are appropriate in the circumstances, but not for the purpose of expressing an opinion on the effectiveness of the entity’s internal control. Accordingly, we express no such opinion. An audit also includes evaluating the appropriateness of accounting policies used and the reasonableness of significant accounting estimates made by management, as well as evaluating the overall presentation of the financial statements.
We believe that the audit evidence we have obtained is sufficient and appropriate to provide a basis for our audit opinions.
Opinions
In our opinion, based on our audit and the reports of other auditors, the financial statements referred to above present fairly, in all material respects, the respective financial position of the governmental activities, the business-type activities, the aggregate discretely presented component units, each major fund, and the aggregate remaining fund information of the County of Los Angeles, California, as of June 30, 2019, and the respective changes in financial position and, where applicable, cash flows thereof and the respective budgetary comparison for the General Fund, Fire Protection District, Flood Control District, LA County Library, Regional Park and Open Space District, and Mental Health Services Act for the year then ended in accordance with accounting principles generally accepted in the United States of America.
Other Matters
Required Supplementary Information
Accounting principles generally accepted in the United States of America require that the management’s discussion and analysis, the schedule of the County’s proportionate share of the net pension liability and related ratios, the schedule of County’s pension contributions, the schedule of the County’s proportionate share of the net RHC OPEB liability, the schedule of County’s RHC OPEB contributions and the schedule of changes in the total LTD OPEB liability and related ratios as listed on the table of contents be presented to supplement the basic financial statements. Such information, although not a part of the basic financial statements, is required by the Governmental Accounting Standards Board who considers it to be an essential part of financial reporting for placing the basic financial statements in an appropriate operational, economic, or historical context. We have applied certain limited procedures to the required supplementary information in accordance with auditing standards generally accepted in the United States of America, which consisted of inquiries of management about the methods of preparing the information and comparing the information for consistency with management’s responses to our inquiries, the basic financial statements, and other knowledge we obtained during our audit of the basic financial statements. We do not express an opinion or provide any assurance on the information because the limited procedures do not provide us with sufficient evidence to express an opinion or provide any assurance.

3
Other Information
Our audit was conducted for the purpose of forming opinions on the financial statements that collectively comprise the County’s basic financial statements. The accompanying schedule of expenditures of federal awards, the community services block grant supplementary schedules of revenue and expenditures, and the supplementary schedule of expenditures of federal and state awards granted by California Department of Aging are presented for purposes of additional analysis as required by Title 2 U.S. Code of Federal Regulations Part 200, Uniform Administrative Requirements, Cost Principles, and Audit Requirements for Federal Awards, the California Department of Community Services and Development, and the California Department of Aging, respectively, and are not a required part of the basic financial statements.
Such information is the responsibility of management and was derived from and relates directly to the underlying accounting and other records used to prepare the basic financial statements. Such information has been subjected to the auditing procedures applied in the audit of the basic financial statements and certain additional procedures, including comparing and reconciling such information directly to the underlying accounting and other records used to prepare the basic financial statements or to the basic financial statements themselves, and other additional procedures in accordance with auditing standards generally accepted in the United States of America. In our opinion, the schedule of expenditures of federal awards, the community services block grant supplementary schedules of revenue and expenditures, and the supplementary schedule of expenditures of federal and state awards granted by California Department of Aging are fairly stated, in all material respects, in relation to the basic financial statements as a whole.
Other Reporting Required by Government Auditing Standards
In accordance with Government Auditing Standards, we have also issued our report dated December 13, 2019, on our consideration of the County’s internal control over financial reporting and on our tests of its compliance with certain provisions of laws, regulations, contracts, and grant agreements and other matters. The purpose of that report is solely to describe the scope of our testing of internal control over financial reporting and compliance and the results of that testing, and not to provide an opinion on the effectiveness of the County’s internal control over financial reporting or on compliance. That report is an integral part of an audit performed in accordance with Government Auditing Standards in considering the County’s internal control over financial reporting and compliance.
Los Angeles, California December 13, 2019, except for the last paragraph of Note 22 Subsequent Events and the report on the schedule of expenditures of federal awards, the community services block grant supplementary schedules of revenue and expenditures, and the supplementary schedule of expenditures of federal and state awards granted by California Department of Aging, as to which the date is March 26, 2020

COUNTY OF LOS ANGELESMANAGEMENT’S DISCUSSION AND ANALYSIS (UNAUDITED)
FOR THE YEAR ENDED JUNE 30, 2019
This section of the County’s Comprehensive Annual Financial Report (CAFR) presents a narrative overview and analysis of financial activities for the year ended June 30, 2019. We recommend that this information be used in conjunction with additional information contained in the letter of transmittal.
Financial Highlights
At the end of the current year, the net position (total assets and deferred outflows of resources, reduced by total liabilities and deferred inflows of resources) of the County was negative $13.492 billion. Net position is classified into three categories and the unrestricted component is negative $34.718 billion.
During the current year, the County’s net position increased by $26 million. Net position related to governmental activities increased by $261 million, while net position related to business-type activities decreased by $235 million.
At the end of the current year, the County’s General Fund reported a total fund balance of $4.434 billion. The fund balance categories and amounts consisted of nonspendable fund balance of $312 million, restricted fund balance of $79 million, committed fund balance of $780 million, assigned fund balance of $621 million, and $2.642 billion of unassigned fund balance.
The County’s capital asset balances were $19.743 billion at year-end and increased by $225 million during the year.
During the current year, the County’s total long-term debt increased by $514 million. Newly issued and accreted long-term debt of $942 million was more than the long-term debt maturities of $428 million.
Overview of the Basic Financial Statements
This discussion and analysis are intended to serve as an introduction to the County’s basic financial statements, which are comprised of the following three components:
• Government-wide financial statements• Fund financial statements• Notes to the basic financial statements
This report also includes other supplementary information in addition to the basic financial statements.
4

COUNTY OF LOS ANGELESMANAGEMENT’S DISCUSSION AND ANALYSIS (UNAUDITED)-Continued
FOR THE YEAR ENDED JUNE 30, 2019
GOVERNMENT-WIDE FINANCIAL STATEMENTS
The government-wide financial statements are designed to provide readers with a broad overview of the County’s finances, in a manner similar to a private-sector business.
The Statement of Net Position presents information on all County assets and deferred outflows of resources reduced by liabilities and deferred inflows of resources, which represent net position. Over time, increases and decreases in net position may serve as an indicator of whether the financial position of the County is improving or deteriorating.
The Statement of Activities presents information that indicates how the County’s net position changed during the fiscal year. All changes in net position are reported as soon as the underlying events giving rise to the changes occur, regardless of the timing of related cash flows. Therefore, revenues and expenses are reported in these statements for some items that affect cash flows in future periods. For example, property tax revenues have been recorded that have been earned but not yet collected and pension and Other Postemployment Benefits (OPEB) expenses have been accrued but not yet paid.
The government-wide financial statements report the following different types of programs or activities:
• Governmental Activities - The majority of County services are reported under this category. Taxesand intergovernmental revenues are the major revenue sources that fund these activities, whichinclude general government, public protection, public ways and facilities, health and sanitation, publicassistance, education, recreation and cultural services, and interest on long-term debt.
• Business-type Activities - County services that are intended to recover costs through user chargesand fees are reported under this category. The County Hospitals, the Waterworks Districts, and theAviation Funds represent the County’s business activities.
• Discretely Presented Component Units - Component units are separate entities for which the Countyis financially accountable. The Los Angeles County Development Authority (formerly referred to asthe "Community Development Commission") and First 5 LA are displayed as discretely presentedin the financial statements.
5

COUNTY OF LOS ANGELESMANAGEMENT’S DISCUSSION AND ANALYSIS (UNAUDITED)-Continued
FOR THE YEAR ENDED JUNE 30, 2019
FUND FINANCIAL STATEMENTS
The fund financial statements contain information regarding major individual funds. A fund is a fiscal and accounting entity with a balanced set of accounts. The County uses separate funds to ensure compliance with fiscal and legal requirements.
The County’s funds are classified into the following three categories:
• Governmental Funds - These funds are used to account for essentially the same services that werepreviously described as governmental activities above. However, the fund financial statements focuson near-term inflows and outflows of spendable resources, as well as on balances of spendableresources available at the end of the fiscal year. Such information may be useful in evaluating theCounty’s near-term financing requirements. Because the focus of governmental funds is narrowerthan that of the government-wide financial statements, it is useful to compare the informationpresented for governmental funds with similar information presented for governmental activities inthe government-wide financial statements. By doing so, readers may better understand the long-term impact of the government’s near-term financing decisions. Both the governmental funds balancesheet and the governmental funds statement of revenues, expenditures and changes in fund balancesprovide a reconciliation to facilitate this comparison between governmental funds and governmentalactivities. Governmental funds include the General Fund, as well as Special Revenue Funds, DebtService Funds, Capital Projects Funds, and Permanent Funds.
• Proprietary Funds - These funds are used to account for functions that are classified as “business-type activities” in the government-wide financial statements. The County’s Internal Service Fundsare also reported within the proprietary fund section. The County’s four Hospital Funds andWaterworks Funds are all considered major funds for presentation purposes. There is one nonmajorenterprise fund (Aviation Funds) and it is displayed with the other major enterprise funds.
• Fiduciary Funds - These funds are used to report assets held in a trustee or agency capacity forothers and cannot be used to support the County’s programs. The Pension and OtherPostemployment Benefit Trust Funds, the Investment Trust Funds, and Agency Funds are reportedin this fund category, using the accrual basis of accounting.
NOTES TO THE BASIC FINANCIAL STATEMENTS
The notes to the basic financial statements provide additional information that is essential to a full understanding of the data provided in the government-wide and the fund financial statements.
6

COUNTY OF LOS ANGELESMANAGEMENT’S DISCUSSION AND ANALYSIS (UNAUDITED)-Continued
FOR THE YEAR ENDED JUNE 30, 2019
REQUIRED SUPPLEMENTARY INFORMATION
In addition to the basic financial statements and accompanying notes, this report presents certain required supplementary information concerning the County’s proportionate share of the net pension liability and related ratios, the County’s contributions to pension benefits, the County's proportionate share of the net Retiree Healthcare OPEB Liability, the County's contributions to OPEB, and the schedule of changes in the total Long-Term Disability OPEB liability and related ratios.
Government-wide Financial Analysis
As noted earlier, net position may serve over time as a useful indicator of a government’s financial position. In the case of the County, liabilities and deferred inflows of resources exceeded assets and deferred outflows of resources by $13.492 billion at the close of the most recent fiscal year.
Summary of Net PositionAs of June 30, 2019 and 2018 (in thousands)
GovernmentalActivities
Business-typeActivities Total
2019 2018 2019 2018 2019 2018
Current and other assets $ 12,857,626 $ 11,472,818 $ 2,638,388 $ 2,629,318 $ 15,496,014 $ 14,102,136Capital assets 16,676,242 16,271,623 3,067,230 3,247,254 19,743,472 19,518,877
Total assets 29,533,868 27,744,441 5,705,618 5,876,572 35,239,486 33,621,013Deferred outflows of
resources 4,991,057 4,387,213 833,848 793,005 5,824,905 5,180,218Current and other
liabilities 3,414,482 3,139,671 643,334 553,750 4,057,816 3,693,421Long-term liabilities 36,141,322 37,194,272 8,039,108 8,549,718 44,180,430 45,743,990
Total liabilities 39,555,804 40,333,943 8,682,442 9,103,468 48,238,246 49,437,411Deferred inflows of
resources 5,357,831 2,447,435 960,494 434,369 6,318,325 2,881,804
Net position:
Net investment incapital assets 15,166,340 14,984,847 2,109,416 2,320,256 17,275,756 17,305,103Restricted 3,811,405 3,524,215 138,686 134,647 3,950,091 3,658,862Unrestricted (deficit) (29,366,455) (29,158,786) (5,351,572) (5,323,163) (34,718,027) (34,481,949)
Total net position $ (10,388,710) $ (10,649,724) $ (3,103,470) $ (2,868,260) $ (13,492,180) $ (13,517,984)
7

COUNTY OF LOS ANGELESMANAGEMENT’S DISCUSSION AND ANALYSIS (UNAUDITED)-Continued
FOR THE YEAR ENDED JUNE 30, 2019
Significant changes in assets, deferred outflows of resources, liabilities, and deferred inflows of resources included the following:
Current and Other Assets
Current and other assets increased by $1.385 billion for governmental activities and by $9 million for business-type activities. For governmental activities, there was an increase of $276 million in Other investments, largely due to the unspent bonds proceeds held by the Public Buildings outside trustee, over the prior year. Other receivables increased by $529 million, as the Other receivables for the County's General Fund were higher by $496 million from the prior year. On July 1, 2018, the County restructured the ambulatory care services previously provided by the County hospitals and increased the receivables related to ambulatory care services by $374 million. In addition, the public social services program receivables increased by $112 million due to higher year-end revenue accruals . Changes from Internal balances of $505 million had the effect of increasing assets for governmental activities and reducing assets for business-type activities by like amounts. This change was primarily associated with a $507 million increase in cash flow advances from governmental activities (the County's General Fund) to the business-type activities (the County's Hospitals).
For business-type activities, current and other assets increased by $9 million. The business-type activities accounts receivable and other receivables were higher by $202 million and $313 million, respectively, over the prior year. The increases were primarily attributable to higher receivables associated with the Quality Incentive Program (QIP) and Enhanced Payment Program (EPP) at the hospitals. This was offset by the change from the Internal balances of $507 million, as mentioned above.
Deferred Outflows of Resources
In the current year, the County's deferred outflows of resources balances were $5.825 billion. The deferred outflows of resources were $4.991 billion and $834 million for governmental and business-type activities, respectively. The total deferred outflows of resources amounts and net increases of $645 million were mostly related to pension and OPEB. The total OPEB related deferred outflows increased by $530 million and $33 million for governmental and business-type activities, respectively, from the prior year. The total pension related deferred outflows increased by $75 million and $7 million for governmental and business-type activities, respectively, from the prior year. These amounts vary from year to year due to differences between projected and actual experience, assumption changes and changes in proportion, as required by GASB 68 and GASB 75.
Liabilities
Current and other liabilities increased by $275 million for governmental activities. There was an increase of $114 million in accounts payable for amounts owed for the year-end expenditure accruals. In addition, advances payable increased by $81 million, largely due to higher advances for health, mental health, public protection and social services programs. Accrued payroll was higher by $25 million due to increases in amounts owed for the year-end payroll accruals. For business-type activities, a net increase of $90 millionin current and other liabilities was largely associated with increases in accounts payable for the hospitals.
8

COUNTY OF LOS ANGELESMANAGEMENT’S DISCUSSION AND ANALYSIS (UNAUDITED)-Continued
FOR THE YEAR ENDED JUNE 30, 2019
Liabilities-Continued
Long-term liabilities decreased by $1.053 billion for governmental activities and by $511 million for business-type activities. Net OPEB liabilities significantly decreased by $1.371 billion for governmental and $312 million for business-type activities, respectively. The decrease in the Net OPEB liability was a result of an increase to the discount rate resulting from the prefunding of the OPEB liability. Net pension liabilities decreased in the current year by $443 million and $61 million for governmental and business-type activities, respectively, which was due to the investment earnings being higher than the actuarial assumptions. For governmental activities, liabilities for bonds payable, notes, loans, workers’ compensation and compensated absences were higher by $687 million. For business-type activities, amounts owed to third party payors by the County's hospitals were lower by $184 million as discussed in Note 14. Specific disclosures related to pension liabilities, OPEB liabilities, and other changes in long-term liabilities are discussed and referenced in Notes 8, 9, and 11 to the basic financial statements, respectively.
Deferred Inflows of Resources
In the current year, the County's deferred inflows of resources were $6.318 billion. Deferred inflows of resources increased by $2.910 billion and $526 million for governmental and business-type activities, respectively. The increase in deferred inflows of resources of $3.436 billion was mostly related to OPEB. The OPEB and pension changes in deferred inflows of resources will vary from year to year due to differences between projected and actual experience, assumption changes and changes in proportion. The total OPEB related deferred inflows increased by $2.593 billion and $484 million for governmental and business-type activities, respectively, from the prior year. Pension related deferred inflows of resources increased by $322 million and $43 million for governmental and business-type activities, respectively. Pension and OPEB matters are discussed in more detail in Note 8 and 9, respectively, to the basic financial statements.
For service concession arrangements, there were also $83 million of deferred inflows of resources recognized in the current year, which represents a decrease of $4 million from the prior year. This amount represents the present value of installment payments associated with private operators of twenty County golf courses, as discussed in Note 7 to the basic financial statements.
The County’s total net position consists of the following three components:
Net Investment in Capital Assets
The largest portion of the County’s net position, $17.276 billion, represents its investment in capital assets (i.e., land, buildings and improvements, infrastructure, software and equipment, net of related depreciation), less any related debt and related deferred outflows of resources used to acquire those assets that is still outstanding. The County uses these capital assets to provide services to citizens; consequently, these assets are not available for future spending. Although the County’s investment in its capital assets is reported net of related debt, it should be noted that the resources needed to repay this debt must be provided from other sources, since the capital assets themselves cannot be used to liquidate these liabilities.
Restricted Net Position
The County’s restricted net position at year-end was $3.950 billion. Asset restrictions are primarily due to external restrictions imposed by State legislation and bond covenants. Net position that pertains to the various separate legal entities included in the basic financial statements is also generally restricted because the entities’ funding sources require that funds be used for specific purposes.
9

COUNTY OF LOS ANGELESMANAGEMENT’S DISCUSSION AND ANALYSIS (UNAUDITED)-Continued
FOR THE YEAR ENDED JUNE 30, 2019
Unrestricted Net Position (Deficit)
The County’s total unrestricted net position is negative $34.718 billion. Both governmental and business-type activities reported deficits in this category of $29.366 billion and $5.352 billion, respectively. OPEB related liabilities of $24.639 billion, along with pension liabilities totaling $10.345 billion, continued to be the most significant factors associated with the reported deficits.
The following table details and identifies changes in net position for governmental and business-type activities:
Summary of Changes in Net Position For the Years Ended June 30, 2019 and 2018
(in thousands)
GovernmentalActivities
Business-typeActivities Total
2019 2018 2019 2018 2019 2018
Revenues:
Program revenues:Charges for services $ 3,680,145 $ 2,861,290 $ 3,526,524 $ 4,155,049 $ 7,206,669 $ 7,016,339Operating grants and contributions 10,719,454 10,263,315 488,087 651,303 11,207,541 10,914,618Capital grants and contributions 72,955 26,310 3,850 8,291 76,805 34,601
General revenues:Taxes 8,184,940 7,475,813 6,504 6,013 8,191,444 7,481,826Unrestricted grants and
contributions 473,800 433,799 32 473,832 433,799Investment earnings 380,361 101,730 6,600 675 386,961 102,405Miscellaneous 269,931 149,384 36 110 269,967 149,494
Total revenues 23,781,586 21,311,641 4,031,633 4,821,441 27,813,219 26,133,082
Expenses:General government 1,660,335 1,579,367 1,660,335 1,579,367Public protection 7,772,364 7,841,468 7,772,364 7,841,468Public ways and facilities 453,758 415,805 453,758 415,805Health and sanitation 5,433,924 4,307,099 5,433,924 4,307,099Public assistance 6,922,346 6,693,008 6,922,346 6,693,008Education 161,012 160,097 161,012 160,097Recreation and cultural services 320,838 487,173 320,838 487,173Interest on long-term debt 124,549 106,425 124,549 106,425Hospitals 4,827,429 5,370,965 4,827,429 5,370,965Waterworks 104,906 95,301 104,906 95,301Aviation 5,954 11,148 5,954 11,148
Total expenses 22,849,126 21,590,442 4,938,289 5,477,414 27,787,415 27,067,856
Excess (deficiency) before transfers 932,460 (278,801) (906,656) (655,973) 25,804 (934,774)Transfers (671,446) (747,863) 671,446 747,863Change in net position 261,014 (1,026,664) (235,210) 91,890 25,804 (934,774)
Net position - beginning (10,649,724) (9,623,060) (2,868,260) (2,960,150) (13,517,984) (12,583,210)
Net position - ending $ (10,388,710) $ (10,649,724) $ (3,103,470) $ (2,868,260) $ (13,492,180) $ (13,517,984)
10

COUNTY OF LOS ANGELES MANAGEMENT’S DISCUSSION AND ANALYSIS (UNAUDITED)-Continued
Operating grants and contributions41%
Unrestricted grants and contributions2%Other
3%
Charges for services25%
Taxes29%
Other4%
Public assistance25%
Hospitals17%
Health and sanitation 20%
General government 6%
Public protection 28%
REVENUES BY SOURCE – ALL ACTIVITIES FOR THE YEAR ENDED JUNE 30, 2019
EXPENSES BY TYPE – ALL ACTIVITIES FOR THE YEAR ENDED JUNE 30, 2019
11

COUNTY OF LOS ANGELESMANAGEMENT’S DISCUSSION AND ANALYSIS (UNAUDITED)-Continued
FOR THE YEAR ENDED JUNE 30, 2019
Governmental Activities
Revenues from governmental activities increased by $2.470 billion (11.6%) when compared with the prior year. The most significant changes in specific revenue sources were experienced in the following areas:
• Program revenues recognized from charges for services increased by $819 million. The increasewas primarily attributable to charges for services for health and sanitation programs which grew by$844 million. As previously discussed, the County restructured the ambulatory care servicespreviously provided by the County hospitals and shifted the revenues from charges for services of$605 million to the governmental activities. The ambulatory care services were restructured toprovide better management oversight and operational efficiencies. Also, the Global PaymentProgram (GPP) revenue increased by $119 million from the prior year for health services programsin the General Fund.
• Taxes, the County's largest general revenue source, were $709 million higher than the prior yearand were mostly attributable to an increase in property taxes and sales and use tax, which grew by$481 million and $151 million, respectively. The County's total taxable assessed property tax valueis $1.530 trillion, which grew by 6.6% in the current year. Property tax revenues were also recognizedin conjunction with the dissolution of redevelopment agencies. “Pass through” payments fromredevelopment dissolution were $136 million and increased by $27 million from the prior year.Redevelopment dissolution also provides residual property taxes to local governments, includingthe County. The County's share of such residual tax revenues in the current year was $290 million,an increase of $51 million compared to the prior year. Revenues also grew by $142 million from theHomeless and Housing Measure H program sales and use taxes.
• Program revenues recognized from operating grants and contributions increased by $456 million.Revenues for public assistance programs grew by $188 million as there were higher levels ofadministrative and program costs which are primarily funded from federal and State reimbursement.For health and sanitation programs, there was net revenue growth of $149 million. Health servicesprogram administration revenue of $100 million was primarily associated with revenues from theWhole Person Care (WPC) program. State and federal funding for public health programs grew by$54 million. Pursuant to Assembly Bill 85 (AB85), the County is subject to State withholding ofrevenues known as "1991 County Health Realignment Funds." The amounts withheld are basedon an assumption that County healthcare costs for the indigent population will decrease. The fundswill be reconciled and trued-up two years after the fiscal year in which the amounts were withheld.For the current year, there was a net decrease of $71 million from the State Health Realignmentrevenues for health services from the true-ups. Revenues for public ways and facilities grew by$70 million primarily related to road projects funded from an increase in the State Road Repair andAccountability Act of 2017 (SB 1).
Expenses related to governmental activities increased by $1.259 billion (5.8%) during the current year. The most significant increase was in the area of health and sanitation expenses, where expenses increased by $1.127 billion. As previously mentioned above, $447 million of expenses from the ambulatory care services program were shifted to the governmental activities. Health services programs and mental health program expenses were higher by $162 million and $138 million, respectively, as operating and healthcare costs increased from the prior year. Public assistance expenses were higher by $229 million primarily from increased costs of $187 million for the Measure H homeless and housing assistance programs. Recreation expenses were lower by $166 million. The decrease was associated with the capital assets adjustment that was made in the prior year. Depreciation expense was $448 million in the current year, an increase of $26 million from the prior year amount of $422 million.
12

COUNTY OF LOS ANGELESMANAGEMENT’S DISCUSSION AND ANALYSIS (UNAUDITED)-Continued
FOR THE YEAR ENDED JUNE 30, 2019
Business-type Activities
Revenues from business-type activities for the current year were $4.032 billion, a decrease of $790 million (16.4%) from the previous year. The most significant decrease was in charges for services and operating grants and contributions for the County's hospitals, where revenue declined by $627 million and $162 million, respectively. As previously stated, the County restructured the ambulatory care services and it reduced the County hospitals charges for services by $605 million and operating grants and contributions revenue by $31 million and shifted the revenue to the governmental activities. As discussed in Note 14 to the basic financial statements, County hospital revenues are derived from a wide range of federal and State funding sources. GPP and PRIME are components of the Medi-Cal Demonstration Project 2020, which provides federal funding to the County for health-care programs that shift the focus from hospital-based and inpatient care to outpatient, primary, and preventative care. QIP represents a new pay structure based on performance achieved on a set of clinically-established quality measures for Medi-Cal managed care enrollees.
Expenses related to business-type activities decreased from the previous year by a net total of $539 million(9.8%), and were associated primarily with the County’s hospitals, where expenses declined by $544 million. Specifically, as previously stated, the County restructured the ambulatory care services and reduced the hospital expenses by $447 million and shifted the expenses to the governmental activities under health and sanitation. OPEB and Pension expenses were lower by $88 million and $46 million, respectively. For all hospital facilities, the average daily inpatient census during the current year was 1,110 patients, which was slightly lower than the 1,113 patients for the prior year.
Financial Analysis of the County’s Funds
As noted earlier, the County uses fund accounting to ensure and demonstrate compliance with finance-related legal requirements.
Governmental Funds
The focus of the County’s governmental funds is to provide information on near-term inflows, outflows, and balances of resources that are available for spending. Such information is useful in assessing the County’s financing requirements. Types of governmental funds reported by the County include the General Fund, Special Revenue Funds, Debt Service Funds, Capital Projects Funds, and the Permanent Funds.
As of the end of the current fiscal year, the County’s governmental funds reported combined total fund balances of $8.779 billion, an increase of $916 million in comparison with the prior year. Of the total fund balances, $328 million is nonspendable to indicate the extent that funds are not in spendable form or are required to remain intact. An additional $4.054 billion is classified as restricted, $908 million as committed, and $847 million as assigned. The remaining balance of $2.642 billion is classified as unassigned and is entirely associated with the General Fund.
Revenues from all governmental funds for the current year were $23.511 billion, an increase of $2.319 billion (10.9%) from the previous year. Expenditures for all governmental funds in the current year were $22.326 billion, an increase of $2.185 billion (10.8%) from the previous year. In addition, other financing uses were $269 million, a decrease of $378 million (58.4%) as compared to $647 million in the prior year.
13
COUNTY OF LOS ANGELESMANAGEMENT’S DISCUSSION AND ANALYSIS (UNAUDITED)-Continued
FOR THE YEAR ENDED JUNE 30, 2019
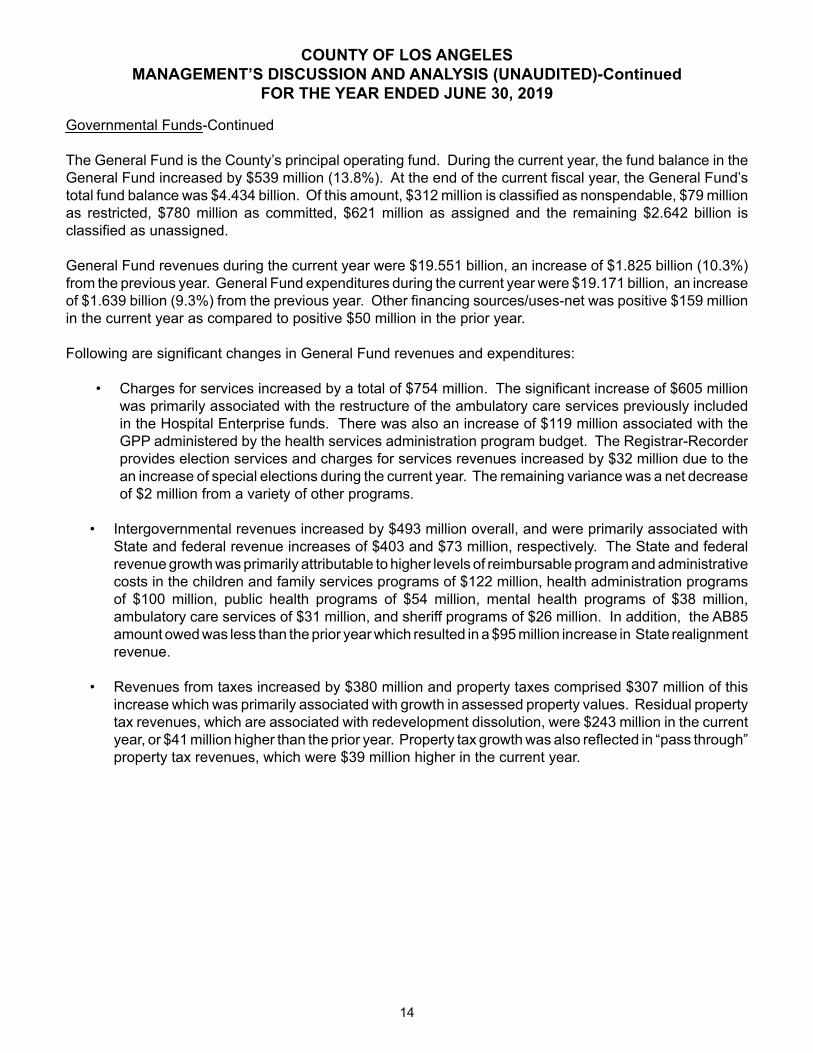
Governmental Funds-Continued
The General Fund is the County’s principal operating fund. During the current year, the fund balance in the General Fund increased by $539 million (13.8%). At the end of the current fiscal year, the General Fund’s total fund balance was $4.434 billion. Of this amount, $312 million is classified as nonspendable, $79 millionas restricted, $780 million as committed, $621 million as assigned and the remaining $2.642 billion is classified as unassigned.
General Fund revenues during the current year were $19.551 billion, an increase of $1.825 billion (10.3%) from the previous year. General Fund expenditures during the current year were $19.171 billion, an increaseof $1.639 billion (9.3%) from the previous year. Other financing sources/uses-net was positive $159 million in the current year as compared to positive $50 million in the prior year.
Following are significant changes in General Fund revenues and expenditures:
• Charges for services increased by a total of $754 million. The significant increase of $605 millionwas primarily associated with the restructure of the ambulatory care services previously includedin the Hospital Enterprise funds. There was also an increase of $119 million associated with theGPP administered by the health services administration program budget. The Registrar-Recorderprovides election services and charges for services revenues increased by $32 million due to thean increase of special elections during the current year. The remaining variance was a net decreaseof $2 million from a variety of other programs.
• Intergovernmental revenues increased by $493 million overall, and were primarily associated withState and federal revenue increases of $403 and $73 million, respectively. The State and federalrevenue growth was primarily attributable to higher levels of reimbursable program and administrativecosts in the children and family services programs of $122 million, health administration programsof $100 million, public health programs of $54 million, mental health programs of $38 million,ambulatory care services of $31 million, and sheriff programs of $26 million. In addition, the AB85amount owed was less than the prior year which resulted in a $95 million increase in State realignmentrevenue.
• Revenues from taxes increased by $380 million and property taxes comprised $307 million of thisincrease which was primarily associated with growth in assessed property values. Residual propertytax revenues, which are associated with redevelopment dissolution, were $243 million in the currentyear, or $41 million higher than the prior year. Property tax growth was also reflected in “pass through”property tax revenues, which were $39 million higher in the current year.
14

COUNTY OF LOS ANGELESMANAGEMENT’S DISCUSSION AND ANALYSIS (UNAUDITED)-Continued
FOR THE YEAR ENDED JUNE 30, 2019
Governmental Funds-Continued
• General fund expenditures increased by a total of $1.639 billion, or 9.3%. Current expendituresincreased by $1.639 billion, and debt service and capital outlay expenditures remained the same.The most significant increase in current expenditures was reflected in the health and sanitationprograms, where expenditures grew by $1.069 billion. This was primarily due to an increase of $447million for ambulatory care services and for mental health services. In addition, an increase of $162million was from programs administered for health community programs and $61 million for publichealth programs. Public protection program costs were higher by $276 million, of which $227 million,and $19 million were associated with the departments of Sheriff and District Attorney, respectively,and $30 million was for the Diversion and Reentry program. Public assistance expenditures werehigher by $241 million, of which $153 million was for salary and benefit increases and $81 millionwas for increased spending on public assistance payments, children and family assistance paymentsand the affordable housing program. General government spending increased by $31 million andwas associated with an increase of $24 million for costs associated with capital improvements.
The Fire Protection District reported a year-end fund balance of $147 million, which represented a decreaseof $29 million in fund balance compared to the previous year decrease of $30 million, resulting in a net difference of $ 1 million. The Fire Protection District responds to a number of major incidents and emergencies during the fiscal year. Revenues increased by $32 million, of which $49 million was related to property taxes and primarily associated with growth in assessed property values and was offset by a decline in a variety of other revenues. Expenditures were higher by $31 million, of which $53 million was related to an increase in salaries and employee benefit costs and was offset by decreases of $13 million and $8 million in services and supplies and capital asset equipment costs, respectively.
The Flood Control District reported a year-end fund balance of $488 million, which represented a decrease of $15 million in fund balance compared to the previous year increase of $33 million, resulting in a net difference of $48 million. The change in fund balance was primarily due to higher expenditures by $93 million for infrastructure improvement projects to support flood protection and water conservation. This was offset by revenues that increased by $51 million, primarily from property taxes and charges for services.
The LA County Library Fund reported a year-end fund balance of $88 million, which represented an increase of $10 million in fund balance compared to the previous year increase of $3 million, resulting in a net difference of $7 million. The increase in the change in fund balance was primarily attributable to higher property tax revenues of $6 million from the prior year. Overall, revenue was higher by $8 million and expenditures were higher by $2 million.
The Regional Park and Open Space District reported a year-end fund balance of $404 million, which represented an increase of $84 million in fund balance compared to the previous year increase of $42 million, resulting in a net difference of $42 million. The increase in the change of fund balance was primarily attributable to higher property tax revenue of $91 million from the the Safe, Clean Neighborhood Parks, Open Space, Beaches, Rivers Protection, and Water Conservation Measure A (Measure A). Measure A levied 1.5 cents annually per square foot of improved property. Overall, current year revenues were higherby $17 million and expenditures were lower by $25 million.
15

COUNTY OF LOS ANGELESMANAGEMENT’S DISCUSSION AND ANALYSIS (UNAUDITED)-Continued
FOR THE YEAR ENDED JUNE 30, 2019
Governmental Funds-Continued
The Mental Health Services Act (MHSA) Special Revenue Fund reported a year-end fund balance of $938 million, which represented a decrease of $112 million in fund balance compared to no change in fund balance from the previous year. Current year revenues were higher by $26 million, primarily from an increase in State revenues, while transfers out were higher by $125 million from an increase in mental health expenditures in the General Fund. Expenditures increased by $13 million primarily to fund affordable housing projects for mental health clients.
Proprietary Funds
The County’s proprietary funds provide the same type of information found in the government-wide financial statements, but in more detail. The County’s principal proprietary funds consist of four hospital enterprise funds and each one is reported as a major fund. All of the aforementioned funds incurred a net loss prior to contributions and transfers.
The County is legally required to provide local matching funds to the health care system in order to remain eligible for federal and State assistance. Such funds were provided to the hospitals as operating subsidies from the County General Fund during the year as discussed in Note 15 to the basic financial statements. The amount of subsidy, per facility, ranged from $8 million for Olive View-UCLA Medical Center to $462 million for the LAC+USC Medical Center. The total subsidy amount was $632 million and is reflected in the Statement of Revenues, Expenses and Changes in Fund Net Position as “transfers in.” By comparison, the total General Fund subsidy in the prior year was $530 million. During the current year, the County’s hospital operations experienced higher levels of patient care revenues and operating expenses in comparison to the prior year as previously discussed.
An additional source of local funding for the Hospitals is the Health Services Measure B Special Revenue Fund (Measure B Fund). The Measure B Fund receives voter approved property taxes for trauma and emergency services. In the current year, the Measure B Fund provided transfers to the LAC+USC Medical Center ($122 million), Harbor-UCLA Medical Center ($50 million), and Olive-View UCLA Medical Center ($45 million). The total current year amount of $217 million in Measure B transfers was slightly higher by $8 million from the prior year amount of $209 million.
Waterworks Funds reported year-end net position of $790 million, which was $10 million lower than the previous year due to higher operating expenses. There were no significant operational changes during the current year. Current year operating revenues for charges for services were lower by $1 million, operating expenses were higher by $10 million, and nonoperating revenue/(expenses) were higher by $2 million.
General Fund Budgetary Highlights
The accompanying basic financial statements include a Statement of Revenues, Expenditures, and Changes in Fund Balance - Budget and Actual on Budgetary Basis for the County’s General Fund. The County’s budgetary basis of accounting is discussed in Notes 1 and 16 to the basic financial statements. There are approximately 180 separate budget units within the General Fund, excluding capital improvement projects, which are individually budgeted. The data presented below represents the net budgetary changes for the General Fund in a highly summarized format. Accordingly, in certain instances, budgets have been increased for programs within a category even though actual amounts have not been realized for the category in its entirety. Under the budgetary basis, there was a net increase of $161 million in the General Fund’s available (unassigned) fund balance from the previous year.
16

COUNTY OF LOS ANGELESMANAGEMENT’S DISCUSSION AND ANALYSIS (UNAUDITED)-Continued
FOR THE YEAR ENDED JUNE 30, 2019
Budgetary Summary - Revenues/Financing Sources
Following is a summary of current year budgetary changes and actual results (on the County’s budgetary basis) for General Fund revenues and other financing sources (in thousands):
Category
Increase (Decrease)
From OriginalBudget
Final BudgetAmount
ActualAmount
Variance-Positive
(Negative)Taxes $ 72,204 $ 5,978,608 $ 6,042,289 $ 63,681Intergovernmental
revenues 40,634 11,135,583 10,175,360 (960,223)Charges for services 48,128 2,727,854 2,508,796 (219,058)All other revenues 25,771 615,003 707,628 92,625Other sources and
transfers in 28,626 1,176,661 974,329 (202,332)Total $ 215,363 $ 21,633,709 $ 20,408,402 $ (1,225,307)
Changes from Amounts Originally Budgeted
During the year, net increases in budgeted revenues and other financing sources were approximately $215 million. The most significant changes occurred in the following areas:
• The budget for tax revenues increased by $72 million. Of this increase, $60 million was associatedwith year-end budgetary changes that are designed to demonstrate compliance with legal provisionsrelated to the appropriation of revenues from property taxes and certain other tax related revenues.
• The estimated revenue for "Charge for Services" increased by $48 million. The increase is primarilyfrom revenue associated with the new Voter Solutions for All People (VSAP) election system of $22million. Also, there was in increase of $12 million in health care administration programs and $7million in the Sheriff contract cities revenue. There were other net budget increases in charges forservices of $7 million.
• Estimated intergovernmental revenues increased by $41 million. The social service and child andfamily programs increased the estimated State and federal revenues by $49 million. Net additionsof $31 million were made to augment federal funds budgeted for the GPP and WPC program pursuantto the Medi-Cal 2020 Federal Waiver program in the health department. Budgeted intergovernmentalrevenues for capital projects were increased by $25 million to reflect additional grant funding. Also,an increase of $15 million was made to budgeted intergovernmental revenues associated withredevelopment dissolution successor agencies. The decrease is primarily attributable to thereduction of State Health Realignment estimated revenues of $85 million. There were other netincreases to budgeted intergovernmental revenues of $6 million.
• The budget for "other sources and transfers in" increased by $29 million. Budgeted transfers in forcapital projects were increased by $20 million from the nonmajor special revenue funds. MentalHealth programs funded by the Mental Health Services Act Special Revenue Fund were increasedby $4 million. There were net increases to budgeted "other sources and transfers in" of $5 million.
17

COUNTY OF LOS ANGELESMANAGEMENT’S DISCUSSION AND ANALYSIS (UNAUDITED)-Continued
FOR THE YEAR ENDED JUNE 30, 2019
Changes from Amounts Originally Budgeted-Continued
• The budgeted "all other revenues" increased by $26 million. Budgeted revenues were increasedby $15 million for tobacco settlement revenues. The remaining increases of $11 million wereassociated with a wide variety of revenues.
Actual Revenues/Financing Sources Compared with Final Budget Amounts
Actual revenues and other financing sources recognized by the General Fund were approximately $20.408 billion. This amount was $1.225 billion, or 5.7%, lower than budget. As discussed below, most of this variance was concentrated in the areas of intergovernmental revenues, charges for services, and "other sources and transfers in."
• Actual intergovernmental revenues were $960 million lower than the amount budgeted.Approximately $344 million was associated with social services and child and family programs, wherereimbursable costs were lower than anticipated due to delays in hiring and promoting staff, reducedcontractual spending for services and child care provider payments, and delays in implementing newsystems. Mental health programs accounted for approximately $244 million of this variance, whichexperienced lower than anticipated reimbursable costs and correspondingly lower than expectedrevenues. Budgeted intergovernmental revenues of $230 million were not realized for various capitalimprovements, disaster recovery programs and emergency preparedness projects, as theseinitiatives were not completed prior to year-end. Public health related programs experiencedbudgeted revenue shortfalls of $154 million, most of which was associated with federal and Stategrants and offset by a comparable amount of cost savings. The remaining difference of $12 millionwas related to a variety of other programs.
• Actual charges for services were $219 million lower than the amount budgeted. The decrease wasprimarily attributable to revenues associated with the GPP and services rendered to the Countyhospitals of $89 million. Net reductions include costs associated with public health programs whichexperienced lower than anticipated reimbursable costs and correspondingly lower than expectedrevenues of $83 million. Approximately $34 million was associated with the Internal ServicesDepartment (ISD), which experienced lower that reimbursable expenditures. There were netdecreases of $13 million related to a variety of other programs.
• The actual amount of “other sources and transfers in” was $202 million lower than the amountbudgeted. Of this amount, mental health programs funded by the Mental Health Services Act SpecialRevenue Fund did not fully materialize at the budgeted level and “transfers in” were $122 millionlower than budgeted. In addition, “transfers in” totaling $49 million were assumed in the budget forcapital improvements and extraordinary building maintenance projects, which did not incur expectedcosts. Costs associated with Probation and Sheriff Department programs funded by the Other PublicProtection Special Revenue Funds were $13 million less than budgeted. The "transfers in" for thehousing for health program, funded by the nonmajor special revenue funds, were $10 million lessthan budgeted. There were various other sources and transfers that comprised the remainingvariance of $8 million.
18

COUNTY OF LOS ANGELESMANAGEMENT’S DISCUSSION AND ANALYSIS (UNAUDITED)-Continued
FOR THE YEAR ENDED JUNE 30, 2019
Budgetary Summary - Expenditures/Other Financing Uses
Following is a summary of current year budgetary changes and actual results (on the County’s budgetary basis) for General Fund expenditures, transfers out, and changes in fund balance components (in thousands):
Category
Increase (Decrease)
From OriginalBudget
Final BudgetAmount
ActualAmount
Variance-Positive
General government $ (187,342) $ 2,148,163 $ 1,269,518 $ 878,645Public protection 163,841 6,117,033 5,922,770 194,263Health and sanitation (45,512) 5,808,067 5,093,306 714,761Public assistance 73,794 7,204,254 6,559,773 644,481All other expenditures 54,593 1,439,872 600,566 839,306Transfers out 7,721 685,649 671,633 14,016Contingencies 20,405 58,472 58,472Fund balance changes-net 127,863 101,531 130,328 (28,797)Total $ 215,363 $ 23,563,041 $ 20,247,894 $ 3,315,147
Changes from Amounts Originally Budgeted
During the year, net increases in General Fund appropriations and fund balance component changes were approximately $215 million. The most significant changes occurred in the following areas:
• Public protection appropriations were increased by $164 million. An increase of $198 million ofsalaries and employee benefits were appropriated and the majority of the increase was to complywith the Ninth Circuit Court of Appeals decision on overtime. In addition, law enforcementappropriations were decreased by $50 million to provide funding for grant program and contractcities services. There were net increases of $16 million for other public protection programs.
• Net fund balance budgetary changes of $128 million had the effect of reducing the available(unassigned) fund balance component. At the end of the year, the restricted fund balance increasedby $40 million for utility users' taxes that were not expended and remained obligated for programsin unincorporated areas. Committed fund balance was increased by $38 million for reserve for rainyday funds, $30 million for Tobacco Settlement funds, and $15 million for Board Budget Policies andPriorities. The remaining variance of $5 million was attributable to various other fund balanceaccounts.
• Public assistance appropriation increased by $74 million. An increase of $54 million of salaries andemployee benefits were appropriated and the majority of the increase was to comply with the NinthCircuit Court of Appeals decision on overtime. In addition, there was an $15 million increase inappropriation for social services programs. The remaining variance of $5 million was related to otherpublic assistance programs.
19
COUNTY OF LOS ANGELESMANAGEMENT’S DISCUSSION AND ANALYSIS (UNAUDITED)-Continued
FOR THE YEAR ENDED JUNE 30, 2019
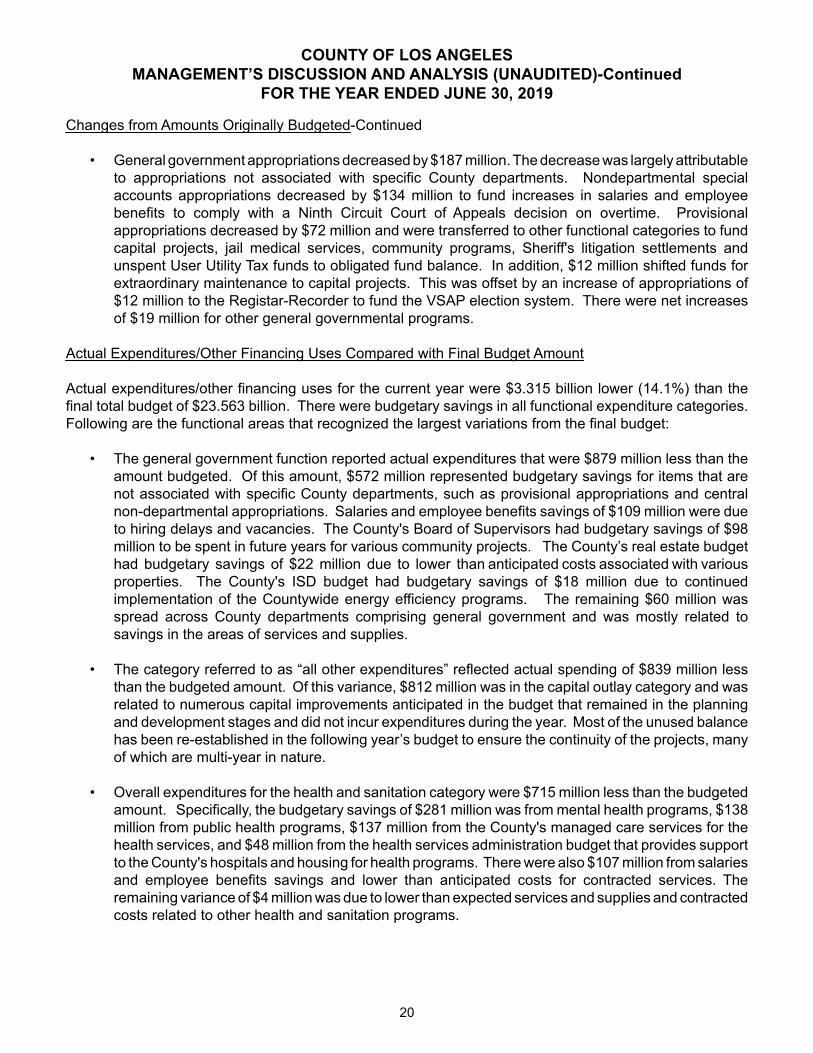
Changes from Amounts Originally Budgeted-Continued
• General government appropriations decreased by $187 million. The decrease was largely attributableto appropriations not associated with specific County departments. Nondepartmental specialaccounts appropriations decreased by $134 million to fund increases in salaries and employeebenefits to comply with a Ninth Circuit Court of Appeals decision on overtime. Provisionalappropriations decreased by $72 million and were transferred to other functional categories to fundcapital projects, jail medical services, community programs, Sheriff's litigation settlements andunspent User Utility Tax funds to obligated fund balance. In addition, $12 million shifted funds forextraordinary maintenance to capital projects. This was offset by an increase of appropriations of$12 million to the Registar-Recorder to fund the VSAP election system. There were net increasesof $19 million for other general governmental programs.
Actual Expenditures/Other Financing Uses Compared with Final Budget Amount
Actual expenditures/other financing uses for the current year were $3.315 billion lower (14.1%) than the final total budget of $23.563 billion. There were budgetary savings in all functional expenditure categories. Following are the functional areas that recognized the largest variations from the final budget:
• The general government function reported actual expenditures that were $879 million less than theamount budgeted. Of this amount, $572 million represented budgetary savings for items that arenot associated with specific County departments, such as provisional appropriations and centralnon-departmental appropriations. Salaries and employee benefits savings of $109 million were dueto hiring delays and vacancies. The County's Board of Supervisors had budgetary savings of $98million to be spent in future years for various community projects. The County’s real estate budgethad budgetary savings of $22 million due to lower than anticipated costs associated with variousproperties. The County's ISD budget had budgetary savings of $18 million due to continuedimplementation of the Countywide energy efficiency programs. The remaining $60 million wasspread across County departments comprising general government and was mostly related tosavings in the areas of services and supplies.
• The category referred to as “all other expenditures” reflected actual spending of $839 million lessthan the budgeted amount. Of this variance, $812 million was in the capital outlay category and wasrelated to numerous capital improvements anticipated in the budget that remained in the planningand development stages and did not incur expenditures during the year. Most of the unused balancehas been re-established in the following year’s budget to ensure the continuity of the projects, manyof which are multi-year in nature.
• Overall expenditures for the health and sanitation category were $715 million less than the budgetedamount. Specifically, the budgetary savings of $281 million was from mental health programs, $138million from public health programs, $137 million from the County's managed care services for thehealth services, and $48 million from the health services administration budget that provides supportto the County's hospitals and housing for health programs. There were also $107 million from salariesand employee benefits savings and lower than anticipated costs for contracted services. Theremaining variance of $4 million was due to lower than expected services and supplies and contractedcosts related to other health and sanitation programs.
20
COUNTY OF LOS ANGELESMANAGEMENT’S DISCUSSION AND ANALYSIS (UNAUDITED)-Continued
FOR THE YEAR ENDED JUNE 30, 2019
Actual Expenditures/Other Financing Uses Compared with Final Budget Amount-Continued
• Actual public assistance expenditures were $644 million lower than the final budget. Vendor andassistance payments for social services and children and family programs were lower than budgetedby $440 million. Administrative cost savings in these areas were due to lower than anticipated costsfor professional, contracted, and information technology services and delays in hiring. There werealso direct program savings associated with lower than anticipated caseloads. Salaries and employeebenefits savings of $140 million were due to hiring delays and vacancies. There were $51 millionof savings related to homeless and housing programs due to delays in carrying out multi-year projects.The remaining variance of $13 million was related to other public assistance programs.
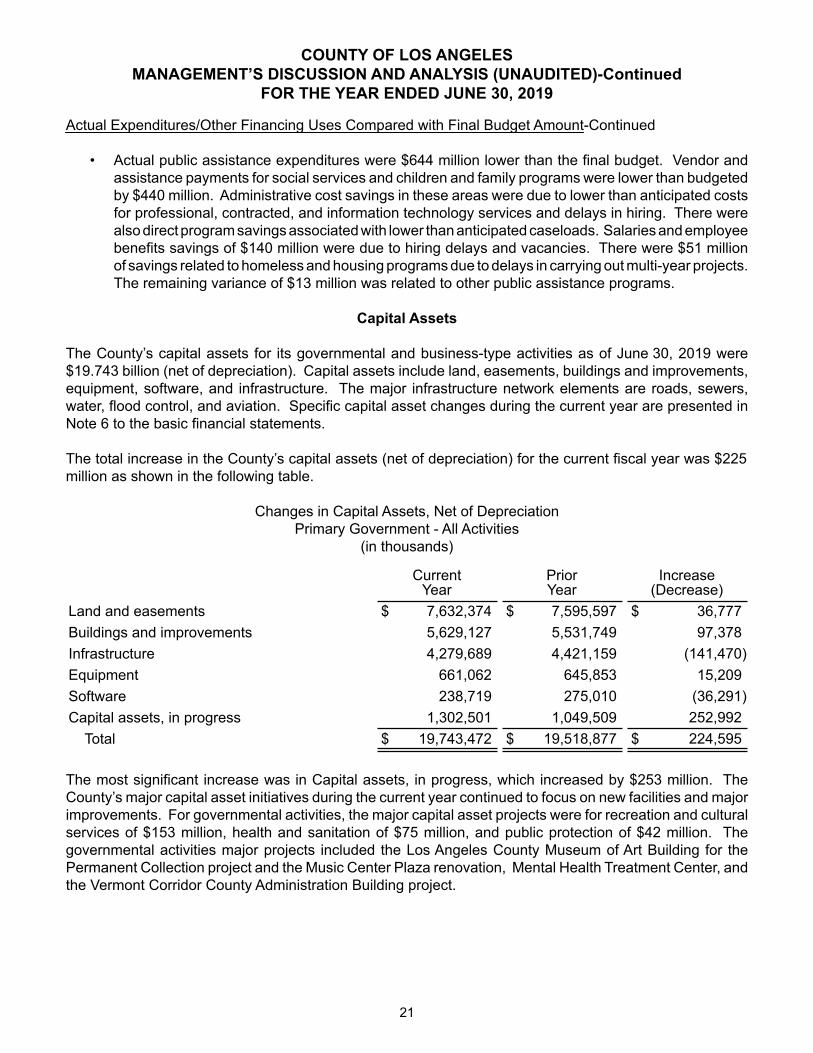
Capital Assets
The County’s capital assets for its governmental and business-type activities as of June 30, 2019 were $19.743 billion (net of depreciation). Capital assets include land, easements, buildings and improvements, equipment, software, and infrastructure. The major infrastructure network elements are roads, sewers, water, flood control, and aviation. Specific capital asset changes during the current year are presented in Note 6 to the basic financial statements.
The total increase in the County’s capital assets (net of depreciation) for the current fiscal year was $225 million as shown in the following table.
Changes in Capital Assets, Net of DepreciationPrimary Government - All Activities
(in thousands)
CurrentYear
PriorYear
Increase(Decrease)
Land and easements $ 7,632,374 $ 7,595,597 $ 36,777Buildings and improvements 5,629,127 5,531,749 97,378Infrastructure 4,279,689 4,421,159 (141,470)Equipment 661,062 645,853 15,209Software 238,719 275,010 (36,291)Capital assets, in progress 1,302,501 1,049,509 252,992
Total $ 19,743,472 $ 19,518,877 $ 224,595
The most significant increase was in Capital assets, in progress, which increased by $253 million. The County’s major capital asset initiatives during the current year continued to focus on new facilities and major improvements. For governmental activities, the major capital asset projects were for recreation and cultural services of $153 million, health and sanitation of $75 million, and public protection of $42 million. The governmental activities major projects included the Los Angeles County Museum of Art Building for the Permanent Collection project and the Music Center Plaza renovation, Mental Health Treatment Center, and the Vermont Corridor County Administration Building project.
21

COUNTY OF LOS ANGELESMANAGEMENT’S DISCUSSION AND ANALYSIS (UNAUDITED)-Continued
FOR THE YEAR ENDED JUNE 30, 2019
For business-type activities, major construction in progress was $27 million at the Rancho Los Amigos National Rehabilitation Center for various projects, including the Support Services Annex Building Renovation and Seismic Retrofit projects. There was also $24 million of capitalized construction-in-progress costs at Harbor-UCLA Medical Center for various projects, including the new Outpatient/Support Building. In addition, there was capitalized software-in-progress costs of $23 million for the Assessor’s Modernization Project Phase 3 and $19 million for the Registrar-Recorder/County Clerk’s VSAP election system project.
Buildings and improvements increased by $97 million. Various projects were completed during the fiscal year, including the Rancho Los Amigos National Rehabilitation Center’s New Outpatient Facilities, with a net book value of $101 million, the Martin Luther King, Jr. New Parking Structure, with a net book value of $39 million, the 3965 S. Vermont Avenue Renovation for Probation, with a net book value of $26 million, and the Sheila Kuehl Family Wellness Center, with a net book value of $12 million. As of June 30, 2019, there were $76 million of capital asset commitments outstanding.
Debt Administration
During the current year, the County’s liabilities for long-term debt, including accreted interest, increased by $514 million, as newly issued debt and accretions of $942 million were more than the debt maturities of $428 million. Specific changes related to governmental and business-type activities are presented in Note 11 to the basic financial statements.
During the current year, significant long-term debt transactions were as follows:
• Lease Revenue Obligation Notes (LRON) of $562 million were issued for governmental and business-type activities in the amounts of $239 million and $323 million, respectively. For governmentalactivities, debt was issued to finance a renovation for a probation facility, parking lot and a newmuseum of art building. For business-type activities, debt was issued to finance hospitalimprovements.
• New debt of $347 million (including bond premium proceeds) was issued to finance the constructionof the Vermont Corridor County Administration Building and parking structure.
• New debt of $30 million was issued to finance the acquisition of equipment for governmental activities.Equipment debt totaling $20 million was redeemed during the year in accordance with maturityschedules.
In addition to the above borrowing, the County continued to finance General Fund cash flow shortages occurring periodically during the fiscal year by selling $700 million in tax and revenue anticipation notes.
The notes matured and were redeemed on June 28, 2019. The General Fund also relied upon periodic borrowing from available agency funds.
22

COUNTY OF LOS ANGELESMANAGEMENT’S DISCUSSION AND ANALYSIS (UNAUDITED)-Continued
FOR THE YEAR ENDED JUNE 30, 2019
Bond Ratings
The County's debt is rated by Moody's, Standard & Poor's, and Fitch. The following is a schedule of ratings assigned by the respective rating agencies:
Moody's Standard & Poor's FitchCertificates of Participation Aa3 AA AAEquipment/Non-Essential Leases Aa2 AA AAOperating/Non-Essential Leases Aa2 AA AAShort-Term MIG1 SP-1+ F1+Regional Park and Open Space
District Bonds Aa1 AA AAA
The County’s bond ratings assigned by Fitch for General Obligation Bonds, Certificates of Participation (formerly referred as "Facilities"), Equipment Lease Revenue, and Operating Leases were upgraded from the previous year.
Economic Conditions and Outlook
The Board of Supervisors adopted the County’s 2019-2020 Budget on June 24, 2019. The Budget was adopted based on estimated fund balances that would be available at the end of 2018-2019. The Board updated the Budget on October 1, 2019 to reflect final 2018-2019 fund balances and other pertinent financial information. For the County’s General Fund, the 2019-2020 Budget utilized $2.090 billion of fund balance, which exceeded the previously estimated fund balance of $1.654 billion. Of the additional fund balance of $436 million, $203 million was used to carryover lapsed appropriations and ensure the continuity of funded program initiatives. The remaining $233 million was primarily used to fund programs for fighting homeless and increasing affordable housing, investing in children, families, and seniors, innovation and growth in health care, fostering arts and culture, advancing information technology initiatives, enhancing public safety, increasing consumer protection, and investing in public assets.
The County’s 2019-2020 Budget reflects the County's values and vision, along with its ambitious commitment to improving life for all County residents, especially the vulnerable and under-served. The projects and programs reflects the budget for funding to advance key priorities of fighting homelessness, promoting health and well-being, improving our justice system, championing the rights and needs of immigrants, creating better lives for children and families, and enriching communities through the arts, recreation, and sustainability. The County's budget continues to reflect the County's long-standing commitment to responsible and sustainable fiscal practices. The County has experienced slow and steady growth in the economy and has a positive outlook for the remainder of 2019 and into 2020 year. The County has taken steps to address long-term budget issues by approving a multi-year plan to prefund retiree healthcare benefits and increasing the County's "Rainy Day Reserve" to $602 million. Looking forward, there are some long-term budgetary issues which will require significant investments and may require a multi-year funding approach related to the expiration of the Title IV-E Waiver, VSAP Election system, Information Technology Systems Replacements, the Facility Reinvestment program, Pensions, OPEB, and Stormwater and Urban Runoff. The County's budget also anticipates uncertainty with budget proposals from both the federal and State governments that could create significant short and long-term budget challenges for the County.
23

COUNTY OF LOS ANGELESMANAGEMENT’S DISCUSSION AND ANALYSIS (UNAUDITED)-Continued
FOR THE YEAR ENDED JUNE 30, 2019
The County’s budget outlook, while favorable, continues to be influenced by the fiscal condition and outlook of the State of California. In this regard, the State Legislative Analyst’s Office (LAO) reports the California's budget continues to be in a good position for FY 2020-2021. The State projects to have sufficient resources to pay for its existing commitments and estimates to have a surplus for FY 2020-2021. In addition, the State continues to add additional funds to the State's rainy day fund. For the longer term, the State should conservatively allocate its available surplus and focus on one-time, flexible commitments that can be changed mid-year if economic conditions change. The State’s outlook is subject to either continuing economic growth or a recession. With a continuing growing economy, the operating surplus will increase, but will decline over time. In the recession scenario, the State has enough reserve to cover its deficit for the outlook period. Health and human services programs are subject to considerable challenges and uncertainty as the State depends on information from the federal government or State executive branch.
The County receives substantial federal revenues and operates many programs which are subject to federal rules and regulations. Federal assistance is especially critical to the County's ability to operate its four County hospitals and health care network. The County is carefully monitoring State and federal policy developments to determine the future impacts, if any, on its ability to administer federal programs and deliver County services that rely upon federal funding. In addition, no update has been received regarding the State audit that questioned California Medical Assistance Program payments. The findings of the audit included $2.1 billion in overpayments related to Los Angeles County beneficiaries. The financial impact, if any, in future years to the County has yet to be quantified.
Obtaining Additional Information
This financial report is designed to provide a general overview of the County’s finances for all interested parties. Questions concerning any of the information provided in this report or requests for additional information should be addressed to the Los Angeles County Auditor-Controller, 500 West Temple Street, Room 525, Los Angeles, CA 90012-3873.
24

BASIC FINANCIAL STATEMENTS

COUNTY OF LOS ANGELESSTATEMENT OF NET POSITIONJUNE 30, 2019 (in thousands)
PRIMARY GOVERNMENT DISCRETELYPRESENTED
COMPONENT UNITSGOVERNMENTAL
ACTIVITIESBUSINESS-TYPE
ACTIVITIES TOTALASSETS
Pooled cash and investments: (Notes 1 and 5)Operating $ 6,300,767 164,202 $ 6,464,969 $ 490,662Other 2,382,605 30,563 2,413,168 —
Total pooled cash and investments 8,683,372 194,765 8,878,137 490,662Other investments (Notes 4 and 5) 329,100 — 329,100 420,934Taxes receivable 263,366 727 264,093 —Accounts receivable - net (Note 14) — 2,443,417 2,443,417 22,884Interest receivable 34,815 592 35,407 608Other receivables 2,795,886 521,662 3,317,548 33,899Internal balances (Note 15) 661,023 (661,023) —Inventories 82,165 25,114 107,279 13,976Restricted assets (Note 5) 7,899 113,134 121,033 —Capital assets: (Notes 1, 6 and 10)
Capital assets, not being depreciated 8,470,128 464,747 8,934,875 94,378Capital assets, net of accumulated depreciation 8,206,114 2,602,483 10,808,597 88,882
Total capital assets 16,676,242 3,067,230 19,743,472 183,260TOTAL ASSETS 29,533,868 5,705,618 35,239,486 1,166,223
DEFERRED OUTFLOWS OF RESOURCES (Note 20) 4,991,057 833,848 5,824,905 12,277LIABILITIES
Accounts payable 773,068 509,640 1,282,708 51,181Accrued payroll 515,144 97,979 613,123 —Other payables 171,657 12,868 184,525 7,273Accrued interest payable 20,079 18,444 38,523 —Advances payable 1,934,534 4,403 1,938,937 5,775Long-term liabilities: (Note 11)
Due within one year 1,126,293 426,382 1,552,675 4,705Due in more than one year 35,015,029 7,612,726 42,627,755 85,220
TOTAL LIABILITIES 39,555,804 8,682,442 48,238,246 154,154DEFERRED INFLOWS OF RESOURCES (Note 20) 5,357,831 960,494 6,318,325 3,300NET POSITION
Net investment in capital assets 15,166,340 2,109,416 17,275,756 141,576Restricted for:
Capital projects 43,950 — 43,950 —Debt service 269,731 16,998 286,729 363Permanent funds - nonspendable 2,145 — 2,145 —Permanent funds - spendable 132 — 132 —General government 311,958 — 311,958 —Public protection 1,051,404 — 1,051,404 —Public ways and facilities 367,055 121,688 488,743 —Health and sanitation 1,203,900 — 1,203,900 —Recreation 407,713 — 407,713 —Community development — — 463,672First 5 LA 364,339Other 153,417 — 153,417
Unrestricted (deficit) (29,366,455) (5,351,572) (34,718,027) 51,096TOTAL NET POSITION (DEFICIT) (Note 3) $ (10,388,710) (3,103,470) $ (13,492,180) $ 1,021,046
The notes to the basic financial statements are an integral part of this statement.
25

COUNTY OF LOS ANGELESSTATEMENT OF ACTIVITIESFOR THE YEAR ENDED JUNE 30, 2019 (in thousands)
PROGRAM REVENUES
FUNCTIONS CHARGES FORSERVICES
OPERATINGGRANTS AND
CONTRIBUTIONS
CAPITALGRANTS AND
CONTRIBUTIONSPRIMARY GOVERNMENT: EXPENSESGovernmental activities:
General government $ 1,660,335 570,425 54,159 8,243Public protection 7,772,364 1,281,280 1,682,689 62,952Public ways and facilities 453,758 26,882 283,007 —Health and sanitation 5,433,924 1,606,315 3,016,694 —Public assistance 6,922,346 18,460 5,680,991 —Education 161,012 16,672 105 —Recreation and cultural services 320,838 160,111 1,809 1,760Interest on long-term debt 124,549 — — —
Total governmental activities 22,849,126 3,680,145 10,719,454 72,955
Business-type activities:Hospitals 4,827,429 3,437,056 486,589 —Waterworks 104,906 84,748 1,458 56Aviation 5,954 4,720 40 3,794
Total business-type activities 4,938,289 3,526,524 488,087 3,850Total primary government $ 27,787,415 7,206,669 11,207,541 76,805
DISCRETELY PRESENTED COMPONENT UNITS $ 648,734 28,096 695,644 5,912
GENERAL REVENUES:Taxes:
Property taxesUtility users taxesVoter approved taxesDocumentary transfer taxesOther taxes
Sales and use taxes, levied by the StateGrants and contributions not restricted to special
programsInvestment incomeMiscellaneous
TRANSFERS - NETTotal general revenues and transfers
CHANGE IN NET POSITIONNET POSITION (DEFICIT), JULY 1, 2018NET POSITION (DEFICIT), JUNE 30, 2019
The notes to the basic financial statements are an integral part of this statement.
26

NET (EXPENSES) REVENUES ANDCHANGES IN NET POSITION
PRIMARY GOVERNMENT
DISCRETELYPRESENTEDCOMPONENT
UNITS
GOVERNMENTAL BUSINESS-TYPE FUNCTIONSACTIVITIES ACTIVITIES TOTAL PRIMARY GOVERNMENT:
Governmental activities:$ (1,027,508) $ (1,027,508) General government
(4,745,443) (4,745,443) Public protection(143,869) (143,869) Public ways and facilities(810,915) (810,915) Health and sanitation
(1,222,895) (1,222,895) Public assistance(144,235) (144,235) Education(157,158) (157,158) Recreation and cultural services(124,549) (124,549) Interest on long-term debt
(8,376,572) (8,376,572) Total governmental activities
Business-type activities:(903,784) (903,784) Hospitals
(18,644) (18,644) Waterworks2,600 2,600 Aviation
(919,828) (919,828) Total business-type activities(8,376,572) (919,828) (9,296,400) Total primary government
$ 80,918 DISCRETELY PRESENTED COMPONENT UNITS
GENERAL REVENUES:Taxes:
7,008,569 6,504 7,015,073 — Property taxes44,604 — 44,604 — Utility users taxes
463,450 — 463,450 — Voter approved taxes87,899 — 87,899 — Documentary transfer taxes39,160 — 39,160 — Other taxes
541,258 — 541,258 Sales and use taxes, levied by the State
473,800 32 473,832 — Grants and contributions not restricted to specialprograms
380,361 6,600 386,961 21,286 Investment income269,931 36 269,967 1,684 Miscellaneous
(671,446) 671,446 — — TRANSFERS - NET8,637,586 684,618 9,322,204 22,970 Total general revenues and transfers
261,014 (235,210) 25,804 103,888 CHANGE IN NET POSITION(10,649,724) (2,868,260) (13,517,984) 917,158 NET POSITION (DEFICIT), JULY 1, 2018
$ (10,388,710) (3,103,470) $ (13,492,180) $ 1,021,046 NET POSITION (DEFICIT), JUNE 30, 2019
27
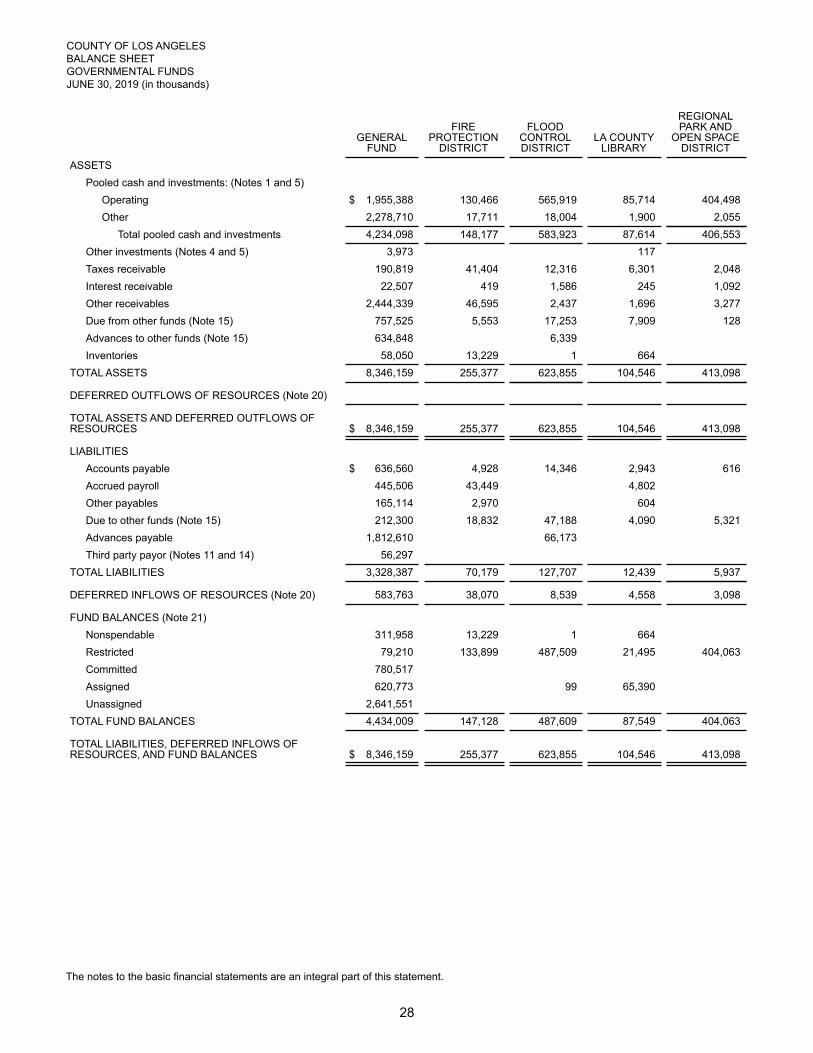
COUNTY OF LOS ANGELESBALANCE SHEETGOVERNMENTAL FUNDSJUNE 30, 2019 (in thousands)
GENERALFUND
FIREPROTECTION
DISTRICT
FLOODCONTROLDISTRICT
LA COUNTYLIBRARY
REGIONALPARK AND
OPEN SPACEDISTRICT
ASSETSPooled cash and investments: (Notes 1 and 5)
Operating $ 1,955,388 130,466 565,919 85,714 404,498Other 2,278,710 17,711 18,004 1,900 2,055
Total pooled cash and investments 4,234,098 148,177 583,923 87,614 406,553Other investments (Notes 4 and 5) 3,973 — — 117 —Taxes receivable 190,819 41,404 12,316 6,301 2,048Interest receivable 22,507 419 1,586 245 1,092Other receivables 2,444,339 46,595 2,437 1,696 3,277Due from other funds (Note 15) 757,525 5,553 17,253 7,909 128Advances to other funds (Note 15) 634,848 — 6,339 — —Inventories 58,050 13,229 1 664 —
TOTAL ASSETS 8,346,159 255,377 623,855 104,546 413,098
DEFERRED OUTFLOWS OF RESOURCES (Note 20) — — — — —TOTAL ASSETS AND DEFERRED OUTFLOWS OFRESOURCES $ 8,346,159 255,377 623,855 104,546 413,098
LIABILITIESAccounts payable $ 636,560 4,928 14,346 2,943 616Accrued payroll 445,506 43,449 — 4,802 —Other payables 165,114 2,970 — 604 —Due to other funds (Note 15) 212,300 18,832 47,188 4,090 5,321Advances payable 1,812,610 — 66,173 — —Third party payor (Notes 11 and 14) 56,297 — — — —
TOTAL LIABILITIES 3,328,387 70,179 127,707 12,439 5,937
DEFERRED INFLOWS OF RESOURCES (Note 20) 583,763 38,070 8,539 4,558 3,098
FUND BALANCES (Note 21)Nonspendable 311,958 13,229 1 664 —Restricted 79,210 133,899 487,509 21,495 404,063Committed 780,517 — — — —Assigned 620,773 — 99 65,390 —Unassigned 2,641,551 — — — —
TOTAL FUND BALANCES 4,434,009 147,128 487,609 87,549 404,063
TOTAL LIABILITIES, DEFERRED INFLOWS OFRESOURCES, AND FUND BALANCES $ 8,346,159 255,377 623,855 104,546 413,098
The notes to the basic financial statements are an integral part of this statement.
28

MENTAL HEALTH SERVICES
ACT
NONMAJORGOVERNMENTAL
FUNDSELIMINATIONS
(NOTE 4)
TOTALGOVERNMENTAL
FUNDSASSETS
Pooled cash and investments: (Notes 1 and 5)$ 1,195,634 1,923,540 $ 6,261,159 Operating
1,999 53,014 2,373,393 Other1,197,633 1,976,554 8,634,552 Total pooled cash and investments
— 338,630 (13,620) 329,100 Other investments (Notes 4 and 5)— 10,478 263,366 Taxes receivable
3,277 5,372 34,498 Interest receivable— 189,535 2,687,879 Other receivables
17,281 43,438 849,087 Due from other funds (Note 15)
— 11,232 652,419 Advances to other funds (Note 15)
— 1 71,945 Inventories1,218,191 2,575,240 (13,620) 13,522,846 TOTAL ASSETS
— 217,518 217,518 DEFERRED OUTFLOWS OF RESOURCES (Note 20)
$ 1,218,191 2,792,758 (13,620) $ 13,740,364TOTAL ASSETS AND DEFERRED OUTFLOWS OFRESOURCES
LIABILITIES$ 103,549 $ 762,942 Accounts payable
— 87 493,844 Accrued payroll
— — 168,688 Other payables279,696 328,060 895,487 Due to other funds (Note 15)
— 55,448 1,934,231 Advances payable
— 246 56,543 Third party payor (Notes 11 and 14)279,696 487,390 4,311,735 TOTAL LIABILITIES
— 11,758 649,786 DEFERRED INFLOWS OF RESOURCES (Note 20)
FUND BALANCES (Note 21)
— 2,146 327,998 Nonspendable938,495 2,002,656 (13,620) 4,053,707 Restricted
— 127,829 908,346 Committed
— 160,979 847,241 Assigned
— — 2,641,551 Unassigned938,495 2,293,610 (13,620) 8,778,843 TOTAL FUND BALANCES
$ 1,218,191 2,792,758 (13,620) $ 13,740,364TOTAL LIABILITIES, DEFERRED INFLOWS OFRESOURCES, AND FUND BALANCES
29

COUNTY OF LOS ANGELESRECONCILIATION OF THE BALANCE SHEET OF GOVERNMENTAL FUNDSTO THE STATEMENT OF NET POSITIONJUNE 30, 2019 (in thousands)
Fund balances - total governmental funds (page 29) $ 8,778,843Amounts reported for governmental activities in the statement of net position are differentbecause:
Capital assets used in governmental activities are not reported in governmental funds:Land and easements $ 7,465,808Construction-in-progress 1,004,320Buildings and improvements - net 3,813,269Equipment - net 381,179Intangible software - net 222,564Infrastructure - net 3,646,888 16,534,028
Deferred outflows and inflows of resources reported in the statement of net position, butnot recognized in the governmental funds:
Deferred outflows from losses on refunding of debt $ 14,452Deferred outflows from OPEB 1,201,924Deferred outflows from pension 3,601,401Deferred inflows from service concession arrangements (82,853)Deferred inflows from OPEB (3,935,542)Deferred inflows from pension (1,135,407) (336,025)
Deferred outflows and inflows of resources reported in the balance sheet, but notrecognized in the statement of net position:
Deferred outflows from tobacco settlement revenues $ (217,518)Deferred inflows from tobacco settlement revenues 217,518Deferred inflows from property taxes 183,517Deferred inflows from long-term receivables 248,751 432,268
Other long-term asset transactions are not available for the current period and are notrecognized in governmental funds:
Payables and receivables related to capital assets $ 16,079Accrued interest on long-term receivables 165 16,244
Installment receivables from service concession arrangements. 82,853Accrued interest payable is not recognized in governmental funds. (19,302)Long-term liabilities, including bonds and notes payable, are not due and payable in thecurrent period and, therefore, are not reported in the governmental funds:
Bonds and notes $ (1,760,910)Unamortized premiums on bonds and notes (124,277)Accreted interest on bonds and notes (143,725)Capital lease obligations (156,887)Accrued compensated absences (1,598,645)Workers' compensation (2,572,791)Litigation and self-insurance (264,324)Pollution remediation obligations (44,112)Net pension liability (8,446,386)Net OPEB liability (19,566,774)Third party payor liability (22,947) (34,701,778)
Assets and liabilities of certain internal service funds are included in governmentalactivities in the accompanying statement of net position. (1,175,841)
Net position (deficit) of governmental activities (page 25) $(10,388,710)
The notes to the basic financial statements are an integral part of this statement.
30

31

COUNTY OF LOS ANGELESSTATEMENT OF REVENUES, EXPENDITURES AND CHANGES IN FUND BALANCESGOVERNMENTAL FUNDSFOR THE YEAR ENDED JUNE 30, 2019 (in thousands)
GENERALFUND
FIREPROTECTION
DISTRICT
FLOODCONTROLDISTRICT
LA COUNTYLIBRARY
REGIONALPARK AND
OPEN SPACEDISTRICT
REVENUESTaxes $ 6,034,742 901,130 159,233 97,670 90,599Licenses, permits and franchises 63,538 16,848 1,168 — —Fines, forfeitures and penalties 187,979 2,428 803 374 515Revenue from use of money and property:
Investment income (Note 5) 238,811 3,236 18,783 2,603 11,368Rents and concessions (Note 10) 127,240 101 6,522 14 —Royalties 65 — 754 — —
Intergovernmental revenues:Federal 3,943,338 1,862 86 40 —State 6,228,635 17,068 5,286 465 —Other 52,374 1,294 646 267 —
Charges for services 2,505,049 210,307 133,555 15,799 28,393Miscellaneous 169,320 2,927 309 1,245 111TOTAL REVENUES 19,551,091 1,157,201 327,145 118,477 130,986
EXPENDITURESCurrent:
General government 1,284,824 — — — —Public protection 5,893,865 1,216,700 334,319 — —Public ways and facilities — — — — —Health and sanitation 5,065,138 — — — —Public assistance 6,501,712 — — — —Education — — — 152,112 —Recreation and cultural services 386,217 — — — 46,949
Debt service:Principal 8,108 115 — 34 —Interest and other charges 29,411 426 — 23 —
Capital outlay 1,586 — — — —TOTAL EXPENDITURES 19,170,861 1,217,241 334,319 152,169 46,949
EXCESS (DEFICIENCY) OF REVENUES OVEREXPENDITURES 380,230 (60,040) (7,174) (33,692) 84,037
OTHER FINANCING SOURCES (USES)Transfers in (Note 15) 977,789 39,272 — 47,751 —Transfers out (Note 15) (822,556) (7,874) (7,918) (3,936) —Issuance of debt (Note 11) — — — — —Bond premium proceeds (Note 11) — — — — —Capital leases (Note 10) 1,586 — — — —Sales of capital assets 1,769 115 309 13 —TOTAL OTHER FINANCING SOURCES (USES) 158,588 31,513 (7,609) 43,828
NET CHANGE IN FUND BALANCES 538,818 (28,527) (14,783) 10,136 84,037
FUND BALANCES, JULY 1, 2018 3,895,191 175,655 502,392 77,413 320,026FUND BALANCES, JUNE 30, 2019 $ 4,434,009 147,128 487,609 87,549 404,063
The notes to the basic financial statements are an integral part of this statement.
32

MENTAL HEALTH SERVICES
ACT
NONMAJORGOVERNMENTAL
FUNDSELIMINATIONS
(NOTE 4)
TOTALGOVERNMENTAL
FUNDSREVENUES
$ 790,054 $ 8,073,428 Taxes— 20,811 102,365 Licenses, permits and franchises— 44,512 236,611 Fines, forfeitures and penalties
Revenue from use of money and property:41,489 63,998 (1,039) 379,249 Investment income (Note 5)
— 27,895 161,772 Rents and concessions (Note 10)— 5 824 Royalties
Intergovernmental revenues:— 24,024 3,969,350 Federal
555,104 321,354 7,127,912 State— 15,297 69,878 Other— 144,526 3,037,629 Charges for services— 177,642 351,554 Miscellaneous
596,593 1,630,118 (1,039) 23,510,572 TOTAL REVENUES
EXPENDITURESCurrent:
— 14,581 1,299,405 General government— 69,534 7,514,418 Public protection— 406,019 406,019 Public ways and facilities
65,266 172,265 5,302,669 Health and sanitation— 206,805 6,708,517 Public assistance— — 152,112 Education— 8,475 441,641 Recreation and cultural services
Debt service:— 138,923 (12,955) 134,225 Principal— 100,777 (1,039) 129,598 Interest and other charges— 235,466 237,052 Capital outlay
65,266 1,352,845 (13,994) 22,325,656 TOTAL EXPENDITURES
531,327 277,273 12,955 1,184,916EXCESS (DEFICIENCY) OF REVENUES OVER
EXPENDITURES
OTHER FINANCING SOURCES (USES)— 493,564 1,558,376 Transfers in (Note 15)
(643,721) (932,187) (2,418,192) Transfers out (Note 15)— 541,555 541,555 Issuance of debt (Note 11)— 44,179 44,179 Bond premium proceeds (Note 11)— — 1,586 Capital leases (Note 10)— 912 3,118 Sales of capital assets
(643,721) 148,023 (269,378) TOTAL OTHER FINANCING SOURCES (USES)
(112,394) 425,296 12,955 915,538 NET CHANGE IN FUND BALANCES
1,050,889 1,868,314 (26,575) 7,863,305 FUND BALANCES, JULY 1, 2018$ 938,495 2,293,610 (13,620) $ 8,778,843 FUND BALANCES, JUNE 30, 2019
33

COUNTY OF LOS ANGELESRECONCILIATION OF THE STATEMENT OF REVENUES, EXPENDITURES ANDCHANGES IN FUND BALANCES OF GOVERNMENTAL FUNDSTO THE STATEMENT OF ACTIVITIESFOR THE YEAR ENDED JUNE 30, 2019 (in thousands)
Net change in fund balances - total governmental funds (page 33) $ 915,538Amounts reported for governmental activities in the statement of activities are differentbecause:
Governmental funds report capital outlay as expenditures. However, in the statement ofactivities, the cost of those assets is allocated over their estimated useful lives andreported as depreciation expense:
Expenditures for general capital assets, infrastructure and other related capital assetadjustments $ 569,861Less - current year depreciation expense (413,306) 156,555
In the statement of activities, only the gain or loss on the disposal of capital assets isreported, whereas in the governmental funds, the proceeds from the sale are reported asan increase in financial resources. Thus, the change in net position differs from thechange in fund balance. (2,729)Contribution of capital assets is not recognized in the governmental funds. 64,712Amortization of losses on refunding of debt are reported as changes to deferred outflowsof resources in governmental activities, but not reported for governmental funds. (1,476)Changes in unavailable revenues are reported as changes in deferred inflows ofresources for governmental funds, but were recognized when earned for governmentalactivities. 163,652Timing differences result in more or less revenues and expenses in the statement ofactivities.
Change in accrued interest on long-term receivables $ 22Change in unamortized premiums 2,060 2,082
Issuance of long-term debt provides resources in the governmental funds, but increaseslong-term liabilities in the statement of net position. (587,320)Repayment of debt principal is an expenditure in the governmental funds, but therepayment reduces long-term liabilities in the statement of net position:
Certificates of participation and bonds $ 37,524Notes, loans, and lease revenue obligation notes 75,489Assessment bonds 12,955Other long-term notes, loans and capital leases 8,257 134,225
Some expenses reported in the accompanying statement of activities do not require (orprovide) the use of current financial resources and, therefore, are not reported asexpenditures in governmental funds:
Change in workers' compensation $ (119,459)Change in litigation and self-insurance (56,601)Change in pollution remediation obligations 1,910Change in accrued compensated absences (100,499)Change in net pension liability, net of related deferred outflows of resources anddeferred inflows of resources 190,350Change in net OPEB liability, net of related deferred outflows of resources and deferred inflows of resources (663,275)Change in third party payor liability (8,577)Change in accrued interest payable (1,073)Change in accretion of bonds and notes 11,918Change in accretion of tobacco settlement bonds (3,603)Transfer of capital assets between governmental fund and enterprise fund 172,601 (576,308)
The portion of internal service funds that is reported with governmental activities. (7,917)Change in net position of governmental activities (page 27) $ 261,014
The notes to the basic financial statements are an integral part of this statement.
34

COUNTY OF LOS ANGELESSTATEMENT OF REVENUES, EXPENDITURES AND CHANGES IN FUND BALANCE -BUDGET AND ACTUAL ON BUDGETARY BASISGENERAL FUNDFOR THE YEAR ENDED JUNE 30, 2019 (in thousands)
GENERAL FUNDORIGINALBUDGET
FINALBUDGET
ACTUAL ONBUDGETARY
BASIS
VARIANCE WITHFINAL BUDGET
POSITIVE(NEGATIVE)
REVENUESTaxes $ 5,906,404 5,978,608 6,042,289 63,681Licenses, permits and franchises 59,645 59,654 63,538 3,884Fines, forfeitures and penalties 172,719 173,239 187,979 14,740Revenue from use of money and property:
Investment income 98,233 100,289 160,314 60,025Rents and concessions 134,460 135,049 127,240 (7,809)Royalties 100 100 65 (35)
Intergovernmental revenues:Federal 4,556,793 4,574,684 3,935,379 (639,305)State 6,491,090 6,470,638 6,187,917 (282,721)Other 47,066 90,261 52,064 (38,197)
Charges for services 2,679,726 2,727,854 2,508,796 (219,058)Miscellaneous 124,075 146,672 168,492 21,820
TOTAL REVENUES 20,270,311 20,457,048 19,434,073 (1,022,975)
EXPENDITURESCurrent:
General government 2,335,505 2,148,163 1,269,518 878,645Public protection 5,953,192 6,117,033 5,922,770 194,263Health and sanitation 5,853,579 5,808,067 5,093,306 714,761Public assistance 7,130,460 7,204,254 6,559,773 644,481Recreation and cultural services 404,485 421,895 394,770 27,125
Debt service-Interest 11,916 11,916 11,916
Capital outlay 968,878 1,006,061 193,880 812,181TOTAL EXPENDITURES 22,658,015 22,717,389 19,445,933 3,271,456
DEFICIENCY OF REVENUES OVER EXPENDITURES (2,387,704) (2,260,341) (11,860) 2,248,481
OTHER FINANCING SOURCES (USES)Sales of capital assets 468 468 1,769 1,301Transfers in 1,147,567 1,176,193 972,560 (203,633)Transfers out (677,928) (685,649) (671,633) 14,016Appropriations for contingencies (38,067) (58,472) — 58,472Changes in fund balance 26,332 (101,531) (130,328) (28,797)
TOTAL OTHER FINANCING SOURCES (USES) 458,372 331,009 172,368 (158,641)
NET CHANGE IN FUND BALANCE (1,929,332) (1,929,332) 160,508 2,089,840
FUND BALANCE, JULY 1, 2018 (Note 16) 1,929,332 1,929,332 1,929,332
FUND BALANCE, JUNE 30, 2019 (Note 16) $ 2,089,840 2,089,840
The notes to the basic financial statements are an integral part of this statement.
35

COUNTY OF LOS ANGELESSTATEMENT OF REVENUES, EXPENDITURES AND CHANGES IN FUND BALANCE -BUDGET AND ACTUAL ON BUDGETARY BASISFIRE PROTECTION DISTRICTFOR THE YEAR ENDED JUNE 30, 2019 (in thousands)
FIRE PROTECTION DISTRICTORIGINALBUDGET
FINALBUDGET
ACTUAL ONBUDGETARY
BASIS
VARIANCE WITHFINAL BUDGET
POSITIVE(NEGATIVE)
REVENUESTaxes $ 906,091 906,091 902,212 (3,879)Licenses, permits and franchises 14,325 15,168 16,848 1,680Fines, forfeitures and penalties 2,180 2,351 2,428 77Revenue from use of money and property:
Investment income 938 1,302 1,543 241Rents and concessions 81 81 101 20
Intergovernmental revenues:Federal 15,038 15,838 5,375 (10,463)State 19,628 20,999 17,068 (3,931)Other — 267 1,294 1,027
Charges for services 212,324 217,555 211,710 (5,845)Miscellaneous 2,634 2,646 2,927 281
TOTAL REVENUES 1,173,239 1,182,298 1,161,506 (20,792)
EXPENDITURESCurrent-Public protection:
Salaries and employee benefits 1,021,895 1,077,746 1,063,262 14,484Services and supplies 150,370 156,391 133,602 22,789Other charges 7,313 8,278 6,163 2,115Capital assets 3,480 4,389 2,524 1,865
TOTAL EXPENDITURES 1,183,058 1,246,804 1,205,551 41,253
DEFICIENCY OF REVENUES OVER EXPENDITURES (9,819) (64,506) (44,045) 20,461
OTHER FINANCING SOURCES (USES)Sales of capital assets 297 297 115 (182)Transfers in 37,651 38,163 39,272 1,109Transfers out (4,450) (5,756) (5,756) —Appropriation for contingencies (24,093) (21) — 21Changes in fund balance — 31,409 30,163 (1,246)
TOTAL OTHER FINANCING SOURCES (USES) 9,405 64,092 63,794 (298)
NET CHANGE IN FUND BALANCE (414) (414) 19,749 20,163
FUND BALANCE, JULY 1, 2018 (Note 16) 414 414 414
FUND BALANCE, JUNE 30, 2019 (Note 16) $ 20,163 20,163
The notes to the basic financial statements are an integral part of this statement.
36

COUNTY OF LOS ANGELESSTATEMENT OF REVENUES, EXPENDITURES AND CHANGES IN FUND BALANCE -BUDGET AND ACTUAL ON BUDGETARY BASISFLOOD CONTROL DISTRICTFOR THE YEAR ENDED JUNE 30, 2019 (in thousands)
FLOOD CONTROL DISTRICTORIGINALBUDGET
FINALBUDGET
ACTUAL ONBUDGETARY
BASIS
VARIANCE WITHFINAL BUDGET
POSITIVE(NEGATIVE)
REVENUESTaxes $ 151,817 160,417 159,478 (939)Licenses, permits and franchises 1,181 1,181 1,168 (13)Fines, forfeitures and penalties 947 947 803 (144)Revenue from use of money and property:
Investment income 6,837 6,837 11,641 4,804Rents and concessions 6,445 6,445 6,522 77Royalties 540 540 754 214
Intergovernmental revenues:Federal — — 86 86State 1,314 1,314 5,286 3,972Other 1,463 1,463 646 (817)
Charges for services 112,394 127,394 133,475 6,081Miscellaneous 126 126 309 183
TOTAL REVENUES 283,064 306,664 320,168 13,504
EXPENDITURESCurrent-Public protection:
Services and supplies 251,029 329,939 329,416 523Other charges 18,877 26,200 21,792 4,408Capital assets 1,562 1,562 1,471 91
Capital outlay 106,740 60,762 34,677 26,085
TOTAL EXPENDITURES 378,208 418,463 387,356 31,107
DEFICIENCY OF REVENUES OVER EXPENDITURES (95,144) (111,799) (67,188) 44,611
OTHER FINANCING SOURCES (USES)Sales of capital assets 45 45 309 264Transfers out (10,876) (10,946) (7,918) 3,028Changes in fund balance 39,300 56,025 68,221 12,196
TOTAL OTHER FINANCING SOURCES (USES) 28,469 45,124 60,612 15,488
NET CHANGE IN FUND BALANCE (66,675) (66,675) (6,576) 60,099
FUND BALANCE, JULY 1, 2018 (Note 16) 66,675 66,675 66,675
FUND BALANCE, JUNE 30, 2019 (Note 16) $ 60,099 60,099
The notes to the basic financial statements are an integral part of this statement.
37

COUNTY OF LOS ANGELESSTATEMENT OF REVENUES, EXPENDITURES AND CHANGES IN FUND BALANCE -BUDGET AND ACTUAL ON BUDGETARY BASISLA COUNTY LIBRARYFOR THE YEAR ENDED JUNE 30, 2019 (in thousands)
LA COUNTY LIBRARYORIGINALBUDGET
FINALBUDGET
ACTUAL ONBUDGETARY
BASIS
VARIANCE WITHFINAL BUDGET
POSITIVE(NEGATIVE)
REVENUESTaxes $ 95,549 96,439 97,730 1,291Fines, forfeitures and penalties 556 556 374 (182)Revenue from use of money and property:
Investment income 437 437 1,783 1,346Rents and concessions 15 15 14 (1)
Intergovernmental revenues:Federal — — 40 40State 540 540 465 (75)Other 130 130 267 137
Charges for services 15,972 15,972 15,799 (173)Miscellaneous 584 584 1,245 661
TOTAL REVENUES 113,783 114,673 117,717 3,044
EXPENDITURESCurrent-Education:
Salaries and employee benefits 113,020 113,020 103,429 9,591Services and supplies 86,355 88,339 57,694 30,645Other charges 945 945 809 136Capital assets 2,233 3,083 2,377 706
TOTAL EXPENDITURES 202,553 205,387 164,309 41,078
DEFICIENCY OF REVENUES OVER EXPENDITURES (88,770) (90,714) (46,592) 44,122
OTHER FINANCING SOURCES (USES)Sales of capital assets 13 13 13 —Transfers in 50,452 54,021 47,751 (6,270)Transfers out (2,464) (3,199) (3,199) —Appropriation for contingencies — (890) — 890Changes in fund balance (3,881) (3,881) (1,276) 2,605
TOTAL OTHER FINANCING SOURCES (USES) 44,120 46,064 43,289 (2,775)
NET CHANGE IN FUND BALANCE (44,650) (44,650) (3,303) 41,347
FUND BALANCE, JULY 1, 2018 (Note 16) 44,650 44,650 44,650
FUND BALANCE, JUNE 30, 2019 (Note 16) $ 41,347 41,347
The notes to the basic financial statements are an integral part of this statement.
38

COUNTY OF LOS ANGELESSTATEMENT OF REVENUES, EXPENDITURES AND CHANGES IN FUND BALANCE -BUDGET AND ACTUAL ON BUDGETARY BASISREGIONAL PARK AND OPEN SPACE DISTRICTFOR THE YEAR ENDED JUNE 30, 2019 (in thousands)
REGIONAL PARK AND OPEN SPACE DISTRICTORIGINALBUDGET
FINALBUDGET
ACTUAL ONBUDGETARY
BASIS
VARIANCE WITHFINAL BUDGET
POSITIVE(NEGATIVE)
REVENUESTaxes $ 91,214 90,599 (615)Fines, forfeitures and penalties 389 389 515 126Revenue from use of money and property-
Investment income 1,948 1,548 7,255 5,707Charges for services 123,073 28,750 28,670 (80)Miscellaneous 111 111
TOTAL REVENUES 125,410 121,901 127,150 5,249
EXPENDITURESCurrent-Recreation and cultural services:
Services and supplies 16,062 13,300 7,212 6,088Other charges 173,044 188,799 29,766 159,033
TOTAL EXPENDITURES 189,106 202,099 36,978 165,121
EXCESS (DEFICIENCY) OF REVENUES OVEREXPENDITURES (63,696) (80,198) 90,172 170,370
OTHER FINANCING SOURCES (USES)Transfers in 148,937 163,280 159,318 (3,962)Transfers out (163,059) (163,349) (159,580) 3,769Appropriations for contingencies (3,799) — — —Changes in fund balance (69,892) (71,242) (59,905) 11,337
TOTAL OTHER FINANCING SOURCES (USES) (87,813) (71,311) (60,167) 11,144
NET CHANGE IN FUND BALANCE (151,509) (151,509) 30,005 181,514
FUND BALANCE, JULY 1, 2018 (Note 16) 151,753 151,753 151,753
FUND BALANCE, JUNE 30, 2019 (Note 16) $ 244 244 181,758 181,514
The notes to the basic financial statements are an integral part of this statement.
39

COUNTY OF LOS ANGELESSTATEMENT OF REVENUES, EXPENDITURES AND CHANGES IN FUND BALANCE -BUDGET AND ACTUAL ON BUDGETARY BASISMENTAL HEALTH SERVICES ACTFOR THE YEAR ENDED JUNE 30, 2019 (in thousands)
MENTAL HEALTH SERVICES ACTORIGINALBUDGET
FINALBUDGET
ACTUAL ONBUDGETARY
BASIS
VARIANCE WITHFINAL BUDGET
POSITIVE (NEGATIVE)
REVENUESRevenue from use of money and property-
Investment income $ 9,879 9,879 25,460 15,581Intergovernmental revenues-
State 557,281 557,281 555,104 (2,177)
TOTAL REVENUES 567,160 567,160 580,564 13,404
EXPENDITURESCurrent-Health and sanitation:
Services and supplies 5,610 5,610 57 5,553Other Charges — 65,000 65,000
TOTAL EXPENDITURES 5,610 70,610 65,057 5,553
EXCESS OF REVENUES OVER EXPENDITURES 561,550 496,550 515,507 18,957
OTHER FINANCING SOURCES (USES)Transfers out (756,326) (760,775) (643,721) 117,054
Appropriations for contingencies (77,618) (77,618) — 77,618Changes in fund balance 45,571 115,020 115,019 (1)
TOTAL OTHER FINANCING SOURCES (USES) (788,373) (723,373) (528,702) 194,671
NET CHANGE IN FUND BALANCE (226,823) (226,823) (13,195) 213,628
FUND BALANCE, JULY 1, 2018 (Note 16) 226,823 226,823 226,823
FUND BALANCE, JUNE 30, 2019 (Note 16) $ 213,628 213,628
The notes to the basic financial statements are an integral part of this statement.
40

41

COUNTY OF LOS ANGELESSTATEMENT OF NET POSITIONPROPRIETARY FUNDSJUNE 30, 2019 (in thousands)
BUSINESS-TYPE ACTIVITIES -Harbor-UCLA
MedicalCenter
Olive View-UCLA Medical
Center
LAC+USCMedicalCenter
Rancho LosAmigos NationalRehab Center
ASSETSCurrent assets:
Pooled cash and investments: (Notes 1 and 5)Operating $ 1,525 873 1,983 32,157Other 9,445 4,580 11,553 2,691
Total pooled cash and investments 10,970 5,453 13,536 34,848Taxes receivable — — — —Accounts receivable - net (Note 14) 843,369 411,633 1,009,883 164,052Interest receivable 113 48 15 64Other receivables 21,487 14,661 27,357 5,283Due from other funds (Note 15) 74,980 77,082 314,124 4,789Advances to other funds (Note 15) — — — —Inventories 8,362 4,551 10,246 1,955
Total current assets 959,281 513,428 1,375,161 210,991Noncurrent assets:
Restricted assets (Note 5) 61,440 15,593 — 29,131Other receivables (Note 14) 176,237 61,351 197,728 17,558Capital assets: (Notes 1, 6 and 10)
Land and easements 1,671 1,894 16,194 217Buildings and improvements 928,530 222,706 1,050,748 306,112Equipment 119,704 85,203 146,569 41,459Intangible - software 16,921 14,359 20,704 5,616Infrastructure — — — —Construction in progress 49,165 — — 212,040
Less accumulated depreciation (317,861) (176,980) (383,588) (147,730)Total capital assets - net 798,130 147,182 850,627 417,714
Total noncurrent assets 1,035,807 224,126 1,048,355 464,403TOTAL ASSETS 1,995,088 737,554 2,423,516 675,394DEFERRED OUTFLOWS OF RESOURCES (Note 20) 258,425 173,014 336,082 66,327LIABILITIESCurrent liabilities:
Accounts payable 187,924 89,614 182,598 43,950Accrued payroll 30,849 16,744 42,170 8,216Other payables 4,878 2,340 4,254 1,349Accrued interest payable 13,789 4,627 — —Due to other funds (Note 15) 218,922 94,612 112,694 69,053Advances from other funds (Note 15) 235,317 58,732 336,473 1,265Advances payable — 17 437 18Current portion of long-term liabilities (Note 11) 133,832 14,505 36,998 238,029
Total current liabilities 825,511 281,191 715,624 361,880Noncurrent liabilities:
Accrued compensated absences (Note 11) 67,118 36,267 87,408 17,109Bonds and notes (Note 11) 493,398 190,836 — —Premiums on bonds and notes payable (Note 11) 15,846 13,013 — —Capital lease obligations (Notes 10 and 11) 18 74 — —Workers' compensation (Notes 11 and 18) 100,124 40,271 149,566 29,620Litigation and self-insurance (Notes 11 and 18) 8,578 8,947 38,167 100Net pension liability (Notes 8 and 11) 478,407 310,986 644,171 133,205Net OPEB liability (Notes 9 and 11) 1,216,180 809,347 1,807,930 360,859Third party payor (Notes 11 and 14) 164,443 76,203 257,619 47,724
Total noncurrent liabilities 2,544,112 1,485,944 2,984,861 588,617TOTAL LIABILITIES 3,369,623 1,767,135 3,700,485 950,497DEFERRED INFLOWS OF RESOURCES (Note 20) 271,329 181,641 403,952 103,572NET POSITIONNet investment in capital assets 246,945 (46,460) 850,627 213,272Restricted:
Debt service 2,809 9,058 — —Public ways and facilities — — — —
Unrestricted (deficit) (1,637,193) (1,000,806) (2,195,466) (525,620)TOTAL NET POSITION (DEFICIT) (Note 3) $ (1,387,439) (1,038,208) (1,344,839) (312,348)
The notes to the basic financial statements are an integral part of this statement.
42

ENTERPRISE FUNDSGOVERNMENTAL
ACTIVITIES
WaterworksFunds
NonmajorAviationFunds Total
Internal Service Funds
ASSETSCurrent assets:
Pooled cash and investments: (Notes 1 and 5)$ 116,285 11,379 $ 164,202 $ 39,608 Operating
2,118 176 30,563 9,212 Other118,403 11,555 194,765 48,820 Total pooled cash and investments
727 — 727 Taxes receivable13,270 1,210 2,443,417 Accounts receivable - net (Note 14)
322 29 591 153 Interest receivable— — 68,788 8,788 Other receivables
2,242 39 473,256 120,838 Due from other funds (Note 15)1,368 — 1,368 Advances to other funds (Note 15)
— — 25,114 10,220 Inventories136,332 12,833 3,208,026 188,819 Total current assets
Noncurrent assets:— — 106,164 14,869 Restricted assets (Note 5)— 452,874 Other receivables (Note 14)
Capital assets: (Notes 1, 6 and 10)11,898 134,692 166,566 — Land and easements
119,091 42,227 2,669,414 — Buildings and improvements1,525 1,465 395,925 291,302 Equipment1,322 58,922 Intangible - software
1,211,358 69,766 1,281,124 — Infrastructure35,857 1,119 298,181 — Construction in progress
(705,396) (71,347) (1,802,902) (149,088) Less accumulated depreciation675,655 177,922 3,067,230 142,214 Total capital assets - net675,655 177,922 3,626,268 157,083 Total noncurrent assets811,987 190,755 6,834,294 345,902 TOTAL ASSETS
— — 833,848 173,280 DEFERRED OUTFLOWS OF RESOURCES (Note 20)LIABILITIESCurrent liabilities:
5,253 301 509,640 10,126 Accounts payable— 97,979 21,300 Accrued payroll— 47 12,868 2,969 Other payables— 20 18,436 785 Accrued interest payable
7,532 1,047 503,860 43,834 Due to other funds (Note 15)— — 631,787 22,000 Advances from other funds (Note 15)25 497 3,922 Advances payable
1,255 104 424,723 36,147 Current portion of long-term liabilities (Note 11)14,065 1,519 2,199,790 141,083 Total current liabilities
Noncurrent liabilities:— — 207,902 57,640 Accrued compensated absences (Note 11)
6,736 1,510 692,480 30,615 Bonds and notes (Note 11)— 28,859 Premiums on bonds and notes payable (Note 11)— 92 — Capital lease obligations (Notes 10 and 11)— 319,581 50,536 Workers' compensation (Notes 11 and 18)
774 — 56,566 — Litigation and self-insurance (Notes 11 and 18)— 1,566,769 332,054 Net pension liability (Notes 8 and 11)— 4,194,316 877,840 Net OPEB liability (Notes 9 and 11)— 545,989 Third party payor (Notes 11 and 14)
7,510 1,510 7,612,554 1,348,685 Total noncurrent liabilities21,575 3,029 9,812,344 1,489,768 TOTAL LIABILITIES
— — 960,494 204,029 DEFERRED INFLOWS OF RESOURCES (Note 20)NET POSITION
668,724 176,308 2,109,416 107,138 Net investment in capital assetsRestricted:
— — 11,867 5,131 Debt service121,688 121,688 Public ways and facilities
— 11,418 (5,347,667) (1,286,884) Unrestricted (deficit)$ 790,412 187,726 (3,104,696) $ (1,174,615) TOTAL NET POSITION (DEFICIT) (Note 3)
1,226 Adjustment to reflect the consolidation of internal service fund activities relatedto enterprise funds
$ (3,103,470) NET POSITION (DEFICIT) OF BUSINESS-TYPE ACTIVITIES (PAGE 25)
43

COUNTY OF LOS ANGELESSTATEMENT OF REVENUES, EXPENSES AND CHANGES IN FUND NET POSITIONPROPRIETARY FUNDSFOR THE YEAR ENDED JUNE 30, 2019 (in thousands)
BUSINESS-TYPE ACTIVITIES -Harbor-UCLA
MedicalCenter
Olive View-UCLA Medical
Center
LAC+USCMedicalCenter
Rancho LosAmigos NationalRehab Center
OPERATING REVENUES:Net patient service revenues (Note 14) $ 1,150,236 527,859 1,483,845 275,116Rentals — — — —Charges for services — — — —Other (Note 14) 199,248 64,351 189,543 34,928
TOTAL OPERATING REVENUES 1,349,484 592,210 1,673,388 310,044
OPERATING EXPENSES:Salaries and employee benefits 747,682 405,898 1,015,833 196,998Services and supplies 199,347 69,894 254,974 39,973Other professional services 222,979 129,939 382,949 56,262Depreciation and amortization (Note 6) 27,077 21,326 27,253 7,486Medical malpractice — 8,269 — 294Rent 3,437 1,315 2,806 —
TOTAL OPERATING EXPENSES 1,200,522 636,641 1,683,815 301,013
OPERATING INCOME (LOSS) 148,962 (44,431) (10,427) 9,031
NONOPERATING REVENUES (EXPENSES):Taxes — — — —Investment income 677 743 872 287Gain (loss) on capital assets (15,549) (151,349) (7,972) 2Interest expense (34,818) (10,128) (1,926) (3,030)Intergovernmental transfers expense (Note 14) (325,122) (117,520) (369,607) (148,156)Intergovernmental revenues-
State — — — —TOTAL NONOPERATING REVENUES (EXPENSES) (374,812) (278,254) (378,633) (150,897)
LOSS BEFORE CONTRIBUTIONS AND TRANSFERS (225,850) (322,685) (389,060) (141,866)
Capital contributions 765 5 — 16Transfers in (Note 15) 130,992 53,617 593,533 89,637Transfers out (Note 15) (830) (10,476) (5,047) (5,094)
CHANGE IN NET POSITION (94,923) (279,539) 199,426 (57,307)
NET POSITION (DEFICIT), JULY 1, 2018 (1,292,516) (758,669) (1,544,265) (255,041)
NET POSITION (DEFICIT), JUNE 30, 2019 $ (1,387,439) (1,038,208) (1,344,839) (312,348)
The notes to the basic financial statements are an integral part of this statement.
44

ENTERPRISE FUNDSGOVERNMENTAL
ACTIVITIES
WaterworksFunds
NonmajorAviationFunds Total
Internal Service Funds
OPERATING REVENUES:$ $ 3,437,056 $ Net patient service revenues (Note 14)
— 4,240 4,240 27,288 Rentals84,748 480 85,228 593,009 Charges for services
24 12 488,106 Other (Note 14)
84,772 4,732 4,014,630 620,297 TOTAL OPERATING REVENUES
OPERATING EXPENSES:
— 2,366,411 508,459 Salaries and employee benefits78,436 3,239 645,863 50,577 Services and supplies
2,428 483 795,040 44,883 Other professional services23,877 2,182 109,201 34,379 Depreciation and amortization (Note 6)
— 8,563 Medical malpractice
— 7,558 Rent
104,741 5,904 3,932,636 638,298 TOTAL OPERATING EXPENSES
(19,969) (1,172) 81,994 (18,001) OPERATING INCOME (LOSS)
NONOPERATING REVENUES (EXPENSES):6,504 — 6,504 Taxes3,732 264 6,575 1,117 Investment income
(174,868) Gain (loss) on capital assets(165) (50) (50,117) (1,908) Interest expense
— (960,405) Intergovernmental transfers expense (Note 14)Intergovernmental revenues-
1,490 40 1,530 State
11,561 254 (1,170,781) (791) TOTAL NONOPERATING REVENUES (EXPENSES)
(8,408) (918) (1,088,787) (18,792) LOSS BEFORE CONTRIBUTIONS AND TRANSFERS
56 3,794 4,636 Capital contributions— — 867,779 19,304 Transfers in (Note 15)
(1,696) (143) (23,286) (3,981) Transfers out (Note 15)
(10,048) 2,733 (239,658) (3,469) CHANGE IN NET POSITION
800,460 184,993 (1,171,146) NET POSITION (DEFICIT), JULY 1, 2018
$ 790,412 187,726 $ (1,174,615) NET POSITION (DEFICIT), JUNE 30, 2019
4,448Adjustment to reflect the consolidation of internal service fund activities related to enterprise funds
$ (235,210)CHANGE IN NET POSITION OF BUSINESS-TYPE ACTIVITIES (PAGE 27)
45

COUNTY OF LOS ANGELESSTATEMENT OF CASH FLOWSPROPRIETARY FUNDSFOR THE YEAR ENDED JUNE 30, 2019 (in thousands)
BUSINESS-TYPE ACTIVITIES -Harbor-UCLA
MedicalCenter
Olive View-UCLA Medical
Center
LAC+USCMedicalCenter
Rancho LosAmigos NationalRehab Center
CASH FLOWS FROM OPERATING ACTIVITIESCash received from patient services $ 853,930 469,811 895,906 325,338Rentals receivedRentals received from other fundsCash received from charges for servicesOther operating revenues 199,248 64,351 189,543 34,928Cash received for services provided to other funds 19,779 33,080 30,712 320Cash paid for salaries and employee benefits (710,753) (387,655) (964,312) (188,093)Cash (paid) returned for services and supplies (5,759) 30,127 (12,244) (747)Other operating expenses (231,790) (131,784) (396,889) (56,425)Cash (paid) returned for services from other funds 53,242 27,485 (144,387) 22,804
Net cash provided by (required for) operating activities 177,897 105,415 (401,671) 138,125
CASH FLOWS FROM NONCAPITAL FINANCING ACTIVITIESCash advances received from other funds 1,009,055 393,890 1,531,967 228,553Cash advances paid/returned to other funds (866,544) (337,754) (1,202,490) (249,515)Interest paid on advances (2,383) (547) (1,926) (297)Intergovernmental transfers (325,122) (117,520) (369,607) (148,156)Intergovernmental receipts — — — —Transfers in 55,902 (21,673) 419,333 80,060Transfers out (830) (10,476) (5,047) (5,094)
Net cash provided by (required for) noncapital financing activities (129,922) (94,080) 372,230 (94,449)
CASH FLOWS FROM CAPITAL AND RELATED FINANCINGACTIVITIESProceeds from taxesCapital contributions — — — —Proceeds from bonds and notes 89,572 — — 233,573Interest paid on capital borrowing (33,323) (10,196) — (2,733)Principal payments on bonds and notes (68,755) (4,484) — (192,770)Principal payments on capital leases (42) (28) — —Acquisition and construction of capital assets (25,039) (30,388) (5,100) (35,330)
Net cash provided by (required for) capital and related financing activities (37,587) (45,096) (5,100) 2,740
CASH FLOWS FROM INVESTING ACTIVITIESInvestment income 674 716 869 233
Net increase (decrease) in cash and cash equivalents 11,062 (33,045) (33,672) 46,649
Cash and cash equivalents, July 1, 2018 61,348 54,091 47,208 17,330
Cash and cash equivalents, June 30, 2019 $ 72,410 21,046 13,536 63,979
The notes to the basic financial statements are an integral part of this statement.
46

ENTERPRISE FUNDSGOVERNMENTAL
ACTIVITIES
WaterworksFunds
NonmajorAviationFunds Total
Internal Service Funds
CASH FLOWS FROM OPERATING ACTIVITIES$ $ 2,544,985 $ Cash received from patient services
— 4,240 4,240 51 Rentals received25,103 Rentals received from other funds
84,935 4,320 89,255 37,917 Cash received from charges for services24 12 488,106 Other operating revenues
83,891 533,587 Cash received for services provided to other funds— (2,250,813) (482,474) Cash paid for salaries and employee benefits
(76,778) (3,456) (68,857) (45,322) Cash (paid) returned for services and supplies(2,244) (483) (819,615) (44,883) Other operating expenses
— (40,856) Cash (paid) returned for services from other funds
5,937 4,633 30,336 23,979 Net cash provided by (required for) operating activities
CASH FLOWS FROM NONCAPITAL FINANCING ACTIVITIES1 — 3,163,466 — Cash advances received from other funds
(33) — (2,656,336) (4,998) Cash advances paid/returned to other funds— (5,153) Interest paid on advances— (960,405) Intergovernmental transfers
1,490 40 1,530 — Intergovernmental receipts— — 533,622 19,304 Transfers in
(1,696) (143) (23,286) (3,981) Transfers out
(238) (103) 53,438 10,325 Net cash provided by (required for) noncapital financing activities
CASH FLOWS FROM CAPITAL AND RELATED FINANCINGACTIVITIES
6,494 — 6,494 Proceeds from taxes— 3,794 3,794 — Capital contributions— — 323,145 30,000 Proceeds from bonds and notes
(165) (51) (46,468) (1,465) Interest paid on capital borrowing(384) (101) (266,494) (19,545) Principal payments on bonds and notes
(70) — Principal payments on capital leases(3,438) (3,913) (103,208) (48,912) Acquisition and construction of capital assets
2,507 (271) (82,807) (39,922) Net cash provided by (required for) capital and related financing activities
CASH FLOWS FROM INVESTING ACTIVITIES3,679 255 6,426 1,119 Investment income
11,885 4,514 7,393 (4,499) Net increase (decrease) in cash and cash equivalents
106,518 7,041 293,536 68,188 Cash and cash equivalents, July 1, 2018
$ 118,403 11,555 $ 300,929 $ 63,689 Cash and cash equivalents, June 30, 2019
Continued…
47

COUNTY OF LOS ANGELESSTATEMENT OF CASH FLOWS - ContinuedPROPRIETARY FUNDSFOR THE YEAR ENDED JUNE 30, 2019 (in thousands)
BUSINESS-TYPE ACTIVITIES -Harbor-UCLA
MedicalCenter
Olive View-UCLA Medical
Center
LAC+USCMedicalCenter
Rancho LosAmigos NationalRehab Center
RECONCILIATION OF OPERATING INCOME (LOSS) TO NET CASHPROVIDED BY (REQUIRED FOR) OPERATING ACTIVITIES:Operating income (loss) $ 148,962 (44,431) (10,427) 9,031Adjustments to reconcile operating income (loss) to net cash provided
by (required for) operating activities:Depreciation and amortization 27,077 21,326 27,253 7,486
(Increase) decrease in:Accounts receivable - net (103,707) 33,089 (180,423) 44,391Other receivables (124,965) (29,800) (146,346) (12,189)Due from other funds 29,572 1,130 (147,410) 14,598Inventories 919 1,052 561 (120)
Increase (decrease) in:Accounts payable 39,832 5,477 46,429 10,013Accrued payroll (2,140) (3,189) (1,436) 400Other payables 17 (20) 12 16Accrued compensated absences (965) (4,045) (1,378) 1,298Due to other funds 207,042 121,204 52,525 52,376Workers' compensation 2,892 1,905 4,757 887Litigation and self-insurance (5,164) 7,739 (11,134) 131Net pension liability and related changes in deferred outflows andinflows of resources (7,193) (5,110) (10,930) (2,981)Net OPEB liability and related changes in deferred outflows andinflows of resources 41,172 28,475 59,324 9,046Third party payor (75,454) (29,387) (83,048) 3,742
TOTAL ADJUSTMENTS 28,935 149,846 (391,244) 129,094
NET CASH PROVIDED BY (REQUIRED FOR) OPERATING ACTIVITIES $ 177,897 105,415 (401,671) 138,125
SCHEDULE OF NONCASH INVESTING, CAPITAL AND FINANCINGACTIVITIES:
Contributions of capital assets $ 765 5 — 16Gain (loss) on disposal of capital assets (15,549) (151,349) (7,972) 2
TOTAL $ (14,784) (151,344) (7,972) 18
RECONCILIATION OF CASH AND CASH EQUIVALENTS TO THESTATEMENT OF NET POSITION:Pooled cash and investments $ 10,970 5,453 13,536 34,848Restricted assets 61,440 15,593 — 29,131
TOTAL $ 72,410 21,046 13,536 63,979
The notes to the basic financial statements are an integral part of this statement.
48

ENTERPRISE FUNDSGOVERNMENTAL
ACTIVITIES
WaterworksFunds
NonmajorAviationFunds Total
Internal Service Funds
RECONCILIATION OF OPERATING INCOME (LOSS) TO NET CASHPROVIDED BY (REQUIRED FOR) OPERATING ACTIVITIES:
$ (19,969) (1,172) $ 81,994 $ (18,001) Operating income (loss)Adjustments to reconcile operating income (loss) to net cash provided
by (required for) operating activities:23,877 2,182 109,201 34,379 Depreciation and amortization
(Increase) decrease in:912 3,721 (202,017) Accounts receivable - net
— — (313,300) (316) Other receivables(725) 119 (102,716) (22,909) Due from other funds
— — 2,412 (1,602) InventoriesIncrease (decrease) in:
(66) (325) 101,360 924 Accounts payable(6,365) 1,042 Accrued payroll
— 2 27 77 Other payables— — (5,090) 1,494 Accrued compensated absences
1,724 106 434,977 5,933 Due to other funds10,441 1,489 Workers' compensation
184 — (8,244) — Litigation and self-insurance
(26,214) (6,429)Net pension liability and related changes in deferred outflows andinflows of resources
138,017 27,898Net OPEB liability and related changes in deferred outflows andinflows of resources
(184,147) Third party payor
25,906 5,805 (51,658) 41,980 TOTAL ADJUSTMENTS
$ 5,937 4,633 $ 30,336 $ 23,979 NET CASH PROVIDED BY (REQUIRED FOR) OPERATING ACTIVITIES
SCHEDULE OF NONCASH INVESTING, CAPITAL AND FINANCINGACTIVITIES:
$ 56 — $ 842 $ Contributions of capital assets(174,868) Gain (loss) on disposal of capital assets
$ 56 $ (174,026) $ TOTAL
RECONCILIATION OF CASH AND CASH EQUIVALENTS TO THESTATEMENT OF NET POSITION:
$ 118,403 11,555 $ 194,765 $ 48,820 Pooled cash and investments106,164 14,869 Restricted assets
$ 118,403 11,555 $ 300,929 $ 63,689 TOTAL
49

COUNTY OF LOS ANGELESSTATEMENT OF FIDUCIARY NET POSITIONFIDUCIARY FUNDSJUNE 30, 2019 (in thousands)
PENSION AND OTHERPOSTEMPLOYMENT
BENEFIT TRUST FUNDSINVESTMENT
TRUST FUNDSAGENCY FUNDS
ASSETSPooled cash and investments (Note 5) $ 96,221 $ 20,529,670 $ 1,953,762Other investments: (Note 5) — 165,487 300
Short-term investments 1,322,051Equity 26,460,105 —Fixed income 18,508,520 —Private equity 6,028,265 —Real estate 6,312,866 —Hedge funds 1,890,739 —Cash collateral on loaned securities 814,829 —
Taxes receivable — 259,974Interest receivable 102,850 49,019 122,425Other receivables 1,057,959 — —TOTAL ASSETS 62,594,405 20,744,176 2,336,461
LIABILITIESAccounts payable 2,162,819 —Other payables (Note 5) 898,273 — —Due to other governments — 2,336,461
TOTAL LIABILITIES 3,061,092 2,336,461
NET POSITIONNet position restricted for pension benefits and otherpurposes $ 59,533,313 $ 20,744,176 $
The notes to the basic financial statements are an integral part of this statement.
50

COUNTY OF LOS ANGELESSTATEMENT OF CHANGES IN FIDUCIARY NET POSITIONFIDUCIARY FUNDSFOR THE YEAR ENDED JUNE 30, 2019 (in thousands)
PENSION AND OTHERPOSTEMPLOYMENT
BENEFIT TRUST FUNDSINVESTMENT TRUST
FUNDSADDITIONSContributions:
Pension and OPEB trust contributions:Employer $ 2,531,179 $Member 683,215
Contributions to investment trust funds — 47,849,861Total contributions 3,214,394 47,849,861
Investment earnings:Investment income 2,194,924 590,202Net increase in the fair value of investments 1,272,295Securities lending income (Note 5) 26,146
Total investment earnings 3,493,365 590,202Less - Investment expenses:
Expense from investing activities 233,868 —Expense from securities lending activities (Note 5) 21,658 —
Total net investment expense 255,526Net investment earnings 3,237,839 590,202
Miscellaneous 5,958 —
TOTAL ADDITIONS 6,458,191 48,440,063
DEDUCTIONSAdministrative expenses:
Salaries and employee benefits 63,116Services and supplies 20,024
Total administrative expenses 83,140Benefit payments 4,053,703Distributions from investment trust funds — 48,510,285Miscellaneous 29,024
TOTAL DEDUCTIONS 4,165,867 48,510,285
CHANGE IN NET POSITION 2,292,324 (70,222)
NET POSITION, JULY 1, 2018 57,240,989 20,814,398
NET POSITION, JUNE 30, 2019 $ 59,533,313 $ 20,744,176
The notes to the basic financial statements are an integral part of this statement.
51

COUNTY OF LOS ANGELESSTATEMENT OF NET POSITIONDISCRETELY PRESENTED COMPONENT UNITSJUNE 30, 2019 (in thousands)
LOS ANGELESCOUNTY
DEVELOPMENTAUTHORITY FIRST 5 LA TOTAL
ASSETSPooled cash and investments-
Operating (Notes 1 and 5) $ 124,931 365,731 $ 490,662Other investments (Note 5) 420,934 — 420,934Accounts receivable - net 22,884 — 22,884Interest receivable — 608 608Other receivables 15,294 18,605 33,899Inventories 13,976 — 13,976Capital assets: (Notes 1, 6 and 10)
Capital assets, not being depreciated 92,339 2,039 94,378Capital assets, net of accumulated depreciation 80,080 8,802 88,882
Total capital assets 172,419 10,841 183,260TOTAL ASSETS 770,438 395,785 1,166,223DEFERRED OUTFLOWS OF RESOURCES 12,277 — 12,277LIABILITIES
Accounts payable 31,283 19,898 51,181Other payables 7,257 16 7,273Advances payable 5,775 — 5,775Long-term liabilities: (Note 11)
Due within one year 4,606 99 4,705Due in more than one year 84,628 592 85,220
TOTAL LIABILITIES 133,549 20,605 154,154DEFERRED INFLOWS OF RESOURCES 3,300 — 3,300NET POSITION
Net investment in capital assets 130,735 10,841 141,576Restricted for:
Debt service 363 363Community development 463,672 — 463,672First 5 LA — 364,339 364,339
Unrestricted 51,096 — 51,096TOTAL NET POSITION $ 645,866 375,180 $ 1,021,046
The notes to the basic financial statements are an integral part of this statement.
52

COUNTY OF LOS ANGELESSTATEMENT OF ACTIVITIESDISCRETELY PRESENTED COMPONENT UNITSFOR THE YEAR ENDED JUNE 30, 2019 (in thousands)
LOS ANGELESCOUNTY
DEVELOPMENTAUTHORITY FIRST 5 LA TOTAL
PROGRAM (EXPENSES) REVENUES:Expenses $ (529,734) (119,000) $ (648,734)Program revenues:
Charges for services 28,096 — 28,096Operating grants and contributions 604,744 90,900 695,644Capital grants and contributions 5,912 — 5,912
Net program (expenses) revenues 109,018 (28,100) 80,918
GENERAL REVENUES:Investment income 8,204 13,082 21,286Miscellaneous 1,551 133 1,684
Total general revenues 9,755 13,215 22,970
CHANGE IN NET POSITION 118,773 (14,885) 103,888
NET POSITION, JULY 1, 2018 527,093 390,065 917,158
NET POSITION, JUNE 30, 2019 $ 645,866 375,180 $ 1,021,046
The notes to the basic financial statements are an integral part of this statement.
53

54
COUNTY OF LOS ANGELESNOTES TO THE BASIC FINANCIAL STATEMENTS
FOR THE YEAR ENDED JUNE 30, 20191. SUMMARY OF SIGNIFICANT ACCOUNTING POLICIES
Reporting Entity
The County of Los Angeles (County), which was established in 1850, is a legal subdivision of the Stateof California (State) charged with general governmental powers. The County's powers are exercisedthrough an elected five member Board of Supervisors (Board), which, as the governing body of theCounty, is responsible for the legislative and executive control of the County. As required by generallyaccepted accounting principles (GAAP), these basic financial statements include both those of theCounty and its component units. The component units discussed below are included in the County’sreporting entity because of the significance of their operational or financial relationships with the County.
The basic financial statements include blended, fiduciary and discretely presented component units.The blended component units, although legally separate entities are, in substance, part of the County’soperations. The data from these units are combined with data of the primary government. The fiduciarycomponent unit is reported under Fiduciary Funds in the basic financial statements. The discretelypresented component units, on the other hand, are reported in a separate column in the government-wide financial statements.
Blended Component Units
While each of the component units is legally separate from the County, the County is financiallyaccountable for these entities. Financial accountability is primarily demonstrated by the County’s Boardacting as the governing board for each of the component units and its ability to impose its will or anexistence of a financial benefit/burden relationship. County management has determined that thefollowing related entities should be included in the basic financial statements as blended componentunits:
Fire Protection District Waterworks DistrictsFlood Control District Los Angeles County Capital Asset LeasingGarbage Disposal Districts Corporation (a Not-for-Profit Corporation) (NPC)Improvement Districts Various Joint Powers Authorities (JPAs)Regional Park and Open Space District Los Angeles County Securitization CorporationSewer Maintenance Districts (LACSC)Street Lighting Districts Los Angeles County Facilities Inc. (LACF)
The various districts are included primarily because the Board is also their governing board and the County has operational responsibilities for the districts. As such, the Board establishes policy, appoints management and exercises budgetary control. The NPC and JPAs have been included because their sole purpose is to finance and construct County capital assets and because they are dependent upon the County for funding.
The Los Angeles County Capital Asset Leasing Corporation (LACCAL) is organized as a not-for-profit corporation in which the primary government is the sole corporate member, as identified in LACCAL's articles of incorporation or bylaws, and the component unit is included in the financial reporting entity.
55

COUNTY OF LOS ANGELESNOTES TO THE BASIC FINANCIAL STATEMENTS
FOR THE YEAR ENDED JUNE 30, 20191. SUMMARY OF SIGNIFICANT ACCOUNTING POLICIES-Continued
Blended Component Units-Continued
The LACSC is a California public benefit corporation created by the County Board in January 2006.Three directors, the County’s Auditor-Controller, Treasurer and Tax Collector, and an independent partydesignated by at least one of the County directors, govern the LACSC. The LACSC purpose is toacquire the County’s rights in relation to future tobacco settlement payments and to facilitate the issuanceof long-term bonds secured by the County Tobacco Assets. The LACSC provides service solely to theCounty and is reported as a blended component unit of the County.
LACF is a California nonprofit pubic benefit corporation and an organization described under Section501(c)(3) of the Internal Revenue Code of 1986. It was formed on April 25, 2016. On July 26, 2018,LACF issued $302.38 million of lease revenue bonds to be used to finance the construction of theVermont Corridor County Administration Building and parking structure. LACF is reported as a blendedcomponent unit because it provides services solely to the County and it is fiscally dependent on theCounty. It is reported under Public Buildings Debt Service and Capital Projects funds.
Fiduciary Component Unit
The County pension plan is administered by the Los Angeles County Employees Retirement Association(LACERA), which was established under the County Employees' Retirement Law of 1937 (CERL).LACERA is a cost-sharing, multi-employer defined benefit plan. LACERA provides retirement, disability,death benefits and cost of living adjustments to eligible members. LACERA also administers a cost-sharing, multi-employer Other Postemployment Benefit (OPEB) or Retiree Healthcare Program onbehalf of the County. LACERA is reported in the Pension and OPEB Trust Funds on the Statement ofNet Position - Fiduciary Funds of the basic financial statements and has been included because itsoperations are dependent upon County funding and because its operations, almost exclusively, benefitthe County. LACERA issues a stand-alone financial report, which is available at its offices located atGateway Plaza, 300 N. Lake Avenue, Pasadena, California 91101-4199 or at www.LACERA.com.
Discretely Presented Component Units
Los Angeles County Development Authority (formerly Community Development Commission of theCounty of Los Angeles)
On May 16, 2019, the Community Development Commission/Housing Authority of the County of LosAngeles established on July 1, 1982 under the provisions of Section 34100-34160 of the Health andSafety Code of the State of California, was officially rebranded to the Los Angeles County DevelopmentAuthority (LACDA).
LACDA is responsible for:• Administering the Housing Choice Voucher and other Section 8 programs;• Directing the County’s housing programs, including planning, housing finance, production and
conservation, and management of the County’s public housing developments;• Financing community improvements such as resurfacing streets and rehabilitating homes and
businesses;• Providing economic development, business revitalization services, and comprehensive
planning systems for affordable housing; and• Developing housing, business, and industry in designated areas.
56

COUNTY OF LOS ANGELESNOTES TO THE BASIC FINANCIAL STATEMENTS
FOR THE YEAR ENDED JUNE 30, 20191. SUMMARY OF SIGNIFICANT ACCOUNTING POLICIES-Continued
Discretely Presented Component Units-Continued
Los Angeles County Development Authority (formerly Community Development Commission of theCounty of Los Angeles)-Continued
While its Board members are the same as the County Board, LACDA does not meet the criteria forblending due to the following: 1) there is no financial burden or benefit relationship with the County nordoes management of the County have operational responsibilities over it; 2) LACDA does not provideservices entirely or almost entirely to the County; and 3) LACDA's total debt outstanding is not expectedto be repaid with resources of the County. The financial activity of LACDA is reported within the DiscretelyPresented Component Units column of the government-wide financial statements. LACDA issues aseparate financial report that can be obtained at https://www.lacda.org/about-cdc/budget-and-financeor by writing to the Los Angeles County Development Authority at 700 W. Main Street, Alhambra,California 91801.
Los Angeles County Children and Families First - Proposition 10 Commission
Los Angeles County Children and Families First - Proposition 10 Commission, also known as First 5LA, was established by the County as a separate legal entity to administer the County's share of tobaccotaxes levied by the State pursuant to Proposition 10. The Board established First 5 LA with nine votingmembers and four non-voting representatives. Of the nine voting members, one is a member of theBoard of Supervisors, three are heads of County Departments (Public Health Services, Mental Health,and Children and Family Services), and five are public members appointed by the Board. The non-voting representatives are from other County commissions and planning groups.
First 5 LA services support programs and services for children ages prenatal through five, and theirfamilies, in the areas of health, safety, early education and literacy. First 5 LA is a discretely presentedcomponent unit of the County because the County’s Board appoints the voting Commissioners and theCounty has the ability to impose its will by removing those Commissioners at will. First 5 LA hires itsown employees, including an Executive Director and functions independent of the County. It is discretelypresented because its governing body is not substantially the same as the County's governing bodyand it does not provide services entirely or exclusively to the County. The financial activity of First 5LA is reported within the Discretely Presented Component Units column of the government-widefinancial statements. First 5 LA issues a separate financial report that can be obtained by writing toFirst 5 LA at 750 N. Alameda Street, Suite 300, Los Angeles, California 90012.
Related Organization
Los Angeles County Office of Education (LACOE) is a legally separate entity from the County. LACOEis governed by a seven-member Board of Education appointed by the County Board. However, theCounty’s accountability for LACOE does not extend beyond making appointments and no financialbenefit/burden relationship exists between the County and LACOE. LACOE is deemed to be a relatedorganization. LACOE issues a separate financial report that can be obtained by writing to the LosAngeles County Office of Education at 9300 Imperial Highway, Downey, California 90242-2890.
57

COUNTY OF LOS ANGELESNOTES TO THE BASIC FINANCIAL STATEMENTS
FOR THE YEAR ENDED JUNE 30, 20191. SUMMARY OF SIGNIFICANT ACCOUNTING POLICIES-Continued
Basic Financial Statements
In accordance with Governmental Accounting Standards Board Statement (GASB) 34, "Basic FinancialStatements - and Management's Discussion and Analysis - for State and Local Governments," the basicfinancial statements consist of the following:
• Government-wide financial statements;• Fund financial statements; and• Notes to the basic financial statements.
Government-wide Financial Statements
The statement of net position and statement of activities display information about the primary government, the County, and its blended and discretely presented component units. These statements include the financial activities of the overall government, except for fiduciary activities. Eliminations have been made to minimize the double counting of internal activities, except for services provided among funds (other than internal service funds). These statements distinguish between the governmental and business-type activities of the County and between the County and its discretely presented component units.
Governmental activities, which normally are supported by taxes and intergovernmental revenues, are reported separately from business-type activities, which rely to a significant extent on fees charged to external parties.
The statement of activities presents a comparison between direct expenses and program revenues for each segment of the business-type activities of the County and for each function of the County’s governmental activities. Direct expenses are those that are specifically associated with a program or function and, therefore, are clearly identifiable to a particular function. Program revenues include charges paid by the recipients of goods or services offered by the programs. Grants and contributions that are restricted to meeting the operational or capital requirements of a particular program are also recognized as program revenues. Revenues that are not classified as program revenues, including all taxes, are presented instead as general revenues.
Net position is classified into the following three components: 1) net investment in capital assets; 2) restricted; and 3) unrestricted. Net position is reported as restricted when it has external restrictions imposed by creditors, grantors, or laws or regulations of other governments and restrictions imposed by law through constitutional provisions or enabling legislation. At June 30, 2019, the restricted net position balances were $3.811 billion and $138.69 million for governmental activities and business-type activities, respectively. For governmental activities, $602.37 million was restricted by enabling legislation.
When both the restricted and unrestricted components of net position are available, restricted resources are used first and then unrestricted resources are used to the extent necessary.
58

COUNTY OF LOS ANGELESNOTES TO THE BASIC FINANCIAL STATEMENTS
FOR THE YEAR ENDED JUNE 30, 20191. SUMMARY OF SIGNIFICANT ACCOUNTING POLICIES-Continued
Fund Financial Statements
The fund financial statements provide information about the County’s funds, including fiduciary fundsand blended component units. Separate statements for each fund category - governmental, proprietary,and fiduciary are presented. The emphasis of fund financial statements is on major governmental andenterprise funds, each displayed in a separate column. All remaining governmental and enterprisefunds are separately aggregated and reported as nonmajor funds.
In accordance with GAAP, the County reports on each major fund. By definition, the general fund isalways considered a major fund. Funds other than the general fund must be reported as major fundsif they meet both the ten percent and five percent criterion, defined respectively, 1) an individual fundreports at least ten percent of any of the following: a) total fund assets and deferred outflows of resources,b) total fund liabilities and deferred inflows of resources, c) total fund revenues, or d) total fundexpenditures/expenses; 2) an individual fund reports at least five percent of the aggregated total forboth governmental funds and enterprise funds of any one of the items for which it met the ten percentcriterion. In addition, a fund may be reported as major if it is believed to be of particular importance tofinancial statement users.
The County reports the following major governmental funds:
General FundThe General Fund is available for any authorized purpose and is used to account for and report all financial resources not accounted for and reported in another fund.
Fire Protection District FundThe Fire Protection District Fund is used to account for fire prevention and suppression, rescue service, management of hazardous materials incidents, ocean lifeguard services, and acquisition and maintenance of the Fire Protection District property and equipment. Funding comes primarily from the Fire Protection District’s statutory share of the Countywide tax levy, voter-approved taxes and charges for services.
Flood Control District FundThe Flood Control District provides flood protection services that incorporate an integrated water resource management approach in providing flood protection; increases local water availability through conservation efforts; increases stormwater capture and reduces stormwater and urban runoff pollution; and provides passive recreational opportunities. The primary sources of revenue for the Flood Control District are property taxes and benefit assessments (charges for services).
LA County Library FundThe LA County Library Fund is used to account for free library services to the unincorporated areas of the County and to cities that contract for these services. Funding comes primarily from the District’s statutory share of the Countywide tax levy and voter-approved taxes.
Regional Park and Open Space District FundThe Regional Park and Open Space District Fund is used to account for the programs designed to preserve beaches, parks, and wild lands, to acquire and renovate new and existing recreational facilities, and to restore rivers, streams, and trails in the County. Funding comes primarily from voter-approved special taxes, benefit assessments (charges for services) and long-term debt proceeds.
59

COUNTY OF LOS ANGELESNOTES TO THE BASIC FINANCIAL STATEMENTS
FOR THE YEAR ENDED JUNE 30, 20191. SUMMARY OF SIGNIFICANT ACCOUNTING POLICIES-Continued
Fund Financial Statements-Continued
Mental Health Services Act FundThe Mental Health Services Act (MHSA) Fund is used to account for the County's mental health delivery system for children, transition age youth, adults, older adults, and families. Revenues are derived primarily by the passage of State Proposition 63 in November 2004. Proposition 63 generates mental health revenue through a one percent income surcharge on individuals with State taxable incomes over $1.00 million.
The County's four Hospital Funds and Waterworks Funds are all considered major funds for presentation purposes. There is one nonmajor enterprise fund (Aviation Funds). The Hospital Enterprise funds provide health services to County residents. Revenues are principally patient service fees. Subsidies are also received from the General Fund. The Waterworks Enterprise Funds provide water services to County residents. Revenues are derived primarily from the sale of water and water service standby charges. The Aviation Enterprise Funds provide airport services for five County airports. Revenues are derived primarily from airport charges and rentals. A description of each Enterprise Fund is provided below:
Harbor-UCLA Medical CenterThe Harbor-UCLA Medical Center (H-UCLA) provides acute and intensive care unit medical/surgical inpatient and outpatient services, trauma and emergency room services, acute psychiatric services, pediatric and obstetric services, and transplants.
Olive View-UCLA Medical CenterThe Olive View-UCLA Medical Center (OV-UCLA) provides acute and intensive care, emergency services, medical/surgical inpatient and outpatient health care services, obstetric and gynecological services, and psychiatric services.
LAC+USC Medical CenterThe LAC+USC Medical Center (LAC+USC) provides acute and intensive care unit medical/surgical inpatient and outpatient services, trauma and emergency room services, a burn center, psychiatric services, renal dialysis, AIDS services, pediatric and obstetric services, and communicable disease services.
Rancho Los Amigos National Rehabilitation CenterThe Rancho Los Amigos National Rehabilitation Center (Rancho) specializes in the rehabilitation for victims of spinal cord injuries and strokes, pathokinesiology and polio services, services for liver diseases, pediatrics, ortho diabetes, dentistry, and neuro-science.
Waterworks FundsThe Waterworks Enterprise funds are used to account for the administration, maintenance, operation and improvement of district water systems.
Aviation FundsThe Aviation Enterprise Funds are used to account for the administration, maintenance, operation and improvement of the five airports which are owned by the County.
60

COUNTY OF LOS ANGELESNOTES TO THE BASIC FINANCIAL STATEMENTS
FOR THE YEAR ENDED JUNE 30, 20191. SUMMARY OF SIGNIFICANT ACCOUNTING POLICIES-Continued
Fund Financial Statements-Continued
The following fund types have also been reported:
Internal Service FundsThe Internal Service Funds are used to account for the financing of services provided by a department or agency to other departments or agencies on a cost-reimbursement basis. The County's principal Internal Service Fund is used to account for the cost of services provided by the Department of Public Works to various other County funds and agencies.
Fiduciary Fund Types
Pension and Other Postemployment Benefits Trust FundsThe Pension Trust Fund is used to account for financial activities of the County’s Pension Plan administered by LACERA.
The OPEB Trust Fund is used to account for the financial activities of the OPEB trust for the purpose of holding and investing assets to pre-fund the Retiree Health Program administered by LACERA.
Investment Trust FundsThe Pooled Investment Trust Fund is used to account for the net position of the County's external investment pool.
The Specific Investment Trust Fund is used to account for the net position of individual investment accounts, in aggregate. The related investment activity occurs separately from the County’s investment pool and is provided as a service to external investors.
Agency FundsThe Agency Funds are used primarily to account for assets held by the County in an agency capacity pending transfer or distribution to individuals, private organizations, other governmental entities, and other funds. Such funds have no equity accounts since all assets are due to individuals or entities at some future time. These funds (including property taxes and departmental funds) account for assets held by the County in an agency capacity for individuals or other government units.
Basis of Accounting
The government-wide, proprietary, pension and other postemployment benefits, and investment trust funds financial statements are reported using the economic resources measurement focus and the accrual basis of accounting. Revenues are recorded when earned and expenses are recorded at the time liabilities are incurred, regardless of when the related cash flows take place. Nonexchange transactions, in which the County gives (or receives) value without directly receiving (or giving) equal value in exchange, include property and sales taxes, grants, entitlements and donations. On an accrual basis, revenue from property taxes is recognized in the fiscal year for which the taxes are levied. Revenues from grants and similar items are recognized in the fiscal year in which all eligibility requirements have been satisfied.
61

COUNTY OF LOS ANGELESNOTES TO THE BASIC FINANCIAL STATEMENTS
FOR THE YEAR ENDED JUNE 30, 20191. SUMMARY OF SIGNIFICANT ACCOUNTING POLICIES-Continued
Basis of Accounting-Continued
Governmental funds are reported using the current financial resources measurement focus and themodified accrual basis of accounting. Under this method, revenues are recognized when measurableand available. The County considers revenues to be available if collectible within one year after year-end, except for property taxes, which are considered available to the extent that they are collectiblewithin 60 days after year-end. When property taxes are measurable but not available, the collectibleportion (taxes levied less estimated uncollectibles) is recorded as deferred inflows of resources in theperiod when an enforceable legal claim to the assets arises. Expenditures are generally recorded whena liability is incurred, as under accrual accounting. However, debt service expenditures, as well asexpenditures related to compensated absences and claims (including workers’ compensation) andjudgments are recorded only when payment is due. General capital asset acquisitions are reported asexpenditures in governmental funds. Proceeds of long-term debt and capital lease obligations arereported as other financing sources.
For the governmental funds financial statements, revenues are recorded when they are susceptible toaccrual. Specifically, ad valorem property taxes (except for redevelopment agency dissolution), salestaxes, investment income (loss), charges for services, and other miscellaneous revenue are allconsidered to be susceptible to accrual and have been recognized as revenue in the current fiscalperiod. Entitlements and shared revenues are recorded at the time of receipt or earlier if the susceptibleto accrual criteria are met. Expenditure-driven grants are recognized as revenue when the qualifyingexpenditures have been incurred and all other eligibility requirements have been met and are recordedat the time of receipt or earlier, if the susceptible to accrual criteria are met. When all eligibilityrequirements are met, except for the timing requirements, a deferred inflow of resources is reporteduntil the time requirements have passed. All other revenues are not considered susceptible to accrualand are recognized when received, including property tax revenues derived from redevelopment agencydissolution.
Proprietary funds distinguish operating revenues and expenses from nonoperating items. Operatingrevenues and expenses generally result from providing services and producing and delivering goodsin connection with a proprietary fund’s principal ongoing operations. The principal operating revenuesof the County’s four Hospital Enterprise Funds (Hospitals) are from patient services. The principaloperating revenues for the Waterworks Enterprise Funds are from charges for services. The principaloperating revenues for the Nonmajor Aviation Enterprise Funds and Internal Service Funds are chargesfor services and rental revenues. Operating expenses for all Enterprise Funds and the Internal ServiceFunds include the cost of sales and services, administrative expenses and depreciation on capitalassets. Medical malpractice expenses, which are self-insured, are classified as operating expensesof the Hospitals. All other revenues and expenses not meeting this definition are reported asnonoperating items. As discussed in Note 14, intergovernmental transfer payments are recorded in theHospitals and this item is classified as a nonoperating expense.
Agency funds do not have a measurement focus because they report only assets and liabilities. Theydo, however, use the accrual basis of accounting to recognize receivables and payables.
62

COUNTY OF LOS ANGELESNOTES TO THE BASIC FINANCIAL STATEMENTS
FOR THE YEAR ENDED JUNE 30, 20191. SUMMARY OF SIGNIFICANT ACCOUNTING POLICIES-Continued
Budgetary Data
In accordance with the provisions of Sections 29000-29144 of the Government Code of the State ofCalifornia (Government Code), commonly known as the County Budget Act, the County prepares andadopts a budget on or before October 2 for each fiscal year. Budgets are adopted for the majorgovernmental funds and certain nonmajor governmental funds on a basis of accounting that is differentfrom GAAP. Annual budgets were not adopted for the JPAs, Public Buildings and the LACSC debtservice funds, the capital project funds and the permanent funds.
The County budget is organized by budget unit and by expenditure object. Budget units are establishedat the discretion of the Board. Within the General Fund (with certain exceptions), budget units aregenerally defined as individual departments. For other funds, each individual fund constitutes a budgetunit. Expenditures are controlled at the object level for all budget units within the County, except forcapital asset expenditures, which are controlled at the sub-object level. The total budget exceeds$34.461 billion and is currently controlled through the use of approximately 500 separate budget units.There were no excesses of expenditures over the related appropriations within any fund for the yearended June 30, 2019. The County prepares a separate budgetary document, the County Budget, whichdemonstrates legal compliance with budgetary control. This document is made available to the publicon the County’s website at https://ceo.lacounty.gov/budget, or can be obtained from the Auditor-Controller’s office.
Transfers of appropriations between budget units must be approved by the Board. Supplementalappropriations financed by unanticipated revenue during the year must also be approved by the Board.Transfers of appropriations between objects of expenditure within the same budget unit must beapproved by the Board or the Chief Executive Office, depending upon the amount transferred. Theoriginal and final budget amounts are reported in the accompanying basic financial statements. Anyexcess of budgetary expenditures and other financing uses over revenues and other financing sourcesis financed by beginning available fund balances as provided for in the County Budget Act.
Note 16 describes the differences between the budgetary basis of accounting and GAAP. A reconcilingschedule is also presented for the major governmental funds.
Property Taxes
All jurisdictions within California derive their taxing authority from the State Constitution and variouslegislative provisions contained in the Government Code and Revenue and Taxation Code. Propertyis assessed at 100% of full cash or market value (with some exceptions) pursuant to Article XIIIA of theCalifornia State Constitution and statutory provisions by the County Assessor and State Board ofEqualization. The total Fiscal Year (FY) 2018-2019 assessed valuation of the County approximated$1.530 trillion.
The property tax levy to support general operations of the various jurisdictions is limited to one percent(1%) of full cash value and is distributed in accordance with statutory formulae. Amounts needed tofinance the annual requirements of voter-approved debt are excluded from this limitation and areseparately calculated and levied each fiscal year. The rates are formally adopted by either the Boardor the city councils and, in some instances, the governing board of a special district.
63

COUNTY OF LOS ANGELESNOTES TO THE BASIC FINANCIAL STATEMENTS
FOR THE YEAR ENDED JUNE 30, 20191. SUMMARY OF SIGNIFICANT ACCOUNTING POLICIES-Continued
Property Taxes-Continued
The County is divided into 12,736 tax rate areas, which are unique combinations of various jurisdictionsservicing a specific geographic area. The rates levied within each tax rate area vary only in relation tolevies assessed as a result of voter-approved taxes or indebtedness.
Property taxes are levied on both real and personal property. Secured property taxes are levied duringSeptember of each year. They become a lien on real property on January 1 preceding the fiscal yearfor which taxes are levied. These tax payments can be made in two equal installments; the first is dueNovember 1 and delinquent with penalties after December 10; the second is due February 1 anddelinquent with penalties after April 10. Secured property taxes, which are delinquent and unpaid asof June 30, are declared to be tax defaulted and are subject to redemption penalties, costs, and interestwhen paid. If the delinquent taxes are not paid at the end of five (5) years, the property may be soldat public auction. The proceeds are used to pay the delinquent amounts due, and any excess is remitted,if claimed, to the taxpayer. Additional tax liens are created when there is a change in ownership ofproperty or upon completion of new construction. Tax bills for these new tax liens are issued throughoutthe fiscal year and contain various payment and delinquent dates but are generally due within one year.If the new tax liens are lower, the taxpayer receives a tax refund rather than a tax bill. Unsecuredpersonal property taxes are not a lien against real property. These taxes are due on August 1 andbecome delinquent, if unpaid, on August 31.
Legislation Dissolving Redevelopment Agencies and Affect on Property Taxes
State Assembly Bill (AB) x1 26, also referred to as the “Redevelopment Dissolution Act” was approvedin 2011. Under AB x1 26, property tax revenues are allocated to pay enforceable legal obligations, pass-through payments and eligible administrative costs. Any remaining property tax revenues, otherwiseknown as “residual taxes,” are distributed as property tax revenue to the appropriate local governmentagencies, including the County. Oversight Boards were established for each of the 71 successoragencies within the County. In FY 2018-2019, the 71 Oversight Boards were consolidated to 5 OversightBoards per Senate Bill 107. The Oversight Boards are required to evaluate and approve the successoragencies’ remaining enforceable legal obligations. The County Auditor-Controller is responsible fordisbursing property tax increment revenues in accordance with provisions of AB x1 26 and applicableamendments. For the year ended June 30, 2019, the County’s share of residual property tax revenueswas $290.32 million, of which $243.21 million was recognized in the County’s General Fund.
Deposits and Investments
Deposits and investments as discussed in Note 5 are reflected in the following asset accounts:
Pooled Cash and Investments
As provided for by the Government Code, the cash balances of substantially all funds are pooled and invested by the County Treasurer for the purpose of increasing interest earnings through investment activities. Interest earned on pooled investments is deposited to participating funds based upon each fund's average daily deposit balance during the allocation period. Each respective fund's share of the total pooled cash and investments is included among asset balances under the caption "Pooled Cash and Investments."
64

COUNTY OF LOS ANGELESNOTES TO THE BASIC FINANCIAL STATEMENTS
FOR THE YEAR ENDED JUNE 30, 20191. SUMMARY OF SIGNIFICANT ACCOUNTING POLICIES-Continued
Deposits and Investments-Continued
Pooled Cash and Investments-Continued
Pooled Cash and Investments are identified within the following categories for all County operating funds:
Operating Pooled Cash and Investments
This account represents amounts reflected in the County’s day-to-day financial records. Such amounts are utilized to determine the availability of cash for purposes of disbursing and borrowing funds.
Other Pooled Cash and Investments
This account represents amounts identified in various agency funds as of June 30, 2019, that were owed to or were more appropriately classified in County operating funds. Accordingly, certain cash balances have been reclassified from the agency funds as required by GASB 34.
Other Investments
This account represents Pension and OPEB Trust Fund investments, various JPAs, NPCs and Public Buildings (bond financed capital assets), and amounts on deposit with the County Treasurer, which are invested separately as provided by the Government Code or by specific instructions from the depositing entities.
Restricted Assets
Enterprise Funds’ restricted assets represent cash and investments of certain JPAs and Public Buildings projects restricted in accordance with the provisions of the certificates of participation issued. The Internal Service Funds’ restricted assets represent cash and investments restricted for debt service in accordance with the provisions of the LACCAL bond indenture. All of the above noted assets are included in the various disclosures in Note 5. These restricted assets are presented as noncurrent assets and are generally associated with long-term bonds payable and certificates of participation.
Inventories
Inventories, which consist of materials and supplies held for consumption, are valued at cost using the first in / first out basis. The inventory costs of the governmental funds are accounted for as expenditures when the inventory items are purchased. Reported inventories are categorized as nonspendable fund balance as required by GASB 54, "Fund Balance Reporting and Governmental Fund Type Definitions" (GASB 54) because these amounts are not available for appropriation and expenditure.
65

COUNTY OF LOS ANGELESNOTES TO THE BASIC FINANCIAL STATEMENTS
FOR THE YEAR ENDED JUNE 30, 20191. SUMMARY OF SIGNIFICANT ACCOUNTING POLICIES-Continued
Capital Assets
Capital assets, which include land and easements, buildings and improvements, equipment, andintangible and infrastructure assets, are reported in the applicable governmental or business-typeactivities columns in the government-wide financial statements. Infrastructure assets are divided intothe five following networks: road, water, sewer, flood control and aviation. Capital assets are recordedat historical cost or estimated historical cost if purchased or constructed. Donated capital assets,donated works of art and similar items, and capital assets received in a service concession arrangementshould be reported at acquisition value rather than fair value. Certain buildings and equipment arebeing leased under capital leases as defined in GASB 62, "Codification of Accounting and FinancialReporting Guidance Contained in Pre-November 30, 1989 FASB and AICPA Pronouncements." Thepresent value of the minimum lease obligation has been capitalized in the statement of net position andis also reflected as a liability in that statement.
Capital outlay is recorded as expenditures in the governmental fund financial statements and as assetsin the government-wide financial statements to the extent the County’s capitalization threshold is met.Interest incurred during the construction phase of the capital assets of business-type activities is reflectedin the capitalized value of the asset constructed, net of interest earned on the invested proceeds fromtax-exempt debt over the same period. For taxable debt, business-type activities interest is capitalizedand not netted with interest earnings.
The County’s capitalization thresholds are $5,000 for equipment, $100,000 for buildings andimprovements, $1 million for software intangible assets, $100,000 for non-software intangible assets,and $25,000 for infrastructure assets. Maintenance and repairs are charged to operations whenincurred. Betterments and major improvements, which significantly increase values, change capacities,or extend useful lives are capitalized subject to the threshold in the affected asset category. Upon saleor retirement of capital assets, the cost and the related accumulated depreciation or amortization, asapplicable, are removed from the respective accounts and any resulting gain or loss is included in theresults of operations. Specific disclosures related to capital assets appear in Note 6. Amortization forsoftware and other intangible assets is included in the reporting of depreciation.
Capital assets are depreciated or amortized using the straight-line method over the following estimateduseful lives:
Buildings and Improvements 10 to 50 yearsEquipment 2 to 35 yearsSoftware 5 to 25 yearsInfrastructure 15 to 100 years
Works of art and historical treasures held for public exhibition, education, or research in furtherance of public service, rather than financial gain, are not capitalized. These items are protected, encumbered, conserved, and preserved by the County. It is the County’s policy to utilize proceeds from the sale of these items for the acquisition of other items for collection and display.
66

COUNTY OF LOS ANGELESNOTES TO THE BASIC FINANCIAL STATEMENTS
FOR THE YEAR ENDED JUNE 30, 20191. SUMMARY OF SIGNIFICANT ACCOUNTING POLICIES-Continued
Deferred Outflows and Inflows of Resources
Pursuant to GASB 63, “Financial Reporting of Deferred Outflows of Resources, Deferred Inflows ofResources, and Net Position,” and GASB 65, “Items Previously Reported as Assets and Liabilities,”the County recognizes deferred outflows of resources and/or deferred inflows of resources in thegovernment-wide statement of net position, governmental funds balance sheets, and proprietary fundsstatement of net position.
In addition to assets, the financial statements report a separate section for deferred outflows ofresources. Deferred outflows of resources represent a consumption of net position that applies to afuture period and will not be recognized as an outflow of resources (expense/expenditures) until then.
In addition to liabilities, the financial statements report a separate section for deferred inflows ofresources. Deferred inflows of resources represent an acquisition of net position that applies to a futureperiod and will not be recognized as an inflow of resources (revenue) until that time, except for pensionand OPEB related deferred inflows of resources, which will be recognized as a credit to expense.
Specific disclosures of items representing deferred outflows and inflows of resources appear in Note20.
Advances Payable
The County uses certain agency funds as clearing accounts for the distribution of financial resourcesto other County funds. Pursuant to GASB 34, for external financial reporting purposes, the portions ofthe clearing account balances that pertain to other County funds should be reported as cash of theappropriate funds. The corresponding liability is included in “Advances Payable” because the amountsrepresent unearned revenue.
Compensated Absences
Vacation pay benefits accrue to employees ranging from 10 to 25 days per year depending on yearsof service and the benefit plan. Sick leave benefits accrue at the rate of 10 to 12 days per year forunion represented employees depending on years of service. Non-represented employees accrue ata rate of up to 8 days of sick leave per year depending on the benefit plan. Employees can alsoaccumulate unused holiday and compensatory time off benefits throughout the year. All benefits arepayable upon termination, if unused, within limits and rates as specified in the County Salary Ordinance.
Liabilities for accrued compensated absences are accrued in the government-wide financial statementsand in the proprietary funds. For the governmental funds, expenditures are recorded when amountsbecome due and payable (i.e., when employees terminate from service).
67

COUNTY OF LOS ANGELESNOTES TO THE BASIC FINANCIAL STATEMENTS
FOR THE YEAR ENDED JUNE 30, 20191. SUMMARY OF SIGNIFICANT ACCOUNTING POLICIES-Continued
Net Pension Liability and Related Balances
For purposes of measuring the net pension liability, deferred outflows of resources and deferred inflowsof resources related to pensions, and pension expense, information about the fiduciary net position ofLACERA and additions to/deductions from LACERA’s fiduciary net position have been determined onthe same basis as they are reported by LACERA. For this purpose, benefit payments (including refundsof employee contributions) are recognized when due and payable in accordance with the benefit terms.Investments are reported at fair value. Reported results pertain to liability and asset information withinthe following defined timeframes:
Valuation Date - June 30, 2017 rolled forward to June 30, 2018 Measurement Date - June 30, 2018 Measurement Period - July 1, 2017 to June 30, 2018
Net OPEB Liability and Related Balances - Retiree Healthcare
For purposes of measuring the net OPEB liability related to Retiree Healthcare, deferred outflows of resources and deferred inflows of resources related to OPEB, and OPEB expense, information about the fiduciary net position of LACERA and additions to/deductions from LACERA’s fiduciary net position have been determined on the same basis as they are reported by LACERA. For this purpose, benefit payments are recognized when due and payable in accordance with the benefit terms. Investments are reported at fair value. Reported results pertain to liability and asset information within the following defined timeframes:
Valuation Date - June 30, 2017 rolled forward to June 30, 2018 Measurement Date - June 30, 2018 Measurement Period - July 1, 2017 to June 30, 2018
Total OPEB Liability and Related Balances - Long-Term Disability
For purposes of measuring the total OPEB liability related to Long-Term Disability (LTD), deferred outflows of resources and deferred inflows of resources related to OPEB, and OPEB expense, have been determined on the same basis as they are reported by the plan. For this purpose, the LTD plan recognizes benefit payments when due and payable in accordance with the benefit terms. Reported results pertain to liability information within the following defined timeframes:
Valuation Date - June 30, 2017 rolled forward to June 30, 2018Measurement Date - June 30, 2018 Measurement Period - July 1, 2017 to June 30, 2018
68

COUNTY OF LOS ANGELESNOTES TO THE BASIC FINANCIAL STATEMENTS
FOR THE YEAR ENDED JUNE 30, 20191. SUMMARY OF SIGNIFICANT ACCOUNTING POLICIES-Continued
Long-term Debt
In the government-wide and proprietary funds financial statements, long-term debt and other long-termobligations are reported as liabilities in the applicable governmental activities, business-type activities,or proprietary funds statement of net position. Bond premiums and discounts are amortized over thelife of the bonds using the effective interest method. Bonds payable are reported net of the applicablebond premium or discount. Bond issuance costs are recognized in the period issued.
In the governmental funds financial statements, bond premiums, discounts, and issuance costs arerecognized in the period issued. Issuance costs, even if withheld from the actual net proceeds received,are reported as debt service expenditures. Interest is reported as an expenditure in the period in whichthe related payment is made. The matured portion of long-term debt (i.e., portion that has come duefor payment) is reported as a liability in the fund financial statements of the related fund.
Fund Balances
In the fund financial statements, the governmental funds report the classification of fund balance inaccordance with GASB 54. The reported fund balances are categorized as nonspendable, restricted,committed, assigned, or unassigned based on the extent to which the County is bound to honorconstraints on the specific purposes for which amounts in those funds can be spent. Specific detailsrelated to Fund Balances appear in Note 21.
Nonspendable Fund Balance - amounts that cannot be spent because they are either (a) not in spendable form, or (b) legally or contractually required to be maintained intact. The “not in spendable form” criterion includes items that are not expected to be converted to cash, for example: inventories and long-term notes receivable.
Restricted Fund Balance - amounts with constraints placed on their use that are either (a)externally imposed by creditors, grantors, contributors, or laws or regulations of other governments; or (b) imposed by law through constitutional provisions or enabling legislation. Restrictions may effectively be changed or lifted only by changing the condition of the constraint.
Committed Fund Balance - amounts that can only be used for the specific purposes determined by a formal action of the County’s highest level of decision-making authority, the County’s Board. Commitments may be changed or lifted only by the County taking the same formal action that imposed the constraint originally. The underlying action that imposed the limitation needs to occur no later than the close of the fiscal year.
69

COUNTY OF LOS ANGELESNOTES TO THE BASIC FINANCIAL STATEMENTS
FOR THE YEAR ENDED JUNE 30, 20191. SUMMARY OF SIGNIFICANT ACCOUNTING POLICIES-Continued
Fund Balances-Continued
Assigned Fund Balance - amounts intended to be used by the County for specific purposes that are neither restricted nor committed. The intent can be established at either the highest level of decision making, or by a body or an official designated for that purpose. Authorization to assign fund balance rests with the County’s Board through the budget process. The Board has also delegated authority to the Chief Executive Officer and County Department Heads for contracts and purchasing authority.
Unassigned Fund Balance - the residual classification for the County’s General Fund that includes amounts not contained in other classifications. In other funds, the unassigned classification is used only if expenditures incurred for specific purposes exceed the amounts restricted, committed, or assigned to those purposes.
The Board establishes, modifies, or rescinds fund balance commitments by passage of an ordinance or resolution. For its budget, the County utilizes the GASB 54 criteria and an ordinance or resolution is equally binding, for purposes of establishing a fund balance commitment. This is done through the adoption of the budget and subsequent amendments that occur throughout the fiscal year.
In circumstances when an expenditure is made for a purpose for which amounts are available in multiple fund balance classifications, fund balance is generally depleted in the order of restricted, committed, assigned, and unassigned.
Cash Flows
For purposes of reporting cash flows, all amounts reported as "Pooled Cash and Investments," "Other Investments," and "Restricted Assets" are considered cash equivalents. Pooled cash and investment amounts represent funds held in the County Treasurer's cash management pool. Other investments and restricted assets are invested in money market mutual funds held by outside trustees. Such amounts are similar in nature to demand deposits (i.e., funds may be deposited and withdrawn at any time without prior notice or penalty).
Use of Estimates
The preparation of financial statements in conformity with GAAP requires management to make estimates and assumptions that affect the reported amounts of certain assets and deferred outflows of resources, liabilities and deferred inflows of resources, disclosures of contingent assets and liabilities at the date of the financial statements, and the reported amounts of revenues and expenditures/expenses during the reporting period. Actual results could differ from those estimates.
70

COUNTY OF LOS ANGELESNOTES TO THE BASIC FINANCIAL STATEMENTS
FOR THE YEAR ENDED JUNE 30, 20192. NEW ACCOUNTING PRONOUNCEMENTS
The following GASB Statements have been implemented in the current basic financial statements.
GASB 83 Certain Asset Retirement Obligations Addresses accounting and financial reporting forcertain asset retirement obligations (AROs). This statement establishes criteria for determining the timing and pattern of recognition of a liability and a corresponding deferred outflow of resources for AROs. This statement requires that recognition occur when the liability is both incurred and reasonably estimable. This statement did not have a material impact on the financial statements.
GASB 88 Certain Disclosures Related to Debt, including Direct Borrowings and Direct Placements
Improves the information that is disclosed in notes to government financial statements related to debt, including direct borrowings and direct placements. This statement requires that additional essential information related to debt be disclosed in notes to financial statements, including unused lines of credit; assets pledged as collateral for the debt; and terms specified in debt agreements related to significant events of default with finance-related consequences, significant termination events with finance-related consequences, and significant subjective acceleration clauses. Refer to Note 11 for the required note disclosure information.
3. DEFICIT NET POSITION
The following activities/funds had a net deficit at June 30, 2019 (in thousands):
Government-wide:Accumulated Deficit
Governmental Activities $ 10,388,710Business-type Activities 3,103,470
Enterprise Funds:Harbor-UCLA Medical Center 1,387,439Olive View-UCLA Medical Center 1,038,208LAC+USC Medical Center 1,344,839Rancho Los Amigos National Rehab Center 312,348
Internal Service Funds-Public Works 1,175,566
The government-wide governmental and business-type activities, enterprise and internal service funds’ Public Works deficits result primarily from the recognition of certain liabilities including accrued compensated absences, net pension liability, net OPEB liability, workers’ compensation, self-insurance and, for the enterprise funds, medical malpractice, and third party payors, as required by GAAP. Deficits are expected to continue until such liabilities are retired through user charges or otherwise funded.
71

COUNTY OF LOS ANGELESNOTES TO THE BASIC FINANCIAL STATEMENTS
FOR THE YEAR ENDED JUNE 30, 20194. ELIMINATIONS
The Regional Park and Open Space District (RPOSD), a blended component unit, is authorized to issueassessment bonds to acquire and improve recreational land and facilities. These bonds are securedby voter-approved property tax assessments. The RPOSD executed a financing agreement with thePublic Works Financing Authority, another blended component unit referred to in the basic financialstatements as “Various Joint Powers Authorities (JPAs)". Under the terms of the agreement, the RPOSDsold $510.19 million of bonds in 1997 that were acquired as an investment by the JPAs. The JPAsfinanced this investment from proceeds of a simultaneous issuance of an equivalent amount of bondsas a public offering. The structure of the publicly offered JPA bonds was designed to match the RPOSD’sbonds relative to the principal and interest maturities and interest rates. This series of transactions wasconducted to facilitate the issuance of RPOSD related bonds and to minimize the County’s overallinterest cost. Pursuant to the financing agreement with the JPAs, the RPOSD has pledged all availabletax assessments necessary to ensure the timely payment of principal and interest on the bonds issuedby the JPAs. The 1997 bonds were partially refunded in FY 2004-2005 and the remaining 1997 bondswere fully refunded in FY 2007-2008. The transactions between the two component units have beenaccounted for as follows:
Fund Financial Statements
At June 30, 2019, the governmental funds financial statements reflect an investment asset (referred toas “Other Investments”) held by the JPAs of $13.62 million that has been recorded in the nonmajorgovernmental funds. The governmental funds financial statements do not reflect a liability for the relatedbonds payable ($13.62 million), as this obligation is not currently due. Accordingly, the value of theasset represents restricted fund balance in the nonmajor governmental funds.
In order to reflect the economic substance of the transaction described above, an eliminations columnhas been established in the governmental funds financial statements. The purpose of the column is toremove the duplication of assets, fund balances, revenues and expenditures that resulted from theconsolidation of the two component units into the County’s overall financial reporting structure.
Government-wide Financial Statements
The government-wide financial statements are designed to minimize the duplicative effects oftransactions between funds. Accordingly, the effects of the transaction described above have beeneliminated from the amounts presented within governmental activities (as appropriate under the accrualbasis of accounting). The specific items eliminated were other investments and bonds payable ($13.62million) and investment income and interest expense ($1.04 million for each). Accordingly, there areno reconciling differences between the two sets of financial statements (after the effects of eliminations)for this matter.
The bonds payable of $13.62 million, that were publicly issued, are included among the liabilitiespresented in the Government-wide Financial Statements. Disclosures related to those outstandingbonds appear in Note 11 and are captioned “Assessment Bonds.”
72

COUNTY OF LOS ANGELESNOTES TO THE BASIC FINANCIAL STATEMENTS
FOR THE YEAR ENDED JUNE 30, 20195. CASH AND INVESTMENTS
Investments in the County's cash and investment pool, other cash and investments, and Pension andOPEB Trust Funds investments, are stated at fair value. Aggregate pooled cash and investments andother cash and investments are as follows at June 30, 2019 (in thousands):
Restricted AssetsPooled Cash
and InvestmentsOther
InvestmentsPooled Cash
and InvestmentsOther
Investments TotalGovernmental Funds $ 8,634,552 329,100 $ 8,963,652Proprietary Funds 243,585 119,996 1,037 364,618Fiduciary Funds (excluding
Pension and OPEB) 22,483,432 165,787 22,649,219Pension and OPEB Trust
Funds 96,221 61,337,375 61,433,596Discretely Presented
Component Units 490,662 420,934 911,596Total $ 31,948,452 62,253,196 119,996 1,037 $ 94,322,681
A summary of cash and investments (by type) as of June 30, 2019 is as follows (in thousands):
Cash: Cash and investments are reported as follows:County
Imprest Cash $ 9,714 Governmental Funds $ 8,963,652Cash in Vault 364 Proprietary Funds 364,618Cash in Bank 260,573 Investment Trust Funds 20,695,157Deposits in Transit 10,676 Agency Funds 1,954,062
Held by Outside Trustees 234,121 Pension and OPEBLACDA 14,097 Trust Funds (LACERA) 61,433,596Total Cash 529,545 Discretely presented component unit:
- First 5 LA 365,731- LACDA 545,865
Total Cash and Investments $ 94,322,681Investments:
In Treasury Pool 31,787,121In Specific Purpose Investment
(SPI) 169,459In Other Specific Investments 301Held by Outside Trustees 92,043In LACERA 61,337,375In Discretely Presented Component
Unit - LACDA 406,837Total Investments 93,793,136
Total Cash and Investments $ 94,322,681
73

COUNTY OF LOS ANGELESNOTES TO THE BASIC FINANCIAL STATEMENTS
FOR THE YEAR ENDED JUNE 30, 20195. CASH AND INVESTMENTS-Continued
County Treasurer Cash
As of June 30, 2019, the County Treasurer (Treasurer) maintained accounts in six banks. The carryingamount of the Treasurer’s total deposits in financial institutions was $260.57 million, deposits in transitwere $10.68 million, and cash in the Treasurer’s vault was $0.36 million.
Under California Government Code Section 53652, each financial institution in California is required topledge a pool of securities as collateral against all of its public deposits. California GovernmentCode Section 53651 delineates the types of eligible securities, and the required collateral percentage,generally at 110%. In addition, under California Government Code Section 53653, the Treasurer hasdiscretion to waive security for the portion of any deposits as insured pursuant to federal law. Throughcontractual agreement, the Treasurer has opted to waive security for the portion of deposits that isfederally insured.
The total balance of deposits in financial institutions was covered by federal depository insurance orcollateralized with securities monitored by the California Department of Business Oversight (DBO).DBO confirmed that the pools of collateral related to the County Treasurer’s deposits were maintainedat required levels as of June 30, 2019.
County Investment Pool
California Government Code Sections 53601, 53635 and 53534 authorize the Treasurer to invest theExternal Investment Pool (Pool) and SPI funds in obligations of the United States Treasury, federalagencies, municipalities, asset-backed securities, bankers’ acceptances, commercial paper, negotiablecertificates of deposit, medium-term notes, corporate notes, repurchase agreements, reverserepurchase agreements, forwards, futures, options, shares of beneficial interest of a Joint PowersAuthority (JPA) that invests in authorized securities, shares of beneficial interest issued by diversifiedmanagement companies known as money market mutual funds (MMF) registered with the Securitiesand Exchange Commission (SEC), securities lending agreements, the State of California’s Local AgencyInvestment Fund (LAIF), interest rate swaps, and supranational institutions. California GovernmentCode Section 53534 authorizes the Treasurer to enter into interest rate swaps agreements. However,these agreements should only be used in conjunction with the sale of the bonds approved by the Board.The investments are managed by the Treasurer, which reports investment activity to the Board on amonthly basis. In addition, Treasurer investment activity is subject to an annual investment policyreview, compliance oversight, quarterly financial review, and annual financial reporting. The Treasureralso maintains Other Specific Investments, which are invested pursuant to the California GovernmentCode. The County has not provided nor obtained any legally binding guarantees during the year endedJune 30, 2019, to support the value of shares in the Pool.
74

COUNTY OF LOS ANGELESNOTES TO THE BASIC FINANCIAL STATEMENTS
FOR THE YEAR ENDED JUNE 30, 20195. CASH AND INVESTMENTS-Continued
County Investment Pool-Continued
The School Districts and the Superior Court are required by legal provisions to participate in the County’sinvestment pool. Fifty-six percent (55.96%) of the Treasurer’s Pool consists of these involuntaryparticipants. Voluntary participants in the County’s Pool include the Sanitation Districts, MetropolitanTransportation Authority, the South Coast Air Quality Management District and other special districtswith independent governing boards. The deposits held for both involuntary and voluntary entities areincluded in the Pooled Investment Trust Fund. Certain SPI have been made by the County, as directedby external depositors. This investment activity occurs separately from the County’s Pool and is reportedin the Specific Investment Trust Fund in the amount of $165.49 million. The Pool is not registered asan investment company with the SEC. California Government Code statutes and the County Board setforth the various investment policies that the Treasurer must follow.
Investments are stated at fair value and are valued on a monthly basis. The Treasurer categorizes itsfair value measurements within the fair value hierarchy established by GAAP. Securities classified inLevel 1 of the fair value hierarchy are valued using prices quoted in active markets for those securities.Securities classified in Level 2 of the fair value hierarchy are valued using other observable inputs suchas matrix pricing techniques or based on quoted prices for assets in markets that are not active.Matrix pricing is used to value securities based on the securities’ relationship to benchmark quotedprices. Level 3 inputs are significant unobservable inputs. Securities classified in Level 3 are valuedusing the income approach such as discounted cash flow techniques. Investment in an externalgovernment investment pool is not subject to reporting within the level hierarchy.
Investments in LAIF are governed by the California Government Code and overseen by a five memberLocal Investment Advisory Board as designated by the California Government Code. As of June 30,2019, the total amount invested by all California local governments and special districts in LAIF was$24.580 billion. LAIF is part of the State of California’s Pooled Money Investment Account (PMIA),which as of June 30, 2019 had a balance of $105.740 billion. The PMIA is not SEC registered, but isrequired to invest according to the California Government Code. Included in the PMIA’s investmentportfolio are certain derivative securities or similar products in the form of asset-backed securitiestotaling $1.880 billion at June 30, 2019. Collectively, these represent 1.78% of the PMIA balance of$105.740 billion. The SPI holdings in the LAIF investment pool as of June 30, 2019, were $42.24million, which were valued using a fair value factor provided by LAIF.
75

COUNTY OF LOS ANGELESNOTES TO THE BASIC FINANCIAL STATEMENTS
FOR THE YEAR ENDED JUNE 30, 20195. CASH AND INVESTMENTS-Continued
County Investment Pool-Continued
The Treasurer has the following recurring fair value measurements as of June 30, 2019 (in thousands):
Fair Value Measurement Using
Pool Fair Value
Quoted Pricesin Active
Markets forIdenticalAssets
(Level 1)
SignificantOther
ObservableInputs
(Level 2)
SignificantUnobservable
Inputs(Level 3)
ExternalGovernmentInvestment
PoolsCommercial Paper $ 9,436,908 $ $ 9,436,908 $ $Corporate and Deposit Notes 102,432 102,432Los Angeles County Securities 49,146 49,146Negotiable Certificates of Deposit 1,900,305 1,900,305U.S. Agency Securities 19,006,583 19,006,583U.S. Treasury Securities:
U.S. Treasury Notes 148,035 148,035U.S. Treasury Bills 1,143,712 1,143,712
Total Investments $ 31,787,121 $ $ 31,737,975 $ 49,146 $
SPILocal Agency Investment Fund $ 42,238 $ $ $ $ 42,238Los Angeles County Securities 3,972 3,972Negotiable Certificates of Deposit 20,000 20,000U.S. Agency Securities 67,761 67,761U.S. Treasury Securities:
U.S. Treasury Bills 35,488 35,488Total Investments $ 169,459 $ $ 123,249 $ 3,972 $ 42,238
Other Specific InvestmentsU.S. Treasury Bills $ 301 $ $ 301 $ $
Total Investments $ 301 $ $ 301 $ $
76

COUNTY OF LOS ANGELESNOTES TO THE BASIC FINANCIAL STATEMENTS
FOR THE YEAR ENDED JUNE 30, 20195. CASH AND INVESTMENTS-Continued
County Investment Pool-Continued
As permitted by the Government Code, the Treasurer developed, and the Board adopted, an InvestmentPolicy that further defines and restricts the limits within which the Treasurer may invest. The table belowidentifies the investment types that are authorized by the County, along with the related concentrationof credit limits:
MaximumMaturity
Maximum Percentageof Portfolio
Maximum InvestmentIn One Issuer
MinimumRating
Authorized InvestmentType
Gov.Code Pool Policy
Gov.Code Pool Policy
Gov.Code Pool Policy
Gov.Code Pool Policy
U. S. Treasury Notes, Bills and Bonds 5 years None (1) None None None None None NoneU.S. Agency Securities 5 years None (1) None None None None None NoneLocal Agency Obligations 5 years 5 years (2) None 10%* None 10%* None None (2)Asset-Backed Securities 5 years 5 years 20% 20% None $750 million* AA AA (3)*Bankers' Acceptances 180
days180 days 40% 40% 30% $750 million* None A-1/P-1/F1*
Negotiable Certificates of Deposit (4) 5 years 3 years* 30% 30% None $750 million* None A-1/P-1/F1*
Commercial Paper270 days 270 days 40% 40% 10% $1.5 billion* A-1 A-1/P-1/F1
Corporate and Depository Medium-Term Notes (5) 5 years 3 years* 30% 30% None $750 million* A A-1/P-1/F1*LAIF N/A N/A None $65 million (6)* None None None NoneShares of Beneficial Interest N/A N/A 20% 15%* 10% 10% AAA AAARepurchase Agreements 1 year 30 days* None $1 billion* None $500 million* None NoneReverse Repurchase Agreements 92 days 92 days 20% $500 million* None $250 million* None NoneForwards, Futures, and Options N/A 90 days* None $100 million* None $50 million* None A*Interest Rate Swaps N/A None None None None None A ASecurities Lending Agreements 92 days 92 days 20% 20% (7) None None None NoneSupranationals 5 years 5 years 30% 30% None None AA AA
(1) Pursuant to the California Government Code 53601, the Board granted authority to make investments in U.S. Treasury Notes,Bills and Bonds, and U.S. Agency Securities that have maturities beyond 5 years.
(2) Any obligation issued or caused to be issued on behalf of other County affiliates must have a minimum rating of "A3" (Moody’s)or "A " (S&P or Fitch) and the maximum maturity is limited to thirty years. Any short- or medium-term obligation issued by theState of California or a California local agency must have a minimum rating of "MIG-1" or "A2" (Moody's) or "SP-1" or "A" (S&P)and the maximum maturity is limited to 5 years.
(3) All Asset Backed securities must be rated at least “AA”. Pool Policy also requires that Asset-Backed securities issuers' debtbe rated "A" or its equivalent or better.
(4) Euro Certificates of Deposit are further restricted to a maximum maturity of one year and a maximum percentage of portfolioof 10%.
(5) Floating Rate Notes are further restricted to a maximum maturity of five years, maximum of 10% of the portfolio, and maximuminvestment in one issuer of $750 million. The maximum maturity may be seven years, provided that the Board’s authorizationto exceed maturities in excess of five years is in effect, of which $100 million par value may be greater than five years tomaturity.
(6) The maximum percentage of the portfolio is based on the investment limit established by LAIF for each account, not by PoolPolicy.
(7) The maximum par value is limited to a combined total of reverse repurchase agreements and securities lending agreementsof 20% of the base value of the portfolio.
*Represents restriction in which the County’s Investment Policy is more restrictive than the CaliforniaGovernment Code.
77

COUNTY OF LOS ANGELESNOTES TO THE BASIC FINANCIAL STATEMENTS
FOR THE YEAR ENDED JUNE 30, 20195. CASH AND INVESTMENTS-Continued
County Investment Pool-Continued
A summary of investments held by the Pool at June 30, 2019 is as follows (dollars in thousands):
Pool Fair Value Principal Interest Rate Range Maturity Range
WeightedAverage
Maturity InYears
Commercial Paper $ 9,436,908 $ 9,438,744 2.29% - 2.55% 07/01/19 - 09/05/19 0.06Corporate and Deposit Notes 102,432 101,616 2.00% - 3.05% 01/10/20 - 03/03/22 1.27Los Angeles County
Securities 49,146 50,000 2.60% - 5.50% 06/30/20 - 06/30/21 1.60Negotiable Certificates of
Deposit 1,900,305 1,900,000 2.31% - 2.71% 07/01/19 - 03/27/20 0.10U.S. Agency Securities 19,006,583 19,036,285 1.13% - 3.90% 07/01/19 - 07/23/25 2.43U.S. Treasury Securities:
U.S. Treasury Notes 148,035 149,332 1.13% 07/31/21 - 09/30/21 2.20U.S. Treasury Bills 1,143,712 1,142,351 2.31% - 2.64% 07/02/19 - 03/26/20 0.27
Total $ 31,787,121 $ 31,818,328 1.50
The unrealized loss on investments held in the Pool was $31.21 million as of June 30, 2019. This amount takes into account all changes in fair value that occurred during the year. The method used to apportion the unrealized loss was based on a prorata share of each funds’ cash balance as of June 30, 2019 relative to the County Pool balances. A separate financial report is issued for the Pool for the year ended June 30, 2019 and can be obtained at https://ttc.lacounty.gov/investor-information/.
Specific Purpose Investments and Other Specific Investments
A summary of investments held by the SPI and Other Specific Investments at June 30, 2019 is as follows (dollars in thousands):
SPI Fair Value Principal Interest Rate Range Maturity Range
WeightedAverage
Maturity InYears
Local AgencyInvestment Fund $ 42,238 $ 42,166 0.47
Los Angeles CountySecurities 3,972 3,790 5.00% 12/02/27 8.43
Negotiable Certificatesof Deposit 20,000 20,000 2.07% 06/29/20 1.00
U.S. Agency Securities 67,761 67,669 1.50% - 3.27% 07/27/21 - 12/26/41 13.81U.S. Treasury Bills 35,488 35,403 2.48% - 2.50% 01/02/20 0.51
Total $ 169,459 $ 169,028 6.26
78

COUNTY OF LOS ANGELESNOTES TO THE BASIC FINANCIAL STATEMENTS
FOR THE YEAR ENDED JUNE 30, 20195. CASH AND INVESTMENTS-Continued
Specific Purpose Investments and Other Specific Investments-Continued
Other Specific Investments Fair Value PrincipalInterest Rate
Range Maturity Range
WeightedAverage
Maturity InYears
U.S. Treasury Bills $ 301 $ 301 2.32% 11/29/19 0.42
Interest Rate Risk
Interest rate risk is the risk that changes in interest rates will adversely affect the fair value of an investment. The County’s Investment Policy limits most investment maturities to less than five years, with the exception of U.S. Treasury Notes, Bills, and Bonds and U.S. Agency Securities, which may have maturities beyond five years. The Treasurer manages the Pool and mitigates exposure to declines in fair value by generally investing in short-term investments with maturities of six months or less and by holding all investments to maturity.
The Treasurer manages the Pool’s exposure to declines in fair value by limiting its weighted average maturity target to a range between 1.0 and 2.0 years, in accordance with the Investment Policy. For purposes of computing weighted average maturity, the maturity date of variable-rate notes is the stated maturity.
The balance of the Pool's investments at June 30, 2019 is $31.787 billion, of which 42.28% will mature in six months or less. Of the remainder, 43.46% have a maturity of more than one year. At June 30, 2019, the weighted average maturity in years for the Pool was 1.50.
The California Government Code and the Investment Policy allow the Treasurer to purchase floating rate notes, that is, any instruments that have a coupon interest rate that is adjusted periodically due to changes in a base or benchmark rate. The Investment Policy limits the amount invested in floating rate notes to 10% of the Pool portfolio. The Investment Policy prohibits the purchase of inverse floating rate notes and hybrid or complex structured investments and for the year ended June 30, 2019, there were none.
At June 30, 2019, the Pool contained floating rate notes at fair value of $207.21 million (0.65% of the Pool). The notes are tied to one-month and three-month London Interbank Offered Rate (LIBOR) with monthly and quarterly coupon resets. The fair value of variable securities is generally less susceptible to changes in value than fixed rate securities because the variable-rate coupon resets back to the market rate on a periodic basis. There were no variable rate notes in the SPI and Other Specific Investments.
Fair value fluctuates with interest rates, and increasing interest rates could cause fair value to decline below original cost. County management believes the liquidity in the portfolios is adequate to meet cash flow requirements and to preclude the County from having to sell investments below original cost for that purpose.
79

COUNTY OF LOS ANGELESNOTES TO THE BASIC FINANCIAL STATEMENTS
FOR THE YEAR ENDED JUNE 30, 20195. CASH AND INVESTMENTS-Continued
Custodial Credit Risk
Custodial credit risk for investments is the risk that the Treasurer will not be able to recover the valueof investment securities that are in the possession of an outside party. Investments are exposed tocustodial credit risk if the securities are uninsured, are not registered in the name of the Treasurer andare held by either the counterparty, or the counterparty's trust department or agent but not in theTreasurer's name. At year-end, all Pool, SPI and Other Specific Investment securities, except for theRancho Palos Verdes Redevelopment Agency Tax Allocation Bond (Bond), Bond Anticipation Notes(BANs) and LAIF, were either held by the Treasurer or by the custodian bank in the name of the Treasurer.The Bond and the BANs were held in the Treasurer’s vault and are recorded in the Los Angeles CountySecurities line item. The LAIF investments were managed by the State of California and the Countyis considered a pool participant.
Credit Risk and Concentration of Credit Risk
Credit risk is the risk that an issuer, or other counterparty to an investment, will not fulfill its obligations.Concentration of credit risk is the risk of loss attributed to the magnitude of an investment in a singleissuer. The County mitigates these risks by holding a diversified portfolio of high quality investments.
The Investment Policy establishes acceptable credit ratings for investments from any two NationallyRecognized Statistical Rating Organizations (NRSRO). For an issuer of short-term debt, the ratingmust be no less than A-1 (S&P) or P-1 (Moody’s), and F-1 (Fitch) while an issuer of long-term debt shallbe rated no less than an “A.” All investments purchased during the year ended June 30, 2019 met thecredit rating criteria in the Investment Policy, at the issuer level. However, while the NRSROs did ratethe issuer of the investments purchased, the NRSRO did not, in all instances, rate the investment itself(e.g., commercial paper, bankers’ acceptances, corporate and deposit notes, negotiable certificates ofdeposit, and U.S. Treasury bills, bonds and notes). Accordingly, for purposes of reporting the creditquality distribution of investments, some investments are reported as not rated.
The Investment Policy also permits investments in LAIF, pursuant to California Government CodeSection 16429.1. At June 30, 2019, a portion of the SPI was invested in LAIF, which is unrated as tocredit quality.
The Pool and SPI had the following U.S. Agency and commercial paper securities in a single issuerthat represent 5% or more of total investments at June 30, 2019 (dollars in thousands):
80

COUNTY OF LOS ANGELESNOTES TO THE BASIC FINANCIAL STATEMENTS
FOR THE YEAR ENDED JUNE 30, 20195. CASH AND INVESTMENTS-Continued
Credit Risk and Concentration of Credit Risk-Continued
Issuer Pool SPIFair Value % of Portfolio Fair Value % of Portfolio
Federal Home Loan Bank $ 4,075,398 12.82% $ 36,184 21.35%Federal Home Loan Mortgage Corporation 6,731,727 21.18%Federal Farm Credit Bank 5,618,785 17.68% 23,875 14.09%Federal National Mortgage Association 2,555,647 8.04%United States Treasury 35,488 20.94%Toronto Dominion Bank 20,000 11.80%
The following is a summary of the credit quality distribution and concentration of credit risk by investment type as a percentage of each portfolio’s fair value at June 30, 2019:
Pool S&P Moody's Fitch % of PortfolioCommercial Paper Not Rated Not Rated Not Rated 29.69%Corporate and Deposit Notes (ST) AA- A1 AA- 0.08%
AA- Aa3 A+ 0.08%Corporate and Deposit Notes (LT) AA- Aa3 AA- 0.06%
AA- Aa3 A+ 0.03%AAA Aaa AAA 0.07%
Los Angeles County Securities Not Rated Not Rated Not Rated 0.15%Negotiable Certificates of Deposits AA- Aa3 Not Rated 0.32%
Not Rated P-1 Not Rated 0.16%Not Rated Not Rated Not Rated 5.50%
U.S. Agency Securities AA+ Aaa AAA 46.39%Not Rated Not Rated AAA 0.08%Not Rated Aaa AAA 0.23%
AA+ Aaa Not Rated 12.11%Not Rated Not Rated Not Rated 0.98%
U.S. Treasury Securities:U.S. Treasury Notes Not Rated Aaa AAA 0.47%U.S. Treasury Bills Not Rated Not Rated Not Rated 3.60%
100.00%SPI
Local Agency Investment Fund Not Rated Not Rated Not Rated 24.93%Los Angeles County Securities Not Rated Not Rated Not Rated 2.35%Negotiable Certificates of Deposits Not Rated Not Rated Not Rated 11.80%U.S Agency Securities AA+ Aaa AAA 18.63%
AA+ Aaa Not Rated 21.35%U.S. Treasury Securities:
U.S. Treasury Bills Not Rated Not Rated Not Rated 20.94%100.00%
Other Specific InvestmentsU.S. Treasury Bills Not Rated Not Rated Not Rated 100.00%
100.00%
81

COUNTY OF LOS ANGELESNOTES TO THE BASIC FINANCIAL STATEMENTS
FOR THE YEAR ENDED JUNE 30, 20195. CASH AND INVESTMENTS-Continued
Reverse Repurchase Agreements
The California Government Code permits the Treasurer to enter into reverse repurchase agreements,that is, a sale of securities with a simultaneous agreement to repurchase them in the future at the sameprice plus a contract rate of interest. The fair value of the securities underlying reverse repurchaseagreements normally exceeds the cash received, providing the broker-dealer a margin against a declinein the fair value of the securities. If the broker-dealer defaults on the obligation to resell these securitiesto the County or provide securities or cash of equal value, the County would suffer an economic lossequal to the difference between the fair value plus accrued interest of the underlying securities and theagreement obligation, including accrued interest.
The County's investment guidelines limit the maximum par value of reverse repurchase agreements to$500.00 million and proceeds from reverse repurchase agreements may only be reinvested ininstruments with maturities at or before the maturity of the reverse repurchase agreement. During thefiscal year, the County did not enter into any reverse repurchase agreements.
Securities Lending Transactions
For the year ended June 30, 2019, the Pool did not enter into any securities lending transactions.
Cash and Investments - Held by Outside Trustees
NPC and JPAs have been established for the purpose of rendering assistance to the County to refinance,acquire, construct, improve, lease and sell properties and equipment, including the construction ofbuildings, and purchase of equipment, land, and any other real or personal property, for the benefit ofCounty residents, through the issuance of bonds, certificates of participation notes (COPs) andcommercial paper.
The NPC and JPAs’ cash is invested with the outside trustees and the amounts are held in the NPCand JPAs name. Investment practices are governed by the County’s investment guidelines, establishedpursuant to the California Government Code and the County Board's action.
Investments are stated at fair value. Deposits held by outside trustees as of June 30, 2019 were $234.12million. A total of $111.90 million of investments held by outside trustees are invested in the Pool. Inaddition, the outside trustees invested $92.04 million outside of the Pool.
82

COUNTY OF LOS ANGELESNOTES TO THE BASIC FINANCIAL STATEMENTS
FOR THE YEAR ENDED JUNE 30, 20195. CASH AND INVESTMENTS-Continued
Cash and Investments - Held by Outside Trustees-Continued
The following is a summary of deposits and investments held by outside trustees as of June 30, 2019(dollars in thousands):
Amortized Cost PrincipalInterest Rate
Range Maturity Range
WeightedAverage
Maturity (Years)Money Market Mutual Funds $92,043 $92,043 0.30% - 2.56% 07/01/19 0.00
The following is a summary of the credit quality distribution and concentration of credit risk as of June 30, 2019:
Other Investments S&P Moody's Fitch % of PortfolioMoney Market Mutual Funds Not Rated Not Rated Not Rated 100.00%
LACERA Investment Portfolio
Narratives and tables presented for the Pension and OPEB Trust funds managed by the LACERA are taken directly from LACERA’s CAFR for the year ended June 30, 2019 (certain terms have been modified to conform with the County’s CAFR presentation). The custodial credit risk, credit risk, concentration of credit risk, interest rate risk, and foreign currency risk related to Pension and OPEB Trust Funds investments are different than the corresponding risk on investments held by the Treasurer. Detailed deposit and investment risk disclosures are included in Note G, Note I and the fair value measurement disclosures are included in Note P of the LACERA’s CAFR.
Investments
Pension and OPEB Trust Funds investments are reported at fair value at June 30, 2019, (in thousands) and are as follows:
Fair ValueCash Collateral on Loaned Securities $ 814,829Short-term Investments 1,322,051Domestic and International Equity 26,460,105Fixed Income 18,508,520Real Estate* 6,312,866Private Equity 6,028,265Hedge Funds 1,890,739
Total $ 61,337,375
* Refer to Note J of LACERA’s CAFR for year ended June 30, 2019, for additional discussion on specialpurpose entities.
83

COUNTY OF LOS ANGELESNOTES TO THE BASIC FINANCIAL STATEMENTS
FOR THE YEAR ENDED JUNE 30, 20195. CASH AND INVESTMENTS-Continued
LACERA Investment Portfolio-Continued
Investments-Continued
The Pension and OPEB Trust Funds also had deposits with the Pool at June 30, 2019 totaling $96.22 million.
Concentration of Credit Risk
The Pension and OPEB Trust Funds portfolio contained no concentration of investments in any one organization (other than those issued or guaranteed by the U.S. Government) that represents 5% or more of total investments or plan net position.
Investment Risks
The County Employees Retirement Law of 1937 (CERL) vests the Board of Investments (BOI) with exclusive control over LACERA’s investment portfolio. The BOI established Investment Policy Statements and Manager Guidelines for the management of the LACERA defined benefit retirement plan (Pension Plan) and the LACERA Other Post-Employment Benefit Master Trust (OPEB Master Trust or OPEB Trust). BOI members exercise authority and control over the management of LACERA’s Net Position Restricted for Benefits by setting a policy that the investments staff executes either internally or through the use of prudent external experts.
Each Investment Policy Statement recognizes that every investment asset class and type is subject to certain risks. Outlined below are the Investment Risks as they relate to fixed income investments.
Credit Risk
Credit risk is the risk that an issuer or other counterparty to an investment will not fulfill its obligations, causing the investment to decline in value. LACERA seeks to maintain a diversified portfolio of fixed income instruments in order to obtain the highest total return for the Pension and OPEB plans at an acceptable level of risk within this asset class. To control credit risk, credit quality guidelines have been established.
Investment Grade Bonds
Investment Grade bonds are subdivided into two types of strategies: Core and Core Plus, with target allocation weights of 80% for Core and 20% for Core Plus. Investment guidelines for Core managers require that they invest predominantly in sectors represented in their benchmark index, which consists 100% of bonds rated investment grade. As a result, Core portfolios consist almost 100% of bonds rated investment grade by the major credit rating agencies: Moody’s, S&P, and Fitch. Core Plus managers are afforded some latitude to deviate from the benchmark index in order to generate excess return, so investment grade bonds must comprise at least 70% of Core Plus portfolios.
84

COUNTY OF LOS ANGELESNOTES TO THE BASIC FINANCIAL STATEMENTS
FOR THE YEAR ENDED JUNE 30, 20195. CASH AND INVESTMENTS-Continued
LACERA Investment Portfolio-Continued
High Yield Bonds
High yield portfolios use the following credit quality guidelines.
• At least 95.00% of all rated securities, including Rule 144A securities, must be rated B- or higher byS&P or equivalent by a major credit rating agency at the time of purchase.
• Consistent with the preceding requirement, a maximum of 5.00% of the portfolio may be investedin issues rated below B- by S&P or equivalent; however, these issues must be rated at least CCCby S&P or Caa by Moody’s.
• Unrated issues may be purchased, provided that, in the judgment of the Investment Manager, theywould not violate LACERA’s minimum credit criteria.
• Money market instruments must be rated at least A-2/P-2 or equivalent by at least one major creditrating agency.
The credit portfolios allow for the assumption of more credit risk than Investment Grade portfolios by investing in securities that include unrated bonds, bonds rated below investment grade issued by corporations undergoing financial stress or distress, junior tranches of structured securities backed by residential and commercial mortgages, bank loans, illiquid credit, and emerging market debt. LACERA utilizes specific investment guidelines for these portfolios that limit maximum exposure by issuer, industry, and sector, which result in well-diversified portfolios.
The following is a schedule as of June 30, 2019 of the credit quality ratings by Moody’s, a nationally recognized statistical rating organization, of investments in fixed income securities. Whole loan mortgages included in the Pension Plan portfolio of $27.21 million are excluded from this presentation.
Credit Quality Ratings of Investments in Fixed Income Securities - Pension PlanAs of June 30, 2019 (dollars in thousands)
Quality RatingsU.S.
TreasuriesU.S. Govt.Agencies Municipals
CorporateDebt/CreditSecurities
PooledInvestment
Non U.S.Fixed
Income
PrivatePlacement
FixedIncome Total
Percentageof Portfolio
Aaa $ 1,605,167 $ 2,040,089 $ 831 $ 237,230 $ $ 1,980 $ 227,427 $ 4,112,724 22.85%Aa 4,245 24,668 179,219 3,986 61,327 273,445 1.52%A 8,696 659,900 11,610 247,339 927,545 5.15%Baa 13,913 976,853 10,907 273,128 1,274,801 7.08%Ba 392,778 9,757 287,172 689,707 3.83%B 91 770,865 36,157 411,389 1,218,502 6.77%Caa 164,700 558 127,317 292,575 1.63%Ca 4,918 36,179 1,519 42,616 0.24%C 574 3 577 0.00%Not Rated 100,216 5,134 182,793 8,555,790 10,824 314,293 9,169,050 50.93%Total Investment in Fixed Income Securities - Pension Plan $ 1,605,167 $ 2,144,550 $ 58,251 $ 3,601,091 $ 8,555,790 $ 85,779 $ 1,950,914 $18,001,542 100.00%
85

COUNTY OF LOS ANGELESNOTES TO THE BASIC FINANCIAL STATEMENTS
FOR THE YEAR ENDED JUNE 30, 20195. CASH AND INVESTMENTS-Continued
LACERA Investment Portfolio-Continued
High Yield Bonds-Continued
Credit Quality Ratings of Investments in Fixed Income Securities - OPEB TrustAs of June 30, 2019(dollars in thousands)
Quality Ratings U.S. Treasuries
CorporateDebt/CreditSecurities
PooledInvestments
PrivatePlacement
Fixed Income TotalPercentage of
PortfolioAaa $ 2,993 $ 825 $ $ 512 $ 4,330 0.90%Aa 1,333 468 1,801 0.37%A 3,382 1,249 4,631 0.97%Not Rated 679 468,061 271 469,011 97.76%Total Investment in FixedIncome Securities - OPEBTrust $ 2,993 $ 6,219 $ 468,061 $ 2,500 $ 479,773 100.00%
Custodial Credit Risk
LACERA’s contract with its primary custodian State Street Bank and Trust (Bank) provides that the Bank may hold LACERA’s securities registered in the Bank’s or its agent’s nominee name, in bearer form, book-entry form, with a clearing house corporation, or with a depository, so long as the Bank’s records clearly indicate that the securities are held in custody for LACERA’s account. The Bank may also hold securities in custody in LACERA’s name when required by LACERA. When held in custody by the Bank, the securities are not at risk of loss in the event of the Bank’s financial failure, because the securities are not property (assets) of the Bank. Cash invested overnight in the Bank’s depository accounts is subject to the risk that in the event of the Bank’s failure, LACERA might not recover all or some of those overnight deposits. This risk is mitigated when the overnight deposits are insured or collateralized.
LACERA’s policy as incorporated in its current contract with the Bank requires the Bank to certify it has taken all steps to assure all LACERA monies on deposit with the Bank are eligible for and covered by “pass-through insurance,” in accordance with applicable law and FDIC rules and regulations. The steps taken by the Bank include paying deposit insurance premiums when due, maintaining a “prompt corrective action” capital category of “well capitalized,” and identifying on the Bank’s records that it acts as a fiduciary for LACERA with respect to the monies on deposit. In addition, the Bank is required to provide evidence of insurance and to maintain a Financial Institution Bond, which would cover the loss of money and securities with respect to any and all property the Bank or its agents hold in or for LACERA’s account, up to the amount of the bond. To implement certain investment strategies, some of LACERA’s assets are invested in investment managers’ pooled vehicles. The securities in these vehicles may be held by a different custodian other than the Bank.
86

COUNTY OF LOS ANGELESNOTES TO THE BASIC FINANCIAL STATEMENTS
FOR THE YEAR ENDED JUNE 30, 20195. CASH AND INVESTMENTS-Continued
LACERA Investment Portfolio-Continued
Counterparty Risk
Counterparty risk for investments is the risk that, in the event of the failure of the counterparty to completea transaction, LACERA would not be able to recover the value of the investment or collateral securitiesthat are in the possession of an outside party. LACERA and its managers seek to minimize risk of lossfrom its counterparties by diversifying the number of counterparties, periodically reviewing their creditquality and seeking to structure agreements so that collateral is posted on accrued gains if they reachcertain size thresholds.
Concentration of Credit Risk
No more than 5.00% of the Investment Grade bond and High Yield bond portfolios may be invested insecurities of a single issuer, except: U.S. Treasury securities, government-guaranteed debt (includingG-7 countries), agency debt, agency mortgage-backed securities, and approved commingled funds.
As of June 30, 2019, LACERA did not hold any investments in any one issuer that would represent 5.00% or more of the Pension Plan Fiduciary Net Position nor the OPEB Trust Fiduciary Net Position. Investments issued or explicitly guaranteed by the U.S. government and pooled investments are excluded from this requirement.
Interest Rate Risk
Interest rate risk is the risk that changes in interest rates will adversely affect the fair value of an investment. Duration is a measure of the price sensitivity of a fixed income portfolio to changes in interest rates. It is calculated as the weighted average time to receive a bond’s coupon and principal payments. The longer the duration of a portfolio, the greater its price sensitivity to changes in interest rates.
To manage interest rate risk, the duration of all Investment Grade bond portfolios is restricted to +/- 25.00% of the duration of the portfolios’ respective benchmarks. Deviations from any of the stated guidelines require prior written authorization from LACERA.
87

COUNTY OF LOS ANGELESNOTES TO THE BASIC FINANCIAL STATEMENTS
FOR THE YEAR ENDED JUNE 30, 20195. CASH AND INVESTMENTS-Continued
LACERA Investment Portfolio-Continued
Interest Rate Risk-Continued
The Duration in Fixed Income Securities - Pension Plan schedule for the year ended June 30, 2019 presents the duration by investment type. Whole loan mortgages included in the Pension Plan portfolio of $27.21 million are excluded from this presentation.
Duration in Fixed Income Securities - Pension PlanAs of June 30, 2019 (dollars in thousands)
Investment Type Fair Value
Portfolio WeightedAverage Effective
Duration*
U.S. Treasuries, U.S. Government Agency, and Municipal Instruments:U.S. Treasuries $ 1,605,167 8.26U.S. Government Agency 2,144,550 1.86Municipal / Revenue Bonds 58,251 9.12
Subtotal U.S. Treasuries, U.S. Government Agency, and Municipal Instruments 3,807,968
Corporate Bonds and Credit Securities:Asset-Backed Securities 506,275 1.63Corporate and Other Credit 3,121,985 3.55Fixed Income Swaps and Options (27,169) N/APooled Funds 8,555,790 N/A
Subtotal Corporate Bonds and Credit Securities 12,156,881
Non-U.S. Fixed Income 85,779 3.17Private Placement Fixed Income 1,950,914 3.03
Subtotal Non-U.S. and Private Placement Securities 2,036,693Total Fixed Income Securities - Pension Plan $ 18,001,542
*Effective Duration is a measure of a bond's sensitivity to interest rates. It is calculated as the percentage change in a bond'sprice caused by a change in the bond's yield. For example, a duration of 5 indicates that a 1.00% increase in a bond's yieldwill cause the bond price to decline 5.00%.
88

COUNTY OF LOS ANGELESNOTES TO THE BASIC FINANCIAL STATEMENTS
FOR THE YEAR ENDED JUNE 30, 20195. CASH AND INVESTMENTS-Continued
LACERA Investment Portfolio-Continued
Interest Rate Risk-Continued
Duration in Fixed Income Securities - OPEB TrustAs of June 30, 2019 (dollars in thousands)
Investment Type Fair Value
Portfolio WeightedAverage Effective
Duration*
U.S. Treasuries Instruments:U.S. Treasuries $ 2,993 1.16
Subtotal U.S. Treasuries Instruments 2,993
Corporate Bonds and Credit Securities:Asset-Backed Securities 1,334 0.27Corporate and Other Credit 4,885 0.55Pooled Investments 468,061 N/A
Subtotal Corporate Bonds and Credit Securities 474,280Private Placement Fixed Income 2,500 0.62Total Fixed Income Securities - OPEB Trust $ 479,773
*Effective Duration is a measure of a bond's sensitivity to interest rates. It is calculated as the percentage change in a bond'sprice caused by a change in the bond's yield. For example, a duration of 5 indicates that a 1.00% increase in a bond's yieldwill cause the bond price to decline 5.00%.
Foreign Currency Risk
Foreign currency risk is the risk that changes in exchange rates will adversely affect the fair value of an investment or deposit. LACERA’s authorized managers are permitted to invest in approved countries or regions, as stated in their respective investment guidelines. To mitigate foreign currency risk with global equity, LACERA has implemented a passive currency hedging program, which hedges into U.S. dollars approximately 50.00% of LACERA’s foreign currency exposure for developed market equities.
The following schedule represents LACERA’s exposure to foreign currency risk in U.S. dollars. LACERA is invested in several non-U.S. commingled funds. This means LACERA owns units of commingled funds, and the fund holds the actual securities and/or currencies. The values shown include LACERA’s pro rata portion of non-U.S. commingled fund holdings.
89

COUNTY OF LOS ANGELESNOTES TO THE BASIC FINANCIAL STATEMENTS
FOR THE YEAR ENDED JUNE 30, 20195. CASH AND INVESTMENTS-Continued
LACERA Investment Portfolio-Continued
Non-U.S. Investment Securities at Fair Value - Pension PlanAs of June 30, 2019(in thousands)
Currency Equity FixedIncome
ForeignCurrency
Real EstateCommingled Funds
Private EquityInvestments
ForwardContracts Total
AFRICAGhanaian Cedi $ $ 216 $ $ $ $ $ 216Kenya Shilling 1,884 1,884Moroccan Dirham 3,425 3,425Nigerian Naira 11,860 199 12,059South African Rand 210,439 12,135 26 222,600
AMERICASArgentine Peso 5,374 15,001 159 (88) 20,446Brazilian Real 212,043 40,224 507 252,774Canadian Dollar 995,278 597 (583) (8,732) 986,560Chilean Peso 29,486 4,711 34,197Colombian Peso 14,749 13,342 2 28,093Dominican Peso 215 215Mexican Peso 83,676 28,228 1,353 (72) 113,185Peruvian New Sol 10,213 5,610 15,823Uruguayan Peso 792 792
ASIAAustralian Dollar 440,681 3,989 374 4,055 449,099Chinese Renminbi 202,261 8,630 247 211,138Hong Kong Dollar 911,449 16 1,280 (280) 912,465Indian Rupee 287,263 15,991 303,254Indonesian Rupiah 61,900 26,622 63 88,585Japanese Yen 1,586,453 (982) 3,772 (24,744) 1,564,499Malaysian Ringgit 49,707 4,522 29 54,258New Zealand Dollar 36,756 238 73 (120) 36,947Pakistan Rupee 913 913Philippine Peso 27,783 1,825 1 29,609Singapore Dollar 103,413 6,114 70 2 109,599South Korean Won 442,579 8,084 450,663Taiwan Dollar 215,762 4,773 220,535Thai Baht 87,955 12,617 5 100,577Vietnamese Dong 33,649 33,649
EUROPEBritish Pound Sterling 1,607,880 24,663 5,637 1,497 29,526 21,462 1,690,665Czech Republic Koruna 2,090 12,597 14,687Danish Krone 160,765 8,891 81 (913) 168,824Euro 2,700,632 109,089 16,151 214,554 246,944 (14,453) 3,272,917Hungarian Forint 14,420 11,199 30 25,649Iceland Krona 55 55Norwegian Krone 75,780 566 (36) 76,310Polish Zloty 25,231 22,626 25 47,882Romanian New Leu 13,717 3,741 17,458Russian Ruble 92,780 23,715 454 2 116,951Swedish Krona 315,312 270 (1,270) 314,312Swiss Franc 721,518 49 (10,084) 711,483Ukrainian Hryvnia 1,046 1,046
MIDDLE EASTEgyptian Pound 12,027 2,950 14,977Israeli New Shekel 71,842 1,345 33 (119) 73,101Jordanian Dinar 5,133 5,133Qatari Rial 14,716 43 14,759Saudi Riyal 24,685 (1,250) 23,435Turkish Lira 50,502 3,311 10 53,823UAE Dirham 17,092 10 17,102
Total Investment Securities Subject toForeign Currency Risk - PensionPlan $ 11,993,073 $ 437,687 $ 30,737 $ 216,051 $ 276,470 $ (35,390) $12,918,628
90

COUNTY OF LOS ANGELESNOTES TO THE BASIC FINANCIAL STATEMENTS
FOR THE YEAR ENDED JUNE 30, 20195. CASH AND INVESTMENTS-Continued
LACERA Investment Portfolio-Continued
Non-U.S. Investment Securities at Fair Value - OPEB TrustAs of June 30, 2019(in thousands)
Currency Equity Fixed Income Total
AFRICALiberian Dollar $ $ 3 $ 3South African Rand 4,243 4,287 8,530
AMERICASArgentine Peso 250 175 425Brazilian Real 5,553 5,014 10,567Canadian Dollar 19,218 5,285 24,503Cayman Islands Dollar 876 876Chilean Peso 749 1,742 2,491Colombian Peso 312 3,450 3,762Dominican Peso 96 96Mexican Peso 1,872 5,527 7,399Panamanian Balboa 76 76Peruvian New Sol 250 1,778 2,028Uruguayan Peso 158 158
ASIAAustralian Dollar 13,664 428 14,092Chinese Renminbi 21,152 21,152Hong Kong Dollar 7,051 7,051Indian Rupee 6,988 6,988Indonesian Rupiah 1,560 4,976 6,536Japanese Yen 46,734 478 47,212Malaysian Ringgit 1,622 2,971 4,593New Zealand Dollar 686 686Pakistan Rupee 62 62Philippine Peso 811 270 1,081Singapore Dollar 2,683 8 2,691South Korean Won 9,172 116 9,288Taiwan Dollar 8,423 8,423Thai Baht 2,246 4,248 6,494
EUROPEBritish Pound Sterling 32,196 2,852 35,048Czech Republic Koruna 125 2,127 2,252Danish Krone 3,307 55 3,362Euro 59,025 7,191 66,216Hungarian Forint 187 2,232 2,419Norwegian Krone 1,685 138 1,823Polish Zloty 811 4,490 5,301Romanian Leu 1,204 1,204Russian Ruble 2,621 3,976 6,597Swedish Krona 5,927 193 6,120Swiss Franc 16,534 16,534
MIDDLE EASTEgyptian Pound 125 125Iraqi Dinar 217 217Israeli New Shekel 1,435 32 1,467Jordanian Dinar 7 7Qatari Rial 686 686Saudi Riyal 998 998Turkish Lira 437 1,773 2,210UAE Dirham 499 499
Total Investment Securities Subject to Foreign Currency Risk - OPEB Trust $ 281,899 $ 68,449 $ 350,348
91

COUNTY OF LOS ANGELESNOTES TO THE BASIC FINANCIAL STATEMENTS
FOR THE YEAR ENDED JUNE 30, 20195. CASH AND INVESTMENTS-Continued
LACERA Investment Portfolio-Continued
Securities Lending Program
The Board of Investments’ policies authorize LACERA to participate in a securities lending program. Securities lending is an investment management activity that mirrors the fundamentals of a loan transaction. Securities are lent to brokers and dealers (borrower), and in turn, LACERA receives cash and non-cash collateral. When cash collateral is received, the income that is generated from securities lending has two sources: lending and reinvestment. LACERA pays the borrower interest on the collateral and invests the collateral with the goal of earning a higher yield than the interest rate paid to the borrower. When non-cash collateral is received, the borrower pays a fee for borrowing the security.
LACERA’s securities lending program is managed by two parties: LACERA’s custodian bank, State Street Bank and Trust, and a third-party lending agent, Goldman Sachs Agency Lending (GSAL). The Bank lends LACERA’s non-U.S. equities, U.S. Treasury, and U.S. Agency securities. GSAL lends LACERA’s U.S. equities and corporate bonds. Collateralization is set on non-U.S. loans at 105% and on U.S. loans at 102% of the market value of securities on loan.
State Street Global Advisors invests the collateral received from both lending programs. The collateral is invested in short-term highly liquid instruments. The maturities of the investments made with cash collateral typically do not match the maturities of their securities loans. Loans are marked-to-market daily, so that if the market value of a security on loan rises, LACERA receives additional collateral. Conversely, if the market value of a security on loan declines, then the borrower receives a partial return of the collateral. Earnings generated in excess of the interest paid to the borrowers represent net income. LACERA shares this net income with the two lending agents based on contractual agreements.
Under the terms of their lending agreements, both lending agents provide borrower default indemnification in the event a borrower does not return securities on loan. The terms of the lending agreements entitle LACERA to terminate all loans upon the occurrence of default and purchase a like amount of “replacement securities” when loaned securities are not returned. LACERA does not have the ability to pledge assets received as collateral without a borrower default. In the event the purchase price of replacement securities exceeds the amount of collateral, the lending agent is liable to LACERA for the difference, plus interest. Either LACERA or the borrower of the security can terminate a loan on demand.
At fiscal year end, LACERA had no credit risk exposure to borrowers, because the amount of collateral received exceeded the value of securities on loan. As of June 30, 2019, there were no known violations of legal or contractual provisions. LACERA had no losses on securities lending transactions resulting from the default of a borrower for the year ended June 30, 2019.
As of June 30, 2019, the fair value of securities on loan was $927.07 million, with a value of cash collateral received of $814.83 million, which is included in Other payables on the financial statements, and non-cash collateral of $136.35 million. LACERA’s income, net of expenses from securities lending, was $4.49 million for the year ended June 30, 2019.
92

COUNTY OF LOS ANGELESNOTES TO THE BASIC FINANCIAL STATEMENTS
FOR THE YEAR ENDED JUNE 30, 20195. CASH AND INVESTMENTS-Continued
LACERA Investment Portfolio-Continued
Securities Lending Program-Continued
Securities Lending As of June 30, 2019 (in thousands)
Securities on Loan
Fair Value ofSecurities on
Loan
CashCollateralReceived
Non-CashCollateralReceived
Calculated Mark (1)
U.S. Equity $ 197,819 $ 199,522 $ $U.S. Fixed Income 674,828 604,323 90,445 115Non-U.S. Equity 54,423 10,984 45,906 1,204Total $ 927,070 $ 814,829 $ 136,351 $ 1,319
(1) Calculated Mark is performed daily, and it is the amount LACERA will collect from the borrower (if the amount is positive),or payment to the borrower (if the amount is negative), to bring the collateralization to appropriate levels based on marketvalue.
Interest Rate Risk
Interest rate risk is the risk that changes in interest rates will adversely affect the fair value of an investment. Interest rate swaps are an example of an investment that has a fair value that is highly sensitive to interest rate changes. These investments are disclosed in the following table:
Interest Rate Risk AnalysisAs of June 30, 2019 (dollars in thousands)
Investment Maturities (in years)
Investment Type
NotionalValue
(Dollar)
NotionalSharesUnits
FairValue
LessThan 1 1 - 5 6 - 10
Morethan 10
Credit Default Swaps Bought $ 136,585 $ (9,509) $ $ (9,509) $ $Credit Default Swaps Written 22,574 618 608 9Fixed Income Options Bought 38,600 36 36Fixed Income Options Written (255,602) (74) (72) (1) (1)Pay Fixed Interest Rate Swaps 1,082,132 (32,205) (10,106) (7,664) (14,436)
Receive Fixed Interest RateSwaps 222,420 3,963 1,184 273 181 2,325Total Return Swaps Bond 73,135 (1,263) (1,263)Total Return Swaps Equity (518,403) 11,551 11,610 (59)
Total $1,018,443 (217,002) $(26,883) $ 11,495 $(18,794) $ (7,483) $(12,103)
93

COUNTY OF LOS ANGELESNOTES TO THE BASIC FINANCIAL STATEMENTS
FOR THE YEAR ENDED JUNE 30, 20195. CASH AND INVESTMENTS-Continued
LACERA Investment Portfolio-Continued
Hedge Funds
The hedge fund category of investments is not a separate asset class but is comprised of strategies that may: 1) invest in securities within LACERA’s existing asset classes or across multiple asset classes; 2) have an absolute return objective; and 3) include the ability to use specialized techniques, such asleverage and short-selling, and instruments such as derivatives.
As of the fiscal year end, LACERA employed two hedge fund of funds managers, Grosvenor Capital Management (GCM) and Goldman Sachs Asset Management (GSAM), with discretion to construct hedge fund portfolios. The hedge fund of funds managers identify, select, implement, and monitor portfolios consistent with LACERA’s stated objectives, constraints, and Investment Policy Statement. Additionally, LACERA invested directly with five investment managers as part of a Direct hedge funds portfolio.
LACERA’s Investment Policy Statement establishes the portfolio framework for the hedge funds program. Each underlying investment in the entire hedge fund program is in an entity legally structured to limit liability for each investor to the capital invested by that investor.
The GCM diversified portfolio, GSAM diversified portfolio, and Direct portfolio reside within the Diversified Hedge Funds class under the Risk Reduction and Mitigation functional asset category of LACERA’s Total Fund, and the GCM credit portfolio resides within the Credit functional asset category. A prior credit portfolio, also managed by GCM, was liquidated during the fiscal year.
The investment performance for this strategy is measured separately from other asset classes. The fair value of assets invested in hedge funds as of June 30, 2019 was $1.891 billion.
Fair Value
For the year ended June 30, 2016, LACERA adopted GASB 72, "Fair Value Measurement and Application". GASB 72 was issued to address accounting and financial reporting issues related to fair value measurements and disclosures. LACERA categorizes its fair value measurements within the fair value hierarchy established by GAAP. The hierarchy is based on the valuation inputs used to measure the fair value of the investment securities and assets. Level 1 inputs are quoted prices in active markets for identical assets; Level 2 inputs are significant other observable inputs; Level 3 inputs are significant unobservable inputs. Certain investments held by LACERA are valued at net asset value (NAV) per share when an investment does not have a readily determined fair value, provided that the NAV is calculated and used as a practical expedient to estimate fair value in accordance with the requirements of GAAP.
94

COUNTY OF LOS ANGELESNOTES TO THE BASIC FINANCIAL STATEMENTS
FOR THE YEAR ENDED JUNE 30, 20195. CASH AND INVESTMENTS-Continued
LACERA Investment Portfolio-Continued
Fair Value-Continued
Equity and Fixed Income Securities
Equity securities classified in Level 1 of the fair value hierarchy are valued using prices quoted in active markets issued by pricing vendors for these securities. Fixed income and equity securities classified in Level 2 of the fair value hierarchy are valued using prices determined by matrix pricing techniques maintained by the various pricing vendors for these securities. Matrix pricing is used to value securities based on the securities’ relationship to benchmark quoted prices. Fixed income and equity securities classified in Level 3 are securities whose stated market price is unobservable by the marketplace; many of these securities are priced by the issuers or industry groups for these securities. Fair value is defined as the quoted market value on the last trading day of the period. These prices are obtained from various pricing sources by LACERA's custodian bank.
Hedge Funds, Private Equity, and Real Estate Funds
Investments in hedge funds, private equity, and real estate funds are valued at estimated fair value, as determined in good faith by the General Partner (GP), in accordance with GAAP fair value principles and in instances where no observable public market values are available. Investments which are estimated at fair value, are initially valued at cost with subsequent adjustments that reflect third party transactions, financial operating results, and other factors deemed relevant by the GP. These assets are reported by LACERA based on the practical expedient allowed under GAAP.
Real Estate Separate Account Investments
Investments in real estate are valued at estimated fair value, as determined in good faith by the Investment Manager. These investments are initially valued at cost with subsequent adjustments that reflect third party transactions, financial operating results, and other factors deemed relevant by the Investment Manager. Properties are subject to independent third party appraisals every three years.
95

COUNTY OF LOS ANGELESNOTES TO THE BASIC FINANCIAL STATEMENTS
FOR THE YEAR ENDED JUNE 30, 20195. CASH AND INVESTMENTS-Continued
LACERA Investment Portfolio-Continued
Fair Value-Continued
Investments and Derivatives Measured at Fair Value - Pension Plan As of June 30, 2019 (in thousands)
Investments by Fair Value Level Total
Quoted Prices InActive Markets forIdentical Assets
Level 1
Significant OtherObservable Inputs
Level 2
SignificantUnobservableInputs Level 3
Fixed Income SecuritiesAsset-Backed Securities $ 506,275 $ $ 506,194 $ 81Corporate and Other Credit 3,121,985 3,116,458 5,527Municipal/Revenue Bonds 58,251 58,251Non-U.S. Fixed Income 85,780 85,780Pooled Investments 7,243 7,243Private Placement Fixed Income 1,950,914 1,950,914U.S. Government Agency 2,144,550 2,144,550U.S. Treasuries 1,605,167 1,605,167Whole Loan Mortgages 27,205 27,205
Total Fixed Income Securities 9,507,370 7,243 9,467,314 32,813
Equity SecuritiesNon-U.S. Equity 1,811,817 1,810,709 1,100 8Pooled Investments 285,532 285,532U.S. Equity 13,932,458 13,920,038 11,499 921
Total Equity Securities 16,029,807 16,016,279 12,599 929
Collateral from Securities Lending 814,829 814,829
Total Investments by Fair Value Level $ 26,352,006 $ 16,023,522 $ 10,294,742 $ 33,742
Investments Measured at NAVFixed Income $ 8,548,547Equity 9,805,218Hedge Funds 1,890,739Private Equity 6,028,265Real Estate 6,192,619Total Investments Measured at NAV 32,465,388
Total Investments $ 58,817,394
DerivativesForeign Exchange Contracts $ (35,389) $ $ (35,389) $
Foreign Fixed Income Derivatives 5,868 (10) 5,878
Foreign Equity Derivatives (223) (223)
U.S. Equity Derivatives 1,264 1,264
U.S. Fixed Income Derivatives (33,038) (314) (32,724)
Total Derivatives $ (61,518) $ 717 $ (62,235) $
96

COUNTY OF LOS ANGELESNOTES TO THE BASIC FINANCIAL STATEMENTS
FOR THE YEAR ENDED JUNE 30, 20195. CASH AND INVESTMENTS-Continued
LACERA Investment Portfolio-Continued
Fair Value-Continued
Investments Measured at the Net Asset Value - Pension PlanAs of June 30, 2019 (dollars in thousands)
Fair ValueUnfunded
Commitments Redemption Frequency (If Currently Eligible)Redemption
Notice Period
Commingled Fixed Income Funds (1) $ 8,548,547 $ Daily, Monthly or Not Eligible 1-60 days or N/A
Commingled Equity Funds (2) 9,805,218 14,544 Daily, Monthly or Not Eligible 1-60 days or N/A
Hedge Funds (3) 1,890,739 18,500 Daily, Monthly, Quarterly, Semi-Annual, Annual,Self-Liquidating 5-180 days
Private Equity (4) 6,028,265 4,337,030 Not Eligible N/A
Real Estate (4) 6,192,619 970,531 Quarterly or Not Eligible 30 days+ or N/A
Total Investments Measured at the NAV $32,465,388
(1) Commingled Fixed Income Funds: 9 fixed income funds are considered commingled in nature. They are valued at the NAV of unitsheld at the end of the period based upon the fair value of the underlying investments. Most of the funds are highly liquid within onemonth; 2 of the funds representing 3% of Commingled Fixed Income assets have liquidity available at the end of the fund terms whichrange from 3 to 7 years.
(2) Commingled Equity Funds: 13 equity funds are considered commingled in nature. They are valued at the NAV of units held at the endof the period based upon the fair value of the underlying investments. Most of the funds are highly liquid within one month; 3 of thefunds representing 5% of Commingled Equity assets have liquidity subject to lock up periods that limit or prohibit redemptions for thenext 3 to 4 years.
(3) Hedge Funds: This portfolio consists of 70 funds. Hedge Fund investments are valued at NAV per share. When considering liquidityterms, 78% of the fund assets are available within 12 months; these funds provide daily, monthly, quarterly, semi-annual, or annualliquidity. Some of these funds are subject to redemption notices that extend the time frame to receive redemptions beyond the next12 months. The remaining 22% of fund assets are in self-liquidating funds which do not permit voluntary redemption/withdrawals orin funds that offer periodic liquidity that extends beyond the next 12 months.
LACERA's Hedge Funds portfolio invests in the following strategies:(a) Macro and Tactical Trading: This strategy makes investments based on analyses and forecasts of macroeconomic trends, including
governmental and central bank policies, fiscal trends, trade imbalances, interest rate trends, inter-country relations, and economicand technical analysis.
(b) Equity Long/Short: This strategy purchases and/or sells equities based on fundamental and/or quantitative analysis and otherfactors.
(c) Credit: This strategy includes long-biased credit, long/short credit, structured credit, and mortgage credit.(d) Relative Value: This strategy’s main focus is to benefit from valuation discrepancies that may be present in related financial
instruments by purchasing and/or shorting these instruments.(e) Multi-Strategy: This strategy aims to pursue varying strategies in order to diversify risks and reduce volatility.(f) Event Driven: This strategy seeks to gain an advantage from pricing inefficiencies that may occur in the onset or aftermath of a
corporate action or related event.
(4) Private Equity and Real Estate Funds: LACERA’s Private Equity portfolio consists of 207 funds, investing primarily in Buyout Funds,with some exposure to Venture Capital, Special Situations. Due to contractual limitations, none of the 207 funds are eligible forredemption for up to 10 years. The Real Estate portfolio, composed of 23 commingled funds, invests in both U.S. and Non-U.S.commercial real estate. The fair values of these funds have been determined using net assets valued at the end of the period and netassets valued one quarter in arrears plus current quarter cash flows. 2 out of 23 Real Estate funds are eligible for redemption dependingupon the availability of cash for redemptions in the fund. Distributions are received as underlying investments within the funds areliquidated, which on average can occur over the span of 5 to 10 years. For Real Estate investments held in separate accounts anddebt program investments, see Note J - Special Purpose Entities of LACERA's CAFR.
97

COUNTY OF LOS ANGELESNOTES TO THE BASIC FINANCIAL STATEMENTS
FOR THE YEAR ENDED JUNE 30, 20195. CASH AND INVESTMENTS-Continued
LACERA Investment Portfolio-Continued
Fair Value-Continued
Investments Measured at Fair Value - OPEB TrustAs of June 30, 2019 (in thousands)
Investments by Fair Value Level Total
Quoted Prices inActive Markets
for IdenticalAssets Level 1
Significant OtherObservable
Inputs Level 2
SignificantUnobservableInputs Level 3
Fixed Income SecuritiesAsset-Backed Securities $ 1,334 $ $ 1,334 $Private Placement Fixed Income 2,500 2,500Corporate and Other Credit 4,885 4,885Pooled Investments 122,194 122,194U.S. Treasuries 2,993 2,993
Total Fixed Income Securities 133,906 122,194 11,712 —Total Investments by Fair Value Level $ 133,906 $ 122,194 $ 11,712 $
Investments Measured at Net Asset Value (NAV)Fixed Income $ 345,867Equity 624,039Real Estate Investment Trust (REIT) 120,247Total Investments Measured at NAV 1,090,153
Total Investments $ 1,224,059
Investments Measured at Net Asset Value - OPEB TrustAs of June 30, 2019(dollars in thousands)
Fair ValueUnfunded
Commitments (2)Redemption Frequency
(If Currently Eligible)Redemption
Notice PeriodCommingled Fixed Income Funds $ 345,867 $ Daily, Monthly 1-30 days or N/ACommingled Equity Fund 624,039 Daily, Monthly 1-30 days or N/AReal Estate Investment Trust (REIT) 120,247 Daily, Monthly 1-30 days or N/ATotal Investments Measured at NAV (1) $ 1,090,153
(1) Commingled Funds: The OPEB Master Trust is invested in 7 funds that are considered commingled in nature. They are valued at theNAV of units held at the end of the period based upon the fair value of the underlying investments. Most of the funds are highly liquidwithin one month.
(2) There are no unfunded commitments in the OPEB Trust. As of June 30, 2019, there was $2.26 million uninvested cash in the OPEBTrust which was deposited into the OPEB cash account and then subsequently invested after month end.
98

COUNTY OF LOS ANGELESNOTES TO THE BASIC FINANCIAL STATEMENTS
FOR THE YEAR ENDED JUNE 30, 20196. CAPITAL ASSETS
Capital assets activity for the year ended June 30, 2019 is as follows (in thousands):
Balance BalanceGovernmental Activities July 1, 2018 Additions Deletions June 30, 2019
Capital assets, not being depreciated:Land $ 2,454,914 24,070 — $ 2,478,984Easements 4,956,047 67,822 (37,045) 4,986,824Software in progress 17,533 45,673 (6,779) 56,427Construction in progress-buildings and
improvements 304,336 356,963 (129,556) 531,743Construction in progress-infrastructure 336,419 102,225 (22,494) 416,150
Subtotal 8,069,249 596,753 (195,874) 8,470,128
Capital assets, being depreciated:Buildings and improvements 5,733,153 353,349 (7,274) 6,079,228Equipment 1,688,641 184,911 (90,714) 1,782,838Software 490,208 10,804 — 501,012Infrastructure 7,930,769 35,934 (11,400) 7,955,303
Subtotal 15,842,771 584,998 (109,388) 16,318,381
Less accumulated depreciation for:Buildings and improvements (2,061,979) (124,928) (79,052) (2,265,959)Equipment (1,189,861) (122,294) 52,710 (1,259,445)Software (235,140) (43,308) — (278,448)Infrastructure (4,153,417) (157,155) 2,157 (4,308,415)
Subtotal (7,640,397) (447,685) (24,185) (8,112,267)
Total capital assets, being depreciated, net 8,202,374 137,313 (133,573) 8,206,114
Governmental activities capital assets, net $ 16,271,623 734,066 (329,447) $ 16,676,242
Business-type ActivitiesCapital assets, not being depreciated:
Land $ 153,058 — (18,126) $ 134,932Easements 31,578 56 — 31,634Construction in progress-buildings and
improvements 349,138 56,352 (144,285) 261,205Construction in progress-infrastructure 42,083 7,346 (12,453) 36,976
Subtotal 575,857 63,754 (174,864) 464,747
Capital assets, being depreciated:Buildings and improvements 2,749,234 145,345 (225,165) 2,669,414Equipment 412,371 67,961 (84,407) 395,925Software 58,922 — — 58,922Infrastructure 1,268,671 12,453 — 1,281,124
Subtotal 4,489,198 225,759 (309,572) 4,405,385
99

COUNTY OF LOS ANGELESNOTES TO THE BASIC FINANCIAL STATEMENTS
FOR THE YEAR ENDED JUNE 30, 20196. CAPITAL ASSETS-Continued
Business-type Activities-Continued
Balance BalanceJuly 1, 2018 Additions Deletions June 30, 2019
Less accumulated depreciation for:Buildings and improvements $ (888,659) (55,315) 90,418 $ (853,556)Equipment (265,298) (26,640) 33,682 (258,256)Software (38,980) (3,787) — (42,767)Infrastructure (624,864) (23,459) — (648,323)
Subtotal (1,817,801) (109,201) 124,100 (1,802,902)
Total capital assets, being depreciated, net 2,671,397 116,558 (185,472) 2,602,483
Business-type activities capital assets, net 3,247,254 180,312 (360,336) 3,067,230
Total capital assets, net $ 19,518,877 914,378 (689,783) $ 19,743,472
Depreciation Expense
Depreciation expense was charged to functions/programs of the primary government as follows (in thousands):
Governmental activities:General government $ 44,646Public protection 168,099Public ways and facilities 89,803Health and sanitation 49,670Public assistance 11,758Education 5,399Recreation and cultural services 43,931Capital assets held by the County’s internal service funds are charged to the various
functions based on their usage of the assets 34,379Total depreciation expense, governmental activities $ 447,685
Business-type activities:Hospitals $ 83,142Waterworks 23,877Aviation 2,182Total depreciation expense, business-type activities $ 109,201
100

COUNTY OF LOS ANGELESNOTES TO THE BASIC FINANCIAL STATEMENTS
FOR THE YEAR ENDED JUNE 30, 20196. CAPITAL ASSETS-Continued
Discretely Presented Component Units
LACDA
Capital assets activity for the LACDA component unit for the year ended June 30, 2019, was as follows(in thousands):
BalanceJuly 1, 2018 Additions Deletions
BalanceJune 30, 2019
Capital assets, not being depreciated:Land $ 92,447 — (3,183) $ 89,264Construction in progress-buildings and
improvements 4,881 2,941 (4,747) 3,075Subtotal 97,328 2,941 (7,930) 92,339
Capital assets, being depreciated:Buildings and improvements 228,680 8,970 — 237,650Equipment 10,355 161 (447) 10,069Software — 1,025 — 1,025
Subtotal 239,035 10,156 (447) 248,744
Less accumulated depreciation for:Buildings and improvements (155,690) (4,410) — (160,100)Equipment (8,315) (632) 434 (8,513)Software — (51) — (51)
Subtotal (164,005) (5,093) 434 (168,664)
Total capital assets being depreciated, net 75,030 5,063 (13) 80,080LACDA capital assets, net $ 172,358 8,004 (7,943) $ 172,419
First 5 LA
Capital assets activity for the First 5 LA component unit for the year ended June 30, 2019, was as follows (in thousands):
Balance BalanceJuly 1, 2018 Additions Deletions June 30, 2019
Capital assets, not being depreciated-Land $ 2,039 — — $ 2,039
Capital assets, being depreciated:Buildings and improvements 12,076 — — 12,076Equipment 2,815 97 — 2,912
Subtotal 14,891 97 14,988
Less accumulated depreciation for:Buildings and improvements (3,164) (242) — (3,406)Equipment (2,720) (60) — (2,780)
Subtotal (5,884) (302) (6,186)
Total capital assets being depreciated,net 9,007 (205) 8,802First 5 LA capital assets, net $ 11,046 (205) $ 10,841
101

COUNTY OF LOS ANGELESNOTES TO THE BASIC FINANCIAL STATEMENTS
FOR THE YEAR ENDED JUNE 30, 20197. SERVICE CONCESSION ARRANGEMENTS (SCA)
GASB 60, “Accounting and Financial Reporting for Service Concession Arrangements (SCA),” (GASB60) defines an SCA as a type of public-private or public-public partnership. An SCA is an arrangement,which meets specific criteria under GASB 60, between a government (the transferor) and an operator.
The County determined that golf courses met the criteria set forth in GASB 60 (where the County is the transferor) and therefore included these SCAs in the County’s financial statements as deferred inflows of resources. GASB 60 also provides guidance on accounting treatment if the County were acting as an operator of another government’s facility. The County has determined that there are no incidences where the County would qualify as an operator.
Golf Courses
The County manages a public golf course system, which offers affordable greens fees, discount programs for senior citizens and students, and a junior golf program. Each golf course is leased under agreement with an operator, which provides for activities such as golf course management, clubhouse operations, and food and beverage concessions. The operators collect user fees and are responsible for the day-to-day operations of the golf courses. The operators are required to operate and maintain the golf courses, and make installment payments to the County, in accordance with their respective contracts.
As of June 30, 2019, the present value of the installment payments under contract is estimated to be $82.85 million and reported as deferred inflows of resources in the statement of net position. The present values of the installment payments were calculated using discount rates of 5.12%, 3.55% and 3.70% for the term of the agreement for each SCA. The lease terms for the twenty golf courses cover remaining periods ranging from 5 to 20 years as of June 30, 2019. The FY 2018-2019 total monthly installment payments are approximately $667,000. The County primarily uses the proceeds to fund parks and recreation operations, 10% of which is set aside for future golf course capital improvements. The acquisition value of the golf courses, including land, buildings, and construction in progress, is reported at $24.37 million as of June 30, 2019.
8. PENSION PLAN
Plan Description
The County pension plan is administered by LACERA, which was established under the CERL. LACERAis a cost-sharing, multi-employer defined benefit plan. It provides benefits to employees of the Countyand the following additional entities that are not part of the County's reporting entity:
Los Angeles Superior CourtLittle Lake Cemetery DistrictLocal Agency Formation CommissionLos Angeles County Office of Education (LACOE)South Coast Air Quality Management District (SCAQMD)
New employees of LACOE hired on or after July 1971 and new employees of SCAQMD hired after December 31, 1979 are not eligible for LACERA benefits.
LACERA issues a stand-alone financial report, which is available at its offices located at Gateway Plaza, 300 N. Lake Avenue, Pasadena, California 91101-4199 or at www.LACERA.com.
102

COUNTY OF LOS ANGELESNOTES TO THE BASIC FINANCIAL STATEMENTS
FOR THE YEAR ENDED JUNE 30, 20198. PENSION PLAN-Continued
Benefits Provided
Benefits are authorized in accordance with the California Constitution, the CERL, the bylaws, andprocedures and policies adopted by LACERA's Boards of Retirement and Investments. The Boardmay also adopt resolutions, as permitted by CERL, which may affect the benefits of LACERA members.
LACERA provides retirement, disability, death benefits and cost of living adjustments to eligiblemembers. Vesting occurs when a member accumulates 5 years of creditable service under contributoryplans or accumulates 10 years of creditable service under the general service non-contributory plan.Benefits are based upon 12 or 36 months' average compensation, depending on the plan, as well asage at retirement and length of service as of the retirement date, according to applicable statutoryformula. Vested members who terminate employment before retirement age are considered terminatedvested (deferred) members. Service-connected disability benefits may be granted regardless of lengthof service consideration. Five years of service are required for nonservice-connected disability eligibilityaccording to applicable statutory formula. Members of the non-contributory plan, who are coveredunder separate long-term disability provisions not administered by LACERA, are not eligible for disabilitybenefits provided by LACERA.
Contributions
LACERA has nine benefit tiers known as A, B, C, D, E and G, and Safety A, B and C. All tiers exceptE are employee contributory. Tier E is employee non-contributory. Prior to December 31, 2012, newgeneral members were only eligible for tier D or E and new safety members were only eligible for SafetyB. As of January 1, 2013, new general employees are only eligible for tier G and new safety membersare only eligible for Safety C. These new tiers were added as a result of the California Public Employees’Pension Reform Act of 2013 (PEPRA) and became effective January 1, 2013. Rates for the tiers areestablished in accordance with State law by LACERA's Boards of Retirement and Investments and theCounty Board.
The following employer rates were in effect for FY 2018-2019:
July 1, 2018 - September 30, 2018 A B C D E GGeneral Members 26.06% 17.50% 16.80% 18.70% 19.57% 18.04%Safety Members 34.45% 27.75% 23.73%
October 1, 2018 - June 30, 2019 A B C D E GGeneral Members 26.94% 18.04% 16.85% 18.51% 19.84% 18.53%Safety Members 34.11% 28.36% 23.97%
103

COUNTY OF LOS ANGELESNOTES TO THE BASIC FINANCIAL STATEMENTS
FOR THE YEAR ENDED JUNE 30, 20198. PENSION PLAN-Continued
Contributions-Continued
The rates were determined by the actuarial valuation performed as of June 30, 2017. The assumptionsremained unchanged from the assumptions used in the actuarial valuation performed as of June 30,2016. The employer contribution rates used in FY 2018-2019, beginning October 1, 2018, increasedby 0.05% to 0.88% over the rates used in FY 2017-2018 and may increase again during the followingfiscal year. The most significant factor causing the increase was the additional year phase-in of thecost impact of the 2016 assumption changes.
Employee rates vary by option and employee entry age from 5% to 16% of their annual covered salary.
During FY 2018-2019, the County contributed the full amount of the Actuarial Determined Contribution,as determined by the actuarial valuations, in the form of semi-monthly cash payments in the amountof $1.605 billion.
Pension Liabilities, Pension Expense, and Deferred Outflows of Resources and Deferred Inflows ofResources Related to Pensions
At June 30, 2019, the County reported a liability of $10.345 billion for its proportionate share of the netpension liability in accordance with the parameters of GASB 68, "Accounting and Financial ReportingFor Pensions-An Amendment of GASB Statement No. 27" (GASB 68). The net pension liability wasmeasured as of June 30, 2018, and the total pension liability used to calculate the net pension liabilitywas determined by an actuarial valuation as of June 30, 2017, projected forward to the measurementdate, taking into account any significant changes between the valuation date and the measurementdate. The County’s proportion of the net pension liability was based on a projection of the County’sfuture contribution effort to the pension plan relative to the projected contributions of all Pension Planparticipants, actuarially determined. At June 30, 2018, the County’s proportionate share was 96.17%,which was an increase of 0.05% from its proportion measured as of June 30, 2017.
For the year ended June 30, 2019, the County recognized pension expense of $1.382 billion which isreported as $1.165 billion for governmental activities and $0.217 billion for business-type activities.Pension expense represents the change in the net pension liability during the measurement period,adjusted for actual contributions and the deferred recognition of changes in investment gain/loss,actuarial gain/loss, actuarial assumptions or methods, and plan benefits. At June 30, 2019, the Countyreported deferred outflows of resources and deferred inflows of resources related to pensions from thefollowing sources (in thousands):
Deferred Inflowsof Resources
Deferred Outflowsof Resources
Net difference between projected and actual earnings $ 418,426 $Change in assumptions 2,221,442Change in experience 650,863 260,144Change in proportion and differences between County
contributions and proportionate share of contributions 272,711 314,851Contributions made subsequent to measurement date 1,605,150
Total $ 1,342,000 $ 4,401,587
104

COUNTY OF LOS ANGELESNOTES TO THE BASIC FINANCIAL STATEMENTS
FOR THE YEAR ENDED JUNE 30, 20198. PENSION PLAN-Continued
Pension Liabilities, Pension Expense, and Deferred Outflows of Resources and Deferred Inflows ofResources Related to Pensions-Continued
Deferred outflows of resources and deferred inflows of resources above represent the unamortizedportion of changes to net pension liability to be recognized in future periods in a systematic and rationalmanner in accordance with GASB 68. Investment gains or losses are recognized in pension expenseover a five year period and economic/demographic gains or losses and assumption changes or inputsare recognized over the average remaining service life for all active and inactive members, which is 8years.
Amounts currently reported as deferred outflows and inflows of resources, other than contributionsrelated to pension, will be recognized in pension expense as follows (in thousands):
DeferredOutflows/(Inflows)
of ResourcesYear Ending June 30:2020 $ 623,9732021 312,9862022 (379,808)2023 102,3852024 352,829Thereafter 442,072
Deferred outflows of $1.605 billion related to contributions subsequent to the measurement date will be recognized as a reduction of the net pension liability in the year ending June 30, 2020.
Actuarial Assumptions
Valuation Timing June 30, 2017, rolled forward to June 30, 2018Actuarial Cost Method Individual Entry Age NormalInflation 2.75%General Wage Growth 3.25%Projected Salary Increases 3.51% to 11.51%Investment Rate of Return 7.38%, net of investment expense, including inflationCost of Living Adjustments (COLA) Based on changes in the Consumer Price Index from the
previous January 1 to the current January 1, to the nearest 0.50% of 1.00%, limited to a maximum of 3.00%. Supplemental Targeted Adjustment for Retirees (STAR) COLA benefits are assumed to be substantively automatic at the 80% purchasing power level until the STAR reserve is projected to be insufficient to pay further STAR benefits.
Mortality Various rates based on the RP-2014 Healthy and Disabled Annuitant mortality tables and including projection for expected future mortality improvement using the MP2014 Ultimate Projection Scale. See June 30, 2017 actuarial valuation for details. It can be found at www.LACERA.com.
Experience Study Covers the three year period ended June 30, 2016.
105

COUNTY OF LOS ANGELESNOTES TO THE BASIC FINANCIAL STATEMENTS
FOR THE YEAR ENDED JUNE 30, 20198. PENSION PLAN-Continued
Actuarial Assumptions-Continued
The long-term expected rate of return on pension plan investments (7.25%, net of all expenses) wasdetermined using a building block method in which a median, or expected, geometric rate of return wasdeveloped for each major asset class. The median rates were combined to produce the long-termexpected rate of return by weighting the expected future rates of return by the target asset allocationpercentages.
For the year ended June 30, 2018:
Asset Class Target Allocation
Weighted Average Long-Term Expected Rate ofReturn (After Expected2.75% Inflation Rate)
(Geometric)Global Equity 43.40% 5.70%Fixed Income 26.60% 2.60%Real Estate 11.00% 4.60%Private Equity 10.00% 6.90%Commodities 2.80% 1.60%Hedge Funds 4.20% 3.10%Other Opportunities 0.00% 4.50%Cash 2.00% (0.20)%
Discount Rate
The discount rate used to measure the total pension liability was 7.38%. This is equal to the 7.25%long-term investment return assumption adopted by LACERA (net of investment and administrative expenses), plus 0.13% assumed administrative expenses. The projection of cash flows used to determine the discount rate assumed that plan member contributions will be made at the current contribution rate, and that County contributions will be made at rates equal to the difference between actuarially determined contribution rates and member rates. Based on those assumptions, the pension plan’s fiduciary net position was projected to be sufficient to pay all projected future benefit payments of current active and inactive plan members. Therefore, the discount rate for calculating the total pension liability is equal to the long-term expected rate of return, gross of administrative expenses.
Sensitivity of the County’s Proportionate Share of the Net Pension Liability to Changes in the Discount Rate
The following represents the County’s proportionate share of the net pension liability calculated using the discount rate of 7.38%, as well as what the County’s proportionate share of the net pension liability would be if it were calculated using a discount rate that is 1-percentage point lower (6.38%) or 1-percentage point higher (8.38%) than the current rate (in thousands):
1%Decrease
DiscountRate
1%Increase
(6.38%) (7.38%) (8.38%)Net Pension Liability $19,053,004 $10,345,209 $ 3,146,511
106

COUNTY OF LOS ANGELESNOTES TO THE BASIC FINANCIAL STATEMENTS
FOR THE YEAR ENDED JUNE 30, 20198. PENSION PLAN-Continued
Pension Plan Fiduciary Net Position
Detailed information about pension plan fiduciary net position as of June 30, 2018 is available in theseparately issued LACERA financial report, which can be found at www.LACERA.com.
Deferred Compensation Plans
The County offers to its employees three deferred compensation plans created in accordance withSections 401 and 457 of the Internal Revenue Code. One or more of these plans are available tosubstantially all employees and allow participants to defer a portion of their current income until futureyears.
Plan Description and Funding Policy
The Deferred Compensation and Thrift Plan was established as a Section 457 defined contribution plan covering employees who have achieved full time and permanent employment status. The Plan is designed to permit these employees to voluntarily defer a portion of their compensation and provide for retirement and death benefits. The plan is funded by employer and employee contributions. As of June 30, 2019, the County provided up to a 4% matching contribution per pay period of the employee’s voluntary contribution. Employer and employee contributions are deposited into the participant accounts and invested based on participant selected options. Total employer contributions for the year ended June 30, 2019, were $259.37 million.
The Savings Plan is a Section 401(k) defined contribution plan covering eligible full-time permanent employees of the County not covered by collective bargaining agreements and who desire to participate in the Plan. Employees eligible for voluntary participation in this plan are also eligible for participation in the Deferred Compensation and Thrift Plan. The plan is funded by employer and employee contributions. As of June 30, 2019, the County provided up to a 4% matching contribution per pay period of the employee’s voluntary contribution. Employer and employee contributions are deposited into the participant accounts and invested based on participant selected options. Total employer contributions for the year ended June 30, 2019, were $69.80 million.
The Pension Savings Plan is a Section 457 defined contribution plan covering part-time, temporary and seasonal County employees who are not eligible to participate in the retirement programs provided through the LACERA. The Plan was established in lieu of employee coverage under Social Security. Participation in the plan is mandatory and employees must contribute a minimum of 4.5% of their eligible earnings and the County makes a contribution equal to 3% of compensation. Participants may contribute additional amounts beyond the required 4.5%. Total employer contributions for the year ended June 30, 2019, were $8.99 million.
The plans are administered through a third-party administrator. The assets of the plans are held in trust by Wells Fargo Bank, N.A. and invested at the direction of the participants. Thus, plan assets and any related liability to plan participants have been excluded from the County’s financial statements.
107

COUNTY OF LOS ANGELESNOTES TO THE BASIC FINANCIAL STATEMENTS
FOR THE YEAR ENDED JUNE 30, 20199. OTHER POSTEMPLOYMENT BENEFITS
Retiree Healthcare
Plan Description
LACERA administers a cost-sharing, multi-employer Retiree Healthcare (RHC) OPEB program onbehalf of the County, its affiliated Superior Court, and four outside districts. The outside districts include:Little Lake Cemetery District, Local Agency Formation Commission, LACOE and the South Coast AirQuality Management District.
In April 1982, the County adopted an ordinance pursuant to Government Code Section 31691, whichprovided for a health insurance program and death benefits for retired employees and their dependents.In 1994, the County amended the agreements to continue to support LACERA’s retiree insurancebenefits program regardless of the status of active member insurance.
In June 2014, the LACERA Board approved the County’s request to modify the agreements to createa new retiree healthcare benefit plan in order to lower its Retiree Healthcare Program (RHP) costs.Structurally, this means the County will be segregating all current retirees and current employees intoRHP Tier 1 and placing all employees hired after June 30, 2014 into RHP Tier 2. Under the new RHPTier 2, retirees who are eligible for Medicare will be required to enroll in that program. In addition,coverage will be available for employees or eligible survivors only.
Pursuant to the 1982, 1994, and 2014 Agreements between the County and LACERA, the partiesagreed to the continuation of the health insurance benefits then in existence. The County agreed tosubsidize a portion of the insurance premiums of certain retired members and their eligible dependentsbased on the member’s length of service. The County further agreed to maintain the status quo ofexisting benefits provided to participants. As part of the 2014 Agreement, the County modified theexisting healthcare benefit plan, which created a new benefit structure, Tier 2, for all employees hiredafter June 30, 2014. LACERA agreed not to change retired members’ contributions toward insurancepremiums or modify medical benefit levels without the County’s prior consent. Active employees arenot required to make contributions to the plan.
Pursuant to the California Government Code, the County established an irrevocable OPEB Trust forthe purpose of holding and investing assets to pre-fund the RHP, which LACERA administers. On May15, 2012, the County Board entered into a trust and investment services agreement with the LACERABoard of Investments to act as trustee and investment manager. The OPEB Trust does not modify theCounty’s benefit programs.
LACERA issues a stand-alone financial report that includes the required information for the OPEB plan.The report is available at its offices located at Gateway Plaza, 300 North Lake Avenue, Pasadena,California 91101-4199 or www.LACERA.com.
108

COUNTY OF LOS ANGELESNOTES TO THE BASIC FINANCIAL STATEMENTS
FOR THE YEAR ENDED JUNE 30, 20199. OTHER POSTEMPLOYMENT BENEFITS-Continued
Retiree Healthcare-Continued
Benefits Provided
Health care benefits earned by County employees are dependent on the number of completed years of retirement service credited to the retiree by LACERA upon retirement; it does not include reciprocal service in another retirement system. Service includes all service on which the member's retirement allowance was based.
The RHC OPEB Program offers members an extensive choice of medical plans as well as two dental/vision plans. The medical plans are either HMOs or indemnity plans, and some are designed to work with Medicare benefits, such as the Medicare Supplement or Medicare HMO plans. Coverage is available regardless of preexisting medical conditions. Under Tier 2, retirees who are eligible for Medicare are required to enroll in that program. Medicare-eligible retirees and their covered dependents must enroll in Medicare Parts A and B and in a Medicare HMO plan or Medicare Supplement plan under Tier 2.
Medical and Dental/Vision - Program benefits are provided through third party insurance carriers with the participant’s cost for medical and dental/vision insurance varying according to the years of retirement service credit with LACERA, the plan selected, and the number of persons covered. The County contribution subsidizing the participant’s cost starts at 10 years of service credit in the amount of 40% of the lesser of the benchmark plan rate or the premium of the plan in which the retiree is enrolled. For each year of retirement service credit earned beyond 10 years, the County contributes 4% per year, up to a maximum of 100% for a member with 25 years of service credit. The County contribution can never exceed the premium of the benchmark plans. Members are responsible for premium amounts above the benchmark plans, including those with 25 or more years of service credit.
Under Tier 1, the County subsidy is based on the coverage elected by the retiree. The benchmark plans are Anthem Blue Cross Plans I and II for medical and Cigna Indemnity Dental/Vision for dental and vision. Under Tier 2, the County subsidy is based on retiree only coverage. Tier 2 medical benchmark plans are Anthem Blue Cross Plans I and II for Medicare-ineligible members, Anthem Blue Cross Plan III for Medicare-eligible members, and Cigna Indemnity Dental/Vision for dental and vision plans.
Medicare Part B - The County reimburses the member’s Medicare Part B Standard rate premiums paid by member to Social Security for Part B coverage, subject to annual approval by the County Board of Supervisors. Eligible members and their dependents must be enrolled in both Medicare Part A and Medicare Part B and enrolled in a LACERA- administered Medicare HMO Plan or Medicare Supplement Plan and meet all of the qualifications. Under Tier 2, the County reimburses for Medicare Part B (at the standard rate) for eligible members or eligible survivors only.
Disability - If a member is granted a service-connected disability retirement and has less than 13 years of service, the County contributes the lesser of 50% of the benchmark plan rate or the premium of the plan in which the retiree is enrolled. Under Tier 2, the benchmark plan rate is based on retiree-only premiums. A member with 13 years of service credit receives a 52% subsidy. This percentage increases 4% for each additional completed year of service, up to a maximum of 100%.
109
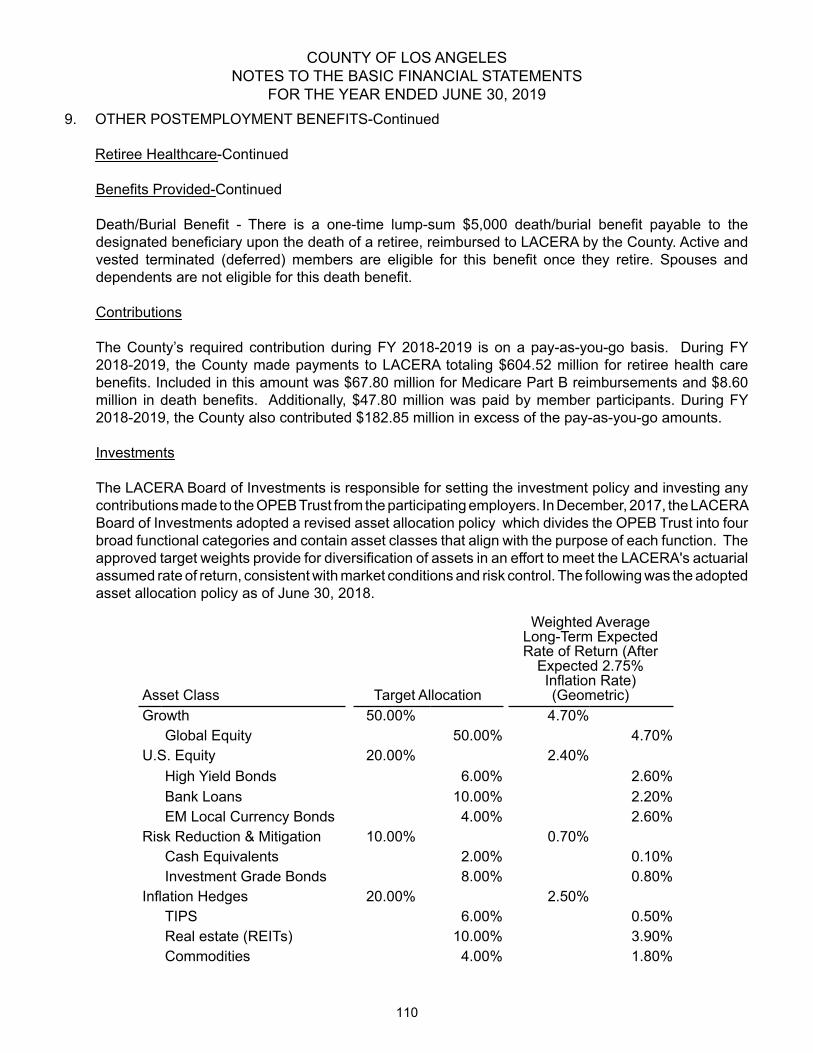
COUNTY OF LOS ANGELESNOTES TO THE BASIC FINANCIAL STATEMENTS
FOR THE YEAR ENDED JUNE 30, 20199. OTHER POSTEMPLOYMENT BENEFITS-Continued
Retiree Healthcare-Continued
Benefits Provided-Continued
Death/Burial Benefit - There is a one-time lump-sum $5,000 death/burial benefit payable to thedesignated beneficiary upon the death of a retiree, reimbursed to LACERA by the County. Active andvested terminated (deferred) members are eligible for this benefit once they retire. Spouses anddependents are not eligible for this death benefit.
Contributions
The County’s required contribution during FY 2018-2019 is on a pay-as-you-go basis. During FY2018-2019, the County made payments to LACERA totaling $604.52 million for retiree health carebenefits. Included in this amount was $67.80 million for Medicare Part B reimbursements and $8.60million in death benefits. Additionally, $47.80 million was paid by member participants. During FY2018-2019, the County also contributed $182.85 million in excess of the pay-as-you-go amounts.
Investments
The LACERA Board of Investments is responsible for setting the investment policy and investing anycontributions made to the OPEB Trust from the participating employers. In December, 2017, the LACERABoard of Investments adopted a revised asset allocation policy which divides the OPEB Trust into fourbroad functional categories and contain asset classes that align with the purpose of each function. Theapproved target weights provide for diversification of assets in an effort to meet the LACERA's actuarialassumed rate of return, consistent with market conditions and risk control. The following was the adoptedasset allocation policy as of June 30, 2018.
Asset Class Target Allocation
Weighted AverageLong-Term ExpectedRate of Return (After
Expected 2.75%Inflation Rate)(Geometric)
Growth 50.00% 4.70%Global Equity 50.00% 4.70%
U.S. Equity 20.00% 2.40%High Yield Bonds 6.00% 2.60%Bank Loans 10.00% 2.20%EM Local Currency Bonds 4.00% 2.60%
Risk Reduction & Mitigation 10.00% 0.70%Cash Equivalents 2.00% 0.10%Investment Grade Bonds 8.00% 0.80%
Inflation Hedges 20.00% 2.50%TIPS 6.00% 0.50%Real estate (REITs) 10.00% 3.90%Commodities 4.00% 1.80%
110

COUNTY OF LOS ANGELESNOTES TO THE BASIC FINANCIAL STATEMENTS
FOR THE YEAR ENDED JUNE 30, 20199. OTHER POSTEMPLOYMENT BENEFITS-Continued
Retiree Healthcare-Continued
OPEB Liabilities, OPEB Expense, and Deferred Outflows of Resources and Deferred Inflows ofResources Related to the Retiree Healthcare OPEB Plan
Annual RHC OPEB Expense and Net OPEB Liability
At June 30, 2019, the County reported a liability of $23.591 billion for its proportionate share of the netRHC OPEB liability. The net RHC OPEB liability was measured as of June 30, 2018, and the total RHCOPEB liability used to calculate the net RHC OPEB liability was determined by an actuarial valuationas July 1, 2017, projected forward to the measurement date taking into account any significant changesbetween the valuation date and the measurement date. The County’s proportion of the net OPEBliability was based on a projection of the County’s future contribution effort to the OPEB plan relativeto the projected contributions of all OPEB participants actuarially determined. At June 30, 2018, theCounty’s proportionate share was 95.39%, which was the same as the proportion measured at June30, 2017.
For the year ended June 30, 2019, the County recognized OPEB expense of $1.631 billion which isreported as $1.353 billion for governmental activities and $0.278 billion for business-type activities.OPEB expense represents the change in the net OPEB liability during the measurement period, adjustedfor actual contributions and the deferred recognition of change in investment gain/loss, actuarial gain/loss, actuarial assumptions or methods, and plan benefits.
At June 30, 2019, the County reported deferred outflows of resources and deferred inflows of resourcesrelated to RHC OPEB from the following sources (in thousands):
DeferredInflows ofResources
DeferredOutflows ofResources
Net difference between projected and actual earnings $ 50,178 $Change of assumptions 2,928,167Change in experience 1,170,484Change in proportion and differences between County
contributions and the proportionate share ofcontributions 555,809 559,601
Contributions made subsequent to measurement date 787,366 Total $ 4,704,638 $ 1,346,967
The deferred inflows of resources and deferred outflows of resources above represent the unamortized portion of changes to the net RHC OPEB liability to be recognized in future periods in a systematic and rationale manner in accordance with GASB 75, "Accounting and Financial Reporting for Postemployment Benefits Other Than Pensions" (GASB 75). Investment gains or losses are recognized in OPEB expense over a five year period and economic/demographic gains or losses and assumption changes or inputs are recognized over the average remaining service life of all active and inactive members, which is 9 years.
111

COUNTY OF LOS ANGELESNOTES TO THE BASIC FINANCIAL STATEMENTS
FOR THE YEAR ENDED JUNE 30, 20199. OTHER POSTEMPLOYMENT BENEFITS-Continued
Retiree Healthcare-Continued
Annual RHC OPEB Expense and Net OPEB Liability-Continued
Amounts currently reported as deferred outflows and inflows of resources, other than contributionsrelated to RHC OPEB, will be recognized in RHC OPEB expense as follows (in thousands):
DeferredOutflows/(Inflows)
of ResourcesYear Ending June 30:2020 $ (550,310)2021 (550,310)2022 (550,310)2023 (540,022)2024 (535,193)Thereafter (1,418,892)
Deferred outflows of resources of $787.37 million related to contributions subsequent to the measurement date will be recognized as a reduction of the net OPEB liability in the year ending June 30, 2020.
Actuarial Methods and Assumptions
Valuation Timing July 1, 2017, rolled forward to June 30, 2018Actuarial Cost Method Individual Entry Age Normal, Level Percent of PayAsset Valuation Method Fair Market ValueInflation 2.75%Salary Increases 3.25% general wage increase and merit according to
Table A-5 of the June 30, 2017 actuarial valuation of retirement benefits. It can be found at www.LACERA.com.
Mortality Various rates based on the RP-2014 Healthy and Disabled Annuitant mortality tables and including projection for expected future mortality improvement using the MO Healthcare Cost Trend Rates P-2014 Ultimate Projection Scale.
Experience Study Covers the three year period ended June 30, 2016.Discount Rate 5.11%Long-term expected rate of return,
net of investment expenses 6.30%20 Year Tax-Exempt Municipal Bond Yield 3.87%
112

COUNTY OF LOS ANGELESNOTES TO THE BASIC FINANCIAL STATEMENTS
FOR THE YEAR ENDED JUNE 30, 20199. OTHER POSTEMPLOYMENT BENEFITS-Continued
Retiree Healthcare-Continued
Actuarial Methods and Assumptions-Continued
Healthcare Cost Trend rates:Initial Year Ultimate
LACERA Medical Under 65 5.80% 4.50% LACERA Medical Over 65 6.00% 4.50% Part B Premiums 9.25% 4.35% Dental/Vision 0.00% 3.70% Weighted Average Trend 5.85% 4.47%
Discount Rate
GASB 75 requires determination of whether the OPEB Trust’s Fiduciary Net Position is projected to be sufficient to make projected benefit payments. The Plan’s fiduciary net position was not projected to be available to make all projected future benefit payments of current active and inactive employees. Therefore, the discount rate incorporates a municipal bond rate based on the 20-year Bond Buyer GO index (municipal bond rate) which was 3.87% as of June 30, 2018. For 2018, the long-term expected rate of return of 6.30% was applied to projected benefit payments from 2018 to 2058. The municipal bond rate was applied to the remaining periods. The resultant blended discount rate used to measure the Total OPEB Liability as of June 30, 2018 was 5.11%, an increase of 0.42% from the rate as of June 30, 2017.
Sensitivity of the County’s Proportionate Share of the RHC OPEB Liability to Changes in the Discount Rate
The following represents the County’s proportionate share of the net RHC OPEB liability calculated using the discount rate of 5.11%, as well as what the County’s proportionate share of the net OPEB liability would be if it were calculated using a discount rate that is 1-percentage point lower (4.11%) or 1-percentage point higher (6.11%) than the current rate (in thousands):
1%Decrease(4.11%)
DiscountRate
(5.11%)
1%Increase(6.11%)
Net RHC OPEB Liability $ 28,263,233 $ 23,590,686 $ 19,905,335
Sensitivity of the County’s Proportionate Share of the RHC OPEB Liability to Changes in the Healthcare Cost Trend Rates
The following represents the County’s proportionate share of the net RHC OPEB liability, as well as what the County’s proportionate share of the net RHC OPEB liability would be if it were calculated using healthcare cost trend rates that are 1-percentage point lower or 1-percentage point higher than the current healthcare cost trend rates (in thousands):
1%Decrease
Current TrendRate
1%Increase
Net RHC OPEB Liability $ 19,236,410 $ 23,590,686 $ 29,369,024
113

COUNTY OF LOS ANGELESNOTES TO THE BASIC FINANCIAL STATEMENTS
FOR THE YEAR ENDED JUNE 30, 20199. OTHER POSTEMPLOYMENT BENEFITS-Continued
Retiree Healthcare-Continued
OPEB Plan Fiduciary Net Position
Detailed information about OPEB plan fiduciary net position as of June 30, 2018 is available in theseparately issued LACERA financial report, which can be found at www.LACERA.com.
Long-Term Disability
Plan Description
The County provides LTD benefits to employees and these benefits have been determined to fall withinthe definition of OPEB, per GASB 75. The LTD plans are administered by the County and are notadministered through a trust. Each of the LTD plans are a single employer plan and the amounts paidby the County are paid when the benefits become due during the reporting period. These LTD benefitsprovide for income replacement if an employee is unable to work because of illness or injury. The Boardapproved the County’s original LTD plan effective March 3, 1982. Effective January 1, 1991, a newMegaflex plan was approved by the Board and includes a Megaflex LTD plan and a LTD Health plan.The LTD Health plan was added to the LTD program and made available to all participants effectiveJanuary 1, 2002.
Benefits Provided
The benefit provisions of the four LTD plans is as follows:
Eligibility
Non-Megaflex Income/Survivor Income Benefit (SIB) - The Plans cover:
(1) An employee who becomes totally disabled as a direct result of an injury or disease whileperforming his/her assigned duties; or,
(2) An employee who becomes totally disabled after having completed five or more years ofcontinuous service with the County; or,
(3) A qualified beneficiary of a deceased employee who had previously become totally disabledas a direct result of an injury or disease while performing his/her assigned duties;
(4) A qualified beneficiary of a deceased employee who had previously become totally disabledafter having completed five or more years of continuous service with the County.
(5) A qualified beneficiary of an employee who dies as a direct result of an injury or disease whileperforming his/her assigned duties, or,
(6) A qualified beneficiary of an employee who dies in active service after having completed fiveor more years of continuous service with the County.
Megaflex Income/SIB - The Plans covers:
(1) An employee purchases LTD coverage and then becomes totally disabled; or,
114

COUNTY OF LOS ANGELESNOTES TO THE BASIC FINANCIAL STATEMENTS
FOR THE YEAR ENDED JUNE 30, 20199. OTHER POSTEMPLOYMENT BENEFITS-Continued
Long-Term Disability-Continued
Benefits Provided-Continued
(2) An employee who becomes totally disabled after having completed five or more years ofcontinuous service with the County and is a member of Retirement Plan E.
(3) The Qualified Beneficiary of a Retirement Plan E participant who is currently enrolled in theSIB plan at the time of death.
Non-MegaFlex Member LTD Health Plan - The plan continues medical insurance coverage for employees who are receiving or eligible to receive LTD Income benefits and are enrolled in one of the County approved health plans.
MegaFlex Member LTD Health Plan - The plan continues medical insurance coverage for employees who are receiving or eligible to receive LTD Income benefits and are enrolled in one of the County approved health plans.
Benefit Formula
Non-Megaflex Income/SIB - The plan provides a basic monthly benefit of:
(1) 60% of Basic Monthly Compensation (commences after 6 months of disability).(2) Annual COLA, beginning after 2 years of benefit payments (limited to a maximum of 2%/
year), if disabled after 1/1/2001.(3) For a qualified beneficiary, 55% of the LTD disability benefit that the employee was receiving
or would have received immediately prior to death; and, continues for the life of the qualifiedsurviving spouse/domestic partner and upon spousal death to the qualified childrenbeneficiaries.
Megaflex Income/SIB - The plan provides a basic monthly benefit of:
(1) 40% or 60% of Basic Monthly Compensation (commences after 6 months of disability)a. Plan E members
(1) With 5+ years of services 40% non-elective or can buy up to 60(2) With less than 5 years of service: can buy 40% or 60%
b. Plan A, B, C, or D members: can buy 40% or 60%(2) Annual COLA, beginning after 2 years of benefit payments (limited to a maximum of 2% per
year), if disabled after 1/1/2001.(3) For a qualified beneficiary, the plan provides a basic monthly benefit of 10%, 15%, 25%, 35%,
or 50% of employee’s monthly salary if they elected.
Non-MegaFlex Member LTD Health Plan - The plan pays 75% of monthly medical premiums for disabled members.
MegaFlex Member LTD Health Plan - The plan pays 75% of monthly medical premiums for disabled members.
115

COUNTY OF LOS ANGELESNOTES TO THE BASIC FINANCIAL STATEMENTS
FOR THE YEAR ENDED JUNE 30, 20199. OTHER POSTEMPLOYMENT BENEFITS-Continued
Long-Term Disability-Continued
Benefits Provided-Continued
Maximum Period
Non-Megaflex Income/SIB and Megaflex Income/SIB - LTD benefits stop when:
(1) Employee is no longer totally disabled or turns age 65, whichever occurs first. However, ifemployee is age 62 or older when benefit commences, benefit can continue beyond age 65(length depends on age at commencement) as follows:
Age at Disability Maximum Period62 3 ½63 364 2 ½65 266 1 ¾67 1 ½68 1 ¼
69 and older 1or
(2) Employee takes early or normal retirement under Plan E.
Employees covered by benefit terms
At June 30, 2018, the following employees were covered by the benefit terms:
LTD Income and Survivor Benefit Plans:Inactive employees or beneficiaries currently receiving benefit payments 2,518Inactive employees entitled to but not yet receiving benefit payments 0 Active employees 74,357
LTD Health PlansInactive employees or beneficiaries currently receiving benefit payments 594Inactive employees entitled to but not yet receiving benefit payments 0Active employees 65,168
Total LTD OPEB Liability
At June 30, 2019, the County reported a total LTD OPEB liability of $1.048 billion. The total LTD OPEB liability was determined by an actuarial valuation as of July 1, 2017, rolled forward to July 1, 2018.
116

COUNTY OF LOS ANGELESNOTES TO THE BASIC FINANCIAL STATEMENTS
FOR THE YEAR ENDED JUNE 30, 20199. OTHER POSTEMPLOYMENT BENEFITS-Continued
Long-Term Disability-Continued
Actuarial Methods and Assumptions
Valuation Timing July 1, 2017, rolled forward to July 1, 2018Actuarial Cost Method Individual Entry Age Normal, Level Percent of PayInflation The inflation rate is included in the salary increase
percentage and the Healthcare cost trend rates.Salary Increases 3.25% general wage increase and merit according to
Table A-5 of the June 30, 2017 RHC OPEB Program's actuarial valuation report. It can be found at www.LACERA.com..Mortality Various rates based on the RP-2014 Healthy andDisabled Annuitant mortality tables and including projection for expected future mortality improvement using the MO Healthcare Cost Trend Rates - 2014 Ultimate Projection Scale.
Discount Rate Equal to the municipal bond rate based on the 20-year Bond Buyer GO index (municipal bond rate), which was 3.58% as of June 30, 2017 and 3.87% as of June 30, 2018.
Healthcare Cost Trend rates:
YearRate (preMedicare/
post Medicare) YearRate (pre Medicare/
post Medicare)2017-2018 4.40%/4.60% 2037-2038 6.10%/5.60%2018-2019 5.80%/6.00% 2047-2048 5.70%/5.60%2019-2020 6.30%/6.00% 2057-2058 5.50%/5.80%2020-2021 6.70%/6.50% 2067-2068 5.10%/5.30%2021-2022 5.70%/6.10% 2077-2078 4.50%/4.60%2022-2023 5.80%/6.10% 2087-2088 4.50%/4.60%2023-2024 5.30%/5.30% 2097-2098 4.50%/4.50%2024-2025 5.40%/5.40% 2099+ 4.50%/4.50%2025-2026 5.60%/5.40%2026-2027 5.80%/5.40%2027-2028 5.90%/5.50%
117

COUNTY OF LOS ANGELESNOTES TO THE BASIC FINANCIAL STATEMENTS
FOR THE YEAR ENDED JUNE 30, 20199. OTHER POSTEMPLOYMENT BENEFITS-Continued
Long-Term Disability-Continued
Changes in the Total LTD OPEB Liability (in thousands):
Total OPEB Liability at 6/30/2017 $ 1,073,040
Service cost 43,162Interest 38,818Changes of benefit termsDifferences between expected and actual experience 1,111Changes of assumptions or other inputs (43,574)Benefit payments (64,313)
Net Changes (24,796)
Total LTD OPEB Liability at 6/30/2018 $ 1,048,244
Changes of assumptions or other inputs reflect a change in the discount rate from 3.58% as of June 30, 2017 to 3.87% as of June 30, 2018.
Sensitivity of the Total LTD OPEB Liability to Changes in the Discount Rate
The following represents the County’s total LTD OPEB liability calculated using the discount rate of 3.87%, as well as what the County’s total LTD OPEB liability would be if it were calculated using a discount rate that is 1-percentage point lower (2.87%) or 1-percentage point higher (4.87%) than the current rate (in thousands):
1%Decrease(2.87%)
DiscountRate
(3.87%)
1%Increase(4.87%)
Total LTD OPEB Liability $ 1,192,924 $ 1,048,244 $ 921,111
Sensitivity of the County’s Total LTD OPEB Liability to Changes in the Healthcare Cost Trend Rates
The following represents the County’s total LTD OPEB liability, as well as what the County’s total LTD OPEB liability would be if it were calculated using healthcare cost trend rates that are 1-percentage point lower or 1-percentage point higher than the current healthcare cost trend rates (in thousands):
1%Decrease
Current TrendRate
1%Increase
Total LTD OPEB Liability $ 1,038,396 $ 1,048,244 $1,059,759
118

COUNTY OF LOS ANGELESNOTES TO THE BASIC FINANCIAL STATEMENTS
FOR THE YEAR ENDED JUNE 30, 20199. OTHER POSTEMPLOYMENT BENEFITS-Continued
Long Term Disability-Continued
OPEB Expense and the Deferred Outflows of Resources and Deferred Inflows of Resources Relatedto LTD OPEB
For the year ended June 30, 2019, the County recognized LTD OPEB expense of ($15.21) millionwhich is reported as ($8.01) million for governmental activities and ($7.20) million for business-typeactivities. OPEB expense represents the change in the total LTD OPEB liability during the measurementperiod, adjusted for the deferred recognition of change in investment gain/loss, actuarial gain/loss,actuarial assumptions or methods, and plan benefits.
At June 30, 2019, the County reported deferred outflows of resources and deferred inflows of resourcesrelated to LTD OPEB from the following sources (in thousands):
DeferredInflows ofResources
DeferredOutflows ofResources
Change in experience $ $ 1,509Change of assumptions 128,444Change in proportionate share 60,390 60,390Total $ 188,834 $ 61,899
The deferred inflows of resources and deferred outflows of resources above represent the unamortized portion of changes to the total LTD OPEB liability to be recognized in future periods in a systematic and rationale manner in accordance with GASB 75. Economic/demographic gains or losses, assumption changes or inputs, and change in proportion are recognized over the average remaining service life of all active and inactive members, which is 12 years. The change in proportionate share represents the changes in allocation percentages to the individual funds, including the proprietary funds, of the total OPEB LTD liability from the prior measurement date to the current measurement date.
Amounts currently reported as deferred outflows and inflows of resources will be recognized in OPEB expense as follows (in thousands):
DeferredOutflows/(Inflows)
of ResourcesYear Ending June 30:2020 $ (12,339)2021 (12,339)2022 (12,339)2023 (12,339)2024 (12,339)Thereafter (65,240)
119

COUNTY OF LOS ANGELESNOTES TO THE BASIC FINANCIAL STATEMENTS
FOR THE YEAR ENDED JUNE 30, 20199. OTHER POSTEMPLOYMENT BENEFITS-Continued
Long Term Disability-Continued
Combined Balances of the Net OPEB Liability, Deferred Outflows of Resources, Deferred Inflows ofResources and the OPEB Expense
The following total balances are reflected in the accompanying statement of net position (in thousands):
RHC OPEB LTD OPEB TotalNet OPEB Liability $ 23,590,686 $ 1,048,244 $ 24,638,930Deferred Outflows of Resources 1,346,967 61,899 1,408,866Deferred Inflows of Resources 4,704,638 188,834 4,893,472OPEB Expense 1,633,970 (15,213) 1,618,757
10. LEASES
Operating Leases
The following is a schedule of future minimum rental payments required under operating leases enteredinto by the County that have initial or remaining noncancelable lease terms in excess of one year as ofJune 30, 2019 (in thousands):
Year Ending June 30Governmental
Activities2020 $ 84,9452021 65,9402022 51,3202023 40,4342024 33,7962025-2029 98,6482030-2034 46,5552035-2039 22,2212040-2044 15,1532045-2049 12,880
Total $ 471,892
Rent expenses related to operating leases were $102.51 million for the year ended June 30, 2019.
120

COUNTY OF LOS ANGELESNOTES TO THE BASIC FINANCIAL STATEMENTS
FOR THE YEAR ENDED JUNE 30, 201910. LEASES-Continued
Capital Lease Obligations
The following is a schedule of future minimum lease payments under capital lease obligations togetherwith the present value of future minimum lease payments as of June 30, 2019 (in thousands):
Year Ending June 30Governmental
ActivitiesBusiness-type
Activities2020 $ 27,439 $ 782021 27,196 522022 26,708 342023 26,669 112024 26,506 —2025-2029 94,114 —2030-2034 62,917 —2035-2038 27,840 —
Total 319,389 175Less: Amount representing interest 162,502 10
Present value of future minimum lease payments $ 156,887 $ 165
The following is a schedule of property under capital leases by major classes at June 30, 2019 (in thousands):
GovernmentalActivities
Business-typeActivities
Land $ 32,238 $Buildings and improvements 142,638 —Equipment 59,471 276Accumulated depreciation (73,193) (117)
Total $ 161,154 $ 159
Future rent revenues to be received from noncancelable subleases are $838,000 as of June 30, 2019.
Leases of County-Owned Property
The County has entered into operating leases relative to the Marina del Rey Project area, regional parks, asset development projects and Whiteman Airport. Substantially all of the Marina's land and harbor facilities are leased to others under agreements classified as operating leases. Certain regional parks are leased under agreements, which provide for activities such as food and beverage concessions, and recreational vehicle camping. The asset development projects are ground leases and development agreements are entered into by the County for private sector development of commercial, industrial, residential, and cultural uses on vacant or underutilized County owned property. The Whiteman Airport lease is for hanger space. The asset development leases cover remaining periods ranging generally from 3 to 79 years and are accounted for in the General Fund. The lease terms for the regional parks cover remaining periods ranging from 1 to 20 years and are also accounted for in the General Fund. The Marina del Rey leases cover remaining periods ranging from 1 to 59 years and are accounted for in the General Fund. The airport lease covers a remaining period of 12 years and is accounted for in the Aviation Enterprise Fund.
121

COUNTY OF LOS ANGELESNOTES TO THE BASIC FINANCIAL STATEMENTS
FOR THE YEAR ENDED JUNE 30, 201910. LEASES-Continued
Leases of County-Owned Property-Continued
The land carrying value of the asset development project ground leases and the Marina del Rey Projectarea leases is $650.23 million. The carrying value of the capital assets associated with the regionalpark and Whiteman Aiport operating leases is not determinable.
The following is a schedule of future minimum rental receipts on noncancelable leases as ofJune 30, 2019 (in thousands):
Year Ending June 30Governmental
ActivitiesBusiness-type
Activities
2020 $ 49,601 $ 1922021 49,580 1962022 49,481 2012023 46,775 2062024 44,329 212Thereafter 1,673,427 1,637
Total $ 1,913,193 $ 2,644
The following is a schedule of rental income for these operating leases for the year ended June 30, 2019 (in thousands):
GovernmentalActivities
Business-typeActivities
Minimum rentals $ 44,812 $ 186Contingent rentals 21,387 —
Total $ 66,199 $ 186
The minimum rental income is a fixed amount based on the lease agreements. The contingent rental income is a percentage of revenue above a certain base for the asset development leases or a calculated percentage of the gross revenue less the minimum rent payment for the other leases.
11. LONG-TERM OBLIGATIONS
Long-term obligations of the County consist of bonds, notes and loans from direct borrowings and directplacements, pension (see Note 8), OPEB (see Note 9), capital lease obligations (see Note 10) andother liabilities, which are payable from the General, Special Revenue, Debt Service, Enterprise andInternal Service Funds.
122

COUNTY OF LOS ANGELESNOTES TO THE BASIC FINANCIAL STATEMENTS
FOR THE YEAR ENDED JUNE 30, 201911. LONG-TERM OBLIGATIONS-Continued
A summary of bonds, and notes and loans from direct borrowings and direct placements recorded withingovernmental activities follows (in thousands):
Original Par BalanceAmount of Debt June 30, 2019
Regional Park and Open Space DistrictBonds (issued by Public WorksFinancing Authority), 3.00% to 5.25% $ 275,535 $ 14,610
NPC Bonds, 5.00% 26,986 4,709Public Buildings Certificates of Participation and Bonds,
0.32% to 7.62% 1,377,476 1,367,157Los Angeles County Securitization
Corporation Tobacco SettlementAsset-Backed Bonds, 5.25% to 6.65% 319,827 395,748
NPC Bond Anticipation Notes, 1.75% to 2.96% 50,000 50,000Marina del Rey Loans, 4.50% to 4.70% 23,500 12,222Lease Revenue Obligation Notes, 1.27% to 2.70% 239,175 239,175
Total $ 2,312,499 $ 2,083,621
A summary of bonds, and notes and loans from direct borrowings and direct placements recorded within business-type activities follows (in thousands):
Original Par BalanceAmount of Debt June 30, 2019
NPC Bonds, 5.00% $ 10,494 $ 1,831Public Buildings Certificates of Participation and Bonds,
0.32% to 7.62% 774,228 732,123Lease Revenue Obligation Notes, 1.27% to 2.70% 323,145 323,145Waterworks District Loans, 2.28% 8,869 6,931Aviation Loan, 2.95% 2,000 1,614
Total $ 1,118,736 $ 1,065,644
Assessment Bonds
The RPOSD issued voter approved assessment bonds in 1997, some of which were advance refunded in FY 2004-2005 and the remainder in FY 2007-2008, to fund the acquisition, restoration, improvement and preservation of beach, park, wildlife and open space resources within the RPOSD. As discussed in Note 4, the bonds were purchased by the Public Works Financing Authority (Authority) and similar bonds were issued as a public offering. The bonds issued by the Authority are payable from the pledged proceeds of annual assessments levied on parcels within RPOSD’s boundaries. The current year assessment revenues were $28.66 million.
123

COUNTY OF LOS ANGELESNOTES TO THE BASIC FINANCIAL STATEMENTS
FOR THE YEAR ENDED JUNE 30, 201911. LONG-TERM OBLIGATIONS-Continued
Assessment Bonds-Continued
The bonds mature in FY 2019-2020. Annual principal and interest payments of the bonds are expectedto require less than 50% of annual assessment revenues. The Authority Master Indenture of Trustcontains a provision that in an event of default, outstanding principal and accrued interest may bedeclared due and payable immediately. Total principal and interest remaining on the bonds is $13.97million, not including unamortized bond premiums. Principal and interest for the current year were$13.99 million.
Principal and interest requirements on assessment bonds are as follows (in thousands):
Year Ending Governmental ActivitiesJune 30 Principal Interest
2020 $ 13,620 $ 352Subtotal 13,620 $ 352
Add: Unamortized bond premiums 990
Total assessment bonds $ 14,610
Certificates of Participation and Bonds
The County has issued lease revenue bonds through various financing entities that have been established and are component units of the County. The debt proceeds have been used to finance the acquisition of County facilities and equipment. The County makes annual payments to the financing entities for the use of the property and the debt is secured by the underlying capital assets that have been financed. The County has pledged a total of 15 County-owned properties as collateral for various bonds, including the new bonds below.
During FY 2018-2019, LACF issued $302.38 million of lease revenue bonds, which includes $297.28 million in tax-exempt lease revenue bonds (Series 2018A) and $5.10 million in federally taxable lease revenue bonds (Series 2018B), to finance the construction of the Vermont Corridor County Administration Building and parking structure. The proceeds from these bonds plus the associated premium of $44.18 million less issuance costs of $1.98 million were used to fund the Project Fund, totaling $297.13 million, and the Capitalized Interest Fund, totaling $47.45 million. The County has pledged four County-owned properties as collateral for the debt. In addition, the Indenture of Trust contains a provision that in an event of default, the outstanding principal and interest accrued may be declared due and payable immediately. The debt was only issued for governmental activities.
Principal and interest requirements on NPC bonds and Public Buildings certificates of participation and bonds for governmental activities and business-type activities are as follows (in thousands):
124

COUNTY OF LOS ANGELESNOTES TO THE BASIC FINANCIAL STATEMENTS
FOR THE YEAR ENDED JUNE 30, 201911. LONG-TERM OBLIGATIONS-Continued
Certificates of Participation and Bonds-Continued
Year Ending Governmental Activities Business-type ActivitiesJune 30 Principal Interest Principal Interest2020 $ 34,892 $ 79,606 $ 19,430 $ 43,8742021 39,571 70,925 18,727 42,8212022 50,020 60,843 19,340 41,7792023 54,920 58,366 20,185 40,6682024 34,381 55,935 21,089 39,4682025-2029 198,914 248,647 122,046 175,0172030-2034 220,282 188,368 155,783 129,6142035-2039 222,209 126,325 197,592 72,4592040-2044 210,396 61,520 129,644 11,5352045-2049 110,765 21,708 — —2050-2052 50,530 3,874
Subtotal 1,226,880 $ 976,117 703,836 $ 597,235
Add: Accretions 21,699Unamortized bond premiums 123,287 30,118
Total certificates of participation and bonds $ 1,371,866 $ 733,954
Tobacco Settlement Asset-Backed Bonds
In 2006, the County entered into a Sale Agreement with the LACSC under which the County relinquishes to the LACSC a portion of its future tobacco settlement revenues (TSRs) for the next 40 years. The County received from the sold TSRs a lump sum payment of $ 319.83 million and a residual certificate in exchange for the rights to receive and retain 25.90% of the County’s TSRs through 2046. The residual certificate represented the County’s ownership interest in excess TSRs to be received by the LACSC during the term of the Sale Agreement. Residuals through 2019 were $131.51 million. The total TSRs sold, based on the projected payment schedule in the Master Settlement Agreement and adjusted for historical trends, was estimated to be $ 1.438 billion. The estimated present value of the TSRs sold, net of the expected residuals and assuming a 5.70% interest rate at the time of the sale, was $309.23 million. In the event of a decline in the tobacco settlement revenues for any reason, including the default or bankruptcy of a participating cigarette manufacturer, resulting in a decline in the tobacco settlement revenues and possible default on the Tobacco Bonds, neither the California County Tobacco Securitization Agency, the County, nor the LACSC has any liability to make up any such shortfall.
125

COUNTY OF LOS ANGELESNOTES TO THE BASIC FINANCIAL STATEMENTS
FOR THE YEAR ENDED JUNE 30, 201911. LONG-TERM OBLIGATIONS-Continued
Tobacco Settlement Asset-Backed Bonds-Continued
Principal and interest requirements (in thousands) for the Tobacco Settlement Asset-Backed bonds areas follows:
Year Ending Governmental ActivitiesJune 30 Principal Interest2020 $ $ 18,7772021 14,175 18,7772022 — 17,1362023 — 17,1362024 — 17,1362025-2029 46,370 82,4062030-2034 — 69,3112035-2039 62,196 55,6802040-2044 53,157 34,8102045-2046 97,824 10,782
Subtotal 273,722 $ 341,951
Add: Accretions 122,026
Total tobacco settlement asset-backed bonds $ 395,748
Notes, Loans, and Lease Revenue Obligation Notes
Notes from Direct Placements
BANs are issued by LACCAL to provide interim financing for equipment purchases. BANs are purchased by the County Treasury Pool and are payable within 5 years. In addition, the BANs are issued with a formal agreement that, in the event they are not liquidated within the five-year period, they convert to capital lease obligations with a three-year term secured by County real property. During FY 2018-2019, LACCAL, an Internal Service Fund, issued additional BANs in the amount of $30.00 million as reflected in governmental activities and $0 as reflected in business-type activities. As of June 30, 2019, the unissued BANS balance is $17.50 million and the note balance is $50.00 million for governmental activities only.
Loans from Direct Borrowings
Marina del Rey loans were obtained from the California Department of Boating and Waterways for the restoration and renovation of the marina seawall. The loans are secured by Marina del Rey lease revenue and by Los Angeles County Music Center parking revenues. The loan contract contains a provision that in the event the County fails to make payment due, all principal and interest outstanding shall become immediately due and payable, and the deficiency will be added to, and become part of, the principal of the loan. As of June 30, 2019, the balance is $12.22 million.
126

COUNTY OF LOS ANGELESNOTES TO THE BASIC FINANCIAL STATEMENTS
FOR THE YEAR ENDED JUNE 30, 201911. LONG-TERM OBLIGATIONS-Continued
Notes, Loans, and Lease Revenue Obligation Notes-Continued
Loans from Direct Borrowings-Continued
In June 2010, the Board approved a resolution authorizing the Waterworks Districts to obtain Safe Drinking Water State Revolving loans in the amount of $3.41 million and $5.47 million from the California Department of Public Health to fund the Sepulveda Feeder Interconnection project (Malibu) and the Marina del Rey Waterline Replacement project (Marina), respectively. The loans will be repaid over 20 years and are secured by revenues from surcharges collected for capital improvements. Annual principal and interest payments of the loans are expected to require less than 46.73% of the annual surcharge revenues. The funding agreements contain a provision that in an event of default, obligations may be immediately due and payable, and further disbursements may be terminated. During FY 2018-2019, the County did not obtain any additional loans. As of June 30, 2019, total loans drawn are $3.40 million on the Sepulveda Feeder Interconnection project and $5.47 million on the Marina del Rey Waterline Replacement project. As of June 30, 2019, the balance is $6.93 million.
In July 2014, the Board approved the Whiteman Airport Leasehold Interest Acquisition Project, with a total Project cost of $4.02 million. To partially finance the acquisition, the Aviation Enterprise Fund obtained an Airport Development Loan from the State of California Department of Transportation, Aeronautics Program for $2.00 million with an annual interest rate of 2.95%. The Airport Development Loan will be repaid over 17 years with revenue generated by rental income. The loan agreement contains a provision that if the County fails to comply with or perform any term or condition in the agreement, or fails to pay the annual loan payment, the entire outstanding principal amount of the loan and all accrued interest may be immediately due and payable. In addition, the County may be ineligible for future financing under the program. During FY 2018-2019, the County did not obtain any additional airport development loans. As of June 30, 2019, the balance is $1.62 million.
Lease Revenue Obligation Notes from Direct Borrowings
Lease revenue obligation notes (LRON) provide the County with a flexible and cost-effective source of financing to provide interim funding during the initial construction phase of a capital project, which may be refinanced with the issuance of long-term bonds upon completion. Repayment of LRON are secured by four irrevocable direct-pay letters of credit (LOC) from separate banks supporting the issuance of LRON. This program is secured by fifteen County-owned properties pledged as collateral in a lease-revenue financing structure with LACCAL. The LOCs were issued for a five-year period and have a termination date of April 4, 2024. The County has the option to extend the LOCs for an additional one-year period or to some other term mutually agreed to with the participating banks.
The aggregate maximum principal amount of the four LOCs is $600.00 million, which consists of $100.00 million of Series A (Bank of the West), $200.00 million of Series B (U.S. Bank), $200.00 million of Series C (Wells Fargo Bank), and $100.00 million of Series D (State Street Bank). The County is responsible for the payment of a non-refundable letter of credit fee for each LOC on a quarterly basis in an amount equal to the rate per annum corresponding to the lowest long-term unenhanced debt ratings assigned by any of Moody’s, S&P, or Fitch to any Lease Obligation Debt of the County. The letter of credit fee for all four series of LOCs is equal to 0.35% of the maximum principal amount of the LOC. As of June 30, 2019, $562.32 million of LRON issued under the program were outstanding, including $100.00 million of Series A, $186.84 million of Series B, $175.48 million of Series C, and $100.00 million of Series D.
127

COUNTY OF LOS ANGELESNOTES TO THE BASIC FINANCIAL STATEMENTS
FOR THE YEAR ENDED JUNE 30, 201911. LONG-TERM OBLIGATIONS-Continued
Notes, Loans, and Lease Revenue Obligation Notes-Continued
Lease Revenue Obligation Notes from Direct Borrowings-Continued
LRON are issued as variable rate instruments with a maximum term not to exceed 270 days. On thematurity date of LRON, the notes are reissued at the prevailing interest rates in the note market, whichreflects the term of the note and the perceived credit quality of the supporting letter of credit bank. Inthe event the notes are not able to be reissued in the note market, the bank will make a PrincipalAdvance to pay the principal of the maturing note. If the Principal Advance remains outstanding longerthan 90 days, a term loan is created to repay the bank. During FY 2018-2019, the County reissued$75.49 million for governmental activities and reissued $249.10 million for business-type activities,representing the total amounts outstanding at the beginning of the year. These reissues, alongwith an additional $237.73 million of new County LRON, which is reported as $163.69 million forgovernmental activities and $74.04 million for business-type activities, are reflected as notes payable.The total outstanding LRON as of June 30, 2019 is $562.32 million, which is reported as $239.18 millionfor governmental activities and $323.14 million for business-type activities. The average interest rateon LRON issued in FY 2018-2019 was 1.34%.
Principal and interest requirements on NPC BANS, Marina del Rey Loans and LRON for governmentalactivities and NPC BANS, Waterworks District Loans, Aviation Loan and LRON for business-typeactivities are as follows (in thousands):
Year Ending Governmental Activities Business-type ActivitiesJune 30 Principal Interest Principal Interest2020 $ 260,170 $ 550 $ 323,444 $ 1272021 31,039 505 504 1962022 1,086 458 516 1842023 1,135 410 528 1712024 1,186 359 541 1582025-2029 6,781 942 2,910 5882030-2034 — — 2,976 2192035 271 3Total notes, loans, and LRON $ 301,397 $ 3,224 $ 331,690 $ 1,646
128

COUNTY OF LOS ANGELESNOTES TO THE BASIC FINANCIAL STATEMENTS
FOR THE YEAR ENDED JUNE 30, 201911. LONG-TERM OBLIGATIONS-Continued
Summary-All Future Principal, Interest and Accretions
The following summarizes total future principal and interest requirements for the various debt issuesreferenced above (in thousands):
Governmental Activities Business-type ActivitiesDebt Type Principal Interest Principal InterestAssessment bonds $ 13,620 $ 352 $ $Certificates of participation and bonds 1,226,880 976,117 703,836 597,235Tobacco settlement asset-backed bonds 273,722 341,951Notes, Loans, and LRON from directborrowings and placements 301,397 3,224 331,690 1,646Subtotal 1,815,619 $ 1,321,644 1,035,526 $ 598,881Add: Accretions 143,725
Unamortized premiums on bonds payable 124,277 30,118
Total bonds and notes $ 2,083,621 $ 1,065,644
Long-term liabilities recorded in the government-wide statement of net position include accreted interest on zero coupon bonds and unamortized bond premiums.
Bonds Defeased in Prior Years
In prior years, various debt obligations, consisting of bonds and certificates of participation, were defeased by placing the proceeds of refunding bonds in an irrevocable trust to provide for all future debt service payments on the old obligations. GASB 86, "Certain Debt Extinguishment Issues," requires that debt also be considered defeased when cash and other monetary assets acquired with only existing resources are placed in an irrevocable trust to extinguish debt. Accordingly, the trust account assets and the related debt service payments for the defeased bonds would not be reflected in the County’s statement of net position. At June 30, 2019, there were no outstanding bonds and certificates of participation considered defeased.
129

COUNTY OF LOS ANGELESNOTES TO THE BASIC FINANCIAL STATEMENTS
FOR THE YEAR ENDED JUNE 30, 201911. LONG-TERM OBLIGATIONS-Continued
Changes in Long-term Liabilities
The following is a summary of long-term liabilities and corresponding activity for the year endedJune 30, 2019 (in thousands):
Balance Additions/ Transfers/ Balance Due WithinJuly 1, 2018 Accretions Maturities June 30, 2019 One Year
Governmental activities:Bonds payable $ 1,272,794 302,380 60,952 $ 1,514,222 $ 48,512Add: Unamortized premium on
bonds payable 82,158 44,179 2,060 124,277 2,572Total bonds payable 1,354,952 346,559 63,012 1,638,499 51,084Interest accretion on capital
appreciation bonds payable 152,040 3,603 11,918 143,725 14,489Notes, loans, and LRON from direct
borrowings and placements 112,220 269,175 79,998 301,397 260,170Other long-term liabilities:Capital lease obligations (Note 10) 162,606 1,586 7,305 156,887 9,990Accrued compensated absences 1,557,458 219,250 117,257 1,659,451 104,185Workers’ compensation (Note 18) 2,509,435 586,551 465,603 2,630,383 488,835Litigation and self-insurance (Note 18) 207,723 144,432 87,831 264,324 139,820Pollution remediation obligation
(Note 19) 46,022 1,639 3,549 44,112 1,177Net pension liability (Note 8) 9,221,697 443,257 8,778,440Net OPEB liability (Note 9) 21,815,813 1,371,199 20,444,614Third party payor 54,306 179,903 154,719 79,490 56,543Total governmental activities $37,194,272 1,752,698 2,805,648 $ 36,141,322 $ 1,126,293Business-type activities:Bonds payable $ 724,816 — 20,980 $ 703,836 $ 19,430Add: Unamortized premium on
bonds payable 31,275 — 1,157 30,118 1,259Total bonds payable 756,091 — 22,137 733,954 20,689Notes, loans, and LRON from direct
borrowings and placements 259,574 323,145 251,029 331,690 323,444Other long-term liabilities:Capital lease obligations (Note 10) 235 — 70 165 73Accrued compensated absences 225,614 9,355 14,445 220,524 12,622Workers’ compensation (Note 18) 348,993 47,215 36,774 359,434 39,853Litigation and self-insurance (Note 18) 91,550 1,746 9,990 83,306 26,740Net pension liability (Note 8) 1,628,234 61,465 1,566,769Net OPEB liability (Note 9) 4,506,330 312,014 4,194,316Third party payor (Note 14) 733,097 42,727 226,874 548,950 2,961Total business-type activities $ 8,549,718 424,188 934,798 $ 8,039,108 $ 426,382
130

COUNTY OF LOS ANGELESNOTES TO THE BASIC FINANCIAL STATEMENTS
FOR THE YEAR ENDED JUNE 30, 201911. LONG-TERM OBLIGATIONS-Continued
Changes in Long-term Liabilities-Continued
For governmental activities, the General Fund, the Fire Protection District Special Revenue Fund andthe LA County Library Special Revenue Fund have typically been used to liquidate workers’compensation, accrued compensated absences, pension, OPEB, and litigation and self-insurance.
Bond interest accretions for deep discount bonds have been included in the amounts reported for Bonds.Accretions decreased during FY 2018-2019, thereby decreasing liabilities for Bonds by $8.32 millionfor governmental activities. Note 18 contains information about changes in the combined current andlong-term liabilities for workers' compensation and litigation and self-insurance.
Discretely Presented Component Unit
Long-term debt obligations and corresponding activity for the LACDA discretely presented componentunit for the year ended June 30, 2019, was as follows (in thousands):
Balance Due WithinJuly 1, 2018 Additions Maturities June 30, 2019 One Year
Governmental activities:Notes from direct borrowing $ 15,386 3,120 7,922 $ 10,584 $ 1,564Compensated absences 903 1,181 1,084 1,000 900Capital lease obligations 980 14 256 738 247Claims payable 4,546 1,992 3,016 3,522 352Net pension liability 22,520 2,417 20,103Net OPEB liability 2,108 549 1,141 1,516Total governmental
activities $ 46,443 6,856 15,836 $ 37,463 $ 3,063
Business-type activities:Bonds payable $ 34,140 700 $ 33,440 $ 735Notes from direct borrowing 2,200 — — 2,200 —Compensated absences 774 987 864 897 808Net pension liability 16,882 1,905 14,977Net OPEB liability 330 68 141 257Total business-type
activities $ 54,326 1,055 3,610 $ 51,771 $ 1,543
Total long-term obligations $ 100,769 7,911 19,446 $ 89,234 $ 4,606
12. SHORT-TERM DEBT
On July 2, 2018, the County issued $700.00 million of short-term Tax and Revenue Anticipation Notesat an effective interest rate of 1.55%. The proceeds of the notes were used to assist with County GeneralFund cash flow needs prior to the first major apportionment of property taxes, which occurred inDecember 2018. The notes matured and were redeemed on June 28, 2019.
131

COUNTY OF LOS ANGELESNOTES TO THE BASIC FINANCIAL STATEMENTS
FOR THE YEAR ENDED JUNE 30, 201913. CONDUIT DEBT OBLIGATIONS
Community Facilities and Improvement District Bonds
As of June 30, 2019, various community facilities and improvement districts established by the Countyhad outstanding special tax bonds payable totaling $22.86 million and limited obligation improvementbonds totaling $1.14 million. The bonds were issued to finance the cost of various construction activitiesand infrastructure improvements, which have a regional or direct benefit to the related property owners.
The bonds do not constitute an indebtedness of the County and are payable solely from special taxesand benefit assessments collected from property owners within the districts. In the opinion of Countyofficials, these bonds are not payable from any revenues or assets of the County and neither the fullfaith and credit of the County, the State or any political subdivision thereof is obligated to the paymentof the principal or interest on the bonds. Accordingly, no liability has been recorded in the accompanyingbasic financial statements.
The County functions as an agent for the districts and bondholders. Debt service transactions relatedto the various bond issues are reported in the agency funds. Construction activities are reported in theImprovement Districts' Capital Projects Fund.
Industrial Development and Other Conduit Bonds
Industrial development bonds, and other conduit bonds, have been issued to provide financial assistanceto private sector entities and nonprofit corporations for the acquisition of industrial and health carefacilities, which provide a public benefit. The bonds are secured by the facilities acquired and/or bankletter of credit and are payable solely from project revenue or other pledged funds. The County is notobligated in any manner for the repayment of the bonds. Accordingly, no liability has been recorded inthe accompanying basic financial statements.
As of June 30, 2019, the amount of industrial development and other conduit bonds outstanding was$69.06 million.
Redevelopment Refunding Bonds
The County of Los Angeles Redevelopment Refunding Authority, a JPA between the County and thePublic Works Financing Authority, was established to issue bonds that would enable successor agenciesto former redevelopment agencies within the County to refund their outstanding tax allocation bondsin order to achieve debt service savings and to provide significant economies of scale through reducedcosts of issuance and lower interest rates. The bonds are secured by a lien on future tax revenues ofsuccessor agencies. The County is not obligated in any manner for the repayment of the bonds.Accordingly, no liability has been recorded in the accompanying basic financial statements.
As of June 30, 2019, the amount of redevelopment refunding bonds outstanding was $620.77 million.
132

COUNTY OF LOS ANGELESNOTES TO THE BASIC FINANCIAL STATEMENTS
FOR THE YEAR ENDED JUNE 30, 201914. HOSPITAL AND OTHER PROGRAM REVENUES
Net patient service revenue is reported at the estimated net realizable amounts from patients, thirdparty payors, and others for services rendered, including estimated retroactive adjustments underreimbursement agreements with third party payors. Retroactive adjustments are accrued on anestimated basis in the period the related services are rendered and adjusted in future periods, as finalsettlements are determined.
Medi-Cal Demonstration Project: Medi-Cal 2020
On December 30, 2015, the federal Centers for Medicaid and Medicare Services (CMS) approved thespecial terms and conditions (STCs) for Medi-Cal 2020 - a five-year renewal of California’s Section1115(a) Medi-Cal Demonstration Project, which provides California with new federal funding throughprograms with an intent to shift focus away from hospital-based and inpatient care, towards outpatient,primary, and preventative care. Medi-Cal 2020 covers the period January 1, 2016 to December 31,2020.
Revenues for the public hospitals under Medi-Cal 2020 are composed of:
1) Global Payment Program2) Public Hospitals Redesign and Incentives in Medi-Cal3) Whole Person Care
Global Payment Program
The Global Payment Program (GPP) is a payment reform program that aims to change the way county-owned and operated Public Hospital Systems (PHS) in California are compensated for providing care to the remaining uninsured. The program encourages a shift away from cost-based, hospital-centric models of care, through financial incentives to provide cost-effective primary and specialty care.
The GPP funds are comprised of Disproportional Share Hospital (DSH) funds that otherwise would have been allotted to a PHS, and Safety Net Uncompensated Care Pool (SNCP). DSH is a federal program to support safety-net hospital caring for a disproportionate share of low-income patients. SNCP was established under California’s 2005 waiver to support services provided to uninsured patients. The GPP lifts restrictions that have historically impeded providing services for the remaining uninsured in the most appropriate setting for each patient, and now includes non-traditional methods of care delivery that have not been covered under either program.
The shift from volume to value is done through a value-based point methodology, which takes into account both the value of care to the patient, and the recognition of costs to the health care system.
Each participating PHS has an opportunity to earn a global budget for care to the remaining uninsured, and must meet service thresholds to receive full funding. Points are assigned to services in the following categories:
133

COUNTY OF LOS ANGELESNOTES TO THE BASIC FINANCIAL STATEMENTS
FOR THE YEAR ENDED JUNE 30, 201914. HOSPITAL AND OTHER PROGRAM REVENUES-Continued
Medi-Cal Demonstration Project: Medi-Cal 2020-Continued
Global Payment Program-Continued
• Traditional Outpatient (e.g., primary or specialty care visit, dental, ER/urgent care, mental healthvisit).
• Non-Traditional Outpatient (e.g., health coaching, care navigation, community wellnessencounters).
• Technology-Based Outpatient (e.g., nurse advice line, email consultation, provider-to-providereConsult for specialty care).
• Inpatient and Facility Stays (e.g., trauma care, ICU stays, recuperative care, respite care, sobercenter stays, skilled nursing facility stays).
The County provides funding for the State of California’s (State's) share of the program by “using Intergovernmental Transfers (IGTs)” to draw down federal matching funds.
The estimated GPP revenues and related IGTs recorded in FY 2018-2019, in thousands, were as follows:
GPPRevenues
IntergovernmentalTransfers Expense
Harbor-UCLA Medical Center $ 302,472 $ 160,348Olive View-UCLA Medical Center 131,180 61,642LAC+USC Medical Center 323,826 244,631Rancho Los Amigos National Rehab Center 118,117 101,666
Total $ 875,595 $ 568,287
The General Fund received $352.34 million for GPP and paid $62.82 million of related IGTs, which were recorded as “Charges for Services” revenue and "Health and Sanitation" expenditures, respectively, on the governmental funds statement.
Public Hospital Redesign and Incentives in Medi-Cal
The Public Hospital Redesign and Incentives in Medi-Cal (PRIME) program is the successor to the 2010 Bridge to Reform waiver’s Delivery System Reform Incentive Program (DSRIP), a pay-for-performance program that improves care delivery to prepare California’s PHS for an influx of newly covered patients through the implementation of the Affordable Care Act (ACA).
PRIME directs PHS, district, and municipal hospitals to use evidence-based quality improvement methods to achieve ambitious, year-over-year performance targets. All federal funding for this program is contingent on meeting these targets.
134

COUNTY OF LOS ANGELESNOTES TO THE BASIC FINANCIAL STATEMENTS
FOR THE YEAR ENDED JUNE 30, 201914. HOSPITAL AND OTHER PROGRAM REVENUES-Continued
Medi-Cal Demonstration Project: Medi-Cal 2020-Continued
Public Hospital Redesign and Incentives in Medi-Cal-Continued
Efforts within PRIME include (1) increasing the capability to furnish patient-centered, data driven, team-based care, (2) improving the capacity to provide point-of-care services, complex care management and population health management, (3) improving population and health outcomes, (4) high quality care that integrates physical and behavioral health services in the most appropriatesetting and (5) moving towards value-based payments. The estimated revenues below, in thousands,were recorded as “other operating revenues” in FY 2018-2019:
PRIMERevenues
IntergovernmentalTransfers Expense
Harbor-UCLA Medical Center $ 138,237 $ 86,029Olive View-UCLA Medical Center 33,994 33,995LAC+USC Medical Center 106,266 39,686Rancho Los Amigos National Rehab Center 30,195 30,195
Total $ 308,692 $ 189,905
The General Fund received $109.71 million for PRIME and paid $19.29 million of related IGTs, which were recorded as “Intergovernmental Revenue Federal” and "Health and Sanitation" expenditures, respectively, on the governmental funds statement.
Whole Person Care
Whole Person Care (WPC) pilot program focuses on coordination of health, behavioral health, and social services in a patient-centered manner with the goals of improved beneficiary health and well-being through more efficient and effective use of resources.
WPC program is on a calendar year basis, starting with 2016. The General Fund received $259.88 million for WPC revenues, which were recorded as "Intergovernmental Revenue Federal" on the governmental funds statement. In addition, the General Fund recorded $149.26 million of WPC IGT expenditures, which were recorded as "Health and Sanitation" expenditures on the governmental funds statement.
Medi-Cal Demonstration Project: Bridge to Reform
Bridge to Reform was approved in November 2010 by CMS, pursuant to Section 1115(a) of the Social Security Act. This waiver affected many aspects of Medi-Cal revenue for the County hospitals and clinics including the financing methods by which the State drew down federal matching funds. Bridge to Reform covered the period November 1, 2010 to October 31, 2015, with a temporary extension to December 31, 2015.
Although DSH and SNCP ended in FY 2014-2015, the Department of Health Care Services (DHCS) has yet to perform the final reconciliation for various program years. In FY 2018-2019, the financial impact of these programs is immaterial.
135

COUNTY OF LOS ANGELESNOTES TO THE BASIC FINANCIAL STATEMENTS
FOR THE YEAR ENDED JUNE 30, 201914. HOSPITAL AND OTHER PROGRAM REVENUES-Continued
Managed Care for Seniors and Persons with Disabilities
Under the Medi-Cal Demonstration Project, in an effort to provide more coordinated care and containcosts, Medi-Cal beneficiaries who are Seniors and Persons with Disabilities (SPDs) are required toenroll in managed care plans, rather than using a fee for service system. In FY 2018-2019, an estimated$121.87 million of SPD revenues were recorded as part of net patient service revenue.
The Medi-Cal Demonstration Project required the County to make IGTs to the State to fund the non-federal share of Medi-Cal inpatient payments for the SPD managed care population. Expensesassociated with such IGTs were $75.48 million in FY 2018-2019.
The General Fund received $26.11 million for SPD, which were recorded as "Charges for Services"revenue on the governmental funds statement.
Affordable Care Act
On January 1, 2014, when the federal health care reform of the Patient Protection went into effect, theHospital Presumptive Eligibility program also provided individuals with temporary Medi-Cal benefitswhile a formal, permanent Medi-Cal application is being processed.
Medicaid Coverage Expansion
The Medicaid Coverage Expansion (MCE), also known as the Optional Medicaid Expansion program, provides Medi-Cal coverage for adult citizens or legal residents (ages 19-64) who are uninsured and have incomes at or below 138% of the Federal Property Level. The Federal Medical Assistance Percentage (FMAP) for the MCE Program is 100.00% from July 1, 2016 through December 31, 2016, 95.00% from January 1, 2017 through December 31, 2017, 94.00% from January 1, 2018 through December 31, 2018, and 93.00% effective January 1, 2019.
During FY 2018-2019, LA Care Health Plan (LA Care), one of the health plans which subcontracts with the County to provide services for their Medi-Cal managed care members, continued to pay the County managed care capitation payments based on the FY 2017-2018 contract rates. The two organizations are currently working together to determine the new rates, but the negotiated rates are not yet finalized. For the MCE capitated lives, the official MCE rates are estimated to have increased in FY 2018-2019.
In FY 2018-2019, the total estimated MCE revenues and related estimated IGTs, including prior year over/under-realization were as follows (in thousands):
ProgramRevenues
IntergovernmentalTransfers Expense
MCE $ 131,333 $ 16,861MCRS - MCE 148,787 9,770Total $ 280,120 $ 26,631
The General Fund received $78.52 million for MCE and paid $12.40 million of related IGTs, which were recorded as "Charges for Services" revenue and "Health and Sanitation" expenditures, respectively, on the governmental funds statement.
136

COUNTY OF LOS ANGELESNOTES TO THE BASIC FINANCIAL STATEMENTS
FOR THE YEAR ENDED JUNE 30, 201914. HOSPITAL AND OTHER PROGRAM REVENUES-Continued
Other Medi-Cal Programs
Medi-Cal Fee-For-Service
The Medi-Cal Demonstration Project restructured the financing method by which the State draws down federal matching funds for the inpatient hospital fee for service (FFS) to cost based reimbursement. The non-federal share of the Medi-Cal FFS is provided by the hospitals primarily through certified public expenditures (CPE) whereby the hospital expends its local funding for services to draw down the federal financing participation, currently provided at a 50% match. For FY 2018-2019, an estimated $420.18 million of Medi-Cal FFS revenues were recorded as part of net patient service revenue.
Medi-Cal Physician State Plan Amendment
The Medi-Cal Demonstration Project payment for inpatient and other facility services excluded professional services. State Plan Amendment 05-23 allows professional services provided by public entities to be paid similarly to the inpatient hospital services under the Medi-Cal Demonstration Project. Hospitals are allowed to claim federal reimbursement for unreimbursed costs of Medi-Cal professional services (Hospital Inpatient, Emergency Room, and Psychiatric services), which is matched at the applicable FMAP rate for the year.
Revenues of $49.38 million were recognized and recorded as part of net patient service revenue during FY 2018-2019 and included adjustments for the over/under-realization of revenues associated with FY 2008-2009 and FY 2016-2017 through FY 2017-2018.
Cost Based Reimbursement Clinics
Cost Based Reimbursement Clinics (CBRC) reimburse 100% of allowable costs for outpatient services provided to Medi-Cal beneficiaries at the County's hospital-based clinics, outpatient centers and Ambulatory Care Network health centers (excluding clinics that provide predominately public health services). CBRC revenues in FY 2018-2019 were $147.06 million. As of June 30, 2019, the County estimated that approximately $65.61 million of CBRC accounts receivable would not be collectible within 12 months and this amount is classified as a non-current asset in the proprietary fund statements of net position for each hospital.
The General Fund received $42.31 million for CBRC, which was recorded as "Charges for Services" revenue on the governmental funds statement. As of June 30, 2019, the County estimated that approximately $11.38 million of CBRC accounts receivable would not be collectible within 12 months.
Medi-Cal Cost Report Settlements
In FY 2018-2019, the County recognized favorable audit settlements of $83.86 million related to FY 2015-2016, and FY 2016-2017. The County’s various level appeals to the Office of Administrative Appeals of certain audit adjustments have been favorably resolved resulting in $5.35 million of final settlement revenues.
The State is in the process of auditing the FY 2017-2018 cost reports and settlements are expected by the 4th quarter of FY 2019-2020.
137

COUNTY OF LOS ANGELESNOTES TO THE BASIC FINANCIAL STATEMENTS
FOR THE YEAR ENDED JUNE 30, 201914. HOSPITAL AND OTHER PROGRAM REVENUES-Continued
Other Medi-Cal Programs-Continued
Medi-Cal Managed Care Rate Supplements
The State is obtaining CMS' approval to continue the Medi-Cal Managed Care Rate Supplements (MCRS) paid to LA Care and Health Net Health Plans for FY 2018-2019. The supplements are funded by IGTs made by the County. The County does not receive the supplemental payments directly from the State; rather, the State contracts with LA Care and Health Net, which then subcontract for services with various provider networks.
In addition, in order to receive the supplemental payments, the County is required by Welfare and Institutions Code Section 14301.4, to pay the State a 20% administrative fee that is assessed on the full amount of the IGTs. This amount is also recorded as part of the IGT.
The total estimated managed care rate supplement revenues and related estimated IGTs recorded in FY 2018-2019, including prior year over/under realization, were as follows (in thousands):
MCRSRevenues
IntergovernmentalTransfers Expense
LA Care $ 70,810 $ 40,468Health Net 25,321 15,064
Total $ 96,131 $ 55,532
The General Fund received $127.71 million for MCRS and paid $71.39 million of related IGTs, which were recorded as "Charges for Services" revenue and "Health and Sanitation" expenditures, respectively, on the governmental funds statement.
Managed Care Rule
On April 25 2016, CMS published the Medicaid and Children's Health Insurance Program (CHIP) Managed Care Final Rule. The rule, many provisions of which went into effect July 1, 2017, is an update to the regulatory framework for Medicaid, aligning it as much as possible with Medicare and other commercial insurance requirements for issues like rate setting, access standards, grievances and appeals, and quality.
The managed care rule limits the ability of states to direct payments to health care providers, unless certain conditions are met. Among the allowable exceptions are payments tied to performance, and payments that provide a uniform payment increase which includes a pre-determined increase over contracted rates. The previous SPD-SB208 and AB85 MCE-to-Cost programs did not meet these conditions. In order to retain this critical funding, the following two programs were introduced:
1. Enhanced Payment Program2. Quality Incentive Program
138

COUNTY OF LOS ANGELESNOTES TO THE BASIC FINANCIAL STATEMENTS
FOR THE YEAR ENDED JUNE 30, 201914. HOSPITAL AND OTHER PROGRAM REVENUES-Continued
Other Medi-Cal Programs-Continued
Managed Care Rule-Continued
Enhanced Payment Program
The Enhanced Payment Program (EPP) creates a funding to be used to supplement the base rates public health care systems receive through Medi-Cal managed care contracts, meant to meet the managed care rule’s exception that allows payments that provide a uniform increase within a class of providers such as a predetermined increase over contracted rates.
Enhanced payments public health care systems would be eligible to receive depend largely on systems’ existing payment arrangements with their managed care plans. Under the proposed structure, health plans would receive an add-on to their managed care rates and would provide interim payments to providers throughout the year. Payments would be reconciled at the end of the year, protecting health plans from any risk associated with payment.
At FY 2018-2019 year-end, the estimated EPP revenues and related IGTs are as follows (in thousands):
EPPRevenues
IntergovernmentalTransfers Expense
Harbor-UCLA Medical Center $ 180,518 $ 28,651Olive View-UCLA Medical Center 66,019 11,377LAC+USC Medical Center 207,138 33,062Rancho Los Amigos National Rehab Center 10,180 2,611
Total $ 463,855 $ 75,701
As of June 30, 2019, the County estimated that approximately $299.10 million of EPP accounts receivable would not be collectible within 12 months and this amount is classified as a non-current asset in the proprietary fund statements of net position for each hospital.
The General Fund received $184.55 million for EPP and paid $21.82 million of related IGTs, which were recorded as "Charges for Services" revenue and "Health and Sanitation" expenditures, respectively, on the governmental funds statement.
Quality Incentive Program
The Quality Incentive Program (QIP) is meant to meet the Managed Care Rule’s exception that allows payments tied to performance.
The QIP represents a new pay for performance program for California’s public health care systems that would convert funding from previously-existing supplemental payments into a value-based structure. QIP payments are tied to the achievement of performance on a set of clinically-established quality measures for Medi-Cal managed care enrollees.
The QIP is structured similar to the PRIME program. The QIP’s measures do not directly overlap with any of the quality measures being used in PRIME, but are designed to be complementary.
139

COUNTY OF LOS ANGELESNOTES TO THE BASIC FINANCIAL STATEMENTS
FOR THE YEAR ENDED JUNE 30, 201914. HOSPITAL AND OTHER PROGRAM REVENUES-Continued
Other Medi-Cal Programs-Continued
Managed Care Rule-Continued
Quality Incentive Program-Continued
At FY 2018-2019 year end, the estimated QIP revenues, recorded as "other operating revenues", and related IGTs, including prior year over/under realization, are as follows (in thousands):
QIPRevenues
IntergovernmentalTransfers Expense
Harbor-UCLA Medical Center $ 35,138 $ (10,428)Olive View-UCLA Medical Center 18,770 (7,402)LAC+USC Medical Center 38,252 (11,820)Rancho Los Amigos National Rehab Center 77 (1,480)
Total $ 92,237 $ (31,130)
As of June 30, 2019, the County estimated that approximately $88.16 million of QIP accounts receivable would not be collectible within 12 months and this amount is classified as a non-current asset in the proprietary fund statements of net position for each hospital.
The General Fund received $14.81 million for QIP and paid $3.49 million of related IGTs, which were recorded as "Intergovernmental Revenue Federal" and "Health and Sanitation" expenditures, respectively, on the governmental funds statement.
Third Party Payor Liability
The County's Hospitals reported third party payor liabilities of $548.95 million (see Note 11) as of June 30, 2019, as reported on the statement of net position for proprietary funds. The current liabilities for amounts due within one year are $2.96 million.
The noncurrent liabilities for third party payors are $545.99 million. The primary programs associated with third party payors liabilities include DSH ($239.15 million), Medi-Cal ($103.98 million), SNCP ($54.95 million), Medicare ($49.97 million), SPD ($40.48 million), and other miscellaneous programs ($57.46 million).
Accounts Receivable-Net
The following is a summary, by hospital, of accounts receivable and allowances for uncollectible amounts as of June 30, 2019 (in thousands):
H-UCLA OV-UCLA LAC+USC Rancho TotalAccounts receivable $ 2,661,136 $ 1,454,024 $ 3,973,642 $ 637,270 $ 8,726,072Less: Allowance for
uncollectibleamounts 1,817,767 1,042,391 2,963,759 473,218 6,297,135
Accounts receivable -net $ 843,369 $ 411,633 $ 1,009,883 $ 164,052 $ 2,428,937
140

COUNTY OF LOS ANGELESNOTES TO THE BASIC FINANCIAL STATEMENTS
FOR THE YEAR ENDED JUNE 30, 201914. HOSPITAL AND OTHER PROGRAM REVENUES-Continued
Charity Care
Charity care includes those uncollectible amounts for which the patient is unable to pay. Generally,charity care adjustment accounts are those accounts for which an indigence standard has beenestablished and under which the patient qualifies. Inability to pay may be determined through theDepartment’s Ability-to-Pay program, through other collection efforts by the Department, by theTreasurer and Tax Collector, or by an outside collection agency. Determinations of charity care maybe made prior to, at the time of service, or any time thereafter. The estimated cost of charity care forthe year ended June 30, 2019 was $558.43 million. A portion of the charity care is funded by GPP ata rate of 20.00%. The total amount of such charity care provided by the hospitals for the year endedJune 30, 2019 is as follows (in thousands):
Charity care at established rates $ 1,279,384GPP reimbursement 175,119Charges forgone $ 1,104,265
Realignment
As a result of the ACA, the State of California (State) adopted and passed Assembly Bill 85 (AB85), as amended by Senate Bill 98, which lays out the process by which a portion of the 1991 County Health Realignment funds will be redirected to support Social Services programs based on a formula. The redirection is based on the assumption that the counties will decrease their cost for healthcare for the indigent population. These savings will be shared between the counties’ health departments and the State. The sharing ratio is 80% to the State and 20% to the County. This ratio has been in place since FY 2014-2015. AB85, as amended, provides a unique formula for the County to determine the amount to be redirected.
In FY 2018-2019, the State did not withhold any of the County's Health Realignment funds. This amount is expected to be reconciled against actual revenues and expenses for FY 2018-2019 within two years. The redirection amount will be subject to the State's review and approval. The financial impact of the potential redirection of realignment funding in future years is not yet known.
In FY 2017-2018, the State did not withhold any of the County's Health Realignment funds. However, based on updated revenues realized for FY 2017-2018 services in FY 2018-2019, the projected redirection amount is $82.34 million. As a result, the "Intergovernmental Revenue - State" revenue has been reduced by $82.34 million in the County's General Fund in FY 2018-2019.
In FY 2016-2017, the State withheld $5.61 million from the County's Health Realignment funds. However, based on updated revenues realized for FY 2016-2017 services in FY 2018-2019, the projected redirection amount is $229.89 million. As a result, the "Intergovernmental Revenue - State" revenue has been reduced by $224.28 million in the County's General Fund in FY 2018-2019.
141

COUNTY OF LOS ANGELESNOTES TO THE BASIC FINANCIAL STATEMENTS
FOR THE YEAR ENDED JUNE 30, 201914. HOSPITAL AND OTHER PROGRAM REVENUES-Continued
Martin Luther King, Jr. Community Hospital
The County and the University of California (UC), with the State, have created a wholly independent,non-profit 501(c)(3) entity, the Martin Luther King, Jr. - Los Angeles Healthcare Corporation (MLK-LA),to operate a new hospital at the MLK-MACC site. The hospital will: i) serve as a safety-net providertreating a high volume of Medi-Cal and uninsured patients and ii) be integrated with the County's existingnetwork of specialty and primary care ambulatory clinics. The seven-member MLK Hospital Board ofDirectors was appointed by the County and UC in August 2010. The new MLK Community Hospitalopened on May 14, 2015.
To assist with the opening of the MLK Hospital, the County provided MLK-LA with $50.00 million ofcoordination start-up funds, $39.10 million of grant funding, and $82.00 million of long-term loan funding,which includes a 30-year loan in the amount of $50.00 million, a 10-year revolving line of credit in theamount of $20.00 million, and a 2-year loan in the amount of $12.00 million. On January 5, 2016, theBoard approved an additional short-term revolving loan in the amount of $40.00 million to assist MLK-LA with post-hospital opening expenses. All the loans have been repaid in full, with the exception ofthe 30-year loan, which has a current outstanding balance of $44.64 million. In addition, the DHS hascommitted to make ongoing annual payments of $18.00 million for indigent care support, and $50.00million of intergovernmental transfers for the benefit of the MLK Hospital.
15. INTERFUND TRANSACTIONS
Interfund Receivables/Payables
Interfund receivables and payables have been eliminated in the government-wide financial statements,except for “internal balances” that are reflected between the governmental and business-type activities.The majority of the interfund balances resulted from the time lag between the time that (1) goods andservices were provided; (2) the recording of those transactions in the accounting system; and (3)payments between the funds were made. Interfund receivables and payables have been recorded inthe fund financial statements. Such amounts arise due to the exchange of goods or services (or subsidytransfers) between funds that were pending the transfer of cash as of June 30, 2019.
142

COUNTY OF LOS ANGELESNOTES TO THE BASIC FINANCIAL STATEMENTS
FOR THE YEAR ENDED JUNE 30, 201915. INTERFUND TRANSACTIONS-Continued
Interfund Receivables/Payables-Continued
Cash transfers related to interfund receivables/payables are generally made within 30 days afteryear-end. Amounts due to/from other funds at June 30, 2019 are as follows (in thousands):
Receivable Fund Payable Fund Amount
General Fund Fire Protection District $ 16,513Flood Control District 12,919LA County Library 3,674Regional Park and Open Space District 5,321Mental Health Services Act 279,696Nonmajor Governmental Funds 156,357Harbor-UCLA Medical Center 84,093Olive View-UCLA Medical Center 50,609LAC+USC Medical Center 110,613Rancho Los Amigos Nat’l Rehab Center 27,960Waterworks Enterprise Funds 548Nonmajor Aviation Funds 599Internal Service Funds 8,623
757,525
Fire Protection District General Fund 1,241Nonmajor Governmental Funds 4,312
5,553
Flood Control District General Fund 799Nonmajor Governmental Funds 1,904Waterworks Enterprise Funds 299Nonmajor Aviation Funds 50Internal Service Funds 14,201
17,253
LA County Library General Fund 7,486Fire Protection District 8Nonmajor Governmental Funds 415
7,909
143

COUNTY OF LOS ANGELESNOTES TO THE BASIC FINANCIAL STATEMENTS
FOR THE YEAR ENDED JUNE 30, 201915. INTERFUND TRANSACTIONS-Continued
Interfund Receivables/Payables-Continued
Receivable Fund Payable Fund Amount
Regional Park and Open Space District General Fund $ 128
Mental Health Services Act General Fund 17,281
Nonmajor Governmental Funds General Fund 4,183Fire Protection District 1,998Flood Control District 3LA County Library 411Nonmajor Governmental Funds 18,052Internal Service Funds 18,791
43,438
Harbor-UCLA Medical Center General Fund 49,524Fire Protection District 28Nonmajor Governmental Funds 22,900Olive View-UCLA Medical Center 414LAC+USC Medical Center 1,950Rancho Los Amigos Nat'l Rehab Center 160Internal Service Funds 4
74,980
Olive View-UCLA Medical Center General Fund 41,245Fire Protection District 113Nonmajor Governmental Funds 14,578Harbor-UCLA Medical Center 116LAC+USC Medical Center 66Rancho Los Amigos Nat’l Rehab Center 20,964
77,082
LAC+USC Medical Center General Fund 52,663Fire Protection District 35Nonmajor Governmental Funds 66,784Harbor-UCLA Medical Center 132,697Olive View-UCLA Medical Center 43,584Rancho Los Amigos Nat’l Rehab Center 18,361
314,124
144

COUNTY OF LOS ANGELESNOTES TO THE BASIC FINANCIAL STATEMENTS
FOR THE YEAR ENDED JUNE 30, 201915. INTERFUND TRANSACTIONS-Continued
Interfund Receivables/Payables-Continued
Receivable Fund Payable Fund Amount
Rancho Los Amigos Nat’l Rehab Center General Fund $ 4,686Fire Protection District 13Harbor-UCLA Medical Center 42Olive View-UCLA Medical Center 3LAC+USC Medical Center 45
4,789
Waterworks Enterprise Funds General Fund 51Internal Service Funds 2,191
2,242
Nonmajor Aviation Funds Fire Protection District 15Internal Service Funds 24
39
Internal Service Funds General Fund 33,013Fire Protection District 109Flood Control District 34,266LA County Library 5Nonmajor Governmental Funds 42,758Harbor-UCLA Medical Center 1,974Olive View-UCLA Medical Center 2LAC+USC Medical Center 20Rancho Los Amigos Nat’l Rehab Center 1,608Waterworks Enterprise Funds 6,685Nonmajor Aviation Funds 398
120,838
Total Interfund Receivables/Payables $ 1,443,181
Interfund Transfers
Transfers were made during the year from the General Fund to subsidize the operations of the LA County Library and the four hospitals. Other transfers primarily consisted of payments from the various operating funds (principally the General Fund) to debt service funds in accordance with long-term debt covenants. In addition, special revenue funds that are statutorily restricted made transfers to other funds to augment funding for programs operated in the General Fund and hospitals.
145

COUNTY OF LOS ANGELESNOTES TO THE BASIC FINANCIAL STATEMENTS
FOR THE YEAR ENDED JUNE 30, 201915. INTERFUND TRANSACTIONS-Continued
Interfund Transfers-Continued
Interfund transfers to/from other funds for the year ended June 30, 2019 are as follows (in thousands):
Transfer From Transfer To Amount
General Fund Fire Protection District $ 37,324LA County Library 47,173Nonmajor Governmental Funds 105,885Harbor-UCLA Medical Center 76,652Olive View-UCLA Medical Center 7,706LAC+USC Medical Center 461,633Rancho Los Amigos Nat’l Rehab Center 86,045Internal Service Funds 138
822,556
Fire Protection District Nonmajor Governmental Funds 7,874
Flood Control District Nonmajor Governmental Funds 3Internal Service Funds 7,915
7,918
LA County Library General Fund 3,199Nonmajor Governmental Funds 737
3,936
Mental Health Services Act General Fund 643,721
Nonmajor Governmental Funds General Fund 322,874Fire Protection District 1,948LA County Library 578Nonmajor Governmental Funds 377,469Harbor-UCLA Medical Center 50,166Olive View-UCLA Medical Center 44,996LAC+USC Medical Center 122,241Rancho Los Amigos Nat'l Rehab Center 2,279Internal Service Funds 9,636
932,187
Harbor-UCLA Medical Center Nonmajor Governmental Funds 339Rancho Los Amigos Nat'l Rehab Center 491
830
146

COUNTY OF LOS ANGELESNOTES TO THE BASIC FINANCIAL STATEMENTS
FOR THE YEAR ENDED JUNE 30, 201915. INTERFUND TRANSACTIONS-Continued
Interfund Transfers-Continued
Transfer From Transfer To Amount
Olive View-UCLA Medical Center LAC+USC Medical Center $ 9,654Rancho Los Amigos Nat'l Rehab Center 822
10,476
LAC+USC Medical Center General Fund 5,047
Rancho Los Amigos Nat’l RehabCenter Harbor-UCLA Medical Center 4,174
Olive View-UCLA Medical Center 915LAC+USC Medical Center 5
5,094
Waterworks Enterprise Funds Nonmajor Governmental Funds 224Internal Service Funds 1,472
1,696
Nonmajor Aviation Funds Internal Service Funds 143
Internal Service Funds General Fund 2,948Nonmajor Governmental Funds 1,033
3,981
Total Interfund Transfers $ 2,445,459
Interfund Advances
The General Fund, along with other funds that receive services from the Public Works Internal Service Fund, makes short-term advances to ensure sufficient cash is available to fund operations. In addition, the General Fund makes short-term advances to assist the Hospital Funds in meeting their cash flow requirements.
147

COUNTY OF LOS ANGELESNOTES TO THE BASIC FINANCIAL STATEMENTS
FOR THE YEAR ENDED JUNE 30, 201915. INTERFUND TRANSACTIONS-Continued
Interfund Advances-Continued
Advances from/to other funds at June 30, 2019 are as follows (in thousands):
Receivable Fund Payable Fund Amount
General Fund Harbor-UCLA Medical Center $ 235,317Olive View-UCLA Medical Center 58,732LAC+USC Medical Center 336,473Rancho Los Amigos Nat’l Rehab Center 1,265Internal Service Funds 3,061
634,848
Flood Control District Internal Service Funds 6,339
Nonmajor Governmental Funds Internal Service Funds 11,232
Waterworks Enterprise Funds Internal Service Funds 1,368
Total Interfund Advances $ 653,787
16. BUDGETARY ACCOUNTING DIFFERENCES/RECONCILIATIONS BETWEEN THE BUDGETARYBASIS AND GAAP
The County’s statement of revenues, expenditures and changes in fund balances-budget and actualon budgetary basis for the major governmental funds has been prepared on the budgetary basis ofaccounting, which is different from GAAP.
The amounts presented for the governmental funds statements are based on the modified accrual basisof accounting and differ from the amounts presented on a budgetary basis of accounting. The majorareas of difference are as follows:
– For budgetary purposes, nonspendable, restricted, committed and assigned fund balancesand the portion of unassigned fund balance reserved for the “Rainy Day” fund are recordedas other financing uses at the time they are established. The County recognizes them asuses of budgetary fund balance. The nonspendable, restricted, committed and assigned fundbalances that are subsequently canceled or otherwise made available are recorded aschanges in fund balance in other financing sources.
148

COUNTY OF LOS ANGELESNOTES TO THE BASIC FINANCIAL STATEMENTS
FOR THE YEAR ENDED JUNE 30, 201916. BUDGETARY ACCOUNTING DIFFERENCES/RECONCILIATIONS BETWEEN THE BUDGETARY
BASIS AND GAAP-Continued
– Under the budgetary basis, revenues (primarily intergovernmental) are recognized at the timeencumbrances are established for certain programs and capital improvements. The intentof the budgetary policy is to match the use of budgetary resources (for amounts encumbered,but not yet expended) with funding sources that will materialize as revenues when actualexpenditures are incurred. Under the modified accrual basis, revenues are not recognizeduntil the qualifying expenditures are incurred and amounts are collected within the County’savailability period.
– For the General Fund, obligations for accrued compensated absences and estimated liabilitiesfor litigation and self-insurance are recorded as budgetary expenditures to the extent thatthey are estimated to be payable within one year after year-end. Under the modified accrualbasis of accounting, such expenditures are not recognized until they become due and payablein accordance with GASB Interpretation 6.
– In conjunction with the sale of Tobacco Settlement Asset-Backed bonds in FY 2005-2006,the County sold 25.9% of its future tobacco settlement revenues. Under the budgetary basis,the proceeds were recognized as revenues. Under the modified accrual basis, the proceedswere recorded as deferred inflows of resources and are being recognized over the durationof the sale agreement, in accordance with GASB 48 and 65. This matter is also discussedin Note 11, under the caption, “Tobacco Settlement Asset-Backed Bonds.”
– Under the budgetary basis, property tax revenues are recognized to the extent that they arecollectible within one year after year-end. Under the modified accrual basis, property taxrevenues are recognized only to the extent that they are collectible within 60 days.
– For budgetary purposes, investment income is recognized prior to the effect of changes inthe fair value of investments. Under the modified accrual basis, the effects of such fair valuechanges have been recognized.
– The County determined that certain assets were held by LACERA (the OPEB administrator)in an OPEB Agency Fund. For budgetary purposes, any excess payments (beyond the pay-as-you-go amount) are recognized as expenditures. Under the modified accrual basis, theexpenditures are adjusted to recognize the OPEB Agency assets at June 30, 2019.
The following schedule is a reconciliation of the budgetary and GAAP fund balances for the major governmental funds (in thousands):
149
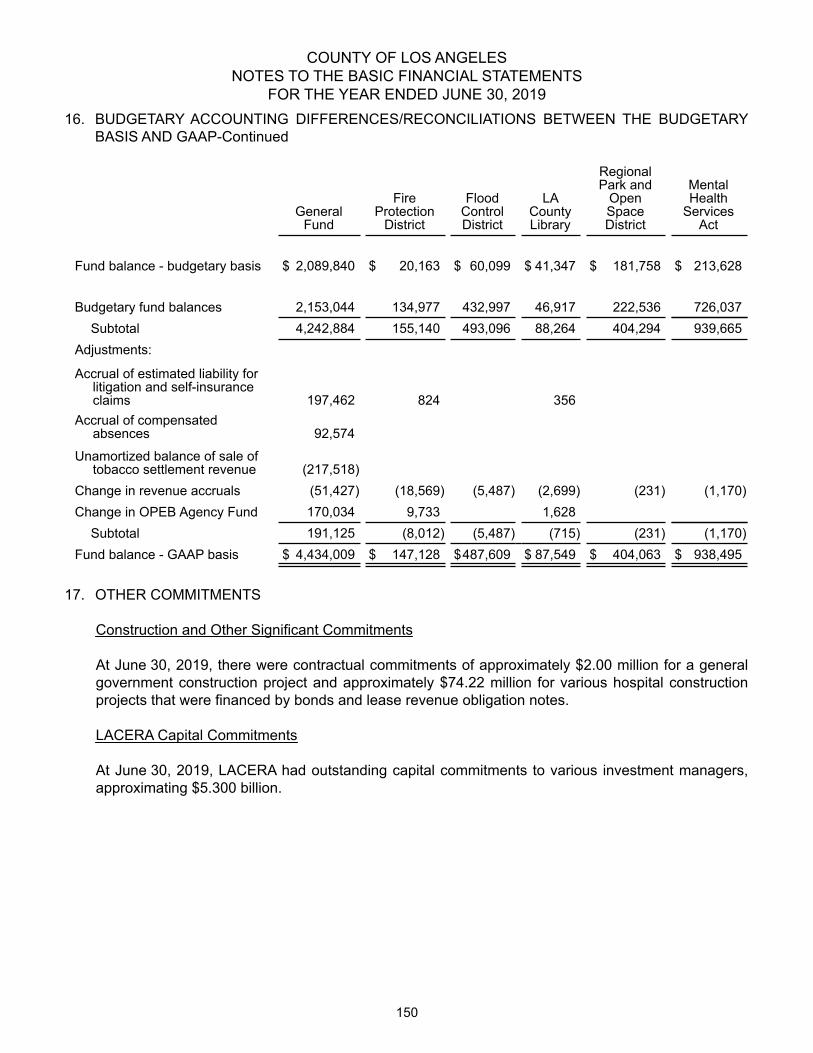
COUNTY OF LOS ANGELESNOTES TO THE BASIC FINANCIAL STATEMENTS
FOR THE YEAR ENDED JUNE 30, 201916. BUDGETARY ACCOUNTING DIFFERENCES/RECONCILIATIONS BETWEEN THE BUDGETARY
BASIS AND GAAP-Continued
GeneralFund
FireProtection
District
FloodControlDistrict
LACountyLibrary
RegionalPark and
OpenSpaceDistrict
MentalHealth
ServicesAct
Fund balance - budgetary basis $ 2,089,840 $ 20,163 $ 60,099 $ 41,347 $ 181,758 $ 213,628
Budgetary fund balances 2,153,044 134,977 432,997 46,917 222,536 726,037Subtotal 4,242,884 155,140 493,096 88,264 404,294 939,665
Adjustments:
Accrual of estimated liability forlitigation and self-insuranceclaims 197,462 824 — 356 — —
Accrual of compensatedabsences 92,574 — — — — —
Unamortized balance of sale oftobacco settlement revenue (217,518) — — — — —
Change in revenue accruals (51,427) (18,569) (5,487) (2,699) (231) (1,170)Change in OPEB Agency Fund 170,034 9,733 — 1,628 — —
Subtotal 191,125 (8,012) (5,487) (715) (231) (1,170)Fund balance - GAAP basis $ 4,434,009 $ 147,128 $487,609 $ 87,549 $ 404,063 $ 938,495
17. OTHER COMMITMENTS
Construction and Other Significant Commitments
At June 30, 2019, there were contractual commitments of approximately $2.00 million for a generalgovernment construction project and approximately $74.22 million for various hospital constructionprojects that were financed by bonds and lease revenue obligation notes.
LACERA Capital Commitments
At June 30, 2019, LACERA had outstanding capital commitments to various investment managers,approximating $5.300 billion.
150

COUNTY OF LOS ANGELESNOTES TO THE BASIC FINANCIAL STATEMENTS
FOR THE YEAR ENDED JUNE 30, 201917. OTHER COMMITMENTS-Continued
Encumbrances
The County uses “encumbrances” to control expenditure commitments for the year. Encumbrancesrepresent commitments related to executory contracts not yet performed and purchase orders not yetfilled. Commitments for such expenditure of monies are encumbered to reserve applicableappropriations. Depending on the source(s) of funding, encumbrances are reported as part of restricted,committed or assigned fund balance on the governmental funds balance sheet. As of June 30, 2019,the encumbrance balances for the governmental funds (in thousands) are reported as follows:
Restricted Committed Assigned TotalGeneral Fund $ $ $ 583,488 $ 583,488Fire Protection District 38,468 — — 38,468Flood Control District 147,259 — — 147,259LA County Library — — 24,742 24,742Regional Park and Open Space District 53,827 — — 53,827Mental Health Services Act 925 — — 925Nonmajor Governmental Funds 113,521 5,243 702 119,466Total Encumbrances $ 354,000 $ 5,243 $ 608,932 $ 968,175
18. RISK MANAGEMENT
The County purchases insurance for certain risk exposures such as property, aviation, employee fidelity,boiler and machinery, cyber, catastrophic workers’ compensation, art objects, volunteers, special events,public official bonds, crime, safety reserve employee death and disability, and fiduciary liability for thedeferred compensation plans. There have been settlements related to these programs that exceededself-insured retention in the last three years. Losses did not exceed coverage in FY 2016-2017, FY2017-2018 or FY 2018-2019.
The County retains the risk for all other loss exposures. Major areas of risk include workers'compensation, medical malpractice, law enforcement, natural disasters, inverse condemnation, non-tort and tort liability. Expenditures are accounted for in the fund whose operations resulted in the loss.Claims expenditures and liabilities are reported when it is probable that a loss has been incurred andthe amount of that loss, including those incurred but not reported, can be reasonably estimated. TheCounty utilizes actuarial studies, historical data, and individual claims reviews to estimate these liabilities.The liabilities include estimable incremental claim adjustment expenses, net of salvage, and recovery/subrogation of approximately 10% of the total liability expenditures. They do not include other claimadjustment costs because the County does not believe it is practical or cost effective to estimate them.
As indicated in the following table, the County’s workers’ compensation balance as of June 30, 2019was approximately $2.990 billion. This amount is undiscounted and is based on an actuarial study ofthe County’s self-insured program as of June 30, 2019. Approximately $111.87 million of the totalliabilities pertain to salary continuation payments and other related costs mandated by the State LaborCode.
151

COUNTY OF LOS ANGELESNOTES TO THE BASIC FINANCIAL STATEMENTS
FOR THE YEAR ENDED JUNE 30, 201918. RISK MANAGEMENT-Continued
As of June 30, 2019, the County's estimate of these liabilities is $3.337 billion. Changes in the reportedliability since July 1, 2017 resulted from the following (in thousands):
Beginning ofFiscal Year
Liability
Current YearClaims andChanges InEstimates
ClaimPayments
Balance AtFiscal Year-
End2017-2018
Workers’ Compensation $ 2,639,553 $ 679,229 $ (460,354) $ 2,858,428Other 301,519 86,925 (89,171) 299,273Total $ 2,941,072 $ 766,154 $ (549,525) $ 3,157,701
2018-2019Workers’ Compensation $ 2,858,428 $ 633,766 $ (502,377) $ 2,989,817Other 299,273 146,178 (97,821) 347,630Total $ 3,157,701 $ 779,944 $ (600,198) $ 3,337,447
In addition to the above estimated liabilities, the County has determined that claims seeking damages of approximately $174.26 million are reasonably possible of creating adverse judgments against the County. Because of the uncertainty of their outcome, no loss has been accrued for these claims.
The County receives substantial federal revenues and operates many programs which are subject to federal rules and regulations. Federal assistance is especially critical to the County's ability to operate its four County hospitals and health care network. The County is carefully monitoring State and federal policy developments to determine the future impacts, if any, on its ability to administer federal programs and deliver County services that rely upon federal funding.
19. POLLUTION REMEDIATION
The County is involved in several remediation actions to clean up pollution sites within its boundaries.These matters generally coincide with the County’s ownership of land, buildings and infrastructureassets. In some cases, regulatory agencies (e.g., Regional Water Quality Board, State Department ofToxic Control, California Coastal Commission) notified the County of the need for remedial action. Inaddition, the County conducts its own environmental monitoring and this activity identifies pollution sitesand matters requiring further investigation and possible remediation. Once the County is aware ofthese conditions, it commences monitoring, assessment, testing and/or cleanup activities, andrecognizes a pollution remediation obligation when estimates can reasonably be determined. Thepollution remediation obligation is an estimate and is subject to revision because of price increases orreductions, changes in technology, or changes in applicable laws or regulations. The types of pollutionthat have been identified include leaking underground storage tanks, water, groundwater and soilcontamination, asbestos and lead paint contamination, methane gas detection and excessive levels ofother contaminants. Remediation efforts include developing remediation and feasibility studies, sourceidentification studies, site testing, sampling and analysis, ground water cleanup, and removal of storagetanks, asbestos tiles and other hazardous materials.
152

COUNTY OF LOS ANGELESNOTES TO THE BASIC FINANCIAL STATEMENTS
FOR THE YEAR ENDED JUNE 30, 201919. POLLUTION REMEDIATION-Continued
As of June 30, 2019, the County’s estimated pollution remediation obligation totaled $44.11 million.This obligation was associated with the County’s governmental activities. Obligations of enterprise andinternal service funds were immaterial. The estimated liability was determined by project managers,based on historical cost information for projects of the same type, size and complexity and measuredat their current value. In subsequent periods, the County will adjust the estimated obligation when newinformation indicates that such changes are required. At this time, the County has determined thereare no estimated recoveries reducing the obligation.
20. DEFERRED OUTFLOWS AND INFLOWS OF RESOURCES
Deferred outflows and inflows of resources balances in the government-wide and the proprietary fundsstatement of net position as of June 30, 2019 are described as follows:
– The deferred outflows of resources, included on the government-wide statement of net position,relate to the unamortized losses on refunding of debt, changes in the net pension liability asdiscussed in Note 8, and changes in the net OPEB liability as discussed in Note 9. The unamortizedlosses on refunding of debt are a deferred charge on refunding resulting from the difference in thecarrying value of refunded debt and its reacquisition price. This amount is deferred and amortizedover the remaining life of the old debt or the life of the new debt, whichever is shorter.
– The deferred inflows of resources, included on the government-wide statement of net position, relateto the future installment payments of service concession arrangements as discussed in Note 7,from changes in the net pension liability as discussed in Note 8, and from changes in the net OPEBliability as discussed in Note 9.
Government-wideStatement of Net Position (in thousands)
GovernmentalActivities
Business-typeActivities Total
Deferred outflows of resources:Unamortized losses on refunding of debt $ 14,452 $ 14,452Pensions 3,741,547 660,040 4,401,587OPEB 1,235,058 173,808 1,408,866
Total government-wide deferred outflowsof resources $ 4,991,057 833,848 $ 5,824,905
Deferred inflows of resources:Service concession arrangements $ 82,853 $ 82,853Pensions 1,175,234 166,766 1,342,000OPEB 4,099,744 793,728 4,893,472
Total government-wide deferred inflows ofresources $ 5,357,831 960,494 $ 6,318,325
153
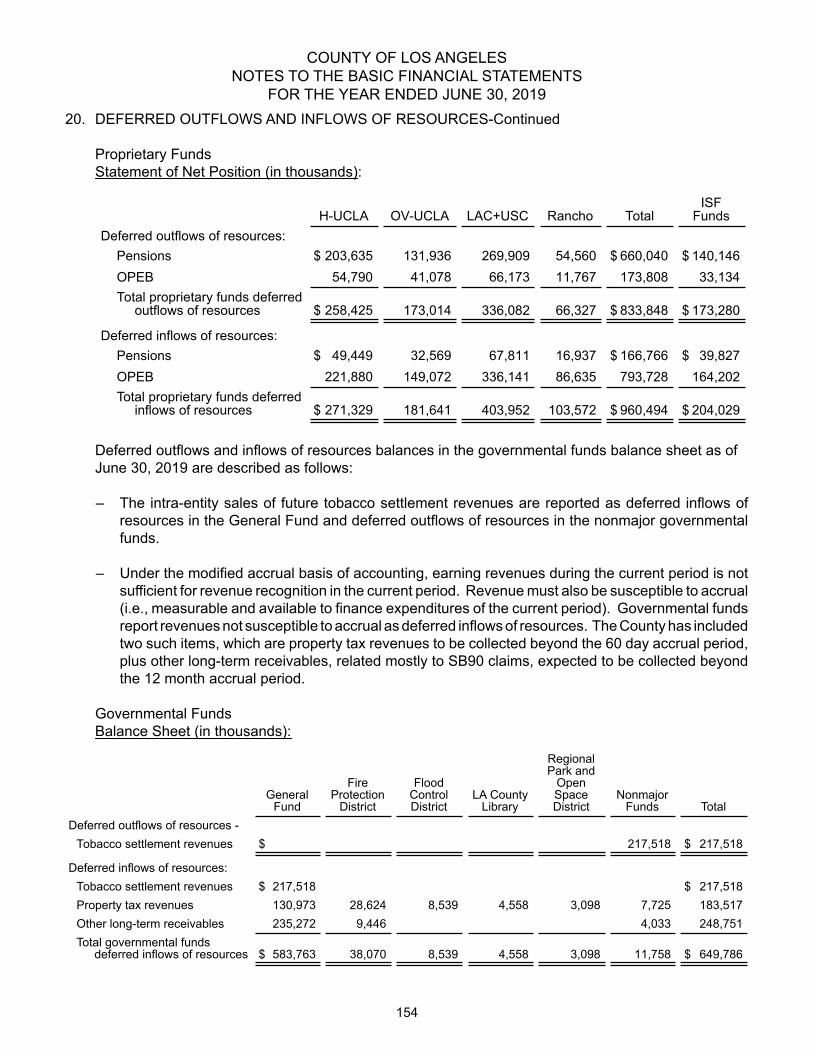
COUNTY OF LOS ANGELESNOTES TO THE BASIC FINANCIAL STATEMENTS
FOR THE YEAR ENDED JUNE 30, 201920. DEFERRED OUTFLOWS AND INFLOWS OF RESOURCES-Continued
Proprietary FundsStatement of Net Position (in thousands):
H-UCLA OV-UCLA LAC+USC Rancho TotalISF
FundsDeferred outflows of resources:
Pensions $ 203,635 131,936 269,909 54,560 $ 660,040 $ 140,146OPEB 54,790 41,078 66,173 11,767 173,808 33,134Total proprietary funds deferred
outflows of resources $ 258,425 173,014 336,082 66,327 $ 833,848 $ 173,280
Deferred inflows of resources:Pensions $ 49,449 32,569 67,811 16,937 $ 166,766 $ 39,827OPEB 221,880 149,072 336,141 86,635 793,728 164,202Total proprietary funds deferred
inflows of resources $ 271,329 181,641 403,952 103,572 $ 960,494 $ 204,029
Deferred outflows and inflows of resources balances in the governmental funds balance sheet as of June 30, 2019 are described as follows:
– The intra-entity sales of future tobacco settlement revenues are reported as deferred inflows ofresources in the General Fund and deferred outflows of resources in the nonmajor governmentalfunds.
– Under the modified accrual basis of accounting, earning revenues during the current period is notsufficient for revenue recognition in the current period. Revenue must also be susceptible to accrual(i.e., measurable and available to finance expenditures of the current period). Governmental fundsreport revenues not susceptible to accrual as deferred inflows of resources. The County has includedtwo such items, which are property tax revenues to be collected beyond the 60 day accrual period,plus other long-term receivables, related mostly to SB90 claims, expected to be collected beyondthe 12 month accrual period.
Governmental FundsBalance Sheet (in thousands):
GeneralFund
FireProtection
District
FloodControlDistrict
LA CountyLibrary
RegionalPark and
OpenSpaceDistrict
NonmajorFunds Total
Deferred outflows of resources -Tobacco settlement revenues $ 217,518 $ 217,518
Deferred inflows of resources:Tobacco settlement revenues $ 217,518 $ 217,518Property tax revenues 130,973 28,624 8,539 4,558 3,098 7,725 183,517Other long-term receivables 235,272 9,446 4,033 248,751Total governmental funds
deferred inflows of resources $ 583,763 38,070 8,539 4,558 3,098 11,758 $ 649,786
154

COUNTY OF LOS ANGELESNOTES TO THE BASIC FINANCIAL STATEMENTS
FOR THE YEAR ENDED JUNE 30, 201921. FUND BALANCES
Fund balances are presented in the following categories: nonspendable, restricted, committed,assigned, and unassigned as described in Note 1. A detailed schedule of fund balances for all themajor and nonmajor governmental funds at June 30, 2019 (in thousands) is as follows:
GeneralFund
FireProtection
District
FloodControlDistrict
LACountyLibrary
RegionalPark and
OpenSpaceDistrict
MentalHealth
ServicesAct
NonmajorGovernmental
FundsFund Balances:Nonspendable:
Inventories $ 58,050 13,229 1 664 — — 1Long-term receivables 253,908 —Permanent fund principal — — — — — — 2,145
Total Nonspendable 311,958 13,229 1 664 2,146
Restricted for:Purpose of fund 133,899 487,509 21,495 404,063 938,495 1,328,092Purpose of utility user tax 69,634Grand Avenue project 4,600Sheriff Pitchess landfill 2,976La Alameda project 2,000Capital projects 337,259Debt service 337,173Endowments and annuities 132
Total Restricted 79,210 133,899 487,509 21,495 404,063 938,495 2,002,656
Committed to:Purpose of fund 48,227Capital projects and
extraordinarymaintenance 142,946 79,602
Affordable housing 11,877Assessor tax system 1,494Board budget policies and
priorities 16,228Budget uncertainties 91,959Consolidated correctional
treatment facility debtservice 149,676
Department of children andfamily services 8,840
Financial system 11,714Health services future
financial requirements 5,328Health services-tobacco
settlement 120,104Interoperable and countywide
communication 1,740Information technology
enhancements 78,184
155

COUNTY OF LOS ANGELESNOTES TO THE BASIC FINANCIAL STATEMENTS
FOR THE YEAR ENDED JUNE 30, 201921. FUND BALANCES-Continued
GeneralFund
FireProtection
District
FloodControlDistrict
LACountyLibrary
RegionalPark and
OpenSpaceDistrict
MentalHealth
ServicesAct
NonmajorGovernmental
FundsLibrary services $ 5,370Live scan 2,000Office of Diversion and Re-
Entry PermanentSupportive Housing 80,084
Public works-permit trackingsystem 3,549
Services to unincorporatedareas 4,015
Sheriff unincorporated patrol 90TTC remittance processing
and mailroom equipment 3,877TTC unsecured property tax
system 463Voting solutions for all people 40,979
Total Committed 780,517 127,829Assigned to:
Purpose of fund 99 65,390 120,649Future purchases 620,773Capital projects 40,330
Total Assigned 620,773 99 65,390 160,979Unassigned 2,641,551
Total Fund Balances $4,434,009 147,128 487,609 87,549 404,063 938,495 2,293,610
Reserve for “Rainy Day” Fund
On June 22, 2009, the Board established a Reserve for “Rainy Day” fund. The Reserve for “Rainy Day” fund was established and maintained to protect essential County programs against unforeseen emergencies and economic downturns. The Reserve cap should be 10.00% of on-going locally generated revenue. Transfers, at a minimum of ten percent (10.00%) of excess fund balance, less Board approved carryovers, will be set aside in the Rainy Day Fund and/or OPEB trust fund each year until the 10.00% cap is met. Excess fund balance is defined as the difference between the actual year-end fund balance amount as determined by the Auditor-Controller, less the estimated fund balance amount included in the Adopted Budget. Board approved carryover is defined as unspent funding that was previously approved by the Board for critical programs and/or uncompleted projects.
When the Reserve cap of 10.00% is reached, the annual 10.00% of excess fund balance amount should be deposited into the OPEB trust fund to be made available for unfunded retiree health obligations. The objective is to avoid on-going commitments with funding that may not be sustainable in an economic downturn.
The County’s “Rainy-Day” fund does not meet the criteria for a stabilization arrangement for reporting the funds as either restricted or committed. As such, the Reserve for “Rainy Day” funds in the amount of $562.94 million is reported as unassigned fund balance in the General Fund.
156

COUNTY OF LOS ANGELESNOTES TO THE BASIC FINANCIAL STATEMENTS
FOR THE YEAR ENDED JUNE 30, 2019
22. SUBSEQUENT EVENTS
Tax and Revenue Anticipation Notes (TRANS)
On July 1, 2019, the County issued $700.00 million in 2019-2020 TRANS, which will mature on June 30,2020. The TRANS are collateralized by taxes and other revenues attributable to FY 2019-2020 andwere issued in the form of Fixed Rate Notes at an effective interest rate of 1.24%.
Mental Health Treatment Center (MHTC) - Termination of Design-Build Agreement
On August 13, 2019, the Board authorized the termination of the entire Design-Build Agreement withMcCarthy Building Companies, Inc. (McCarthy) for the design and construction of the MHTC which wasto replace the Men’s Central Jail. The design for the original scope of the MHTC will need to substantiallychange once ongoing analysis regarding a care-first treatment model is complete and all facts areknown for the Board to make the best decision on the right-sizing and configuration of the MHTC. Thetotal contractual commitment was for $12.94 million. As of June 30, 2019, the total capitalized costsfor the MHTC construction in progress was $41.84 million, of which $3.37 million was for the McCarthyagreement. On September 15, 2019, the County made a payment of $5.99 million. There are additionalclose out items and the final financial impact has yet to be quantified.
Public Works Financing Authority - Lease Revenue Bonds 2019 Series E-1 and E-2
On August 29, 2019, the Authority issued $251.89 million of lease revenue bonds, which includes$219.34 million (Series E-1) and $32.55 million (Series E-2), maturing from 2020 to 2049, with yieldsfrom 0.82% to 2.11%. Proceeds from the sale of the Series E-1 and Series E-2 bonds were used toredeem LRON for various capital improvement projects.
Lease Revenue Obligation Notes (LRON)
On October 23, 2019, the County redeemed $24.78 million of LRON, which included $24.38 million forthe 1060 North Vignes Lot Acquisition and $400,000 for the Music Center Plaza Refinements.
On November 5, 2019, LACCAL issued an additional $30.00 million in LRON with an interest rate of1.06%. The proceeds are being used to fund capital requirements of various capital projects. LRONissuances are supported and secured by four separate series of letters of credit and pledged Countyproperties.
COVID-19 Crisis
On March 4, 2020, the County declared a local public health emergency in response to the COVID-19pandemic. To further protect against the spread of COVID-19, the County, the State of California, andthe federal government ordered social distancing measures and temporary closures of certainbusinesses. The County is assessing the economic and budgetary impact on County revenues,including property tax and sales tax revenues. In addition, the County is working closely with the Stateand federal agencies to manage the potential increase in COVID-19 patients to our hospital system.The financial impact in future years to the County cannot be reasonably quantified with respect to theCOVID-19 crisis at this time.
157

CO
UN
TY O
F LO
S A
NG
ELE
SR
EQ
UIR
ED
SU
PP
LEM
EN
TAR
Y IN
FOR
MAT
ION
(U
naud
ited)
Los
Ang
eles
Cou
nty
Em
ploy
ees
Ret
irem
ent A
ssoc
iatio
n S
ched
ule
of th
e C
ount
y's
Pro
porti
onat
e S
hare
of t
he N
et P
ensi
on L
iabi
lity
and
Rel
ated
Rat
ios
Last
10
Fisc
al Y
ears
1,2
(Dol
lar a
mou
nts
in th
ousa
nds)
6/30
/201
86/
30/2
017
6/30
/201
66/
30/2
015
6/30
/201
4P
ensi
on P
lan’
s fid
ucia
ry n
et p
ositi
on a
s pe
rcen
tage
of t
otal
pe
nsio
n lia
bilit
y83
.960
%82
.370
%81
.749
%86
.296
%86
.804
%
Cou
nty’
s pr
opor
tiona
te s
hare
of t
he c
olle
ctiv
e ne
t pen
sion
lia
bilit
y$1
0,34
5,20
9$1
0,84
9,93
1$1
0,27
2,67
1$
7,44
8,37
4$
6,95
7,08
2
Cou
nty’
s pr
opor
tion
as p
erce
ntag
e of
the
colle
ctiv
e ne
t pe
nsio
n lia
bilit
y96
.169
%96
.119
%96
.170
%96
.081
%95
.897
%
Cov
ered
pay
roll
$7,
631,
381
$7,
320,
575
$6,
986,
004
$6,
948,
738
$6,
672,
228
Cou
nty’
s pr
opor
tiona
te s
hare
of t
he c
olle
ctiv
e ne
t pen
sion
lia
bilit
y as
a p
erce
ntag
e of
its
cove
red
payr
oll
135.
561%
148.
211%
147.
046%
107.
190%
104.
269%
Sch
edul
e of
Cou
nty’
s P
ensi
on C
ontri
butio
nsLa
st 1
0 Fi
scal
Yea
rs1,
3
(Dol
lar a
mou
nts
in th
ousa
nds)
2019
2018
2017
2016
2015
Act
uaria
lly D
eter
min
ed C
ontri
butio
n (A
DC
)$
1,60
5,15
0$
1,46
6,41
1$
1,30
0,71
1$
1,38
9,62
8$
1,43
7,55
5Le
ss: C
ontri
butio
ns in
rela
tion
to th
e A
DC
1,60
5,15
01,
466,
411
1,30
0,71
11,
389,
628
1,43
7,55
5C
ontri
butio
n D
efic
ienc
y (e
xces
s)$
0$
0$
0$
0$
0
Cov
ered
pay
roll
$8,
031,
454
$7,
631,
381
$7,
320,
575
$6,
986,
004
$6,
948,
738
Con
tribu
tions
as
a pe
rcen
tage
of t
otal
cov
ered
pay
roll
19.9
86%
19.2
16%
17.7
68%
19.8
92%
20.6
88%
(1)
His
toric
al in
form
atio
n is
requ
ired
only
for m
easu
rem
ent p
erio
ds fo
r whi
ch G
AS
B 6
8 is
app
licab
le.
Eve
ntua
lly, 1
0 ye
ars
of d
ata
will
be
show
n.(2
)R
efle
cts
data
as
of th
e m
easu
rem
ent d
ate.
(3)
Ref
lect
s da
ta a
s of
the
repo
rting
dat
e.
158

COUNTY OF LOS ANGELESREQUIRED SUPPLEMENTARY INFORMATION
(Unaudited)
Los Angeles County Employees Retirement AssociationNotes to Required Supplementary Information
Changes of benefit terms
There were no plan changes after June 30, 2013.
Changes of assumptions
There were no changes of assumptions used to determine the Total Pension Liability.
There were no changes of assumptions in determining the ADC since FY 2014-2015.
159

COUNTY OF LOS ANGELESREQUIRED SUPPLEMENTARY INFORMATION
(Unaudited)
Los Angeles County Employees Retirement AssociationSchedule of the County's Proportionate Share of the Net RHC OPEB Liability
Last 10 Fiscal Years1,2
(Dollar amounts in thousands)
6/30/2018 6/30/2017County's proportion as a percentage of the collective net OPEB liability 95.392% 95.391%
County's proportionate share of the collective net OPEB liability $ 23,590,686 $ 25,249,103
Covered-employee payroll $ 8,571,345 $ 8,176,831
County's proportionate share of the collective net OPEB liability as apercentage of its covered-employee payroll 275.227% 308.788%
Plan fiduciary net position as a percentage of the total OPEB liability 3.670% 2.730%
Schedule of County's RHC OPEB ContributionsLast 10 Fiscal Years1,3
(Dollar amounts in thousands)
2019 2018Actuarially Determined Contribution (ADC) $ 1,549,500 $ 1,901,000Less: Contributions in relation to the ADC 787,366 679,872Contribution Deficiency (excess) $ 762,134 $ 1,221,128
Covered-employee payroll $ 9,071,329 $ 8,571,345
Contributions as a percentage of total covered-employee payroll 8.680% 6.523%
(1) Historical information is required only for measurement periods for which GASB 75 is applicable.Eventually, 10 years of data will be shown.
(2) Reflects data as of the measurement date.(3) Reflects data as of the reporting date.
160

COUNTY OF LOS ANGELESREQUIRED SUPPLEMENTARY INFORMATION
(Unaudited)
Los Angeles County Employees Retirement AssociationNotes to Required Supplementary Information
Changes of benefit terms
None
Changes of assumptions
The Discount rate increased from 4.69% as of June 30, 2017 to 5.11% as of June 30, 2018.
The Investment rate of return decreased from 6.66% as of June 30, 2017 to 6.30% as of June 30, 2018.
161

COUNTY OF LOS ANGELESREQUIRED SUPPLEMENTARY INFORMATION
(Unaudited)Schedule of Changes in the Total LTD OPEB Liability and Related Ratios
Last 10 Fiscal Years1
(Dollar amounts in thousands)
6/30/2018 6/30/2017Total OPEB Liability
Service cost $ 43,162 $ 49,068Interest 38,818 33,546Changes of benefit termsDifferences between expected and actual experience 1,111 589Changes of assumptions or other inputs (43,574) (106,200)Benefit payments (64,313) (63,430)Net Change in Total OPEB Liability (24,796) (86,427)
Total LTD OPEB Liability - beginning 1,073,040 1,159,467Total LTD OPEB Liability - ending $ 1,048,244 $ 1,073,040
Covered-employee payroll $ 9,071,329 $ 8,571,345
Total LTD OPEB Liability as a percentage of covered-employee payroll 11.556% 12.519%
Notes to schedule:Changes of benefit terms: No changes to benefit terms
Changes of assumptions:Changes of Assumptions and other inputs reflect the effects of changes in the discountrate each period. The following are the discount rates used in each period:
As of June 30, 2017 3.58%As of June 30, 2018 3.87%
(1) Historical information is required only for measurement periods for which GASB 75 is applicable.Eventually, 10 years of data will be shown.
162

COUNTY OF LOS ANGELESREQUIRED SUPPLEMENTARY INFORMATION
(Unaudited)Total LTD OPEB Liability
Notes to Required Supplementary Information
Changes of benefit terms
None
Changes of assumptions
The Discount rate increased from 3.58% as of June 30, 2018 to 3.87% as of June 30, 2019.
No assets are accumulated in a trust that meets the criteria in GASB 75, paragraph 4 to pay related benefits.
163

164

SINGLE AUDIT REPORT

COUNTY OF LOS ANGELESSCHEDULE OF EXPENDITURES OF FEDERAL AWARDS
FOR THE YEAR ENDED JUNE 30, 2019
Federal Grantor/Pass-Through Grantor/Program TitlePass-Through Entity ID No.
(Note A) Federal
Expenditures
Passed Through to
Subrecipients
U.S. Agency for International Development Direct Program
USAID Foreign Assistance for Programs OverseasInternational Search and Rescue Operations AID-OFDA-A-15-00014 98.001 1,633,406$ -$
Total U.S. Agency for International Development 1,633,406 -
U.S. Department of Agriculture Direct Program
USDA Forest Service Angeles National Forest 10.680 82,770 -
Passed Through the California Department of Aging State Administrative Matching Grants for the Supplemental Nutrition Program
Supplemental Nutrition Assistance Program - Education (SNAP-Ed) 10.561 (1) (15) SP1718-19 18,028 11,993 Supplemental Nutrition Assistance Program - Education (SNAP-Ed) 10.561 (1) (15) SP1819-19 184,937 148,443
Subtotal 10.561 202,965 160,436
Passed Through the California Department of Education Child and Adult Care Food Program 10.558 174,381 -
Summer Food Service Program for Children 10.559 (2) 197CACA3N1099 22,092 - Summer Food Service Program for Children 10.559 (2) 437,176 -
Subtotal 10.559 459,268 -
Passed Through the California Department of Food and AgriculturePlant and Animal Disease, Pest Control, and Animal Care (Note 3)
Pest Exclusion/Dog Teams Program (Note 3) 10.025 597,303 - Glassy Winged Sharpshooter (GWSS) (Note 3) 10.025 1,659,128 - Sudden Oak Death (SOD) Program 10.025 6,769 -
Subtotal 10.025 2,263,200 -
Senior Farmers Market Nutrition ProgramSenior Farmers Market Program 10.576 84,914 -
Passed Through the California Department of Public HealthState Administrative Matching Grants for the Supplemental Nutrition Assistance Program
Supplemental Nutrition Assistance Program - Education (SNAP-Ed) 10.561 (1) (15) 16-10148 14,146,527 7,744,093
Passed Through the California Department of Social ServicesState Administrative Matching Grants for the Supplemental Nutrition Assistance Program
Supplemental Nutrition Assistance Program (SNAP) - Administration (CalFresh) 10.561 (1) (15) 253,438,691 5,080,752 Subtotal 10.561 267,585,218 12,824,845
Passed Through the California State Controller's OfficeSchools and Roads - Grants to States
U.S. Forest Service 10.665 (3) 736,222 - Total U.S. Department of Agriculture 271,588,938 12,985,281
U.S. Department of DefenseDirect Program
Procurement Technical Assistance for Business FirmsProcurement Technical Assistance 12.002 215,445 - Total U.S. Department of Defense 215,445 -
U.S. Department of EducationDirect Program
Federal Supplemental Educational Opportunity GrantsSupplemental Educational Opportunity Grants 84.007 (14) 11,607 -
Federal Pell Grant ProgramPell Grants 84.063 (14) 322,506 -
Subtotal Student Financial Assistance Cluster (84.007, 84.063) 334,113 - Total U.S. Department of Education 334,113 -
U.S. Department of Health and Human ServicesDirect Program
Public Health Emergency Preparedness 93.069 19,741,008 1,085,278 Birth Defects and Developmental Disabilities - Prevention and Surveillance
Surveillance, Intervention, and Referral to Services Activities for Infants with Microcephaly or Other Adverse Outcomes Linked with the Zika Virus High-Risk Local Areas 93.073 263,596 -
Sodium Reduction in CommunitiesLos Angeles County Sodium Reduction Initiative (LACSRI) 93.082 490,798 88,516
Catalog of Federal Domestic
Assistance Number (CFDA#)
See legend on page 174 for CFDA No. Cluster Summary and Notes A and B.See accompanying Notes to Schedule of Expenditures of Federal Awards.
165 (Continued)

COUNTY OF LOS ANGELESSCHEDULE OF EXPENDITURES OF FEDERAL AWARDS
FOR THE YEAR ENDED JUNE 30, 2019
Federal Grantor/Pass-Through Grantor/Program TitlePass-Through Entity ID No.
(Note A) Federal
Expenditures
Passed Through to
Subrecipients
Catalog of Federal Domestic
Assistance Number (CFDA#)
Project Grants and Cooperative Agreements for Tuberculosis Control ProgramsTuberculosis/Centers for Disease Control Cooperative Agreement 93.116 4,681,242$ -$
Substance Abuse and Mental Health Services Projects of Regional and National Significance
First Responders-Comprehensive Addiction and Recovery Act 17 (1H79SP080293-01) 93.243 478,680 - Epidemiology and Laboratory Capacity for Infectious Diseases (ELC)
ELC - Building and Strengthening Epidemy 93.323 4,016,721 - Nurse Education, Practice, Quality, and Retention Grants
Nurse Education, Practice, Quality, and Retention Project 93.359 114,656 - Innovative State and Local Public Health Strategies to Prevent and Manage Diabetes and Heart Disease and Stroke
Chronic Disease Prevention and Management Strategy: Innovation Solutions for Healthier Communities (SHC) 93.435 811,143 -
The Affordable Care Act: Building Epidemiology, Laboratory, and Health Information Systems Capacity in the Epidemiology and Laboratory Capacity for Infectious Disease (ELC) and Emerging Infections Programs (EIP) Cooperative Agreements; PPHF
ELC - Building and Strengthening Epidemy 93.521 55,143 - State and Local Public Health Actions to Prevent Obesity, Diabetes, Heart Disease and Stroke (PPHF)
Chronic Disease Prevention Strategy in Los Angeles 93.757 1,489,663 86,111 Domestic Ebola Supplement to the Epidemiology and Laboratory Capacity for Infectious Diseases (ELC)
ELC - Building and Strengthening Epidemy 93.815 464,537 - Hospital Preparedness Program (HPP) Ebola Preparedness and Response Activities
HPP Ebola Preparedness and Response Activities 93.817 220,000 - National Bioterrorism Hospital Preparedness Program
Bioterrorism Hospital Preparedness Program 93.889 8,709,348 5,723,417
HIV Emergency Relief Project GrantsHIV Emergency Relief Project Grant 93.914 42,953,770 27,135,095 Minority Aids Initiative (MAI) 93.914 5,088,030 3,603,229
Subtotal 93.914 48,041,800 30,738,324
HIV Prevention Activities - Health Department BasedImplementation of Prep and Linkage and Re-Engagement to HIV Medical Services 93.940 10,124 10,124 Integrated HIV Surveillance and Prevention for Los Angeles County 93.940 16,656,236 7,751,485
Subtotal 93.940 16,666,360 7,761,609
Human Immunodeficiency Virus (HIV)/Acquired Immunodeficiency Virus Syndrome (AIDS) Surveillance
Medical Monitoring Project (MMP) 93.944 712,435 - Behavioral Surveillance Study of HIV Risk and Prevention Behaviors Among At-Risk Populations in Los Angeles 93.944 711,813 -
Subtotal 93.944 1,424,248 -
Sexually Transmitted Diseases (STD) Prevention and Control GrantsLos Angeles County STD Programs Through Assessment, Assurance, Policy Development, and Prevention Strategies 93.977 (20) 2,013,178 536,629 CDC Strengthening STD Prevention and Control for Health Departments (STD PCHD) 93.977 (20) 1,453,100 30,424
Subtotal 93.977 3,466,278 567,053
Passed Through the California Family Health CouncilFamily Planning Services
Family Planning 93.217 583,195 -
Passed Through the University of Southern CaliforniaTeenage Pregnancy Prevention Program 93.297 64750337 376,722 -
Passed Through the California Department of AgingSpecial Programs for the Aging - Title VII, Chapter 3 - Programs for Prevention of Elder Abuse, Neglect, and Exploitation
Title VII - Elder Abuse Prevention 93.041 (9) AP-1819-19 85,269 85,269 Special Programs for the Aging - Title VII, Chapter 2 - Long-Term Care Ombudsman Services for Older Individuals
Title VII - Ombudsman 93.042 (9) AP-1819-19 127,791 127,791 Special Programs for the Aging - Title III, Part D - Disease Prevention and Health Promotion Services
Area Agency on Aging III D 93.043 (9) AP-1819-19 551,555 551,555 Special Programs for the Aging - Title III, Part B - Grants for Supportive Services and Senior Centers
Area Agency on Aging III B 93.044 (9) AP-1819-19 6,788,335 3,348,220
See legend on page 174 for CFDA No. Cluster Summary and Notes A and B.See accompanying Notes to Schedule of Expenditures of Federal Awards.
166 (Continued)

COUNTY OF LOS ANGELESSCHEDULE OF EXPENDITURES OF FEDERAL AWARDS
FOR THE YEAR ENDED JUNE 30, 2019
Federal Grantor/Pass-Through Grantor/Program TitlePass-Through Entity ID No.
(Note A) Federal
Expenditures
Passed Through to
Subrecipients
Catalog of Federal Domestic
Assistance Number (CFDA#)
Special Programs for the Aging - Title III, Part C - Nutrition ServicesArea Agency on Aging III C-I 93.045 (9) AP-1819-19 6,923,508$ 6,295,223$ Area Agency on Aging III C-II 93.045 (9) AP-1819-19 5,439,563 4,942,109
Subtotal 93.045 12,363,071 11,237,332
National Family Caregiver Support, Title III, Part EArea Agency on Aging Title III E 93.052 (9) AP-1819-19 3,029,604 1,802,618
Nutrition Services Incentive ProgramArea Agency on Aging III USDA C-I 93.053 (9) AP-1819-19 951,194 951,194 Area Agency on Aging III USDA C-II 93.053 (9) AP-1819-19 748,177 748,177
Subtotal 93.053 1,699,371 1,699,371
Medical Enrollment Assistance ProgramMedicare Improvements for Patients and Providers Act 93.071 MI1718-19 2,968 - Medicare Improvements for Patients and Providers Act 93.071 MI1819-19 114,201 108,034
Subtotal 93.071 117,169 108,034
State Health Insurance Assistance Program
Area Agency on Aging - Health Insurance Counseling and Advocacy Program (HICAP)H9 93.324 HI-1819-19 205,125 187,055 Area Agency on Aging - Health Insurance Counseling and Advocacy Program (HICAP)H3 93.324 HI-1819-19 77,271 63,495
Subtotal 93.324 282,396 250,550
Affordable Care Act State Health Insurance Assistance Program (SHIP) and Aging and Disability Resource Center (ADRC) Options Counseling for Medicare-Medicaid Individuals in States with Approved Financial Alignment Models
Financial Alignment 93.626 FA1718-19 63,660 60,509
Passed Through the California Department of Child Support ServicesChild Support Enforcement
Child Support Enforcement Title IV-D 93.563 C8-C191009-R2 118,669,742 -
Passed Through the California Department of Community Services and DevelopmentCommunity Services Block Grant
Community Services Block Grant (Note 4) 93.569 18F-5021 5,524,319 3,986,250 Community Services Block Grant (Note 4) 93.569 19F-4021 844,238 248,000 Community Services Block Grant (Note 4) 93.569 18F-5105 192,815 156,683 Community Services Block Discretionary Grant (Note 4) 93.569 18F-5105 33,203 15,000 Community Services Block Grant (Note 4) 93.569 19F-4105 122,779 114,465
Subtotal 93.569 6,717,354 4,520,398
Passed Through the California Department of EducationChild Care and Development Block Grant
Child Care Salary Retention Incentive Program 93.575 (12) 2,987,253 - Local Child Care Planning and Development Council (LCCPDC) 93.575 (12) 183,784 - Child Care and Development Block Grant 93.575 (12) CAPP8026 2,164,659 -
Subtotal 93.575 5,335,696 -
Child Care Mandatory and Matching Funds of the Child Care and Development FundChild Day Care Program 93.596 (12) CAPP8026 9,611,880 -
Passed Through the California Department of Health Care ServicesComprehensive Community Mental Health Services for Children with Serious Emotional Disturbances (SED)
Project ABC South Los Angeles 93.104 1,120,415 944,306 Projects for Assistance in Transition from Homelessness (PATH)
McKinney Homeless Act Program 93.150 2,427,876 104,744 Substance Abuse and Mental Health Services Projects of Regional and National Significance
SAMHSA STR to the Opioid Crisis Grant - Bridge Program 93.243 18-95423 5,000 -
Medical Assistance ProgramMedi-Cal Eligibility Determination 93.778 (13) (19) 309,045,662 - Medi-Cal Administrative Activities (MAA) 93.778 (13) (19) 17-94017 26,568,350 1,215,101 Federal Drug Medi-Cal (Prenatal and Drug) FMAP 93.778 (13) (19) 17-94199 11,115,948 - Health Care Program Children in Foster Care 93.778 (13) (19) 11,214,743 - Child Health and Disability Program 93.778 (13) (19) 5,742,946 -
Subtotal 93.778 363,687,649 1,215,101
See legend on page 174 for CFDA No. Cluster Summary and Notes A and B.See accompanying Notes to Schedule of Expenditures of Federal Awards.
167 (Continued)

COUNTY OF LOS ANGELESSCHEDULE OF EXPENDITURES OF FEDERAL AWARDS
FOR THE YEAR ENDED JUNE 30, 2019
Federal Grantor/Pass-Through Grantor/Program TitlePass-Through Entity ID No.
(Note A) Federal
Expenditures
Passed Through to
Subrecipients
Catalog of Federal Domestic
Assistance Number (CFDA#)
Opioid STRSAMHSA STR Opioid Crisis Grant - MAT 93.788 18-95362 685$ -$
Block Grants for Community Mental Health ServicesMental Health Services: Block Grant 93.958 21,595,886 2,207,353
Block Grants for Prevention and Treatment of Substance AbuseAlcohol Block Grant 93.959 17-94136 21,023,002 14,289,760 Substance Abuse Prevention and Treatment Set-Aside 93.959 17-94136 18,814,505 17,537,430 Substance Abuse Prevention and Treatment Block Grant Adolescent Treatment 93.959 17-94136 845,316 845,316 Drug-Free Schools and Communities - Friday Night Live 93.959 17-94136 75,000 75,000 Drug-Free Schools and Communities - Club Live 93.959 17-94136 75,000 75,000 New Prenatal Set-Aside 93.959 17-94136 120,643 120,643
Subtotal 93.959 40,953,466 32,943,149
Passed Through the California Department of Public HealthInjury Prevention and Control Research and State and Community-Based Programs
National Violent Death Reporting System (NVDRS) 93.136 17-10598 53,830 - Immunization Cooperative Agreements
Vaccine Preventable Disease Control 93.268 17-10326 5,546,960 - Refugee and Entrant Assistance - State/Replacement Designee Administered Programs
Refugee Health Assessment Program 93.566 (18) 18-19-90899-00 187,000 - Refugee and Entrant Assistance - Discretionary Grants
Refugee Health Promotion Project (RHPP) 93.576 18-19-90893-00 51,001 - State Survey and Certification of Health Care Providers and Suppliers (Title XVIII) Medicare
Health Facilities Inspection 93.777 (13) 15-10003 18,411,633 - Maternal, Infant, and Early Childhood Home Visiting Grant Program
Title V Maternal, Infant, and Early Childhood Home Visiting Program 93.870 (10) 15-10161, 15-10162 1,440,670 1,440,670 HIV Care Formula Grants
HIV Care Program 93.917 5,073,788 4,564,131 Sexually Transmitted Diseases (STD) Prevention and Control Grants
STD Surveillance Network (SSUN) 93.977 (20) 18-10275 81,997 - Maternal and Child Health Services Block Grant to the States
Maternal and Child Health 93.994 201819 3,705,720 50,873
Passed Through the California Department of Social ServicesGuardianship Assistance
Kinship Guardianship Assistance Payment Program (Kin-GAP) Title IV-E 93.090 CFL 16/17-69, 14/15-40, 11/12-18 26,014,478 - Promoting Safe and Stable Families
Promoting Safe and Stable Families Program (PSSF) 93.556 CFL 18/19-34 & 18/19-36 8,461,642 5,504,902
Temporary Assistance for Needy Families (TANF)CalWORKs Single 93.558 (11) 410,399,525 115,103,303 CalWORKs - Family Group/Unemployed Parent (FG/U) Assistance 93.558 (11) 102,358,377 - Temporary Assistance for Needy Families 93.558 (11) CFL 18/19-20 88,605,848 11,272,975 CalWORKs Fraud Incentives 93.558 (11) 1,903,546 - CalWORKs Legal Immigrants (MC) 93.558 (11) 1,593,767 - CalWORKs Diversion - Federal 93.558 (11) 3,088 -
Subtotal 93.558 604,864,151 126,376,278
Refugee and Entrant Assistance State/Replacement Designee Administered ProgramsRefugee Resettlement 93.566 (18) 1,667,472 - Refugee Employment Social Services 93.566 (18) 806,998 472,660 Services to Older Refugees 93.566 (18) 66,995 55,902
Subtotal 93.566 2,541,465 528,562
U.S. RepatriationU.S. Repatriation Program 93.579 8,112 -
Refugee and Entrant Assistance Targeted Assistance GrantsRefugee Targeted Assistance Program 93.584 894,736 789,460
Community-Based Child Abuse Prevention 93.590 ACIN I-10-19 283,003 - Adoptions and Legal Guardianship Incentive Payments 93.603 CFL 18/19-66 72 - Stephanie Tubbs Jones Child Welfare Services Program
Children's Welfare Services IV-B (Direct Cost) 93.645 CFL 18/19-20 7,500,322 -
See legend on page 174 for CFDA No. Cluster Summary and Notes A and B.See accompanying Notes to Schedule of Expenditures of Federal Awards.
168 (Continued)

COUNTY OF LOS ANGELESSCHEDULE OF EXPENDITURES OF FEDERAL AWARDS
FOR THE YEAR ENDED JUNE 30, 2019
Federal Grantor/Pass-Through Grantor/Program TitlePass-Through Entity ID No.
(Note A) Federal
Expenditures
Passed Through to
Subrecipients
Catalog of Federal Domestic
Assistance Number (CFDA#)
Foster Care - Title IV-EAid to Families with Dependent Children - FC - Administration and Assistance 93.658 CFL 18/19-41 177,317,743$ 112,455,503$ Foster Care Title IV-E 93.658 CFL 18/19-41 & CFL 18/19-20 327,869,341 7,387,192 Foster Care Title IV-E 93.658 CFL 18/19-05 42,482,774 - Foster Parent Training 93.658 CFL 18/19-41 79,152 - Group Home Month Visits / CWD 93.658 CFL 18/19-41 32,441,217 - Child Welfare Services Outcome Improvement Project (Cohort 1) 93.658 CFL 18/19-41 1,200,266 -
Subtotal 93.658 581,390,493 119,842,695
Adoption AssistanceAdoptions - Administration and Assistance 93.659 CFL 16/17-69, 14/15-40, 11/12-18 148,115,566 -
Social Services Block GrantChildren's Welfare Services Title XX 93.667 CFL 18/19-20 40,137,009 -
John H. Chafee Foster Care Program for Successful Transition to AdulthoodIndependent Living Skills - Children's Services 93.674 CFL 18/19-28 5,766,632 3,336,420
Medical Assistance ProgramChildren's Welfare Services XIX (Health-Related) 93.778 (13) (19) CFL 16/17-69, 14/15-40, 11/12-18 57,092,766 - In-Home Supportive Services - Personal Care Services Program (Health-Related) 93.778 (13) (19) 94,911,894 - Adult Protective Services/County Services Block Grant 93.778 (13) (19) 31,518,054 -
Subtotal 93.778 183,522,714 - Total U.S. Department of Health and Human Services 2,351,382,002 369,690,599
U.S. Department of Homeland SecurityDirect Program
National Urban Search and Rescue (US&R) Response SystemUrban Search and Rescue 2013 97.025 526,109 - Urban Search and Rescue 2014 97.025 77,623 - Urban Search and Rescue 2015 97.025 89,940 - Urban Search and Rescue 2016 97.025 259,185 - Urban Search and Rescue 2017 97.025 345,436 - Urban Search and Rescue 2018 97.025 294,251 -
Subtotal 97.025 1,592,544 -
Assistance to Firefighters Grant2016 Assistance to Firefighter Grant (16 AFG) 97.044 4,599 -
Port Security Grant ProgramPort Security Grant Program 15 97.056 981 - Port Security Grant Program 17 97.056 304,979 -
Subtotal 97.056 305,960 -
Passed Through the City of Los AngelesSecuring the Cities Program 97.106 C-125911 76,199 - Securing the Cities Program 97.106 C-125298 35,211 -
Subtotal 97.106 111,410 -
Passed Through the United WayEmergency Food and Shelter National Board Program
Emergency Food and Shelter Program - Phase 35 97.024 069500-009 13,026 -
Passed Through the California Department of Parks and RecreationBoating Safety Financial Assistance
Recreational Boating Safety Program 97.012 C1770602 90,722 -
Passed Through the California Office of Emergency ServicesBoating Safety Financial Assistance
Law Enforcement Equipment Grant Program 97.012 C17L0610 66,455 - Subtotal 97.012 157,177 -
Emergency Management Performance Grants2017 Emergency Management Performance Grant 97.042 2017-0007 262,899 27,821 2018 Emergency Management Performance Grant 97.042 2018-0008 2,173,209 1,428,549
Subtotal 97.042 2,436,108 1,456,370
See legend on page 174 for CFDA No. Cluster Summary and Notes A and B.See accompanying Notes to Schedule of Expenditures of Federal Awards.
169 (Continued)

COUNTY OF LOS ANGELESSCHEDULE OF EXPENDITURES OF FEDERAL AWARDS
FOR THE YEAR ENDED JUNE 30, 2019
Federal Grantor/Pass-Through Grantor/Program TitlePass-Through Entity ID No.
(Note A) Federal
Expenditures
Passed Through to
Subrecipients
Catalog of Federal Domestic
Assistance Number (CFDA#)
Passed Through the California Office of Emergency ServicesHomeland Security Grant Program
State Homeland Security Program 15 97.067 2015-0078 735,183$ -$ State Homeland Security Program 16 97.067 2016-0102 11,906,809 5,369,150 State Homeland Security Program 17 97.067 2017-0083 594,314 35,595
Passed Through the California Office of Emergency Services/City of Los AngelesHomeland Security Grant Program
Urban Area Security Initiative 16 97.067 C-129936 6,876,215 - Urban Area Security Initiative 17 97.067 C-131830 2,798,562 -
Passed Through the California Office of Emergency Services/County of San DiegoHomeland Security Grant Program
Operation Stonegarden Grant Program (OPSG) 17 97.067 449,975 - Subtotal 97.067 23,361,058 5,404,745
Total U.S. Department of Homeland Security 27,981,882 6,861,115
U.S. Department of Housing and Urban DevelopmentDirect Program
Lead Hazard Reduction Demonstration Grant Program 14.905 712,119 -
Passed Through the Los Angeles County Development AuthorityContinuum of Care Program
Tenant-Based Rental Assistance (TBRA) Program/Shelter Plus Care 14.267 178,189 -
Community Development Block Grants/Entitlement GrantsAdventure Park Recreation Program 14.218 (4) 63,464 - ALPR Mobile Cameras - East LA 14.218 (4) 601929-17 44,160 - ALPR Stationary Cameras - East LA 14.218 (4) 601907-17 91,948 - Amigo Park Mobile Recreation Program 14.218 (4) 22,717 - Bike Patrol Pilot Program - Whittier Blvd 14.218 (4) 601937-17 60,000 - Burke's Club Drug Prevention and Gang Intervention 14.218 (4) 135,975 - Century Station Code Enforcement Project 14.218 (4) 200,000 - Community Code Enforcement - 4 th District 14.218 (4) 600727-18 35,000 - Community Code Enforcement East Los Angeles - 1 st District 14.218 (4) 601956-18 188,250 - Community Development Block Grant 14.218 (4) 85,949 - Enhanced Patrol Walnut Park - Century Station 14.218 (4) 601938-17 60,000 - Equestrian Patrol Pilot Program - Industry Station 14.218 (4) 601936-17 117,303 - Homeowners Fraud Prevention Program 14.218 (4) F96227-18 21,284 - Loma Alta Park Recreation Program 14.218 (4) 37,340 - Pamela Park Recreation Program 14.218 (4) 26,468 - Pathfinder Senior Recreation Program 14.218 (4) 19,911 - Pearblossom Park Recreation Program 14.218 (4) 38,529 - Project Star (La Puente/Graham Library) 14.218 (4) 601638-17 30,000 - Project Star (Studying, Tutoring, and Reading) 14.218 (4) F96125-17 90,000 - Rimgrove Park Recreation Program 14.218 (4) 14,853 - Rowland Heights Youth Athletic League Program - Carolyn Rosas Park 14.218 (4) 49,997 - Salazar Park Recreation Program 14.218 (4) 29,728 - Saybrook Park Recreation Program 14.218 (4) 37,467 - Security Cameras at Ruben Salazar Park 14.218 (4) 92,152 - Unincorporated Areas Small Business Initiative 14.218 (4) 601827-18 105,935 - Valleydale Park After-School Program 14.218 (4) 25,000 -
Subtotal 14.218 1,723,430 - Total U.S. Department of Housing and Urban Development 2,613,738 -
U.S. Department of JusticeDirect Program
Services for Trafficking VictimsLos Angeles County Human Trafficking Task Force (LACHTTF) 15 16.320 199,357 89,583 Enhanced Collaborative Model to Combat Human Trafficking 18 16.320 43,085 -
Subtotal 16.320 242,442 89,583
State Criminal Alien Assistance ProgramState Criminal Alien Assistance Program (SCAAP) 16.606 2,120,590 -
Public Safety Partnership and Community Policing Grants
Community Policing Development Program (CPD) - Innovative Officer Accountability Model 16.710 9,748 -
See legend on page 174 for CFDA No. Cluster Summary and Notes A and B.See accompanying Notes to Schedule of Expenditures of Federal Awards.
170 (Continued)

COUNTY OF LOS ANGELESSCHEDULE OF EXPENDITURES OF FEDERAL AWARDS
FOR THE YEAR ENDED JUNE 30, 2019
Federal Grantor/Pass-Through Grantor/Program TitlePass-Through Entity ID No.
(Note A) Federal
Expenditures
Passed Through to
Subrecipients
Catalog of Federal Domestic
Assistance Number (CFDA#)
DNA Backlog Reduction ProgramDNA Capacity Enhancement and Backlog Reduction Program 16 16.741 149,210$ -$ DNA Capacity Enhancement and Backlog Reduction Program 17 16.741 520,916 - DNA Capacity Enhancement and Backlog Reduction Program 18 16.741 373,071 -
Subtotal 16.741 1,043,197 -
Economic, High-Tech, and Cybercrime PreventionCounterfeit and Piracy Enforcement (CAPE) Team 16 16.752 31,502 - Intellectual Property Enforcement Program - Counterfeit 18 (CAPE) 16.752 65,266 -
Subtotal 16.752 96,768 -
Comprehensive Opioid Abuse Site-Based Program 16.838 60,000 -
Equitable Sharing ProgramAsset Seizure and Forfeiture 16.922 2,269,383 - Domestic Cannabis Eradication Suppression Program 18 16.922 129,642 -
Subtotal 16.922 2,399,025 -
Passed Through the City of Los AngelesEconomic, High-Tech, and Cybercrime Prevention
Intellectual Property Enforcement Program 17 (IPE) 16.752 107,025 -
Edward Byrne Memorial Justice Assistance Grant ProgramAlternate Sentencing Program (APD) (JAG) 15 16.738 JAG 2015-DJ-BX-0302 101,431 - Centinela Youth Services - Every Child Restorative Justice (JAG) 15 16.738 JAG 2015-DJ-BX-0302 32,954 - Toberman Grace (JAG) 15 16.738 JAG 2015-DJ-BX-0302 72,262 - New Earth - Dream Space Library and Flow Program (JAG) 15 16.738 JAG 2015-DJ-BX-0302 14,307 - Patrol Services Overtime (JAG) 15 16.738 JAG 2015-DJ-BX-0302 27,930 - Spirit Awakening Foundation (JAG) 15 16.738 JAG 2015-DJ-BX-0302 48,907 - School Resource Deputy (JAG) 15 16.738 JAG 2015-DJ-BX-0302 6,166 - Southern California Crossroads (JAG) 15 16.738 JAG 2015-DJ-BX-0302 21,575 - Alternate Sentencing Program (PD) (JAG) 16 16.738 JAG 2016-DJ-BX-0246 347,713 - School Resource Deputy/Rosemont Middle School (Sheriff) (JAG) 16 16.738 JAG 2016-DJ-BX-0246 17,699 - Sheriff Youth Activities League (JAG) 16 16.738 JAG 2016-DJ-BX-0246 37,168 - JAG City Clear Foothill 16.738 2017-DJ-BX-0337 43,377 - JAG City Clear Various Sites 16.738 2017-DJ-BX-0337 347,019 - JAG City Clear 16.738 2017-DJ-BX-0337 251,292 -
Subtotal 16.738 1,369,800 -
Passed Through the California Office of Emergency ServicesCrime Victim Assistance
Victim Witness Assistance Program 16.575 037-00000 6,439,133 1,193,628 Underserved Victim Advocacy and Outreach Program 16.575 037-00000 198,019 - Human Trafficking Advocacy Program 16.575 037-00000 129,426 - County Victim Services Program 16.575 037-00000 2,558,955 2,381,489 Elder Abuse Program 16.575 037-00000 83,290 -
Subtotal 16.575 9,408,823 3,575,117
Paul Coverdell Forensic Sciences Improvement Grant ProgramPaul Coverdell Forensic 16.742 CQ17 07 0190 20,299 - Paul Coverdell Forensic 16.742 CQ18 08 0190 21,010 - Coverdell Forensic Sciences Improvement Act Program 17 16.742 037-00000 72,967 -
Subtotal 16.742 114,276 - Total U.S. Department of Justice 16,971,694 3,664,700
U.S. Department of LaborPassed Through the California Department of Aging
Senior Community Service Employment ProgramOlder American Title V Project 17.235 TV-1819-19 1,244,740 1,115,780
Passed Through the California Employment Development DepartmentWorkforce Innovation and Opportunity Act (WIOA) Adult Program
WIOA Adult 17.258 (5) K8106640 1,725,331 1,725,331 WIOA Adult 17.258 (5) K9110017 9,568,882 6,670,801 1129 Slingshot Construction Pre-Apprenticeship Pipeline 17.258 (5) K8106640 54,225 31,580
Subtotal 17.258 11,348,438 8,427,712
See legend on page 174 for CFDA No. Cluster Summary and Notes A and B.See accompanying Notes to Schedule of Expenditures of Federal Awards.
171 (Continued)

COUNTY OF LOS ANGELESSCHEDULE OF EXPENDITURES OF FEDERAL AWARDS
FOR THE YEAR ENDED JUNE 30, 2019
Federal Grantor/Pass-Through Grantor/Program TitlePass-Through Entity ID No.
(Note A) Federal
Expenditures
Passed Through to
Subrecipients
Catalog of Federal Domestic
Assistance Number (CFDA#)
WIOA Youth ActivitiesWIOA Youth 17.259 (5) K8106640 7,009,714$ 7,009,714$ WIOA Youth 17.259 (5) K9110017 3,278,968 417,131
Subtotal 17.259 10,288,682 7,426,845
WIOA National Dislocated Worker Grants/WIA National Emergency Grants1140 2018 CA Megafires NDWG - Workforce Development 17.277 K9110017 288,056 247,639
WIOA Dislocated Worker Formula GrantsWIOA Dislocated Worker 17.278 (5) K8106640 1,638,390 1,638,390 WIOA Rapid Response 17.278 (5) K8106640 569,451 569,451 WIOA Dislocated Worker 17.278 (5) K9110017 2,754,087 1,439,782 WIOA Rapid Response 17.278 (5) K9110017 831,850 302,301 WIOA Layoff Version RR (GC 292) 17.278 (5) K9110017 236,518 - WIOA Layoff Version RR (GC 293) 17.278 (5) K9110017 60,122 - WIOA Transfer DW to Adult (GC 500) 17.278 (5) K9110017 838,103 -
Subtotal 17.278 6,928,521 3,949,924 Total U.S. Department of Labor 30,098,437 21,167,900
U.S. Department of the InteriorDirect Program
Invasive and Noxious Plant ManagementNational Recreation Area Vacant Lot Weeding Program 15.230 4,199 -
Passed Through the California State Controller's OfficeFlood Control Act Lands 15.433 3,538 - Total U.S. Department of the Interior 7,737 -
U.S. Department of TransportationDirect Program
Airport Improvement ProgramAirport Improvement Program 20.106 3,769,394 - Vacant Lot Clearance - Federal Aviation 20.106 4,106 -
Subtotal 20.106 3,773,500 -
Passed Through the California Department of TransportationHighway Planning and Construction
Bridge Retrofit Program 20.205 (6) 94,647 - Surface Transportation Program (STP) 20.205 (6) 8,078,676 - Highway Bridge Rehabilitation 20.205 (6) 4,928,663 - 1998/1999 Demonstration 20.205 (6) 27,729 - Transportation Enhancement Activities 20.205 (6) 201,590 - Congestion Mitigation and Air Quality Program 20.205 (6) 596,526 - Emergency Relief Program 20.205 (6) 5,409,707 - Highway Safety Improvement Program (HSIP) 20.205 (6) 1,903,024 - Federal Safe Routes to School (SRTS) 20.205 (6) 33,565 - Transportation Alternative Program 20.205 (6) 421,428 -
Subtotal 20.205 21,695,555 -
Formula Grants for Rural Areas and Tribal Transit ProgramPublic Transportation for Non-Urbanized Areas 20.509 413,632 -
State and Community Highway Safety 20.600 (8) (16) 110,641 -
Passed Through the California Office of Traffic SafetyState and Community Highway Safety
Selective Traffic Enforcement Program 19 (402PT-19) (PT 19061) 20.600 (8) (16) 516,713 -
Passed Through the California Office of Emergency ServicesState and Community Highway Safety
Selective Traffic Enforcement Program (402PT) (PT 18090) 20.600 (8) (16) 210,293 - Subtotal 20.600 837,647 -
Passed Through the Los Angeles Metropolitan Transportation AuthorityNew Freedom Program
New Freedom Program - CA-57-X084 20.521 (7) MOU.NFLACNTY09A 824,913 320,104
Passed Through the California Office of Emergency ServicesMinimum Penalties for Repeat Offenders for Driving While Intoxicated
Selective Traffic Enforcement Program (164AL) (PT 18090) 20.608 (17) 271,795 -
See legend on page 174 for CFDA No. Cluster Summary and Notes A and B.See accompanying Notes to Schedule of Expenditures of Federal Awards.
172 (Continued)

COUNTY OF LOS ANGELESSCHEDULE OF EXPENDITURES OF FEDERAL AWARDS
FOR THE YEAR ENDED JUNE 30, 2019
Federal Grantor/Pass-Through Grantor/Program TitlePass-Through Entity ID No.
(Note A) Federal
Expenditures
Passed Through to
Subrecipients
Catalog of Federal Domestic
Assistance Number (CFDA#)
Passed Through the California Office of Traffic SafetyMinimum Penalties for Repeat Offenders for Driving While Intoxicated
Intensive Probation Supervision for High-Risk Felony and Repeat DUI Offenders 20.608 (17) AL18018 83,051$ -$ Intensive Probation Supervision for High-Risk Felony and Repeat DUI Offenders 20.608 (17) AL19005 219,437 - Selective Traffic Enforcement Program 19 (164AL-19) 20.608 (17) PT 19061 436,113 - Minor Decoy, Shoulder Tap, Informed Merchants Preventing 20.608 (17) 17-OTS05 1,981 -
Subtotal 20.608 1,012,377 -
National Priority Safety ProgramsAlcohol & Drug Impaired Driver Vertical Prosecution Program 20.616 (8) DI19006 923,685 - Office of Traffic Safety Program (OTS) 20.616 (8) OP19006 93,923 -
Subtotal 20.616 1,017,608 - Total U.S. Department of Transportation 29,575,232 320,104
U.S. Election Assistance CommissionPassed Through the California Secretary of State
Help America Vote Act (HAVA) Requirements PaymentsHAVA Section 301 Voting Systems Program 90.401 2,135,555 - HAVA Polling Place Accessibility Training Program 90.401 200,000 - Total U.S. Election Assistance Commission 2,335,555 -
U.S. Environmental Protection AgencyDirect Program
Congressionally Mandated ProjectsWater Infrastructure - Regional Recycled Water Project 66.202 352 -
Superfund State, Political Subdivision, and Indian Tribe Site-Specific Cooperation Agreements
Fish Contamination Inspection, Outreach, and Education (Toxics Epidemiology) 66.802 105,648 - Palos Verdes Fish Contamination - Enforcement Cooperative Agreement 66.802 10,807 -
Subtotal 66.802 116,455 -
Passed Through the California Environmental Protection AgencyBeach Monitoring and Notification Program Implementation Grants
Public Beach Safety Program 66.472 188,500 - Total U.S. Environmental Protection Agency 305,307 -
U.S. Executive Office of the PresidentDirect Program
High Intensity Drug Trafficking Areas (HIDTA) Program 95.001 108,389 - Total U.S. Executive Office of the President 108,389 -
U.S. Institute of Museum and Library ServicesPassed Through California Humanities
Promotion of the Humanities Federal/State PartnershipCal Humanities: A Lens into Mi Vida 45.129 LIL18-14 4,999 -
Passed Through the California State LibraryGrants to States
Veterans Connect @ the Library 45.310 LS-00-17-0005-17 4,700 - CA Initiative Book Project 45.310 40-8812 9,109 -
Subtotal 45.310 13,809 - Total U.S. Institute of Museum and Library Services 18,808 -
Total Expenditures of Federal Awards 2,735,170,683$ 414,689,699$
See legend on page 174 for CFDA No. Cluster Summary and Notes A and B.See accompanying Notes to Schedule of Expenditures of Federal Awards.
173 (Continued)

COUNTY OF LOS ANGELESSCHEDULE OF EXPENDITURES OF FEDERAL AWARDS
FOR THE YEAR ENDED JUNE 30, 2019
Legend Amounts
(1) SNAP Cluster $ 267,788,183 (2) Child Nutrition Cluster 459,268(3) Forest Service Schools and Roads Cluster 736,222(4) CDBG - Entitlement Grants Cluster 1,723,430(5) WIOA Cluster 28,565,641(6) Highway Planning and Construction Cluster 21,695,555(7) Transit Services Programs Cluster 824,913(8) Highway Safety Cluster 1,855,255(9) Aging Cluster (Note B) 24,644,996
(10) Maternal, Infant, and Early Childhood Home Visiting Cluster 1,440,670(11) TANF Cluster 604,864,151(12) CCDF Cluster 14,947,576(13) Medicaid Cluster 565,621,996(14) Student Financial Assistance Cluster 334,113(15) Total for CFDA #10.561 - State Administrative Matching Grants for the
Supplemental Nutrition Assistance Program 267,788,183(16) Total for CFDA #20.600 - State and Community Highway Safety 837,647(17) Total for CFDA #20.608 - Minimum Penalties for Repeat Offenders for
Driving While Intoxicated 1,012,377(18) Total for CFDA #93.566 - Refugee and Entrant Assistance-State
Administered Programs 2,728,465(19) Total for CFDA #93.778 - Medical Assistance Program 547,210,363(20) Total for CFDA #93.977 - Sexually Transmitted Diseases Prevention and
Control Grants 3,548,275
Note A - Certain awards do not have a pass-through entity ID number
Note B - Aging Cluster (as determined by the California Health and Human Services Agency, Department of Aging)
See accompanying Notes to Schedule of Expenditures of Federal Awards.
174

COUNTY OF LOS ANGELES NOTES TO SCHEDULE OF EXPENDITURES OF FEDERAL AWARDS
FOR THE YEAR ENDED JUNE 30, 2019
175
NOTE 1 – GENERAL The accompanying Schedule of Expenditures of Federal Awards (SEFA) represents all federal programs of the County of Los Angeles, California (the County). The County’s basic financial statements include the operations of the Los Angeles County Development Authority (LACDA), formerly known as the Community Development Commission, and the Los Angeles County Children and Families First – Proposition 10 Commission (First 5 LA), which expended $410,220,178 and $682,813, respectively, in federal awards that are not included in the accompanying SEFA. The LACDA engaged other auditors to perform an audit in accordance with Title 2 U.S. Code of Federal Regulations Part 200, Uniform Administrative Requirements, Cost Principles, and Audit Requirements for Federal Awards (Uniform Guidance). First 5 LA did not meet the minimum threshold of $750,000 and, therefore, was exempted from having a Single Audit. All federal financial assistance received directly from federal/state agencies, as well as federal financial assistance passed through other government agencies, is included in the SEFA. NOTE 2 – BASIS OF ACCOUNTING The accompanying SEFA is prepared on the modified accrual basis of accounting for program expenditures accounted for in the governmental funds and the accrual basis of accounting for program expenditures accounted for in the proprietary funds, as described in Note 1 of the Notes to the County's basic financial statements. The information in this schedule is presented in accordance with the requirements of the Uniform Guidance. However, some amounts presented in this schedule are reported on a cash basis, as described in the succeeding paragraph. Certain federal program expenditures in the SEFA are converted to and reported on a cash basis due to the claiming requirements of pass-through and federal agencies. These expenditures are presented on a cash basis to be consistent with the amounts previously claimed and reported for reimbursement purposes. The affected programs are listed below.
Catalog of Federal
Domestic Assistance
Number (CFDA#) Program Name 10.561
Supplemental Nutrition Assistance Program (SNAP) - Administration (CalFresh)
10.561
Supplemental Nutrition Assistance Program - Education (SNAP-ED) - 16-10148
10.561
Supplemental Nutrition Assistance Program - Education (SNAP-ED) - SP1718-19
10.561
Supplemental Nutrition Assistance Program - Education (SNAP-ED) - SP1819-19

COUNTY OF LOS ANGELES NOTES TO SCHEDULE OF EXPENDITURES OF FEDERAL AWARDS
FOR THE YEAR ENDED JUNE 30, 2019
176
CFDA# Program Name 12.002 Procurement Technical Assistance 14.218 Project Star (Studying, Tutoring, and Reading) 14.218 Project Star (La Puente/Graham Library) 14.218 Burke's Club Drug Prevention and Gang Intervention 14.218 Adventure Park Recreation Program 14.218 Amigo Park Mobile Recreation Program 14.218 Pathfinder Senior Recreation Program 14.218 Loma Alta Park Recreation Program 14.218 Pamela Park Recreation Program 14.218 Pearblossom Park Recreation Program 14.218 Valleydale Park After-School Program 14.218 Salazar Park Recreation Program 14.218 Rimgrove Park Recreation Program 14.218 Security Cameras at Ruben Salazar Park 14.218 Saybrook Park Recreation Program 14.218 Community Development Block Grant 14.218 Community Code Enforcement - 4th District 14.218 Community Code Enforcement East Los Angeles-1st District 14.218 Homeowners Fraud Prevention Program 14.218 Unincorporated Areas Small Business Initiative 14.218 Rowland Heights Youth Athletic League Program-Carolyn Rosas Park 14.218 Century Station Code Enforcement Project 14.218 ALPR Stationary Cameras - East LA 14.218 ALPR Mobile Cameras - East LA 14.218 Equestrian Patrol Pilot Program - Industry Station 14.218 Bike Patrol Pilot Program - Whittier Blvd 14.218 Enhanced Patrol Walnut Park - Century Station 16.738 Alternate Sentencing Program (APD) (JAG) 15 16.738 Centinela Youth Services - Every Child Restorative Justice (JAG) 15 16.738 Toberman Grace (JAG) 15 16.738 New Earth - Dream Space Library and Flow Program (JAG) 15 16.738 Patrol Services Overtime (JAG) 15 16.738 Spirit Awakening Foundation (JAG) 15 16.738 School Resource Deputy (JAG) 15 16.738 Southern California Crossroads (JAG) 15 16.738 Alternate Sentencing Program (PD) (JAG) 16 16.738 School Resource Deputy/Rosemont Middle School (Sheriff) (JAG) 16 16.738 Sheriff Youth Activities League (JAG) 16 84.007 Supplemental Educational Opportunity Grants 84.063 Pell Grants 93.090
Kinship Guardianship Assistance Payment Program (Kin-GAP) Title IV-E
93.556 Promoting Safe And Stable Families Program (PSSF) 93.558 CalWORKs - Family Group/Unemployed Parent (FG/U) Assistance

COUNTY OF LOS ANGELES NOTES TO SCHEDULE OF EXPENDITURES OF FEDERAL AWARDS
FOR THE YEAR ENDED JUNE 30, 2019
177
CFDA# Program Name 93.558 CalWORKs Legal Immigrants (MC) 93.558 CalWORKs Diversion - Federal 93.558 CalWORKs Fraud Incentives 93.558 CalWORKs Single 93.558 Temporary Assistance For Needy Families 93.563 Child Support Enforcement Title IV-D 93.566 Refugee Resettlement 93.566 Refugee Employment Social Services 93.566 Services to Older Refugees 93.569 Community Services Block Grant 93.569 Community Services Block Discretionary Grant 93.584 Refugee Targeted Assistance Program 93.590 Community-Based Child Abuse Prevention 93.596 Child Day Care Program 93.645 Children's Welfare Services IV-B (Direct Cost) 93.658
Aid to Families with Dependent Children - FC - Administration and Assistance
93.658 Foster Care Title IV-E 93.658 Foster Parent Training 93.658 Group Home Month Visits / CWD 93.658 Child Welfare Services Outcome Improvement Project (Cohort 1) 93.659 Adoptions - Administration and Assistance 93.667 Children's Welfare Services Title XX 93.674 Independent Living Skills - Children's Services 93.778 Medi-Cal Administrative Activities (MAA) 93.778 Medi-Cal Eligibility Determination 93.778
In-Home Supportive Services - Personal Care Services Program (Health-Related)
93.778 Adult Protective Services/County Services Block Grant NOTE 3 – GRANT PROGRAMS REIMBURSED IN ARREARS The County participates in several federal programs where payments are received in arrears because eligibility, as determined by the federal agency, is determined in arrears. The County reports actual revenues for these programs in the year that the funds are received, since the County’s eligible expenditures are not determinable until reimbursement is received. State Criminal Alien Assistance Program (SCAAP), CFDA #16.606 FY Exp. Incurred FY Exp. Reimbursed Amount 2015-16 2018-19 $ 2,120,590

COUNTY OF LOS ANGELES NOTES TO SCHEDULE OF EXPENDITURES OF FEDERAL AWARDS
FOR THE YEAR ENDED JUNE 30, 2019
178
Pest Exclusion/Dog Teams Program, CFDA #10.025 FY Exp. Incurred FY Exp. Reimbursed Amount 2017-18 2018-19 $ 597,303 Glassy Winged Sharpshooter (GWSS), CFDA #10.025 FY Exp. Incurred FY Exp. Reimbursed Amount 2017-18 2018-19 $ 1,659,128 NOTE 4 – COMMUNITY SERVICES BLOCK GRANTS, CFDA #93.569 At the request of the California Health and Human Services Agency, Department of Community Services and Development, supplementary schedules of expenditures for Community Services Block Grant (CSBG) programs are included on pages 217 through 221. NOTE 5 – MEDICAID CLUSTER Direct Medi-Cal and Medicare expenditures are excluded from the SEFA. These expenditures represent fees for services and are not included in the SEFA or in determining major programs. The County assists the State of California in determining eligibility and provides Medi-Cal and Medicare services through County-owned facilities. Administrative costs related to Medi-Cal and Medicare are, however, included in the SEFA under the Medicaid Cluster. NOTE 6 – INDIRECT COST RATE The County of Los Angeles has elected not to use the 10-percent de minimis indirect cost rate allowed under the Uniform Guidance.

www.mgocpa.com
Macias Gini & O’Connell LLP 700 South Flower St., Suite 800 Los Angeles, CA 90017
179
Independent Auditor’s Report on Internal Control Over Financial Reporting and on Compliance and Other Matters
Based on an Audit of Financial Statements Performed in Accordance With Government Auditing Standards
The Honorable Board of Supervisors County of Los Angeles, California
We have audited, in accordance with auditing standards generally accepted in the United States of America and the standards applicable to financial audits contained in Government Auditing Standards issued by the Comptroller General of the United States, the financial statements of the governmental activities, the business-type activities, the aggregate discretely presented component units, each major fund, and the aggregate remaining fund information of the County of Los Angeles, California (County), as of and for the year ended June 30, 2019, and the related notes to the financial statements, which collectively comprise the County’s basic financial statements, and have issued our report thereon dated December 13, 2019, except for the last paragraph of Note 22 Subsequent Events and the report on the schedule of expenditures of federal awards, the community services block grant supplementary schedules of revenue and expenditures, and the supplementary schedule of expenditures of federal and state awards granted by the California Department of Aging, as to which the date is March 26, 2020. Our report includes a reference to other auditors who audited the financial statements of the Los Angeles County Development Authority (LACDA), the Los Angeles County Children and Families First – Proposition 10 Commission (First 5 LA), and the Los Angeles County Employees Retirement Association (LACERA), as described in our report on the County’s financial statements. This report does not include the results of the other auditors testing of internal control over financial reporting or compliance and other matters that are reported on separately by those auditors.
Internal Control over Financial Reporting
In planning and performing our audit of the financial statements, we considered the County’s internal control over financial reporting (internal control) to determine the audit procedures that are appropriate in the circumstances for the purpose of expressing our opinions on the financial statements, but not for the purpose of expressing an opinion on the effectiveness of the County’s internal control. Accordingly, we do not express an opinion on the effectiveness of the County’s internal control.
A deficiency in internal control exists when the design or operation of a control does not allow management or employees in the normal course of performing their assigned functions, to prevent, or detect and correct misstatements on a timely basis. A material

180
weakness is a deficiency, or a combination of deficiencies, in internal control, such that there is a reasonable possibility that a material misstatement of the entity’s financial statements will not be prevented, or detected and corrected on a timely basis. A significant deficiency is a deficiency, or a combination of deficiencies, in internal control that is less severe than a material weakness, yet important enough to merit attention by those charged with governance.
Our consideration of internal control was for the limited purpose described in the first paragraph of this section and was not designed to identify all deficiencies in internal control that might be material weaknesses or significant deficiencies. Given these limitations, during our audit we did not identify any deficiencies in internal control that we consider to be material weaknesses. However, material weaknesses may exist that have not been identified.
Compliance and Other Matters
As part of obtaining reasonable assurance about whether the County’s financial statements are free from material misstatement, we performed tests of its compliance with certain provisions of laws, regulations, contracts, and grant agreements, noncompliance with which could have a direct and material effect on the determination of financial statement amounts. However, providing an opinion on compliance with those provisions was not an objective of our audit and, accordingly, we do not express such an opinion. The results of our tests disclosed no instances of noncompliance or other matters that are required to be reported under Government Auditing Standards.
Purpose of this Report
The purpose of this report is solely to describe the scope of our testing of internal control and compliance and the results of that testing, and not to provide an opinion on the effectiveness of the entity’s internal control or on compliance. This report is an integral part of an audit performed in accordance with Government Auditing Standards in considering the entity’s internal control and compliance. Accordingly, this communication is not suitable for any other purpose.
Los Angeles, California December 13, 2019

www.mgocpa.com
Macias Gini & O’Connell LLP 700 South Flower St., Suite 800 Los Angeles, CA 90017
181
Independent Auditor’s Report on Compliance for Each Major Federal Program and Report on Internal Control Over
Compliance Required by the Uniform Guidance
The Honorable Board of Supervisors County of Los Angeles, California
Report on Compliance for Each Major Federal Program
We have audited the County of Los Angeles, California’s (County) compliance with the types of compliance requirements described in the OMB Compliance Supplement that could have a direct and material effect on each of the County’s major federal programs for the year ended June 30, 2019. The County’s major federal programs are identified in the summary of auditor’s results section of the accompanying schedule of findings and questioned costs.
The County’s basic financial statements include the operations of the Los Angeles County Development Authority (LACDA) and the Los Angeles County Children and Families First – Proposition 10 Commission (First 5 LA), which expended $410,220,178 and $682,813,respectively, in federal awards, which are not included in the schedule of expenditures offederal awards for the year ended June 30, 2019. Our audit, described below, did notinclude the operations of LACDA and First 5 LA. The LACDA engaged other auditors toperform an audit in accordance with Title 2 U.S. Code of Federal Regulations Part 200,Uniform Administrative Requirements, Cost Principles, and Audit Requirements forFederal Awards (Uniform Guidance). The First 5 LA did not issue a report in accordancewith the Uniform Guidance because it did not meet the reporting threshold under theUniform Guidance.
Management’s Responsibility
Management is responsible for compliance with federal statutes, regulations, and the terms and conditions of federal awards applicable to its federal programs.
Auditor’s Responsibility
Our responsibility is to express an opinion on compliance for each of the County’s major federal programs based on our audit of the types of compliance requirements referred to above. We conducted our audit of compliance in accordance with auditing standards generally accepted in the United States of America; the standards applicable to financial audits contained in Government Auditing Standards, issued by the Comptroller General of the United States; and the audit requirements of the Uniform Guidance. Those standards and the Uniform Guidance require that we plan and perform the audit to obtain

182
reasonable assurance about whether noncompliance with the types of compliance requirements referred to above that could have a direct and material effect on a major federal program occurred. An audit includes examining, on a test basis, evidence about the County’s compliance with those requirements and performing such other procedures as we considered necessary in the circumstances.
We believe that our audit provides a reasonable basis for our qualified and unmodified opinions on compliance for major federal programs. However, our audit does not provide a legal determination of the County’s compliance.
Basis for Qualified Opinion on the Promoting Safe and Stable Families and Adoption Assistance Programs
As described in finding numbers 2019-001 and 2019-002 in the accompanying schedule of findings and questioned costs, the County did not comply with requirements regarding the following:
Finding No. CFDA No. Program Name Compliance Requirement(s) 2019-001 93.556 Promoting Safe and
Stable Families Earmarking
2019-002 93.659 Adoption Assistance Activities Allowed or Unallowed and Eligibility
Compliance with such requirements is necessary, in our opinion, for the County to comply with the requirements applicable to that program.
Qualified Opinion on the Promoting Safe and Stable Families and Adoption Assistance Programs
In our opinion, except for the noncompliance described in the Basis for Qualified Opinion paragraph, the County complied, in all material respects, with the types of compliance requirements referred to above that could have a direct and material effect on CFDA No. 93.556 Promoting Safe and Stable Families and CFDA No. 93.659 Adoption Assistance for the year ended June 30, 2019.
Unmodified Opinion on Each of the Other Major Federal Programs
In our opinion, the County complied, in all material respects, with the types of compliance requirements referred to above that could have a direct and material effect on each of its other major federal programs identified in the summary of auditor’s results section of the accompanying schedule of findings and questioned costs for the year ended June 30, 2019.

183
Other Matters
The results of our auditing procedures disclosed an other instance of noncompliance which is required to be reported in accordance with the Uniform Guidance and which is described in the accompanying schedule of findings and questioned costs as item 2019-003. Our opinion on the major federal program is not modified with respect to this matter.
The County’s response to the noncompliance findings identified in our audit are described in the accompanying schedule of findings and questioned costs. The County’s response was not subjected to the auditing procedures applied in the audit of compliance and, accordingly, we express no opinion on the response.
Report on Internal Control over Compliance
Management of the County is responsible for establishing and maintaining effective internal control over compliance with the types of compliance requirements referred to above. In planning and performing our audit of compliance, we considered the County’s internal control over compliance with the types of requirements that could have a direct and material effect on each major federal program to determine the auditing procedures that are appropriate in the circumstances for the purpose of expressing an opinion on compliance for each major federal program and to test and report on internal control over compliance in accordance with the Uniform Guidance, but not for the purpose of expressing an opinion on the effectiveness of internal control over compliance. Accordingly, we do not express an opinion on the effectiveness of the County’s internal control over compliance.
Our consideration of internal control over compliance was for the limited purpose described in the preceding paragraph and was not designed to identify all deficiencies in internal control over compliance that might be material weaknesses or significant deficiencies and therefore, material weaknesses or significant deficiencies may exist that have not been identified. However, as discussed below, we did identify certain deficiencies in internal control over compliance that we consider to be material weaknesses and significant deficiencies.
A deficiency in internal control over compliance exists when the design or operation of a control over compliance does not allow management or employees, in the normal course of performing their assigned functions, to prevent, or detect and correct, noncompliance with a type of compliance requirement of a federal program on a timely basis. A material weakness in internal control over compliance is a deficiency, or a combination of deficiencies in internal control over compliance, such that there is a reasonable possibility that material noncompliance with a type of compliance requirement of a federal program will not be prevented, or detected and corrected, on a timely basis. We consider the deficiencies in internal control over compliance described in the accompanying schedule of findings and questioned costs as items 2019-001 and 2019-002 to be material weaknesses.

184
A significant deficiency in internal control over compliance is a deficiency, or a combination of deficiencies, in internal control over compliance with a type of compliance requirement of a federal program that is less severe than a material weakness in internal control over compliance, yet important enough to merit attention by those charged with governance. We consider the deficiencies in internal control over compliance described in the accompanying schedule of findings and questioned costs as items 2019-003 and 2019-004 to be significant deficiencies.
The County’s response to the internal control over compliance findings identified in our audit is described in the accompanying schedule of findings and questioned costs. The County’s response was not subjected to the auditing procedures applied in the audit of compliance and, accordingly, we express no opinion on the response.
The purpose of this report on internal control over compliance is solely to describe the scope of our testing of internal control over compliance and the results of that testing based on the requirements of the Uniform Guidance. Accordingly, this report is not suitable for any other purpose.
Los Angeles, California March 26, 2020

COUNTY OF LOS ANGELES SCHEDULE OF FINDINGS AND QUESTIONED COSTS
FOR THE YEAR ENDED JUNE 30, 2019
185
(a) Financial Statements
Type of report issued on whether the financial statements audited were prepared in accordance with GAAP: Unmodified Opinion
Internal control over financial reporting:
Material weakness(es) identified? No
Significant deficiency(ies) identified? None reported
Noncompliance material to the financial statements noted? No
(b) Federal Awards
Internal control over major federal programs:
Material weakness(es) identified? Yes
Significant deficiency(ies) identified? Yes
Type of auditor’s report issued on compliance for major federal programs:
Unmodified for all major programs except for the following, which were qualified:
- CFDA No. 93.556 Promoting Safe and Stable Families - CFDA No. 93.659 Adoption Assistance
Any audit findings disclosed that are required to be reported in accordance with 2 CFR 200.516(a): Yes
Section I - Summary of Auditor’s Results

COUNTY OF LOS ANGELES SCHEDULE OF FINDINGS AND QUESTIONED COSTS
FOR THE YEAR ENDED JUNE 30, 2019
186
Identification of major federal programs:
CFDA Number Name of Federal Program or Cluster 10.025 Plant and Animal Disease, Pest Control,
and Animal Care
16.575 Crime Victim Assistance
93.041/93.042/93.043 93.044/93.045/93.052 93.053
Aging Cluster
93.556 Promoting Safe and Stable Families
93.558 Temporary Assistance for Needy Families (TANF) Cluster
93.575/93.596 Child Care and Development Fund (CCDF) Cluster
93.566 Refugee and Entrant Assistance – State/Replacement Designee Administrative Programs
93.659 Adoption Assistance
93.777/93.778 Medicaid Cluster
93.940 HIV Prevention Activities – Health Department Based
93.959 Block Grants for Prevention and Treatment of Substance Abuse
Dollar threshold used to distinguish between Type A and Type B programs: $8,205,512 Auditee qualified as a low-risk auditee? No

COUNTY OF LOS ANGELES SCHEDULE OF FINDINGS AND QUESTIONED COSTS
FOR THE YEAR ENDED JUNE 30, 2019
187
None noted.
Section II – Financial Statement Findings

COUNTY OF LOS ANGELES SCHEDULE OF FINDINGS AND QUESTIONED COSTS
FOR THE YEAR ENDED JUNE 30, 2019
188
Reference Number: 2019-001 Federal Program Title: Promoting Safe and Stable Families Federal Catalog Number: 93.556 Federal Agency: U.S. Department of Health and Human
Services Pass-Through Entity: California Department of Social Services Federal Award Number and Year: CFL No. 18/19-34; Fiscal Year 2018-19 Name of Department: Department of Children and Family
Services Category of Finding: Earmarking Criteria In accordance with the County Fiscal Letter (CFL) No. 18/19-34 issued by the California Department of Social Services (CDSS), the County received $8,055,423 of program funds and must spend a minimum of 20 percent of these Promoting Safe and Stable Families (PSSF) program funds on each of the four program components: (1) Family Preservation Services (2) Family Support Services (3) Adoption Promotion and Support (4) Time-Limited Family Reunification Per CFL No. 18/19-36, the County also received $406,219 for the PSSF program and could only use these funds for improving the quality of monthly caseworker visits with an emphasis on caseworker decision making and caseworker recruitment and retention. Therefore, the County received a total of $8,461,642 of PSSF program funds in fiscal year (FY) 2018-19. Condition During our review of the four quarterly County Expense Claims (CEC) submitted for FY 2018-19, we noted that the Department of Children and Family Services (DCFS) did not spend a minimum of 20 percent of PSSF program funds on the Time-Limited Family Reunification (TLFR) component. Cause DCFS has a memorandum of understanding with the County’s Department of Public Health (DPH) to provide substance abuse treatment services for the TLFR. Due to a Medi-Cal waiver that allows DPH to bill additional substance abuse treatment service costs to the Medi-Cal program, DPH billed more costs to the Medi-Cal program and less
Section III – Federal Award Findings and Questioned Costs

COUNTY OF LOS ANGELES SCHEDULE OF FINDINGS AND QUESTIONED COSTS
FOR THE YEAR ENDED JUNE 30, 2019
189
to the TLFR, which caused DCFS to be out of compliance for the earmarking requirement. DCFS had informed CDSS and was working on a plan to utilize additional funds on TLFR. Because the plan was not implemented in FY 2018-19, the minimum 20 percent requirement was not met.
Effect
Failure to spend the required minimum of 20 percent of program funds on the TLFR results in noncompliance with CFL No. 18/19-34.
Questioned Costs
$1,378,783 (known questioned costs based on the minimum 20 percent requirement compared to the actual amount spent on TLFR)
Context
Of the $8,461,642 expenditures claimed, $8,055,423 is subject to the minimum of 20 percent earmarking requirement, which requires DCFS to spend at least $1,611,085 on each program component. However, DCFS spent $232,302 or 3 percent of the PSSF program funds on the TLFR component, which did not meet the requirement.
Recommendation
We recommend that DCFS continues to work on a plan to spend a minimum of 20 percent of PSSF program funds on the TLFR.
Views of Responsible Officials and Planned Corrective Action
1. Person responsible: Deputy Director
2. Corrective action plan:DCFS agrees with the audit finding. For future grants received from the CaliforniaDepartment of Social Services, DCFS will request the State’s approval to re-allocate the portion of Time-Limited Family Reunification (TLRF) funding that isexpected to be underspent. If the re-allocation request is approved, DCFS willamend the budgets of the Family Preservation (FP) contracts.
3. Anticipated implementation date:June 30, 2020 for FP grant; December 31, 2021 for TLFR grants.

COUNTY OF LOS ANGELES SCHEDULE OF FINDINGS AND QUESTIONED COSTS
FOR THE YEAR ENDED JUNE 30, 2019
190
Reference Number: 2019-002 Federal Program Title: Adoption Assistance Federal Catalog Number: 93.659 Federal Agency: U.S. Department of Health and Human
Services Pass-Through Entity: California Department of Social Services Federal Award Number and Year: CFL No. 11/12-18, 14/15/-40, 16/17-69;
Fiscal Year 2018-19 Name of Department: Department of Children and Family
Services Category of Finding: Activities Allowed or Unallowed and
Eligibility Criteria The compliance criteria pertaining to the Adoption Assistance program are as follows:
1. The child was determined by the Department of Children and Family Services (DCFS) to be a child with special needs. Special needs means that there is a specific factor or condition (such as ethnic background, age, or membership in a minority or sibling group, or the presence of factors such as medical conditions or physical, mental, or emotional handicaps) because of which it is reasonable to conclude that the child cannot be placed with adoptive parents without providing adoption assistance under Title IV-E and medical assistance under Title XIX (42 USC 673(c)(1)(B)).
2. Per DCFS’ policies and procedures, the Adoption Assistance Program (AAP) 4 form – Eligibility Certification, Section I Three Part Special Needs Determination or Barriers to Adoption section and the AD 4320 Adoption Assistance Program (AAP) Agreement should be completed.
3. The prospective adoptive parents must satisfactorily have met a criminal records
check, including a fingerprint-based check (42 USC 671(a)(20)(A)), which involves a determination that such individuals have not committed any prohibited felonies in accordance with 42 USC 671(a)(20)(A)(i) and (ii). In addition, the prospective adoptive parents and any other adult living in the home who has resided in the provider home in the preceding 5 years must satisfactorily have a met child abuse and neglect registry check under 42 USC 671(a)(20)(B).
4. The child was determined by the Title IV-E agency as someone who cannot or
should not be returned to the home of his or her parents (42 USC 673(c)(1)(A)).

COUNTY OF LOS ANGELES SCHEDULE OF FINDINGS AND QUESTIONED COSTS
FOR THE YEAR ENDED JUNE 30, 2019
191
5. The Title IV-E agency has made reasonable efforts to place the child for adoption without a subsidy. The only exception to this requirement is where it would be against the best interests of the child because of such factors as the existence of significant emotional ties with prospective adoptive parents while in the care of the parents as a foster child (42 USC 673(c)(1)(B) and 673(c)(2) as amended/added by Pub. L. No. 110-351).
6. Each State or local agency shall enter into adoption assistance agreements with the adoptive parents of children with special needs. The amount of the payments to be made shall be determined through agreement between the adoptive parents and the State or local agency administering the program (42 USC 673(a)1(A) and (a)(3)).
Condition Of the sixty (60) samples selected for testing, we noted the following exceptions:
1. Three (3) samples where Section I Three Part Special Needs Determination or Barriers to Adoption of the AAP 4 form was not fully completed to support that the children have special needs.
2. Three (3) samples where documentation of the search for non-subsidy placement section of the AAP 4 form was not fully completed.
3. Three (3) samples where the AD 4320 AAP Agreements for two (2) were not fully completed and one (1) had an incorrect agreement date.
4. One (1) sample where the Federal Eligibility section of the AAP 4 form regarding the removal of a child from his or her parent(s) was not fully completed.
5. One (1) sample where there was no criminal record check, as well as child abuse and neglect registry check in the case file.
Eligibility of AAP cases is determined when the cases are initiated. No redetermination is required, and eligible children can receive benefits until the age of 18 (or 21 if they meet specific requirements). Therefore, documentation of eligibility determination for some cases were prepared in the late 1990s or early 2000s, and the children in those cases could receive benefits in FY 2018-19 since they had not reached the age of 18 (or 21). Prior to 2010, there were many deficiencies in DCFS’s documentation of eligibility determination for the program. In 2010, DCFS implemented procedures to improve the accuracy and completeness of their documentation. Four (4) of the eight (8) samples noted in this finding are cases that were initiated prior to 2010.

COUNTY OF LOS ANGELES SCHEDULE OF FINDINGS AND QUESTIONED COSTS
FOR THE YEAR ENDED JUNE 30, 2019
192
Cause
1. DCFS failed to fully complete a section of the AAP 4 form to support that the children have special needs due to human error and oversight.
2. DCFS failed to fully complete a section of the AAP 4 form to support that a search for non-subsidy placement was completed due to human error and oversight.
3. DCFS failed to fully complete the AD 4320 AAP Agreement and failed to document the correct agreement date due to human error and oversight.
4. DCFS failed to fully complete a section of the AAP 4 form to support that the
child should be removed from his or her parent(s) due to human error and oversight.
5. The criminal record check and the child abuse and neglect registry check could
not be located and DCFS management represented that they were most likely misplaced.
Effect The lack of documentation and proper completion of the AAP 4 forms to support allowable activities and eligibility determinations results in questioned costs and noncompliance with 42 USC 673, 42 USC 671, and DCFS policies and procedures. Questioned Costs $145,714 (known questioned costs based on FY 2018-19 assistance payments for the 8 samples) Context From a population of $124,414,750 of FY 2018-19 assistance payments, eight (8) samples with total payments of $145,714 are noted with the following exceptions:
1. One (1) sample, totaling $42,156, did not fully complete the search for non-subsidy placement section of the AAP 4 form.
2. One (1) sample, totaling $29,964,
a. Did not fully complete Section I Three Part Special Needs Determination or Barriers to Adoption of the AAP 4 form;
b. Did not fully complete the search for non-subsidy placement section of the AAP 4 form;
c. Did not fully complete the Federal Eligibility section of the AAP 4 form; and d. Did not have the DCFS representative signature on the AD 4320 AAP
Agreement.

COUNTY OF LOS ANGELES SCHEDULE OF FINDINGS AND QUESTIONED COSTS
FOR THE YEAR ENDED JUNE 30, 2019
193
3. One (1) sample, totaling $12,384, did not document whether the AD 4320 AAP
Agreement is the initial or amended agreement.
4. One (1) sample, totaling $18,180, did not have a criminal record check, as well as a child abuse and neglect registry check in the case file.
5. One (1) sample, totaling $18,732, documented an incorrect agreement date on the AD 4320 AAP Agreement.
6. One (1) sample, totaling $9,156, did not fully complete Section I Three Part Special Needs Determination or Barriers to Adoption of the AAP 4 form.
7. One (1) sample, totaling $12,108, did not fully complete the search for non-subsidy placement section of the AAP 4 form.
8. One (1) sample, totaling $3,034, did not fully complete Section I Three Part Special Needs Determination or Barriers to Adoption of the AAP 4 form.
The sample was not a statistically valid sample. In addition, this is a repeat finding as indicated in the Status of Prior Years’ Findings, as finding numbers 2018-005 and 2017-007. Recommendation We recommend that DCFS performs the following procedures:
1. Continue to strengthen their review process to ensure completeness and accuracy on the AAP 4 – Eligibility Certification and AD 4320 – AAP Agreement.
2. Maintain adequate documentation for adoption case files.
Views of Responsible Officials and Planned Corrective Action
1. Person responsible: CSA III, Resource Family Support & Permanency HSA III, Revenue Enhancement Division

COUNTY OF LOS ANGELES SCHEDULE OF FINDINGS AND QUESTIONED COSTS
FOR THE YEAR ENDED JUNE 30, 2019
194
2. Corrective action plan: The County of Los Angeles DCFS agrees with the audit finding and recommendations. DCFS would like to point out that if cases prior to 2010 continue to be pulled, they will reflect more deficiencies than cases started after 2010. To correct the current deficiencies, DCFS will continue to:
Provide additional training to staff, supervisors, and management; Revise procedural guides; and Perform random sampling quality assurance review.
3. Anticipated implementation date: March 31, 2020.

COUNTY OF LOS ANGELES SCHEDULE OF FINDINGS AND QUESTIONED COSTS
FOR THE YEAR ENDED JUNE 30, 2019
195
Reference Number: 2019-003 Federal Program Title: Block Grants for Prevention and Treatment
of Substance Abuse Federal Catalog Number: 93.959 Federal Agency: U.S. Department of Health and Human
Services Pass-Through Entity: California Department of Health Care
Services Federal Award Number and Year: 17-94136; Fiscal Year 2018-19 Name of Department: Department of Public Health Category of Finding: Subrecipient Monitoring Criteria In accordance with Title 2 U.S. Code of Federal Regulations (CFR) §200.331(a) Requirements for pass-through entities, all pass-through entities must ensure that every subaward is clearly identified to the subrecipient as a subaward and includes the following information at the time of the subaward and if any of these data elements change, include the changes in subsequent subaward modification.
(1) Federal Award Identification: (ii) Subrecipient’s unique entity identifier [generally the Data Universal Numbering System (DUNS) number]
Condition During our review of subrecipient monitoring, we noted that the agreement between the Department of Public Health (DPH) and three (3) subrecipients did not contain the subrecipients’ DUNS numbers. Cause Although subrecipients’ DUNS numbers were included in some of the subawards, DPH was not aware that it is a compliance requirement for every subaward.
Effect Failure to provide the required subaward information results in noncompliance with 2 CFR §200.331(a). Questioned Costs No questioned costs were identified.

COUNTY OF LOS ANGELES SCHEDULE OF FINDINGS AND QUESTIONED COSTS
FOR THE YEAR ENDED JUNE 30, 2019
196
Context Of the nine (9) subrecipients selected for testing, which totaled $2,824,988 from a population of $32,943,149, the subrecipients’ DUNS numbers were not included in the subaward for three (3) subrecipients, totaling $853,297. The sample was not a statistically valid sample. Recommendation We recommend that DPH includes the subrecipients’ DUNS numbers in the grant agreement for all subawards and communicate any changes in subsequent subaward modifications. Views of Responsible Officials and Planned Corrective Action
1. Person responsible: Interim Division Director
2. Corrective action plan:
DPH - Substance Abuse Prevention and Control (SAPC) agrees with the recommendation and DPH-SAPC's Contracts Service Division will ensure that the DUNS numbers are included in the grant agreement for all subawards and DPH - SAPC Finance will communicate any changes in subsequent subaward modifications.
3. Anticipated implementation date: July 1, 2020.

COUNTY OF LOS ANGELES SCHEDULE OF FINDINGS AND QUESTIONED COSTS
FOR THE YEAR ENDED JUNE 30, 2019
197
Reference Number: 2019-004 Federal Program Title: Temporary Assistance for Needy Families Federal Catalog Number: 93.558 Federal Agency: U.S. Department of Health and Human
Services Pass-Through Entity: California Department of Social Services Federal Award Number and Year: CFL No. 18/19-20; Fiscal Year 2018-19 Name of Department: Department of Children and Family
Services Category of Finding: Allowable Costs/Cost Principles Criteria Title 2 U.S. Code of Federal Regulations (CFR) §200.303 states that the non-Federal entity must:
(a) Establish and maintain effective internal control over the Federal award that provides reasonable assurance that the non-Federal entity is managing the Federal award in compliance with Federal statutes, regulations, and the terms and conditions of the Federal award. These internal controls should be in compliance with guidance in “Standards for Internal Control in the Federal Government” issued by the Comptroller General of the United States or the “Internal Control Integrated Framework”, issued by the Committee of Sponsoring Organizations of the Treadway Commission (COSO).
Condition The Department of Children and Family Services (DCFS) has common internal controls over the payroll process for its federal programs. We selected seventy five (75) employees, two timesheets for each employee for a total of 150 timesheets, to test allowable costs and the internal controls over this category of compliance requirements. Twenty five (25) employees were selected from each of the three major programs below:
1. CFDA No. 93.558 Temporary Assistance for Needy Families (TANF) 2. CFDA No. 93.778 Medical Assistance Program 3. CFDA No. 93.659 Adoption Assistance
During our review of the payroll transactions, two timesheets for one (1) employee, were not approved timely for the TANF program.
Timesheet Month
Timesheet Period Approval Date Delay in Timesheet Approval
November 2018
11/1/2018 – 11/15/2018
9/5/2019 10 Months
November 2018
11/16/2018 – 11/30/2018
9/10/2019 10 Months

COUNTY OF LOS ANGELES SCHEDULE OF FINDINGS AND QUESTIONED COSTS
FOR THE YEAR ENDED JUNE 30, 2019
198
Cause The timesheets were initially submitted electronically and placed on hold/rejected status since corrections needed to be made. Due to an oversight, the manual timesheet corrections were not submitted and approved until the transaction was selected for our review. Effect The late approval of employee timesheets results in noncompliance with 2 CFR §200.303(a). Questioned Costs No questioned costs were identified. Context Of the one hundred and fifty (150) timesheets from seventy five (75) employees, totaling $471,722, selected from a population of $211,916,981, the timesheets for one (1) employee for the TANF program, totaling $7,681, were not approved timely. The sample was not a statistically valid sample. Recommendation We recommend that DCFS strengthens its review process to ensure all timesheets and manual corrections are approved in a timely manner. Views of Responsible Officials and Planned Corrective Action
1. Person responsible: Payroll Timekeeping Supervisor
2. Corrective action plan: Management agrees with the finding. In addition to the internal controls already in place and functioning, the Payroll Timekeeping Supervisor will create a departmental Excel spreadsheet to track the following:
Pay period being reported Employees with missing timesheet Dates of contact Contact person Mode of contact Escalated to Status/comments/updates
COUNTY OF LOS ANGELES SCHEDULE OF FINDINGS AND QUESTIONED COSTS
FOR THE YEAR ENDED JUNE 30, 2019
199
When the timesheet is received and processed, the Excel spreadsheet is updated as processing is completed, indicating if the timesheet resulted in an overpayment or an underpayment. Each Payroll Timekeeper will provide an updated missing timesheet report to the Payroll Timekeeping Supervisor weekly.
3. Anticipated implementation date: March 1, 2020.

200
This page left blank intentionally.

COUNTY OF LOS ANGELES STATUS OF PRIOR YEARS’ FINDINGS FOR THE YEAR ENDED JUNE 30, 2019
201
FINANCIAL STATEMENT FINDINGS: Finding 09-04 – Protection of Information Assets (DHS) Condition At another hospital facility, IT assets are not currently safeguarded by an active dry fire suppression system. The server room has a Halon system, but it had been disconnected. Recommendation
We recommend that the County evaluate options and budget for the replacement of the Halon fire suppression system because the system should be reactivated as soon as possible. Current Year Management Response Management has agreed to replace the fire suppression system and a budget request was approved for 2019 to be completed in phases since the hospital is a California Office of Statewide Health Planning and Development (OSHPD) building and the permits have to be obtained after a specification data sheet has been completed by an appropriate vendor. Current Status as of June 30, 2019 Partially Implemented FEDERAL AWARDS FINDINGS: Finding 2018-001 – Subrecipient Monitoring CFDA #93.958 Block Grants for Community Mental Health Condition
During our review of three (3) subrecipients, we noted that the agreement between the Department of Mental Health (DMH) and the subrecipients did not contain four (4) of the required data elements: the subrecipients’ DUNS numbers, FAIN, whether the award is R&D, and the indirect cost rate. DMH provided a schedule that listed the required data elements, which included the four (4) elements. However, DMH was not able to provide written evidence of when they communicated the four (4) elements to the subrecipients. DMH obtained the FY 2016-17 Single Audit reports for two (2) subrecipients. However, there was no written evidence that DMH reviewed one (1) of the two (2) Single Audit reports and considered whether the results from the Single Audit report indicate conditions that require adjustments to DMH’s records.

COUNTY OF LOS ANGELES STATUS OF PRIOR YEARS’ FINDINGS FOR THE YEAR ENDED JUNE 30, 2019
202
DMH indicated that one (1) subrecipient’s FY 2016-17 federal expenditures were below the $750,000 threshold for a Single Audit. Therefore, there was no Single Audit report. However, DMH did not provide documentation to support that they have verified the subrecipient was not required to have a Single Audit for FY 2016-17. Recommendation We recommend that DMH performs the following procedures:
1. Provide the subaward information as required by 2 CFR §200.331(a) to subrecipients at the time of the subaward and communicate any changes in subsequent subaward modifications.
2. For existing subrecipients that were not previously provided the required elements, ensure they are communicated prior to the end of FY 2018-19.
3. Establish written policies and procedures that require DMH employees to review all subrecipients’ Single Audit reports regardless of the amount awarded to the subrecipients and maintain documentation to indicate that a Single Audit report was reviewed and whether there are findings that necessitate adjustments to DMH’s records.
4. Contact subrecipients to determine whether their total federal expenditures from all funding sources equal or exceed the $750,000 threshold in a fiscal year. If a subrecipient’s federal expenditures are below the threshold, obtain a confirmation from the subrecipient and maintain documentation in DMH’s records.
Current Year Management Response Contracts Development and Administration Division (CDAD) shall provide the subaward information to subrecipients and communicate any changes in subsequent subaward modifications. CDAD shall provide required elements to existing subrecipients and communicate prior to the end of FY 2018-19. CDAD shall send out the Federal Award Notices; request copies of single audit report should federal expenditures exceed $750,000 from all funding sources; if subrecipient’s federal expenditure is less than $750,000, CDAD shall obtain a confirmation from the subrecipient and maintain documentation in DMH’s records. Audit Services Program shall review all subrecipients’ Single Audit reports regardless of the amount they awarded to the subrecipients and maintain documentation to indicate that a Single Audit report was reviewed and whether any findings were identified that necessitate adjustments to DMH’s records. DMH follows the 2 CFR §200.331(a) requirements so as to ensure that finding are accurately stated and the recommendations understood. Current Status as of June 30, 2019 Implemented

COUNTY OF LOS ANGELES STATUS OF PRIOR YEARS’ FINDINGS FOR THE YEAR ENDED JUNE 30, 2019
203
Finding 2018-002 – Activities Allowed or Unallowed and Eligibility CFDA #93.658 Foster Care Title IV-E Condition
During our review of sixty (60) case files for the Foster Care Title IV-E program (Program), we noted the following:
1. Based on the FC 2 and FC 3 eligibility determination forms completed by DCFS eligibility workers, four (4) cases were determined to be ineligible for the Federal AFDC-FC aid but received foster care maintenance payments.
2. The eligibility supervisors are required to approve payments in the CWS/CMS before the LEADER Replacement System (LRS) issues payments. However, there were payments for three (3) cases without approval in the CWS/CMS, and one (1) case’s payment approval date was one month after the LRS issued the payment.
3. There was one (1) case where the child is over age 18, however DCFS was unable to provide documents to support that the child met the criteria for continued foster care maintenance payments.
Recommendation We recommend that DCFS performs the following procedures:
1. Strengthen the review process over the Title IV-E foster care maintenance payments to ensure that only children eligible for federal AFDC-FC aid receive benefits, and provide additional training to staff who complete eligibility questions in the LRS.
2. Correct the aid codes for the cases noted above and ensure adjustments are made to federal assistance claims.
3. Reinforce existing policies and procedures to ensure eligibility supervisors approve payments in the CWS/CMS before payments are issued to caregivers for eligible children.
4. Implement procedures to ensure adequate documentation for foster care case files is maintained.
Current Year Management Response Revenue Enhancement continues to conduct extensive Quality Assurance random case reviews; Aid code adjustments were completed as required; a Memo was issued to all eligibility supervisors to reinforce the importance of following current policy and procedure regarding the accuracy of payment and funding source; a Memo was issued to all eligibility staff reinforcing the need to ensure all required documentation is obtained and maintained in the case record for document retention purposes.

COUNTY OF LOS ANGELES STATUS OF PRIOR YEARS’ FINDINGS FOR THE YEAR ENDED JUNE 30, 2019
204
Current Status as of June 30, 2019 Implemented Finding 2018-003 – Subrecipient Monitoring and Procurement and Suspension and Debarment CFDA #17.258, 17.259, 17.278 Workforce Innovation and Opportunity Act (WIOA) Cluster Condition
We selected seven (7) subrecipient samples with active contracts during FY 2017-18 and noted that the Department of Workforce Development, Aging & Community Services (WDACS) did not perform the following:
1. WDACS was not able to provide complete documentation to indicate all required federal award information was communicated to the subrecipients. a. Four (4) subrecipient files were missing communication of the DUNS number,
Federal Award Identification Number (FAIN), Federal Award Date, Total Amount of Federal Award, project description, and identification of whether the award is R&D.
b. Three (3) of the four (4) subrecipient files were also missing the CFDA number and name, and the name of the federal awarding agency.
2. For seven (7) subrecipients, WDACS was not able to provide documentation to support that they verified the subrecipients were not suspended or debarred prior to entering into contracts.
Recommendation We recommend that WDACS performs the following procedures:
1. Provide the subaward information as required by 2 CFR §200.331(a) to subrecipients at the time of the subaward and communicate any changes in subsequent subaward modifications.
2. For existing subrecipients that were not previously provided the required elements, ensure they are communicated prior to the end of FY 2018-19.
3. Maintain documentation of when verification of suspension and debarment was performed or add a clause to the contract that subrecipients certify they are not suspended or debarred.

COUNTY OF LOS ANGELES STATUS OF PRIOR YEARS’ FINDINGS FOR THE YEAR ENDED JUNE 30, 2019
205
Current Year Management Response As of March 31, 2019, WDACS has completed implementation of all CAPs. Therefore, the CAPs for these recommendations have been completed. Current Status as of June 30, 2019 Implemented Finding 2018-004 – Suspension and Debarment CFDA #97.067 Homeland Security Grant Program Condition During our testing of suspension and debarment of vendors, we noted that the Fire Department did not verify that one (1) vendor was not suspended or debarred prior to entering into a covered transaction. Subsequent to the execution of the contract, the Fire Department verified that the vendor was not suspended or debarred. Recommendation We recommend the Fire Department strengthen its process to ensure that verification of suspension and debarment is performed for all vendors prior to entering into a covered transaction and maintain the evidence/documentation on file. Current Year Management Response On January 15, 2019, the Fire Department introduced a grant purchase checklist and instructed Procurement staff to ensure all grant related purchases are processed appropriately. The Fire Department’s Procurement management finalized the grant checklist document and, on January 30, 2019, reiterated to staff the importance to ensure the initiation of a secondary S.A.M. search for vendors that are on the debarment and suspension list once the purchase order was returned from ISD for final approval. In addition, each grant purchase checklist must be signed by the buyer and initialed by a procurement supervisor prior to final approval. Current Status as of June 30, 2019 Implemented

COUNTY OF LOS ANGELES STATUS OF PRIOR YEARS’ FINDINGS FOR THE YEAR ENDED JUNE 30, 2019
206
Finding 2018-005 – Activities Allowed or Unallowed and Eligibility CFDA #93.659 Adoption Assistance Condition Of the sixty (60) samples selected for testing, we noted the following exceptions to documentation requirements:
1. Two (2) samples where Section I Three Part Special Needs Determination or Barriers to Adoption of the AAP 4 form was not fully completed to support that the children have special needs.
2. Two (2) samples where there were no criminal record checks and a child abuse
and neglect registry check in the case files.
3. Two (2) samples where the children were an applicable child based on the Adoption Assistance Program Agreement and the child’s age; however, the applicable child section was not completed in the AAP 4 form.
Eligibility of Adoption Assistance Program cases is determined when the cases are initiated. No redetermination is required, and eligible children can receive benefits until the age of 18 (or 21 if they meet specific requirements). Therefore, documentation of eligibility determination for some cases was prepared in the late 1990s or early 2000s, and the children in those cases could receive benefits in FY 2017-18 since they had not reached the age of 18 (or 21). Prior to 2010, there were many deficiencies in DCFS’s documentation of eligibility determination for the program. In 2010, DCFS implemented procedures to improve the accuracy and completeness of their documentation. Two (2) of the six (6) samples noted in this finding are cases that were initiated prior to 2010. Recommendation We recommend that DCFS performs the following procedures:
1. Continue to strengthen their review process to ensure completeness on the AAP 4 - Eligibility Certification.
2. Maintain adequate documentation for adoption case files. Current Year Management Response Resource Family Support and Permanency Division The Department agrees with the recommendation. RFSPD will provide mandatory training for all managers by July 31, 2019 on the proper completion of all AAP documents and the importance of ensuring that all AAP forms are fully completed and accurate. To further strengthen the AAP documentation process, all staff and managers will receive a memo on the importance of ensuring that all AAP forms are fully completed and accurate

COUNTY OF LOS ANGELES STATUS OF PRIOR YEARS’ FINDINGS FOR THE YEAR ENDED JUNE 30, 2019
207
along with copies of the forms with instructions on completing them and areas where errors were found in this past review by June 30, 2019. Managers will review these forms with their staff to ensure understanding at least quarterly beginning July 1, 2019. RFSPD will initiate an e-learning on the proper completion of AAP forms by March 31, 2019 so that instructions can be available at any juncture needed. Also, the AAP Documents Custodian will add data elements to the log to ensure correction of errors found in review by June 30, 2019. In a joint effort with RE, by June 30, 2019 the AAP intake unit will review submitted requests to initiate AAP to immediately catch any errors prior to initiating the AAP. Revenue Enhancement Division The Revenue Enhancement Division (RED) continues the random sampling quality assurance review process for AAP cases to ensure the accuracy of the eligibility determination process. It is an ongoing task. In order to strengthen the AAP case review process a Memo was issued on June 6, 2018 requiring all AAP Eligibility Supervisors to thoroughly review Eligibility Determination Benefit Calculation (EDBC) results and return to the assigned Eligibility Workers for corrections prior to authorizing the EDBC results. The Revenue Enhancement Division continues to work with the Policy Section to finalize the revision of all AAP Procedural Guides and submit to the Policy Committee for final approval. AAP Policy # E050-0560 – AAP Freed Child and AAP Intake, # E050-0562 –AAP Reassessment/Post Adoption, and E050-0564 – AAP payment Resolution, are tentatively scheduled to be presented to the Policy Committee for approval on August 7, 2019. The last AAP policy piece – Procedural Guide #E050-0565 – Extended AAP Beyond the Age of 18 is in the process of revision. The Revenue Enhancement Division’s Management has developed and conducted a comprehensive AAP training covering all aspects of AAP eligibility and completion of frequently used forms on November 8, 2018. The Power Point presentation and Instructions for completion of forms were shared with the Eligibility Staff. RED will continue to identify the Eligibility Staff’s training needs and schedule and conduct additional trainings, as needed, to ensure full compliance with policies and procedures. Current Status as of June 30, 2019 Condition 1: Not implemented (see current year finding 2019-002) Condition 2: Not implemented (see current year finding 2019-002) Condition 3: Implemented
COUNTY OF LOS ANGELES STATUS OF PRIOR YEARS’ FINDINGS FOR THE YEAR ENDED JUNE 30, 2019
208
Finding 2018-006 – Subrecipient Monitoring CFDA #16.575 Crime Victim Assistance Condition During our review of the Crime Victim Assistance program, nine (9) subrecipients with active contracts during FY 2017-18 were selected for testing. The District Attorney’s Office (DA) indicated that they evaluated each subrecipient’s risk of noncompliance, but did not document their evaluations. The DA provided two types of documents that they reviewed as part of their risk assessment: (1) a copy of one (1) subrecipient’s audit report, which was performed by a public accounting firm and contained no findings related to the program and (2) for seven (7) subrecipients, letters were provided by two non-profit organizations indicating that the seven (7) subrecipients received funding from the State of California, Office of Emergency Services (Cal OES). However, no documented evaluations were provided. The DA’s office utilizes the 2015 and 2016 Subrecipient Handbook (Handbook) issued by the Cal OES as their subrecipient monitoring policies. The Handbook does not include a policy to perform a risk assessment to address the requirements in accordance with 2 CFR §200.331. In the absence of a documented evaluation of the risk of non-compliance for the program’s subrecipients, we were unable to determine whether one was performed for each subrecipient. Recommendation We recommend that the District Attorney’s Office document their risk assessment for subrecipients. Current Year Management Response The Los Angeles County District Attorney’s Office (LADA) has implemented the recommended corrective action plan by documenting the Department’s risk assessment for subrecipients using the form provided by the Auditor-Controller. Current Status as of June 30, 2019 Implemented

COUNTY OF LOS ANGELES STATUS OF PRIOR YEARS’ FINDINGS FOR THE YEAR ENDED JUNE 30, 2019
209
Finding 2018-007 – Special Test – Child Support Non-Cooperation CFDA #93.558 Temporary Assistance for Needy Families Condition During our review of sixty (60) cases, which the individuals did not cooperate in establishing, modifying, or enforcing a support order with respect to a child of the individual, we noted that the assistance payments for one (1) case was not reduced by at least 25 percent. Recommendation We recommend that DPSS strengthens their review process to ensure deductions to assistance payments are applied to individuals who do not cooperate in establishing, modifying, or enforcing a support order with respect to a child of the individuals. Current Year Management Response The Department released the Child Support Enforcement web-based training (WBT) on August 21, 2018. The training was mandatory for all CalWORKs eligibility staff and is also available on demand through the Learning Management System. Additionally, this training is provided to all new hires designated to the CalWORKs Program. Current Status as of June 30, 2019 Implemented Finding 2017-002 – Activities Allowed or Unallowed and Eligibility CFDA #93.658 Foster Care Title IV-E Condition During our review of sixty (60) case files for the Foster Care Title IV-E program (Program), we noted the following:
1. Based on the FC 2 and FC 3 eligibility determination forms completed by DCFS eligibility workers, four (4) children were determined to be ineligible for the Federal AFDC-FC aid but received foster care maintenance payments.
2. DCFS staff was unable to provide one (1) child’s court order or transcript of the
court proceedings to support the judicial determinations.
3. The foster care maintenance payment for one (1) child was less than the applicable rate per the rate schedule established by CDSS.

COUNTY OF LOS ANGELES STATUS OF PRIOR YEARS’ FINDINGS FOR THE YEAR ENDED JUNE 30, 2019
210
Recommendation We recommend that DCFS strengthens the review process over the Title IV-E foster care maintenance payments to ensure that only children eligible for Federal AFDC-FC aid receive benefits and payments are made in accordance with the CDSS foster care rate schedule. In addition, we recommend that DCFS implements procedures to ensure adequate documentation for foster care case files are maintained. Current Year Management Response As of February 1, 2018, the Quality Assurance personnel resumed the random review of foster care cases. On March 28, 2018, a memo was provided to all Revenue Enhancement eligibility staff to reinforce the need for a thorough review of accurate documentation to ensure the correctness of the eligibility determination, as well as a reminder to ensure that the rate amount reflects the CDSS Foster Care rate schedule. Current Status as of June 30, 2019 Implemented Finding 2017-006 – Special Tests – Child Support Non-Cooperation CFDA #93.558 Temporary Assistance for Needy Families Condition During our review of twenty five (25) cases, which the individuals did not cooperate in establishing, modifying, or enforcing a support order with respect to a child of the individual, we noted that the assistance payments for two (2) cases were not reduced by at least 25 percent. Recommendation We recommend that DPSS strengthens their review process to ensure deductions to assistance payments is applied to individuals who do not cooperate in establishing, modifying, or enforcing a support order with respect to a child of the individuals. Current Year Management Response The Department released the Child Support Enforcement web-based training (WBT) on August 21, 2018. The training was mandatory for all CalWORKs eligibility staff and is also available on demand through the Learning Management System. Additionally, this training is provided to all new hires designated to the CalWORKs Program. Current Status as of June 30, 2019 Implemented

COUNTY OF LOS ANGELES STATUS OF PRIOR YEARS’ FINDINGS FOR THE YEAR ENDED JUNE 30, 2019
211
Finding 2017-007 – Activities Allowed or Unallowed and Eligibility (DCFS) CFDA #93.659 Adoption Assistance Condition Of the sixty (60) samples selected for testing, we noted that the supporting documentation was missing or not complete as described below:
1. One (1) sample where Section I Three Part Special Needs Determination or Barriers to Adoption of the AAP 4 form was not fully completed to support that the child has special needs.
2. One (1) sample where the adoption assistance agreement was not signed by the
prospective adoptive parent.
3. Two (2) samples where there was no documentation of whether the children were an applicable child or a non-applicable child. Based on our review of the DCFS system, the two samples are determined as non-federal cases. However, the payments were recorded as federal expenditures.
Eligibility of Adoption Assistance Program cases is determined when the cases are initiated. No redetermination is required, and eligible children can receive benefits until the age of 18 (or 21 if they meet specific requirements). Therefore, documentation of eligibility determination for some cases was prepared in the late 1990s or early 2000s, and the children in those cases could receive benefits in FY 2016-17 since they had not reached the age of 18 (or 21). Prior to 2010, there were many deficiencies in DCFS’ documentation of eligibility determination for the program. In 2010, DCFS implemented procedures to improve the accuracy and completeness of their documentation. The samples noted in this finding are cases that were initiated prior to 2010. Recommendation We recommend that DCFS continues to strengthen their review process to ensure completeness on the AAP 4 - Eligibility Certification and to maintain adequate documentation for adoption case files. In addition, we recommend that DCFS strengthens their review process over payments to ensure that only cases eligible for federal aid were paid with federal funds.

COUNTY OF LOS ANGELES STATUS OF PRIOR YEARS’ FINDINGS FOR THE YEAR ENDED JUNE 30, 2019
212
Current Year Management Response Resource Family Support and Permanency Division The Resource Family Support and Permanency Division proactively began re-training staff in November 2017 on the proper completion of all AAP documents and the importance of ensuring that all AAP forms are fully completed and accurate. To further strengthen the process, all staff and managers received copies of the forms with instructions on completing them and areas where errors were found in this past review on March 14, 2018. Managers began reviewing these forms with their staff to ensure understanding on March 15, 2018. Also, the institution of the AAP Documents Custodian function in July 2016 has provided for a secondary quality assurance of all AAP documentation upon finalization of the adoption. As of March 1, 2019, the AAP Documents Custodian added three new data elements to the AAP Documentation Tracking logs to track when errors are noted post finalization, when the CSW, SCSW and ARA are notified/enlisted to assist in correcting the errors, and when/if corrections are received. Revenue Enhancement Division The Revenue Enhancement Division continues to work with the Policy Section to finalize the revision of all AAP Procedural Guides and submit to the Policy Committee for final approval. AAP Policy # E050-0560 – AAP Freed Child and AAP Intake, # E050-0562 –AAP Reassessment/Post Adoption, and E050-0564 – AAP payment Resolution, are tentatively scheduled to be presented to the Policy Committee for approval on August 7, 2019. The last AAP policy piece – Procedural Guide #E050-0565 – Extended AAP Beyond the Age of 18 is in the process of revision. The Revenue Enhancement Division continues the random sampling Quality Assurance Process of AAP cases that was resumed in 2018 to ensure that the Eligibility Staff is in compliance with policies and procedures. The Revenue Enhancement Division’s Management has developed and conducted a comprehensive AAP training covering all aspects of AAP eligibility and completion of frequently used forms on November 8, 2018. The Power Point presentation and Instructions for completion of forms were shared with the Eligibility Staff. Current Status as of June 30, 2019 Condition 1: Not implemented (see current year finding 2019-002) Condition 2: Not implemented (see current year finding 2019-002) Condition 3: Implemented

COUNTY OF LOS ANGELES STATUS OF PRIOR YEARS’ FINDINGS FOR THE YEAR ENDED JUNE 30, 2019
213
Finding 2017-009 – Subrecipient Monitoring CFDA #17.258, 17.259, 17.278 Workforce Innovation and Opportunity Act Cluster Condition During our review of the Workforce Innovation and Opportunity Act (WIOA) Cluster, we selected eight subrecipient samples with active contracts during Fiscal Year 2016-17 and noted that the Department of Workforce Development, Aging and Community Services (WDACS) did not perform the following:
1. WDACS was not able to provide complete documentation to indicate all required federal award information was communicated to the subrecipients.
a. Eight (8) subrecipient files were missing communication of the DUNS number,
Federal Award Date, Total Amount of Federal Award, and identification of whether the award is R&D.
b. Seven (7) subrecipient files were missing communication of the Federal Award Identification Number (FAIN).
c. Four (4) subrecipient files were missing communication of the federal award project description, terms and conditions concerning the closeout of the award, and verbiage indicating a requirement that the subrecipient permits the pass-through entities and auditors to have access to the subrecipient’s records and financial statements.
d. Five (5) subrecipient files were missing the CFDA number and name. e. Three (3) subrecipient files were missing the indirect cost rate for the federal
award.
2. WDACS provided printouts from the System for Award Management (SAM) to indicate that the eight subrecipients were not suspended or debarred. However, we noted that the printouts from SAM were not dated. Therefore, we were not able to verify that verification of suspension and debarment was performed before entering into a contract with the subrecipient.
3. Two (2) out of the eight (8) subrecipients were not monitored by WDACS. Recommendation We recommend that WDACS performs the following procedures:
1. Comply with the requirements specified in 2 CFR §200.331. 2. Maintain documentation of when verification of suspension and debarment was
performed or add a clause to a contract that subrecipientss certify they are not suspended or debarred by signing the contract.
3. Strengthen subrecipient monitoring tracking process to ensure all subrecipients are monitored during each fiscal year.

COUNTY OF LOS ANGELES STATUS OF PRIOR YEARS’ FINDINGS FOR THE YEAR ENDED JUNE 30, 2019
214
Current Year Management Response As of June 30, 2018, WDACS has completed implementation of all CAPs. Therefore, the CAPs for these recommendations have been completed. Current Status as of June 30, 2019 Implemented Finding 2017-011 – Level of Effort CFDA #93.069 Public Health Emergency Preparedness Condition
During our review of the Public Health Emergency Preparedness program, we noted that the FY 2016-17 expenditures for public health security were less than the average level of such expenditures maintained by the County’s Department of Public Health (DPH) for the preceding two year period. Recommendation We recommend that DPH continues to work toward achieving expenditure levels that will meet the grant requirement. When DPH is unable to meet the requirement, DHS should obtain written approval from the grantor agency waiving such requirement. Current Year Management Response EPRD determined that public health had eligible expenditures toward health security that could have been counted toward Level of Effort maintenance. Since the audit finding, EPRD has worked with Operations Support Bureau (OSB) Finance Division to ensure that all eligible costs are accounted for and reported, and DPH has not fallen below grantor requirements for Level of Effort for FY 2017-18 and 2018-19. Current Status as of June 30, 2019 Implemented

COUNTY OF LOS ANGELES STATUS OF PRIOR YEARS’ FINDINGS FOR THE YEAR ENDED JUNE 30, 2019
215
Finding 2016-002 CFDA #93.659 Adoption Assistance Finding 2015-002 CFDA #93.659 Adoption Assistance Finding 2014-004 CFDA #93.659 Adoption Assistance These findings do not warrant further action and are removed as they meet the following criteria per 2 CFR §200.511(b)(3):
1. Two years have passed since the audit report in which the finding occurred was submitted to the Federal Audit Clearinghouse;
2. The federal agency or pass-through entity is not currently following up with the auditee on the audit finding; and
3. A management decision was not issued.

216
This page left blank intentionally.

COUNTY OF LOS ANGELESDEPARTMENT OF PUBLIC SOCIAL SERVICES
SUPPLEMENTARY SCHEDULE OF REVENUE AND EXPENDITURES CSBG CONTRACT NO. 18F-5021
FOR THE YEAR ENDED JUNE 30, 2019
CFDA #93.569
January 1, 2018 July 1, 2018
through through Total Total
June 30, 2018 May 31, 2019 Costs Budget(1)
REVENUE
Grant Revenue 2,149,938$ 3,992,036$ 6,141,974$ 6,141,974$
CSBG Discretionary 35,000 35,000 35,000 Interest Income - - - 500 (3)
Total Revenue 2,149,938 4,027,036 6,176,974 6,176,974 (4)
EXPENDITURES(2)
Administrative Costs
Salaries and Wages 114,387 258,824 373,211 373,211
Fringe Benefits 69,409 152,294 221,703 221,703
Operating Expenses 303 13,096 13,399 13,399
Out-of-State Travel 1,485 6,515 8,000 8,000
Other CostsIndirect Cost/Other Costs 37,470 81,393 118,863 118,863
Total Administrative Costs 223,054 512,122 735,176 735,176
Program Costs
Salaries and Wages 193,248 559,856 753,104 753,104
Fringe Benefits 90,835 298,925 389,760 389,760
Operating Expenses - - - -
Out-of-State Travel - - - -
Other Costs
Indirect Costs/Other Costs 59,101 167,166 226,267 226,267 Subcontractor Services 86,417 3,986,250 4,072,667 4,072,667
Total Program Costs 429,601 5,012,197 5,441,798 5,441,798
Total Expenditures 652,655 5,524,319 6,176,974 6,176,974
Revenue over (under) Expenditures 1,497,283$ (1,497,283)$ -$ -$
(1)
(2)
(3)
(4)
Total Budget amounts are based on the CSBG Contract Budget Summary contained in the contract (as an Attachment to the Grant Agreement) with year-end budget shifts. The interest earned on the Advance in excess of $500 was remitted to the U.S. Department of Health and Human Services.
The Expenditure amounts are based on the monthly California Department of Community Services and Development Expenditure Claim Reports filed with the California Department of Community Services and Development.
An administrative claim for $500 to utilize the interest earned on the Advance was filed separately on the close-out claim.
The total revenue budget of $6,176,974 does not include the $500 interest income.
217

COUNTY OF LOS ANGELESDEPARTMENT OF PUBLIC SOCIAL SERVICES
SUPPLEMENTARY SCHEDULE OF REVENUE AND EXPENDITURES CSBG CONTRACT NO. 19F-4021
FOR THE YEAR ENDED JUNE 30, 2019
CFDA #93.569
January 1, 2019
through Total Total
June 30, 2019 Costs Budget(1)
REVENUE
Grant Revenue 2,362,258$ 2,362,258$ 6,072,078$
CSBG Discretionary (has a separate contract this year) - - - Interest Income - - -
Total Revenue 2,362,258 2,362,258 6,072,078
EXPENDITURES(2)
Administrative Costs
Salaries and Wages 102,729 102,729 365,128
Fringe Benefits 63,578 63,578 215,426
Operating Expenses 2,259 2,259 14,900
Out-of-State Travel 1,578 1,578 8,000
Other CostsIndirect Cost/Other Costs 34,092 34,092 116,111
Total Administrative Costs 204,236 204,236 719,565
Program Costs
Salaries and Wages 208,420 208,420 740,727
Fringe Benefits 114,400 114,400 392,586
Operating Expenses - - -
Out-of-State Travel - - -
Other Costs
Indirect Costs/Other Costs 69,182 69,182 226,600 Subcontractor Services 248,000 248,000 3,992,600
Total Program Costs 640,002 640,002 5,352,513
Total Expenditures 844,238 844,238 844,238
Revenue over Expenditures 1,518,020$ (3) 1,518,020$ 5,227,840$ (4)
(1)
(2)
(3)
(4)
The expenditure and total budget amounts are based on the Community Services Block Grant (CSBG) Contract Budget Summary contained in the contract (as Attachment I to the Grant Agreement.) The contract budget amounts are from January 1, 2019 through December 31, 2019.
The expenditure amounts are based on monthly CSBG Expenditure Claim Reports filed with the California Department of Community Services and Development (CSD) from January 1, 2019 through June 30, 2019.
Revenue over Expenditures represents the balance of CSD program advances at the end of Fiscal Year (FY) 2018-19. The amount will be applied to FY 2019-20 CSD expenditure claims.
This amount represents the grant balance of Contract 19F-4021 that will be expended during FY 2019-20.
218

COUNTY OF LOS ANGELESWORKFORCE DEVELOPMENT, AGING AND COMMUNITY SERVICESSUPPLEMENTARY SCHEDULE OF REVENUE AND EXPENDITURES
CSBG CONTRACT NO. 18F-5105FOR THE YEAR ENDED JUNE 30, 2019
CFDA #93.569
January 1, 2018 July 1, 2018
through through Total Total
REVENUE June 30, 2018 May 31, 2019 Costs Budget
Grant Revenue 93,377$ 192,815$ 286,192$ 288,147$ Interest Income - 500 500 (1) -
Total Revenue 93,377 193,315 286,692 288,147
EXPENDITURES
Administrative Costs
Salaries and Wages - - - -
Fringe Benefits - - - -
Operating Expenses - - - -
Equipment - - - -
Out-of-State Travel - - - -
Subcontractor Services - - - -
Other Costs - - - -
Total Administrative Costs - - - -
Program Costs
Salaries and Wages 2,318 18,682 21,000 21,000
Fringe Benefits 2,550 8,450 11,000 11,000
Operating Expenses - 9,000 9,000 9,000
Equipment - - - -
Out-of-State Travel - - - -
Subcontractor Services 88,509 156,683 245,192 247,147
Other Costs - - - -
Total Program Costs 93,377 192,815 286,192 288,147
Total Expenditures 93,377 192,815 286,192 288,147
Revenue over Expenditures -$ 500$ 500$ -$
(1) Interest earned on advances.
219

COUNTY OF LOS ANGELESWORKFORCE DEVELOPMENT, AGING AND COMMUNITY SERVICESSUPPLEMENTARY SCHEDULE OF REVENUE AND EXPENDITURES
CSBG CONTRACT NO. 18F-5105 DISCRETIONARYFOR THE YEAR ENDED JUNE 30, 2019
CFDA #93.569
July 1, 2018
through Total Total
May 31, 2019 Costs Budget
REVENUE
Grant Revenue 33,203$ 33,203$ 35,000$ Interest Income - - -
Total Revenue 33,203 33,203 35,000
EXPENDITURES
Administrative Costs
Salaries and Wages - - -
Fringe Benefits - - -
Operating Expenses - - -
Out-of-State Travel - - -
Other CostsIndirect Cost/Other Costs - - -
Total Administrative Costs - - -
Program Costs
Salaries and Wages - - -
Fringe Benefits - - -
Operating Expenses 18,203 18,203 20,000
Out-of-State Travel - - -
Other Costs
Indirect Costs/Other Costs - - - Subcontractor Services 15,000 15,000 15,000
Total Program Costs 33,203 33,203 35,000
Total Expenditures 33,203 33,203 35,000
Revenue over Expenditures -$ -$ -$
220

COUNTY OF LOS ANGELESWORKFORCE DEVELOPMENT, AGING AND COMMUNITY SERVICESSUPPLEMENTARY SCHEDULE OF REVENUE AND EXPENDITURES
CSBG CONTRACT NO. 19F-4105FOR THE YEAR ENDED JUNE 30, 2019
CFDA #93.569
January 1, 2019
through Total Total
June 30, 2019 Costs Budget
REVENUE
Grant Revenue 122,779$ 122,779$ 284,472$
Interest Income - - -
Total Revenue 122,779 122,779 284,472
EXPENDITURES
Administrative Costs
Salaries and Wages - - -
Fringe Benefits - - -
Operating Expenses - - -
Out-of-State Travel - - -
Other Costs
Indirect Cost/Other Costs - - -
Total Administrative Costs - - -
Program Costs
Salaries and Wages 5,408 5,408 17,375
Fringe Benefits 2,906 2,906 9,097
Operating Expenses - - 2,000
Out-of-State Travel - - -
Other Costs
Indirect Costs/Other Costs - - -
Subcontractor Services 114,465 114,465 256,000
Total Program Costs 122,779 122,779 284,472
Total Expenditures 122,779 122,779 284,472
Revenue over Expenditures -$ -$ -$
221

COUNTY OF LOS ANGELESWORKFORCE DEVELOPMENT, AGING AND COMMUNITY SERVICES
SUPPLEMENTARY SCHEDULE OF EXPENDITURES OF FEDERAL AND STATE AWARDSGRANTED BY CALIFORNIA DEPARTMENT OF AGING
FOR THE YEAR ENDED JUNE 30, 2019
Single Audit
Federal State Total
Grant Name CFDA # Expenditures Expenditures Expenditures
Older American Title V Project 17.235 1,244,740$ -$ 1,244,740$
Area Agency on Aging HICAP (H9 Fed) 93.324 205,125 - 205,125
Area Agency on Aging HICAP (H3 Fed and H12 State) 93.324 77,271 626,584 703,855
Financial Alignment (FA 1718-19) 93.626 63,660 - 63,660
Medicare Improvement for Patients and Providers Act (MI1718-19) 93.071 2,968 - 2,968
Medicare Improvement for Patients and Providers Act (MI1819-19) 93.071 114,201 - 114,201
Supplemental Nutrition Assistance Program - Education (SNAP-Ed) - (SP1718-19) 10.561 18,028 - 18,028
Supplemental Nutrition Assistance Program - Education (SNAP-Ed) - (SP1819-19) 10.561 184,937 - 184,937
TOTAL OTHERS 1,910,930 626,584 2,537,514
Ombudsman Volunteer Recruitment Initiative (1)
- 511,035 511,035
Area Agency on Aging Title III E 93.052 3,029,604 - 3,029,604
Area Agency on Aging III B 93.044 6,788,335 234,148 7,022,483
Title VII - Ombudsman 93.042 127,791 - 127,791
Area Agency on Aging III C-I 93.045 6,923,508 608,888 7,532,396
Area Agency on Aging III C-II 93.045 5,439,563 732,550 6,172,113
Title VII - Elder Abuse Prevention 93.041 85,269 - 85,269
Area Agency on Aging III D 93.043 551,555 - 551,555
Area Agency on Aging III USDA C-I 93.053 951,194 - 951,194
Area Agency on Aging III USDA C-II 93.053 748,177 - 748,177
TOTAL TITLE III AND VII 24,644,996 2,086,621 26,731,617
TOTAL 26,555,926$ 2,713,205$ 29,269,131$
(1) This grant does not have a CFDA number and it is 100% State of California funded.
222