Embed Size (px)
Citation preview


Fixed Income Update
Jason Weiner, Germán Gaymer, Jacob BowlandSeptember 23, 2021

Fixed Income: Overview
1
The Fixed Income asset class provides Trust Fund diversification.
IPS Objective for the Core Fixed Income Portfolio:“The core fixed income asset class diversifies the risk of the overall investment portfolio with asecondary goal of capital preservation. The overall objective is to exceed its benchmarkperformance net of fees over rolling five-year periods.”
IPS Objective for the Non-Core Fixed Income Portfolio:“The NCFI asset class diversifies the risk of the overall investment program and is designed toprovide both income and capital appreciation. The overall objective is to exceed its benchmarkperformance net of fees over rolling five-year periods.”

Fixed Income: Overview
2
The Fixed Income Asset Class is separated into two portfolios each with distinct investment goals:
1) Core Capital Preservation
2) Non-Core Income and Capital Appreciation

The Fixed Income Market
3
• The fixed income market represents an investable market of over $125 trillion globally.• The private credit fixed income market surpassed $1 trillion and is an important source of diversification by
generating unique sources of return.• Staff along with our investment consultants conduct extensive due diligence to identify best in class managers to
build a well diversified portfolio to achieve our investment goals.

Fixed Income Portfolios
4

5
Fixed Income Performance and Goals
Core Fixed Income Performance Goals:
Exceed the Bloomberg Barclays US Aggregate Bond Index net of fees over rolling five-year periods.
Non-Core Fixed Income Performance Goals:
Exceed its benchmark performance net of fees over rolling five-year periods.
Measures of success are portfolio construction: identify best in class managers, balance concentration and diversification, ensure sufficient strategy diversification, etc.
Data as of July 31, 2021 as reported by SSB
1 Yr. 3 Yrs. 5 Yrs. 10 Yrs. 20 Yrs. 30 Yrs. ITD Inception Date
Effective Date
CORE FIXED INCOME -0.35 6.09 3.50 3.59 5.35 6.97 7.34 1/1/1989 7/31/2021TMRS - Total Fixed Income Index (Daily) (TEXTFID) -0.70 5.73 3.13 3.35 4.88 6.43 6.82Excess 0.35 0.37 0.37 0.24 0.47 0.54 0.52
1 Yr. 3 Yrs. 5 Yrs. ITD Inception Date
Effective Date
NON-CORE FIXED INCOME 12.06 6.05 5.94 4.90 10/1/2014 7/31/2021TOTAL NON-CORE FI WEIGHTED INDEX (TMRS0A11) 12.82 5.51 5.29 4.18Excess -0.76 0.53 0.65 0.72

3rd Quarter Update
6
Rebalances:Completed two portfolio rebalance transactions:
1) Liquidated the $780 million Core-Plus portfolio and rebalanced proceeds across six NCFI managers.> Staff negotiated fee reductions with several NCFI managers given increased portfolio size.
2) Liquidated $1.1 billion in the Core portfolio and rebalanced into Global Public Equities.
Investment Pacing:• Completed two portfolio recommendations for opportunistic credit managers.
1) Closed documentation for $250 million commitment for a distressed credit fund.2) Negotiating documentation for a $250 million commitment for a European private credit fund.
• Implemented the liquidation for a structured credit manager.• NCFI portfolio will be at target on an invested basis.• Expect to deploy approximately $1.2 billion in 2022 across complementary public and private credit strategies
to keep the NCFI portfolio at target of 20% of the total TMRS portfolio.• Continue to assess investments in the expansive private credit opportunity set to potentially achieve a
strategic allocation of approximately 10% of the total TMRS portfolio.

Administrative Summary
7
Core Management Fee on 2020 Net Asset Value
0.07%
Total Fixed IncomeManagers
21
0.59%NCFI Management Fee on
2020 Net Asset Value

Private Equity Update
Tom MasthaySeptember 23, 2021

Achieving PE Strategic Goals
2
Performance Scale Cost Reduction
Outperform Public Equities
Achieve 10% Target Allocation
Reduce Program Costs
Scaling of co-investments is reducing program costs.
Expect to achieve 10% target in early 2024, possibly sooner.
Portfolio is outperforming on all relevant metrics.

Performance
3
TMRS has more than $200 million in the Trust Fund because of its decision to invest in PE instead of TMRS’ public equity benchmark.
TMRS’ PE portfolio has earned a 24.6% cash-weighted return inception-to-date (December 2015). TMRS’ public equity benchmark earned 12.2% over the same period.
TMRS’ PE portfolio is outperforming all relevant industry metrics, including peer universes and passive manager selection.

4
PE Performance vs. MSCI ACWI IMI
54.0%
25.8% 24.5% 24.2%
57.6%
11.9% 13.2% 12.2%
0.0%
10.0%
20.0%
30.0%
40.0%
50.0%
60.0%
TMRS - Total PE ACWI IMI
1yr. 3yr. 5yr. Inception-to-DateDecember 2015
IRR
TMRS Private Equity Performance vs. MSCI ACWI IMICash-Weighted as of 6/30/21
TMRS’ PE portfolio has achieved meaningful long-term return premiums relative to its public equity benchmark.

Scale: Invested Capital
5
3.97% YE 2020
5.76% as of 9/10/21
~6.3% Projected 9/30/21
10% Portfolio Target
Future %Historical %
Left axis in $ millions
$2.3 billionestimated 9/30/21 Net Asset Value
$776 millionNet Asset Value Increase Year-to-Date
$207 million net capital called since 6/30/21
TMRS controls when capital is committed. TMRS’ PE managers control when capital
is invested.

Scale: Commitment Pacing
6
Pre-2020 Avg.
2020
2021 original
2021 updated
Historical Pacing Plan
$1.2 billionYear-to-Date new commitments
(15 investments)
$175 million since August Board meeting
(2 investments)
Left axis in $ millions
2021 has been the most active year in the history of TMRS’ PE portfolio.

Cost Reduction
Fee savings comparisons are vs. industry averages. Industry averages fees source:Paul, Weiss, Rifkind, Wharton & Garrison, LLP. Industry avg. carried interest is20.6%, TMRS prior portfolio was 20.2%, TMRS LTM portfolio was 16.6%. $ savingsestimate over the entire lives of investment vehicles. Right axis in $ millions. 7
$560 milliondedicated co-invest commitments
in the last twelve months
$208 millioninvested/approved into 13 deals
Year-to-Date
TMRS’ PE program is cost conscious throughout.
Co-investments meaningfully reduce program costs.

Administrative Summary
8
Management fee on 2020 PE Net Asset Value
2.14% Management fees will fall as a percentage of private equity net asset value over time. This is because fees on committed capital not yet invested will become less prevalent.
Private Equity Managers
39 Private equity manager count is higher than other asset classes due to industry structure. TMRS maintains a modest number of relationships compared to its peer plans.

Real Estate Update
Eddie SchultzSeptember 23, 2021

Real Estate: 2021 Goals
2
Pacing Core Portfolio Cost Reduction
Increase Commitment Pacing
Rebalance Core Portfolio
Reduce Program Costs
Strategic partnerships are all actively deploying capital. Negotiations underway in
commingled portion of portfolio.
Capital being actively deployed from first stage of rebalancing.
To achieve the newly adopted asset allocation targets real estate pacing will need to
temporarily increase.

Pacing Plan
3
The newly adopted asset allocation moved the target from 10% to 12% of the Trust Fund.
To achieve this target, staff will increase 2021 pacing from $800mm to $1,200mm.
In 2022, we expect pacing to return to $800mm per year.

Performance
4Period Ending June 30, 2021 (Source SSB)
1 Yr. 3 Yrs. 5 Yrs. 7 Yrs. Since Inception
TMRS Real Estate 4.83% 5.67% 7.61% 9.24% 9.41%
ODCE Benchmark 2.40% 4.88% 6.20% 8.25% 9.51%
Excess 2.43% 0.78% 1.41% 1.00% -0.10%
During the pandemic of 2020, TMRS saw real estate valuations pullback due to uncertainty within theoverall economy. Beginning in late 2020, and well into Q3 of 2021, we have seen portfolio values bounceback in rapid fashion, now once again exceeding the benchmark for shorter time periods early indicationsfrom Q2 show an increasing spread between our portfolio and the benchmark.

Administrative Summary
5
Management fee on 2020 Real Estate Net Asset Value
1.48% Management fees will remain steady over time with increases coming from periods of outperformance.
Real Estate Managers
28 Real Estate is a mature asset class. The number of managers will fluctuate between 25-35 as new partners come online and old partners sell remaining assets.

Other Public & Private Markets Update
Eddie SchultzSeptember 23, 2021
OPPM: Some History
2
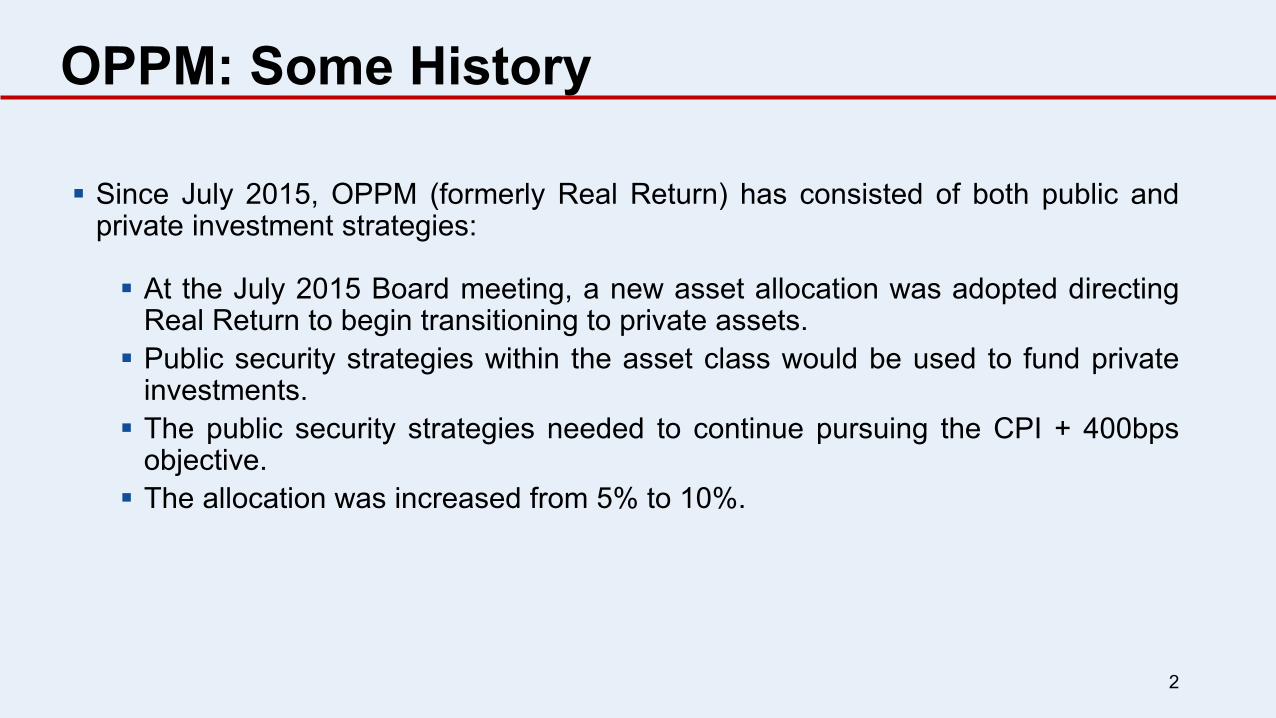
Since July 2015, OPPM (formerly Real Return) has consisted of both public andprivate investment strategies:
At the July 2015 Board meeting, a new asset allocation was adopted directingReal Return to begin transitioning to private assets. Public security strategies within the asset class would be used to fund private
investments. The public security strategies needed to continue pursuing the CPI + 400bps
objective. The allocation was increased from 5% to 10%.

OPPM: Some History (cont’d)
3
At the June 2021 Board meeting, a new asset allocation and benchmarking structurewas adopted:
“Real Return” was renamed “Other Public & Private Markets.” The long-term return target of CPI + 400bps was removed and the benchmark was
changed to the MSCI ACWI. The allocation was increased from 10% to 12% of the Trust Fund.

OPPM: Some History (cont’d)
4
Throughout, Real Return / Other Public & Private Markets has kept the sameinvestment objective:
Uncorrelated private investments that provide excess return.
Other Public & Private Markets provides exposure to private assets that arefrequently overlooked by traditional private equity but provide excellent downsideprotection while enhancing return.

OPPM Portfolio
5
Private Markets Currently 4.1% of Trust Fund Will reach target allocation of 12% in Q4
2024 (estimated) Target Investment Types:
Infrastructure (Roads, power, etc…) Mining (Copper, lithium, etc…) Energy (Oil & Gas) Agriculture Other (Telecom, healthcare, etc..)
Public Markets Currently 7.2% of Trust Fund Will be reduced to 0% as private
markets call capital to fund commitments.
In Q3 the public market strategies were moved from targeting CPI + 400bps to a passive MSCI ACWI target. This change will greatly reduce fees
and simplify the funding process for private markets.

Pacing Plan
6
The newly adopted asset allocation moved the target from 10% to 12% ofthe Trust Fund. To achieve this target, staff will increase 2021 pacing from $800mm to
$1,200mm. Beginning in 2022, pacing will increase to $1,500mm in order to reach
12% in a timely manner.

Performance
7Period Ending June 30, 2021 (Source SSB)
All Strategies 1 Yr. 3 Yrs. 5 Yrs. 10 Yrs. Since Inception
Public (64%) 23.92% 6.38% 5.25% 3.84% 4.22%
Public Benchmark 22.78% 5.82% 5.22% 3.61% 4.15%
Private (36%) 19.84% 10.83% 9.67% - 9.67%
Private Benchmark 19.84% 10.83% 9.67% - 9.67%
Total Performance 22.64% 6.78% 5.60% 4.07% 4.44%
Total Benchmark 20.12% 5.67% 5.24% 3.71% 4.24%%
Over the last 12 months, public market assets have bounced back quickly after the sharp downturn at thebeginning on the pandemic. The private portion of portfolio provided stability during that time and hassince performed very well, with mining and infrastructure assets benefitting from economic growth.

Administrative Summary
8
Management fee on 2020 OPPM
Net Asset Value
0.90% Management fees will increase as a percentage of OPPM net asset value as the portfolio moves toward private assets.
OPPM Managers
18 OPPM managers will increase over the near term as the portfolio continues the move toward being entirely private assets.

Global Public Equity
Kevin Notaro, Timothy Sweeney & Frank Atkins
September 23, 2021

Why TMRS Invests in Global Public Equity
2
Global Public Equity provides strong returns, liquidity and broad geographical
exposure with a high level of transparency.
Returns – Generates a consistent income stream of dividends and capital appreciation
Liquidity – Equities can be purchased and sold quickly, allowing access to cash and
portfolio rebalancing
Global Exposure – Provides exposure to some of the largest and most successful
companies across different geographies and sectors

Global Public Equity: Overview
3
Total assets are $14.1B, 38.5% of the total TMRS Trust Fund
Global Public Equity has a blended approach of passive and active strategies:
80% Passive Equity - The passive equity portfolio serves as a diversified core component.
20% Active Equity - The active equity portfolio allows for alpha opportunities.
This combination reduces fees and allows for excess risk adjusted returns.

TMRS Passive and Active Strategy
4
Northern Trust U.S. Index Fund, 63.2%
Northern Trust International/EM Index Fund, 36.8%
Global Public Equity - Passive Strategies
Northern Trust U.S. Index Fund
Northern Trust International/EM Index Fund
Approximately $11.4 Billion or 81% of Global Public Equity
23.1%
19.8%
13.3%
18.2%
12.5%
13.2%
Global Public Equity - Active Strategies
U.S. Mid Cap U.S. Small Cap International Large Cap
International Small Cap Emerging markets Emerging markets
Approximately $2.7 Billion or 19% of Global Public Equity
Two Passive Managers Six Active Managers 2020 Management Fees: 15bps

Performance Summary
5
As of September 8, 2021, the Global Public Equity Portfolio was up 16.2%year to date (benchmark at 16.3%)
59% of the Portfolio is U.S. – Up 19.4% year to date (benchmark at 20.1%)
41% of the Global Equity Portfolio is Non-U.S. – Up 11.0% year to date (benchmark at11.1%)
2022 Goals
6
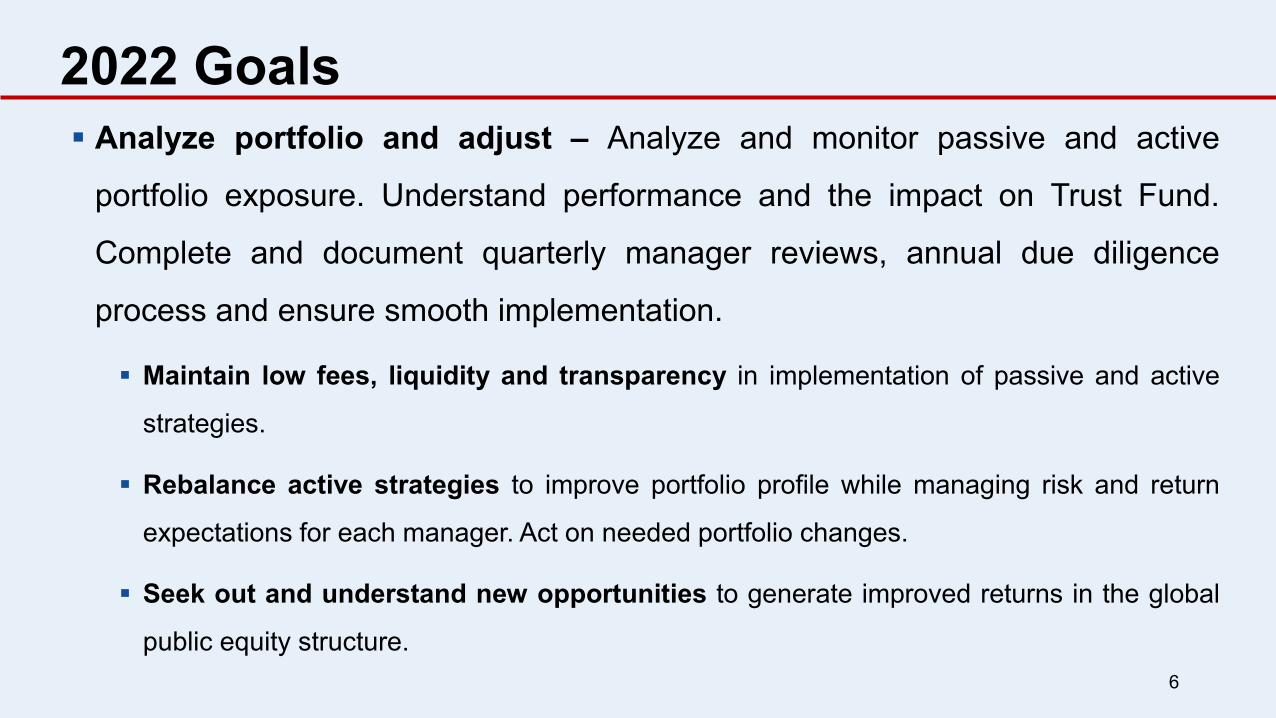
Analyze portfolio and adjust – Analyze and monitor passive and active
portfolio exposure. Understand performance and the impact on Trust Fund.
Complete and document quarterly manager reviews, annual due diligence
process and ensure smooth implementation.
Maintain low fees, liquidity and transparency in implementation of passive and active
strategies.
Rebalance active strategies to improve portfolio profile while managing risk and return
expectations for each manager. Act on needed portfolio changes.
Seek out and understand new opportunities to generate improved returns in the global
public equity structure.

Hedge Funds
Kevin Notaro, Timothy Sweeney & Frank Atkins
September 23, 2021

Moving Towards the 5% Allocation Target
2
June 24th board meeting led to a tight turnaround for redemptions that needed to be
submitted by quarter-end
Submitted three partial redemptions with funds that had longer dated liquidity provisions
Further redemption from a manager was submitted in July for the end of the third quarter
Global macro manager completed its full redemption on June 30th, returning capital in July
Currently working on at least five additional redemptions for year-end
New subscription finalized prior to the June board meeting, began drawing capital in July
Moved an opportunistic equity manager into the Hedge Fund portfolio

Albourne Update
3
Staff continued to work with Albourne analysts to better
understand ratings that were Average (C) or below
Further communication was completed or is ongoing with the
respective portfolio funds
14 of the 15 target managers have IDD and ODD ratings that are Above
Average (B) or better
The TMRS team has worked with Albourne and the investment
manager of the remaining fund with an Average (C) ODD rating

Hedge Fund Strategy
4
Goal: Reduce Hedge Fund assets from 10% to 5%
Retain Top Managers – Selectively reduce underperforming fund managers and target a
final portfolio with 15 of our best performing Hedge Funds
Portfolio Returns – Increase returns by retaining top managers and migrating away
from a ‘fixed income replacement’ strategy
Portfolio Risk – Maintaining diversification benefits, while gradually allowing volatility to
increase as the Hedge Fund portfolio becomes more concentrated

Performance Update
5
Benchmark Change: The Hedge Fund benchmark changed on July 1st
New benchmark going forward is the HFRI Asset Weighted Composite
24 Managers
2020 Management Fees: 140bps
Market Value 3 Month YTD 1 Yr. 3 Yrs. 5 Yrs. ITD TMRS Hedge Fund Portfolio 3,516,669,790 2.22 0.52 11.65 5.52 6.65 5.64HFRI FUND OF FUNDS: DIVERSIFIED INDEX 2.67 4.56 16.90 6.26 5.87 4.86Excess -0.44 -4.04 -5.25 -0.74 0.79 0.78
2016 2017 2018 2019 2020 2021 YTDTMRS Hedge Fund Portfolio 1.16 11.83 0.36 7.02 10.71 0.52HFRI FUND OF FUNDS: DIVERSIFIED INDEX 0.45 6.87 -3.29 8.10 10.62 5.09Excess 0.71 4.96 3.65 -1.08 0.09 -4.57