Embed Size (px)
Citation preview

Fixed Income Special
European High Yield Non-Food Retail
Author:
Jannik Prochnow
Analyst
+49 69 913090 595
19 February 2015

Overview
1. Recommendation and spreads 3
2. Company profiles 7
2.1 Hornbach Baumarkt 8
2.2 Maisons du Monde 16
2.3 BUT 23
2.4 Dufry 37
3. Appendix: Macroeconomic environment 36
4. Disclaimer 43
5. Contacts 51
19/02/2015 2

2. Recommendation and spreads

Company initiations*
Overweight on MdM and Dufry, marketweight on Hornbach
Recommendations:
(Screening Coverage)
Berenberg initiates on Dufry’s 07/22 notes with an overweight rating. This is mainly based on
Dufry’s very strong market position and large scale as well as its high profitability. More particularly,
we like Dufry’s strong free cash flow profile although we note that FCF has been constrained by its
acquisitions. On the negative side, Dufry is highly dependent on global passenger flows and its
acquisition-driven growth strategy is reflected in high leverage ratios. However, we regard the
downside risks as limited and note that Dufry’s 07/22 bonds are trading at an attractive pick-up vs.
the double-B average.
4 Source: Berenberg FI Research; *Our recommendations are based on a fundamental analysis & a relative valuation based on market spreads
We see the strong market position and brand recognition as BUT’s key strengths. We also like the
company’s multichannel distribution strategy and its ability to gain market share. However, BUT has
relatively weak operating margins which makes it more vulnerable to a setback in consumer
demand, especially given its high leverage. Moreover, credit metrics are likely to remain under
pressure due to future acquisitions, including a potential acquisition of 18 franchisee stores. As BUT
has not provided us with the latest financial information, we are not in the position to provide a
recommendation on its notes.
Maisons du Monde has exhibited very strong sales growth in recent years despite challenging
market conditions. Furthermore, we like the company’s multi-channel approach with its unique
product offering. At the same time, MdM’s high leverage and the sales shift towards less profitable
furniture products weigh on its financial profile. Nonetheless, we believe that MdM will continue its
growth story and will be able to deleverage in the near to medium term, especially given
management’s deleveraging commitment. We therefore initiate on MdM’s 08/20 notes with an
overweight rating.
Berenberg initiates with a marketweight recommendation on Hornbach’s 02/2020 bond. We like the
company’s leading market positions, its very efficient megastore network and the increasing
international presence. However, we note that Hornbach operates in a highly seasonal, cyclical and
competitive market and is strongly leveraged. We regard deleveraging potential as limited in the
near future, especially due to higher capex requirements for the expansion of the store network.
Moreover, we believe that Hornbach’s sound financial policy is already reflected in current spread
levels.
HBMGR 3 ⅞ 02/20
Senior unsecured notes
Price / Z-spread / YTW:
110.0 / 146 / 1.8 (Pricing: 19/02/2015 BGN Close)
Marketweight
MDMFP 9 08/20
Senior secured notes
Price / Z-spread / YTW:
102.5 / 797 / 8.2 (Pricing: 19/02/2015 BGN Close)
Overweight
DUFSCA 4 ½ 07/22
Senior unsecured notes
Price / Z-spread / YTW:
107.0 / 269 / 2.8 (Pricing: 19/02/2015 BGN Close)
Overweight
BUTSAS 7 ⅜ 09/19
Senior secured notes
Price / Z-spread / YTW:
95.8 / 825 / 8.5 (Pricing: 19/02/2015 BGN Close)
No recommendation
19/02/2015

AAFFP 5 ⅝ 04/19
Senior secured notes
Ratings*: B2 / B / BB-
Price / Z-spread / YTW:
94.6 / 691 / 7.1 (Pricing: 19/02/2015 BGN Close)
Marketweight (08/12/2014 – Click here)
Recommendation overview within the HY retail sector
Current valuations of retailers offer some attractive entry opportunities
5 Source: Berenberg FI Research *Moody’s / S&P / Fitch
MDMFP 9 08/20
Senior secured notes
Ratings*: B2 / B / -
Price / Z-spread / YTW:
102.5 / 797 / 8.2 (Pricing: 19/02/2015 BGN Close)
Overweight (19/02/2015)
DUFSCA 4 ½ 07/22
Senior unsecured notes
Ratings*: Ba3 / BB+ / BB
Price / Z-spread / YTW:
107.0 / 269 / 2.8 (Pricing: 19/02/2015 BGN Close)
Overweight (19/02/2015)
HBMGR 3 ⅞ 02/20
Senior unsecured notes
Ratings*: Ba2 / BB+ / -
Price / Z-spread / YTW:
110.3 / 142 / 1.7 (Pricing: 19/02/2015 BGN Close)
Marketweight (19/02/2015)
DRTYLN 5 ⅞ 03/21
Senior unsecured notes
Ratings*: - / BB- / -
Price / Z-spread / YTW:
104.2 / 450 / 4.7 (Pricing: 19/02/2015 BGN Close)
Overweight (08/12/2014 – Click here)
THOEUR 7 ⅜ 07/19
Senior secured notes
Ratings*: B2 / B / -
Price / Z-spread / YTW:
102.0 / 652 / 6.7 (Pricing: 19/02/2015 BGN Close)
Overweight (08/12/2014 – Click here)
In our screening coverage
universe of European HY
retailers, we recommend to
overweight four and to
marketweight two retailers.
Even if the macroeconomic
conditions for European
retailers remain challenging,
we believe that the above-
average spreads can offer
very attractive entry points,
particularly given the expected
recovery in most parts of
Europe.
In our view, the following key
success factors for retailers
to remain competitive are:
- online presence or
multichannel distribution
strategy
(Darty & Maisons du Monde)
- international diversification
(Dufry & Hornbach)
- Efficient supply chain and
operating flexibility
(THOM Europe)
19/02/2015

DUFSCA 07/22
AAFFP 04/19
DRTYLN 03/21
BUTSAS 09/19
HBMGR 02/20
MDMFP 08/20
SMCPFP 06/20 THOEUR 07/19
0
100
200
300
400
500
600
700
800
900
1,000
0 1 2 3 4 5 6 7 8 9 10
Z-s
pre
ad
(in
bp
s)
Time to worst
Spread landscape*
Plenty shopping opportunities for investors within retailing
Furniture and homeware retail
bonds BUTSAS 09/19 and
MDMFP 08/20 offer the most
appealing spreads within our
observed universe.
On average, single-B
consumer bonds trade
approximately 50-150bp wider
than single-B non-financials.
(B) Consumer
(B) Non-Financials
(BB) Non Financials
6 Source: Bloomberg (19/02/2015), Berenberg Fixed Income Research; *Outliers not shown and excluded from curve estimation
BBB- Non Financials
19/02/2015
Spread performance
The better the rating, the better the performance
After a significant spread
widening in October, the
market has recovered
recently.
Double-B names performed
particularly well, with Dufry
and Hornbach outperforming
the market.
7 Source: Bloomberg (19/02/2015), Berenberg Fixed Income Research
75
80
85
90
95
100
105
110
115
120
125
130
01/09/2014 01/10/2014 01/11/2014 01/12/2014 01/01/2015 01/02/2015
Ind
exed
z-s
pre
ad
(01/1
0/2
014 =
100)
BofA ML B Corporates (OAS) BofA ML BB Corporates (OAS)BUTSAS 09/19 DUFSCA 07/22HBMGR 02/20 MDMFP 08/20
19/02/2015
2. Company profiles

2. Company profiles
2.1 Hornbach Baumarkt

Company data
Headquarter:
Bornheim (Germany)
Products:
Tools and hardware, building
materials, bathroom fittings and
tiles, paint, wall and floor
coverings, garden products
Major shareholders:
Hornbach Holding (76.4%)
Next financial release:
24/03/2015 (FY2014/15)
Trading statement
Bond data
Price / Z-spread / YTW:
110.0 / 146 / 1.8 (Pricing: 19/02/2015 BGN Close)
Callable:
No
Amount outstanding (€):
250m
Bond ratings:
Moody’s: Ba2 (positive)
S&P: BB+ (stable)
Covenants:
Covenant-lite package
Payment rank:
Senior unsecured
Hornbach Baumarkt
Investment thesis and company snapshot
Hornbach Baumarkt Recommendation:
HBMGR 3 ⅞ 02/20 (Bloomberg: HBMGR<Corp>) Marketweight
Weaknesses
• Highly seasonal and cyclical DIY market
• Challenging competitive environment, but less pressure
since bankruptcy of German competitor Praktiker
• High leverage (lease-adjusted)
Investment thesis Berenberg initiates with a marketweight recommendation on Hornbach’s 02/2020 bond. We like the company’s leading
market positions, its very efficient megastore network and the increasing international presence. However, we note that
Hornbach operates in a highly seasonal, cyclical and competitive market and is strongly leveraged. We regard deleveraging
potential as limited in the near future, especially due to higher capex requirements for the expansion of the store network.
Moreover, we believe that Hornbach’s sound financial policy is already reflected in current spread levels.
Selected Financials
Company Snapshot German Hornbach Baumarkt AG is a leading European do-it-yourself (DIY) retailer with a network of 147 stores in Europe, of
which 98 are based in Germany, representing c. 58% of sales. The company mainly focuses on operating >10,000sqm DIY
megastores combined with garden centres. In 2010, Hornbach successfully introduced an online platform in Germany,
followed by the launch of an online store in Austria 2013. The product range comprises over 50,000 products, which are
offered at permanently low prices, and primarily target DIY customers engaged in large construction or renovation projects.
Strengths
• Very efficient megastore concept, good online presence
• Leading market positions with increasing market shares
• Successful everyday low price strategy
• High customer loyalty and strong brand recognition
through original marketing campaigns
• Good and increasing international presence
€ m (FY ends 28 Feb) 2012 2013 2014 3Q2015
Net sales 3,001.0 3,020.0 3,152.0 2,669.8
Gross profit 1,122.9 1,127.7 1,178.1 1,013.0
EBITDA 184.3 155.8 161.0 182.7
Adj. net debt/EBITDAR 3.6x 4.2x 4.0x 3.6x*
EBITDA interest cover 7.3x 6.0x 9.6x 11.4x*
FCF (before dividends) -5.9 -21.6 60.7 91.0
10 Source: Company data, Bloomberg (19/02/2015), Berenberg FI Research *Based on estimated FY2015 EBITDA/R figures.
DUFSCA 07/22
BUTSAS 09/19
HBMGR 02/20
MDMFP 08/20
-200
0
200
400
600
800
1,000
0 2 4 6 8 10
Z-s
pre
ad
(in
bp
s)
Time to worst
19/02/2015

Opportunities
• Internationalisation: very
profitable European markets
(except for Germany)
• Not yet exploited potential for
online distribution
• Further market consolidation
in the mid to long term
• Cocooning as a social trend
Threats
• Continuing slow economic
recovery in Europe
• Intensifying competition in
German DIY market and other
European countries
Industry characteristics In general, a DIY retailer offers a broad range of products and solutions for the independent realization of home
improvements, in most cases targeted at private and professional consumers.
Europe is the second largest DIY market worldwide, following the US. Within Europe, Germany represents the largest DIY
market in terms of sales (c. €18.1bn in 2013). However, unlike other mature markets, the German DIY market is highly
fragmented with many regional players (comparably low market concentration in Germany with top 5 players holding roughly
70% of the market in terms of sales) and characterized by fierce price competition, causing persisting pressure on margins.
Online distribution could have important implications for the DIY market in the short to medium term. Compared to other
sectors, the DIY/home improvement industry still exhibits a relatively low level of online sales penetration and therefore
offers some potential for growth in the future.
0
10,000
20,000
30,000
-10%
0%
10%
20%
'02 '04 '06 '08 '10 '12 '14 '16
Shipping development
Demand (world container trade, Y/Y)Supply (containership fleet development, Y/Y)Aver. containership earnings* (rhs, USD/day)
Industry forces
Hornbach Baumarkt
The German DIY retail market
Preferred purchasing channel by various sectors (2012) Market share by DIY retailer in Germany (2013)
Size and sales density of European DIY markets (2012)
11 Source: Company data, Dähne, PWC, Berenberg Equity Research, Berenberg FI Research; *Only considering stores >1,000 sqm
6% 6%
7%
11%
12%
13%
15%
19%
11% Hellweg
Praktiker/Max Bahr
Globus/Hela
Hagebau/Zeus
Hornbach
Toom
Bauhaus
Obi
Other
0
1,000
2,000
3,000
4,000
0
10
20
30
40
EU
R p
er
sq
m*
EU
R b
n
Market size Sales density (rhs)
71% 67%
56% 54%
52% 50%
49% 49%
45% 39%
35% 21%
7% 17% 32%
15% 21% 30%
36% 31%
25%
56%
33% 68%
0%
20%
40%
60%
80%
100%
In-store purchases Online purchases
Pricing pressures
• Increased use of discount campaigns to compete in the market (low switching costs, undifferentiated products)
• Service will be key to differentiate
Social trends
• Cocooning/homing (consumers are staying at home more frequently)
• Increasing environmental and cost awareness (need for energy efficiency and sustainability)
State of the economy
• In crisis times, home improvements come into focus ("homing")
• A strong housing market encourages people to move which supports the DIY market
Internationalisation
• Focus on new markets considering mature and competitive German DIY market
• Increased focus on Eastern Europ. and neighbouring German markets
DIYretailing
19/02/2015

Berenberg
competitive scoring
Sensitivity to macro cycles
low / average / high
Regulatory risks
low / average / high
Scale & geographic
diversification
weak / average / strong
Competitive position
weak / average / strong
Financial policy
conservative / sound / aggressive
Distribution strategy
weak / average / strong
Brand awareness
low / average / high
Profitability
low / average / high
Revenue & cash flow volatility
low / average / high
Evolution of store network and weight. average sales / store
Hornbach Baumarkt
Strategic positioning
Strategic direction Hornbach Baumarkt is a leading German DIY retailer which offers a broad
range of high-quality building, renovation and garden products to project and
professional customers, at consistently low prices. In addition, the company
has a strong focus on offering a range of specialists advice and customer
services. According to Kundenmonitor Deutschland 2014, Hornbach ranked
top among German DIY retailers in terms of overall customer satisfaction
(ranked 1st in 6 of 9 product range disciplines).
Hornbach’s strategic concept concentrates on a large network of DIY
megastores (average store size of 11,600 sqm) located in urban catchment
areas, with the aim to permanently offer a large product selection (over
50,000 products per store on average) in close proximity to its customers.
Hornbach in particular convinces with a high efficiency (net sales/sqm) in its
domestic market , despite a challenging market environment with a rather low sales density in Germany. Moreover, Hornbach pursues an active European expansion plan with currently 49 stores in 8
non-domestic markets, which offer a higher sales density (c. 40% of sales and c. 60% of EBIT).
Since 2010, with the launch of its online shop, Hornbach also makes use of a multi-channel retailing approach, helping the
company to also attract customers outside of the catchment area of its megastores. Since 2013, an online shop is also
available for Hornbach’s second largest market, Austria.
Customer satisfaction in German DIY market
12 Source: Company data, Kundenmonitor, Dähne, Berenberg FI Research; *Bubble size = total net sales in Europe, Praktiker went bankrupt.
German industry-wide DIY efficiency (2013)*
2.51
2.49
2.45
2.39
2.36
2.29
2.23
2.22.32.42.52.6
Obi
Toom Baumarkt
Hellweg
Bauhaus
Hagebau
Globus Baumarkt
Hornbach
Industry average
0
2,000
4,000
6,000
8,000
10,000
12,000
14,000
750 1,000 1,250 1,500 1,750 2,000
Avg
sto
re s
ize
(s
qm
)
Net Sales (€/sqm)
Megastores
92 91 92 92
41 43 46 49
21.2
21.6
22
22.4
22.8
0
40
80
120
160
2011 2012 2013 2014€/s
qm
No
. o
f sto
res
Stores all over EuropeStores in GermanyWeighted Average Sales per Store (rhs)
11 10
8 1
6 5
3 5
0 10 20
Austria
Czech…
Slovakia
Sweden
19/02/2015

Senior Unsecured Notes HBMGR 3 ⅞ 02/20
Issuer:
Hornbach Baumarkt AG
Guarantor(s):
Hornbach International GmbH
Comments on Covenants
• Covenant-lite package resulting
in considerably less covenant
protection than found in most high
yield bonds (Restricted Payments,
Asset Sales, Merger, Affiliate
Transactions & Anti-Layering
provisions missing)
• No restriction on the amount of
secured bank debt (debt will be
senior to unsecured notes)
• No limit on the amount of
structurally senior subsidiary debt
which will rank ahead of notes
• Only optional redemption for tax
reasons
• Weak Change of Control clause
with double trigger (put at par; put
not effective if at end of CoC
period lower rating than BB+/Ba2
is assigned to issuer or long-term
liabilities outstanding)
• Events of Default contain both a
cross acceleration and cross
default clause (typical IG clauses;
positive for investors)
Capital structure
Corporate structure
Hornbach Baumarkt
Focus on bond structure
Maturity profile
13 Source: Company data, Berenberg FI Research; *Based on estimated FY2015 EBITDA figures
Hornbach Baustoff Union GmbH
Hornbach International GmbH
Hornbach Baumarkt AG
Hornbach Holding AG
Hornbach Immobilien AG
Senior NotesIssuer of the Notes
Guarantors of the Notes
RCF
250 250
0
100
200
300
€m
RCF 12/16 Senior Unsecured Notes 02/20
€ m 3Q2015 xEBITDA/R Maturity
Cash & cash equivalents (423.7)
Bank liabilities 101.1
Other 6.2
Senior unsecured notes 246.8 02/2020
Net cash 69.6 –
Adj. net debt (lease-adjusted) 1,313.0 3.6x*
Maximum availability under RCF 250.0 12/2016
19/02/2015

The rating agencies’ opinion*
Hornbach Baumarkt
The rating agencies’ view
Threshold for rating pressure…
Rating pressure could arise from*…
• Relatively small size compared to other retailers (M)
• Relatively high gross financial leverage (M)
• High seasonality and cyclicality of the DIY industry –
strong dependence on weather (S&P)
• Stiff competition and additional pressure from
specialized online retailers (S&P)
• High CAPEX requirement for expansion of store
network limits FCF generation (M)
• Strong position in German DIY market (M, S&P)
• Meaningful geographic diversification and further
growing international presence (M, S&P)
• Good strategy execution and customer
satisfaction (M, S&P)
• Well-positioned e-commerce platform (S&P)
• On-going negative sales trend (S&P)
• Financial leverage trends towards 5.5x (M)
• Contradiction of (S&P) adj. EBITDA margin to well
below 10% causing (S&P):
i) FFO/Debt to fall below 20%
ii) FOCF/Debt to fall below 10%
iii) EBITDA interest coverage to fall below 3.0x
• Sustainably maintain LFL revenue growth in
Germany (M)
• EBITDA margin expansion causing FFO/Debt to
sustainably increase to more than 30% (S&P)
• Adj. Debt/EBITDA trends towards 4.0x (M)
• EBITA/Interest Expense ratio remaining above 2.5x
(M)
Adjusted Debt/EBITDA (Moody’s) EBITA/Interest Expense (Moody’s)
14 Source: Company data, Moody’s, S&P, Berenberg Fixed Income Research; *M = Moody’s
Ratings
Moody’s:
Corporate Family: Ba2
Senior unsecured: Ba2
Outlook: Positive
Last update: 02/09/2014
S&P:
Corporate Family: BB+
Senior unsecured: BB+
Outlook: Stable
Last update: 31/07/2014
Fitch:
Corporate Family: NR1
Senior Secured: NR1
Outlook: n.a.
Last update: n.a.
1 NR = Not rated
4.9x
4.7x5.1x 5.1x
3.0x
4.0x
5.0x
6.0x
2011 2012 2013 2014
Debt/EBITDA
threshold for upward rating pressure
threshold for downward rating pressure
2.4x2.5x
2.0x
2.3x
1.5x
2.0x
2.5x
3.0x
2011 2012 2013 2014
EBITA/Interest Expense
threshold for upward rating pressure
19/02/2015

Hornbach Baumarkt
Summary of company figures
Revenue & Profitability Adj. net debt/EBITDAR* EBITDA interest coverage
15 Source: Company data, Berenberg FI Research; *Based on estimated FY2015 EBITDA/R and FCF figures.
6.1%
5.2% 5.1%
6.8%
0%
2%
4%
6%
8%
0
1,000
2,000
3,000
4,000
2012 2013 2014 3Q2015
€ m
Revenue
EBITDA
EBITDA margin (rhs)
3.6x
4.2x 4.0x
3.6x
0.0x
1.5x
3.0x
4.5x
6.0x
0
400
800
1,200
1,600
2012 2013 2014 3Q2015
€ m
Adj. Net debtEBITDARAdj. net debt/EBITDAR (rhs)
7.3x
6.0x
9.6x
11.4x
0.0x
1.5x
3.0x
4.5x
6.0x
7.5x
9.0x
10.5x
12.0x
0
25
50
75
100
125
150
175
200
2012 2013 2014 3Q2015
€ m
EBITDACash Interest ExpenseEBITDA interest coverage
Selected profit & loss and cash flow financials (€ m)
€ m (FY ends 28 February) 2012 2013 2014 3Q2015
Customer sales 3,001.0 3,020.0 3,152.0 2,669.8
LFL growth 2.8% -1.4% 2.7% 4.9%
Gross profit 1,122.9 1,127.7 1,178.1 1,013.0
EBITDA 184.3 155.8 161.0 182.7
EBITDA Margin 6.1% 5.2% 5.1% 6.8%
Change in working capital -40.2 -13.1 19.4 34.1
Capex -95.6 -116.1 -71.9 -76.9
Cash interest -25.2 -26.1 -16.9 -12.4
Cash taxes -29.1 -22.1 -31.0 -36.5
Free Cash flow -5.9 -21.6 60.7 91.0
Selected balance sheet financials, ratios and store network evolution
€ m (FY ends 28 February) 2012 2013 2014 3Q2015
Store network (#) 134 138 141 147
Total assets 1,628.1 1,597.4 1,670.3 1,755.2
% o/w intangibles 1.0% 0.8% 0.7% 0.6%
Cash 404.3 317.2 371.1 423.7
FCF/Total debt -1.4% -5.6% 16.3% 14.1%*
Debt/EBITDA 2.3x 2.5x 2.3x 1.9x*
Net debt/EBITDA 0.2x 0.4x 0.0x Net cash*
Adj. debt/EBITDAR 4.8x 5.2x 5.2x 4.8x*
Adj. net debt/EBITDAR 3.6x 4.2x 4.0x 3.6x*
EBITDA interest coverage 7.3x 6.0x 9.6x 11.4x*
19/02/2015

2. Company profiles
2.2 Maisons du Monde

Maisons du Monde
Investment thesis and company snapshot
Maisons du Monde Recommendation:
MDMFP 9 08/20 (Bloomberg: MDMFP <Corp>) Overweight
Weaknesses
• Modest size of business operations and limited
geographical diversification (~ ⅔ of sales in France)
• High seasonality and cyclicality of the furniture and
decoration market
• High leverage
• Sales shift towards less profitable furniture products
Selected Financials
Company Snapshot Maisons du Monde (MdM) is a France-based multi-channel retailer which offers a wide range of furniture and decorative
items under its own brand label. Founded in 1996, the company currently operates a network of 241 stores across Europe,
with a primary focus on France. In addition, MdM increases its geographical reach by offering its products via its website in
countries where it has no brick-and-mortar presence. In 2013, the majority stake of MdM was acquired in an LBO by Bain
Capital. The management team around founder and CEO Xavier Marie has remained another significant shareholder.
Strengths
• Broad product range with a unique brand offering
• Multi-channel approach combining a strong French
store with an integrated European-wide online platform
• Supply-chain integrated business model
• Strong track record of achieving market share gains
and growth in earnings and profitability
€ m (FY ends 31 Dec) 2011 2012 2013 LTM
3Q2014
Customer sales 421.3 494.7 549.7 602.2*
Gross profit 257.4 305.3 366.4 424.7
EBITDA 59.6 75.0 70.9 65.6
Adj. net debt/EBITDAR 7.1x 6.5x 5.2x 6.5x
EBITDA interest coverage 3.7x 4.6x 3.2x 2.0x
Free cash flow 12.6 11.0 -5.9 -2.7
17
Company data
Headquarter:
Vertou, Nantes (France)
Products:
Furniture, large and small
decorative items
Major shareholder:
Bain Capital, management
Next financial release:
9 April 2015
FY 2014 financial statements
Bond data
Price / Z-spread / YTW:
102.5 / 797 / 8.2 (Pricing: 19/02/2015 BGN Close)
Callable (only on dates shown)
08/01/2016 @ 104.50%
08/01/2017 @ 102.25%
08/01/2018 @ 100.00%
08/01/2019 @ 100.00%
Amount outstanding (€):
325m
Bond ratings:
Moody’s: B2 (stable)
S&P: B (stable)
Covenants:
HY standard package
Payment rank:
Senior secured
Source: Company data, Bloomberg (19/02/2015), Berenberg FI Research *Reported FY 2014 sales volume according to trading statement.
Investment thesis Maisons du Monde has exhibited very strong sales growth in recent years despite challenging market conditions.
Furthermore, we like the company’s multi-channel approach with its unique product offering. At the same time, MdM’s high
leverage and the sales shift towards less profitable furniture products weigh on its financial profile. Nonetheless, we believe
that MdM will continue its growth story and will be able to deleverage in the near to medium term, especially given
management’s deleveraging commitment. We therefore initiate on MdM’s 08/20 notes with an overweight rating.
.
DUFSCA 07/22
BUTSAS 09/19
HBMGR 02/20
MDMFP 08/20
-200
0
200
400
600
800
1,000
0 2 4 6 8 10
Z-s
pre
ad
(in
bp
s)
Time to worst
19/02/2015

Opportunities
• Sophisticated multi-channel
approach: integration of web-
based and mobile platforms
• Positioning as service
specialist (home design, click-
and-collect, etc.)
• Higher growth potential for
French market due to
population trends (number of
households) and relatively low
market penetration (low
renewal rates)
Threats
• Furniture and electrical goods
generally more cyclical and
vulnerable to adverse
economic developments
• Risk of a prolonged economic
downturn in France
• Highly competitive market with
significant competition from
international online retailers
(e.g. Amazon)
Industry characteristics The homeware retail market covers products from home furniture to decorative items. This definition is extended to home
equipment when including electrical goods (white & brown goods). In general, the sub-segment for decorative items is more
resistant to economic downturns considering its less discretionary character.
Over the past years, the size of the European homeware market remained relatively stable with a CAGR of c. 0.15%. The
French market exhibited a similar development with a slightly higher CAGR of c. 0.55%. Compared to other European
homeware markets, the French market is characterized by a relatively low consumer spending per household. This is mainly
attributable to prevailing low furniture renewal rates in France, where furniture is generally replaced less often on average.
In the future, internet sales will constitute a key driver also for the French homeware industry, considering the generally high
level of web-generated sales in France compared to other European markets and further growth expectations.
0
10,000
20,000
30,000
-10%
0%
10%
20%
'02 '04 '06 '08 '10 '12 '14 '16
Shipping development
Demand (world container trade, Y/Y)Supply (containership fleet development, Y/Y)Aver. containership earnings* (rhs, USD/day)
Industry forces
Maisons du Monde
The French homeware & equipment retail market
Size of European vs French homeware market
Consumer spending on homeware across Europe Web sales evolution by European countries
18 Source: Company data, OC&C, Euromonitor, Berenberg Fixed Income Research; *No figure for other EU countries in 2012 available
16.2 16.3 15.9 15.7 16.2 16.4 16.8 17.4 17.2 16.9 16.9 17.2 16.8
143.7 147.2 149.7 147.2 149.5 152.6158.8 164.7
155.6
142.5 145.6 146.1
0
50
100
150
200
€b
n
France Other EU countries
1,142
1,020
907800
716 603500
0
200
400
600
800
1,000
1,200
€s
pe
nd
/ H
H
Home Furnishings Homewares
5.610.6 13.0
25.6
40.7
60.7
74.2
1.21.43.0
5.46.5
8.2
47.5
1.0
0
20
40
60
80
2007 2008 2009 2010 2011 2012 2013
€b
n
France Germany Italy Spain Belgium UK Austria Others
YoY Growth in %
Highly competitive market
• Increased use of discount campaigns to compete in the market (low switching costs, undifferentiated products)
• Service is key to differentiate
Homeownerhsip trend
• Rising trend in France • Demographic trends (ageing
population tend towards ownerhsip)
• Developments in housing finance
Housing market activity
• Decrease in real estate transactions negatively affects demand for furniture products
• Sales of decorative accessories less affected (less discretionary)
Consumer spending levels
• Discretionary good• Dependent on disposable income
and consumer confidence• Focus on home improvements
during crisis times ("homing")Home-ware
retailing
19/02/2015

Berenberg
competitive scoring
Sensitivity to macro cycles
low / average / high
Regulatory risks
low / average / high
Scale & geographic
diversification
weak / average / strong
Competitive position
weak / average / strong
Financial policy
conservative / sound / aggressive
Distribution strategy
weak / average / strong
Brand awareness
low / average / high
Profitability
low / average / high
Revenue & cash flow volatility
low / average / high
Maisons du Monde
Strategic positioning
Strategic direction Maisons du Monde (MdM) targets a niche segment in the homeware
market, offering a broad range of stylish and authentic products at
affordable prices. The French homeware retailer focuses on a
complementary multi-channel approach, combining a strong store
presence (241 stores as of 2014) with an increasing focus on
website and mobile application as well as catalogue offerings.
Besides the strong exposure to its core market France, MdM also
focuses on building up its presence in other European countries. As
of 2013, the company operated 45 stores outside of France and
opened a further 7 in 2014. Additionally, MdM offers a large part of
its products via its website in countries with no store presence,
including Austria and UK. In the future, Maisons du Monde aims to increase its physical presence in other promising European markets such as Germany, where Maisons du Monde opened
two stores in 2014, and Switzerland, where the company opened its first store in 2014.
With regard to its product offering, the company sets a focus on the continuous renewal and rotation of its product
collections to limit the impact of inventory and fashion risk. The focus within its product range is on small decorative items
(c.52% of sales in 2013), which have a higher net margin contribution due to the transportation costs associated with
furniture and large decorative items, which are not fully offset by delivery fees.
Competitive landscape
Sales split by product category (2013)?
19 Source: Company data, OC&C, Berenberg Fixed Income Research
Decorative objects
Household textile
Kitchenware
Lighting
Mirrors & frames
Tableware
Small decorative itemsArmchairs &
couches
Beds & bedsides
Bookshelves & shelves
Coffee& side tables
Cupboard & wardrobes
Dressers & welsh dressers
Junior
Outdoor furniture
Tables & chairs
Others
Large decorative items
12%
3%
4%
9%
9%
9%
3%
10%
2%
1%
4%
7%
6%
3%
2%
8% 6%
Web Stores
69%
18%
6%4%2%
1%
14%
86%
France Italy Belgium Spain Germany Others
€ 550m
Sales distribution by country and channel
Click & MortarStore-based retailers
Internet-only retailers
Mail order & Internet
Department stores
Home equipment
Furniture & furnishing stores
Sp
ec
iali
sts
No
n-
sp
ec
iali
sts
High share of decoration
High share of furniture
19/02/2015

Senior Secured Notes
MDMFP 9 08/20
Issuer:
Magnolia (BC) S.A.
Guarantor(s):
Magnolia (BC) Midco S.A.R.L.,
Magnolia (BC) S.A.S.,
Maisons du Monde S.A.S. &
Maisons du Monde Italie S.R.L.
Comments on Covenants
• Holdco issuance level - Issuer
without revenue-generating
operations, depending on cash
from subsidiaries to service notes
• RCF ranks pari passu to notes, but
poss. super priority status of RCF
and certain hedging debt up to
AMT of €80m during enforcement
• Certain post-completion mergers
should be completed latest by
31/12/2014 (cf. corpor. structure).
Following completion i.a. IPO Debt
Pushdown could take place (under
certain conditions), which would
trigger certain changes to the
Indenture, i.a. the removal of
certain covenants, the substitution
of BidCo for the issuer and the
release of certain security interests
over the collateral.
• Weak LMT on Liens covenant
allows substantial additional debt
(contribution debt, purchase
money debt, credit facility basket,
general debt basket, uncapped
hedging debt) to be secured on
the collateral. Moreover, ratio debt
(including additional notes) may
also be secured on collateral
without a monetary cap only
subject to a CSSLR ≤3.5x
Capital structure
Corporate structure
Maisons du Monde
Focus on bond structure
Maturity profile
20 Source: Company data, Berenberg FI Research *Based on LTM figures
60
325
0
100
200
300
400
€m
RCF 08/19 Senior Secured Notes 08/20
€ m 3Q2014 xEBITDA/R Maturity
Cash & cash equivalents (14.2)
Senior secured RCF (€60m) 20.0 08/2019
Senior secured notes 325.0 08/2020
Net senior secured debt 330.8 5.0x*
Net senior secured debt (lease-adj.) 689.4 6.5x*
Bain Capital
Senior SecuredNotes
RCF€ 60m€ 325m
(Restricted Group)
Magnolia (BC) S.A.
Magnolia (BC) Holdco S.a.r.l.
("LuxCo 1")
Magnolia (BC) Midco S.a.r.l.
("LuxCo 3")
Magnolia (BC) Luxco S.C.A.
("LuxCo 2")
Maisons du Monde Italie S.R.L.
Non-Guarantor Subsidiaries
Issuer of the Notes
Guarantors of the Notes
€ 269.7m notes proceeds loan
Cadr' Academy 1 S.A.S.
Cadr' Academy 2 S.A.
Ginkgo B. S.A.S.("Target")
(Post-closing merger 1)
Magnolia (BC) S.A.S.("BidCo")
Maisons du Monde S.A.S.
Abaco S.A.S.
19/02/2015

Ratings
Moody’s:
Corporate Family: B2
Senior Secured: B2
Outlook: Stable
Last update: 05/11/2014
S&P:
Corporate Family: B
Senior Secured: B
Outlook: Stable
Last update: 27/03/2014
Fitch:
Corporate Family: NR1
Senior Secured: NR1
Outlook: n.a.
Last update: n.a.
1 NR = Not rated
Rating pressure could arise from…
The rating agencies’ opinion
Maisons du Monde
The rating agencies’ view
Thresholds for rating pressure…
• Large exposure to the fragmented, low-growth
French furniture market (M/S&P)
• High cyclicality and seasonality of the business
(M/S&P)
• Fashion and inventory risk with regard to the
business model (S&P)
• Highly leveraged (S&P)
• Good track record of achieving revenue growth
(M)
• Diversity of the product range – often renewed
(M)
• Above average operating efficiency (S&P)
• Complementary distribution channels with a
successful e-commerce platform (M/S&P)
• Significantly positive LfL growth rates (S&P)
• Successful execution of store repositioning (M)
• Continued positive FCF generation and above
industry-average profitability (M)
• Adj. (Gross) Debt/EBITDA sustainably below 5.0x
and EBITA/interest expense above 2.0x (M)
• EBITDA/cash interest falling below 2.0x (S&P)
• EBITDA deterioration due to increased competition
or failure to manage fashion and inventory risks
(S&P)
• Adj. (Gross) Debt/EBITDA remaining above 6.0x
(M)
• Deterioration of the liquidity profile (S&P)
21 Source: Company data, Moody’s, S&P, Berenberg Fixed Income Research *M = Moody’s
Moody‘s 12-18m forward view
(as of 15/10/2014)
Adj. (Gross) Debt/EBITDA 5.8x-6.2x
Threshold for upward rating pressure 5.0x
Threshold for downward rating pressure 6.0x
EBITA/Interest Expenses 1.3x-1.5x
Threshold for upward rating pressure 2.0x
S&P 12m forward view
(as of 27/03/2014)
EBITDA/cash interest >2.5x
Threshold for upward rating pressure 3.0x
Threshold for downward rating pressure 2.0x
19/02/2015

Revenue & profitability
Maisons du Monde
Summary of company figures
Adj. net debt/EBITDAR EBITDA interest coverage
22 Source: Company data, Berenberg FI Research; *FY 2014 figures according to trading statement
Selected profit & loss and cash flow financials
€ m (FY ends 31 December) 2011 2012 2013 LTM 3Q14
Customer sales 421.3 494.7 549.7 602.2*
LFL growth 13.4% 5.9% -0.1% 1.2%*
Gross profit 305.3 366.4 404.7 424.7
EBITDA 59.6 75.0 70.9 65.6
EBITDA Margin 14.1% 15.2% 12.9% 10.7%
Change in working capital -9.2 -4.6 -11.9 -1.4
Capex -20.2 -39.3 -42.1 -32.4
Cash interest -16.0 -16.3 -22.2 -32.9
Cash taxes -1.6 -3.9 -0.6 -1.7
Free Cash flow 12.6 10.9 -5.9 -2.8
7.1x
6.5x 5.2x
6.5x
0.0x
1.5x
3.0x
4.5x
6.0x
7.5x
9.0x
0
150
300
450
600
750
900
2011 2012 2013 LTM3Q2014
€ m
Adj. net debtEBITDARAdj. net debt/EBITDAR
14.1%
15.2%
12.9%
10.7%
0%
4%
8%
12%
16%
0
200
400
600
800
2011 2012 2013 LTM3Q2014
€ m
Customer salesEBITDAEBITDA margin (rhs)
3.7x
4.6x
3.2x
2.0x
0.0x
1.5x
3.0x
4.5x
6.0x
0
20
40
60
80
2011 2012 2013 LTM3Q2014
€ m
EBITDACash interest expensesEBITDA interest cover (rhs)
Selected balance sheet financials, ratios and store network evolution*
€ m (FY ends 31 December) 2011 2012 2013 LTM 3Q14
Store network (#) 215 224 236 241*
Total assets 509.1 549.9 827.6 808.9
% o/w intangibles 54.5% 47.9% 59.1% 58.5%
Cash 62.2 70.0 62.8 14.2
FCF/Total debt 2.5% 2.0% -1.8% -0.8%
Debt/EBITDA 8.5x 7.4x 4.7x 5.3x
Net debt/EBITDA 7.5x 6.5x 3.8x 5.0x
Adj. debt/EBITDAR 7.7x 7.1x 5.7x 6.6x
Adj. net debt/EBITDAR 7.1x 6.5x 5.2x 6.5x
EBITDA interest coverage 3.7x 4.6x 3.2x 2.0x
19/02/2015

2. Company profiles
2.3 BUT
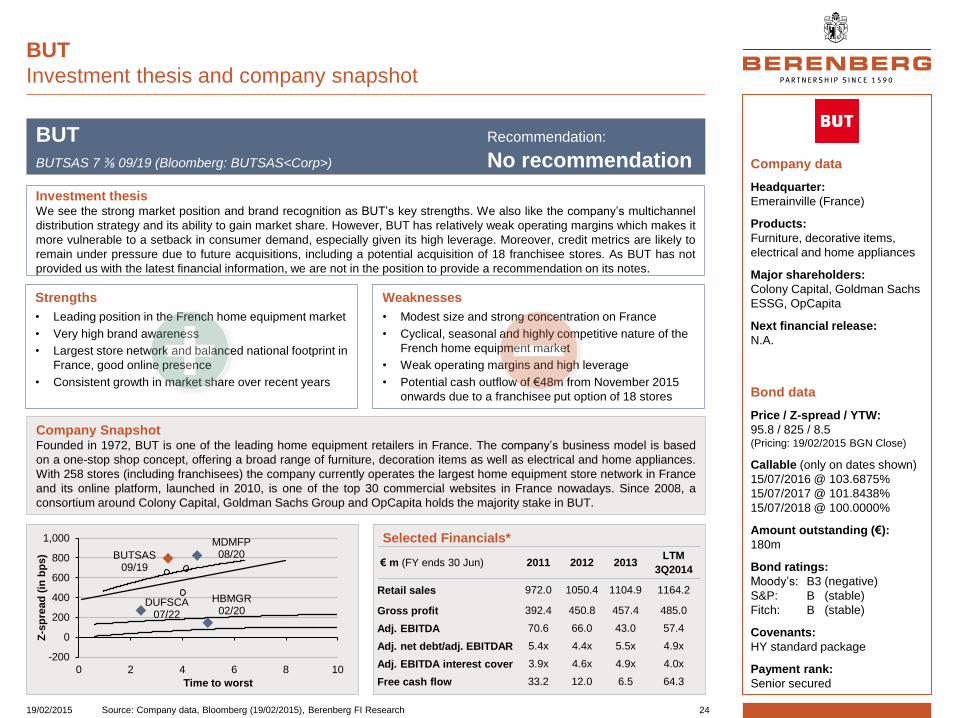
BUT
Investment thesis and company snapshot
BUT Recommendation:
BUTSAS 7 ⅜ 09/19 (Bloomberg: BUTSAS<Corp>) No recommendation
Weaknesses
• Modest size and strong concentration on France
• Cyclical, seasonal and highly competitive nature of the
French home equipment market
• Weak operating margins and high leverage
• Potential cash outflow of €48m from November 2015
onwards due to a franchisee put option of 18 stores
Selected Financials*
Company Snapshot Founded in 1972, BUT is one of the leading home equipment retailers in France. The company’s business model is based
on a one-stop shop concept, offering a broad range of furniture, decoration items as well as electrical and home appliances.
With 258 stores (including franchisees) the company currently operates the largest home equipment store network in France
and its online platform, launched in 2010, is one of the top 30 commercial websites in France nowadays. Since 2008, a
consortium around Colony Capital, Goldman Sachs Group and OpCapita holds the majority stake in BUT.
Strengths
• Leading position in the French home equipment market
• Very high brand awareness
• Largest store network and balanced national footprint in
France, good online presence
• Consistent growth in market share over recent years
€ m (FY ends 30 Jun) 2011 2012 2013 LTM
3Q2014
Retail sales 972.0 1050.4 1104.9 1164.2
Gross profit 392.4 450.8 457.4 485.0
Adj. EBITDA 70.6 66.0 43.0 57.4
Adj. net debt/adj. EBITDAR 5.4x 4.4x 5.5x 4.9x
Adj. EBITDA interest cover 3.9x 4.6x 4.9x 4.0x
Free cash flow 33.2 12.0 6.5 64.3
24
Company data
Headquarter:
Emerainville (France)
Products:
Furniture, decorative items,
electrical and home appliances
Major shareholders:
Colony Capital, Goldman Sachs
ESSG, OpCapita
Next financial release:
N.A.
Bond data
Price / Z-spread / YTW:
95.8 / 825 / 8.5 (Pricing: 19/02/2015 BGN Close)
Callable (only on dates shown)
15/07/2016 @ 103.6875%
15/07/2017 @ 101.8438%
15/07/2018 @ 100.0000%
Amount outstanding (€):
180m
Bond ratings:
Moody’s: B3 (negative)
S&P: B (stable)
Fitch: B (stable)
Covenants:
HY standard package
Payment rank:
Senior secured
Source: Company data, Bloomberg (19/02/2015), Berenberg FI Research
Investment thesis We see the strong market position and brand recognition as BUT’s key strengths. We also like the company’s multichannel
distribution strategy and its ability to gain market share. However, BUT has relatively weak operating margins which makes it
more vulnerable to a setback in consumer demand, especially given its high leverage. Moreover, credit metrics are likely to
remain under pressure due to future acquisitions, including a potential acquisition of 18 franchisee stores. As BUT has not
provided us with the latest financial information, we are not in the position to provide a recommendation on its notes.
DUFSCA 07/22
BUTSAS 09/19
HBMGR 02/20
MDMFP 08/20
-200
0
200
400
600
800
1,000
0 2 4 6 8 10
Z-s
pre
ad
(in
bp
s)
Time to worst
19/02/2015
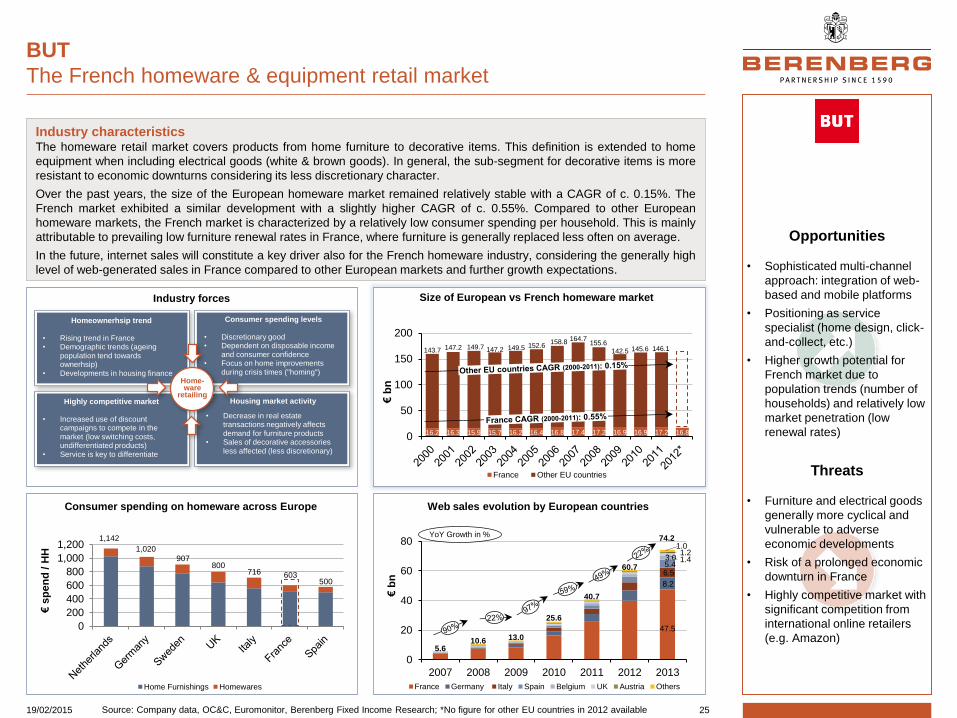
Opportunities
• Sophisticated multi-channel
approach: integration of web-
based and mobile platforms
• Positioning as service
specialist (home design, click-
and-collect, etc.)
• Higher growth potential for
French market due to
population trends (number of
households) and relatively low
market penetration (low
renewal rates)
Threats
• Furniture and electrical goods
generally more cyclical and
vulnerable to adverse
economic developments
• Risk of a prolonged economic
downturn in France
• Highly competitive market with
significant competition from
international online retailers
(e.g. Amazon)
Industry characteristics The homeware retail market covers products from home furniture to decorative items. This definition is extended to home
equipment when including electrical goods (white & brown goods). In general, the sub-segment for decorative items is more
resistant to economic downturns considering its less discretionary character.
Over the past years, the size of the European homeware market remained relatively stable with a CAGR of c. 0.15%. The
French market exhibited a similar development with a slightly higher CAGR of c. 0.55%. Compared to other European
homeware markets, the French market is characterized by a relatively low consumer spending per household. This is mainly
attributable to prevailing low furniture renewal rates in France, where furniture is generally replaced less often on average.
In the future, internet sales will constitute a key driver also for the French homeware industry, considering the generally high
level of web-generated sales in France compared to other European markets and further growth expectations.
0
10,000
20,000
30,000
-10%
0%
10%
20%
'02 '04 '06 '08 '10 '12 '14 '16
Shipping development
Demand (world container trade, Y/Y)Supply (containership fleet development, Y/Y)Aver. containership earnings* (rhs, USD/day)
Industry forces
BUT
The French homeware & equipment retail market
Size of European vs French homeware market
Consumer spending on homeware across Europe Web sales evolution by European countries
25 Source: Company data, OC&C, Euromonitor, Berenberg Fixed Income Research; *No figure for other EU countries in 2012 available
16.2 16.3 15.9 15.7 16.2 16.4 16.8 17.4 17.2 16.9 16.9 17.2 16.8
143.7 147.2 149.7 147.2 149.5 152.6158.8 164.7
155.6
142.5 145.6 146.1
0
50
100
150
200
€b
n
France Other EU countries
1,142
1,020
907800
716 603500
0
200
400
600
800
1,000
1,200
€s
pe
nd
/ H
H
Home Furnishings Homewares
5.610.6 13.0
25.6
40.7
60.7
74.2
1.21.43.0
5.46.5
8.2
47.5
1.0
0
20
40
60
80
2007 2008 2009 2010 2011 2012 2013
€b
n
France Germany Italy Spain Belgium UK Austria Others
YoY Growth in %
Highly competitive market
• Increased use of discount campaigns to compete in the market (low switching costs, undifferentiated products)
• Service is key to differentiate
Homeownerhsip trend
• Rising trend in France • Demographic trends (ageing
population tend towards ownerhsip)
• Developments in housing finance
Housing market activity
• Decrease in real estate transactions negatively affects demand for furniture products
• Sales of decorative accessories less affected (less discretionary)
Consumer spending levels
• Discretionary good• Dependent on disposable income
and consumer confidence• Focus on home improvements
during crisis times ("homing")Home-ware
retailing
19/02/2015
Berenberg
competitive scoring
Sensitivity to macro cycles
low / average / high
Regulatory risks
low / average / high
Scale & geographic
diversification
weak / average / strong
Competitive position
weak / average / strong
Financial policy
conservative / sound / aggressive
Distribution strategy
weak / average / strong
Brand awareness
low / average / high
Profitability
low / average / high
Revenue & cash flow volatility
low / average / high
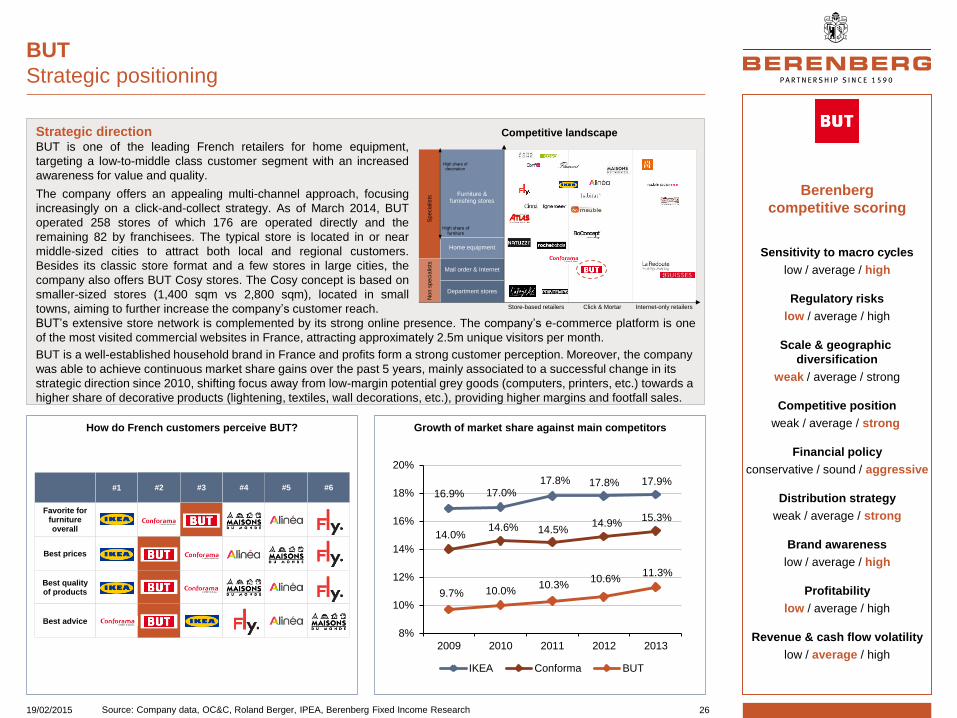
How do French customers perceive BUT?
BUT
Strategic positioning
Strategic direction BUT is one of the leading French retailers for home equipment,
targeting a low-to-middle class customer segment with an increased
awareness for value and quality.
The company offers an appealing multi-channel approach, focusing
increasingly on a click-and-collect strategy. As of March 2014, BUT
operated 258 stores of which 176 are operated directly and the
remaining 82 by franchisees. The typical store is located in or near
middle-sized cities to attract both local and regional customers.
Besides its classic store format and a few stores in large cities, the
company also offers BUT Cosy stores. The Cosy concept is based on
smaller-sized stores (1,400 sqm vs 2,800 sqm), located in small
towns, aiming to further increase the company’s customer reach.
BUT’s extensive store network is complemented by its strong online presence. The company’s e-commerce platform is one
of the most visited commercial websites in France, attracting approximately 2.5m unique visitors per month.
BUT is a well-established household brand in France and profits form a strong customer perception. Moreover, the company
was able to achieve continuous market share gains over the past 5 years, mainly associated to a successful change in its
strategic direction since 2010, shifting focus away from low-margin potential grey goods (computers, printers, etc.) towards a
higher share of decorative products (lightening, textiles, wall decorations, etc.), providing higher margins and footfall sales.
Competitive landscape
Growth of market share against main competitors
26 Source: Company data, OC&C, Roland Berger, IPEA, Berenberg Fixed Income Research
Click & MortarStore-based retailers Internet-only retailers
Mail order & Internet
Department stores
Home equipment
Furniture & furnishing stores
Sp
ecia
lists
No
n s
pe
cia
lists
High share of decoration
High share of furniture
16.9% 17.0%17.8% 17.8% 17.9%
14.0%14.6% 14.5%
14.9%15.3%
9.7% 10.0%10.3%
10.6%11.3%
8%
10%
12%
14%
16%
18%
20%
2009 2010 2011 2012 2013
IKEA Conforma BUT
Favorite for furniture overall
#5 #6#1 #2 #3 #4
Best prices
Best quality of products
Best advice
19/02/2015

Senior Secured Notes
BUTSAS 7⅜ 09/19
Issuer:
BUT S.A.S.
Guarantor(s):
Décomeubles Partners S.A.S,
BUT International,
Cogesem S.A.S.
Comments on Covenants
• Subsidiary guarantees from BUT
International and Cogesem
essentially useless unless/until
issue proceeds downstreamed
(French corporate law)
• Weak Change of Control clause
due to leverage-based portability
feature (immediate portability)
• LMT on Indebtedness provision
with aggressive features leaving
some immediate headroom i.a. for
ratio debt (higher-than-standard
FCCR at 2.25x BUT opening level
at 4.0x) and Credit Facilities
(c.€10m immediate headroom).
Moreover, material Permitted Debt
baskets (~€125m over all baskets)
in context of notes’ issue size
• Alarming LMT on Liens provision
with scope of Permitted Collateral
Liens allowing to secure additional
notes under any permitted debt
basket on collateral pari with initial
notes without CSSLR test (dilution
of initial noteholders)
• Risk of uncapped cash leakage
due to Restricted Payments
provision allowing unlimited
dividends if NLR ≤2.25x (just
below 2.5x opening level)
Capital structure*
Corporate structure
BUT
Focus on bond structure
Maturity profile
27 Source: Company data, Berenberg FI Research; *Based on pro forma figures **Based on LTM adj. EBITDA/R
Private Equity Consortium
Senior SecuredNotes
RCF
100%
Issuer of the Notes
Guarantors of the Notes
Fair Partners Sàrl-SCA(Luxembourg)
Décomeubles Partners SAS
(France)
Fair Finance Sàrl-SCA(Luxembourg)
Non-GuarantorSubsidiaries
BUT International(France)
Immobut SCI (France)
BUT SAS(France)
€ 180m
€ 30m
100%
100%
100%
99.9%Fair Finance Sàrl-SCA
(Luxembourg)
100%
0.1%
Cogesem SAS(France)
Non-GuarantorSubsidiaries
30
180
0
50
100
150
200
250
300
2014 2015 2016 2017 2018 2019
€m
RCF 11/18 Senior Secured Notes 09/19
€ m 3Q2014 xEBITDA/R Maturity
Cash & cash equivalents (54.0)*
Super senior secured RCF (€30m) - 11/2018
Senior Secured Notes 180.0 09/2019
Other debt 18.3
Net debt 144.3 2.5x**
Net debt (lease-adjusted) 657.1 5.4x**
19/02/2015

Ratings
Moody’s:
Corporate Family: B2
Senior Secured: B3
Outlook: Negative
Last update: 18/06/2014
S&P:
Corporate Family: B
Senior Secured: B
Outlook: Stable
Last update: 11/09/2014
Fitch:
Corporate Family: NR1
Senior Secured: NR1
Outlook: n.a.
Last update: n.a.
1 NR = Not rated
Rating pressure could arise from…
The rating agencies’ opinion*
BUT
The rating agencies’ view
Thresholds for rating pressure…
• Strong exposure to fragmented, competitive
French home equipment market (M/S&P)
• Exposure to discretionary spending with regard to
the furniture retail business (M/S&P)
• Weak current profitability levels (M/S&P)
• Highly leveraged (M/S&P)
• Inadequate liquidity for further acquisitions (M)
• Good position and growing market share in the
French home equipment market (M/S&P)
• Good brand recognition (M)
• Turnaround initiated in 2013 and expectation of
continuing improvements (S&P)
• Management initiatives (flexible pricing policy,
cost control, etc.) created positive operating
momentum (S&P)
• Financial policy remains commensurate (S&P)
• Sustainable FCF generation combined with a on-going
improvement of its market position (M/S&P)
• Unadj. FFO/Cash Interest in the high end of the 2.5x-
3.0x range (M)
• Adj. (Gross) Debt/EBITDA sustainably below 5.5x (M)
• Unable to restore sustainable levels of FOCF (S&P)
• More aggressive financial policy (S&P)
• Adj. leverage exceeding 5.0x or unadj. FFO/Cash
Interest below 2.0x on a long-term basis (S&P)
• Adj. (Gross) Debt/EBITDA remaining above 6.5x for
a prolonged period of time (M)
• Any weakening of the liquidity profile (M)
28 Source: Company data, Moody’s, S&P, Berenberg Fixed Income Research *M = Moody’s
S&P ‘15 forward view
(as of 27/03/2014)
Adj. Debt/EBITDA 3.7x
Threshold for downward rating pressure >5.0x
FFO/Cash Interest >2.0x
Threshold for upward rating pressure 2.5x-3.0x
Threshold for downward rating pressure <2.0x
Adjusted (Gross) Debt/EBITDA (Moody’s)
8.7x8.4x
6.4x
7.6x
4.0x
5.0x
6.0x
7.0x
8.0x
9.0x
2010 2011 2012 2013
Adj. (Gross) Debt/EBITDA
threshold for upward rating pressure
threshold for downward rating pressure
19/02/2015

Revenue & profitability
BUT
Summary of company figures
Adj. net debt/EBITDAR Adj. ÉBITDA interest cover
29 Source: Company data, Berenberg FI Research
7.3%
6.3%
3.9% 4.9%
0%
3%
6%
9%
0
400
800
1,200
2011 2012 2013 LTM3Q2014
€ m
Retail salesAdj. EBITDAAdj. EBITDA margin (rhs)
5.4x
4.4x
5.5x 5.4x
0.0x
1.5x
3.0x
4.5x
6.0x
7.5x
0
150
300
450
600
750
2011 2012 2013 LTM3Q2014
€ m
Adj. net debtAdj. EBITDARAdj. net debt/adj. EBITDAR (rhs)
3.9x
4.6x 4.9x
4.0x
0.0x
1.0x
2.0x
3.0x
4.0x
5.0x
6.0x
0
15
30
45
60
75
2011 2012 2013 LTM3Q2014
€ m
Adj. EBITDACash interest expensesAdj. EBITDA interest cover (rhs)
Selected profit & loss and cash flow financials (€ m)
€ m (FY ends 30 June) 2011 2012 2013 LTM 3Q14
Retail sales 972.0 1050.4 1104.9 1164.2
LFL growth -2.4% 3.5% -3.0% 0.1%
Gross profit 392.4 450.8 457.4 485.0
EBITDA 70.6 66.0 43.0 57.4
EBITDA Margin 7.3% 6.3% 3.9% 4.9%
Change in working capital 9.3 4.9 11.9 47.7
Capex -28.6 -33.9 -31.3 -24.8
Cash interest -17.9 -14.3 -8.8 -14.3
Cash taxes -0.2 -10.7 -8.3 -1.7
Free cash flow 33.2 12.0 6.5 64.3
Selected balance sheet financials, ratios and store network evolution
€ m (FY ends 30 June) 2011 2012 2013 LTM 3Q14
Store network (#) 213 217 228 258
Total assets 880.1 774.7 732.2 723.7
% o/w intangibles 17.2% 22.3% 25.0% 26.1%
Cash 38.5 58.9 77.9 54.0
FCF/Total debt 9.9% 7.0% 4.1% 32.4%
Debt/adj. EBITDA 4.8x 2.6x 3.7x 3.5x
Net debt/adj. EBITDA 4.2x 1.7x 1.9x 2.5x
Adj. debt/adj. EBITDAR 5.7x 4.9x 6.2x 5.9x
Adj. net Debt/adj. EBITDAR 5.4x 4.4x 5.5x 5.4x
Adj. EBITDA interest cover 3.9x 4.6x 4.9x 4.0x
19/02/2015

2. Company profiles
2.4 Dufry
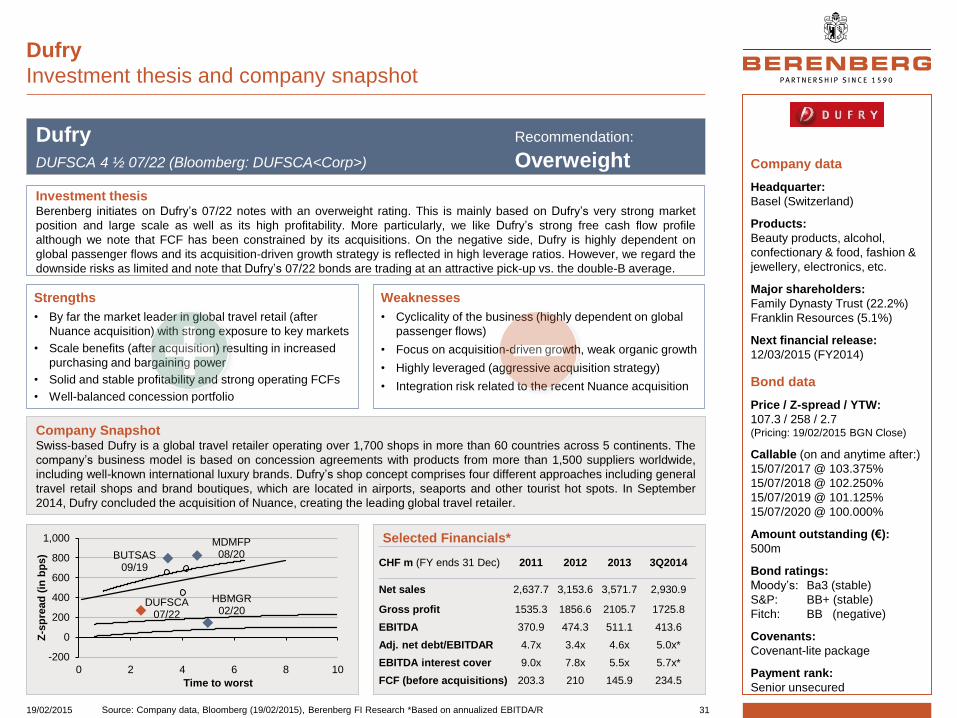
Company data
Headquarter:
Basel (Switzerland)
Products:
Beauty products, alcohol,
confectionary & food, fashion &
jewellery, electronics, etc.
Major shareholders:
Family Dynasty Trust (22.2%)
Franklin Resources (5.1%)
Next financial release:
12/03/2015 (FY2014)
Bond data
Price / Z-spread / YTW:
107.3 / 258 / 2.7 (Pricing: 19/02/2015 BGN Close)
Callable (on and anytime after:)
15/07/2017 @ 103.375%
15/07/2018 @ 102.250%
15/07/2019 @ 101.125%
15/07/2020 @ 100.000%
Amount outstanding (€):
500m
Bond ratings:
Moody’s: Ba3 (stable)
S&P: BB+ (stable)
Fitch: BB (negative)
Covenants:
Covenant-lite package
Payment rank:
Senior unsecured
Dufry
Investment thesis and company snapshot
Dufry Recommendation:
DUFSCA 4 ½ 07/22 (Bloomberg: DUFSCA<Corp>) Overweight
Weaknesses
• Cyclicality of the business (highly dependent on global
passenger flows)
• Focus on acquisition-driven growth, weak organic growth
• Highly leveraged (aggressive acquisition strategy)
• Integration risk related to the recent Nuance acquisition
Selected Financials*
Company Snapshot Swiss-based Dufry is a global travel retailer operating over 1,700 shops in more than 60 countries across 5 continents. The
company’s business model is based on concession agreements with products from more than 1,500 suppliers worldwide,
including well-known international luxury brands. Dufry’s shop concept comprises four different approaches including general
travel retail shops and brand boutiques, which are located in airports, seaports and other tourist hot spots. In September
2014, Dufry concluded the acquisition of Nuance, creating the leading global travel retailer.
Strengths
• By far the market leader in global travel retail (after
Nuance acquisition) with strong exposure to key markets
• Scale benefits (after acquisition) resulting in increased
purchasing and bargaining power
• Solid and stable profitability and strong operating FCFs
• Well-balanced concession portfolio
CHF m (FY ends 31 Dec) 2011 2012 2013 3Q2014
Net sales 2,637.7 3,153.6 3,571.7 2,930.9
Gross profit 1535.3 1856.6 2105.7 1725.8
EBITDA 370.9 474.3 511.1 413.6
Adj. net debt/EBITDAR 4.7x 3.4x 4.6x 5.0x*
EBITDA interest cover 9.0x 7.8x 5.5x 5.7x*
FCF (before acquisitions) 203.3 210 145.9 234.5
31 Source: Company data, Bloomberg (19/02/2015), Berenberg FI Research *Based on annualized EBITDA/R
Investment thesis Berenberg initiates on Dufry’s 07/22 notes with an overweight rating. This is mainly based on Dufry’s very strong market
position and large scale as well as its high profitability. More particularly, we like Dufry’s strong free cash flow profile
although we note that FCF has been constrained by its acquisitions. On the negative side, Dufry is highly dependent on
global passenger flows and its acquisition-driven growth strategy is reflected in high leverage ratios. However, we regard the
downside risks as limited and note that Dufry’s 07/22 bonds are trading at an attractive pick-up vs. the double-B average.
DUFSCA 07/22
BUTSAS 09/19
HBMGR 02/20
MDMFP 08/20
-200
0
200
400
600
800
1,000
0 2 4 6 8 10
Z-s
pre
ad
(in
bp
s)
Time to worst
19/02/2015

Opportunities
• Growth in global passenger
numbers
• Increasing international
tourism travel
• Increasing passenger traffic
from EM (particularly from
China, the world’s leading
market for luxury goods)
• Further market consolidation
in the medium to long term
Threats
• Increasing security and
product regulations (varying
by region)
• Growing political tensions and
terroristic acts negatively
impact passenger numbers
• Highly competitive,
fragmented market
(competition for concession
rights)
Industry characteristics According to Generation Research, the global retail travel market had an approximate size of $60bn in 2013. In general,
travel retailing primarily takes place at airports, seaports, and at international borders, whereby airport retailing constitutes
the largest sector in terms of sales. Within the industry it can be distinguished between duty-free shops, targeted towards
international travellers, and duty-paid shops, focused on domestic costumers, both offering primarily brand products.
The global travel retail market is highly fragmented with the top 10 players holding roughly 55% of the market in 2013, which
indicates further potential for market consolidation, particularly after Dufry’s recent acquisition of Nuance.
In terms of growth drivers, the industry is profiting from steadily increasing passenger numbers, predicted to grow at a CAGR
of c. 4.1% until 2031. In this context, Europe currently represents the major market, followed by North America and the
Asia/Pacific region. However, the Asia/Pacific and ME/Africa regions offer the greatest growth potential in the medium term.
0
10,000
20,000
30,000
-10%
0%
10%
20%
'02 '04 '06 '08 '10 '12 '14 '16
Shipping development
Demand (world container trade, Y/Y)Supply (containership fleet development, Y/Y)Aver. containership earnings* (rhs, USD/day)
Industry forces
Dufry
The global travel retail industry
Regional distribution of global passenger travel (2013) Long term global passenger forecast (2012)
Market share by sales of key airport retailers (2013)
32 Source: Company data, Generation Research, ACI-DKMA, Verdict Research, Berenberg Fixed Income Research
~15%
8.0%6.2% 5.7% 5.4% 5.3% 4.8% 4.5% 3.8%
2.6% 1.9%
9.5%
0%
5%
10%
15%
20%
0
2
4
6
8
10
12
14
bn
pa
ss
en
ge
rs
Force majeure
• Regional travel impacted by certain events (e.g. political turmoil, epidemics, forces of nature etc.)
Increasing global passenger travel
• Increasing world population and tourism trends
• Growth opps in emerging markets• Improvements in air transport
(greater accessibility, affordability)
Regulatory environment
• Increasing security procedures at airports
• Regulations on transportation of liquids and hand baggage
Need to adapt product offering
• Low-cost carriers gaining ground• Increasing number of "budget"
passengers• Need to adapt offering for cheaper
products
Travelretailing
30%
8%
7% 27%
28%
Europe
Latin America
Middle East/Africa
Asia/Pacific
North America
19/02/2015
Berenberg
competitive scoring
Sensitivity to macro cycles
low / average / high
Regulatory risks
low / average / high
Scale & geographic
diversification
weak / average / strong
Competitive position
weak / average / strong
Financial policy
conservative / sound / aggressive
Distribution strategy
weak / average / strong
Brand awareness
low / average / high
Profitability
low / average / high
Revenue & cash flow volatility
low / average / high
Sales by remaining term of concession portfolio (2013)
Dufry
Strategic positioning
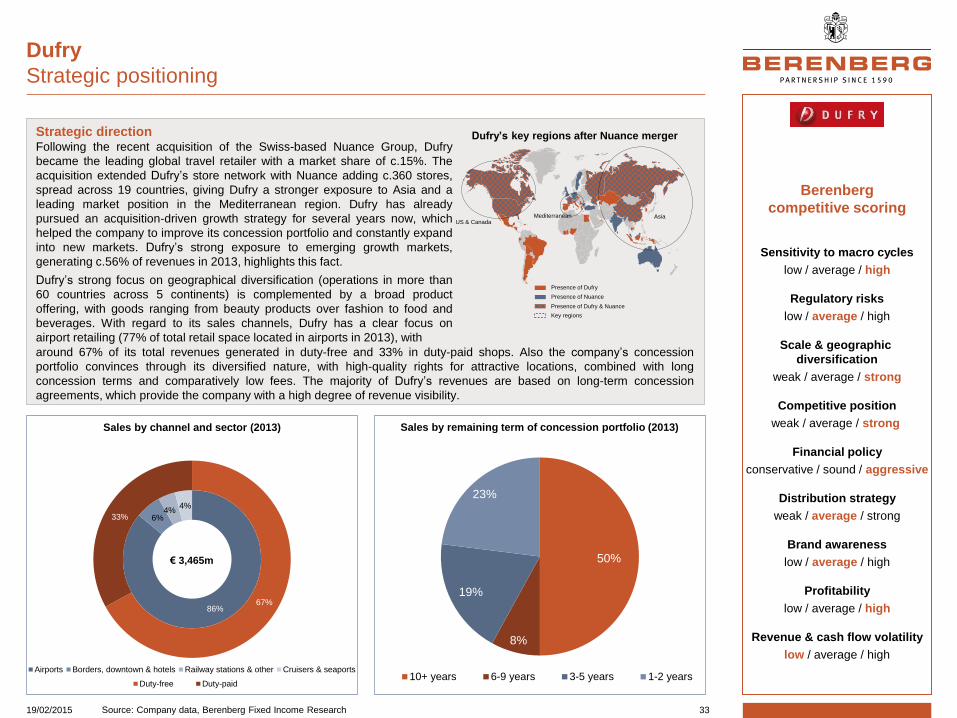
Strategic direction Following the recent acquisition of the Swiss-based Nuance Group, Dufry
became the leading global travel retailer with a market share of c.15%. The
acquisition extended Dufry’s store network with Nuance adding c.360 stores,
spread across 19 countries, giving Dufry a stronger exposure to Asia and a
leading market position in the Mediterranean region. Dufry has already
pursued an acquisition-driven growth strategy for several years now, which
helped the company to improve its concession portfolio and constantly expand
into new markets. Dufry’s strong exposure to emerging growth markets,
generating c.56% of revenues in 2013, highlights this fact.
Dufry’s strong focus on geographical diversification (operations in more than
60 countries across 5 continents) is complemented by a broad product
offering, with goods ranging from beauty products over fashion to food and
beverages. With regard to its sales channels, Dufry has a clear focus on
airport retailing (77% of total retail space located in airports in 2013), with
around 67% of its total revenues generated in duty-free and 33% in duty-paid shops. Also the company’s concession
portfolio convinces through its diversified nature, with high-quality rights for attractive locations, combined with long
concession terms and comparatively low fees. The majority of Dufry’s revenues are based on long-term concession
agreements, which provide the company with a high degree of revenue visibility.
Dufry’s key regions after Nuance merger
33 Source: Company data, Berenberg Fixed Income Research
Duty-free Duty-paid
86%
6%4%
4%
67%
33%
Airports Borders, downtown & hotels Railway stations & other Cruisers & seaports
€ 3,465m
Sales by channel and sector (2013)
50%
8%
19%
23%
10+ years 6-9 years 3-5 years 1-2 years
Presence of Dufry
Presence of Nuance
Presence of Dufry & Nuance
US & CanadaAsiaMediterranean
Key regions
19/02/2015

Senior Unsecured Notes DUFSCA 4½ 07/22
Issuer:
Dufry Finance SCA
Guarantor(s):
Dufry AG &
Dufry International AG &
Dufry Holdings/Investments AG &
Hudson Group Inc. &
Dufry Financial Services B.V.
Comments on Covenants
• Covenant-lite package (Asset
Sales, Affiliate Transactions &
Anti-Layering provisions missing)
• Subsidiary guarantees may cease
to apply before final redemption
(upon guarantee of new CF and
notes maturing 2019 and 2020)
• Fall-Away provision does not
require reinstallation of covenants
after IG is subsequently lost again
• Weak LMT on Indebtedness
provisions (i.a. credit facility
≤CHF900m+ $1,010m +€500m;
debt basket ≤ $125m/11% NTA)
• Weak LMT on Liens allowing to
secure substantial amounts of
additional debt without notes
having to be equally secured over
such assets
• Weak Restricted Payments
provision allows very generous
Permitted Investments and has
various generous carve-outs (i.a.
general RP basket >$200m & 22%
of con. NTA; basket for unlimit.
payments (divid., subord. oblig.) if
con. Total Leverage ratio ≤3.25x)
• No requirement for Nuance to
guarantee notes after acquisition
Capital structure
Corporate structure
Dufry
Focus on bond structure
Maturity profile
34 Source: Company data, Berenberg FI Research;
Senior UnsecuredNotes (due 2020)
RCF
Issuer of the Notes
Guarantors of the Notes
Dufry AG
Dufry Holdings & Investments AG
Dufry Finance SCAHudson Group (HG)
Inc.Dufry Financial Services B.V.
Dufry International AG
The Nuance Group AG
Non-guarantorsubsidiaries
Senior UnsecuredNotes (due 2022)
CHF m 3Q2014 xEBITDA/R Maturity
Cash & cash equivalents (798)
USD term loan ($1,010m) 896
EUR term loan (€500m) 607.5
EUR syndicated CF (€250m) 301.7 2019
RCF (CHF900m) and other 124.4 2019
Senior unsecured notes ($500m) 442.1 10/2020
Senior unsecured notes (€500m) 607.5 07/2022
Net debt 2,181.2 n.m.
Net debt (lease-adj.) 3,399.9 n.m.
900.0
1503.5
301.7
442.1 607.5
0
500
1,000
1,500
2,000
2,500
3,000
CH
F m
RCF 2019 Term Loan 2019 (EUR+USD)
Syndicated facility 2019 Senior Notes 10/20 (USD)
Senior Notes 07/22 (EUR)
19/02/2015
Ratings
Moody’s:
Corporate Family: Ba3
Senior Unsecured: Ba3
Outlook: Stable
Last update: 06/06/2014
S&P:
Corporate Family: BB+
Senior Unsecured: BB+
Outlook: Stable
Last update: 07/07/2014
Fitch:
Corporate Family: BB
Senior Unsecured: BB
Outlook: Negative
Last update: 05/06/2014
The rating agencies’ opinion*
Dufry
The rating agencies’ view
Threshold for rating pressure…
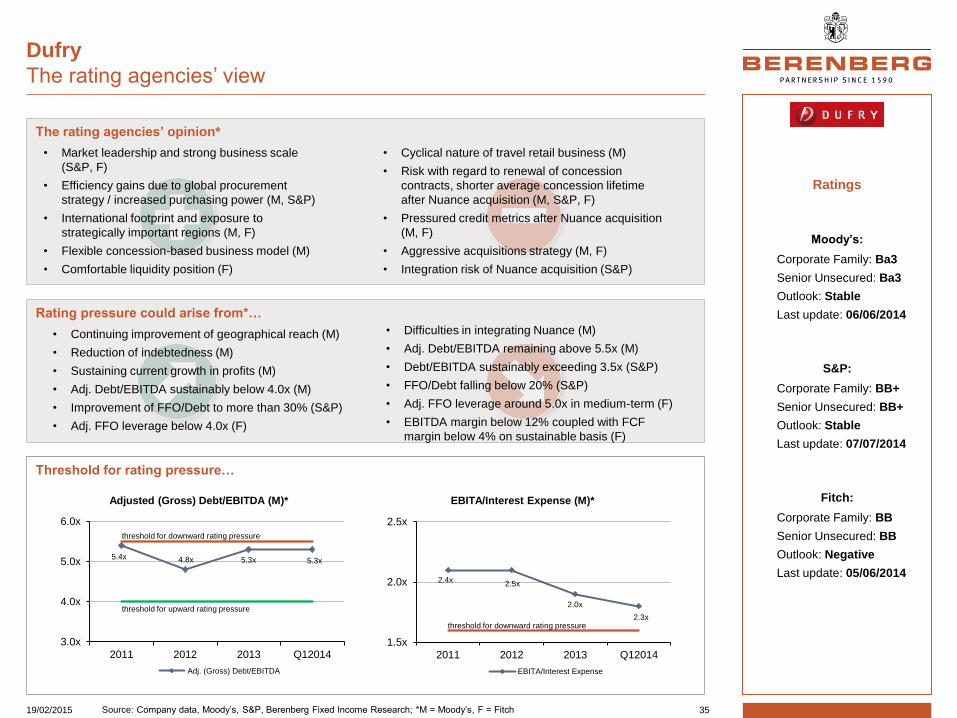
Rating pressure could arise from*…
• Cyclical nature of travel retail business (M)
• Risk with regard to renewal of concession
contracts, shorter average concession lifetime
after Nuance acquisition (M, S&P, F)
• Pressured credit metrics after Nuance acquisition
(M, F)
• Aggressive acquisitions strategy (M, F)
• Integration risk of Nuance acquisition (S&P)
• Market leadership and strong business scale
(S&P, F)
• Efficiency gains due to global procurement
strategy / increased purchasing power (M, S&P)
• International footprint and exposure to
strategically important regions (M, F)
• Flexible concession-based business model (M)
• Comfortable liquidity position (F)
• Difficulties in integrating Nuance (M)
• Adj. Debt/EBITDA remaining above 5.5x (M)
• Debt/EBITDA sustainably exceeding 3.5x (S&P)
• FFO/Debt falling below 20% (S&P)
• Adj. FFO leverage around 5.0x in medium-term (F)
• EBITDA margin below 12% coupled with FCF
margin below 4% on sustainable basis (F)
• Continuing improvement of geographical reach (M)
• Reduction of indebtedness (M)
• Sustaining current growth in profits (M)
• Adj. Debt/EBITDA sustainably below 4.0x (M)
• Improvement of FFO/Debt to more than 30% (S&P)
• Adj. FFO leverage below 4.0x (F)
Adjusted (Gross) Debt/EBITDA (M)* EBITA/Interest Expense (M)*
35 Source: Company data, Moody’s, S&P, Berenberg Fixed Income Research; *M = Moody’s, F = Fitch
5.4x 4.8x 5.3x 5.3x
3.0x
4.0x
5.0x
6.0x
2011 2012 2013 Q12014
Adj. (Gross) Debt/EBITDA
threshold for upward rating pressure
threshold for downward rating pressure
2.4x2.5x
2.0x
2.3x
1.5x
2.0x
2.5x
2011 2012 2013 Q12014
EBITA/Interest Expense
threshold for downward rating pressure
19/02/2015
Dufry
Summary of company figures
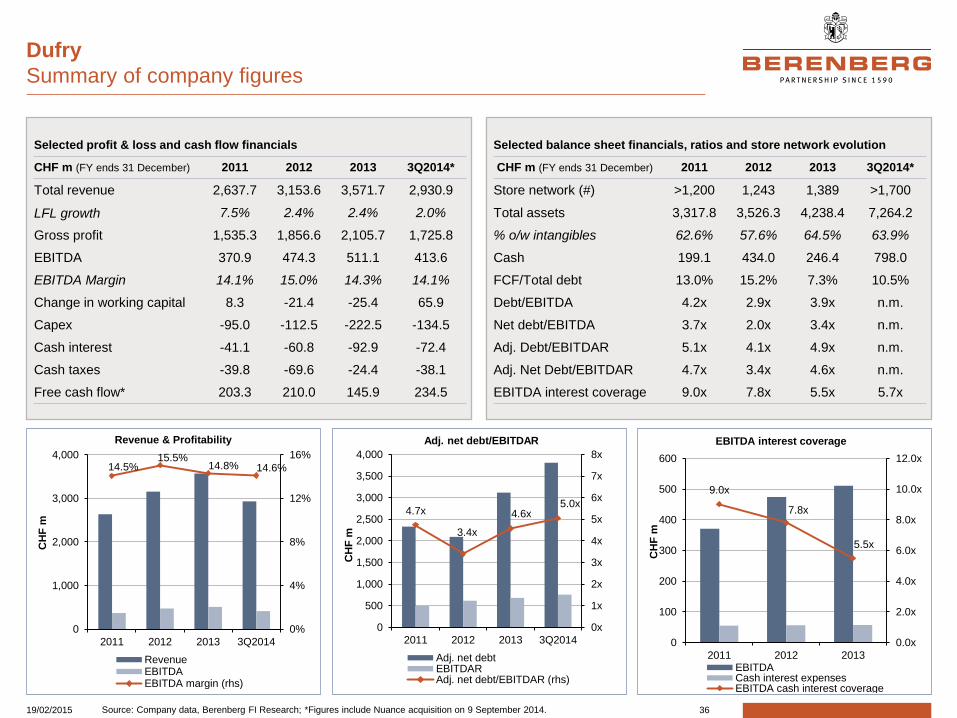
Revenue & Profitability Adj. net debt/EBITDAR EBITDA interest coverage
36 Source: Company data, Berenberg FI Research; *Figures include Nuance acquisition on 9 September 2014.
14.5% 15.5%
14.8% 14.6%
0%
4%
8%
12%
16%
0
1,000
2,000
3,000
4,000
2011 2012 2013 3Q2014
CH
F m
RevenueEBITDAEBITDA margin (rhs)
4.7x
3.4x
4.6x 5.0x
0x
1x
2x
3x
4x
5x
6x
7x
8x
0
500
1,000
1,500
2,000
2,500
3,000
3,500
4,000
2011 2012 2013 3Q2014
CH
F m
Adj. net debtEBITDARAdj. net debt/EBITDAR (rhs)
Selected profit & loss and cash flow financials
CHF m (FY ends 31 December) 2011 2012 2013 3Q2014*
Total revenue 2,637.7 3,153.6 3,571.7 2,930.9
LFL growth 7.5% 2.4% 2.4% 2.0%
Gross profit 1,535.3 1,856.6 2,105.7 1,725.8
EBITDA 370.9 474.3 511.1 413.6
EBITDA Margin 14.1% 15.0% 14.3% 14.1%
Change in working capital 8.3 -21.4 -25.4 65.9
Capex -95.0 -112.5 -222.5 -134.5
Cash interest -41.1 -60.8 -92.9 -72.4
Cash taxes -39.8 -69.6 -24.4 -38.1
Free cash flow* 203.3 210.0 145.9 234.5
Selected balance sheet financials, ratios and store network evolution
CHF m (FY ends 31 December) 2011 2012 2013 3Q2014*
Store network (#) >1,200 1,243 1,389 >1,700
Total assets 3,317.8 3,526.3 4,238.4 7,264.2
% o/w intangibles 62.6% 57.6% 64.5% 63.9%
Cash 199.1 434.0 246.4 798.0
FCF/Total debt 13.0% 15.2% 7.3% 10.5%
Debt/EBITDA 4.2x 2.9x 3.9x n.m.
Net debt/EBITDA 3.7x 2.0x 3.4x n.m.
Adj. Debt/EBITDAR 5.1x 4.1x 4.9x n.m.
Adj. Net Debt/EBITDAR 4.7x 3.4x 4.6x n.m.
EBITDA interest coverage 9.0x 7.8x 5.5x 5.7x
9.0x
7.8x
5.5x
0.0x
2.0x
4.0x
6.0x
8.0x
10.0x
12.0x
0
100
200
300
400
500
600
2011 2012 2013C
HF
m
EBITDACash interest expensesEBITDA cash interest coverage
19/02/2015

3. Appendix: Macroeconomic environment

Macro driver #1: Economic growth (I)
Close link between development of retail sales and GDP
Retail sales growth is
strongly correlated with
overall economic growth.
Eurozone retail sales have
showed stronger growth
than GDP since end of
October 2013, particularly
within the recent months.
.
38 Source: Bloomberg (19/02/2015), Eurostat, Berenberg Fixed Income Research
-6.0%
-5.0%
-4.0%
-3.0%
-2.0%
-1.0%
0.0%
1.0%
2.0%
3.0%
4.0%
5.0%
6.0%
Gro
wth
rate
(yo
y)
Eurozone GDP Eurozone non-food retail sales (3M average)
19/02/2015

Macro driver #1: Economic growth (II)
Putin shock fading, growth is expected to accelerate in early 2015
The upswing within the euro
area has been interrupted,
mainly due to geopolitical
crises (especially in Russia
and Ukraine) which have
weakened business
confidence and investment.
However, this effect is fading
and a rebound is expected in
early 2015. Moreover,
peripheral countries reap
rewards of their painful reform
efforts with gains in GDP and
employment.
Click here for Berenberg’s
latest economic forecasts
39 Source: Bloomberg (19/02/2015), Eurostat, EU Commission, Berenberg Fixed Income Research; *EU Winter Forecast (yoy %)
Country Non-Food Retail Sales (yoy %) GDP (yoy %)
Nov 2014 Dec 2014 Jan 2015 Q3 2014 Q4 2014 2015e* 2016e*
1 Ireland 6.5% 7.4% 7.4% 3.5% 4.8%* 3.5% 3.6%
2 Malta -4.8% -4.4% -4.4% 4.0% 3.3%* 3.3% 2.9%
3 Luxembourg 13.3% 10.9% 10.9% 3.8% 3.0%* 2.6% 2.9%
4 Slovenia 1.0% -2.0% -2.0% 3.1% 2.6%* 1.8% 2.3%
5 Estonia 7.7% 6.7% 6.7% 2.3% 2.6% 2.3% 2.9%
6 Slovakia 3.7% 5.6% 5.6% 2.5% 2.4% 2.5% 3.2%
7 Spain 3.9% 6.8% 6.8% 1.7% 2.0% 2.3% 2.5%
8 Latvia 4.4% 2.4% 2.4% 2.4% 1.9% 2.9% 3.6%
9 Greece -3.7% - - 1.6% 1.7% 2.5% 2.6%
10 Germany 3.6% 5.7% 5.7% 1.2% 1.5% 1.5% 2.0%
11 Netherlands 4.0% - - 1.0% 1.0% 1.4% 1.7%
12 Belgium 2.1% 3.8% 3.8% 1.0% 0.9% 1.1% 1.4%
Ø Euro Area 3.2% 3.5% 3.5% 0.8% 0.9% 1.3% 1.9%
13 Portugal 0.7% - - 1.1% 0.7% 1.6% 1.7%
14 France 3.2% 3.1% 3.1% 0.4% 0.2% 1.0% 1.8%
15 Austria -2.0% 1.8% 1.8% 0.0% 0.0% 0.8% 1.5%
16 Finland -1.6% -3.5% -3.5% 0.0% -0.1% 1.0% 1.8%
17 Italy 2.5% - - -0.5% -0.3% 0.6% 1.3%
18 Cyprus 8.2% 2.3% 2.3% -1.8% -1.9% 0.4% 1.6%
19/02/2015

Macro driver #2: Unemployment (I)
Close link between development of retail sales and employment
After having remained on its
peak of 12% from January to
September 2013, Eurozone
unemployment has
constantly decreased to
11.4% at the end of last year,
which had a positive impact
on retail sales volumes.
40 Source: Bloomberg (19/02/2015), Eurostat, Berenberg Fixed Income Research
7%
8%
9%
10%
11%
12%
13%-6.0%
-5.0%
-4.0%
-3.0%
-2.0%
-1.0%
0.0%
1.0%
2.0%
3.0%
4.0%
5.0%
6.0%
Un
em
plo
ym
en
t ra
te
Gro
wth
rate
(yo
y)
Eurozone non-food retail sales Eurozone unemployment (rhs, inverted)
19/02/2015

Euro area unemployment has
reached its lowest value
since August 2012 at the end
of last year with 11.4%. It is
expected to further decrease
to 10.6% in 2016, mainly
driven by peripheral countries.
Click here for Berenberg’s
latest economic forecasts
Macro driver #2: Unemployment (II)
Eurozone unemployment rates expected to decrease and converge
Country Unemployment Rate Rank by GDP
as of December 2014* 2015e** 2016e** as of Q2 2014
1 Germany 4.8% 4.9% 4.8% #01
2 Austria 4.9% 5.2% 5.0% #06
3 Malta 5.8% 5.9% 5.9% #18
4 Luxembourg 5.9% 6.4% 6.3% #12
5 Estonia 6.6% 6.8% 5.9% #16
6 Netherlands 6.7% 6.6% 6.4% #05
7 Belgium 8.4% 8.3% 8.1% #07
8 Finland 8.9% 9.0% 8.8% #08
9 Slovenia 9.7% 9.5% 8.9% #14
10 France 10.3% 10.4% 10.2% #02
11 Ireland 10.5% 9.6% 8.8% #09
12 Latvia 10.7% 10.2% 9.2% #15
Ø Euro Area 11.4% 11.2% 10.6% -
13 Slovakia 12.5% 12.8% 12.1% #13
14 Italy 12.9% 12.8% 12.6% #03
15 Portugal 13.4% 13.4% 12.6% #10
16 Cyprus 16.4% 15.8% 14.8% #17
17 Spain 23.7% 22.5% 20.7% #04
18 Greece 25.8% 25.0% 22.0% #11
41 Source: Bloomberg (19/02/2015), Eurostat, EU Commission, Berenberg; *Excp.: Lativa (09/2014) & Estonia (11/2014); **EU Winter Forecast 19/02/2015

Macro driver #3: Consumer confidence
Consumer confidence as an indicator for future retail sales
Consumer confidence has
consistently improved since
the beginning of 2013 and has
already reached pre-crisis
levels, indicating a
continuing upward trend for
Eurozone retail sales.
.
42 Source: Bloomberg (19/02/2015), Eurostat, EU Commission, Berenberg Fixed Income Research
-44
-40
-36
-32
-28
-24
-20
-16
-12
-8
-4
0
4
-6.0%
-5.0%
-4.0%
-3.0%
-2.0%
-1.0%
0.0%
1.0%
2.0%
3.0%
4.0%
5.0%
6.0%
Co
nsu
mer
co
nfi
den
ce i
nd
ex l
ev
el
Gro
wth
rate
(yo
y)
Eurozone non-food retail sales Eurozone consumer confidence (rhs)
19/02/2015

4. Disclaimer

Disclaimer
44
Please note that the use of this research report is subject to the conditions and restrictions set forth in the “General investment-related disclosures” and the “Legal disclaimer” at the end of this document.
For analyst certification and remarks regarding foreign investors and country-specific disclosures, please refer to the respective paragraph at the end of this document.
Disclosures in respect of section 34b of the German Securities Trading Act (Wertpapierhandelsgesetz – WpHG)
Company Disclosures Initiation of coverage Alain Afflelou no disclosures 8 December 2014 Darty PLC no disclosures 8 December 2014 Dufry no disclosures 19 February 2015 Hornbach Baumarkt AG 3 19 February 2015 Maisons du Monde no disclosures 19 February 2015 THOM Europe SAS no disclosures 8 December 2014 (1) Joh. Berenberg, Gossler & Co. KG (hereinafter referred to as “the Bank”) or its affiliate(s)
was Lead Manager or Co-Lead Manager over the previous 12 months of a public offering of this company.
(2) The Bank acts as Designated Sponsor for this company. (3) Over the previous 12 months, the Bank and/or its affiliate(s) has effected an agreement
with this company for investment banking services or received compensation or a promise to pay from this company for investment banking services.
(4) The Bank and/or its affiliate(s) holds 5 % or more of the share capital of this company. (5) The Bank holds a trading position in shares of this company.
19/02/2015

Disclaimer
45
Historical recommendation changes for AAFFP 5 5/8 04/19 in the last 12 months Date Recommendation
08 December 2014 Marketweight Historical recommendation changes for DRTYLN 5 7/8 03/21 in the last 12 months Date Recommendation
08 December 2014 Overweight Historical recommendation changes for DUFSCA 4 1/2 07/22 in the last 12 months Date Recommendation
19 February 2015 Overweight Historical recommendation changes for HBMGR 3 7/8 02/20 in the last 12 months Date Recommendation
19 February 2015 Marketweight Historical recommendation changes for MDMFP 9 08/20 in the last 12 months Date Recommendation
19 February 2015 Overweight Historical recommendation changes for THOEUR 7 3/8 07/19 in the last 12 months Date Recommendation
08 December 2014 Overweight
19/02/2015

Disclaimer
46
Berenberg distribution of recommendations and in proportion to investment banking services Overweight 27.35 % 9.09 % Underweight 26.50 % 18.18 % Marketweight 46.15 % 72.73 %
Valuation basis / recommendation key
Overweight: Sustainable spread tightening potential higher 10% within 3-6 months.
Underweight: Sustainable spread widening potential lower 10% within 3-6 months.
Marketweight: Limited spread movement potential. No immediate catalyst visible.
NB The Bank’s Fixed Income Research Department does not make recommendations on the basis of absolute performance, but on performance expected relative to the market or peer group as spreads move with markets and sectors as well as with the issuer itself.
Competent supervisory authority
Bundesanstalt für Finanzdienstleistungsaufsicht -BaFin- (Federal Financial Supervisory Authority), Graurheindorfer Straße 108, 53117 Bonn and Lurgiallee 12, 60439 Frankfurt am Main
19/02/2015

Disclaimer
47
General investment-related disclosures
Joh. Berenberg, Gossler & Co. KG (hereinafter referred to as „the Bank“) has made every effort to carefully research all information contained in this financial analysis. The information on which the financial analysis is based has been obtained from sources which we believe to be reliable such as, for example, Thomson Reuters, Bloomberg and the relevant specialised press as well as the company which is the subject of this financial analysis.
Only that part of the research note is made available to the issuer (who is the subject of this analysis) which is necessary to properly reconcile with the facts. Should this result in considerable changes a reference is made in the research note.
Opinions expressed in this financial analysis are our current opinions as of the issuing date indicated on this document. We do not commit ourselves in advance to whether and in which intervals an update is made. The companies analysed by the Bank are divided into two groups: “full coverage“ - continued updates - and “screening coverage“ - updates as and when required in irregular intervals.
The functional job title of the person/s responsible for the recommendations contained in this report is “Fixed-Income Research Analyst” unless otherwise stated on the cover.
The following internet link provides further remarks on our financial analyses:
https://www.berenberg.de/en/fir_en.html
The following internet link provides further remarks on our financial analyses:
https://www.berenberg.de/en/fir_en.html
19/02/2015

Disclaimer
48
Legal disclaimer
This document has been prepared by Joh. Berenberg, Gossler & Co. KG (hereinafter referred to as „the Bank“). This document does not claim completeness regarding all the information on the stocks, stock markets or developments referred to in it. On no account should the document be regarded as a substitute for the recipient procuring information for himself/herself or exercising his/her own judgements. The document has been produced for information purposes for institutional clients or market professionals. Private customers, into whose possession this document comes, should discuss possible investment decisions with their customer service officer as differing views and opinions may exist with regard to the stocks referred to in this document. This document is not a solicitation or an offer to buy or sell the mentioned stock. The document may include certain descriptions, statements, estimates, and conclusions underlining potential market and company development. These reflect assumptions, which may turn out to be incorrect. The Bank and/or its employees accept no liability whatsoever for any direct or consequential loss or damages of any kind arising out of the use of this document or any part of its content. The Bank and/or its employees may hold, buy or sell positions in any securities mentioned in this document, derivatives thereon or related financial products. The Bank and/or its employees may underwrite issues for any securities mentioned in this document, derivatives thereon or related financial products or seek to perform capital market or underwriting services.
Analyst certification
I, Jannik Prochnow, hereby certify that all of the views expressed in this report accurately reflect my personal views about any and all of the subject securities or issuers discussed herein. In addition, I hereby certify that no part of my compensation was, is, or will be, directly or indirectly related to the specific recommendations or views expressed in this research report, nor is it tied to any specific investment banking transaction performed by the Bank or its affiliates.
19/02/2015

Disclaimer
49
Remarks regarding foreign investors
The preparation of this document is subject to regulation by German law. The distribution of this document in other jurisdictions may be restricted by law, and persons into whose possession this document comes should inform themselves about, and observe, any such restrictions. United Kingdom
This document is meant exclusively for institutional investors and market professionals but not for private customers. It is not for distribution to or the use of private investors or private customers. United States of America
This document has been prepared exclusively by the Bank. Although Berenberg Capital Markets LLC, an affiliate of the Bank and registered US broker-dealer, distributes this document to certain customers, Berenberg Capital Markets LLC does not provide input into its contents, nor does this document constitute research of Berenberg Capital Markets LLC. In addition, this document is meant exclusively for institutional investors and market professionals, but not for private customers. It is not for distribution to or the use of private investors or private customers.
This document is classified as objective for the purposes of FINRA rules. Please contact Berenberg Capital Markets LLC (+1 617.292.8200), if you require additional information.
19/02/2015

Disclaimer
50
Third-party research disclosures
Company Disclosures Alain Afflelou no disclosures Darty PLC no disclosures Dufry no disclosures Hornbach Baumarkt AG no disclosures Maisons du Monde no disclosures THOM Europe SAS no disclosures (1) Berenberg Capital Markets LLC owned 1% or more of the outstanding shares of any class
of the subject company by the end of the prior month.* (2) Over the previous 12 months, Berenberg Capital Markets LLC has managed or co-managed
any public offering for the subject company.* (3) Berenberg Capital Markets LLC is making a market in the subject securities at the time of the
report. (4) Berenberg Capital Markets LLC received compensation for investment banking services in
the past 12 months, or expects to receive such compensation in the next 3 months.* (5) There is another potential conflict of interest of the analyst or Berenberg Capital Markets
LLC, of which the analyst knows or has reason to know at the time of publication of this research report.
* For disclosures regarding affiliates of Berenberg Capital Markets LLC please refer to the ‘Disclosures in respect of section 34b of the German Securities Trading Act (Wertpapierhandelsgesetz – WpHG)’ section above.
Copyright
The Bank reserves all the rights in this document. No part of the document or its content may be rewritten, copied, photocopied or duplicated in any form by any means or redistributed without the Bank’s prior written consent. © February 2015 Joh. Berenberg, Gossler & Co. KG
19/02/2015

4. Contacts
Contacts
52
E-Mail: [email protected]
Internet: www.berenberg.com
INSTITUTIONAL SALES / SALES TRADING
Hamburg
Institutional Sales
Michael Brehmer
+49 40 350 60 704
Nico Bürger
+49 40 350 60 483
Sabine Hahn
+49 40 350 60 754
Lutz-Dieter Mikus
+49 40 350 60 752
Ingo Pufahl
+49 40 350 60 499
Sven Zimatrys
+49 40 350 60 390
Sales Trading
Jan Bruhns
+49 40 350 60 703
Dusseldorf
Institutional Sales
Jörg Bunse
+49 211 540 728 44
Stephan Burmeister
+49 211 540 728 41
Sebastian Krammich
+49 211 540 728 43
Sales Trading
Daniel Meier
+49 211 540 728 42
London
Institutional Sales
Stefan Binder
+44 20 3207 7882
Conor Daly
+44 20 3465 2734
Romain Foussadier
+44 20 3465 2695
Owen Powell
+44 20 3465 2735
Alexandru Toroican
+44 20 3207 7919
Vienna
Institutional Sales
Marco Ferrari
+43 1 22 757 0
Klaus Giesecke
+43 1 22 757 14
Stefan Haupt
+43 1 22 757 20
Dr. Robert Hengl
+43 1 22 757 22
Gerald Kohlmayer
+43 1 22 757 18
Christoph Mayrhofer
+43 1 22 757 12
Iris Sahinoglu
+43 1 22 757 17
Dr. Marija Tomic
+43 1 22 757 16
Ilenia Tonetti
+43 1 22 757 19
Martin Zezula
+43 1 22 757 21
Sales Trading
Aleksandar Doric
+43 1 22 757 24
Rainer Kapeller
+43 1 22 757 13
DEBT CAPITAL MARKETS
Frankfurt/Main
Dominik Gansloser
+49 69 91 30 90 566
Jennifer Rojahn
+49 69 91 30 90 562
Sven-Erik Schipanski
+49 69 91 30 90 560
Christian Wagner
+49 69 91 30 90 564
Christian Wöckener-Erten
+49 69 91 30 90 565
Vienna
Alexandra Ács
+43 1 227 57 23
Renate Mayer
+43 1 227 57 15
RESEARCH
Corporates
Alexandre Daniel
+49 69 91 30 90 593
Jannik Prochnow
+49 69 91 30 90 595
Patrick Weber
+49 69 91 30 90 594
Public Sector & Financials
Philipp Jäger, CIIA, FRM
+49 69 91 30 90 590
Helge Schunck
+49 69 91 30 90 591
Timo Segieth
+49 69 91 30 90 592
19/02/2015


![[Goldman Sachs] Fixed Income Research - The Investment Implications of an Inverted Yield Curve](https://img.dokumen.tips/doc/110x75/577d2f6c1a28ab4e1eb1abfd/goldman-sachs-fixed-income-research-the-investment-implications-of-an-inverted.jpg)