Embed Size (px)
Citation preview

Glasgow Theses Service http://theses.gla.ac.uk/
Fitzpatrick, Amanda (2012) Multifocal motor neuropathy: a trial of therapeutic complement inhibition, and investigation of serological factors. MSc(R) thesis. http://theses.gla.ac.uk/3220/ Copyright and moral rights for this thesis are retained by the author A copy can be downloaded for personal non-commercial research or study, without prior permission or charge This thesis cannot be reproduced or quoted extensively from without first obtaining permission in writing from the Author The content must not be changed in any way or sold commercially in any format or medium without the formal permission of the Author When referring to this work, full bibliographic details including the author, title, awarding institution and date of the thesis must be given

MULTIFOCAL MOTOR NEUROPATHY:
A TRIAL OF THERAPEUTIC COMPLEMENT
INHIBITION, AND INVESTIGATION OF
SEROLOGICAL FACTORS
Dr. Amanda Fitzpatrick, B MedSci(Hons), MBChB
A thesis submitted in fulfilment of the requirements
of the University of Glasgow for the
degree of Master of Research,
Institute of Infection, Immunity and Inflammation,
College of Medical, Veterinary and Life Sciences,
University of Glasgow
January 2011, Revised October 2011

Abstract
Immune-mediated neuropathies cause inflammation of the peripheral nerve, with
disruption of the axon, myelin sheath or both. In the acute setting, immune-mediated
neuropathy can lead to respiratory muscle weakness, in the group of Guillain-Barré
syndrome (GBS). In the chronic setting, immune-mediated neuropathies, which can
be sensorimotor (CIDP, MADSAM), sensory predominant (anti-MAG neuropathy,
others) and purely motor (MMN), cause permanent and progressive disability and
impairment in activities of daily living.
Anti-gangliosides antibodies have been detected with varying frequencies in the
immune-mediated neuropathies, with the highest prevalence being anti-GQ1b
antibodies in Miller-Fisher syndrome and anti-GM1 antibodies in MMN and AMAN
(axonal variant of GBS). There is evidence that the inflammatory potential of these
antibodies is reliant upon complement activation, and the resultant formation of the
MAC (membrane attack complex). In experimental models of anti-ganglioside
mediated neuropathy, inhibition of the complement cascade results in the complete
prevention of inflammatory damage, and preserved nerve function.
Multifocal motor neuropathy is a chronic, progressive purely motor neuropathy which
causes weakness and wasting. IgM anti-GM1 antibodies are found in between 50 –
80% of affected cases. The only current treatment for MMN is high dose IVIg
(intravenous immunoglobulin). The response rate to IVIg is around 80%, and cases
who are antibody negative can also respond to this treatment. However, the effect is
temporary, and further doses are usually re-administered at around 4 weekly
intervals. Since it is a human blood product which is pooled from donated blood
products, it is in short supply and does carry some important side effects.
The main focus of this study was to test a novel therapy for immune-mediated
neuropathy. The treatment tested was the first complement inhibitor licensed for
human use, eculizumab. In this study it has been tested in the treatment of MMN, in
patients who may also be receiving treatment with IVIg. The aim was to collect safety
information regarding the concurrent use of these biological products, and to test for
any neutralising effect between them. Any beneficial effect of complement inhibition in
MMN was investigated by various outcome measures, clinical, functional and
electrophysiological.
The results of the clinical trial showed that eculizumab treatment was associated with
a higher rate of adverse events, in patients who were or were not receiving IVIg. Most
adverse events were mild to moderate in severity, none were unexpected, and more
occurred during the induction phase of treatment than during the maintenance phase.
The most common adverse event was headache, which 69% of patients experienced
at any time. Two thirds of all headaches occurred in the induction phase. IVIg did
lower the serum concentration of eculizumab, however eculizumab activity was not
compromised.
There were significant changes to subjective scores overall, and some objective
scores also displayed significant improvement. However repeated IVIg doses were
still required by those who were regularly using it prior to the study, albeit perhaps at
slightly longer intervals. Electrophysiology showed small significant improvement in
two parameters in keeping with improved nerve conduction. Overall it was felt that
complement inhibition was associated with some potential benefits in MMN however
did not substitute the therapeutic mechanism of action of IVIg. Aspects of the study
design meant that evidence of efficacy could not be concluded from this study, and
further trials are necessary to elucidate this.
In addition, this thesis presents a laboratory-based study in which further information
about the binding characteristics of the IgM GM1 antibody were sought using different
methods than the standard ELISA technique. Using a combinatorial glycolipid
microarray, MMN sera were screened against a large range of glycolipid pairs, to test
for novel epitopes in the ‘antibody negative’ MMN patients without anti-GM1 antibody.
It was found that in patients who did not have an antibody to GM1 or any other single
ganglioside on ELISA or microarray, there was presence of an antibody to the
glycolipid pair, GM1:GalC. It was shown that the IgM GM1 antibody in MMN is also
inhibited from binding to GM1 in a solid phase and live membrane due to the local
presence of GD1a. These findings lead to greater understanding of the pathogenesis
of MMN and possibility of a more sensitive diagnostic test.

Table of contents
Abbreviations 1
Acknowledgements 4
Declaration of Authorship 6
1. Introduction 7
1.1 Overview of peripheral nervous system 7
1.1.1 Peripheral nerve structure and function 7
1.1.2 Blood-nerve barrier 7
1.1.3 Electrophysiology 8
1.1.3.1 Nerve conduction studies (NCS) 8
1.1.3.2 Electromyography (EMG) 9
1.1.4 Classification of peripheral neuropathy 9
1.2 Immune-mediated neuropathy 10
1.3 Multifocal Motor Neuropathy 12
1.3.1 History 12
1.3.2 Clinical features 13
1.3.3 Electrodiagnostic criteria 13
1.3.4 Pathology 16
1.3.5 Treatment of MMN 16
1.3.6 Anti-ganglioside antibodies in MMN 17
1.4 Anti-ganglioside antibodies in the pathogenesis of immune-mediated neuropathy
1.4.1 Gangliosides 17

1.4.2 Anti-ganglioside antibodies in neuropathy 18
1.4.3 Evidence of pathogenic potential of anti-ganglioside antibodies 19
1.4.4 Complement system 20
1.4.5 Complement as a therapeutic target in autoimmune neuropathy 22
1.5 Eculizumab 23
1.6 Research aims 25
2 Clinical trial: Methods 26
2.1 Patients 26
2.2 Inclusion and exclusion criteria 26
2.3 Study drug 27
2.4 Study design 27
2.5 Clinical assessments 28
2.6 Deterioration point criteria 31
2.7 Electrophysiology 32
2.8 Pharmacological tests 32
2.9 Detection of anti-ganglioside antibodies 33
2.10 Adverse events and safety reporting 33
2.11 The role of the author 34
2.12 Ethics and monitoring 35
2.13 Statistics 35
3 Results 37
3.1 Patients 37
3.2 Safety 38

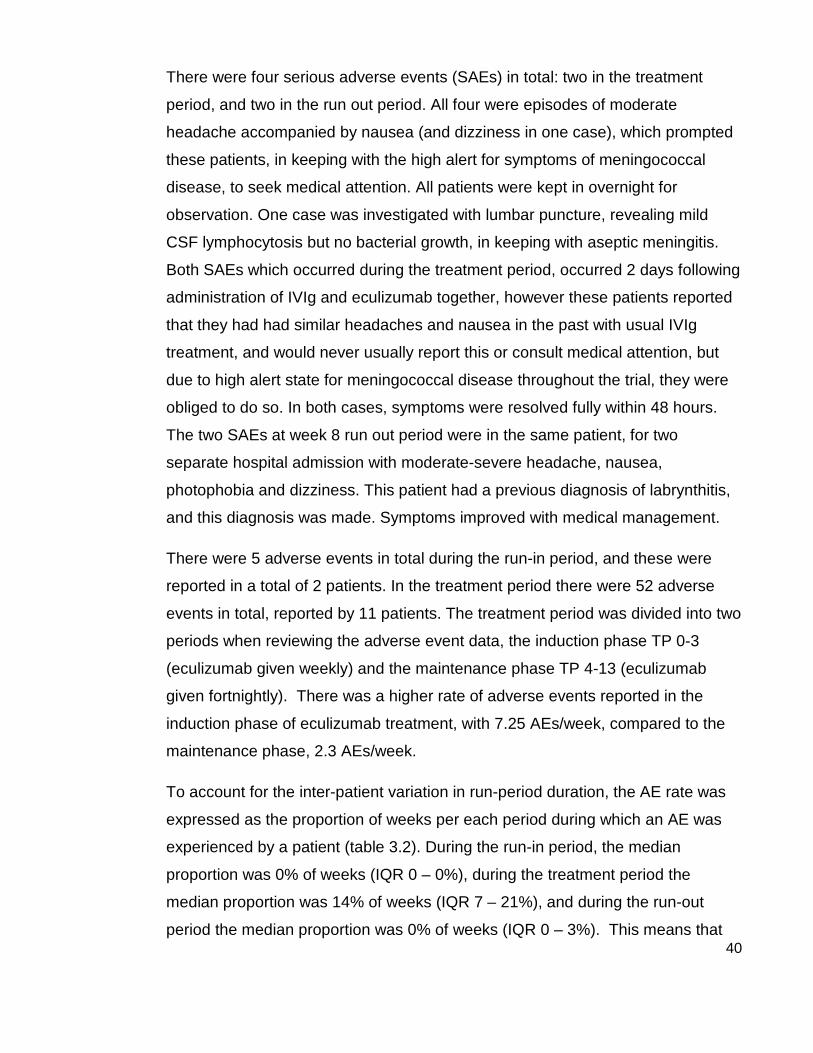
3.3 Pharmacological studies 44
3.4 Intravenous immunoglobin requirements 46
3.5 Muscle strength 48
3.6 Timed assessments 52
3.7 Subjective assessments 53
3.8 Responders versus non-responders 56
3.9 Electrophysiology 57
4 Discussion 60
4.1 Safety 60
4.2 Pharmacokinetic and pharmacodynamics 61
4.3 Secondary outcome measures 64
4.4 Electrophysiology 67
4.5 Conclusion and future work 69
5 Laboratory work: Investigating the serological factors in MMN 70
5.1 Introduction 70
5.1.1 Anti-GM1 antibody in MMN 70
5.1.2 Glycolipid complex microarrays 71
5.1.3 PC12 cells 72
5.1.4 Neuraminidase 73
5.1.5 Cholera toxin B subunit 74
5.1.6 Fluorescence-activated cell sorting (FACS) analysis 74
5.1.7 Research aims 75
5.2 Methods 75

5.2.1 ELISA 75
5.2.2 Microarray 76
5.2.3 PC12 cell culture 76
5.2.4 Immunohistochemistry 77
5.2.5 FACS analysis 78
5.3 Results 79
5.3.1 Combinatorial microarray 79
5.3.2 ELISA vs microarray 80
5.3.3 GM1 binding in complex with other glycolipids 81
5.3.4 GM1:GalC association with disease 82
5.3.5 Immunohistochemistry of PC12 cells 84
5.3.6 FACS analysis 89
5.3.7 Correlation between solid-phase and fluid phase membrane binding
characteristics 93
5.4 Discussion 96
6 Conclusion of Thesis 101
Appendix 1: Patient information sheet 103
Appendix 2: Clinical Trial publication 112
Reference List 121
List of Tables
Table 2.1 Clinical Assessments
Table 2.2 Deterioration Point (DP) Criteria
Table 3.1 Clinical Features
Table 3.2 Summary of adverse event characteristics

List of Figures
Figure 1.1 Motor nerve conduction study
Figure 1.2 Electrodiagnostic criteria in MMN
Figure 1.3 Basic structure of major neural gangliosides
Figure 1.4 Complement cascade
Figure 2.1 Study design flowchart
Figure 3.1 Study progress diagram
Figure 3.2 Pharmacological data
Figure 3.3 Intravenous immunoglobulin requirements
Figure 3.4 SEFR score of individual patient
Figure 3.5 Muscle strength measurements
Figure 3.6 MRC sum score at successive deterioration points
Figure 3.7 Pinch and palm grip (vigorimetry)
Figure 3.8 Timed assessments
Figure 3.9 SEFR score
Figure 3.10 Subjective assessments
Figure 3.11 Responders vs. non-responders
Figure 3.12 Electrophysiology
Figure 3.13 Comparison of conduction block and distal CMAP amplitude
changes over the pre-trial period
Figure 5.1 Schematic illustration of the effect of neuraminidase on
gangliosides with terminal sialic acid
Figure 5.2 Combinatorial glycolipid microarray
Figure 5.3 Correlation between ELISA and microarray for GM1 single
Figure 5.4 GM1:glycolipid complex binding
Figure 5.6 GM1:GalC complex enhancement
Figure 5.7 Fluorescent-labelled Cholera toxin B in neuraminidase treated
cells
Figure 5.8 Binding of anti-GM1 monoclonal antibodies to PC12 cells treated
with neuraminidase.
Figure 5.9 Binding of MMN sera to PC12 cells treated with neuraminidase.
Figure 5.10 FACS analysis of neuraminidase-treated PC12 cells
Figure 5.11 The effect on neuraminidase treatment of MMN sera binding to PC12 cells.
Figure 5.12 Relationship between PC12 binding and combinatorial microarray binding


1
Abbreviations
APB abductor pollicis brevis
AchR-Ab acetycholine receptor antibody
AE adverse event
AIDP acute inflammatory demyelinating polyradiculoneuropathy
AMAN acute motor axonal neuropathy
CB conduction block
CIDP chronic inflammatory demyelinating polyradiculoneuropathy
CMAP compound muscle action potential
CSF cerebrospinal fluid
CTB Cholera toxin B subunit
CMV cytomegalovirus
DAPI 4',6-diamidino-2-phenylindole
DMC Data Monitoring Committee
DML distal motor latency
DP deterioration point
EMG electromyography
ELISA enzyme linked immunosorbent assay
EBV Epstein-Barr virus
EFNS European Federation of Neurological Societies
EQ5D European Quality of life scale

2
FcRn neonatal Fc receptor
FITC Fluorescein isothiocyanate
FACS Fluorescence-activated cell sorting
GAD glutamic acid decarboxylase
GBS Guillain-Barré syndromes
HAHA human anti-human antibody
HNLPP hereditary neuropathy with liability to pressure palsies
HIV human immunodeficiency virus
HRP horseradish peroxidase
IgG immunoglobulin-G
IgM immunoglobulin-M
IU intensity units
IQR inter-quartile range
IVIg intravenous immunoglobulin
LOS lipo-oligosaccharide
mAb monoclonal antibody
MAC membrane attack complex
MADSAM multifocal acquired demyelinating sensory and motor neuropathy
MAG myelin-associated glycoprotein
MBP mannose-binding proteins
MRC Medical Research Council

3
MFU mean fluorescence unit
MFS Miller-Fisher syndrome
MMN multifocal motor neuropathy
MSF muscle strength (force)
NCS nerve conduction studies
NGF nerve growth factor
9HPT nine-hole peg test
OD optical density
ONLS Overall Neuropathy Limitation Scale
PNH paroxysmal nocturnal haemoglobinuria
PD pharmacodynamic
PK pharmacokinetic
PVDF polyvinylidene fluoride
RI run-in period
RID0 run-in day zero
SEFR Self Evaluated Functional Rating Scale
SAE serious adverse event
TD temporal dispersion
TESS treatment emergent signs or symptoms
TP treatment period
4
Acknowledgements
Professor Hugh Willison, who supervised all aspects of this project, was a great
source of inspiration, encouragement and guidance. Firstly he provided me with
great opportunity to run this project, and throughout has nurtured, with patience
and understanding, my development as a researcher. He has been, and will
remain, a valuable mentor to me in both clinical and academic medicine.
There were many people who made the clinical trial come to fruition, and run
efficiently. Firstly, of course, I would like to express much gratitude and warmth to
the patients with MMN who took part in this study, diligently completed all
assessments and accommodated all extra trial visits into their schedules. Alexion
pharmaceutical provided the study drug, performed pharmacological assays, and
Dr John Beauchamp in particular for providing support and advice. The Glasgow
Clinical Trials Unit (NHS Greater Glasgow and Clyde and University of Glasgow)
was a vital resource for expertise in running clinical trial and access to vital
services: the clinical research nurses came from this unit, who brought their
experience to this trial and assisted with vital patient care during administration,
assessment and diligent documentation. The Robertson centre for Biostatistics
(University of Glasgow) provided excellent guidance on the data collection, form
design, safety reporting and database management, in particular Liz Anderson
and Lizzie Thomson. Dr Sarah Barry, the trial statistician, provided an in-depth
analysis of the results, and aided in the presentation of findings, her expertise
was crucial. Members of the Data Monitoring Committee, Professors Donald
Grosset, Richard Hughes and Ian McInnes, were wonderful support and brought
individual areas of expertise.
At the study site, Institute of Neurological Science, Southern General Hospital,
there were many departments which assisted in smooth running of the trial;
Audrey Leitch and other trial pharmacists; nurses on ward 68, who are a great
source of support to patients attending with autoimmune neuropathy, provided
great understanding to the running of the trial. Dr Cameron Mann, the trial
neurophysiologist, provided me with excellent education of electrophysiology,

5
accommodated trial assessments with ease, and provided expertise in the
interpretation of results. Also, all members of staff in the diagnostic
neuroimmunology lab were of great help, in particular Pat Thomson who taught
me ELISA technique.
Further to this, Prof Willison’s research team at the GBRC, University of
Glasgow, were involved in helping experimental work. Dr Simon Rinaldi, Dr Katie
Brennan and Dr Kay Greenshields provided great mentorship and advice on
running experiments from their own experience, in particular with the microarray.
Francesc Galban, was vital in the lab work, and assisted me greatly with the
microarray experiment. Simon Fewou taught me tissue culture and
immunohistochemistry, with great patience and technique.
Finally I am grateful to my close friends and my family, for their providing
wonderful perspective from outside the field, and their support and
encouragement throughout this period of research.

6
Declaration of Authorship
I declare that the work presented here is my own, unless
where acknowledged otherwise.
Dr Amanda Fitzpatrick, BMedSci (Hons), MBChB
Initial submission: January 2011
Revised: October 2011

7
Chapter 1. Introduction
1.1 Overview of peripheral nervous system
1.1.1 Peripheral nerve structure and function
The peripheral nerves control motor, sensory and autonomic functions of muscles
and organs, relaying afferent and efferent information from the brain to the rest of
the body, such as the stimulus for muscle contraction or sensation of pain. The
peripheral nerves comprise 12 cranial nerves and 31 spinal nerves in pairs. Each
nerve is composed of bundles of nerve fibres, which themselves comprise
multiple axons lying adjacent to each other. The cell bodies of these axons reside
in the ganglia, within the gray matter of the spinal cord (or the brain stem for
cranial nerves). The dorsal root ganglion contains the cell bodies of sensory
nerves; the anterior horn cell at the ventral root contains the cell bodies of the
motor nerves.
With the exception of small (less than 1µm diameter) fibres, all peripheral nerves
are myelinated. Myelin is produced by the Schwann cells, a type of glial cell
which exists in the endoneurium of the peripheral nerves. Myelin is composed of
around 80% protein and 20% lipid, a large amounts of which are glycosylated,
that is, they bear sugar moieties on their surface. The major function of myelin is
to insulate axons, allowing faster conduction of nerve impulses. At the distal end
of the nerve fibre is the interface with the effector tissue. For motor nerves this is
called the motor end plate, or the nerve terminal. Here the axons emerge from
the myelin-encasing and communicate with the muscle unit by release of
neurotransmitter. Each axon stimulates one motor unit within a muscle, and
parallel axon firing results in summation of individual motor units contracting
simultaneously and thus results in muscle contraction (Shin J.Oh,2003a).
1.1.2 Blood-nerve barrier
The function of the blood-nerve barrier, similarly to the blood brain barrier, is to
protect excitable neural tissue from potentially toxic substances in the circulation,
and maintenance of the ionic homeostasis the endoneural space. It is formed by
8
the specialised endothelium of blood vessels which pass through peripheral
nerves, lined by cells that are non-fenestrated, sealed by tight junctions, lined by
a basement lamina and coated with negatively charged glycolipids that
electrostatically repel many proteins (Kiernan,1996).
1.1.3 Electrophysiology
Nerve impulses, generated in the cell body, are propagated distally by conduction
of action potentials along the axonal membrane, by the depolarisation of the cell
membrane, which is driven by movement of sodium and potassium ions. The role
of the myelin sheath is to accelerate the journey of electrical charge, by insulating
the axon and therefore preventing the repolarisation while the impulse travels its
length. There are gaps between the myelinated nerve segments at intervals
along the axon, known as the nodes of Ranvier, and at these non-myelinated
points the axon then can repolarise. In this way, the nerve impulse jumps from
node to node, known as ‘saltatory’ conduction (Shin J.Oh,2003a).
Nerve conduction and muscle contraction properties are studied in the field of
electrophysiology, and the techniques employed are essential tools for the clinical
and experimental study of peripheral nerve disease.
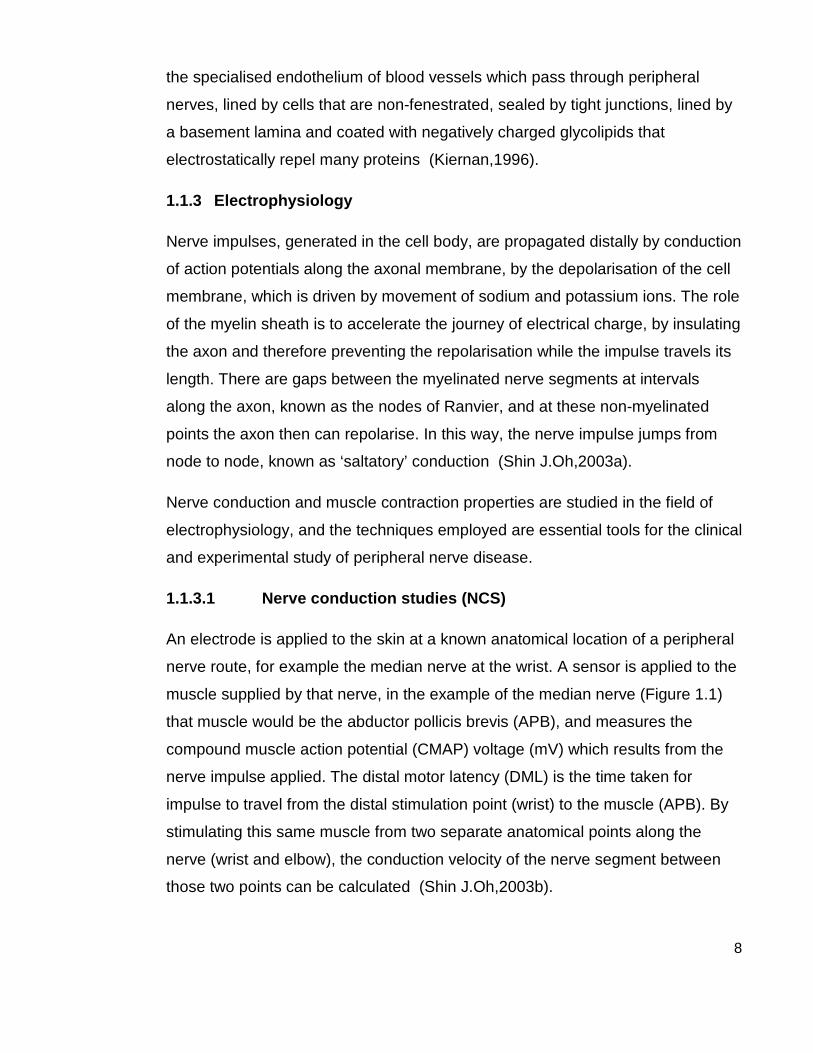
1.1.3.1 Nerve conduction studies (NCS)
An electrode is applied to the skin at a known anatomical location of a peripheral
nerve route, for example the median nerve at the wrist. A sensor is applied to the
muscle supplied by that nerve, in the example of the median nerve (Figure 1.1)
that muscle would be the abductor pollicis brevis (APB), and measures the
compound muscle action potential (CMAP) voltage (mV) which results from the
nerve impulse applied. The distal motor latency (DML) is the time taken for
impulse to travel from the distal stimulation point (wrist) to the muscle (APB). By
stimulating this same muscle from two separate anatomical points along the
nerve (wrist and elbow), the conduction velocity of the nerve segment between
those two points can be calculated (Shin J.Oh,2003b).

9
To measure nerve conduction velocity of the proximal, and thus inaccessible to
testing, nerve segments, the late response, or F-wave, is calculated. Using
supramaximal stimulation of the distal nerve segment, the F-wave latency
records the time for the impulse to travel from the point of stimulation, proximally
to reach the spinal nerve root, and a small reflection of the impulse to travel
distally back to the motor end plate. From this the velocity of conduction from the
point of stimulation to the spinal cord can be derived (Shin J.Oh,2003b).
The main objective of nerve conduction studies is to 1) identify the anatomical
pattern of nerve dysfunction and 2) differentiate between axonal and
demyelinating pathology. NCS features of axonal neuropathy are reduced or
absent distal CMAPs, with normal conduction velocity and distal motor latencies.
On the contrary, demyelinating neuropathies cause delayed conduction, with
prolonged DML, slowed conduction velocities, and prolonged F-wave latencies
(Hughes,2002) .
1.1.3.2 Electromyography (EMG)
Using a needle electrode inserted into the muscle belly, muscle activity is
recording during at rest and during active contraction against resistance. In the
resting phase, any spontaneous (abnormal) activity can be recorded, such as
fibrillation, which is a signal of ongoing denervation. In the contraction phase, the
motor unit activity can be visualised (and heard) as an interference pattern,
comprising characteristic waveforms for each motor unit, repeated with
increasing frequency as the force of contraction increases (Shin J.Oh,2003b).
1.1.4 Classification of peripheral neuropathy
The term neuropathy is generally understood to mean peripheral neuropathy, in
which there is disruption of the peripheral nervous system. The clinical features
depend on the anatomical and functional distribution of the disruption, and
include motor symptoms (weakness, muscle wasting), sensory symptoms
(numbness, pain, paraesthesia) and autonomic symptoms (nausea, postural
hypotension and urinary retention). The population prevalence of neuropathy is
10
about 2400 per 100 000 (2.4%), rising with age to 8000 per 100 000 (8%)
(Martyn et al.,1997).
Conditions affecting the peripheral nerves can be classified by different features
(Poncelet,1998)
1) Type of nerve involved: purely motor, purely sensory, sensorimotor, or
autonomic.
2) Sites of nerve damage: proximal, distal, symmetrical, multifocal,
mononeuropathy, and polyneuropathy
3) Aetiology: toxic, infective, autoimmune, diabetic, paraneoplastic,
nutritional, mechanical, hereditary.
The most common neuropathy in the developed world is diabetic neuropathy,
which tends to be a distal symmetrical sensory polyneuropathy (Llewelyn,1995).
Autonomic and cranial (third nerve palsy) neuropathies are also encountered in
diabetes. In developing countries, infective causes are prevalent, mostly related
to HIV infection (and the medications used to treat HIV), causing a painful distal
sensorimotor polyneuropathy (Gonzalez-Duarte et al.,2008). Neuropathy caused
by Mycobacterium leprae (leprosy) remains the most common treatable
neuropathy in the world, although its prevalence is declining worldwide, the
number of new cases worldwide in 2006 was 250,000, mainly found in areas of
extreme poverty (Scollard et al.,2006).
1.2 Immune-mediated neuropathy
Immune-mediated neuropathies are characterised by inflammatory pathology,
and have an immune-related pathogenesis. Immune-mediated neuropathies can
first be divided into acute and chronic.
Acute immune-mediated neuropathy is better known as the Guillain-Barré
syndrome (GBS), and is characterised by acute onset symmetrical limb
weakness and sensory change, which reaches a nadir within less than 4 weeks
(Hadden et al.,1998). Typically, the weakness is ascending, however in the Miller
11
Fisher variant this is typically descending. The two main disease groups in GBS
are AIDP (acute inflammatory demyelinating polyradiculoneuropathy) and AMAN
(acute motor axonal neuropathy). The overall incidence of GBS worldwide is
rare, at around 1.5/100,000 per year (Alshekhlee et al.,2008), however it is the
leading cause of neuromuscular paralysis and is potentially life threatening
(mortality 2-3%). Although GBS is self remitting, the average recovery to walking
unaided time without treatment is 100 days, and 20% of cases (despite
treatment) are left with permanent disability at 2 years (Rees et al.,1998), or can
progress to a chronic form.
In the chronic immune-mediated neuropathy group, there are CIDP (chronic
inflammatory demyelinating polyradiculoneuropathy), MMN (multifocal motor
neuropathy), MADSAM (multifocal acquired demyelinating sensory and motor
neuropathy), anti-MAG neuropathy and paraproteinaemic neuropathies.
CIDP is a sensorimotor polyneuropathy which reaches it nadir in more than 8
weeks, and includes progressive and relapsing phenotypes. The prevalence is 3-
4/100,000 with equal numbers of men and women affected. Unlike GBS,
respiratory muscle weakness is uncommon. Electrophysiology shows widespread
features of demyelination. First line treatment in CIDP remains corticosteroids,
and between 65 – 95% of patients respond favourably to steroids. Other
treatment options are IVIg (intravenous immunoglobulin) and plasma exchange,
which all show similar efficaciousness to corticosteroids (van Schaik et al.,2002).
MADSAM, originally known as Lewis-Sumner syndrome, is thought to be a
variant of CIDP, and is similar to MMN due to the presence of conduction block in
motor nerves. However, in MADSAM there are also significant sensory
abnormalities (Verschueren et al.,2005).
Anti-MAG neuropathy is characterised by a slowly progressive sensory
neuropathy, with an upper limb tremor and unsteadiness of gait. It is usually
associated with IgM paraprotein directed against myelin-associated glycoprotein
(MAG). Treatment with IVIg, plasma exchange and corticosteroids have not
12
shown great benefit, however recently rituximab has shown significant short and
long-term benefit (Dalakas,2010).
1.3 Multifocal Motor Neuropathy
1.3.1 History
It is impossible to explain the background to MMN without introducing the
concept of conduction block. The phenomenon, of inability of nerve impulse
propagation beyond a certain point in the nerve, has been described in nerves
following trauma since around 1860, and experimentally reproduced (using
tourniquets) since 1944, following which electrophysiology of conduction block
was investigated (Trojaborg,1978). It was initially thought that conduction block
was a reversible lesion which resolved in less than 2 months, however later
studies described conduction block lasting months following trauma
(Harrison,1976; Trojaborg,1977), and at common compression points, in the
condition now known as ‘hereditary neuropathy with liability to pressure palsies’
(HNLPP) (Magistris et al.,1985).
In succession, came the discovery of conduction block in motor nerves of
patients who were thought to have a lower motor neuron variant of motor
neurone disease (MND) (Roth et al.,1986). Various neurologists in the late
1980’s described similar findings, where conduction block of motor, but not
sensory nerves, was found in patients presenting with asymmetrical,
predominantly upper limb weakness and wasting, and absence of sensory
symptoms (Parry et al.,1988). Initially it was presumed that this was a motor-
predominant variant of CIDP, but when treatment with high dose corticosteroids,
known to improve CIDP, failed to show benefit in this motor-variant, it was
suspected that this disease was in fact a separate entity (Pestronk et al.,1988).
In addition, immunological testing of patients with this condition showed that IgM
antibodies against GM1 and other gangliosides existed in the majority of cases
(50 – 80%). Since then hundreds of cases of MMN have been described,
however it remains rare, with an estimated prevalence of between 1 to 2 per
100,000 population.

13
1.3.2 Clinical features
Multifocal motor neuropathy (MMN) is distinct from other chronic immune-
mediated neuropathies, due to its characteristic clinical and electrophysiological
features. Distal motor nerve paralysis usually involves the upper limbs initially,
with a stepwise, asymmetric progression to involve motor nerves at other sites.
Muscle atrophy occurs later in the course of the condition and usually involves
distal small muscles first (Biessels et al.,1997; Bouche et al.,1995; Krarup et
al.,1990). Sensory nerves are rarely affected although some patients may have
minor sensory symptoms (Krarup et al.,1990). Conduction block across a motor
nerve segment is the electrophysiological hallmark, and essential criterion for
diagnosis (Bouche et al.,1995; van Schaik et al.,2006).
1.3.3 Electrodiagnostic criteria
As described in the previous section, nerve conduction studies are used to
measure the velocity of nerve impulses, and the magnitude of effector response
in the muscles innervated by motor nerves. Figure 1.1 demonstrates the
electrophysiological phenomenon of conduction block, where stimulation of the
median nerve at the wrist results in a CMAP in the APB muscle of the hand,
however when the median nerve is stimulated more proximally, no CMAP is
detected in the APB muscle. This means that between the stimulation points at
the wrist and the elbow, conduction block exists, and in the case illustrated, this
appears to be an almost 100% diminution. The degree of conduction block is
expressed as the % CMAP amplitude (or area) reduction, calculated by ((distal
CMAP – proximal CMAP/distal CMAP) x 100%).

14
Figure 1.1 Motor nerve conduction study showing conduction block in the right median nerve (left panel), and a schematic drawing (right) showing the anatomical origin of this. Nerve stimulation at the anatomical locations of the median nerve 1) wrist 2) elbow and 3) axilla, and the corresponding CMAP recorded from the abductor pollicis brevis muscle in the hand. The CMAP amplitude is reduced to almost zero when the nerve is stimulated at the elbow, showing that conduction block occurred in the median nerve between the wrist and the elbow. The CMAP recorded from stimulation at the axilla is temporally dispersed and therefore no statement regarding conduction block can be made about this nerve segment, although this dispersion in itself may represent demyelination in this nerve segment.
American (Olney et al.,2003) and European (van Schaik et al.,2006) consensus
criteria exist for the diagnosis of MMN, and the electrodiagnostic criteria differ
slightly in the definition of ‘probable’ conduction block, but are otherwise similar.
Figure 1.2 presents the electrodiagnostic criteria of the European Federation of
Neurological Societies (EFNS), originally released in 2006. In nerves where
there is significant temporal dispersion, there can be the mistaken appearance of
conduction block due to interphase cancellation, and therefore at the most
‘probable’ CB can be diagnosed from such a nerve.

15
Figure 1.2 . Electrodiagnostic criteria in MMN, adapted from European Federation of Neurological Societies/Peripheral Nerve Society guideline on management of multifocal motor neuropathy, 2006 (van Schaik et al.,2006) .
There is some current debate about threshold for diagnosis of CB, as there are
some case reports of patients in whom clinical evidence of MMN was not
accompanied by conduction block adequate to qualify for probable CB, until later
years when the disease progressed, and thus treatment has been delayed
(Ghosh et al.,2005). In addition, there are cases where MMN is so advanced at
presentation, that conduction block may be imperceptible, due to the degree of
axonal degeneration, such that there is no appreciable difference between
proximal and distal CMAP.
16
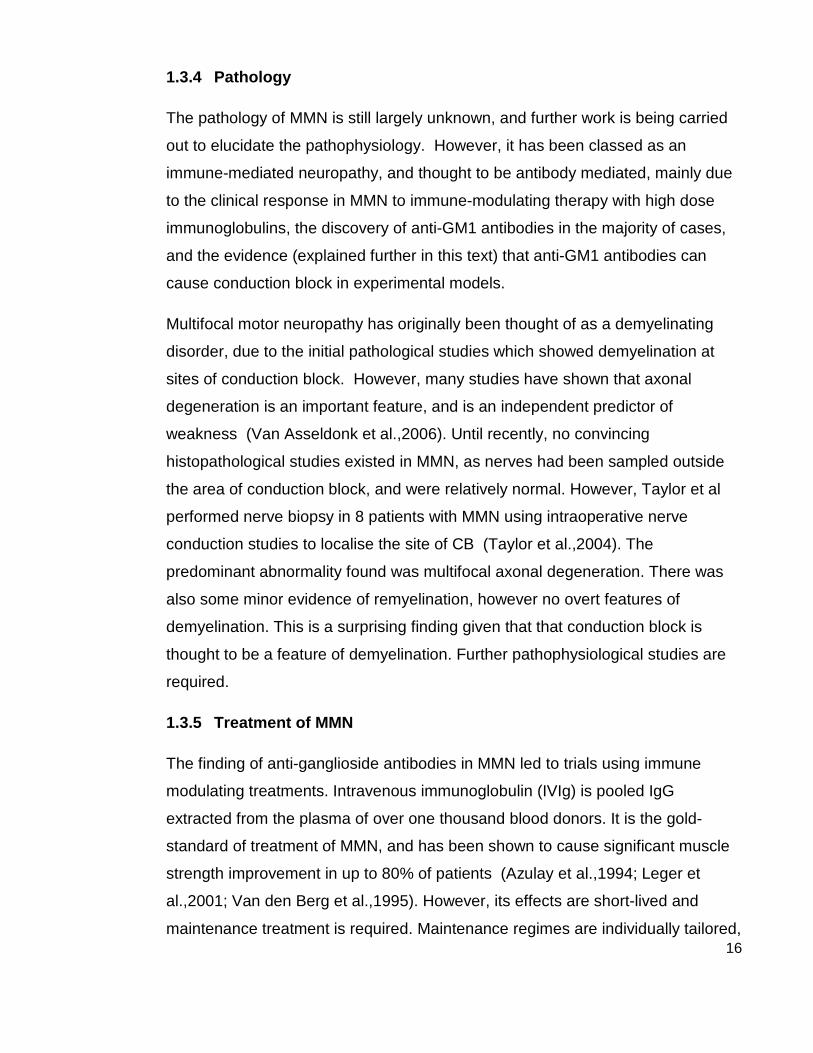
1.3.4 Pathology
The pathology of MMN is still largely unknown, and further work is being carried
out to elucidate the pathophysiology. However, it has been classed as an
immune-mediated neuropathy, and thought to be antibody mediated, mainly due
to the clinical response in MMN to immune-modulating therapy with high dose
immunoglobulins, the discovery of anti-GM1 antibodies in the majority of cases,
and the evidence (explained further in this text) that anti-GM1 antibodies can
cause conduction block in experimental models.
Multifocal motor neuropathy has originally been thought of as a demyelinating
disorder, due to the initial pathological studies which showed demyelination at
sites of conduction block. However, many studies have shown that axonal
degeneration is an important feature, and is an independent predictor of
weakness (Van Asseldonk et al.,2006). Until recently, no convincing
histopathological studies existed in MMN, as nerves had been sampled outside
the area of conduction block, and were relatively normal. However, Taylor et al
performed nerve biopsy in 8 patients with MMN using intraoperative nerve
conduction studies to localise the site of CB (Taylor et al.,2004). The
predominant abnormality found was multifocal axonal degeneration. There was
also some minor evidence of remyelination, however no overt features of
demyelination. This is a surprising finding given that that conduction block is
thought to be a feature of demyelination. Further pathophysiological studies are
required.
1.3.5 Treatment of MMN
The finding of anti-ganglioside antibodies in MMN led to trials using immune
modulating treatments. Intravenous immunoglobulin (IVIg) is pooled IgG
extracted from the plasma of over one thousand blood donors. It is the gold-
standard of treatment of MMN, and has been shown to cause significant muscle
strength improvement in up to 80% of patients (Azulay et al.,1994; Leger et
al.,2001; Van den Berg et al.,1995). However, its effects are short-lived and
maintenance treatment is required. Maintenance regimes are individually tailored,
17
with most patients requiring cyclical dosing at 3-4 weekly intervals. Despite long
term therapy, disease progresses over time causing worsening disability
(Terenghi et al.,2004). All immunomodulating therapies were evaluated in a
recent Cochrane review (Umapathi et al.,2009). Corticosteroids and plasma
exchange are ineffective in MMN (Lehmann et al.,2008; Van den Berg et
al.,1997), and trials of various immunomodulatory therapies, including rituximab,
mycophenolate and interferon-gamma, have not shown sufficient benefit to allow
adoption in clinical practice. In some cases, corticosteroids have been shown to
cause drastic worsening of weakness (Donaghy et al.,1994) and are therefore
avoided in MMN.
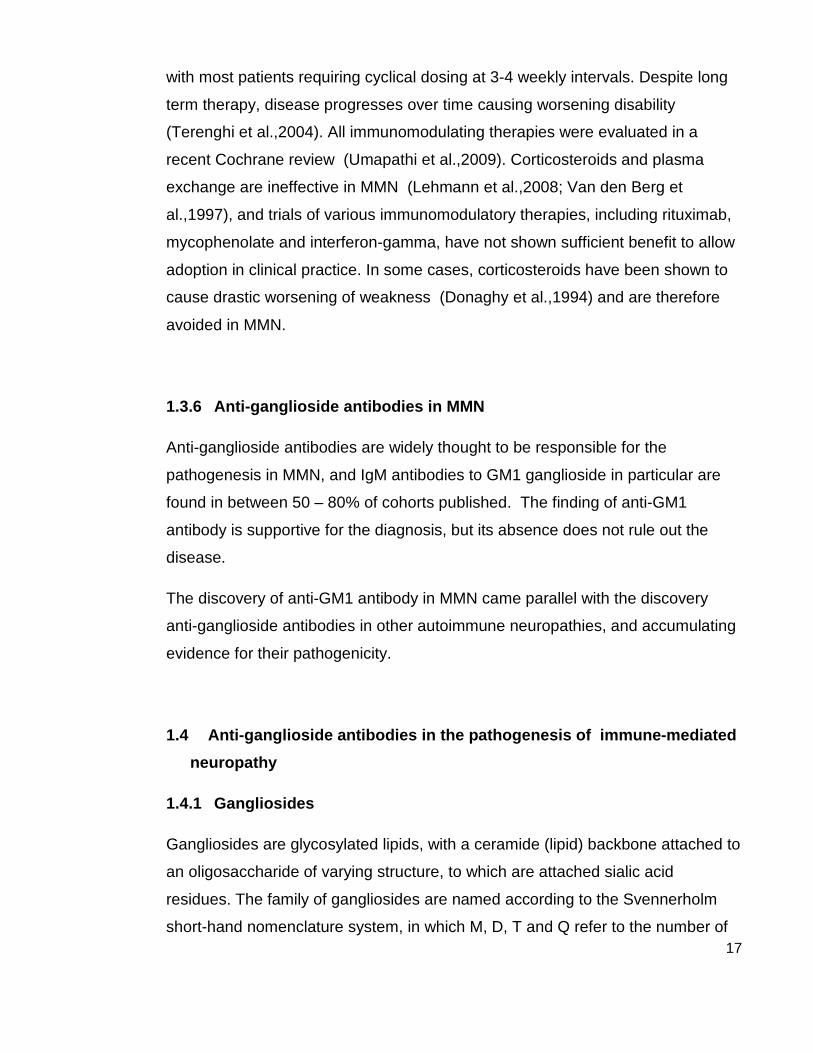
1.3.6 Anti-ganglioside antibodies in MMN
Anti-ganglioside antibodies are widely thought to be responsible for the
pathogenesis in MMN, and IgM antibodies to GM1 ganglioside in particular are
found in between 50 – 80% of cohorts published. The finding of anti-GM1
antibody is supportive for the diagnosis, but its absence does not rule out the
disease.
The discovery of anti-GM1 antibody in MMN came parallel with the discovery
anti-ganglioside antibodies in other autoimmune neuropathies, and accumulating
evidence for their pathogenicity.
1.4 Anti-ganglioside antibodies in the pathogenesis of immune-mediated
neuropathy
1.4.1 Gangliosides
Gangliosides are glycosylated lipids, with a ceramide (lipid) backbone attached to
an oligosaccharide of varying structure, to which are attached sialic acid
residues. The family of gangliosides are named according to the Svennerholm
short-hand nomenclature system, in which M, D, T and Q refer to the number of

18
sialic acid residues i.e. mono-, di-, tri- and tetrasialogangliosides, respectively,
and the numbers 1, 2, 3 refer to the order of migration of the gangliosides on thin-
layer chromatography. Figure 1.3 shows the basic structure of the most common
gangliosides in the human nervous system. More than 100 different gangliosides
have been characterised within vertebrates alone. Gangliosides are known to be
abundant in the central and peripheral nervous system, where their main role is in
cell signalling and adhesion, through which they regulate neural development and
regeneration.
Figure 1.3. Basic structure of major neural gangliosides. NeuAc is sialic
acid, GalNAc is N-acetylgalactosamine.
1.4.2 Anti-ganglioside antibodies in neuropathy
Anti-ganglioside antibodies are most firmly linked to pathogenesis of neuropathy
in the Miller-Fisher syndrome (MFS), an acute, self-remitting variant of Guillain-
Barré syndrome which manifests with acute onset of ophthalmoplegia, ataxia,
and areflexia, and results in a descending paralysis (FISHER,1956). Anti-GQ1b
antibodies are detected in upwards of 90% of cases of this condition (Willison et
al.,1993), with complete absence of anti‐GQ1b IgG antibodies from normal and
other disease control groups, indicating a high level of specificity for this disease.
Additional evidence of this antibody as the pathogenic mediator is that antibody
titres peak at clinical presentation, and decay rapidly with the course of clinical
recovery (Mizoguchi,1998). Also, ophthalmic nerves are known to be rich in
GQ1b ganglioside (Chiba et al.,1997).

19
Further evidence of antiganglioside antibodies in neuropathy comes from the
association between AMAN variant of Guillain-Barré syndrome and IgG
antibodies to GM1, and GD1a; which are shown to exist preferentially in this
variant rather than AIDP (Ho et al.,1999; Kuwabara et al.,1998). In cohorts of
Guillain-Barré syndrome, the presence of IgG anti-GM1 antibodies is strongly
correlated with axonal versus demyelinating neuropathy, predominant motor
involvement, more severe weakness and previous infection with Campylobacter
jejuni. The association with C. jejuni infection led to the theory of ‘molecular
mimicry’ (Yuki et al.,2007), which there now exists substantial evidence
regarding its major aetiological role in axonal variants of Guillain-Barré syndrome.
‘Molecular mimicry’ describes the phenomenon where antibodies which develop
during infection with C. jejuni, can cross-react with GM1 ganglioside, and
therefore act as an autoantibody. The C. jejuni and other gram-negative
organisms, bear an external endotoxin, lipo-oligosaccharide (LOS), and these
LOS have been shown to have ganglioside-like regions (Godschalk et al.,2007).
Other infections which are linked with GBS are Mycoplasma pneumoniae,
cytomegalovirus (CMV), Epstein-Barr virus (EBV), and more rarely influenzas
(Jacobs et al.,1998). These organisms all bear carbohydrate structure on their
surfaces which resemble peripheral nerve gangliosides (Yu et al.,2006), and
there are some associations between certain antecedent infections and certain
autoantibodies, for example there is a correlation between CMV antibodies and
GM2 antibodies in serum of patients with GBS (Irie et al.,1996).
1.4.3 Evidence of pathogenic potential of anti-ganglioside antibodies
The pathogenic potential has been demonstrated in animal models for the major
antibody-disease associations. Santoro et al showed this for anti-GM1 in 1996,
by injecting the serum from a patient with MMN into rat sciatic nerve. The serum
caused conduction block and pathological features of demyelination, in a
complement dependent manner, where IgM and complement were localised to
the nodes of Ranvier (Santoro et al.,1992). Rabbit models, inoculated with a
bovine brain ganglioside mixture or isolated GM1, developed high anti-GM1 IgG
antibody titres and acute flaccid paralysis (Yuki et al.,2001). Anti-GQ1b
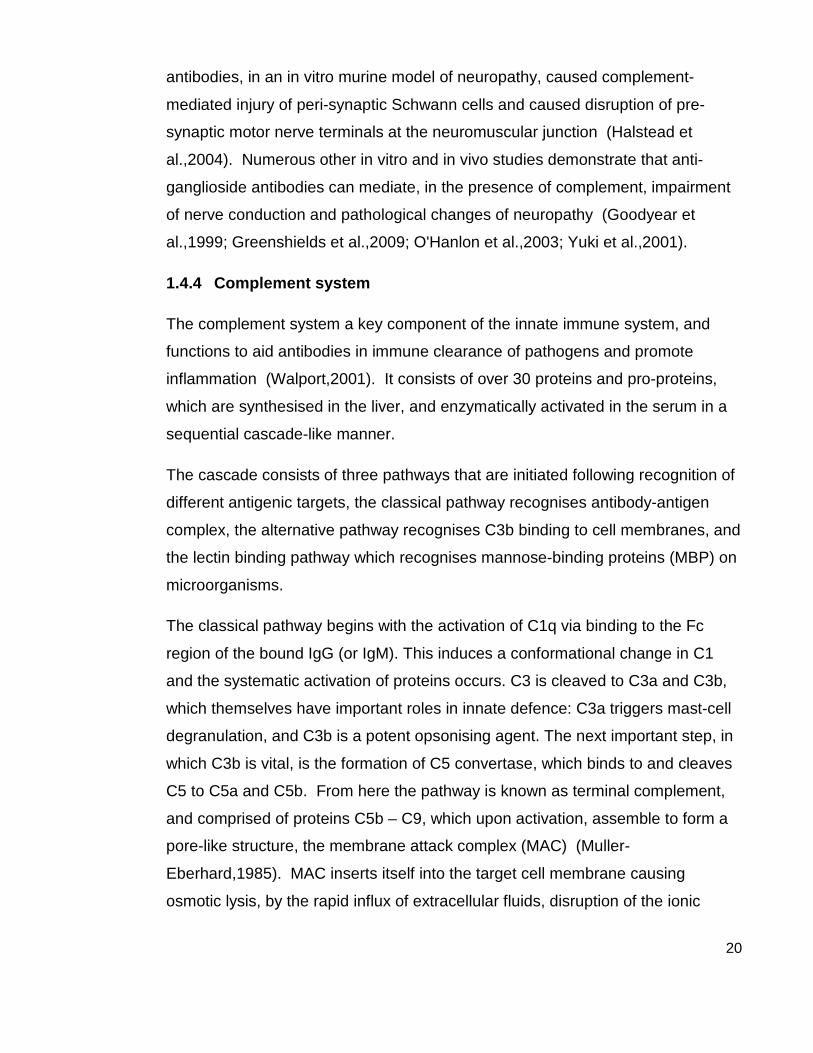
20
antibodies, in an in vitro murine model of neuropathy, caused complement-
mediated injury of peri-synaptic Schwann cells and caused disruption of pre-
synaptic motor nerve terminals at the neuromuscular junction (Halstead et
al.,2004). Numerous other in vitro and in vivo studies demonstrate that anti-
ganglioside antibodies can mediate, in the presence of complement, impairment
of nerve conduction and pathological changes of neuropathy (Goodyear et
al.,1999; Greenshields et al.,2009; O'Hanlon et al.,2003; Yuki et al.,2001).
1.4.4 Complement system
The complement system a key component of the innate immune system, and
functions to aid antibodies in immune clearance of pathogens and promote
inflammation (Walport,2001). It consists of over 30 proteins and pro-proteins,
which are synthesised in the liver, and enzymatically activated in the serum in a
sequential cascade-like manner.
The cascade consists of three pathways that are initiated following recognition of
different antigenic targets, the classical pathway recognises antibody-antigen
complex, the alternative pathway recognises C3b binding to cell membranes, and
the lectin binding pathway which recognises mannose-binding proteins (MBP) on
microorganisms.
The classical pathway begins with the activation of C1q via binding to the Fc
region of the bound IgG (or IgM). This induces a conformational change in C1
and the systematic activation of proteins occurs. C3 is cleaved to C3a and C3b,
which themselves have important roles in innate defence: C3a triggers mast-cell
degranulation, and C3b is a potent opsonising agent. The next important step, in
which C3b is vital, is the formation of C5 convertase, which binds to and cleaves
C5 to C5a and C5b. From here the pathway is known as terminal complement,
and comprised of proteins C5b – C9, which upon activation, assemble to form a
pore-like structure, the membrane attack complex (MAC) (Muller-
Eberhard,1985). MAC inserts itself into the target cell membrane causing
osmotic lysis, by the rapid influx of extracellular fluids, disruption of the ionic

21
gradient across the membrane, rendering the cell or pathogen destructed
(Janeway CA,2001).
Figure 1.3. Complement cascade. A simplified schematic image of the complement cascade. Adapted from NIH Publication No. 03–5423, September 2003.
Hereditary complement deficiencies are described for many of the complement
factors, and result in an increased susceptibility to infections, in particular, from
encapsulated bacteria. Bacteria which are protected by a polysaccharide
capsule, including Neisseria meningitidis, Streptococcus pneumoniae, and
Haemophilus influenza, must be lysed by MAC for their destruction. In the
absence of terminal complement activation, increased susceptibility to infection
with encapsulated bacteria is seen (Figueroa et al.,1991).
22
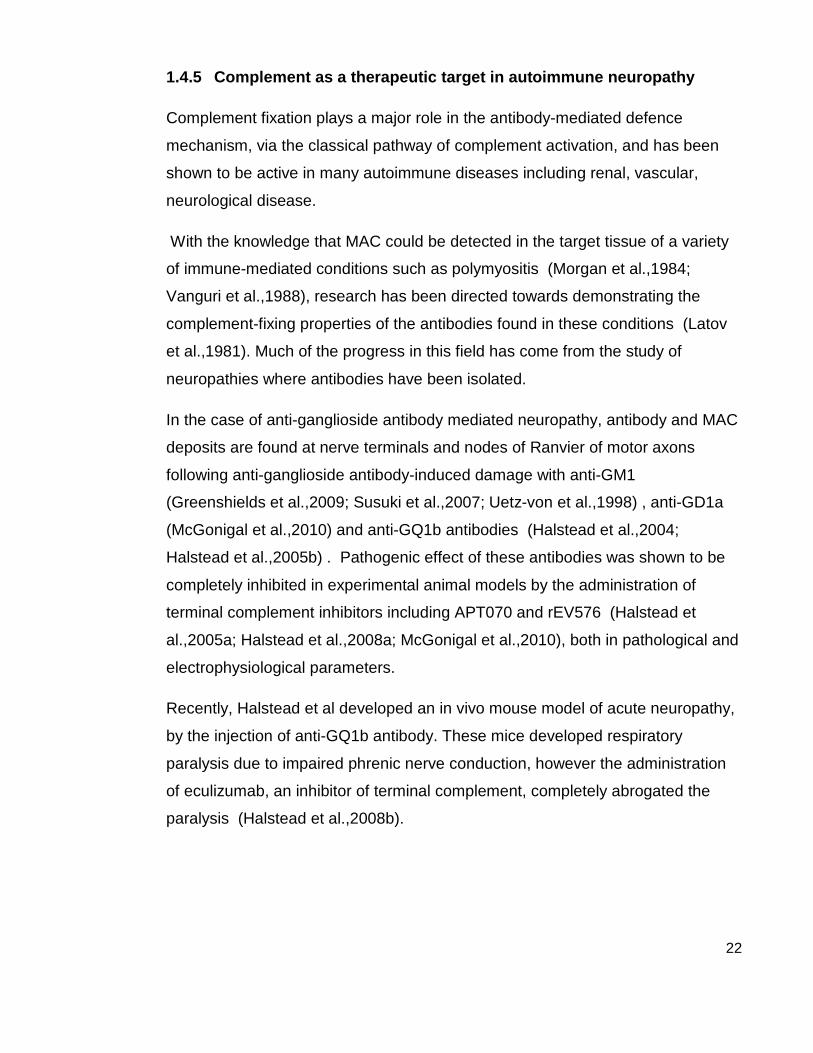
1.4.5 Complement as a therapeutic target in autoimmune neuropathy
Complement fixation plays a major role in the antibody-mediated defence
mechanism, via the classical pathway of complement activation, and has been
shown to be active in many autoimmune diseases including renal, vascular,
neurological disease.
With the knowledge that MAC could be detected in the target tissue of a variety
of immune-mediated conditions such as polymyositis (Morgan et al.,1984;
Vanguri et al.,1988), research has been directed towards demonstrating the
complement-fixing properties of the antibodies found in these conditions (Latov
et al.,1981). Much of the progress in this field has come from the study of
neuropathies where antibodies have been isolated.
In the case of anti-ganglioside antibody mediated neuropathy, antibody and MAC
deposits are found at nerve terminals and nodes of Ranvier of motor axons
following anti-ganglioside antibody-induced damage with anti-GM1
(Greenshields et al.,2009; Susuki et al.,2007; Uetz-von et al.,1998) , anti-GD1a
(McGonigal et al.,2010) and anti-GQ1b antibodies (Halstead et al.,2004;
Halstead et al.,2005b) . Pathogenic effect of these antibodies was shown to be
completely inhibited in experimental animal models by the administration of
terminal complement inhibitors including APT070 and rEV576 (Halstead et
al.,2005a; Halstead et al.,2008a; McGonigal et al.,2010), both in pathological and
electrophysiological parameters.
Recently, Halstead et al developed an in vivo mouse model of acute neuropathy,
by the injection of anti-GQ1b antibody. These mice developed respiratory
paralysis due to impaired phrenic nerve conduction, however the administration
of eculizumab, an inhibitor of terminal complement, completely abrogated the
paralysis (Halstead et al.,2008b).
23
1.5 Eculizumab
Eculizumab is the first targeted complement inhibitor licensed for use in humans.
It is a humanised IgG monoclonal antibody which specifically inhibits activation of
the terminal complement system by binding to C5, thus preventing its cleavage
into C5a and C5b, resulting in failure of MAC pore assembly. Since it acts at C5,
it inhibits terminal complement regardless of the pathway of activation, and it
leaves proximal complement, namely proteins C3a and C3b, preserving innate
immunity.
Eculizumab was developed and tested mainly in the complement driven
haematological disorder paroxysmal nocturnal haemoglobinuria (PNH) (Rother
et al.,2007). PNH is not an intrinsic autoimmune disorder, but is a condition
caused by imbalanced complement activation at red cell surfaces. This occurs
due to a genetic lack of the enzyme needed to make GPI anchor-protein, whose
function is to anchor complement regulators, CD59 and CD55, to the cell surface,
preventing inappropriate complement activation (Parker et al.,2005).
Uncontrolled MAC deposition on red blood cells leads red cell destruction and
chronic anaemia in PNH. The only curative option is allogenic stem cell
transplantation, and prior to trials of eculizumab, patients were managed by
recurrent blood transfusions. In two randomised control trials of eculizumab in a
total 184 patients with PNH, the median yearly blood transfusion requirement
reduced from 10 to 0 with eculizumab treatment (Brodsky et al.,2008; Hillmen et
al.,2006), and improvements were seen in fatigue and quality of life scores.
Eculizumab lends itself well to trials in other complement-mediated conditions,
and recent efficacy has been presented in some case reports in haemolytic-
uraemic syndrome associated with renal transplant (Chatelet et al.,2010;
Zimmerhackl et al.,2010), results from larger trials for this indication are awaited.
A substantial amount of safety data exists for eculizumab, since approximately
820 unique patients to now have been exposed to eculizumab, in dosing

24
regimens ranging from one day to almost six years, over a range of conditions
including renal transplant, idiopathic membranous glomerulonephropathy,
rheumatoid arthritis, psoriasis, and asthma (Alexion Pharmaceuticals,2010).
The most serious risk associated with eculizumab therapy is meningococcal
septicaemia. Since eculizumab inhibits terminal complement, defence against
encapsulated bacteria is reduced whilst on treatment. There have been three
reported cases of Neisseria meningitis infection, and one of these was in an
unvaccinated patient (Alexion Pharmaceuticals,2010). This roughly equates to
an incidence of 0.3% whilst on eculizumab.
Other potentially life threatening risk of eculizumab treatment relates to
immunogenicity of monoclonal antibodies. Although eculizumab is humanised
and therefore less immunogenic than murine antibodies, immune-mediated drug
reactions can occur. The incidence of severe infusion reaction in eculizumab is
estimated at around 8%, and in most cases successfully managed with pre-
medication (corticosteroid) and slowing the rate of infusion (Dmytrijuk et
al.,2008). Drug tolerance due to development of HAHAs (human anti-human
antibodies) are low in frequency (3%) with eculizumab treatment and considered
to be not clinically significant as similar frequency is of HAHA found in placebo
Other, less serious side effects are more common, including headache,
nasopharyngitis, back pain, nausea, and upper respiratory tract infections. In a
large open-label study of 97 PNH patients receiving eculizumab, headache was
the most common side effect, occurring in up to 56% of patients at the beginning
of eculizumab treatment, and reducing to around 15% after 6 months of treatment
(Brodsky et al.,2008). Further analyses of safety data show that the incidence of
headache during the maintenance phase with eculizumab was the same as with
placebo treatment and represents a 50% reduction as compared to the induction
phase.
Eculizumab has not yet been given in patients also receiving intravenous
immunoglobulin, and safety data does not exist for this.
25
1.6 Research aims
The major research aim of the project was to conduct the first trial of a
complement inhibition in humans with an immune-mediated neuropathy. The
complement inhibitor chosen was eculizumab, which is the first inhibitor of
systemic terminal complement to be licensed for human use, and is now used
widely in the treatment of paroxysmal nocturnal haemoglobinuria. A substantial
amount of safety data exists for eculizumab, however, no trial has yet been
published of terminal complement inhibition in any neurological condition, or of
the co-administration of eculizumab with high-dose IVIg.
Therefore, the aim of this study was not to determine the general safety of the
eculizumab, but to discover any additional safety information arising from its
administration in patients with immune-mediated neuropathy, or from its co-
administration with high dose intravenous immunoglobulin. For this reason an
open-label, pilot study design was chosen as the initial trial design.
Multifocal motor neuropathy was chosen as the neuropathy to study as firstly
there is clear evidence of a pathogenic antibody which is complement-fixing in
neuropathy models, secondly it is a chronic condition which (in contrast to acute
neuropathy) should be relatively stable over time and therefore lend itself study of
intervention, and thirdly, patients are already known to be immune-responsive in
MMN due to their responsiveness to IVIg.
Secondary aims of this clinical trial were to discover any beneficial therapeutic
effect by inhibiting complement in MMN. This effect would be measured by the
reduced requirement for IVIg therapy, and by the clinical and functional outcome
measures employed.
26
2 Clinical trial: Methods
2.1 Patients
Patients were screened for eligibility from patients known to have immune-
mediated neuropathy, who were currently attending the short-stay ward for
regular intravenous immunoglobulin, or attending neurology outpatient clinics at
the study centre (Institute of Neurological Sciences, Southern General Hospital,
Glasgow).
2.2 Inclusion and exclusion criteria
Core criterion for entry to the study were
1) Fulfilment of electrodiagnostic criteria for diagnosis of MMN with
conduction block, either with definite or probable conduction block in at
least one nerve segment.
2) Documented clinical improvement with intravenous immunoglobulin.
3) Ability to complete weekly self-evaluation functional rating scales.
4) Agreement to be vaccinated against meningococcal disease.
5) Ability to give informed consent.
Core exclusion criteria were
1) Below the age of 18 years old.
2) Pregnancy, planned pregnancy or lactation.
3) Inability to comply with study related procedures or appointments.
4) Unresolved Neisseria meningitidis infection or history of meningococcal
infection.
5) Known complement deficiency.
6) Any significant medical co-morbidity which was deemed to make the
patient unsuitable for the trial.
Patients who met the criteria above were invited to join the trial, given verbal and
written information (see Patient Information leaflet, appendix 1). They were

27
contacted at least 2 weeks following this to have further discussion, and then
proceeded to give written consent.
2.3 Study drug
Eculizumab (Soliris™) was supplied by Alexion Pharmaceuticals, Cheshire USA,
as a clear liquid in 300mg/30ml vials. The required dose was made up in 0.9%
saline (Baxter™) to 5mg/ml, and infused via peripheral venous cannulae at a rate
of up to 4ml (20mg) per minute. When eculizumab and IVIg were given on the
same day, eculizumab was administered first, with a 2 hour interval before IVIg
was given. Clinical trial nurses were employed to record patients’ vital signs
before and during the infusion. Any signs of infusion reaction (hypotension,
tachycardia, pyrexia, flushing, rash, bronchoconstriction, facial oedema, and
stridor) were managed by stopping the infusion, clinical assessment of the
patient, and administration of corticosteroids and antihistamine. The following
dose could be given as scheduled if deemed safe by the investigator, but at a
slower infusion rate, and following premedication with corticosteroids and
antihistamine.
2.4 Study design
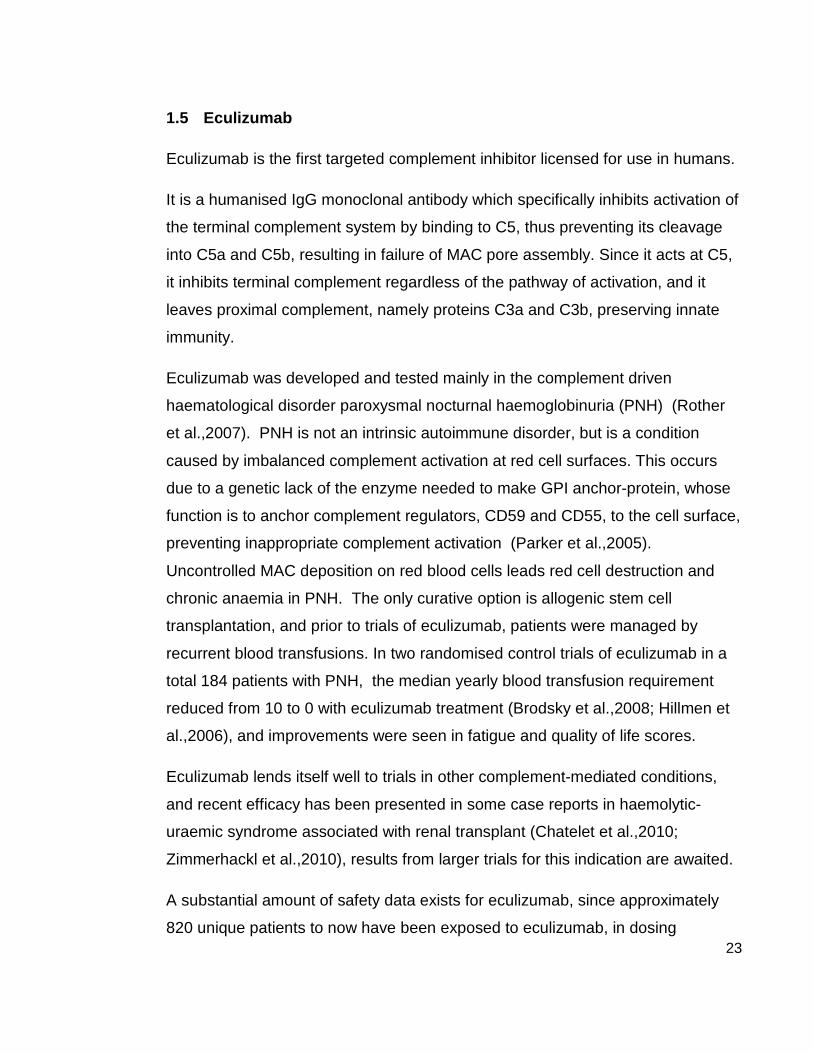
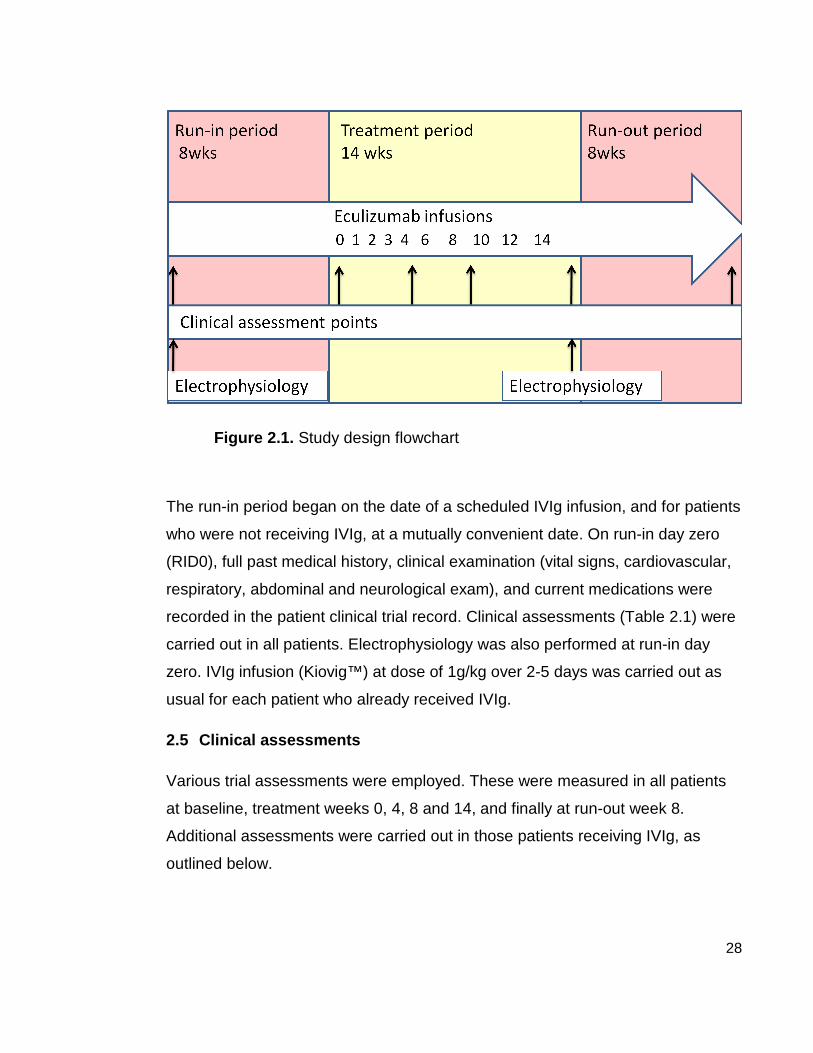
This was an open-label observational study. There were three trial periods,
comprising an initial run-in period of maximum length 8 weeks, a 14 week
treatment period, and an 8 week run-out period (Figure 2.1). At enrolment all
patients were vaccinated with tetravalent meningococcal vaccine (ACWY Vax®,
Glaxo Smith Kline).
28
Figure 2.1. Study design flowchart
The run-in period began on the date of a scheduled IVIg infusion, and for patients
who were not receiving IVIg, at a mutually convenient date. On run-in day zero
(RID0), full past medical history, clinical examination (vital signs, cardiovascular,
respiratory, abdominal and neurological exam), and current medications were
recorded in the patient clinical trial record. Clinical assessments (Table 2.1) were
carried out in all patients. Electrophysiology was also performed at run-in day
zero. IVIg infusion (Kiovig™) at dose of 1g/kg over 2-5 days was carried out as
usual for each patient who already received IVIg.
2.5 Clinical assessments
Various trial assessments were employed. These were measured in all patients
at baseline, treatment weeks 0, 4, 8 and 14, and finally at run-out week 8.
Additional assessments were carried out in those patients receiving IVIg, as
outlined below.

29
Muscle strength was assessed by two means, firstly a qualitative assessment
using the widely clinically practiced MRC score. Five muscles or muscle groups,
each from two affected limbs, were chosen and scored from 0 (no visible
contraction) to 5 (full active power against resistance), giving a total maximum
MRC sum score of 50. The 10 muscles or muscle groups were kept constant for
each patient throughout each trial assessment. Quantitative measurement of
muscle strength on a continuous scale was measured by myometry. Five
clinically weak (MRC 3 or 4) muscles were chosen from each individual for
myometry assessment, to be kept constant for each individual throughout the
trial. A hand-held myometer (Lafayette™ manual muscle testing system, model
01163) was used to measure the maximum force (kg) during isometric
contraction, using the ‘break’ technique, in which both the tester and subject
exerted maximal opposing strength until either the subject or the tester broke the
contraction. Three trials in each muscle were recorded.
Table 2.1. Clinical Assessments
1. Medical Research Council (MRC) sum score: total of 10
muscle groups from 2 affected limbs
2. Muscle strength force (MSF) sum score: total of 5 muscle
groups from 2 affected limbs, using myometry
3. Hand Grip Strength: using hydraulic dynamometer
4. Palm and pinch strength: using vigorimeter
5. Nine-hole peg test (9HPT): time to completion in seconds
6. 10 metre walk: time to completion in seconds
7. Self Evaluated Functional Rating Scale (SEFR)
8. Overall Neuropathy Limitation Scale (ONLS)
9. European Quality of life scale (EQ5D)

30
Overall hand grip strength was measured in kilograms using a hydraulic hand
dynamometer (Jamar™). In addition, various-sized rubber balloons attached to a
barometer (vigorimeter) were used to measure maximum palm and pinch
strength (kiloPascals) in each hand.
The nine-hole peg test comprised nine wooden pegs which were placed in
corresponding holes in a wooden block. The time to completion of the test was
recorded from contact with the first peg until the ninth peg was securely placed.
Again, three trials each side were recorded at each assessment. For ease of
interpretation, and to accommodate those who could not complete the test, this
was converted to speed, expressed as percentage of test completed per second
(100/seconds).
The ten-metre timed walk was performed on a flat level surface using the
patient’s usual walking aid (if any). This was also converted to speed, as
percentage of test completed in one second (100/seconds).
Quality of life scale (EuroQOL™ EQ5D, 1995) was used, which comprises a
visual analogue scale from 0% (worst imaginable health) to 100% (best
imaginable health), and a descriptive system which scores on five dimensions of
living: mobility, self-care, usual activities, pain/discomfort, anxiety/depression,
giving a score between 0 and 1, where 1 is the value for full health. The overall
neuropathy limitation scale (ONLS) measured the limitation of activities of daily
living usually affected by neuropathy, and provided a total score from 0 (no
limitation) to 12 (full limitation, bed bound).
The self evaluated functional rating (SEFR) score was central to the longitudinal
assessment of patients throughout the trial. At run-in day zero the patient and the
investigator chose 5 tasks of daily living that were affected by the condition, for
example, using knife and fork together or lifting cup with left hand. These tasks
were graded from 0 (normal) to 5 (impossible) based on the level of difficulty with
this task. Pre-printed SEFR score sheets were completed at the outset and tasks
remained constant for the duration of the trial.

31
Typically MMN patients, who are on maintenance IVIg regimes, experience a
cyclical change in muscle strength due to the half life of IVIg, with an
improvement in weakness 5 to 10 days after infusion, plateau of increased
strength for some weeks, then subsequent decline heralding requirement for
further IVIg. The aim of using the SEFR score was to measure this effect, and
allow its communication, in a standardised format, from the patient to the study
team. It was expected that the SEFR score would be highest prior to IVIg dosing
(indicating highest level of difficulty with chosen tasks), and lowest mid-cycle.
SEFR score sheets were collected by the investigator weekly, by fax, email or
completed over the telephone.
2.6 Deterioration point criteria
For patients receiving IVIg, the run-in period length was determined by reaching
the deterioration point.
Deterioration point criteria were defined (Table 2.2), the primary criteria being an
increase in the SEFR score by at least 2 points above the baseline (RID0) score.
This triggered clinical examination by the investigator, and if further deterioration
point criteria were fulfilled, IVIg dose was scheduled. At this point, patients then
entered the treatment period, and the first eculizumab dose was then given on
day 0, prior to IVIg dosing.
Table 2.2. Deterioration Point (DP) Criteria
1. SEFR score increase by 2 points from baseline
Plus at least one of the following (2) to (6)
2. MRC sum score decrease by at least 1 point
3. Pinch/palm grip decrease by at least 10% (either
side)
4. 9 hole peg test time increased by at least 10%
5. 10m walk time increase by at least 2 seconds
6. Patient/clinician feels deterioration has occurred

32
Patients not receiving IVIg also completed weekly SEFR score sheets, however
did not require to reach deterioration point prior to entering the trial, all completed
the maximum 8 week run-in period.
2.7 Electrophysiology
Motor nerve conduction studies and electromyography were carried out in at least
one affected nerve segment and muscle group, at baseline (RID0) and again at
the end of the treatment period. The trial neurophysiologist was not involved in
any other trial assessments. Data for distal latency (DL), compound muscle
action potential (CMAP) amplitude and duration, conduction velocity, and F-wave
latency were collected. Needle electromyography recordings (videos) of
voluntarily contracting muscle activity were blindly scored by a panel of five
qualified neurophysiologists, to assess any difference in the motor unit
recruitment density between baseline and the end-of-treatment period. The
recordings were presented in pairs (pre and post treatment) and assessors were
blinded to the patient details and the ordering of the recordings. This resulted in a
total score of minus 5 (all 5 examiners scored the post-treatment EMG less
dense than the pre-treatment) to plus 5 (all 5 examiners scored the post-
treatment EMG more dense than the pre-treatment).
2.8 Pharmacological tests
Blood samples were collected at run-in day 0, then prior to every eculizumab
dose (trough), 1 hour post dose (peak) and if IVIg was also given at same
session, 1 hour into IVIg dose. Samples were immediately centrifuged at 3000
rpm at room temperature for 10 minutes, the resultant supernatant was decanted
into cryotubes, and stored at -80°C until being shi pped to Alexion laboratories,
Cheshire USA. Here pharmacokinetic (PK) and pharmacodynamic (PD) assays
were performed. The PK assay measured serum eculizumab concentration
(µg/ml), while the PD assay measured serum haemolytic activity (% of chicken

33
red blood cells lysed by serum). In addition, serum was collected for detection of
human-anti-human antibodies (HAHAs).
2.9 Detection of anti-ganglioside antibodies
Enzyme-linked immunosorbent assay (ELISA) was used to detect anti-glycolipid
antibodies to GM1, GM2, GD1b and GA1 in patient serum prior to trial
commencement. These were not re-measured at trial completion. For ELISA
methodology see section 5.2.1.
2.10 Adverse events and safety reporting
At each scheduled trial visit, patients were asked to report any symptoms,
medical encounters or changes to medications. During the treatment period,
adverse event (AE) data was recorded weekly for the first 4 weeks, then
fortnightly. During run-in and run-out periods, the AE collection interval varied
between patients according to their visits, up to a maximum interval of 8 weeks
from the previous visit. Adverse events were graded as mild, moderate or
severe, and their attribution to study drug graded 0 (unrelated), 1 (unlikely), 2
(possibly), 3 (probably), 4 (definitely). Serious adverse events (SAEs) were
reported within 24 hours to the local Pharmacovigilance office and to the Data
Monitoring Committee (DMC). Adverse events were defined as serious if they
were fatal, resulted in or lengthened hospital admission, led to persistent or
severe disability, congenital anomalies of birth defects.
At enrolment, patients were issued with a detailed safety information card, which
described the study and “alert” symptoms for meningococcal infection. Patients
were counselled about the increased risk of developing meningococcal
septicaemia whilst on eculizumab, and were asked to carry this safety card with
them at all times during the treatment and run-out period. Alert symptoms were
moderate to severe headache with nausea or vomiting, stiff neck or stiff back,
fever, rash, confusion, severe myalgia with flu-like symptoms and photophobia.
Clear instructions were given that patients should be seen by a physician at their

34
local emergency department without delay. 24 hour emergency contact numbers
of the trial doctors were listed on this card, for specialist advice.
2.11 The role of the author
My involvement in this clinical trial began following acceptance of the trial
protocol by the ethics panel, therefore I did not contribute to the original protocol
design. However, my role began by putting into effect the approved protocol. I
screened and recruited patients, designed the data collection sheets for the
clinical research files, liaised with research and enterprise, pharmacy and NHS
staff and briefed colleagues and the clinical research nurses which were
allocated to the study.
Following recruitment, I collected all the baseline clinical data from patients.
Thereafter, at each trial visit, I examined each patient as set out in section 2.5.
Some of the timed assessments were also performed by the clinical research
nurse(s), whose main roles were preparation the drug for intravenous infusion,
performing measurements of vital signs (pulse, BP and temperature), logging
information essential to drug accountability, and assisting with data collection and
adherence to GCP (Good Clinical Practice) guidelines.
At each trial visit I collected information about any adverse events and made
clinical assessments as indicated. I then evaluated the potential causal
relationship between study drug and adverse effect. Due to the increased risk of
meningococcal septicaemia I was ‘on-call’ for patient queries, and they carried a
safety card with my 24 hr contact number, so that themselves or any doctor
treating them in an emergency could contact me for advice about suspected
adverse reaction.
Blood tests were taken at numerous time points which I then centrifuged in the
lab to decant the serum for storage. Following completion of the trial period, I
sent all the data to the Robertson Centre for Biostatistics, who performed data
cleaning and analysis. At this stage my involvement was dealing with data
queries and liaising with the trial statistician about the analyses to be undertaken.

35
Following this, I wrote the trial up for publication (see Appendix 2) and presented
the findings at local, national, and international meetings.
2.12 Ethics and monitoring
The trial protocol and supporting documentation were approved by the regional
ethical committee, and conducted in keeping with the Declaration of Helsinki. The
trial is registered on EudraCT database (unique no. 2008-005748-18). The study
was funded by Alexion Pharmaceuticals however remained an investigator-led
trial, co-sponsored by the University of Glasgow and NHS Greater Glasgow and
Clyde. A data monitoring committee (DMC) of three independent specialists was
formed, who were provided with interim data and safety reports throughout the
study. Only the DMC and the investigators had a steering role.
2.13 Statistics
Since the study was not designed primarily to test efficacy of this medication, no
power calculation was performed, and the number of patients enrolled was
merely a convenience sample based on the availability of eligible candidates with
the condition.
Individual data was collected on clinical research forms (CRF), and carbon copies
were sent to the Robertson centre for Biostatistics (University of Glasgow), then
entered into a study-specific database which was maintained by the Biostatistics
department.
Myometry or muscle strength/force (MSF) recordings were summed across all 5
selected muscles for each patient to result in a total MSF score.
Electrophysiology measurements were transformed to z-scores (excluding
conduction block). Z-scores were calculated for each nerve (anatomical location)
by subtracting the mean and dividing by the standard deviation. Thus a
difference of 1 in z-score is a difference of 1 standard deviation across nerves.

36
Task scores, speeds or values were summarized by median and inter-quartile
range (IQR) values for each time point or period. The Wilcoxon signed-rank test
was used to test whether the median differences in the intra-patient scores or
speeds between the measurement points or periods and baseline (run-in day
zero) were statistically significantly different from zero. The Mann-Whitney test
was used to compare medians between unpaired groups. A p-value of 0.05 or
less was considered to be significant. Statistical software packages used were R
software version 2.9.0 (R Development Core Team, 2009), used by trial
statistician where indicated in the text, and Minitab version 16 (Minitab Solutions),
used otherwise by the author. Analyses performed by the trial statistician are
acknowledged in the figure legends and text.

37
3 Results
3.1 Patients
25 patients with a prior diagnosis of MMN were screened, and 22 were
considered eligible according to EFNS electrodiagnostic criteria and other
inclusion criteria (see Figure 1.2 and Section 2.2). One patient was excluded from
recruitment since he required air travel to reach the hospital. Another patient was
diagnosed with metastatic cancer of unknown primary during the screening
period and was therefore was not enrolled. 7 out of 20 patients declined
enrolment due to a) potential risks of the trial drug and/or b) already receiving
perceived full benefit from IVIg.
The remaining 13 patients, who fulfilled all the additional criteria, were recruited
to the study with informed consent. Basic clinical data are listed (Table 3.1).
85% of patients in the trial were male (n = 11), and the mean age at entry was 56
years (± SD 10 years). The mean length of disease by the start of the trial was 19
years (± SD 10 years), and mean duration of IVIg treatment, in those receiving
IVIg (n = 10, 77%), was 8.5 years (± SD 5 years). The median IVIg inter-
treatment interval was 4.0 weeks (IQR 3.0 – 4.8 weeks), and the mean dose in
the year prior to the trial was 16.2 g/wk (IQR 5.8 – 19.2g/wk).
Eleven patients (85%) had upper limb onset of weakness. The most common
nerves affected were right median (77%), left ulnar (69%), left median (69%) and
right radial nerve (62%). Six patients (46%) also had lower limb involvement, with
common peroneal nerve involvement in 6, and tibial nerve involvement in 3
patients (23%). Five patients (38%) had sensory symptoms (numbness,
paraesthesia), and 4 (31%) had minor sensory abnormalities on nerve conduction
studies. Four (31%) had diminished reflexes in affected limbs only, whilst five
(38%) had global hyporeflexia.

38
Table 3.1. Clinical Features ( n = 13)
Male gender 11 (85%)
Age at start of trial 55 years (IQR 51 - 65)
Years affected by start of trial 19 years (IQR 10 - 29)
Upper limb onset 11 (85%)
Lower limb involvement 6 (46%)
Sensory symptoms 5 (38%)
IgM anti-GM1 antibody positive 9 (69%)
IgM anti-GM1 antibody titre 1/9000 (IQR 1/1275 – 1/12500)
Current IVIg treatment 10 (77%)
Duration of IVIg treatment 9 years (IQR 5 – 14)
Current IVIg inter-treatment interval
4 weeks (IQR 3.0 – 4.75)
Median IVIg dose per year 840 g/yr (IQR 300 – 1000)
Seven patients had been tested for paraprotein (at some point in the past), and
one had IgM paraprotein, kappa light chain, with high titres of IgM anti-GM1
antibody. Anti-GM1 IgM antibodies were detected in 9 patients (69%), of which all
were also reactive against GA1, and 6 (46%) against GD1a. Anti-GM2 IgM
antibody was detected in 1 patient (8%) who also had reactivity against GM1.
3.2 Safety
No patient discontinued the study medication due to an adverse event. One
patient had an aborted infusion due to an allergic response, with
bronchoconstriction, tachycardia and rash, which was managed with prophylactic
steroid and antihistamine before subsequent doses. This patient had a history of
allergic response to IVIg, and routinely received pre-medication for this.
39
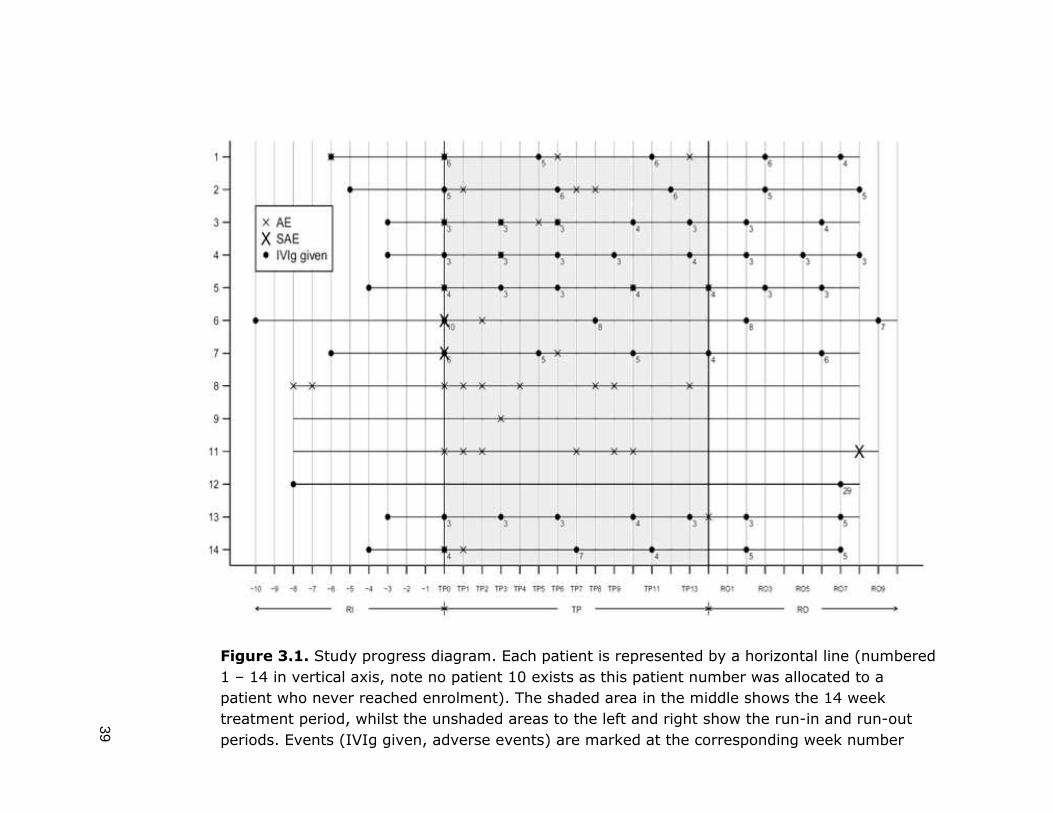
Figure 3.1. Study progress diagram. Each patient is represented by a horizontal line (numbered
1 – 14 in vertical axis, note no patient 10 exists as this patient number was allocated to a
patient who never reached enrolment). The shaded area in the middle shows the 14 week
treatment period, whilst the unshaded areas to the left and right show the run-in and run-out
periods. Events (IVIg given, adverse events) are marked at the corresponding week number
40
There were four serious adverse events (SAEs) in total: two in the treatment
period, and two in the run out period. All four were episodes of moderate
headache accompanied by nausea (and dizziness in one case), which prompted
these patients, in keeping with the high alert for symptoms of meningococcal
disease, to seek medical attention. All patients were kept in overnight for
observation. One case was investigated with lumbar puncture, revealing mild
CSF lymphocytosis but no bacterial growth, in keeping with aseptic meningitis.
Both SAEs which occurred during the treatment period, occurred 2 days following
administration of IVIg and eculizumab together, however these patients reported
that they had had similar headaches and nausea in the past with usual IVIg
treatment, and would never usually report this or consult medical attention, but
due to high alert state for meningococcal disease throughout the trial, they were
obliged to do so. In both cases, symptoms were resolved fully within 48 hours.
The two SAEs at week 8 run out period were in the same patient, for two
separate hospital admission with moderate-severe headache, nausea,
photophobia and dizziness. This patient had a previous diagnosis of labrynthitis,
and this diagnosis was made. Symptoms improved with medical management.
There were 5 adverse events in total during the run-in period, and these were
reported in a total of 2 patients. In the treatment period there were 52 adverse
events in total, reported by 11 patients. The treatment period was divided into two
periods when reviewing the adverse event data, the induction phase TP 0-3
(eculizumab given weekly) and the maintenance phase TP 4-13 (eculizumab
given fortnightly). There was a higher rate of adverse events reported in the
induction phase of eculizumab treatment, with 7.25 AEs/week, compared to the
maintenance phase, 2.3 AEs/week.
To account for the inter-patient variation in run-period duration, the AE rate was
expressed as the proportion of weeks per each period during which an AE was
experienced by a patient (table 3.2). During the run-in period, the median
proportion was 0% of weeks (IQR 0 – 0%), during the treatment period the
median proportion was 14% of weeks (IQR 7 – 21%), and during the run-out
period the median proportion was 0% of weeks (IQR 0 – 3%). This means that

41
during the treatment period, on average a patient experienced an adverse event
during 14% of weeks (2 weeks) meaning that the remaining 86% (12 weeks)
were on average, free from adverse events. There was a significant increase in
the AE rate during the treatment period compared to the run-in period (p = 0.004,
Wilcoxon signed rank test) and run-out period (p = 0.007, Wilcoxon signed rank
test). There was no significant difference between the AE rate during run-in and
run-out periods (p = 0.79, Wilcoxon signed rank test).
Of all 52 adverse events recorded during the treatment period, all except one
(patient 8, diarrhoea, also experienced during run-in period) were treatment
emergent signs or symptoms (TESS). TESS are events which started following
the administration of the study medication, such that any adverse event which
had been present prior to receiving the medication could not be treatment-
emergent. The classification of an event as a TESS does not indicate the
causality of the study drug to the event.

42
Table 3.2. Summary table of adverse event characteristics . Brackets contain the number of AEs in that category, as a percentage all AEs in that time period. (Table produced by trial statistician)

43
Causality of adverse events to the study drug were graded by the investigator,
and there were 2 AEs which were ‘definitely’ attributed to the study drug (infusion
reaction, and subsequent rash), and 5 AEs which were ‘probably’ attributed to
study drug (headache (n = 3), skin rash (n = 1) and pharyngitis (n=1). Overall
during the treatment period, 28 AEs (54% overall) were classed as possibly
related, 15 (29%) were unlikely to be related, and 2 (4%) were unrelated.
Headache was the most common AE, accounting for 33% of all AEs during the
treatment period. Almost two-thirds (11/17; 65%) of the headaches were in the
first 4 weeks of treatment. Nine patients (69%) experienced headache at least
once during the treatment period. Two out of the three patients who were not
receiving IVIg, also experienced headache during the treatment period.
Respiratory and coryzal symptoms (rhinorrhoae, pharyngitis) were responsible for
7 (13%) of AEs during the treatment period, musculoskeletal (myalgia and
arthralgia) accounted for 6 (12%), gastrointestinal symptoms (nausea, diarrhoea,
constipation, and abdominal pain) accounted for 4 (8%) and skin rashes
accounted for 4 (8%).
The adverse event profile in patients not receiving IVIg was similar to those
receiving IVIg. The most common was headache (n = 7). The others included
joint pains (n = 3), malaise (n = 3), rhinorrhoea (n = 2), abdominal pain (n = 2),
excess sweating, diarrhoea, leg cramps, bruising and hypertension (all n = 1).
No unexpected treatment emergent signs or symptoms were noted. No bacterial
or other infections were encountered.
The majority (73%) of AEs during the treatment period were classed as mild, and
the remainder moderate (27%). No adverse event was classed as severe. The
median duration of AE was 3 days (IQR 1 – 5). During the treatment period, AEs
occurred at a median of 2 days post-eculizumab dose, and 2 days post-IVIg
treatment. The three patients who were not receiving IVIg also experienced
adverse events.

44
3.3 Pharmacological studies
Median serum eculizumab concentration had increased to above the 35µg/ml
minimum therapeutic level by treatment period week 1, and was maintained
above this level throughout the treatment period. Pharmacodynamic (PD)
analysis measured the terminal complement activity of patient serum, by its ability
to haemolyse chicken red blood cells in vitro. A value of 100% haemolysis
signifies that the collected serum has equal haemolysing ability as control human
serum, therefore full terminal complement activity. Before Eculizumab treatment
the median % haemolysis was 95% (IQR 77.5-98), whilst by week 1 this had
reduced to 5% (IQR 2.75-19.5).
Patients receiving IVIg had significantly lower median eculizumab concentration
(78.7 µg/ml, IQR 55 - 108) compared to those not receiving IVIg (119.7µg/ml,
IQR 95 - 147). Importantly however, complete terminal complement inhibition in
serum was achieved, with no difference between the median haemolytic
complement activity in both groups (2% and 1% respectively). The serum
measurements were taken prior to Eculizumab or IVIG infusion, and therefore
reflect the plateau state. There was no difference between the haemolytic
complement activity pre-trial in patients receiving IVIg (median 98% haemolysis)
and not receiving IVIg (median 94%) signifying that IVIg maintenance treatment
did not affect terminal complement activity measured at the end of the IVIg cycle.
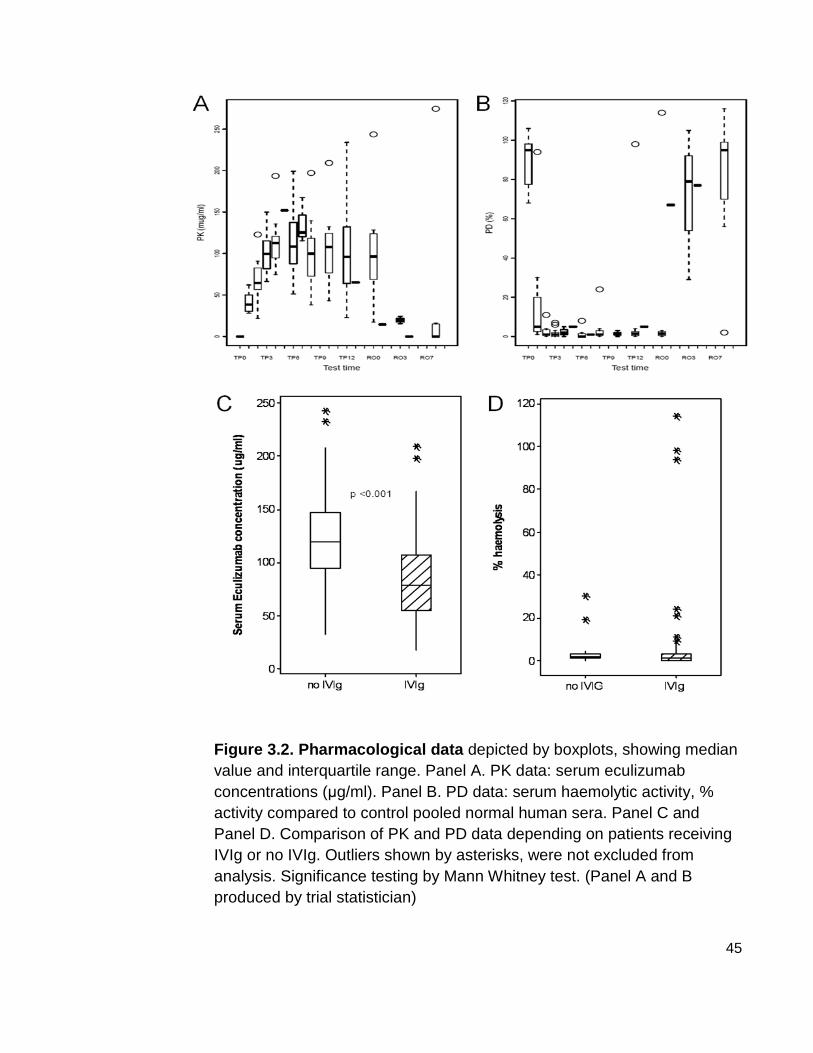
45
Figure 3.2. Pharmacological data depicted by boxplots, showing median value and interquartile range. Panel A. PK data: serum eculizumab concentrations (µg/ml). Panel B. PD data: serum haemolytic activity, % activity compared to control pooled normal human sera. Panel C and Panel D. Comparison of PK and PD data depending on patients receiving IVIg or no IVIg. Outliers shown by asterisks, were not excluded from analysis. Significance testing by Mann Whitney test. (Panel A and B produced by trial statistician)

46
3.4 Intravenous immunoglobin requirements
During the treatment period, 9 out of 10 patients receiving IVIg as maintenance
therapy continued to require IVIg at regular intervals throughout the treatment
period, which was qualified by reaching deterioration point.
IVIg requirement was measured as the inter-treatment interval (in days) (Figure
3.3). In the year prior to trial commencement, the median interval was 28 day
(IQR 21 – 37). During the run-in period, the median interval was 30.5 days (IQR
22 – 46). During the treatment period, the median interval was 35 days (IQR 23 –
46), which was not significantly different to the run-in interval (p = 0.64) but was
significantly different to the pre-trial interval (p = 0.006).
Figure 3.3. Intravenous immunoglobulin requirements . Boxplots
showing median inter-treatment interval (days) across the time points:
prior, year preceding trial; RI, run-in period; TP, treatment period; RO, run-
out period. Significance testing carried out by Wilcoxon signed rank test.

47
During the run-out period, the median IVIg interval was 31 days (IQR 22 – 44),
this was neither significantly different to the treatment period (p = 0.15) nor the
run-in period (p = 0.44). The run-in and run-out periods were not significantly
different from the pre-trial interval (p = 0.44 and 0.53 respectively), however the
treatment period interval was significantly longer than the pre-trial interval
(median difference 6.5 days, p = 0.006). Summarised, there was no significant
difference between the IVIg inter-treatment interval in any of the trial periods, RI,
TP and RO. There was no significant lengthening of the interval between pre-trial
and RI, however there was a significant difference between pre-trial and
treatment period, indicating a small net increase between RI and TP that was not
statistically significant.
The median of the average IVIg dose in the year preceding the trial, across all 13
patients, was 16.2g/week (IQR 5.7 - 19.2), which is very similar to the median of
the average weekly dose during run-in 16.3g/week (IQR 9.4 – 21.5) (p = 0.42).
The average dose during the treatment period was 15g/week (IQR 0 – 23), but
this was not significantly decreased from the run-in dose (p = 0.31). The run-out
period dose was increased to 18.5g/week (IQR 9.5 – 2.5), but this was not
statistically significant (p = 0.15).
Patient 012, who did not require IVIg at all during the treatment period, had been
receiving IVIg at 10 week intervals for 2 years prior to the trial. During the run-in
period, the 8 week maximum length was reached without deterioration, so patient
012 entered the treatment period without receiving his next cycle of IVIg. During
the treatment period, deterioration point criteria were not reached, in fact, SEFR
score dramatically reduced (Figure 3.4), but during the run-out period increased
to beyond baseline levels and IVIg was given again at week 7 of the run-out
period due to reaching deterioration point. For the purpose of the analysis, patient
12 is included in the IVIg treatment interval analysis below, with a run-in interval
of 8 weeks, treatment interval of 14 weeks, and a run-out interval of 8 weeks,
however the actual IVIg interval was 207 days (29 weeks). A sensitivity analysis
was carried out excluding and including patient 012, and there was no overall
change to the significance of the comparisons of IVIg inter-treatment intervals.

48
Figure 3.4. SEFR score of patient 012 , who did not require IVIg between time points RID0 (run-in day zero) and ROW8 (run-out week 8), giving an IVIg interval of 30 weeks which spanned the three study periods.
3.5 Muscle strength
The MRC sum score did not differ significantly between any of the trial periods
(Figure 3.5 Panel A). MRC sum score was also compared at successive
deterioration points during the treatment period, and showed a non-significant
trend to increasing score, from a median score of 23 (IQR 23 – 32) at the first DP
to a median score of 28.5 (IQR 25 – 30) by the fourth DP (figure 3.6).

49
Figure 3.5 Muscle strength measurements. Panel A, MRC sum score (out of total possible score 50). Panel B, MSF (muscle strength force/myometry) sum (kg). Boxplots displaying median score at individual assessment points. Significance testing compares to baseline (RIDO), Wilcoxon signed-rank test (Trial statistician).

50
Figure 3.6. MRC sum score at successive deteriorati on points during the treatment period in patients receiving IVIg. Median MRC sum score across patient (n = 9). Significance testing by Wilcoxon signed rank test.
The MSF (myometry) score steadily increased at each successive assessment
point (Figure 3.5 Panel B), and was significantly higher than baseline (median
35kg, IQR 25 - 42) at treatment week 8 (median 43kg, IQR 38 – 52, p = 0.01) and
week14 (median 44kg, IQR 31 – 59, p = 0.01), and run-out week 8 (median 44
kg, IQR 30 – 48, p = 0.02). The increase between run-in period and treatment
week zero was non-significant (p = 0.13). There was no significant difference
between treatment period overall, and run-out week 8 (p = 0.73).
To control for any ‘learning’ effect between RID0 and TPW0, assessments were
also compared to TPW0, rather then RID0, and the similar increase was found,
also significant.
Median pinch grip strength (vigorimetry) showed small but significant changes at
week 4 in both sides, but this difference was not seen at any other time point
(Figure 3.7 Panels A and B). There were no significant changes in median palm
grip strength throughout all periods (Figure 3.7 Panels C and D). Whole hand grip
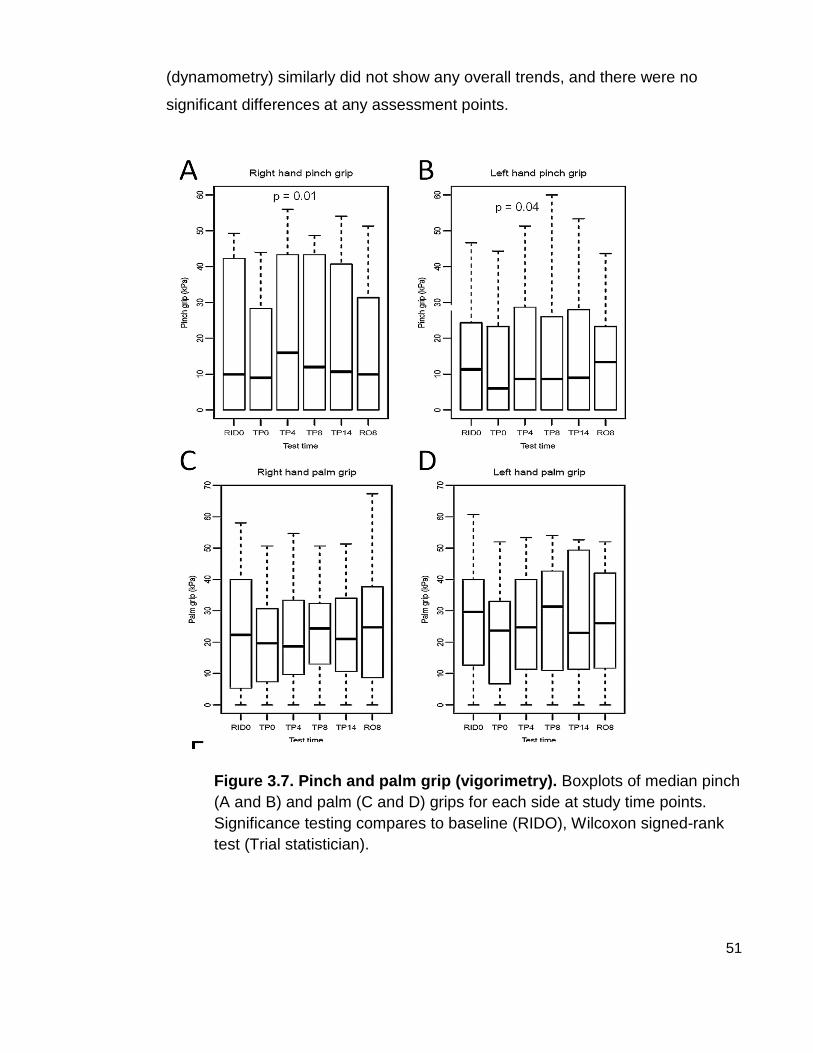
51
(dynamometry) similarly did not show any overall trends, and there were no
significant differences at any assessment points.
Figure 3.7. Pinch and palm grip (vigorimetry). Boxplots of median pinch (A and B) and palm (C and D) grips for each side at study time points. Significance testing compares to baseline (RIDO), Wilcoxon signed-rank test (Trial statistician).

52
3.6 Timed assessments
Figure 3.8. Timed assessments. Panel A shows timed 10m walk expressed as speed in percentage of total completed in 1 second (100/s). Panels B and C display the speed of completion of 9 hole peg test, expressed as percentage of test completed in 1 second. Significance testing compares to baseline (RIDO), Wilcoxon signed-rank test (Trial statistician).
The timed walk speed did not differ from baseline throughout the treatment period
(Figure 3.8 Panel A), save for a slight dip at treatment week 0, which was non-
significant (p = 1.0). Patient 006 at baseline took 21 seconds (speed 4.8/sec) to
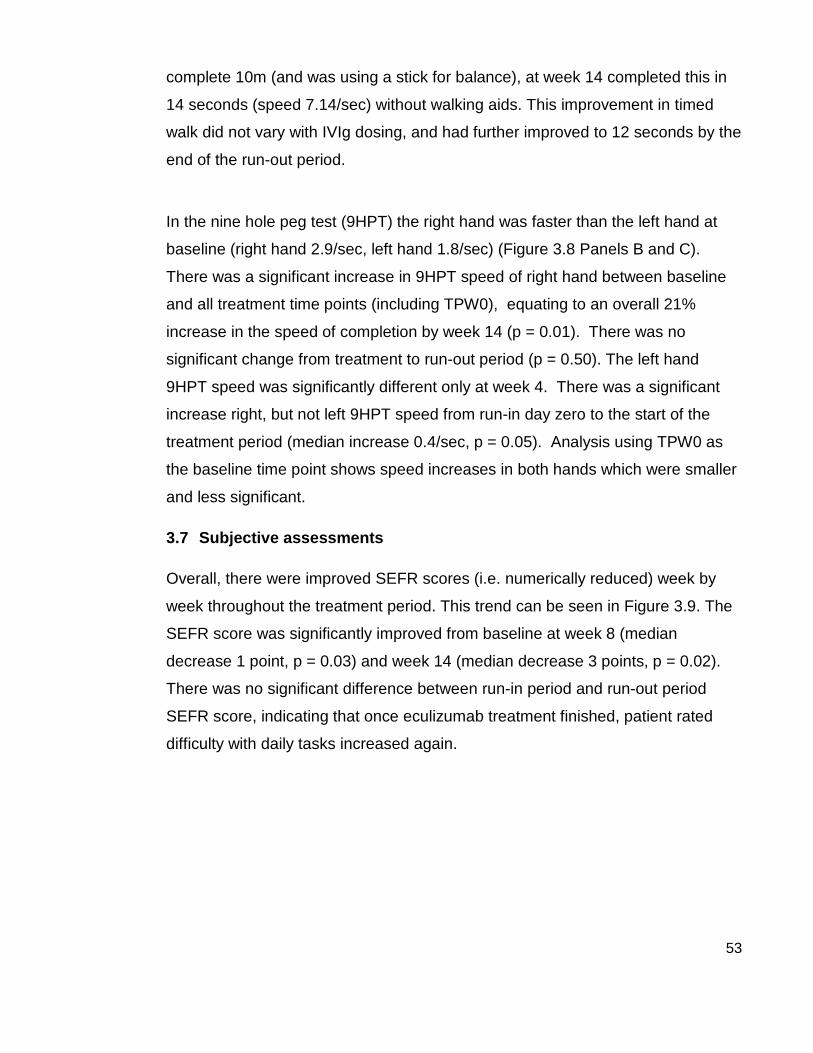
53
complete 10m (and was using a stick for balance), at week 14 completed this in
14 seconds (speed 7.14/sec) without walking aids. This improvement in timed
walk did not vary with IVIg dosing, and had further improved to 12 seconds by the
end of the run-out period.
In the nine hole peg test (9HPT) the right hand was faster than the left hand at
baseline (right hand 2.9/sec, left hand 1.8/sec) (Figure 3.8 Panels B and C).
There was a significant increase in 9HPT speed of right hand between baseline
and all treatment time points (including TPW0), equating to an overall 21%
increase in the speed of completion by week 14 (p = 0.01). There was no
significant change from treatment to run-out period (p = 0.50). The left hand
9HPT speed was significantly different only at week 4. There was a significant
increase right, but not left 9HPT speed from run-in day zero to the start of the
treatment period (median increase 0.4/sec, p = 0.05). Analysis using TPW0 as
the baseline time point shows speed increases in both hands which were smaller
and less significant.
3.7 Subjective assessments
Overall, there were improved SEFR scores (i.e. numerically reduced) week by
week throughout the treatment period. This trend can be seen in Figure 3.9. The
SEFR score was significantly improved from baseline at week 8 (median
decrease 1 point, p = 0.03) and week 14 (median decrease 3 points, p = 0.02).
There was no significant difference between run-in period and run-out period
SEFR score, indicating that once eculizumab treatment finished, patient rated
difficulty with daily tasks increased again.
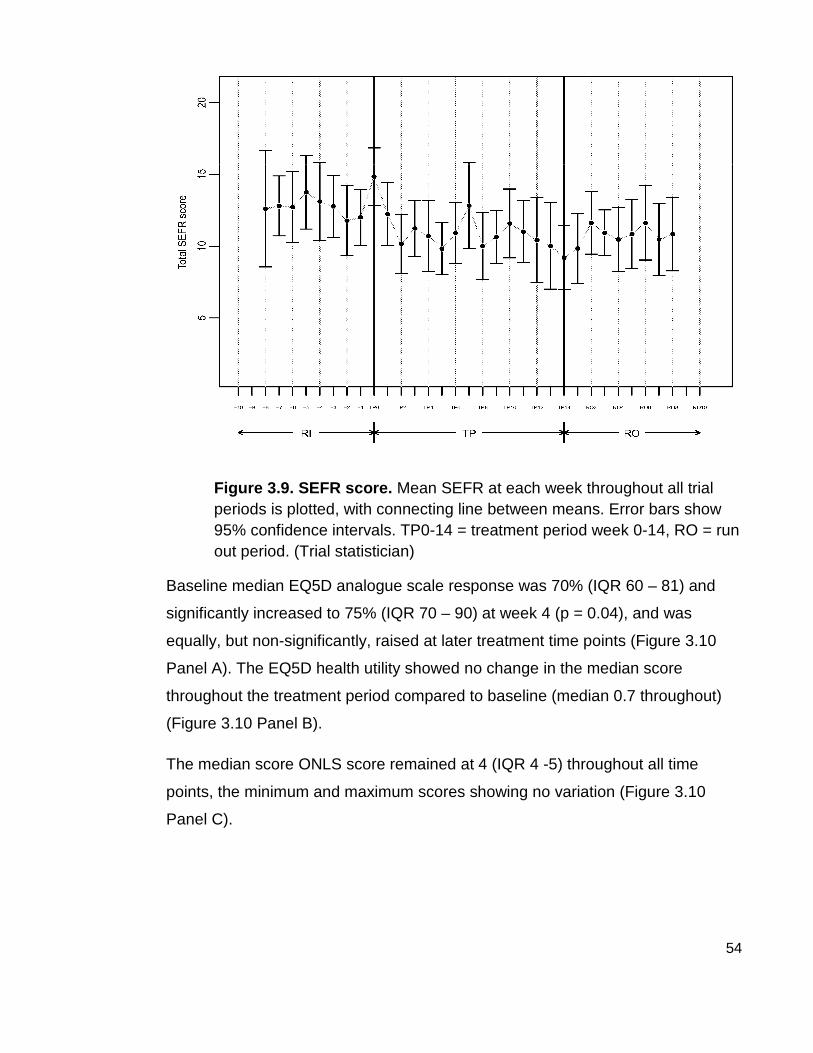
54
Figure 3.9. SEFR score. Mean SEFR at each week throughout all trial periods is plotted, with connecting line between means. Error bars show 95% confidence intervals. TP0-14 = treatment period week 0-14, RO = run out period. (Trial statistician)
Baseline median EQ5D analogue scale response was 70% (IQR 60 – 81) and
significantly increased to 75% (IQR 70 – 90) at week 4 (p = 0.04), and was
equally, but non-significantly, raised at later treatment time points (Figure 3.10
Panel A). The EQ5D health utility showed no change in the median score
throughout the treatment period compared to baseline (median 0.7 throughout)
(Figure 3.10 Panel B).
The median score ONLS score remained at 4 (IQR 4 -5) throughout all time
points, the minimum and maximum scores showing no variation (Figure 3.10
Panel C).

55
Figure 3.10. Subjective assessments. Panel A shows EQ5D visual analogue scale representing perceived health in percentage at study assessment points. Panel B shows EQ5D health utility score, for description see text. Panel C shows ONLS (Overall Neuropathy Limitation Scale) total score at study assessment points. Significance testing compares to baseline (RIDO), Wilcoxon signed-rank test (Trial statistician).

56
3.8 Responders versus non-responders
In a post hoc exploratory analysis, patients that had a minimum SEFR score
during the treatment period which was at least 2 points lower than the minimum
SEFR score during the run-in period (i.e. subjectively improved with daily tasks
during eculizumab treatment) were retrospectively classed as ‘subjective
responders’. Using this criterion, 7 of 13 (54%) of patients were subjective
responders: of these 5 of 7 had subsequent increase in SEFR score by at least 2
points during the run-out period, indicating that this SEFR score decrease was
only seen whilst on eculizumab in these patients.
The seven subjective responders included 2 patients not receiving IVIg.
Comparison of trial assessments at baseline and at time points between
responders and non-responders reveals a difference in the measurements
between these two groups. No statistical analysis has been performed since this
was a post-hoc descriptive analysis, but the pattern suggests that those who had
subjectively responded to treatment with eculizumab also had higher MRC score
and myometry recordings at baseline (Figure 3.11). They also had greater hand
functionality with faster 9HPT speeds and greater pinch-grip strengths at the
outset. The responder group appears to have had an increased IVIg inter-
treatment interval from run-in period to treatment period, while the non-responder
group shows a slightly decreased interval.

57
Figure 3.11. Responders vs non-responders . Boxplots displaying values for two groups of patients, no (clear box) = subjective non-responders (n = 6), and yes (shaded box) = subjective responders (n = 7), at time points RI (run-in day zero) and TP (values averaged throughout treatment period). Panel A shows IVIg inter-treatment interval .Panel B shows MRC sum score and MSF sum score showing responders. Panel shows pinch grip for right and left hands. Panel D shows nine hole peg test (time to complete in seconds). Asterisks represent outliers in the data.
3.9 Electrophysiology
Approximately two motor nerves from each patient were studied by nerve
conduction studies. The median conduction block (expressed as % CMAP
amplitude reduction) at run-in was 36% (IQR 27 – 53), and at treatment week 14
had significantly reduced by median 6.5% (IQR 2.5 – 11.5, p = 0.05) (Figure
3.12). The distal latency Z-score also showed a small but significant decrease at
the end of treatment, by median 0.16 standard deviations (p = 0.05). This
equated to a decrease in distal motor latency from 5.5 seconds (IQR 3.6 – 6.1) to
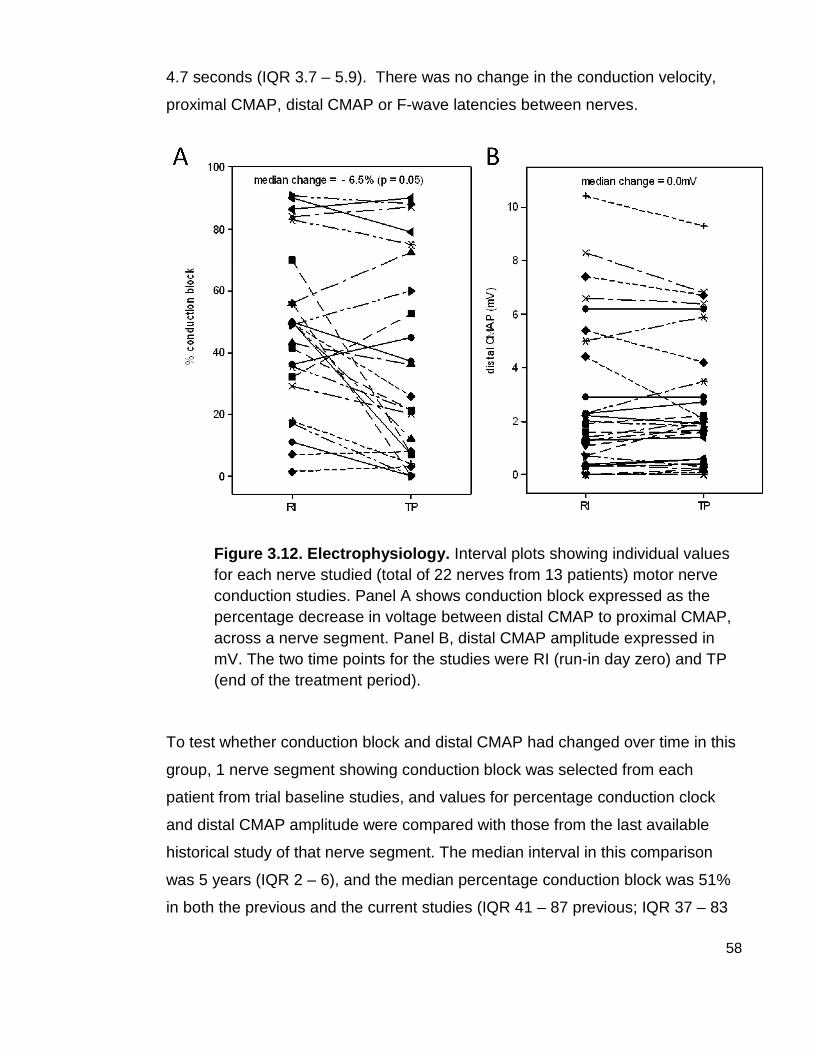
58
4.7 seconds (IQR 3.7 – 5.9). There was no change in the conduction velocity,
proximal CMAP, distal CMAP or F-wave latencies between nerves.
Figure 3.12. Electrophysiology. Interval plots showing individual values for each nerve studied (total of 22 nerves from 13 patients) motor nerve conduction studies. Panel A shows conduction block expressed as the percentage decrease in voltage between distal CMAP to proximal CMAP, across a nerve segment. Panel B, distal CMAP amplitude expressed in mV. The two time points for the studies were RI (run-in day zero) and TP (end of the treatment period).
To test whether conduction block and distal CMAP had changed over time in this
group, 1 nerve segment showing conduction block was selected from each
patient from trial baseline studies, and values for percentage conduction clock
and distal CMAP amplitude were compared with those from the last available
historical study of that nerve segment. The median interval in this comparison
was 5 years (IQR 2 – 6), and the median percentage conduction block was 51%
in both the previous and the current studies (IQR 41 – 87 previous; IQR 37 – 83

59
current). There was a non-significant trend to lower median distal CMAP with
time, (4.0mV previous; 2.7mV current, p = 0.17).
Figure 3.13. Comparison of conduction block and dis tal CMAP amplitude changes over the pre-trial period . Line plots showing individual values for conduction block (left panel) and distal CMAP amplitude (right panel) across 11 nerves with conduction block from this cohort of patients, CB 1 and CMAP 1 values refer to the last available nerve conduction studies prior to trial inclusion. CB 2 and CMAP 2 values refer to the baseline studies recorded for this trial. Significance testing by Wilcoxon signed rank test.
Electromyography studies of a maximum voluntary contraction were compared by
being assessed blindly by a panel of 5 neurophysiologists. 22 muscle groups (2
from each patient, n = 11, 2 patients excluded as recordings were not available at
time of assessment). Out of 22, only 6 muscle groups received unanimous
scorings, four showing increased motor unit recruitment and two showing
decreased recruitment following treatment.

60
4 Discussion
4.1 Safety
This trial did not set out to further clarify the absolute safety of eculizumab, as this
has already been done, but was designed to assess if a complement inhibitor
could be co-administered in patients receiving IVIg, and whether there were any
unexpected adverse events with this combination. Overall, this study observed a
significant increase in the rate of adverse events during eculizumab treatment,
compared with run-in period. Around 10% of these were classed as definitely or
probably related to the study drug. Most of the adverse events were mild, the
remainder moderate in severity. None were severe, and no patient discontinued
treatment due to adverse events. There were two serious adverse events whilst
on treatment, which became classed as ‘serious’ adverse events due to
heightened awareness of meningococcal meningitis, leading to reporting of ‘alert’
symptoms (headache), and the subsequent need for investigation and
hospitalisation for these two episodes. Overall, the most common adverse event
was headache, which made up 33% of the adverse event profile, and occurred at
least once in 69% of patients. The rate of occurrence of headache was higher
than the TRIUMPH study (Schubert et al.,2008), a prominent phase III
randomised control trial of eculizumab in PNH, which found 44% of patients had
headache during eculizumab treatment. Perhaps the increase seen in this trial is
due to the co-administration of IVIg, as headache is also the most side effect of
IVIg treatment. The other most common adverse events encountered in this
study were (in descending order) respiratory, musculoskeletal, gastrointestinal
and dermatological. This compares well to data from other studies with
eculizumab, and there were no unexpected AEs which were thought to be
possibly related to treatment. There were no cases of meningococcal
septicaemia in this group, and no other bacterial infections noted. Furthermore,
no patients experienced a worsening of disease, an important point given that
corticosteroids are known to be deleterious in MMN.

61
However, there were some difficulties with the interpretation of the safety data
findings of this study. Firstly, this trial was not placebo-controlled, and therefore
we do not know how frequently these adverse events would be reported in this
same group of patients whilst not receiving eculizumab. Secondly, the heightened
alert for meningococcal disease led to increased reporting of headaches. Thirdly,
the frequency of adverse event reporting was not constant throughout the three
phases of this trial, as the reporting in the run-in period was from 3 up to 8 weeks,
however in the treatment period, investigators and patients met at least weekly,
and thus there was greater prompting and opportunities for reporting of mild
events.
Overall, in this short duration open label study, it was observed that eculizumab
treatment was associated with an increase in adverse events, of which none
were unexpected side effects, and were roughly in keeping with safety data from
previous studies. There is evidence thus, that co-administration of eculizumab
and IVIg, may be associated with slightly higher rate of adverse events, but is
well tolerated.
4.2 Pharmacokinetic and pharmacodynamics
Pharmacological assays demonstrated that terminal complement function was
fully inhibited in all patients, regardless of concomitant IVIg use, and thus there
was no neutralizing effect of IVIg upon eculizumab. However it was found that
patients receiving IVIg had lower median eculizumab concentrations. Eculizumab
is expected to be eliminated via the same pathways as are native human
antibodies, being too large to be renally excreted, even in the context of nephrotic
syndrome, they are taken up into endothelial pinocytotic vesicles containing FcRn
receptors, also known as the ‘Brambell’ receptor. The Brambell hypothesis is
precisely this, that IgG homeostasis is regulated by the FcRn receptor which
salvages IgG (but not IgA or IgM) and prolongs the life-span of IgG, and
regulates its recycling. (BRAMBELL et al.,1964). Mice genetically lacking
expression of FcRn demonstrated IgG hypercatabolism and faster IgG
elimination (Ghetie et al.,1996).

62
The pharmacokinetics of IgG immunoglobulins is known to be non-linear,
displaying concentration-dependant elimination (Lobo et al.,2004) and this has
been shown for therapeutic monoclonal antibodies also (Tabrizi et al.,2006). The
rate of catabolism of immunoglobulins is increased when higher concentrations
are present, and this is thought to explained by the Brambell hypothesis, as at
lower concentrations, a larger proportion can be ‘salvaged’ by the FcRn receptor,
but at higher concentrations there are less available receptors and thus IgG
remains in the circulation where it is more likely to be catabolised. It has
previously been thought that patients receiving high dose intravenous
immunoglobulin will show higher rates of catabolism of IgG antibodies, due to
saturation of FcRn receptors (Yu et al.,1999). Animal models where monoclonal
antibodies were administered, followed by high dose IVIg (2g/kg), resulted in an
increased rate of excretion of the monoclonal antibody (Bleeker et al.,2001), and
extrapolated to humans, this predicts a 25% increase in elimination of the
monoclonal antibody within 3 to 4 weeks.
A highly possible explanation for the finding in this study, of lower eculizumab
concentrations in patients receiving high dose IVIg, is due to concentration-
dependent elimination, and therefore further supports the Brambell hypothesis.
However it is clear from the data presented here that although this occurs,
pharmacodynamics and this serological efficacy of this antibody were not
compromised.
It is thought that perhaps this effect this also accounts for some of the therapeutic
effect of IVIg in antibody-driven autoimmune conditions, by increased elimination
of the autoantibody, as a result of saturation of the salvaging mechanism by
exogenous IVIg. In myasthenia gravis and stiff-person syndrome, IVIg treatment
results in the decline in AchR-Ab (Illa,2005) and anti-GAD antibodies
respectively (Dalakas,2005). However the same does not hold true for MMN
(Piepers et al.,2010), most likely because the antibody is IgM isotype, and
therefore is not regulated by the FcRn receptor.

63
The MMN response to IVIg, but not to other immunomodulatory methods, may be
due to the complement regulating effects. Antibodies against several
components of the classical complement pathway have been identified in IVIg.
They include antibodies against C1, C3a, C3b and C4 (Jacob et al.,2009). In
addition, high doses of IVIg are thought to enhance the degradation of C3b (Lutz
et al.,1996). It has now been shown in vitro (using ELISA) that IVIg decreases
complement deposition by IgM-GM1 antibodies in vitro, and results in decreased
classical pathway activation in MMN patients receiving IVIg (Piepers et al.,2010).
The results presented here show that IVIg maintenance therapy did not reduce
the haemolytic activity (MAC lysis effect) in MMN patient serum, as this was
>90% in patients regardless of IVIg therapy when patient serum was tested at
baseline, prior to eculizumab treatment. However, the samples from this assay
were collected immediately prior to the next dose of IVIg, and thus perhaps since
the effect of IVIg has since declined, and any changes to complement have
returned to baseline. It would be interesting to test MMN patient serum mid-cycle
for complement levels. This effectively did happen during the eculizumab
treatment period, but complement was already fully suppressed by eculizumab,
and remained inhibited even at the end of the dosing window. Hence, even if IVIg
does cause a decrease in terminal complement activity in MMN, by replacing this
effect more robustly with eculizumab, there still remained a need for IVIg. From
this it could be concluded that the overriding IVIg therapeutic effect in MMN is
mediated by factors other than complement activity. There are many other
immunomodulatory roles of IVIg: interference anti-idiotypic antibodies interfere
with the binding of autoantibodies to their target ligand, reducing the formation of
immune complexes, modulation of macrophages function via modulation of Fc
receptors, and modulation of cytokines and cell signalling molecules in the
humoral and cellular immune reaction.
Another possible reason for lack of IVIg replacement by eculizumab could be that
terminal complement inhibition was not fully achieved in the endoneurial
compartment, since this is separated from plasma by the blood-nerve barrier
(BNB), and we do not know what proportion of eculizumab was able to cross this.

64
Schwann cells and macrophages are known to synthesise C5 locally (Ramaglia
et al.,2009), thus the combination of lower intraneural eculizumab concentration,
and higher C5 concentration, may reduce the pharmacodynamic properties of
eculizumab in this compartment. In addition, Schwann cell expression of
complement regulators such as CD59 may also be fully up-regulated in MMN to
the extent that additional terminal complement inhibition may have little effect on
the ongoing injury.
Regarding the passage of immunoglobulins across the BNB, in animal models of
Guillain-Barré syndrome, radiolabelled immunoglobulin was increased 3-4 days
into the disease, but declined by day 8. MMN is a chronic condition, in this group
the median disease duration was 19 years, and there are multifocal lesions of
different ages throughout various motor nerves. Perhaps the permeability of the
blood-nerve barrier is increased in the acute lesion, but returns to baseline in the
chronic phase, and thus eculizumab and other immunoglobulins cannot enter all
sites of conduction block. This however still leaves the question of why IVIg
works effectively in MMN.
4.3 Secondary outcome measures
Although complement inhibition did not replace the requirement for IVIg, some
improvements in secondary outcomes were observed. There was an overall trend
towards improvement in patient-rated subjective scores whilst receiving
eculizumab, and in approximately half of the group eculizumab treatment
decreased their difficulty with tasks of daily living more than usual with IVIg.
Eculizumab also benefited two patients who were not receiving IVIg, displayed by
changes to SEFR scores in these two patients.
There was an overall trend towards increased muscle strength as measured by
myometry, which did not diminish during the run-out period. The maintenance of
muscle strength during the run-out period could have represented longer lasting
benefit from eculizumab, which could be proposed to occur through remyelination
of some nerve fibres.

65
Speed of 9HPT completion significantly increased in the right hand with
treatment; although this could have been a practice effect, and was not seen in
the left hand. However, other objective clinical measurements did not show any
clear trends, even when responders and non-responders were considered
separately.
Half of the patients who were subjective responders, although still requiring IVIg,
reported the pre-treatment deterioration points (DPs) were less severe, as scored
by SEFR, and the MRC sum score improved during these DP compared to their
previous DPs. One patient who routinely received 10 weekly IVIg did not reach
deterioration point at all during eculizumab treatment, making the inter-treatment
interval 30 weeks in total, and whilst the SEFR scoring greatly improved, no
improvements in objective measurements were noted in this patient.
There are some difficulties in the evaluation of MMN as a condition, the most
prominent reason is due small numbers of patients with this condition. Additional
difficulties are introduced due to the multifocal nature of this neuropathy, resulting
in a slightly different anatomical pattern and severity distribution in each patient,
and thus there is no global set of assessments that can be broadly compared
across the heterogeneous group of patients. Discrepancies between subjective
and objective outcome trends, has been previously noted in MMN trials (Leger et
al.,2001). Few articles have been published on the best outcome measures to
evaluate patients with MMN, and those selected here were based on clinical
experience with neuropathy, knowledge of tools used well other published MMN
trials, for example SEFR score (Van den Berg et al.,1995). Since MMN is an
upper limb predominant disease, multiple measures of hand strength were
employed in this study, and dexterity was also measured by the 9HPT. However,
due to same hand side being compared across the whole patient group,
unaffected hands in some patients were compared with affected hands in other
patients, which could cause the collective data to mask smaller changes in
affected muscles. As proposed during the ENMC (European Neuromuscular
Centre) International workshop on selection of outcome measures for peripheral
neuropathy clinical trials (Merkies et al.,2006), modified sum scores are used

66
here where possible, choosing the most affected muscles in each patient. This
can explain the observation in this study, that myometry and SEFR scores were
those to show a convincing trend, since these tests was individualized for each
patients depending on their most affected muscle groups and functions.
Outcome measures in this study were also likely to be affected by the inter-test
variability introduced by random fluctuations in patient performance and operator
or device measurement errors. In a series of MMN and CIDP patients, controls
limits analysis was performed on myometry data with the aim of describing the
variability within this group, and found that almost 90% of patients had variability
of up to 30% (Lough et al.,2000). Coupled with the suggestion that the minimally
clinically important difference in a measure could be as low as 8% (Jaeschke et
al.,1989), the chances of discovering this within data from neuropathy trials could
be extremely low due to the high levels of inter-test variability.
An additional level of variability introduced in this study was IVIg therapy, as this
is known to cause cyclical changes to muscle strength (Van den Berg et
al.,1998), which were also noted in some, but not all, patients in this trial. Due to
fixed assessment points in this study design, patients were assessed at varying
points in their cycle, so intra- and inter-patient comparisons were also likely to be
difficult to interpret. Due to this, outcomes measures were compared, in a
separate analysis, at successive deterioration points only, which were thought to
represent a fixed ‘trough’ level of function as assessed by patient and clinician.
No significant differences in measures compared at deterioration points were
found, although there was a pattern of increasing MRC sum score at deterioration
points.
The finding that subjective responders had a higher level of pre-trial function and
muscle strength in comparison with subjective non-responders suggests that
patients who were less severely affected were more likely to experience an
eculizumab-related treatment response. It should be equally recognised that the
eculizumab non-responders still remained responsive to IVIg, and so these
patients were not treatment-resistant. Motor axon loss is an important
67
determinant of weakness in MMN and the degree of axonal degeneration
increases with disease duration (Van Asseldonk et al.,2006; Van den Berg-Vos
RM et al.,2002a). As has also been shown in CIDP (Iijima et al.,2005) and MMN
(Nobile-Orazio et al.,2002), muscle atrophy and electrophysiological evidence of
axon loss, are more likely in patients who are not responsive to IVIg. Therefore it
would be not only intuitive, but also evidence-based, to aim this and other novel
therapies towards less advanced cases where more scope for a treatment
response exists.
4.4 Electrophysiology
Electrophysiological measurements are important here as they represent the only
objective assessments collected in the study that were independent of patient-
related performance bias. There were improvements in individual measurements
in some patients, and deterioration in others, but with an overall trend in favour of
improvement, by a small but significant net decrease in the degree of conduction
block across all nerves studied. It would not be expected that conduction block
would change appreciably over time, and the median conduction block had
remained stable in these nerves studied for a median of 5 years before the study,
yet within 14 weeks of treatment, there was a significant change. The effect of
IVIg on conduction block remains unresolved, as some studies show
improvement in conduction block with IVIg treatment (Van den Berg-Vos RM et
al.,2002b; Vucic et al.,2004), whilst in others no electrophysiological changes
were found, despite improvements in muscle strength in by up to 80% (Leger et
al.,2001). This could be explained by an improvement in nerve conduction at
sites not measured by nerve conduction, such as those more proximal or more
distal to the segment studied. There was a significant change in distal motor
latency, which suggests that distal conduction was slightly faster. This may well
represent resolution of distal conduction block at micro sites in the small nerve
fibres in the hands and feet. It has been proposed that this occurred in 4 out of 18
nerves studied with long term IVIg treatment, and is thought to be due to
remyelination (Van den Berg-Vos RM et al.,2002b). However, this effect was not
observed in the nerves as a whole, as there was no significant change to
68
conduction velocity, or F wave latency, other parameters which would be
expected to improve with nerve remyelination, and thus this effect may have
been length dependent.
69
4.5 Conclusion and future work
Overall, in this short duration open label study, it can be concluded that co-
administration of eculizumab and IVIg did not highlight any additional safety
concerns, and IVIg did not reduced the pharmacological effectiveness of
eculizumab. There was some evidence of small positive benefits of eculizumab
treatment in MMN. This was observed in some, but not all, of the subjective and
objective measurements used. The outcome measures that were most tailored to
assess each individual showed the most significant changes. In addition, truly
objective measurement using electrophysiology, showed some small but
significant improvements in nerve conduction. It is difficult to come to any overall
conclusion about the efficacy of eculizumab in multifocal motor neuropathy, due
to the uncontrolled study design and the lack of dramatic response seen (such as
large reduction in amount of IVIg required), however it can be viewed as
encouraging for further studies of complement inhibition in MMN and other
immune-mediated neuropathies.
Ideally, a longer term study of terminal complement inhibition should be
performed in MMN, looking for a more gradual cumulative effect or an arrest of
disease progression. When considering future studies, placebo controlled trials
designs would be clearly be the next step for the investigation of this drug, in
order to control for test performance variability, learning effects, and operator and
patient-related assessment bias.
Perhaps more pressing than future trials in MMN, would be a trial in acute,
severe neuropathy such as Guillain-Barré syndrome in which early aggressive
treatment has a greater capacity to majorly influence short and long-term
morbidity, and more evidence for the beneficial effect of complement inhibition
from animal models exists. Now that safety data regarding the co-administration
of IVIg and eculizumab exists, a trial of complement inhibition in Guillain-Barré
syndrome is a high priority.

70
5 Laboratory work: Investigating the serological factors in MMN
5.1 Introduction
The knowledge that up to 50% of patients in MMN do not possess antibodies to
GM1, may place some doubt over the theory that MMN is an antibody driven
disease (Nobile-Orazio et al.,2005), although it remains clear that MMN is a
immune-mediated disease since antibody-negative patients are also largely
immune-responsive.
5.1.1 Anti-GM1 antibody in MMN
There are some alternative theories to explain the significance of GM1 antibodies
in this disease, for example, that the GM1 antibody is a biomarker for disease,
produced when inflammation of the nerves exposes GM1-rich areas of nerve to
immune cells and thus antibodies develop. A similar explanation is that GM1
antibodies are present as markers of previous infection with Campylobacter jejuni
or other organisms which may have similar cross-reactivity with GM1. However,
much evidence exists to support the theory that immune attack of nerves is
mediated by anti-GM1 antibodies, via complement fixation, causing destruction of
peripheral nerve structure and function. This has been demonstrated in vivo and
ex vivo for not only the anti-GM1 antibody (Greenshields et al.,2009; Nobile-
Orazio et al.,2005; Yuki et al.,2001), but for anti-GD1a antibodies (Goodfellow et
al.,2005; McGonigal et al.,2010) and anti-GQ1b antibodies (Halstead et
al.,2005a; Halstead et al.,2008a; Halstead et al.,2008b). As support for the
antibody-driven theory, the anti-GM1 antibodies found in MMN are demonstrated
in vitro to be specific for motor nerves, though sensory nerves do contain GM1
gangliosides, the antibodies from MMN sera do not bind (Corbo et al.,1992). It is
perhaps no coincidence that MMN is a predominantly motor condition. The
binding site on the GM1 antibody found in MMN perhaps therefore has specificity
for a particular structural arrangement of GM1 which seems to be specific for
GM1 in motor nerves although GM1 ganglioside is found in non-neural tissue
types within the body.
71
The fluid mosaic model of the cell membrane helps us to understand that lipids
and proteins diffuse easily in a bilaminar phospholipid layer (Singer et al.,1972),
and thus the conformation of the gangliosides in this environment are not fixed,
although it is known that gangliosides exist in lipid clusters (Fujita et al.,2007).
Current methods of antibody detection, ELISA and combinatorial microarray both
described in this paper, are conducted in the ‘solid phase’, and therefore detect
antibodies which bind to glycolipids which have been immobilised on a fixed
plane.
5.1.2 Glycolipid complex microarrays
Current work in the investigation of autoimmune neurological conditions uses
combinatorial microarrays to assess the effect of glycolipid pairings on antibody
binding in the solid phase, thereby imitating the effect of glycolipid clustering on
the cell membrane. Using this method, novel antibody sensitivities have been
discovered, for example, sulfatide:ganglioside interactions in CSF from patients
with multiple sclerosis (Brennan et al, unpublished data), and many
ganglioside:ganglioside pairings in serum from patients with GBS (Kaida et
al.,2004; Kaida et al.,2007). The explanation for this new reactivity is that the
pairing of the two lipids creates a novel epitope which matches the binding site of
an antibody already present in serum from the disease population. This may
reflect a configuration of lipids on the nerve membrane within the lipid clusters via
which that antibody exerts pathogenic effects. Previous work within our research
group has demonstrated that the ability of anti-GM1 antibodies to bind to target
tissue is affected by its local glycolipid environment, and that GM1 is often
inaccessible due to the presence of terminal sialic acid residues on neighbouring
gangliosides (Greenshields et al.,2009). This work has primarily involved two
mouse IgG monoclonal antibodies (DG1 and DG2) both with similar binding
affinities for GM1. DG1 was developed by harvesting of the immunogenic
response to lipopolysaccharide isolated from Campylobacter jejuni, and DG2
using a GM1-bearing liposome as the immunogen. DG2 bound to the live ex-vivo
nerves and exerted pathogenic effects via MAC deposition, whilst DG1 did not,
unless the nerves were treated with neuraminidase which altered the ganglioside

72
composition of the nerve membrane by removing terminal sialic acid residues
(see Figure 5.1). Greenshields also used a monoclonal IgM antibody cloned from
a patient with MMN (Willison et al.,1994), and this showed similar binding
requirements as DG1.
Figure 5.1. Schematic illustration of the effect of neuraminidase on
gangliosides with terminal sialic acid. Neuraminidase cleaves the terminal
sialic acid residue, leaving a terminal ganglioside configuration identical to
GM1.
5.1.3 PC12 cells
PC12 phaeochromocytoma cells are clonally derived from rat adrenal medullary
tumour cells, originally generated by Greene and Tischler in 1976 (Greene et
al.,1976). PC12 cells are small round cells, diameter 6-14µm (Tischler et

73
al.,1978), which is comparable in size with human red blood cells. Grown in vitro
they have morphologic and cytochemical features in common with normal
chromaffin cells, synthesising and storing catecholamines and acetylcholine, and
bearing sympathetic nervous system receptors (Tischler et al.,1978). Further to
the development of the cell line, it was discovered that PC12 cells also bear
nerve growth factor (NGF) receptors, and when this is added to culture, it causes
cessation of cell division and development on neuronal cell qualities, with
branched processes (neurites), electrical excitability via activation of Ca2+ and
Na-K+ channels, and development of synapses between cells. Therefore, the
cells undergo morphological and physiological changes with the addition of NGF
which transforms them into neurones similar to those of the sympathetic nervous
system (Fujita et al.,1989). Sialic acid bearing gangliosides account for 10% of
the lipid weight of the PC12 cell, and this approximately doubles with NGF-
induced differentiation. Tri- and tetra-sialogangliosides make up the biggest
proportion of gangliosides, with mono and di-sialogangliosides also present
(Walton et al.,1988; Wu et al.,1988). Although the total amount of gangliosides
increases with neural differentiation, the ganglioside repertoire and their relative
amounts do not change (Walton et al.,1988).
5.1.4 Neuraminidase
Neuraminidases are naturally occurring enzymes that cleave the glycosidic
linkages of neuraminic (sialic) acids (CARUBELLI et al.,1962). The most
characterised is its role as a virulence factor in influenza, and this has led to the
development of therapeutic neuraminidase inhibitors, such as oseltamivir
(Tamiflu™) to prevent virus mobility and penetrance (Jefferson et al.,2010). It
has been demonstrated to cleave terminal sialic acid groups, thus converting
GD1a and GT1b to de novo GM1 (Figure 5.1), in a variety of ganglioside-
containing tissues, including red blood cells (Ackerman et al.,1980), neural tissue
(Wang et al.,2009) and PC12 cells (von et al.,2001).

74
5.1.5 Cholera toxin B subunit
Cholera toxin is a heat-labile enterotoxin secreted by diarrhoeal bacterium Vibrio
cholerae, and less classically, by Escherichia coli (Van Heyningen et al.,1976).
It is composed of two subunits A and B. Each complex contains 5 B-subunits
arranged in a pentamer, and one A-subunit with a long tail that sits within the
central pore of the B-subunit pentamer-complex. Cholera toxin binds to intestinal
epithelium via B-subunit binding GM1 on the cell surface. Upon binding the A-
subunit is released and enters the cells, resulting in increased adenylate cyclise
activity, cAMP production and massive secretion of water and electrolytes leading
to profuse watery diarrhoea (Bennett et al.,1975).
Cholera toxin B subunit (CTB) is widely used experimentally as a reliable probe
for GM1 ganglioside, and the binding affinity is remarkably high with dissociation
constants (KD) in the 10-10 to 10-12 M range (Kuziemko et al.,1996) (which is 104
to 106 fold higher than the anti-GM1 monoclonal antibodies used in the following
experiments). Regarding the specificity of the CTB-ganglioside interaction, there
is some evidence to suggest that CTB may cross react with other gangliosides, in
particular asialo-GM1 (GA1) and GD1b, however with low avidity and
requirement for high concentrations of these other gangliosides (Cumar et
al.,1982; Lauer et al.,2002).
5.1.6 Fluorescence-activated cell sorting (FACS) analysis
FACS analysis uses flow cytometry to detect the fluorescence and structural
characteristics of individual cells (or particles) within heterogeneous mixtures,
and thus has potential to sort the cells into different groups by their
characteristics or different fluorescent labels. Flow cytometers are custom built
machines which propel the cells or particulate mixture in a focused stream, via an
arrangement of lasers, and fluorescence detectors, which are perpendicularly
arranged and detect direct light emittance (forward scatter) and deflected light
(side scatter),giving information about the size and the complexity of the cell
structure (Fulwyler,1980).

75
5.1.7 Research aims
The aim of this experiment was to screen a database of MMN sera, to determine
the different binding characteristics which may exist within this seemingly
homogenous group and through this perhaps elucidate more clues to the
antibody’s pathogenicity. First the aim to was discover any anti-GSC
(ganglioside complex) antibodies in MMN patients, through the use of novel,
miniaturised solid phase immunoabsorption study (microarray), which could
facilitate the screening of larger cohorts of membrane lipids than traditional
ELISA techniques.
Secondly, the binding characteristics of IgM anti-GM1 antibody in MMN sera
were sought, in particular, looking for an inhibitory effect of local GD1a as was
discovered with human monoclonal antibody from an MMN patient.
5.2 Methods
5.2.1 ELISA
Ganglioside stock solutions for ELISA were made by diluting gangliosides in
methanol to 2µg/mL. 96 well ELISA plates (Immulon 2HB) were ‘coated’ with
gangliosides by adding 100µL per well, and for the negative control methanol
only was added to a number of wells per ELISA plate. Subsequently, the plate
was left to air dry for at least 2 hours in a fume hood. Plates were kept at 4°C for
at least 1 h prior to further use.
Plates were blocked with 2% BSA/PBS for 1 h at 4°C. Primary samples were
diluted in 0.1% BSA/PBS. Then 100µL of the diluted solution was applied to each
coated well of the ELISA plate. Incubation was for 12 h at 4°C.
The primary solution was discarded, and the plates immersed in cold PBS were
then discarded for five cycles. IgM peroxidase-labelled secondary antibody was,
diluted 1:3000 in 1% BSA, and 100µL applied to the wells and incubated for 1 h
at 4°C. The plates then underwent the same wash pro tocol as for the primary
solution. Detection was performed with an o-phenylenediamine dihydrochloride
76
solution. The reaction was terminated with 50µL of 4 M H2SO4. Optical density at
492 nm was detected by an automated plate reader (Ascent Multiscan,
Labsystems, GMI, USA). Background (methanol) optical density (OD) values
were subtracted to give final OD values.
5.2.2 Microarray
Screening of combinatorial lipid arrays was performed as previously described
(Rinaldi et al.,2010). Sera from 33 patients with MMN were screened on a
microarray panel comprising lipid membrane components GM1, GM2, sulphated
galactosylceramide (sulfatide), galactocerebroside (GalC), phosphatidylserine
(PS), GD1a, GT1b, GA1, sulfoglucuronyl paragloboside (SGPG) and sialosyl-
lactoneotetraosylceramide (LM1) (Sigma, UK or Avanti Polar Lipids, Alabaster,
AL). These were solubilised in methanol and immobilized on a PVDF membrane
(Invitrogen, UK) alone and in combinations (a 1:1 v/v mixture comprising 10ng of
each lipid per spot) using an automated TLC arrayer (Camag Linomat
Autosampler). Membranes were blocked with 2 % bovine serum albumin (BSA) in
PBS (10 mM Na2HPO4, 150 mM NaCl, pH=7.4) for 1h. Membranes were then
incubated with 250 µl of serum diluted in 1 % BSA in PBS for 1 h at 4° C. After a
further wash cycle, membranes were incubated with 250 µl of a 1:25000 diluted
HRP-labelled anti-human IgM antibody for 30mins and washed twice in 1% BSA
in PBS. The membranes were dried for 10 minutes at room temperature and
chemiluminescence signals were detected (ECLplus, GE Healthcare) by
autoradiography. Exposure time was 1 minute.
5.2.3 PC12 cell culture
Culture flasks were coated with poly-l-lysine (Sigma-Aldrich) diluted to 4mg/ml in
PBS. Culture medium was made as follows: for each 100ml, 7.5ml FBS (foetal
bovine serum, Sigma), 7.5ml horse serum, 1ml penicillin/streptomycin (GIBCO
15140), 1ml L-glutamine 200mM (GIBCO), and remainder, 83ml DMEM
(Dulbecco’s modified eagle medium, GIBCO). The serum-enriched culture
medium was filtered and stored at 4°C until use. PC 12 cells were grown in culture

77
flasks at 37°C in water jacketed CO 2 incubator until around 80% confluence was
reached, with culture medium changed every 48-72 hours.
5.2.4 Immunohistochemistry
Culture medium was removed from the flasks and flasks were rinsed with PBS
(pre-warmed to 37°C), before being trypsinised at 3 7°C for 1-2mins to detach
cells from the coated surface of the flasks. Serum-enriched culture medium was
added to the flasks to suspend trypsinisation, and the cell-containing medium
was added to sterile universal containers, centrifuged at 900rpm for 5 minutes.
The supernatant was discarded and the cell pellet re-suspended in 5ml culture
medium using a 23 gauge needle. Cells were then counted under the microscope
to give cell concentration per ml. 20,000 cells were pipette onto the centre of
poly-l-lysine coated glass cover slips, and once cells had adhered to cover slip,
wells were filled with culture medium, and placed in the 37°C for 24 hours.
Neuraminidase (Sigma-Aldrich) was made up to concentration of 2 units/ml (1
unit = 128µg) in serum-free DMEM, and warmed to 37°C prior to adding to the
culture wells, which had been pre-rinsed with serum-free DMEM. Cell-coated
cover slips were incubated with neuraminidase for 30 mins at 37°C. Following
this, cover slips were rinsed with 4°C PBS, and kep t on ice.
The immunostaining step follows. In preliminary experiment, to establish the
presence of GM1 ganglioside on neuraminidase treated and untreated cells,
FITC-labelled cholera toxin B subunit (Vibrio cholera, Sigma-Aldrich C9903) was
made up to concentrations of 250ng, 500ng, 1µg and 2µg and incubated in
darkness at 4°C for 60 mins. In further experiment s, unlabelled CTB was
incubated as above, at concentration 1µg/ml, prior to incubation with monoclonal
antibodies (DG1, DG2 and SM1) 10 µg/ml, or MMN sera at 1:10, 1:50 and 1:100
dilutions. Following this, FITC-labelled secondary antibodies were applied at
1:300 concentrations for 30mins; for DG1 and DG2 goat anti-mouse IgG3-FITC
(Southern Biotech) and for MMN, control sera and SM1 mAb, goat anti-human
IgM-FITC (Southern Biotech).

78
Cover slips were then washed in 4°C PBS, and then fixed with 4%
paraformaldehyde, left for 15mins at room temperature, then Triton-X100 0.1%
was added to permeabilise the cells. Cover slips were rinsed in PBS and
mounted on microscope slides with addition of DAPI mounting medium for
nuclear staining (Vectashield, Vector). Image acquisition was performed using
Carl Zeiss software, exposure time was kept constant for each image.
5.2.5 FACS analysis
Following the trypsinisation step above, cells were re-suspended in serum free
DMEM and 5 x 10⁵ cells were added to 12mm diameter polyester round bottom
tubes (BD Falcon). Neuraminidase treatment was carried out as above. Following
this, FACS tubes were centrifuged at 4°C 500rcf in FACS buffer (recipe) for
rinsing, prior to addition of 5µg unlabelled CTB (initially 2µg but increased later in
experiment due to lack of blocking of sera – see results). Cells were rinsed twice
in FACS buffer between CTB incubation, and addition of MMN sera,
concentration 1:50. This was the optimum concentration found on cells staining
(above) to have detectable binding to cells with low background binding. Cells
were washed 3 times in FACS buffer by resuspension of the pellet between
successive centrifugations, before incubation with secondary antibody (FITC-
labelled as above, 1:3000). All FACS analyses were carried out on the same
FACScalibur machine, each sample recorded at least 10,000 cells. Using FlowJo
software, mean fluorescence intensities were calculated.

79
5.3 Results
5.3.1 Combinatorial microarray
MMN sera from 33 patients were screened on a 10 x 10 combinatorial microarray
composed of the lipids GM1, GM2, GD1a, GT1b, GA1, GalC, SGPG, Sulphatide,
LM1 and phosphatodylserine (PS), giving a total of 45 lipid complexes, each
duplicated in a mirror image against a diagonal line of methanol only as shown in
figure 5.2.
Figure 5.2.Combinatorial glycolipid microarray. Two microarray images are shown with superimposed layout grids for ease of interpretation. Boxes marked ‘X’ represent spots where methanol only, no lipid, was spotted onto the PVDF. Along the outer horizontal and vertical rows are the single lipid spots, duplicated in a mirror image across the methanol only line. All other spots represent lipid combinations as per the corresponding row/column headers. The microarray depicted on the left side is a typical anti-GM1 positive patient, who has binding detectable to GM1 single, which is seen to be diminished by combinations with GD1a, GT1b and LM1, whilst enhanced in combinations with GalC notably. Whilst on the right, a typical anti-GM1 negative patient is depicted, showing no binding to any single lipid, but binding to the following combinations of lipids: GM1:GalC, GM2:GalC, GA1:GalC and SGPG:GA1.
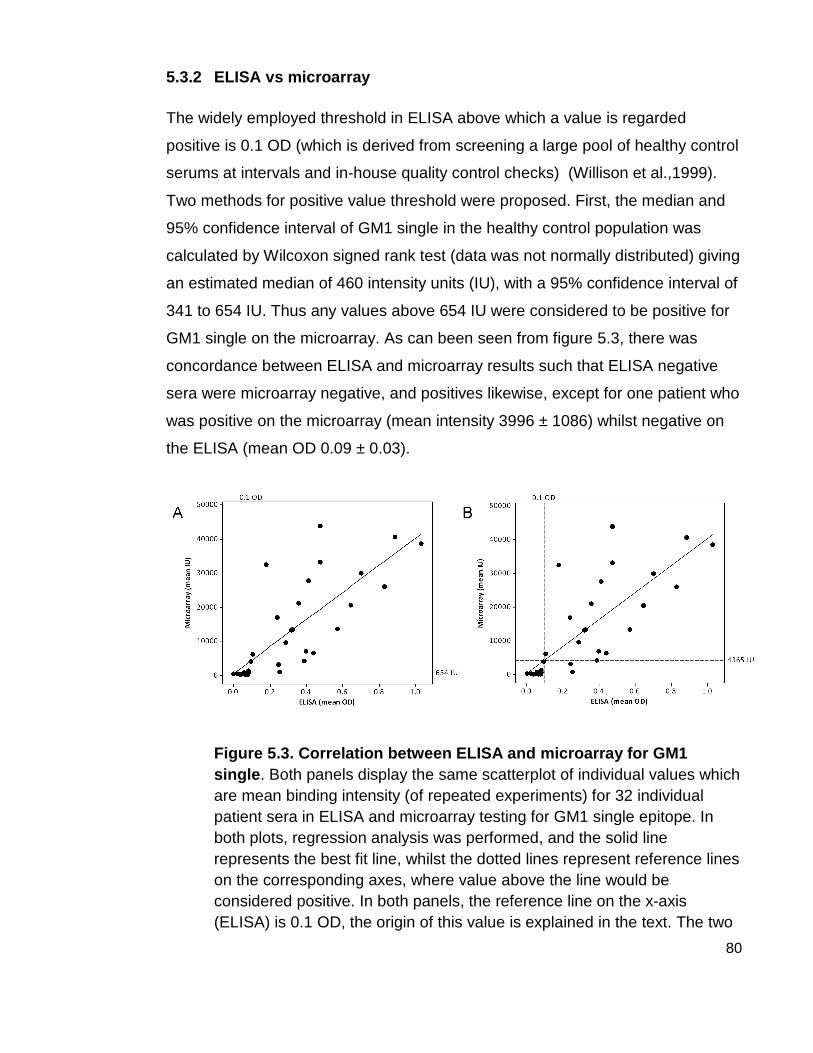
80
5.3.2 ELISA vs microarray
The widely employed threshold in ELISA above which a value is regarded
positive is 0.1 OD (which is derived from screening a large pool of healthy control
serums at intervals and in-house quality control checks) (Willison et al.,1999).
Two methods for positive value threshold were proposed. First, the median and
95% confidence interval of GM1 single in the healthy control population was
calculated by Wilcoxon signed rank test (data was not normally distributed) giving
an estimated median of 460 intensity units (IU), with a 95% confidence interval of
341 to 654 IU. Thus any values above 654 IU were considered to be positive for
GM1 single on the microarray. As can been seen from figure 5.3, there was
concordance between ELISA and microarray results such that ELISA negative
sera were microarray negative, and positives likewise, except for one patient who
was positive on the microarray (mean intensity 3996 ± 1086) whilst negative on
the ELISA (mean OD 0.09 ± 0.03).
Figure 5.3. Correlation between ELISA and microarra y for GM1 single . Both panels display the same scatterplot of individual values which are mean binding intensity (of repeated experiments) for 32 individual patient sera in ELISA and microarray testing for GM1 single epitope. In both plots, regression analysis was performed, and the solid line represents the best fit line, whilst the dotted lines represent reference lines on the corresponding axes, where value above the line would be considered positive. In both panels, the reference line on the x-axis (ELISA) is 0.1 OD, the origin of this value is explained in the text. The two
81
scatterplots here differ by the choice of two different reference lines for microarray method. Panel A uses the value 654 IU, which is the upper 95% confidence interval of the median binding intensity to GM1 single by the cohort of 27 healthy controls. Panel B uses the value 4365 IU, which is the predicted value of binding intensity which corresponds to an ELISA value of 0.1 OD, calculated by the regression equation presented in the text.
There was a linear relationship between ELISA and microarray values, such that
the regression equation was MICROARRAY (IU) = 387 + (39780 x ELISA (OD)),
on linear regression analysis the p value of the correlation coefficient was <
0.001, and R2 was 59.2%, indicating a good fit of this regression line. From this
equation the corresponding microarray value to the widely used positive cut-off
value of 0.1 OD on ELISA can be predicted. Thus a value of 0.1 OD would be
(387 + (39780 x 0.1) =) 4365 IU on microarray testing. Since an OD of 0.1 is the
upper limit reference point for the diagnostic lab, then perhaps the corresponding
microarray value should also be used as the cut-off for a positive result. If we do
this, the yield of GM1 positives is reduced, to 19/33, and as can be seen from
figure 5.3 panel B, there are now two samples which had been positive on the
ELISA but were negative on the microarray.
5.3.3 GM1 binding in complex with other glycolipids
Using the former method, the upper 95% confidence interval of the median as the
cut-off, there are 25 sera which are positive on the microarray for GM1 single,
equating to 76% of the MMN population screened. The median signal intensity of
GM1 single epitope was 13394 IU (IQR 5213 – 28801). When GM1 was in
complex with other gangliosides or glycolipids, the signal intensity increased,
decreased or was unchanged as shown in figure 5.4. The complex-inhibiting
lipids were (in order of inhibition) LM1, GD1a, and GT1b. The complex-enhancing
lipids were (in order of enhancement) GalC, SGPG and sulphatide.

82
Figure 5.4. GM1:glycolipid complex binding Boxplots are drawn, each depicting the median change in binding intensity from GM1 single and the corresponding GM1 complex. Shaded boxes represent interquartile range, whiskers represent the remaining upper and lower 25% of the data, while outliers are represented by circles with diagonal crosses through the centre. Outliers were not excluded from any analyses. Boxplots where the majority of the data falls below the zero line are considered to be complex inhibited, while those which lie above the zero line are considered to be complex-enhanced.
5.3.4 GM1:GalC association with disease
Binding to GM1:GalC lipid combination was found in 100% of MMN sera,
regardless of reactivity to GM1. ANOVA of the significance of the difference
between MMN (all sera) and healthy controls reveals that the combination
GM1:GalC is the most significantly different in the MMN group compared with the
control group, with a p-value of 6.38x10⁻¹⁷ was GM1:GalC. As can be seen in
figure 5.5, this epitope had the highest fold change from the healthy control
group, and was more sensitive than even GM1 single epitope (since it was
present in all MMN sera regardless of GM1 positivity).

83
Figure 5.5. Glycolipid moieties associated with MMN disease vs healthy controls
Scatterplot where individual dots depict the statistical data for the epitope (single or paired glycolipids) comparing the binding intensity of MMN sera to healthy control sera for that epitope. Dots are plotted at x values representing the inverse size of the p-value, where the negative value of x is the number in scientific notation of power-of-ten, thus a larger x-value means a smaller decimal of p-value, thus stronger significance. The fold change value (y-axis) is calculated by the binding intensity in the MMN sera divided by the binding intensity in the healthy control sera.
Examining the GM1:GalC complex further, there was clear complex
enhancement with GalC in the GM1 positive sera. The mean intensity of the
complex was significantly higher by 8797 IU (95% confidence interval 2538 –
15056), than if the intensity of each single spot was added together (GM1:GalC
complex vs. GM1 single + GalC single, paired t-test, p=0.008). In the GM1
negative group this complex enhancement is greater, at 10734 (95% CI 2595 –
18873). The above can be seen illustrated in figure 5.6.

84
Figure 5.6. GM1:GalC complex enhancement. Bar charts display microarray data of the mean value of binding intensity for the epitope shown, plus the 95% confidence interval for the mean (error bars). ‘GM1 + GalC’ was calculated by adding the value of GM1 single to the value of GalC single in each individual, whereas ‘GM1:GalC complex’ is the real value obtained on microarray testing of that glycolipid pair. Panel A displays this data for the GM1 negative population (n = 7) whereas panel B displays the data for the GM1 positive population (n = 25). Paired t-tests were used to derive p-values for the difference between the expected binding intensity from the addition of the two singles, and the observed binding intensity.
5.3.5 Immunohistochemistry of PC12 cells
Immunohistochemistry was performed as a qualitative experiment to test the
antibody and serum binding to the cell membrane. First the cells were incubated
with fluorescence-labelled cholera toxin B subunit, to demonstrate GM1 epitope
presence on the cells. This showed that GM1 was present in both the untreated
and treated PC12 cells.
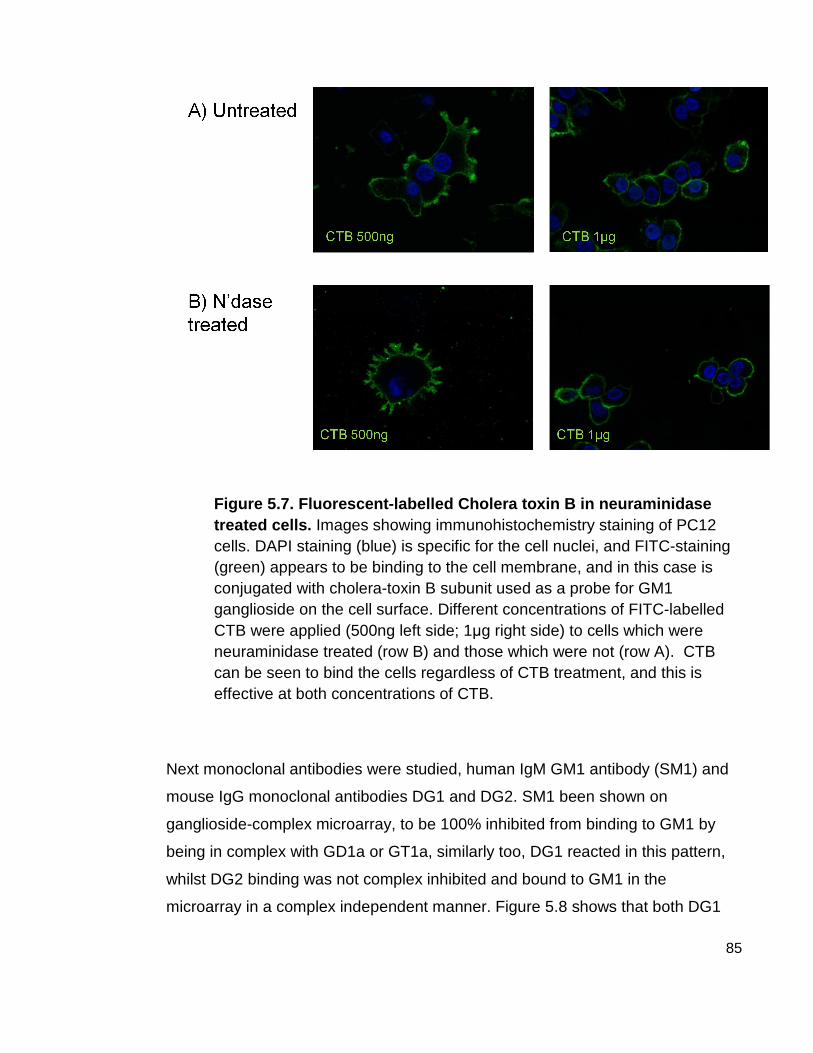
85
Figure 5.7. Fluorescent-labelled Cholera toxin B in neuraminidase treated cells. Images showing immunohistochemistry staining of PC12 cells. DAPI staining (blue) is specific for the cell nuclei, and FITC-staining (green) appears to be binding to the cell membrane, and in this case is conjugated with cholera-toxin B subunit used as a probe for GM1 ganglioside on the cell surface. Different concentrations of FITC-labelled CTB were applied (500ng left side; 1µg right side) to cells which were neuraminidase treated (row B) and those which were not (row A). CTB can be seen to bind the cells regardless of CTB treatment, and this is effective at both concentrations of CTB.
Next monoclonal antibodies were studied, human IgM GM1 antibody (SM1) and
mouse IgG monoclonal antibodies DG1 and DG2. SM1 been shown on
ganglioside-complex microarray, to be 100% inhibited from binding to GM1 by
being in complex with GD1a or GT1a, similarly too, DG1 reacted in this pattern,
whilst DG2 binding was not complex inhibited and bound to GM1 in the
microarray in a complex independent manner. Figure 5.8 shows that both DG1

86
and SM1 did not bind untreated cells, however did bind to the cell surface
following removal of sialic acid residues by neuraminidase treatment, and this
binding was blockable by incubating treated cells with unlabelled cholera toxin B.
It is shown, by the binding of labelleled CTB and DG2 antibody to untreated
PC12 cells, that GM1 is present, and potentially bindable, on the cell surface
before neuraminidase treatment. As can be seen in figure 5.8, binding of DG2
was also blockable by unlabelled CTB.

87
Figure 5.8. Binding of anti-GM1 monoclonal antibodi es to PC12 cells treated with neuraminidase. Immunohistochemistry images with nuclei stained blue (DAPI) and green fluorescent staining (FITC) corresponds to binding of the monoclonal antibody depicted in columns (left to right DG1, DG2 and SM1). In row A the cells are untreated and have had no incubation with cholera toxin, simply incubated with monoclonal antibody then with secondary FITC labelled antibody. Row B shows cells which have been treated with neuraminidase prior to incubation with mAbs and labelled secondary antibody. Row C shows cells which have been treated with neuraminidase then incubated with unlabelled cholera toxin B prior to being incubated with the monoclonal and labelled secondary antibody.
Using unpurified human serum from MMN patients, binding to PC12 cells was
investigated, and similarly found that sera only bound to cells which had been
neuraminidase treated, however binding did not seem to be ‘blockable’ by CTB.
Serum from patients with MMN who were IgM GM1 antibody negative were also
studied, and this revealed no binding to either treated or untreated cells.

88
Figure 5.9. Binding of MMN sera to PC12 cells treat ed with neuraminidase . As before, PC12 cells are stained with DAPI (blue) nuclear staining, and FITC-labelled (green) secondary antibody binds to the primary antibody (MMN sera). ‘MMN 10’ and ‘MMN 24’ (first two columns) are sera from patients who are known to be IgM-anti-GM1 positive on ELISA and microarray. ‘MMN neg serum’ (final column) is serum from a patient known to be IgM-anti-GM1 negative. As before, cells in the second and third rows have been treated with neuraminidase, and only the cells in the final row have been pre-incubated with unlabelled cholera toxin B subunit.

89
5.3.6 FACS analysis
Fluorescence activated cell sorting was employed as a quantitative measure of
the above experiments. Essentially, the same experiments as shown in the
immunohistochemistry above were repeated using FACS methodology. Using
the monoclonal antibodies, antibody binding to the cells was able to be quantified
in terms of the fluorescence of a cell population. Mean fluorescence intensities
(mean fluorescence unit, MFU) were calculated from cell populations of 10,000
(~8000 after gating), and divided by the background fluorescence intensity to
provide a proportion of background fluorescence. For DG1 and SM1, there was
no binding above background levels of fluorescence therefore can be expressed
as 0 MFU. Both DG1 and SM1 were demonstrated to bind to neuraminidase
treated PC12 cells, with mean fluorescence rising to 890 MFU (± SD 142) and
991 MFU (± SD 159), which is between 14 and 18.5 times the background
fluorescence or the binding to untreated cells. Antibody binding to treated cells
was completely blocked by pre-incubation with cholera toxin B-subunit, with
mean fluorescence in this cell population (minus background fluorescence) of 0
MFU, for both DG1 and SM1.
DG2 showed a different pattern, and was able to bind to untreated cells with
intensity up to 20 times higher than background, with mean fluorescence intensity
of 1298 MFU (± SD 207). The binding of DG2 to neuraminidase-treated PC12
cells was over double the binding to untreated cells (3068 FU ± SD 398 vs. 1298
MFU untreated), which was fully blockable by cholera toxin to fluorescence
intensity roughly equal to that of the untreated cell population (1023 MFU ± SD
163) . For this monoclonal, the effect of cholera toxin on untreated cells was
investigated, and this blocked just over 50% of the binding of DG2 to untreated
cells (580 MFU ± SD 85).

90
Figure 5.10. FACS analysis of neuraminidase-treated PC12 cells Histograms overlaid on the same graphs are drawn for each monoclonal antibody tested on Flow cytometry. The x-axis is the mean fluorescence intensity, which is a direct measure of the antibody binding to the cell (and thus to GM1 ganglioside on the cell surface). The y-axis displays the number of cells which were counted in the corresponding fluorescence range, standardised across all three cell groups overlayed on the same graph, as the percentage of the maximum number of cells counted across all three groups. In all three panels, the green line is the histogram for fluorescence intensity of untreated cells, the red line is that of neuraminidase treated cells, and the blue line is the histogram of neuraminidase treated and cholera toxin pre-incubated cells. Where a line shift to the left we can say that binding in that population was lower, whereas line shifted to the right represents higher binding.
Following this initial experiment, the next step was to investigate the binding of
MMN sera to these cell populations (neuraminidase treated PC12 cells), with the
aim to characterise whether the binding of the anti-GM1 antibody in MMN sera
could be enhanced by neuraminidase treatment. Sera from 16 patients, which
were known from microarray and ELISA to be IgM GM1 antibody positive, were
tested. SM1 was used as a standard during each run of the experiment to ensure
there was concordance between the cell populations and the efficacy of
neuraminidase treatment. Thus the MFI value for SM1 binding to neuraminidase-
treated PC12 cells was used as the ‘maximum binding intensity’ for each run.
91
Differences between cell cultures were corrected for by expressing the
fluorescence as a percentage of this maximum binding intensity for each run. The
mean maximum binding intensity across all runs was 1052 IU, 95% confidence
interval 690 – 1413 IU.
Overall, the binding intensity (as % of maximum) increased from 13% to 26%, a
significant increase of 12.7% (95% confidence interval 1.8 to 23.7, p = 0.02).
There was a mean fold change for treated vs untreated cells of 2.0 (95%
confidence interval 1.3, 2.8), thus there was on average a doubling of binding
intensity when treated with neuraminidase.

92
Figure 5.11. The effect on neuraminidase treatment of MMN sera binding to PC12 cells . Binding intensity is expressed as percentage of the maximum binding intensity for that run of experiments, which was SM1 binding to neuraminidase treated cells. Panel A and B show the mean percentage binding intensity for the 3 cell groups overall, and the 95% confidence intervals of the mean, in anti-GM1 positive (Panel A) and anti-GM1 negative patients (Panel B). In panel A, significance testing by paired t-test, showed significant difference between untreated cells and treated or untreated cells and treated plus CTB pre-incubated. In panel B significance testing revealed no significant differences between cell groups. Panel C shows the binding intensity of 16 anti-GM1 positive MMN sera with lines showing the trend between cell groups for each individual serum tested, where ‘treated’ means neuraminidase treatment and ‘CTB’ means cells were incubated with cholera toxin prior to addition of the serum.
Incubation of cholera toxin B following treatment with neuraminidase but prior to
incubation with patient sera did not show the full blocking effect that was

93
demonstrated with the monoclonal antibodies, as can be seen in figure 5.11
panel A, the binding intensity remained as high as the treated cells without
cholera toxin. Significance testing between the two groups, treated and treated
plus CTB incubated, unsurprisingly revealed no difference between groups of
CTB incubation or no incubation. (p = 0.69, paired t-test).
By looking at the individual trend for each patient sera (figure 5.11 panel C) we
can see that there was one in particular (subject ID MMN 10) which behaved
similarly to DG2 and SM1, in that binding increased with neuraminidase
treatment (from 14% untreated to 98% treated). It was partially blocked by
subsequent cholera toxin binding (42%). This gives a mean fold change for this
individual of 6.9 (± SD 3.9).
We divided the mean fluorescence intensity (MFU) of the CTB incubated cells, by
the MFI of the non-CTB cells, giving a ratio, where a value of less than 1 meant
that CTB blocked some of the binding of the sera to the neuraminidase treated
cells. This data was not normally distributed, and Wilcoxon signed rank test was
used to calculate the estimated median ratio to be 1.06, with a 95% confidence
interval 0.8 to 1.6. 5 sera had a ratio of less than 0.8 and therefore we can say
were partially blocked, whilst 3 sera had ratio above 1.6, displaying further
increase of sera binding with incubation of CTB.
A control group of MMN sera known to be negative for IgM anti-GM1 antibody
(figure 5.11 panel B) showed low degree of binding to untreated cells, which did
not increase with neuraminidase treatment (p = 0.7, paired t-test).
5.3.7 Correlation between solid-phase and fluid phase membrane binding
characteristics
Correlation studies were performed using data from the glycolipid complexes
analysis, to search for any relationship between the increase in binding with
neuraminidase treatment (measured fold change mean fluorescence in treated
cells over the mean fluorescence of untreated cells) and the percentage inhibition
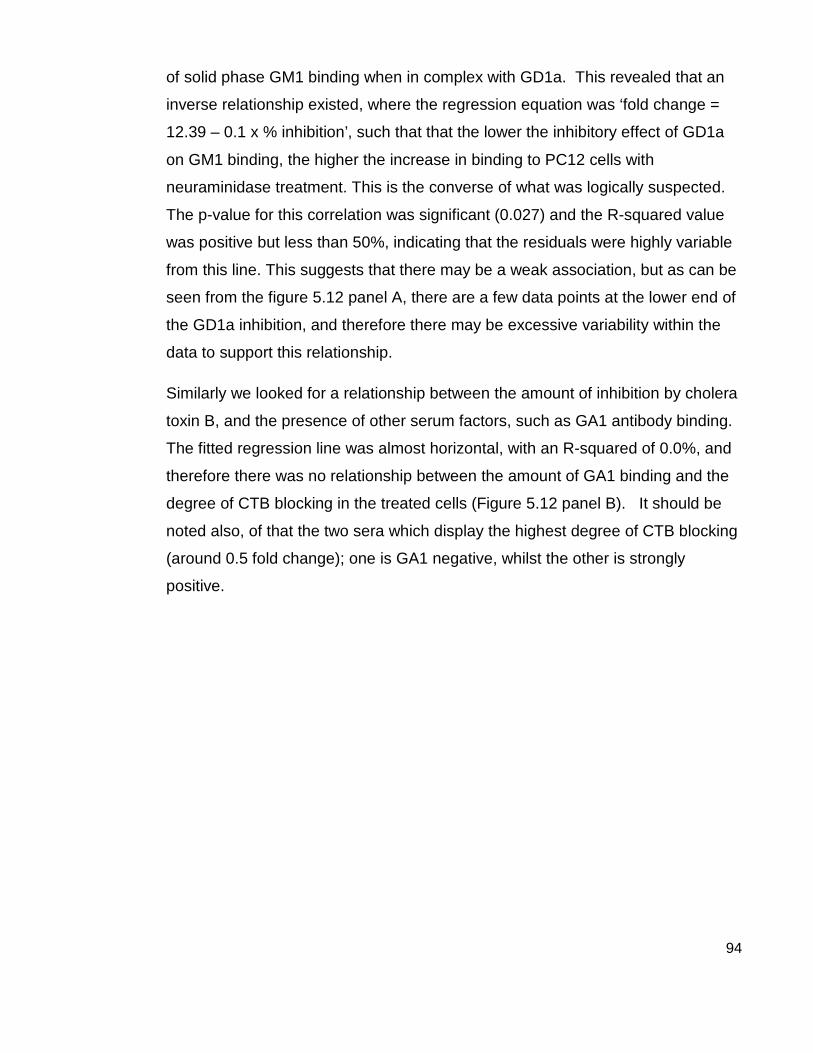
94
of solid phase GM1 binding when in complex with GD1a. This revealed that an
inverse relationship existed, where the regression equation was ‘fold change =
12.39 – 0.1 x % inhibition’, such that that the lower the inhibitory effect of GD1a
on GM1 binding, the higher the increase in binding to PC12 cells with
neuraminidase treatment. This is the converse of what was logically suspected.
The p-value for this correlation was significant (0.027) and the R-squared value
was positive but less than 50%, indicating that the residuals were highly variable
from this line. This suggests that there may be a weak association, but as can be
seen from the figure 5.12 panel A, there are a few data points at the lower end of
the GD1a inhibition, and therefore there may be excessive variability within the
data to support this relationship.
Similarly we looked for a relationship between the amount of inhibition by cholera
toxin B, and the presence of other serum factors, such as GA1 antibody binding.
The fitted regression line was almost horizontal, with an R-squared of 0.0%, and
therefore there was no relationship between the amount of GA1 binding and the
degree of CTB blocking in the treated cells (Figure 5.12 panel B). It should be
noted also, of that the two sera which display the highest degree of CTB blocking
(around 0.5 fold change); one is GA1 negative, whilst the other is strongly
positive.
95
Figure 5.12. Relationship between PC12 binding and combinatorial microarray binding. Scatterplots are drawn with individual data point representing values for individual patient serum from 16 anti-GM1-positive MMN patient sera. Panel A plots the neuraminidase-increased binding effect (expressed as fold change treated over untreated cells) against the percentage of inhibition seen on the microarray lipid complex of GM1:GD1a compared to GM1 alone. It was theorised that the greater the inhibitory effect of GD1a on binding to GM1, the greater the increase in binding with neuraminidase. However, as displayed by the best fit line panel A, there is a pattern towards the converse relationship although this relationship may be weak. Panel B displays the degree of inhibition of serum binding to cells by pre-incubation with cholera toxin B, which was expressed as fold change CTB over no CTB groups (both neuraminidase treated). This showed a horizontal line fit with no correlation between these two variables.
96
5.4 Discussion
Three different approaches to the detection of antibody-ligand interaction in MMN
sera were used in this study.
First, it was demonstrated that novel solid-phase antibody detection assay, PVDF
microarray, correlated well with the standard method of antibody detection,
ELISA, which is used widespread in clinical diagnostic labs for anti-glycolipid
antibody testing. The major advantage of using the PVDF glycolipid microarray,
or ‘microarray’, is that using smaller amounts of all materials, larger cohorts of
samples can be screened against expanded panels of ligands, allowing more
opportunities to screen for antibody interaction with pairs of glycolipids. The
microarray array method may have been more sensitive for detection of antibody
binding to GM1 single lipid which was not already detected by ELISA, however it
depends on the value employed for upper limit of normal, and this may have to
be decided by screening a larger cohort of healthy controls as had been done for
the GM1 ELISA. Using the microarray, antibody binding to a novel epitope was
found to be the most specific for MMN, composed of GM1 ganglioside paired with
galactocerebroside (GalC), a major glycosphingolipid of the myelin sheath in both
central and peripheral nervous system (Lisak et al.,1980). From our cohort of 33
MMN sera tested, all sera were reactive against the GM1:GalC complex,
including those that were not reactive to either GM1 single or GalC single. This
finding has great impact upon the understanding to the immunopathogenesis of
MMN, as patients who were previously considered to be ‘antibody negative’
despite having no discerning clinical features from the antibody positive group,
are now known as also having serological factors which react against glycolipids.
Thus a more unifying theory of antibody-driven pathogenesis may be plausible in
this neuropathy.
In addition, in all MMN sera in this cohort it was demonstrated that GalC pairing
increases the intensity of antibody binding to GM1, thus we have another
example of enhancement of glycolipid pairing in a neurological clinical disease
group. It is known that GM1 is present mostly on the axonal surface and GalC on

97
the myelin. It could be assumed that GM1:GalC pairing may occur at the
paranodal loops, where the myelin and the axon juxtaposed. Given that
conduction block in MMN is thought to occur due to disruption at the nodes of
Ranvier, it is an attractive idea that GM1:GalC antibodies bind to the paranodal
loops, fix complement and form MAC pores, leading to conduction block.
Findings from the microarray reveal that the anti-GM1 antibody in MMN is
inhibited by GD1a and GT1b, gangliosides with terminal sialic acid groups, which
have been proposed to ‘mask’ the GM1 within lipid rafts in the cell membrane,
thus shielding it from antibody binding.
It has previously been demonstrated, using mouse and human monoclonal
antibodies that there are (at least two identified so far) different types anti-GM1
antibodies, separated by their ability to bind GM1 in the locale of GD1a, and that
the monoclonal antibody from an MMN patient was of the GD1a-inhibited type,
such that it could only bind GM1 when GD1a had been removed by sialidase
treatment (Greenshields et al.,2009). Results from the microarray clearly show
that this also holds true for a cohort of MMN sera, that all the anti-GM1 antibodies
in MMN are complex inhibited by local GD1a in solid phase immunoassays. This
seemingly is a unifying feature of MMN, and a further clue towards the
pathogenesis of this condition.
Furthering the biological relevance of these findings, MMN sera was applied to
live cell cultures of PC12 cells known to contain mono-, di- and poly-
sialogangliosides. Cholera toxin avidly bound to GM1 on the cells regardless of
sialidase treatment, thus native GM1 was present in abundance enough that anti-
GM1 recognising factors could bind to untreated cells. Further to that, we
repeated the experiments using mouse mAbs DG1 and DG2, and human
monoclonal SM1 from MMN patient to confirm the presence of the two different
types of anti-GM1 antibodies.
Using sera from MMN patients, we showed that anti-GM1 antibody negative sera
did not bind to PC12 cells, regardless of sialidase treatment. However, almost all
anti-GM1 positive sera displayed the same binding properties as DG1 and SM1:

98
binding did not occur on untreated cells, but with removal of terminal sialic acid
residues, converting GD1a and GT1b to de novo GM1, IgM in the patient sera
bound to the cell membranes. This leads on from the findings that GD1a and
GT1b were inhibitory on the microarray analysis, and allows us to see that this is
relevant in a biological membrane.
DG2 was shown to bind to treated cells up to 45 times the background level, its
binding would be to both native and de novo GM1 since this antibody is shown
not to be GD1a inhibited. DG1 (and SM1) on the other hand, bound up to around
20 times the background level, which is roughly the difference between DG2
binding to treated and untreated cells, and thus these antibodies may be binding
to the de novo GM1. However we would expect the full binding potential of the
GD1a inhibited antibodies to be equal to DG2, since they should also be able to
bind native GM1 with the removal of neighbouring sialic acid residues. This was
addressed by Greenshields et al, who first blocked the native GM1 with
unlabelled cholera toxin, then treated with neuraminidase, and demonstrated that
this reduced the binding potential of DG1, showing that DG1 also binds to native
GM1, which has been exposed by sialidase treatment {Greenshields, 2009 47
/id}. It may be that DG1 and SM1 are unable to bind to the de novo GM1, and
only bind to the unmasked native GM1, however if this was so, then the pre-
blocked then treated cells would have no binding sites available for DG1, yet
DG1 does bind in this condition. We must conclude that DG1 and SM1 can bind
to both native and de novo GM1, but do not bind all the potentially available GM1
lipids in either group. There may be other factors which are inhibitory to the
binding of these antibodies which remain to be discovered, and further expansion
of the combinatorial arrays to include not just glycolipids, but other cell membrane
components such as phospholipids, cholesterols and glycoproteins, may further
elucidate the subtle interactions of neighbouring epitopes on the binding of
antibodies to glycolipids.
A shortcoming of the results presented here was that cholera toxin B did not
effectively block the ability of MMN sera to bind to treated PC12 cells, although
CTB at this concentration demonstrated full blocking activity of the monoclonal
99
SM1, under identical experimental conditions. This implies that there is another
factor in the MMN serum that binds to PC12 cells, but only when they have been
sialidase treated. We know that sialidase treatment converts GD1a and GT1b to
not only GM1 but also to GA1, and that the anti-GM1 antibody has cross
reactivity (via the terminal Gal-GalNAc epitope) with GA1 and GD1b. A potential
explanation for the lack of CTB blocking could be that sialidase treatment
unblocks GA1 and MMN patient sera binds to both de novo GM1, exposed GM1,
and exposed GA1. Since there is no reason to suspect that cholera toxin would
bind to GA1, then this could explain the high mean fluorescence despite CTB
pre-incubation. However there are shortcomings of this theory, firstly that we
would then expect CTB to cause a reduction but not complete blocking of MMN
sera binding, and this was only demonstrated in roughly one-third of patient sera.
Secondly, there was no relationship between GA1 binding intensity on the
microarray and the inhibitory potential of CTB. Thirdly, the same phenomenon
should perhaps be expected to occur with the MMN mAb, since this in theory,
should bind the terminal Gal-GalNAc epitope of GA1, however the mAb binding
to treated cells was fully blocked by CTB. Further work in this series of
experiment could use TLC to separate the lipid components of neuraminidase
treated cells and determine, using ganglioside standards, the factor to which
MMN serum is binding. However, what may be highlighted by this experiment is
the inefficient nature of working with unpurified human serum, and that further
work to develop monoclonal cell lines should be continued, to further discover the
characteristics of MMN antibody binding.
Regarding the discovery of the anti-glycolipid-complex antibody (anti GM1:GalC)
as specific for MMN, the next logical step would be to validate this finding in a
larger cohort of MMN patients. If this revealed that this epitope was highly
sensitive and specific for MMN, then new diagnostic tests should be developed
for accessible testing of this antibody in potential cases of MMN. This would aid
the diagnostic yield, and reduce the number of cases of MMN with delayed
diagnosis and delayed treatment due to diagnostic uncertainty. ELISA could
easily be used for this purpose, with mixing of the gangliosides prior to coating of
100
the wells, and correlation studies between ELISA glycolipid complex binding and
microarray binding should be carried out to test whether this test can potentially
be used. This may herald a more sensitive and specific diagnostic tool for MMN,
and opens up the potential of screening other autoimmune conditions for complex
antibodies, both within the nervous system and beyond.
101
6 Conclusion of Thesis
This project, in its entirety, has made multiple advances in the field of
autoimmune neuropathy. Firstly, it has been the first human trial of complement
inhibition in an immune-mediated neurological disease, and should herald the
beginning of others. It has demonstrated that eculizumab can be given in patients
with MMN and certainly did not worsen their condition, nor interfere with the
beneficial effect of IVIg in this condition. There was however, an increase in side
effects, especially headache. Many of the side effects relate the drug being a
biological agent. Some of the side effects could potentially be avoided with the
development of non-biological complement inhibitors, as some of the
experimental compounds, which demonstrated inhibition of nerve disruption in
animal models, may soon be developed for use in humans. The risk of
meningococcal septicaemia would remain even with these non-biological
compounds however, and therefore therapeutic complement inhibition will never
be without significant risks. However no patients in this trial had bacterial
infection. Overall, the safety profile was felt to be acceptable, and certainly all
patients tolerated the drug.
In this study, it has been shown that concurrent administration of high dose IVIg
caused a decrease in the monoclonal antibody concentration, which provides the
first human evidence of this effect. Despite this, eculizumab retained its
pharmacological activity, and therefore can be given concurrently with IVIg
without reduced effect. Within the limitation of the open-label study design, there
were some indicators of a possible benefit of complement inhibition, which were
superadded to the IVIg benefit. This sheds some light on the pathogenesis of the
condition, as although there perhaps some response the complement inhibition,
the necessity for the other immunomodulatory effects of IVIg remained. It is
suspected that this has much to do with the chronic nature of this neuropathy,
and it is most likely that complement inhibition may be more efficacious in the
prevention of the initial inflammatory injury, as has been demonstrated widely in
the animal models. This leads to future studies of intervention, in which
complement inhibitors could be aimed at patients with new or recent diagnoses of

102
MMN. It is suspected that complement inhibition could prevent progression of
disease. A longer treatment period is necessary, as the small changes in
neurophysiology could increase with time, even in chronic lesions, with removal
of complement injury which may allow remyelination and axonal repair, a process
which is likely to take longer than 14 weeks. However the difficulty with running
trials in immune-mediated neuropathies, given the rarity of cases and difficulties
with finding sensitive outcome measures, may hinder trials. In the acute immune-
mediated neuropathy setting, complement inhibition is predicted to be more
efficacious, and evidence presented here should support this.
In addition to the clinical trial, the experimental laboratory work presented here
elucidates further the nature of the antibody-basis to this disease. Firstly, it has
been the first study to identify an immunological target in patients who have been
demonstrated so far to be antibody negative. Validation studies in larger cohorts
of MMN patients are required, and if this epitope is widely associated with MMN,
then this could potentially open up the field of immunodiagnostics in the testing
towards antigen-pairs or antigen-complexes. These theories could be
extrapolated to many other autoimmune conditions, and contribute to the
understanding of pathogenesis, diagnostics and therapeutics in many body
systems. Further advances are being made within this research group, to
miniaturise the immunoassays further, allowing screening of large libraries of lipid
complexes, which in time could be used to analyse the combinative effects of the
various components of cell membranes, in particular looking at the lipid rafts, and
their interplay with serological factors in disease.
103
Appendix 1
Patient Information Sheet (written by Professor H Willison)
Version 1, 25/11/08
Patient Information Sheet
SAFETY AND TOLERABILITY OF ECULIZUMAB IN THE TREATM ENT OF MULTIFOCAL MOTOR NEUROPATHY: A SINGLE CENTRE OPE N
LABEL STUDY
We would like to invite you to take part in a research study. Before you decide
you need to understand why the research is being done and what it would involve
for you. Please take time to read the following information carefully. Talk to others
about the study if you wish. Ask us if there is anything that is not clear or if you
would like more information.
Part 1 This part provides details on the purpose of this research study
1. Who is conducting the research?
The research is being carried out by Professor Hugh Willison from the
Department of Neurology.
2. What is the purpose of the study?
The main purpose is to see how safe and how well tolerated the anti-
inflammatory drug called eculizumab is, when used for treatment of patients with
multifocal motor neuropathy (MMN). Eculizumab has never been used to treat
MMN before. Eculizumab is currently available in the UK for use in patients for a
different condition and has been used to treat approximately 1000 patients
worldwide with a range of different autoimmune diseases. The secondary
purpose of this study is to gather information on the clinical effectiveness of

104
eculizumab in patients with MMN, and to see whether being treated with
eculizumab reduces your requirement for intravenous immunoglobulin (IVIg).
3. Why have I been invited?
You have been invited to take part in this study as you have MMN and are
already receiving treatment with IVIg or have responded to IVIg treatment in the
past.
4. Do I have to take part?
No, you do not. It is up to you to decide. Taking part in this study is entirely
voluntary. We will describe the study and go through this information sheet,
which we will then give to you. You will be asked to sign a consent form to show
you have understood our explanation and have agreed to take part. You are free
to withdraw from the study at any time, without giving reason. This will not affect
the standard of care you receive or your future treatment.
5. What does taking part involve?
Vaccination
In order to protect you against infection with meningococcus you will be required
to be vaccinated against Neisseria meningitides at least 2 weeks before you
begin the study. Eculizumab works by blocking the action of proteins called
complement. In the body, the complement system acts to cause inflammation
and helps the body fight infection. Neisseria meningitides, is a bacteria which
causes meningitis and can be contracted in patients whose complement system
is not working fully. A very small number (less than 1%) of patients receiving
eculizumab have developed meningitis. We will provide the vaccine for you in our
clinic before you start treatment with eculizumab. The vaccine is given as a
single injection.
You will be given a study card which you should carry with you at all times whilst
you are receiving treatment with eculizumab and for 3 months after your last
treatment. You should show this card to any doctor or other health care
105
professional eg. nurse, pharmacist, or dentist that is involved in your treatment.
The card also lists the signs and symptoms that you should be alert for. They
are:
o Headache with nausea and/or vomiting
o Headache and fever
o Headache with a stiff neck or back
o Fever of 103°F / 39.4°C or higher
o Fever and a rash
o Confusion
o Severe muscle aches combined with flu-like symptoms
o Sensitivity to light
If you experience any of these symptoms then you should contact the study
doctor immediately or if you cannot reach the doctor, you must go to the nearest
Accident and Emergency department and show them the study card.
Women of childbearing potential
If you are a woman of childbearing potential then you will be required to have a
blood test before you start on eculizumab treatment to confirm that you are not
pregnant. You must use adequate contraception during treatment with
eculizumab and for 5 months after treatment. This is because it can take several
months for the body to fully eliminate eculizumab and the effect of eculizumab on
unborn children is not yet known. The study doctor will discuss contraception
with you.
Treatment and monitoring
There will be two treatment phases to your involvement, a run in period up to 8
weeks long, then a 14 week treatment period, followed by an 8 week run out
period. In all these periods you will receive regular assessments and
examinations.
Run –In Period

106
You will be given your normal IVIg treatment and asked to complete self-
evaluation questionnaires in the first instance. This will last for a maximum of 8
weeks and will be followed by a physical examination and some muscle strength
tests. You will be asked to complete the self evaluation test once a week. Once
the study doctor has reviewed the information provided, you will begin treatment
with the study drug.
Treatment Period
Following the run-in period, you will be given the study drug Eculizumab by a drip
through a tube directly into one of your veins before your IVIg treatment. This
treatment will last for 14 weeks in total. You will receive eculizumab infusion as
follows:
Week 0, 1, 2 and 3 – one infusion containing 600mg of eculizumab
Week 4 – one infusion containing 900mg of eculizumab
Weeks 6, 8, 10 and 12 – one infusion containing 900mg of eculizumab
Each infusion of eculizumab will take approximately 25 to 45 minutes, but may
take longer. Following each infusion you will be monitored for one hour.
During the treatment period you will continue to receive IVIg if it is required. If
your motor function does not get worse then you will not be given IVIg during this
period.
Prior to, and just after the first infusion periods, a small volume (10mls; equivalent
to 2 teaspoonfuls) of your blood will be checked for levels of the drug. This will
require 2 additional blood tests per infusion.
Run-out Period
Following the treatment period there will be a period of 8 weeks where you will
not receive Eculizumab and in which time your IVIg treatment will be put back to
its usual interval.

107
6. Expenses and Payments
You will not be paid for your involvement in this study. You will be given money
to cover the costs of your travel.
7. What will I have to do?
The trial protocol follows a carefully structured series of visits to hospital in which
the trial drug and any IVIg you require is administered, and in which a series of
observational measurements are made on your muscle performance. These will
be described to you in detail by the trial doctors. You will need to attend hospital
on a weekly basis for the first 4 weeks to receive your infusion of Eculizumab and
on a fortnightly basis for the next 10 weeks. During some of your visits,
measurements of your strength and performance on particular tasks will be
made. At some visits, blood tests may also be taken. At home, on a weekly basis,
you will complete a short self evaluation questionnaire - this will let us know
whether you require further treatment with IVIg. If you are currently involved in
another research study please discuss this with one of the study doctors whose
names are at the back of this sheet.
You should bring along all medicines that you are currently taking including any
that you have obtained without a prescription eg. herbal or over-the-counter
medicines to each study visit.
8. What drug is being tested?
Eculizumab is being tested. It is one of a new class of drugs referred to as
monoclonal antibodies. It has not previously been used to treat patients with
MMN but has been used to treat other diseases. Many similar drugs are now
used to treat a wide range of diseases, including inflammation and cancer. The
drug will be administered by intravenous drip.
9. What are the possible advantages and disadvantag es of taking part in
this study?
Advantages

108
It is hoped that treatment with Eculizumab will have a positive effect on the
symptoms of MMN and that in this study it will reduce the need for IVIg infusions.
The results of this study will be made public and provide information to both the
medical and patient communities. Eventually, if this and future studies
demonstrate that Eculizumab has a positive effect, it may be possible to
introduce it into routine clinical practice for MMN, although this may take time and
is not guaranteed.
Disadvantages
There is a very small risk of contracting bacterial infections, including a form of
meningitis. Steps have been taken to reduce this risk further by vaccination, and
to ensure that any infection is treated promptly. After receiving the meningitis
vaccine, the most commonly reported adverse effects were pain and redness at
the injection site. Most of these were reported within 48 hours following
vaccination. Other common side effects are headache, drowsiness, nausea,
vomiting and diarrhoea and loss of appetite, but these should not last long.
It is also possible that you may develop other side effects from treatment with
Eculizumab which may be mild, moderate or severe. Possible side effects
include allergic reactions, which may require additional treatment. Other known
side effects, which were very common (occurring in about 1 in 10 patients) that
have been reported include headache, dizziness, runny nose or sore throat,
nausea, diarrhoea, back pain, pain in joints, fever and bruising. Other common
side effects include itchy skin, rash, cold sores, infections, and abdominal pain.
If you notice any side effects that you are concerned about you should discuss
these with the study doctor.
There is also an inconvenience factor as you will have to complete forms and
examinations, and attend hospital more frequently than usual during the course
of the study.
10. What happens to me when the study is finished?

109
When the study is finished you will go back to receiving your normal IVIg
treatment. It is normal practice for drug companies to conduct larger trials before
making long term recommendations on introduction of a new treatment. However,
if both the investigators and the patient agree that Eculizumab appears to have
been beneficial, over and above the benefit achieved by routine IVIg therapy
alone, it may be possible for you to continue on the treatment on a named patient
basis until further studies on larger groups of patients have been conducted, and
agreement to fund the treatment has been received from the NHS. This
arrangement will be discussed with you at the end of the study.
11. What happens to the information?
Your identity and personal information will be completely confidential and known
only to the research team and NHS Greater Glasgow and Clyde staff or UK
regulatory authority staff who monitor research studies. The information obtained
will remain confidential and stored within a locked filing cabinet. The data are
held in accordance with the Data Protection Act, which means that we keep it
safely and cannot reveal it to other people, without your permission.
This completes part of the patient information shee t. If the information in
part 1 has interested you please continue to read t he additional information
in Part 2 before making a decision to participate.
Part 2, This part provides more information.
12. What if relevant new information becomes availa ble?
If we receive new information about the study drug during your participation the
study doctor will tell you about this and discuss whether or not you should
continue. If you want to continue we may ask you to sign an updated consent
form. If the study is stopped for other reasons we will tell you and arrange your
continuing care.
13.What will happen to me if I don’t want to contin ue with the study?
110
You are allowed to withdraw from this study at any time. Your data will be used
up to the time you withdraw unless you inform the study doctors that it shouldn’t
be used. We will destroy all identifiable samples if you wish.
14. Involvement of your family doctor.
We will notify your GP of your involvement in this study.
15. What will happen to the samples I give?
Your samples will be analysed in the laboratory for routine clinical tests, for
antibody and complement activity and for anti-nerve antibodies. There will be no
genetic testing of your samples.
16. Will my taking part in this study be kept confi dential?
All information relating to your participation in this study will remain confidential
and be stored in keeping with the Data Protection Act 1998.
17. What will happen to the results of this study?
The study results will be published in a clinical neurology journal and
disseminated at neurology meetings.
18. Who is organising and funding this research?
NHS Greater Glasgow and Clyde and The University of Glasgow are sponsoring
this study. Alexion Pharmaceuticals is providing funding to support this research.
21. Who has reviewed the study?
This study has been reviewed by the West Glasgow (1) Research Ethics
Committee.
22. If you have any further questions?

111
We will give you a copy of the information sheet and signed consent form to
keep. If you would like more information about the study and wish to speak to
someone not closely linked to the study, please contact Dr O’Leary, Consultant
Neurologist at the Southern General Hospital (Tel: 01412011100).
23. Contacts:
Professor H Willison, Dr J Overell, Dr A Fitzpatrick are contactable at the
Southern General Hospital on 0141 201 2474, 201 2461 and 201 2096.
24. What if there is a problem?
In the event that something does go wrong, you are harmed during the research
and this is due to someone’s negligence then you may have grounds for a legal
action for compensation against Glasgow University & Greater Glasgow and
Clyde NHS. You may have to pay your legal costs.
25. If you have a complaint about any aspect of the study?
If you are unhappy about any aspect of the study and wish to make a complaint,
please contact the study doctors in the first instance through the Southern
General Hospital (Telephone: 0141 201 2474, 201 2461 and 201 2096). Any
complaint about the way you have been dealt with during the study will be
addressed. The normal NHS complaint mechanisms are also available to you
and details for this can be obtained from the hospital.
Thank-you for your time and co-operation
112
Appendix 2. Clinical Trial publication

113

114
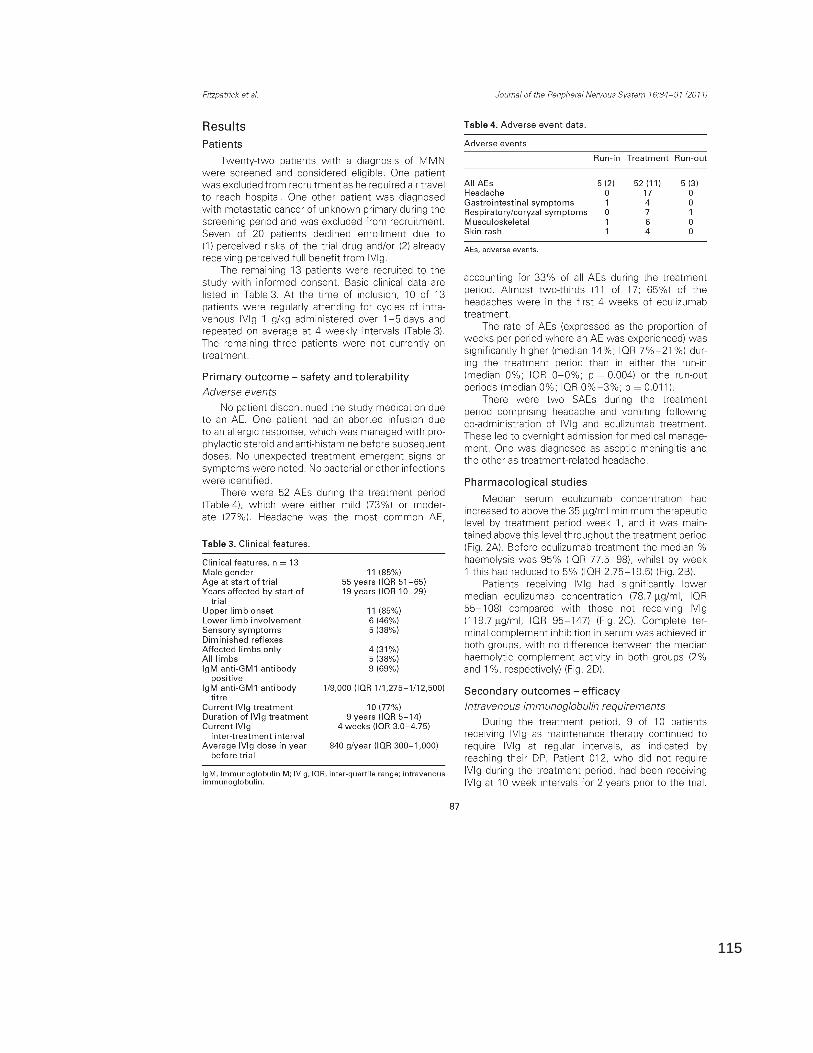
115
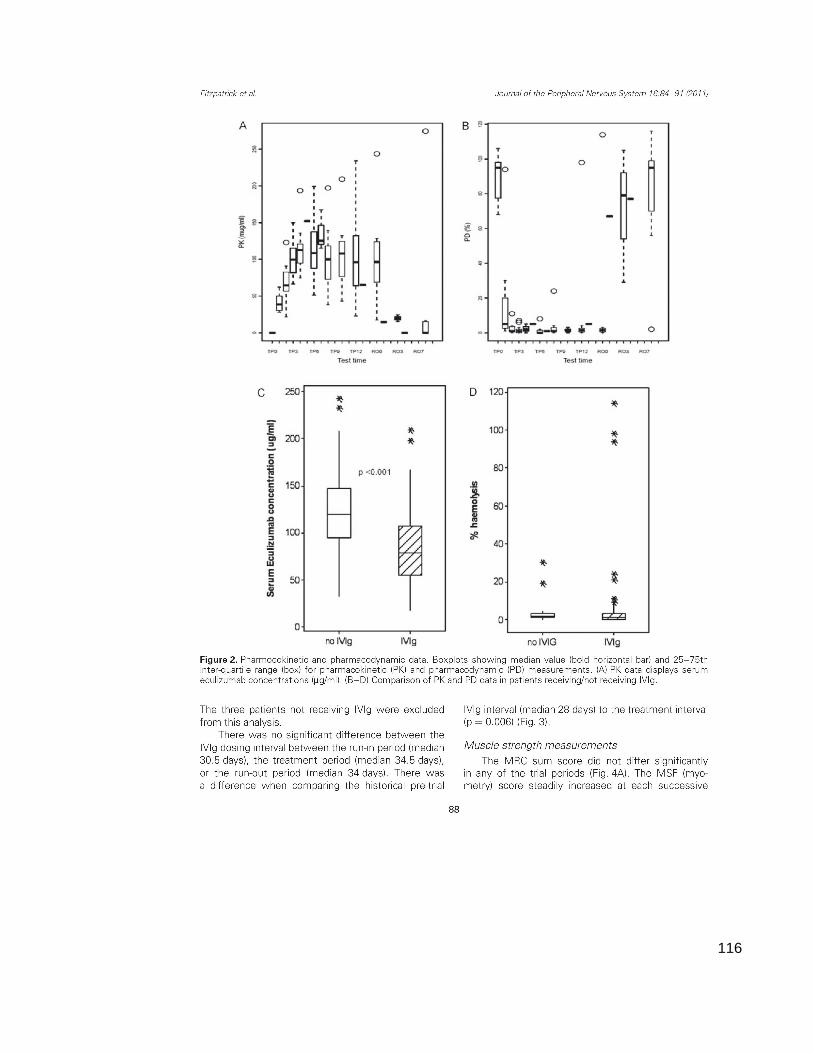
116
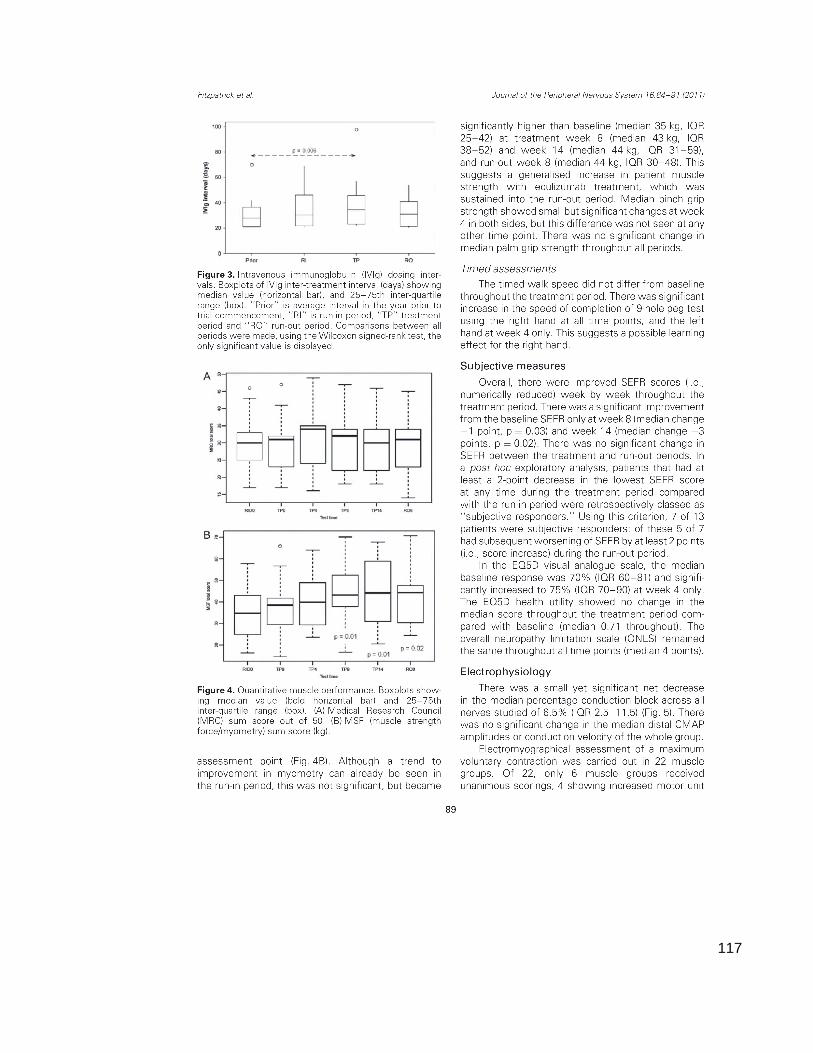
117

118
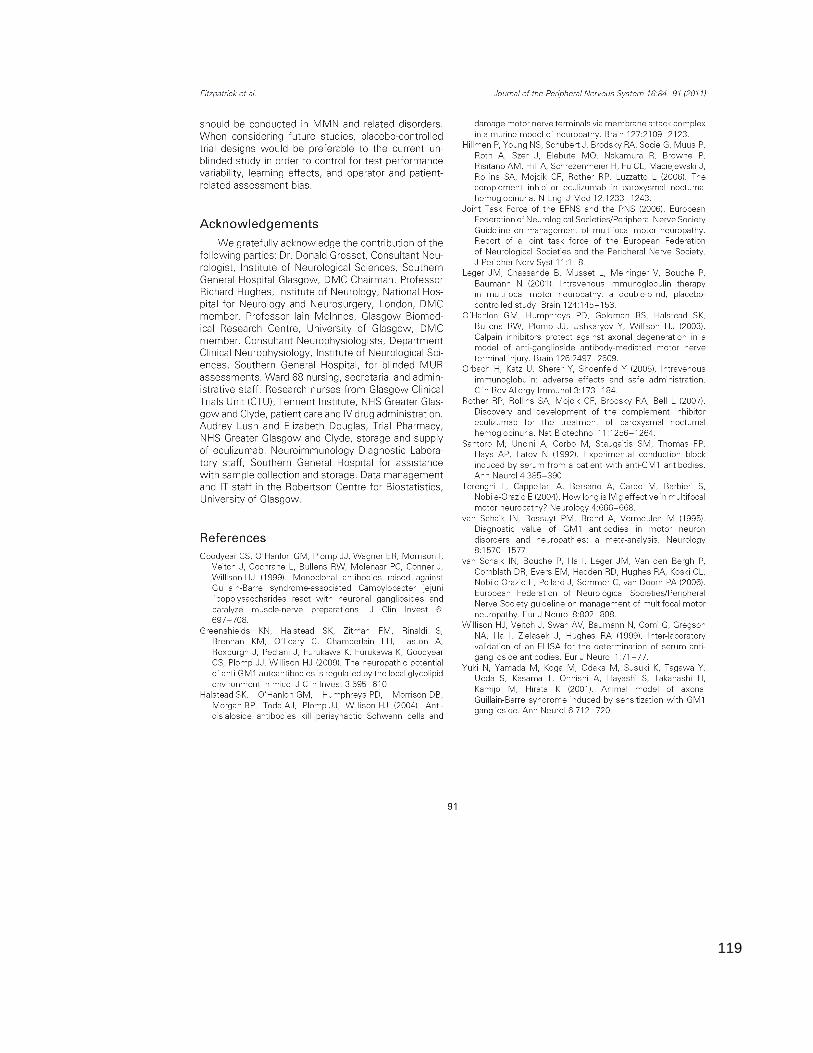
119

120

121
Reference List
Ackerman GA, Wolken, KW, Gelder, FB (1980). Surface distribution of monosialoganglioside GM1 on human blood cells and the effect of exogenous GM1 and neuraminidase on cholera toxin surface labeling. A quantitative immunocytochemical study. J Histochem Cytochem 10:1100-1112.
Alexion Pharmaceuticals U (2010). Soliris EPAR: Summary of Product Characteristics. European Medicines Agency
Alshekhlee A, Hussain, Z, Sultan, B, Katirji, B (2008). Guillain-Barre syndrome: incidence and mortality rates in US hospitals. Neurology 18:1608-1613.
Azulay JP, Blin, O, Pouget, J, Boucraut, J, Bille-Turc, F, Carles, G, Serratrice, G (1994). Intravenous immunoglobulin treatment in patients with motor neuron syndromes associated with anti-GM1 antibodies: a double-blind, placebo-controlled study. Neurology 3 Pt 1:429-432.
Bennett V and Cuatrecasas, P (1975). Mechanism of activation of adenylate cyclase by Vibrio cholerae enterotoxin. J Membr Biol 1:29-52.
Biessels GJ, Franssen, H, Van den Berg, LH, Gibson, A, Kappelle, LJ, Venables, GS, Wokke, JH (1997). Multifocal motor neuropathy. J Neurol 3:143-152.
Bleeker WK, Teeling, JL, Hack, CE (2001). Accelerated autoantibody clearance by intravenous immunoglobulin therapy: studies in experimental models to determine the magnitude and time course of the effect. Blood 10:3136-3142.
Bouche P, Moulonguet, A, Younes-Chennoufi, AB, Adams, D, Baumann, N, Meininger, V, Leger, JM, Said, G (1995). Multifocal motor neuropathy with conduction block: a study of 24 patients. J Neurol Neurosurg Psychiatry 1:38-44.
BRAMBELL FW, HEMMINGS, WA, MORRIS, IG (1964). A THEORETICAL MODEL OF GAMMA-GLOBULIN CATABOLISM. Nature1352-1354.
Brodsky RA, Young, NS, Antonioli, E, Risitano, AM, Schrezenmeier, H, Schubert, J, Gaya, A, Coyle, L, de, CC, Fu, CL, Maciejewski, JP, Bessler, M, Kroon, HA, Rother, RP, Hillmen, P (2008). Multicenter phase 3 study of the complement inhibitor eculizumab for the treatment of patients with paroxysmal nocturnal hemoglobinuria. Blood 4:1840-1847.
CARUBELLI R, TRUCCO, RE, CAPUTTO, R (1962). Neuraminidase activity in mammalian organs. Biochim Biophys Acta196-197.

122
Chatelet V, Lobbedez, T, Fremeaux-Bacchi, V, Ficheux, M, Ryckelynck, JP, Hurault de, LB (2010). Eculizumab: safety and efficacy after 17 months of treatment in a renal transplant patient with recurrent atypical hemolytic-uremic syndrome: case report. Transplant Proc 10:4353-4355.
Chiba A, Kusunoki, S, Obata, H, Machinami, R, Kanazawa, I (1997). Ganglioside composition of the human cranial nerves, with special reference to pathophysiology of Miller Fisher syndrome. Brain Res 1-2:32-36.
Corbo M, Quattrini, A, Lugaresi, A, Santoro, M, Latov, N, Hays, AP (1992). Patterns of reactivity of human anti-GM1 antibodies with spinal cord and motor neurons. Ann Neurol 4:487-493.
Cumar FA, Maggio, B, CAPUTTO, R (1982). Ganglioside-cholera toxin interactions: a binding and lipid monolayer study. Mol Cell Biochem 3:155-160.
Dalakas MC (2005). Intravenous immunoglobulin in patients with anti-GAD antibody-associated neurological diseases and patients with inflammatory myopathies: effects on clinicopathological features and immunoregulatory genes. Clin Rev Allergy Immunol 3:255-269.
Dalakas MC (2010). Pathogenesis and Treatment of Anti-MAG Neuropathy. Curr Treat Options Neurol 2:71-83.
Dmytrijuk A, Robie-Suh, K, Cohen, MH, Rieves, D, Weiss, K, Pazdur, R (2008). FDA report: eculizumab (Soliris) for the treatment of patients with paroxysmal nocturnal hemoglobinuria. Oncologist 9:993-1000.
Donaghy M, Mills, KR, Boniface, SJ, Simmons, J, Wright, I, Gregson, N, Jacobs, J (1994). Pure motor demyelinating neuropathy: deterioration after steroid treatment and improvement with intravenous immunoglobulin. J Neurol Neurosurg Psychiatry 7:778-783.
Figueroa JE and Densen, P (1991). Infectious diseases associated with complement deficiencies. Clin Microbiol Rev 3:359-395.
FISHER M (1956). An unusual variant of acute idiopathic polyneuritis (syndrome of ophthalmoplegia, ataxia and areflexia). N Engl J Med 2:57-65.
Fujita A, Cheng, J, Hirakawa, M, Furukawa, K, Kusunoki, S, Fujimoto, T (2007). Gangliosides GM1 and GM3 in the living cell membrane form clusters susceptible to cholesterol depletion and chilling. Mol Biol Cell 6:2112-2122.
Fujita K, Lazarovici, P, Guroff, G (1989). Regulation of the differentiation of PC12 pheochromocytoma cells. Environ Health Perspect127-142.
Fulwyler MJ (1980). Flow cytometry and cell sorting. Blood Cells 2:173-184.

123
Ghetie V, Hubbard, JG, Kim, JK, Tsen, MF, Lee, Y, Ward, ES (1996). Abnormally short serum half-lives of IgG in beta 2-microglobulin-deficient mice. Eur J Immunol 3:690-696.
Ghosh A, Busby, M, Kennett, R, Mills, K, Donaghy, M (2005). A practical definition of conduction block in IvIg responsive multifocal motor neuropathy. J Neurol Neurosurg Psychiatry 9:1264-1268.
Godschalk PC, Kuijf, ML, Li, J, St, MF, Ang, CW, Jacobs, BC, Karwaski, MF, Brochu, D, Moterassed, A, Endtz, HP, van, BA, Gilbert, M (2007). Structural characterization of Campylobacter jejuni lipooligosaccharide outer cores associated with Guillain-Barre and Miller Fisher syndromes. Infect Immun 3:1245-1254.
Gonzalez-Duarte A, Robinson-Papp, J, Simpson, DM (2008). Diagnosis and management of HIV-associated neuropathy. Neurol Clin 3:821-32, x.
Goodfellow JA, Bowes, T, Sheikh, K, Odaka, M, Halstead, SK, Humphreys, PD, Wagner, ER, Yuki, N, Furukawa, K, Furukawa, K, Plomp, JJ, Willison, HJ (2005). Overexpression of GD1a ganglioside sensitizes motor nerve terminals to anti-GD1a antibody-mediated injury in a model of acute motor axonal neuropathy. J Neurosci 7:1620-1628.
Goodyear CS, O'Hanlon, GM, Plomp, JJ, Wagner, ER, Morrison, I, Veitch, J, Cochrane, L, Bullens, RW, Molenaar, PC, Conner, J, Willison, HJ (1999). Monoclonal antibodies raised against Guillain-Barre syndrome-associated Campylobacter jejuni lipopolysaccharides react with neuronal gangliosides and paralyze muscle-nerve preparations. J Clin Invest 6:697-708.
Greene LA and Tischler, AS (1976). Establishment of a noradrenergic clonal line of rat adrenal pheochromocytoma cells which respond to nerve growth factor. Proc Natl Acad Sci U S A 7:2424-2428.
Greenshields KN, Halstead, SK, Zitman, FM, Rinaldi, S, Brennan, KM, O'Leary, C, Chamberlain, LH, Easton, A, Roxburgh, J, Pediani, J, Furukawa, K, Furukawa, K, Goodyear, CS, Plomp, JJ, Willison, HJ (2009). The neuropathic potential of anti-GM1 autoantibodies is regulated by the local glycolipid environment in mice. J Clin Invest 3:595-610.
Hadden RD, Cornblath, DR, Hughes, RA, Zielasek, J, Hartung, HP, Toyka, KV, Swan, AV (1998). Electrophysiological classification of Guillain-Barre syndrome: clinical associations and outcome. Plasma Exchange/Sandoglobulin Guillain-Barre Syndrome Trial Group. Ann Neurol 5:780-788.
Halstead SK, Humphreys, PD, Goodfellow, JA, Wagner, ER, Smith, RA, Willison, HJ (2005a). Complement inhibition abrogates nerve terminal injury in Miller Fisher syndrome. Ann Neurol 2:203-210.
124
Halstead SK, Humphreys, PD, Zitman, FM, Hamer, J, Plomp, JJ, Willison, HJ (2008a). C5 inhibitor rEV576 protects against neural injury in an in vitro mouse model of Miller Fisher syndrome. J Peripher Nerv Syst 3:228-235.
Halstead SK, Morrison, I, O'Hanlon, GM, Humphreys, PD, Goodfellow, JA, Plomp, JJ, Willison, HJ (2005b). Anti-disialosyl antibodies mediate selective neuronal or Schwann cell injury at mouse neuromuscular junctions. Glia 3:177-189.
Halstead SK, O'Hanlon, GM, Humphreys, PD, Morrison, DB, Morgan, BP, Todd, AJ, Plomp, JJ, Willison, HJ (2004). Anti-disialoside antibodies kill perisynaptic Schwann cells and damage motor nerve terminals via membrane attack complex in a murine model of neuropathy. Brain Pt 9:2109-2123.
Halstead SK, Zitman, FM, Humphreys, PD, Greenshields, K, Verschuuren, JJ, Jacobs, BC, Rother, RP, Plomp, JJ, Willison, HJ (2008b). Eculizumab prevents anti-ganglioside antibody-mediated neuropathy in a murine model. Brain Pt 5:1197-1208.
Harrison MJ (1976). Pressure palsy of the ulnar nerve with prolonged conduction block. J Neurol Neurosurg Psychiatry 1:96-99.
Hillmen P, Young, NS, Schubert, J, Brodsky, RA, Socie, G, Muus, P, Roth, A, Szer, J, Elebute, MO, Nakamura, R, Browne, P, Risitano, AM, Hill, A, Schrezenmeier, H, Fu, CL, Maciejewski, J, Rollins, SA, Mojcik, CF, Rother, RP, Luzzatto, L (2006). The complement inhibitor eculizumab in paroxysmal nocturnal hemoglobinuria. N Engl J Med 12:1233-1243.
Ho TW, Willison, HJ, Nachamkin, I, Li, CY, Veitch, J, Ung, H, Wang, GR, Liu, RC, Cornblath, DR, Asbury, AK, Griffin, JW, McKhann, GM (1999). Anti-GD1a antibody is associated with axonal but not demyelinating forms of Guillain-Barre syndrome. Ann Neurol 2:168-173.
Hughes RA (2002). Peripheral neuropathy. BMJ 7335:466-469.
Iijima M, Yamamoto, M, Hirayama, M, Tanaka, F, Katsuno, M, Mori, K, Koike, H, Hattori, N, Arimura, K, Nakagawa, M, Yoshikawa, H, Hayasaka, K, Onodera, O, Baba, M, Yasuda, H, Saito, T, Nakazato, M, Nakashima, K, Kira, J, Kaji, R, Oka, N, Sobue, G (2005). Clinical and electrophysiologic correlates of IVIg responsiveness in CIDP. Neurology 8:1471-1475.
Illa I (2005). IVIg in myasthenia gravis, Lambert Eaton myasthenic syndrome and inflammatory myopathies: current status. J NeurolI14-I18.
Irie S, Saito, T, Nakamura, K, Kanazawa, N, Ogino, M, Nukazawa, T, Ito, H, Tamai, Y, Kowa, H (1996). Association of anti-GM2 antibodies in Guillain-

125
Barre syndrome with acute cytomegalovirus infection. J Neuroimmunol 1-2:19-26.
Jacob S and Rajabally, YA (2009). Current proposed mechanisms of action of intravenous immunoglobulins in inflammatory neuropathies. Curr Neuropharmacol 4:337-342.
Jacobs BC, Rothbarth, PH, van der Meche, FG, Herbrink, P, Schmitz, PI, de Klerk, MA, van Doorn, PA (1998). The spectrum of antecedent infections in Guillain-Barre syndrome: a case-control study. Neurology 4:1110-1115.
Jaeschke R, Singer, J, Guyatt, GH (1989). Measurement of health status. Ascertaining the minimal clinically important difference. Control Clin Trials 4:407-415.
Janeway CA TPWMeal (2001). The complement system and innate immunity. Immunobiology: The Immune System in Health and Disease 5th edition
Jefferson T, Jones, M, Doshi, P, Del, MC, Dooley, L, Foxlee, R (2010). Neuraminidase inhibitors for preventing and treating influenza in healthy adults: a Cochrane review. Health Technol Assess 46:355-458.
Kaida K, Morita, D, Kanzaki, M, Kamakura, K, Motoyoshi, K, Hirakawa, M, Kusunoki, S (2004). Ganglioside complexes as new target antigens in Guillain-Barre syndrome. Ann Neurol 4:567-571.
Kaida K, Morita, D, Kanzaki, M, Kamakura, K, Motoyoshi, K, Hirakawa, M, Kusunoki, S (2007). Anti-ganglioside complex antibodies associated with severe disability in GBS. J Neuroimmunol 1-2:212-218.
Kiernan JA (1996). Vascular permeability in the peripheral autonomic and somatic nervous systems: controversial aspects and comparisons with the blood-brain barrier. Microsc Res Tech 2:122-136.
Krarup C, Stewart, JD, Sumner, AJ, Pestronk, A, Lipton, SA (1990). A syndrome of asymmetric limb weakness with motor conduction block. Neurology 1:118-127.
Kuwabara S, Yuki, N, Koga, M, Hattori, T, Matsuura, D, Miyake, M, Noda, M (1998). IgG anti-GM1 antibody is associated with reversible conduction failure and axonal degeneration in Guillain-Barre syndrome. Ann Neurol 2:202-208.
Kuziemko GM, Stroh, M, Stevens, RC (1996). Cholera toxin binding affinity and specificity for gangliosides determined by surface plasmon resonance. Biochemistry 20:6375-6384.
Latov N, Gross, RB, Kastelman, J, Flanagan, T, Lamme, S, Alkaitis, DA, Olarte, MR, Sherman, WH, Chess, L, Penn, AS (1981). Complement-fixing
126
antiperipheral nerve myelin antibodies in patients with inflammatory polyneuritis and with polyneuropathy and paraproteinemia. Neurology 12:1530-1534.
Lauer S, Goldstein, B, Nolan, RL, Nolan, JP (2002). Analysis of cholera toxin-ganglioside interactions by flow cytometry. Biochemistry 6:1742-1751.
Leger JM, Chassande, B, Musset, L, Meininger, V, Bouche, P, Baumann, N (2001). Intravenous immunoglobulin therapy in multifocal motor neuropathy: a double-blind, placebo-controlled study. Brain Pt 1:145-153.
Lehmann HC, Hoffmann, FR, Fusshoeller, A, Meyer zu, HG, Hetzel, R, Hartung, HP, Schroeter, M, Kieseier, BC (2008). The clinical value of therapeutic plasma exchange in multifocal motor neuropathy. J Neurol Sci 1-2:34-39.
Lisak RP, Saida, T, Kennedy, PG, Saida, K, Silberberg, DH, Leibowitz, S (1980). EAE, EAN and galactocerebroside sera bind to oligodendrocytes and Schwann cells. J Neurol Sci 2:287-296.
Llewelyn JG (1995). Diabetic neuropathy. Curr Opin Neurol 5:364-366.
Lobo ED, Hansen, RJ, Balthasar, JP (2004). Antibody pharmacokinetics and pharmacodynamics. J Pharm Sci 11:2645-2668.
Lough JC, Rafferty, D, McColl, JH, Bell, F, Willison, HJ (2000). The application of control limits analysis to the myometric assessment of motor performance in neuropathy patients. Eur J Neurol 4:427-434.
Lutz HU, Stammler, P, Jelezarova, E, Nater, M, Spath, PJ (1996). High doses of immunoglobulin G attenuate immune aggregate-mediated complement activation by enhancing physiologic cleavage of C3b in C3bn-IgG complexes. Blood 1:184-193.
Magistris MR and Roth, G (1985). Long-lasting conduction block in hereditary neuropathy with liability to pressure palsies. Neurology 11:1639-1641.
Martyn CN and Hughes, RA (1997). Epidemiology of peripheral neuropathy. J Neurol Neurosurg Psychiatry 4:310-318.
McGonigal R, Rowan, EG, Greenshields, KN, Halstead, SK, Humphreys, PD, Rother, RP, Furukawa, K, Willison, HJ (2010). Anti-GD1a antibodies activate complement and calpain to injure distal motor nodes of Ranvier in mice. Brain
Merkies IS and Lauria, G (2006). 131st ENMC international workshop: selection of outcome measures for peripheral neuropathy clinical trials 10-12 December 2004, Naarden, The Netherlands. Neuromuscul Disord 2:149-156.
127
Mizoguchi K (1998). Anti-GQ1b IgG antibody activities related to the severity of Miller Fisher syndrome. Neurol Res 7:617-624.
Morgan BP, Sewry, CA, Siddle, K, Luzio, JP, Campbell, AK (1984). Immunolocalization of complement component C9 on necrotic and non-necrotic muscle fibres in myositis using monoclonal antibodies: a primary role of complement in autoimmune cell damage. Immunology 1:181-188.
Muller-Eberhard HJ (1985). Transmembrane channel-formation by five complement proteins. Biochem Soc Symp235-246.
Nobile-Orazio E, Cappellari, A, Meucci, N, Carpo, M, Terenghi, F, Bersano, A, Priori, A, Barbieri, S, Scarlato, G (2002). Multifocal motor neuropathy: clinical and immunological features and response to IVIg in relation to the presence and degree of motor conduction block. J Neurol Neurosurg Psychiatry 6:761-766.
Nobile-Orazio E, Cappellari, A, Priori, A (2005). Multifocal motor neuropathy: current concepts and controversies. Muscle Nerve 6:663-680.
O'Hanlon GM, Humphreys, PD, Goldman, RS, Halstead, SK, Bullens, RW, Plomp, JJ, Ushkaryov, Y, Willison, HJ (2003). Calpain inhibitors protect against axonal degeneration in a model of anti-ganglioside antibody-mediated motor nerve terminal injury. Brain Pt 11:2497-2509.
Olney RK, Lewis, RA, Putnam, TD, Campellone, JV, Jr. (2003). Consensus criteria for the diagnosis of multifocal motor neuropathy. Muscle Nerve 1:117-121.
Parker C, Omine, M, Richards, S, Nishimura, J, Bessler, M, Ware, R, Hillmen, P, Luzzatto, L, Young, N, Kinoshita, T, Rosse, W, Socie, G (2005). Diagnosis and management of paroxysmal nocturnal hemoglobinuria. Blood 12:3699-3709.
Parry GJ and Clarke, S (1988). Multifocal acquired demyelinating neuropathy masquerading as motor neuron disease. Muscle Nerve 2:103-107.
Pestronk A, Cornblath, DR, Ilyas, AA, Baba, H, Quarles, RH, Griffin, JW, Alderson, K, Adams, RN (1988). A treatable multifocal motor neuropathy with antibodies to GM1 ganglioside. Ann Neurol 1:73-78.
Piepers S, Jansen, MD, Cats, EA, van Sorge, NM, Van den Berg, LH, Van der Pol, WL (2010). IVIg inhibits classical pathway activity and anti-GM1 IgM-mediated complement deposition in MMN. J Neuroimmunol 1-2:256-262.
Poncelet AN (1998). An algorithm for the evaluation of peripheral neuropathy. Am Fam Physician 4:755-764.

128
Ramaglia V and Baas, F (2009). Innate immunity in the nervous system. Prog Brain Res95-123.
Rees JH, Thompson, RD, Smeeton, NC, Hughes, RA (1998). Epidemiological study of Guillain-Barre syndrome in south east England. J Neurol Neurosurg Psychiatry 1:74-77.
Rinaldi S, Brennan, KM, Willison, HJ (2010). Heteromeric glycolipid complexes as modulators of autoantibody and lectin binding. Prog Lipid Res 1:87-95.
Roth G, Rohr, J, Magistris, MR, Ochsner, F (1986). Motor neuropathy with proximal multifocal persistent conduction block, fasciculations and myokymia. Evolution to tetraplegia. Eur Neurol 6:416-423.
Rother RP, Rollins, SA, Mojcik, CF, Brodsky, RA, Bell, L (2007). Discovery and development of the complement inhibitor eculizumab for the treatment of paroxysmal nocturnal hemoglobinuria. Nat Biotechnol 11:1256-1264.
Santoro M, Uncini, A, Corbo, M, Staugaitis, SM, Thomas, FP, Hays, AP, Latov, N (1992). Experimental conduction block induced by serum from a patient with anti-GM1 antibodies. Ann Neurol 4:385-390.
Schubert J, Hillmen, P, Roth, A, Young, NS, Elebute, MO, Szer, J, Gianfaldoni, G, Socie, G, Browne, P, Geller, R, Rother, RP, Muus, P (2008). Eculizumab, a terminal complement inhibitor, improves anaemia in patients with paroxysmal nocturnal haemoglobinuria. Br J Haematol 2:263-272.
Scollard DM, Adams, LB, Gillis, TP, Krahenbuhl, JL, Truman, RW, Williams, DL (2006). The continuing challenges of leprosy. Clin Microbiol Rev 2:338-381.
Shin J.Oh (2003a). Anatomical and Physiological Basis for Electromyography study (Chapter). Clinical electromyography: nerve conduction studies4-12.
Shin J.Oh (2003b). Electrodiagnositic Studies in Neuromuscular Disease (Chapter). Clinical electromyography: nerve conduction studies14-25.
Singer SJ and Nicolson, GL (1972). The fluid mosaic model of the structure of cell membranes. Science 23:720-731.
Susuki K, Rasband, MN, Tohyama, K, Koibuchi, K, Okamoto, S, Funakoshi, K, Hirata, K, Baba, H, Yuki, N (2007). Anti-GM1 antibodies cause complement-mediated disruption of sodium channel clusters in peripheral motor nerve fibers. J Neurosci 15:3956-3967.
Tabrizi MA, Tseng, CM, Roskos, LK (2006). Elimination mechanisms of therapeutic monoclonal antibodies. Drug Discov Today 1-2:81-88.

129
Taylor BV, Dyck, PJ, Engelstad, J, Gruener, G, Grant, I, Dyck, PJ (2004). Multifocal motor neuropathy: pathologic alterations at the site of conduction block. J Neuropathol Exp Neurol 2:129-137.
Terenghi F, Cappellari, A, Bersano, A, Carpo, M, Barbieri, S, Nobile-Orazio, E (2004). How long is IVIg effective in multifocal motor neuropathy? Neurology 4:666-668.
Tischler AS and Greene, LA (1978). Morphologic and cytochemical properties of a clonal line of rat adrenal pheochromocytoma cells which respond to nerve growth factor. Lab Invest 2:77-89.
Trojaborg W (1977). Prolonged conduction block with axonal degeneration. An electrophysiological study. J Neurol Neurosurg Psychiatry 1:50-57.
Trojaborg W (1978). Early electrophysiologic changes in conduction block. Muscle Nerve 5:400-403.
Uetz-von AE, Sturzenegger, M, Rieben, R, Rihs, F, Frauenfelder, A, Nydegger, UE (1998). Antiganglioside GM1 antibodies and their complement activating capacity in central and peripheral nervous system disorders and in controls. Eur Neurol 2:103-110.
Umapathi T, Hughes, RA, Nobile-Orazio, E, Leger, JM (2009). Immunosuppressant and immunomodulatory treatments for multifocal motor neuropathy. Cochrane Database Syst Rev 1:CD003217-
Van Asseldonk JT, Van den Berg, LH, Kalmijn, S, Van den Berg-Vos RM, Polman, CH, Wokke, JH, Franssen, H (2006). Axon loss is an important determinant of weakness in multifocal motor neuropathy. J Neurol Neurosurg Psychiatry 6:743-747.
Van den Berg LH, Franssen, H, Wokke, JH (1998). The long-term effect of intravenous immunoglobulin treatment in multifocal motor neuropathy. Brain421-428.
Van den Berg LH, Kerkhoff, H, Oey, PL, Franssen, H, Mollee, I, Vermeulen, M, Jennekens, FG, Wokke, JH (1995). Treatment of multifocal motor neuropathy with high dose intravenous immunoglobulins: a double blind, placebo controlled study. J Neurol Neurosurg Psychiatry 3:248-252.
Van den Berg LH, Lokhorst, H, Wokke, JH (1997). Pulsed high-dose dexamethasone is not effective in patients with multifocal motor neuropathy. Neurology 4:1135-
Van den Berg-Vos RM, Franssen, H, Visser, J, de Visser, M, de Haan, RJ, Wokke, JH, Van den Berg, LH (2002a). Disease severity in multifocal

130
motor neuropathy and its association with the response to immunoglobulin treatment. J Neurol 3:330-336.
Van den Berg-Vos RM, Franssen, H, Wokke, JH, Van den Berg, LH (2002b). Multifocal motor neuropathy: long-term clinical and electrophysiological assessment of intravenous immunoglobulin maintenance treatment. Brain Pt 8:1875-1886.
Van Heyningen WE, Van, HS, King, CA (1976). The nature and action of cholera toxin. Ciba Found Symp 42:73-88.
van Schaik IN, Bouche, P, Illa, I, Leger, JM, Van den, BP, Cornblath, DR, Evers, EM, Hadden, RD, Hughes, RA, Koski, CL, Nobile-Orazio, E, Pollard, J, Sommer, C, van Doorn, PA (2006). European Federation of Neurological Societies/Peripheral Nerve Society guideline on management of multifocal motor neuropathy. Eur J Neurol 8:802-808.
van Schaik IN, Winer, JB, De, HR, Vermeulen, M (2002). Intravenous immunoglobulin for chronic inflammatory demyelinating polyradiculoneuropathy. Cochrane Database Syst Rev 2:CD001797-
Vanguri P and Shin, ML (1988). Hydrolysis of myelin basic protein in human myelin by terminal complement complexes. J Biol Chem 15:7228-7234.
Verschueren A, Azulay, JP, Attarian, S, Boucraut, J, Pellissier, JF, Pouget, J (2005). Lewis-Sumner syndrome and multifocal motor neuropathy. Muscle Nerve 1:88-94.
von RC, Kopitz, J, Schuhmann, V, Cantz, M (2001). Differential functional relevance of a plasma membrane ganglioside sialidase in cholinergic and adrenergic neuroblastoma cell lines. Eur J Biochem 2:326-333.
Vucic S, Black, KR, Chong, PS, Cros, D (2004). Multifocal motor neuropathy: decrease in conduction blocks and reinnervation with long-term IVIg. Neurology 7:1264-1269.
Walport MJ (2001). Complement. First of two parts. N Engl J Med 14:1058-1066.
Walton KM, Sandberg, K, Rogers, TB, Schnaar, RL (1988). Complex ganglioside expression and tetanus toxin binding by PC12 pheochromocytoma cells. J Biol Chem 4:2055-2063.
Wang J, Wu, G, Miyagi, T, Lu, ZH, Ledeen, RW (2009). Sialidase occurs in both membranes of the nuclear envelope and hydrolyzes endogenous GD1a. J Neurochem 2:547-554.
Willison HJ, Paterson, G, Kennedy, PG, Veitch, J (1994). Cloning of human anti-GM1 antibodies from motor neuropathy patients. Ann Neurol 4:471-478.

131
Willison HJ, Veitch, J, Paterson, G, Kennedy, PG (1993). Miller Fisher syndrome is associated with serum antibodies to GQ1b ganglioside. J Neurol Neurosurg Psychiatry 2:204-206.
Willison HJ, Veitch, J, Swan, AV, Baumann, N, Comi, G, Gregson, NA, Illa, I, Zielasek, J, Hughes, RA (1999). Inter-laboratory validation of an ELISA for the determination of serum anti-ganglioside antibodies. Eur J Neurol 1:71-77.
Wu GS and Ledeen, R (1988). Quantification of gangliotetraose gangliosides with cholera toxin. Anal Biochem 2:368-375.
Yu RK, Usuki, S, Ariga, T (2006). Ganglioside molecular mimicry and its pathological roles in Guillain-Barre syndrome and related diseases. Infect Immun 12:6517-6527.
Yu Z and Lennon, VA (1999). Mechanism of intravenous immune globulin therapy in antibody-mediated autoimmune diseases. N Engl J Med 3:227-228.
Yuki N and Kuwabara, S (2007). Axonal Guillain-Barre syndrome: carbohydrate mimicry and pathophysiology. J Peripher Nerv Syst 4:238-249.
Yuki N, Yamada, M, Koga, M, Odaka, M, Susuki, K, Tagawa, Y, Ueda, S, Kasama, T, Ohnishi, A, Hayashi, S, Takahashi, H, Kamijo, M, Hirata, K (2001). Animal model of axonal Guillain-Barre syndrome induced by sensitization with GM1 ganglioside. Ann Neurol 6:712-720.
Zimmerhackl LB, Hofer, J, Cortina, G, Mark, W, Wurzner, R, Jungraithmayr, TC, Khursigara, G, Kliche, KO, Radauer, W (2010). Prophylactic eculizumab after renal transplantation in atypical hemolytic-uremic syndrome. N Engl J Med 18:1746-1748.