Embed Size (px)
Citation preview

Fisheries Centre The University of British Columbia
Working Paper Series
Working Paper #2015 - 79
Reconstruction of total catch by U.S. fisheries in the Atlantic and Gulf of Mexico: 1950-2010
Ashley McCrea-Strub
Year: 2015
Email: [email protected]
This working paper is made available by the Fisheries Centre, University of British Columbia, Vancouver, BC, V6T 1Z4, Canada.

RECONSTRUCTION OF TOTAL CATCH BY U.S. FISHERIES IN THE ATLANTIC AND GULF OF MEXICO: 1950-2010.
Ashley McCrea-Strub
Sea Around Us, Fisheries Centre, University of British Columbia, 2202 Main Mall, Vancouver, BC, V6T 1Z4, Canada
ABSTRACT
This report describes the first attempt to reconstruct the history of total U.S. fisheries catch taken from the Atlantic and Gulf of Mexico (GOM) between 1950 and 2010. The best available data regarding commercial landings and discards, recreational landings and discards, and unreported and illegal fishing by species were consolidated. With the exception of commercial landings, additional information was used to estimate the most likely magnitude of annual catch by species during those years for which data were unavailable. The reconstructed U.S. catch was then compared to the total U.S. catch reported by the United Nations Food and Agriculture Organization (FAO) on behalf of the U.S. in Fishing Statistical Areas 21 and 31. Overall, it was estimated that U.S. marine fisheries operating off the U.S. East Coast and in the GOM caught nearly 200 million t of fish between 1950 and 2010, 61% more than the catch of nearly 124 million t reported for the U.S. by the FAO for FAO Areas 21 and 31 combined. The majority of this catch was comprised of legal commercial landings (66%), of which 80% was landed by industrial fisheries and 20% by artisanal fisheries. The remaining catch was composed of commercial and recreational discards (26%), illegal commercial landings (5%) and recreational landings (3%).Nearly 60% of the catch came from the Atlantic portion of the EEZ and the remaining 40% from the GOM. Within the Atlantic portion of the EEZ, the contribution of the total reconstructed catch was 74% industrial, 22% artisanal and 4% recreational, whereas in the GOM there was less small-scale catch with almost 88% industrial, 10% artisanal and nearly 3% recreational. Discards contributed 23% in the Atlantic, 31% in the GOM and 26% overall. Both EEZ areas were dominated by menhaden (Brevoortia tyrannus in the Atlantic and Brevoortia patronus in the GOM), however, the magnitude of its dominance was greater in the GOM with almost 42% of the catch, compared to 19% in the Atlantic.
INTRODUCTION
As the magnitude of effort directed towards fishing continues to increase on a global scale (Watson et al. 2012), and the condition of a substantial fraction of the world’s fisheries has reached an ‘overexploited’ or even ‘collapsed’ state (Froese et al. 2012), it is increasingly important to generate a more accurate understanding of trends in global fisheries catch. The United States (U.S.) has historically been a dominant player amongst fishing nations (Weber 2002), most recently ranking third behind China and Indonesia (FAO 2014). While the U.S. National Marine Fisheries Service (NMFS) does make a concerted effort to collect records of fisheries catch within the boundaries of its extensive Exclusive Economic Zone (EEZ), this effort has varied by region as well as fishing sector and catch type. Consequently, there have thus far been no attempts to develop a complete, historical perspective of changes in total U.S. catch over time.
Due to the relative ease with which different types of data are collected, emphasis has historically been placed on landed fish rather than discarded fish. Additionally, the commercial sector has received the most attention; official records of landings for federal and state-managed
1

commercial fisheries are relatively complete back to 1950. With a few exceptions, data regarding the magnitude of commercial discards are not available until the late 1980s. Coordinated efforts to collect data regarding annual recreational catch, including landings and discards, did not begin until 1981. Very limited efforts have been dedicated towards estimating other potentially significant sources of fishing mortality, including IUU fishing. While data collection is a priority of federal and state fisheries management agencies, little emphasis is placed on understanding and communicating the collective impact of various fisheries across the U.S. EEZ. Stock assessment publications typically provide a long-term perspective on the total landings, and occasionally, the total catch of a particular species, but this same perspective is not available across multiple species at a regional or national level. Each year, the NMFS produces a publication titled “Fisheries of the United States” in which current fisheries statistics are made available, including commercial landings, recreational landings and recreational discards. Annual statistics are listed in tabular form, and a graph illustrates the trend in the volume of total, national landings over the most recent decade. Absent from this publication is any reference to commercial discards or unreported and illegal catches. This report describes the first attempt to reconstruct the history of total U.S. fisheries catch taken from the Atlantic and Gulf of Mexico (GOM) between 1950 and 2010. The best available data regarding commercial landings and discards, recreational landings and discards, and unreported and illegal fishing by species were consolidated. With the exception of commercial landings, additional information was used to estimate the most likely magnitude of annual catch by species during those years for which data were unavailable. The reconstructed U.S. catch was then compared to the total U.S. catch reported by the United Nations Food and Agriculture Organization (FAO) on behalf of the U.S. in Fishing Statistical Areas 21 and 31. Background The Exclusive Economic Zone of the United States is the largest in the world. It encompasses over 12 million km2 (here we include the territorial seas) and includes a variety of physical features and habitats that support highly productive fisheries. The portions of the U.S. EEZ located in the Atlantic and GOM collectively account for approximately 13% of the total area of the U.S. EEZ. Fishing grounds in the Atlantic, extending from the coral reefs of the Florida Keys to Georges Bank and the Gulf of Maine, are influenced by the warm, northward flowing Gulf Stream Current, the cold, southward flowing Slope Current, as well as outflow from numerous rivers, such as the Potomac River. U.S. waters in the Gulf of Mexico are dominated by freshwater input from the Mississippi River as well as periodic upwelling along the edge of the Loop Current. Both regions are characterized by an extensive continental shelf. Commercial fisheries During the first two decades following WWII, the commercial fishing industry in the U.S. was characterized by a desire to expand and increase catch, driven by increasing competition with foreign fleets and a seemingly limitless supply of fish in what was thought to be inexhaustibly productive waters. Fisheries were managed by individual state governments, which held jurisdiction over resources in territorial waters extending 3 miles offshore, with the exception of the Gulf coasts of Florida and Texas where jurisdiction extended 9 miles. Beyond this narrow band lay the high seas, where fishing was unregulated except for those fisheries under the purview of international commissions (such as ICCAT) and/or international agreements. The
2

primary role of the federal government, led by the Bureau of Commercial Fisheries (BCF), was to promote the growth of the industry. Fisheries biologists employed by the BCF were tasked with discovering new potential resources and fishing grounds, as well as testing new fishing gear, processing equipment, and marketing strategies, and disseminating the results of their research to the commercial fishing industry (Weber 2002). Government subsidized financial assistance programs were aimed at enabling fishers to expand and modernize their fleets. Despite these efforts, U.S. commercial fisheries catches in the Atlantic and GOM remained nearly flat during the 1950s and 1960s. Consumer demand for seafood and improvements in fishing technology lagged far behind the booming beef and poultry industries in the U.S. (Weber 2002). Additionally, fisheries were hampered by ineffective management, conflicting state laws regarding stocks that straddled state boundaries, and a relatively small and technologically unsophisticated fleet (Weber 2002). The regional fisheries commissions, established by Congress for the Atlantic states in 1942, the Pacific states in 1947, and the Gulf states in 1949, were largely unsuccessful in coordinating regulatory measures and were declared a failure by the Stratton Commission in 1960. It was not until 1970 that President Nixon created the National Oceanic and Atmospheric Administration (NOAA), which would oversee the new federal agency, the National Marine Fisheries Service (NMFS). While domestic fisheries catches remained largely stagnant, foreign fishing continued to increase in the waters off U.S. shores, peaking in the early 1970s. U.S. fleets could not compete with the efficiency of enormous factory trawlers operated by countries including the Soviet Union, Germany, Spain, and Japan. Initial efforts to protect domestic fishers from this growing competition included the 1945 Truman Proclamation, which declared the U.S. right to regulate fisheries beyond the territorial sea, and the 1971 Pelly Amendment, which authorized a ban on fish imports from countries that failed to comply with international fisheries conservation programs. In 1966, U.S. fisheries management jurisdiction was expanded to include a ‘contiguous zone’ extending 12 nm offshore. The movement to extend U.S. jurisdiction even farther offshore gained urgency as Soviet trawlers decimated the Georges Bank haddock population despite the existence of the International Commission for the Northwest Atlantic Fisheries (ICNAF). While international negotiations leading to the United Nations Convention on the Law of the Sea (UNCLOS) continued, the U.S. acted unilaterally in 1976, declaring exclusive fishing rights within 200 nm of its shoreline under the Fishery Conservation and Management Act (FCMA). The so-called Fishery Conservation Zone was later proclaimed an Exclusive Economic Zone by President Reagan in 1983. The Magnuson-Stevens Act (MSA) initiated a national program of fisheries management in which eight Regional Fishery Management Councils, (i.e., New England, Mid-Atlantic, South Atlantic, Gulf of Mexico, Western Pacific [including Hawaii], Pacific, and North Pacific [including Alaska]), were responsible for coordinating state, regional, tribal and federal interests and developing fishery management plans. Composed of state officials and representatives from the fishing industry (Okey 2003), the councils were advised by NMFS in the development of fishery management plans according to a set of national standards, including the prevention of overfishing. By 1989, following decades of expansion and intense fishing pressure which culminated in declining yields from many important stocks, NMFS acknowledged the need for overfishing definitions to be included in the fishery management plan for each stock. Since 1996, conservation-oriented amendments to the FCMA, renamed the Magnuson-Stevens Fisheries
3

Conservation and Management Act, have resulted in efforts to protect essential fish habitat, rebuild overfished fisheries, reduce bycatch, and assess and minimize impacts on coastal communities (Hanna et al., 2000). Coordinated, national efforts to collect commercial fisheries data began in 1880 with a census of fishers, vessels, and catch in all marine areas except Alaska (U.S. Commission of Fish and Fisheries, 1884-1887). Following decades of difficulties, by 1950 the statistical division of the BCF employed enough agents in each region to regularly survey and compile landing statistics for all states. However, the reliability and comprehensiveness of fisheries-dependent data were still undermined by intentional and unintentional misreporting and the exclusion of the discarded portion of the catch (Weber 2002). Logbook and observer programs were initiated in an attempt to counteract these weaknesses. In most federal and state-managed commercial fisheries, vessel operators are required to submit detailed logbook reports, which include the catch (i.e., landings and discards) of the target species and other species (NRC 2000). In some states, dealer reports of fish bought and sold are used to corroborate the catch reported in logbooks (NRC 2000). Data are also collected from scientific observer programs functioning primarily in large-scale fisheries and those fisheries with a high probability of encountering protected species (NRC 2000). Observer data are also used to validate landings, bycatch and discards reported in logbooks, as well as to estimate correction factors for bycatch and discards on unobserved trips. Recreational fisheries In the years following World War II, participation in recreational fishing grew as American incomes, leisure time and mobility increased, and as families moved from land-locked areas to coastal cities (Schmied and Burgess 1987). Between 1955 and 1970, the number of saltwater anglers more than doubled from an estimated 4.5 million to nearly 9.5 million (FHWAR 1991). Despite the growing importance of this sector, efforts to collect data regarding recreational catch and effort were slow for decades and were hampered by challenges not present in the commercial sector. There are two components of the recreational fishing community: the not-for hire sector, including anglers who fish from private boats or from shore on either private or public property, and the for-hire sector, including party or head boats, charter boats and guided trips. Head boats (aka party boats) carry many anglers (as many as 100) on fishing trips, charter boats are smaller and typically carry 4-8 anglers, and guides typically accompany one or two anglers in a smaller boat (NRC 2006). This variety makes recreational anglers more difficult to encounter in surveys (NMFS 2011, NRC 2006). Additionally, not all recreational fisheries require a license for participation. Estimation of catch is complicated by the fact that many of the fish caught are released back into the sea, presumably with high survival rates. Finally, the quality of the data collected often depends on the anglers’ recall and willingness to volunteer valid information (NRC 2006). In contrast, all commercial fishers are required to be licensed. Commercial vessels typically land at ports where the catch is weighed, recorded on dockside landing receipts and purchased by dealers. Also, commercial fisheries often require logbook and observer programs to collect information regarding effort and discards. As a result of these factors, the methods by which recreational data are collected in the U.S. has evolved and improved over time. Preliminary efforts to collect recreational data at a national scale only began in the 1950s. The first National Survey of Fishing and Hunting was published by the Bureau of Census in 1955 with the intent of better understanding the economic impact of sport fishing and hunting. Using data
4

collected from households interviewed across broadly defined geographic regions, this report includes demographic statistics regarding the salt-water angling population as well as time and money spent sport fishing. While this first survey gathered useful information regarding sport fishing effort, the catch of these fishers was ignored. The publication of this report has continued every five years since its inception. The “collection and dissemination of statistics…on sport fishing” was mandated by the Fish and Wildlife Act of 1956 (16 U.S.C. 742d). In 1960, the first national estimates of total recreational catch by species, region, and method of fishing were reported in the Salt-Water Angling Survey (Clark 1960), a supplement to the National Survey of Fishing and Hunting in 1960 (Bureau of Sport Fisheries and Wildlife 1960). In the foreword of this publication, L.A. Walford, Director of the NMFS Sandy Hook Marine Laboratory, wrote: “…many accumulating bits and pieces of evidence indicate that the number of noncommercial salt-water fishermen has been increasing by leaps and bounds, and the total of their catches has reached proportions that can no longer be dismissed as inconsequential” (Clark, 1960). Two more Salt-Water Angling Surveys were published in 1965 (Deuel & Clark 1968) and 1970 (Deuel 1973). These first three reports were fraught with inaccuracies and bias due to numerous problems, including small sample size and response bias. The Salt Water Angling Surveys interviewed fishers identified in the National Surveys of Fishing and Hunting. Data obtained from less than 2000 saltwater anglers were used to estimate the total catch of all salt-water anglers nationwide. The interviews were conducted only once during the year, and fishers in each region (i.e., the Northeast, Middle Atlantic, South Atlantic, Gulf of Mexico, South Pacific and North Pacific) were asked to recall the number of fish caught by area (tidal waters, bays and open sea) and principal fishing method. The interviews for the 1965 and 1970 surveys included questions regarding the average weight of fish caught. However, in the 1960 survey, the total numbers of fish caught were converted to weights using conversion factors supplied by various field experts (Clark 1960). For each region, species were aggregated into 20 broadly defined groups. It is unclear whether ‘catch’ data reported in each report represent only landed fish or also includes discarded (live and/or dead) fish. A study of the effects of response bias (i.e., the inability of interviewees to answer correctly due to a long recall period and/or reluctance to admit to small or insignificant catches) concluded that in California, the surveys resulted in an overestimation of catch by 200-300%, overestimation of average fish weight by 200%, and that fishers should not be required to recall fishing trips that occurred more than two months in the past (Wheeland 1973). In acknowledgement of the increasing significance of recreational catch in many fisheries, the collection of recreational fishery data was again federally mandated with the passage of the Magnuson Fishery Conservation and Management Act (MFCMA, 16 USC 1801) in 1976. Equipped with a better understanding of the potential pitfalls of estimating sport catch and effort, the NMFS implemented the Marine Recreational Fisheries Statistics Survey (MRFSS) in 1979 and began two years of preliminary surveys. Estimates of catch and effort for reported species became available in 1981 following the standardization of data collection and estimation methods. Since this time, recreational fishing has been surveyed in all states along the Atlantic and Gulf coasts with the exception of Texas, which is monitored by the Texas Parks and Wildlife Department. Beginning with MRFSS, recreational fisheries data have been primarily collected using two complementary surveys. Telephone surveys of households are conducted every two months to collect information regarding fishing effort, including the number of anglers and fishing trips, and location of fishing. Intercept surveys are conducted at public fishing access points (i.e., boat
5

ramps, piers, beaches, jettys, bridges, marinas, etc.) to gather catch data, including the species-specific catch composition, the number of fish caught, and length and weight measurements of fish brought back to shore. The catch is divided into two categories: harvested catch (i.e., whole fish landed onshore which were identified by interviewers, as well as fish used for bait, discarded dead, or filleted on the boat which were identified by anglers) and catch released alive. Total catch by area is calculated by multiplying estimates of effort and catch-per-unit-effort from the two surveys. Additional surveys have been added to enable greater sampling of aspects not adequately covered by the above surveys, including the catch of large pelagic species and fishing from for-hire charter and party boats. Despite great improvements over the methodology used in the original Salt Water Angling Surveys, the National Research Council was asked to conduct a review of the MRFSS methods due to concerns that the surveys were not precise, robust, or timely enough to confidently use the data for the purposes of fisheries management (NRC 2006). These concerns were leading some anglers to refuse to participate in the surveys and to disagreements in proposed management actions. As a result of this review, sources of bias were identified in the MRFSS methodology due to non-representative sampling of the angler population, erroneous assumptions about the behavior of unobserved anglers, and inconsistency in sampling protocols in different areas. An improved survey methodology, renamed the Marine Recreational Information Program (MRIP), was developed and implemented to correct for this bias and increase the accuracy of catch estimates. Additionally, MRFSS catch estimates back to 2004 have been recalculated. Sampling of the ‘for-hire’ sector has varied since the start of the MRFSS in 1981. For the first five years of the survey, no differentiation was made in the sampling of charter and head boats, and landings were estimated for a single, combined category throughout the east coast and Gulf of Mexico. Beginning in 1986, this methodology continued for states between Maine and Virginia, but between North Carolina and Florida and in the Gulf of Mexico, only charter boats were sampled. Catch and effort data from headboats were collected and reported by the Southeast Region Headboat Program (SRHS). The SRHS began sampling headboats on the east coast in 1972, and by 1986, was collecting data from North Carolina to Texas. This program collects information regarding catch and effort from daily catch records maintained in self-reported logbooks on each headboat. Dockside intercept surveys are conducted to collect data regarding the average size of landed species as well as biological samples (e.g., otoliths, gonads, and stomachs) for life history studies. In 2005, the For-Hire Telephone Survey was implemented by the MRFSS to estimate the catch of charter and headboats between Maine and Georgia (partially overlapping with the SHBS). Subsistence fisheries With the exception of Alaska, there is a paucity of research and data regarding subsistence fishing in the U.S. The only formal definition of this sector is given by the Alaska Department of Fish and Game: “…noncommercial, customary and traditional uses for a variety of purposes, including direct personal or family consumption as food, shelter, fuel, clothing, tools, or transportation, for the making and selling of handicraft articles out of nonedible by-products of fish taken for personal or family consumption, and for the customary trade, barter, or sharing for personal or family consumption” (AS 16.05.940[32]). According to the NRC (2000), “subsistence use [in the U.S.] is small in comparison to recreational and commercial use”, and represents “a minor portion of the catch in most fisheries”.
6

Data regarding marine subsistence and ceremonial fishing are only formally collected for members of Native American tribes fishing in Pacific coastal waters. As all other subsistence fishers are likely to fish from the shore, piers, and other coastal access points, it is assumed that their catch has been sampled by the MRFSS and MRIP intercept surveys, and is therefore considered a component of recreational fishing (NRC 2000). In many cases, it is difficult to distinguish between subsistence and recreational fishing, where fish that are caught for sport are subsequently consumed at home. The only known attempt to quantify the portion of ‘recreational’ anglers fishing for subsistence is an analysis of pier-based subsistence fishing in Los Angeles County, California (Pitchon & Norman 2012). According to this study, 42% of surveyed anglers indicated that the primary goal of their fishing activities was to catch fish for consumption. Due to a complete lack of information regarding subsistence fishing in the Atlantic and GOM, this sector was not included in the catch reconstruction for these regions, and subsistence catch is assumed to be part of the estimated recreational catch. Discards The NMFS defines ‘bycatch’ as ‘the discarded catch of any living marine resource plus unobserved mortality due to a direct encounter with fishing gear’ (NMFS 2011). For the purposes of this study, ‘bycatch’ as defined by NMFS will be referred to as ‘discards.’ Four types of discards are recognized by the NMFS: (1) discards of protected species; (2) regulatory discards (i.e., catch that is required to be discarded because it violates some aspect of fishing regulations, including quota, time/area, size, bag limit or trip limit restrictions); (3) economic discards (i.e., catch of the target species which is discarded due to an undesirable size, sex, quality or other economic reason); and (4) catch-and-release discards in recreational fisheries (NMFS 1998, NMFS 2004). While unobserved mortality due to lost or discarded fishing gear (i.e., ghostfishing) as well as stress or injury after escaping from fishing gear is clearly a problem for many species (Morgan & Chuenpagdee 2003), it is not considered in this study. Problems associated with discards in commercial fisheries were cited in the scientific literature as early as the 1930s, as was the case for the shrimp industry in the South Atlantic and Gulf of Mexico (NMFS 2004). However, it was not until 1992 that a research plan to reduce discards in shrimp fisheries was implemented by the NMFS in response to Congressional directives (Scott-Denton 2012). With the exception of protected species, the monitoring of discards of most fish species in the Atlantic and Gulf of Mexico (primarily via observer and logbook programs) did not begin until the late 1980s and early 1990s. Federal recognition of discards in commercial fisheries initially focused on endangered and threatened species through the Endangered Species Act of 1973, which mandated the reduction of incidental catch of protected species. In 1992, members of the commercial fishing industry initiated a series of workshops to develop strategies to reduce discards and increase understanding of the issue, prompting federal action (NMFS 1998). Reductions in fish discards became a requirement under federal law with the 1996 amendments to the MSA, a.k.a. the Sustainable Fisheries Act (SFA). Specifically, the SFA states that ‘conservation and management measures shall, to the extent practicable, (A) minimize bycatch and (B) to the extent bycatch cannot be avoided, minimize the mortality of such bycatch’ (Section 301). As indicated earlier, for our purposes we take the U.S. meaning of ‘bycatch’ to mean ‘discards’.
7

In 1998, the NMFS first reported on the current state of knowledge regarding discards and outlined recommendations regarding data collection, evaluation and management actions necessary to minimize discards (NMFS 1998). At the time, quantitative estimates of discards were available for only 11 species in the Atlantic and Gulf of Mexico, and it was noted that these estimates were not necessarily accurate or precise. In fact, total fish discards could only be estimated for Alaska groundfish and some shellfish fisheries (NMFS 1998). Since the publication of this report, only three studies have attempted to quantify the magnitude of discards at a national scale in the U.S. (Harrington et al. 2005, Kelleher 2005, NMFS 2011).
Kelleher (2005) estimated discards resulting from the world’s fisheries using information regarding the total landings of the fishery and total discards or the percentage of total catch that is discarded. Discards from recreational fisheries were not included. Only federally managed commercial fisheries were considered in the U.S., and discard information was primarily collected from federal sources (Kelleher et al. 2004). However, it is unclear exactly how many U.S. fisheries were included in the study. Keller (2005) reports that the GOM shrimp trawl fishery demonstrated the highest discards of any single fishery in the global database. Overall, it was estimated that 22% (or 928,000 t) of the total catch from U.S. fisheries considered in the study was discarded.
Harrington et al. (2005a, 2005b) compiled estimates of discarded biomass or the ratio of discards to landings in conjunction with landings data for all federally managed commercial fisheries in the U.S. using publically available data from discard monitoring programs as well as information available in the peer-reviewed literature. This study also included discard estimates for some recreational fisheries. When discards were reported in terms of the number of fish, length and weight data for the discarded species or similar species in the same fishery were used to convert numbers to biomass (Harrington et al. 2005b). This study concluded that in 2002, total discards were equal to 28% (i.e., 1.06 million t) of targeted landings or 22% of the total nominal catch. Regionally, the discard to landings ratio was estimated to be greatest in the Southeast (0.59, including North Carolina to Florida and the GOM) due primarily to the shrimp trawl fisheries in the GOM and South Atlantic. The discard to landings ratio in the Northeast (Maine to North Carolina) was equal to 0.49, and discards were highest in the groundfish fishery, followed by the Atlantic scallop fishery and the squid mackerel and butterfish fishery.
In 2011, the NMFS published the National Bycatch Report, which resulted in an estimate of total national discards for federally managed commercial fisheries for 2005 (NMFS 2011). This study complied raw data primarily from observer and logbook programs, as well as from dealer landings reports and production reports. It concluded that in 2005, the magnitude of discards nationwide was equal to approximately 17% of total landings. In contrast to Harrington et al. (2005), the National Bycatch Report reported a discard to landings ratio in the Northeast equal to 0.17 and 0.76 in the Southeast. According to the NMFS (2011), ‘since this report is more comprehensive [compared to Harrington et al. (2005) and Kelleher (2005)], the bycatch ratio estimate in this report should be considered to be the best estimate currently available.’ However, this study excluded all discards reported in numbers of fish rather than weight and did not include estimates of recreational discards. In the Northeast, the fisheries included in the study accounted for 72% of federally managed commercial landings while in the Southeast, only 17% of federally managed commercial landings were considered. For those fisheries with insufficient data, an overall bycatch ratio equal to the national average (0.17) was used to estimate the likely magnitude of discards. The NMFS suggests that the ratios reported by Harrington et al. (2005) and Kelleher (2005) could be larger due to the fact that these studies ‘drew information from a smaller subset
8

of fisheries and were more likely to include fisheries with high bycatch’ (NMFS 2011). While this cannot be confirmed for the Kelleher (2005) study, all fisheries included in the National Bycatch Report (NMFS 2011) were also included in Harrington et al. (2005b). None of the aforementioned studies included estimates of discards from state-managed fisheries (e.g., American lobster, blue crab, inshore herring, bait shrimp) due to a lack of data. Additionally, Harrington et al. (2005a) suggest that their study likely underestimates the true magnitude of discards due to the fact that not all portions of a fishery have 100% observer coverage or complete reporting, and species that are not commercially valuable may not be reported at all. There are two sources of discards in recreational fisheries: fish that die in the process of being caught and/or handled, and fish that are caught and released alive. Discards in the former category are included as a portion of the total ‘harvest’ in the NMFS surveys (i.e., MRFSS, MRIP, and SRHS) and are not possible to separate from landed catch due to the survey methodology. Alternatively, the NMFS has collected information regarding the number of fish caught and released alive from the boat or shore since 1981. Acknowledgement of the need for recreational anglers to limit their catch and release fish back to the sea dates back to the early 20th century in the U.S. (Arlinghaus et al. 2007). Since then, catch-and-release (C&R) fishing has been increasingly encouraged by the sport fishing industry and required under a growing number of management plans. Bartholomew and Bohnsack (2005) showed that the proportion of fish caught and released by recreational anglers nearly doubled between 1981 and 1999 and exceeded total landings by 1999. An analysis of more recent data shows that this growing trend in C&R fishing relative to the number of harvested fish (as defined by NMFS) has continued through 2010 (Figure 16a). It is important to recognize that not all fish released back to the sea survive. Estimation of release (hooking) mortality is necessary to understand the full impact of recreational fishing on fish stocks. Release mortality is defined as the proportion of fish dying after being caught by angling and then released ‘alive’ (Muoneke and Childress 1994). Muoneke and Childress (1994) first conducted a review of release mortality studies gathered from the fisheries literature and fisheries management agencies for 32 marine, freshwater and salmonid species throughout North America. These studies considered the effects of bait type, hook type, season, water temperature, water depth, anatomical location of the hook wound, and the fish size on post-release mortality (Muoneke and Childress 1994). Bartholomew and Bohnsack (2005) updated this review and performed a meta-analysis of the combined data. When all mortality estimates from both reviews were pooled, they found similar, skewed distributions in morality estimates for marine, freshwater and salmonid species and an overall mean release mortality equal to 18%, median 11% and range 0-95% (Bartholomew and Bohnsack 2005). However, it is likely that many reported mortality estimates are underestimates of actual mortality due to the fact that predation following release as well as cumulative mortality from multiple releases was rarely considered (Bartholomew and Bohnsack 2005). IUU fishing Most studies of Illegal, Unreported and Unregulated (IUU) fishing have treated this as an international and multilateral issue (i.e., define IUU almost exclusively as illegal foreign fishing) and fail to address the activity of domestic fisheries. Within the U.S., it is the NOAA Office of International Affairs that addresses problems associated with IUU fishing, and the “National Plan of Action of the United States of America to Prevent, Deter, and Eliminate Illegal, Unregulated,
9

and Unreported Fishing” (U.S. Department of State) focuses on foreign vessels engaged in IUU fishing. The apparent lack of concern and research regarding domestic unreported and illegal fishing in the U.S. is due primarily to a dearth of data, resulting from the fact that most fishing violations occur offshore and out-of-sight, and the problem of inconsistency in data collection by various enforcement agencies (King et al. 2009b). Additionally, the U.S. Coast Guard reports extremely high rates of compliance leading to the belief that illegal fishing is not a domestic problem (King et al. 2009b). However, several studies indicate that noncompliance and illegal landings are, in fact, growing issues in domestic U.S. fisheries (McCay 1984, Sutinen & Gauvin 1989, Sutinen et al. 1989, Bean 1990, Sutinen et al. 1990, Randall 2004, King et al. 2009a, King et al. 2009b, King and Sutinen 2010.) According to King et al. (2009a), illegal fishing by domestic vessels in U.S. waters ‘is significant and seems to be increasing.’ Failure to account for unreported and/or illegal catch will inevitably reduce the reliability of stock assessments and other scientific studies on which Fishery Management Plans and resulting regulations are based, leading to greater difficulty in reducing overfishing and rebuilding fish stocks. Under the MSA, commercial and recreational fishing regulations outlined in Fishery Management Plans are enforced by the NMFS Office for Law Enforcement in cooperation with the U.S. Coast Guard (USCG) (in federal waters) and state enforcement agencies (in near-shore, state waters). The USCG is responsible for at-sea surveillance and inspections regarding permit, area/time/gear and bycatch restriction violations while the NMFS and state officers primarily meet vessels at port where they focus on dockside violations, including landings overages (King et al. 2009b). Between 2000 and 2008, the USCG reported that the rate of compliance observed during at-sea inspections ranged from 95.3% to 98.6% (i.e., the rate of noncompliance ranged from 1.4% to 4.7%) (King et al. 2009b). However, the USCG does not account for violations that are not detected and focuses on vessels deemed more likely to violate rather than ensuring a random sample of vessels are inspected (USCG 2004). A recent survey of fishers, fishery enforcement staff, scientists, managers and others estimated that between 10% and 20% of the annual commercial catch resulted from illegal fishing, and between 36% and 67% of fishers are frequent or occasional violators of fishing regulations (King et al. 2009a). This research concluded that ‘the high observed compliance rates reported by the USCG reflect low success at detecting violations rather than successful deterrence’ (King et al. 2009b). Historically, it is believed that most commercial fishers complied with fishing regulations due to favorable economic and normative conditions (e.g., moral obligations, faith in regulators and regulations), leading to the need for only limited enforcement (King et al. 2009b). However, as fishing effort has increased and more stocks have become subject to overfishing, the regulatory environment has become more restrictive. In many fisheries, the cost of complying with regulations exceeds the potential penalties that could result from noncompliance. Additional motivation for noncompliance results from the low frequency of inspections and the low probability that a violation will be detected (Randall 2004). According to King et al. (2009a), there is a 30% probability of being penalized for a detected violation, and penalties are typically negotiated down to 50% of the scheduled amounts. As the economic environment increasingly favors noncompliance, the magnitude of illegal fishing in commercial fisheries has likely increased in recent years. While most research has focused on illegal domestic activity in the commercial fishing industry, there have been almost no efforts to estimate the magnitude of illegal fishing amongst recreational fishers in the U.S. The results of a national survey of anglers published by the U.S. Fish and Wildlife Service in 1995 suggested that over 40% of recreational fishers violate fishing regulations (Duda et al. 1995).
10

DATA & METHODS Commercial landings Landing statistics for all federal and state-managed commercial fisheries were publically available from the NMFS. The Fisheries Statistics Division provides online access to downloadable commercial landings data. Information regarding monthly landings in weight was available for 354 taxa, including individual species and aggregated groups of similar species, for each state on the East Coast and GOM from 1950 to 2010. States did not indicate the geographic location of the actual catch by a fishing vessel but rather the location of the dock where the fish were landed or reported. Landings statistics were reported in pounds of round (live) weight for all taxa with the exception of univalve and bivalve mollusks, which were reported as pounds of meat (excluding the shell weight). Weights were converted to tonnes (metric tons), and ‘meat weight’ converted to live wet weight. Publically available commercial landings statistics reported by the NMFS included non-confidential data and a relatively small portion of confidential data. Annual non-confidential landings were taxon-specific for each state; however, confidential data for each state were aggregated by the NMFS into general categories of unclassified taxa (e.g., ‘finfish’ and ‘shellfsh’). According to the NMFS, ‘Federal statutes prohibit public disclosure of landings (or other information) that would allow identification of the data contributors and possibly put them at a competitive disadvantage’1. Due to the fact that landings from some inland counties were included in the statistics, it was necessary to remove the inland landings of all freshwater taxa for the purposes of this study. Landings of annelids, seaweeds, sponges, and turtles were also excluded from the final data set, to remain consistency with the global datasets used by the Sea Around Us. Commercial landings reported by NMFS for each state were allocated to regions defined according to the management jurisdictions of the regional Fisheries Management Councils. The “Northeast” region includes Maine, New Hampshire, Massachusetts, Rhode Island, and Connecticut; the “Middle Atlantic” includes New York, New Jersey, Pennsylvania, Delaware, Maryland, and Virginia; the “South Atlantic” includes North Carolina, South Carolina, Georgia, and the east coast of Florida; the “Gulf of Mexico” includes the west coast of Florida, Alabama, Mississippi, Louisiana, and Texas. Landings of each taxon were converted to tonnes (t, metric tons) and aggregated by region and year. Trends in the landings of dominant taxa were also analyzed. For each taxon in each region as well as in the Atlantic and GOM combined, the total landings were computed over the entire time-series. Taxa were then ranked according to total landings. The top five taxa landed in each region as well as in the Atlantic and GOM combined were identified. Annual commercial landings reported by the NMFS were compared to annual U.S. landings reported by the U.S. to the FAO for Major Fishing Areas 21 and 31 for 1950 to 2010. FAO Area 21 includes U.S. state and federal waters (and High Seas waters) from Maine to 35°N latitude, which intersects the east coast at approximately Cape Hatteras, N.C. FAO Area 31 extends south of 35°N latitude and includes state and federal waters (and High Seas waters) off the southeast and Gulf coasts. Consequently, annual state landings reported by the NMFS were aggregated into two regions: the Northeast and Middle Atlantic States (including Maine to Virginia) and the Southeast (including South Atlantic and GOM states; North Carolina to Texas). All landings were reported
1 http://www.st.nmfs.noaa.gov/commercial-fisheries/commercial-landings/data-caveats/index
11

by the FAO in tonnes (t, metric tons) of live weight. To facilitate this comparison, landings of bivalve and univalve mollusks reported by the NMFS were converted from meat weight to live weight according to standard conversion factors provided by the NMFS. Landings of turtles reported by the FAO were excluded from the final data set. While the FAO and many countries around the world recognize the existence of industrial (i.e., large-scale commercial) and artisanal (i.e., small-scale commercial) fisheries, the U.S. does not distinguish between these two commercial sectors in the reported commercial landings data nor does it provide its own definition of these two sectors. In order to facilitate the comparison of commercial landings in the U.S. to those in other countries and to better understand the magnitude of industrial and artisanal landings on a global scale, commercial landings in the U.S. were allocated to each of these sectors following the definition of small-scale coastal fisheries reported by the European Department Committee on Fisheries (Martin 2012). This definition was based primarily on two factors: vessel length and gear type. According to Martin (2012), vessels in the European Union fishing fleet are considered ‘artisanal’ if they are less than 12 meters in length and use non-towed gear as the primary gear-type. Unfortunately, information regarding landings by vessel size was not publicly available for the Atlantic and GOM. However, the NMFS did report annual commercial landings for 1950 to 2010 by gear for each species in each state. ‘Towed’ gears are assumed to include trawls, seines and dredges (Martin 2012). Thus, landings by all trawl, seine (excluding beach seine) and dredge gears were labeled as ‘industrial.’ Additionally, landings of pelagic species using long-line gears were considered ‘industrial’ as were variations of trawl gears used by shrimping vessels, including butterfly and skimmer nets. Commercial landings reported for all other gears were labeled as ‘artisanal’. Recreational landings As described previously, recreational catch and effort data collected at a national or regional scale are scant for the 1950s to the 1970s prior to the official implementation of MRFSS in 1981. Two alternative methods were used to reconstruct recreational landings in the Atlantic and Gulf of Mexico during these three decades, and the results of each were compared. The first method used data from Saltwater Angling Survey reports published in 1960, 1965, and 1970 to reconstruct catch for 1960 to 1980 (Clark 1962, Deuel and Clark 1968, Deuel 1973). The reports include catch in weight (reported in pounds) for each species group in the Northeast (Maine to New York), Middle Atlantic (New Jersey to Cape Hatteras, North Carolina), South Atlantic (Cape Hatteras to the Florida Keys) and Gulf of Mexico (Florida Gulf coast to Texas). These data were recorded, and weight in pounds was converted to tonnes. Due to the fact that average fish weight was likely to have been overestimated by 200% in each survey, as suggest by Wheeland (1973), catches in weight for each species group were corrected for this bias. Total annual catch obtained from these three surveys provided anchor points for the years 1960, 1965 and 1970. To predict the magnitude of total landings in the 1950s, a linear model was fitted to the SWAS data points. Total landings reported from the first year of MRFSS in 1981 provided the final anchor point. Linear interpolation was then used to estimate total catch during the remaining years for which there were no available data (i.e., 1951-1959, 1961-1964, 1966-1969, 1971-1980). Alternatively, a second method based on estimates of recreational effort was also used to reconstruct probable recreational landings for 1950 to 1980. Overall, mean catch-per-unit-effort was estimated from the earliest fives years of the MRFSS dataset and applied to estimates of annual recreational effort derived from the National Surveys of Fishing, Hunting and Wildlife-Associated Recreation (FHWAR) for the years 1955, 1960, 1965, 1970, 1975, and 1980. To begin,
12

the FHWAR surveys provided nationwide estimates of the total number of saltwater and freshwater anglers and the total number of days spent fishing in saltwater and freshwater, as well as regional estimates of the combined number of saltwater and freshwater anglers. For each year of the survey, the nationwide ratio of saltwater anglers to total anglers was applied to the total anglers in each region to estimate the number of saltwater anglers in each region. In the absence of better information, it was assumed that the number of days spent fishing in each region was proportional to the number of saltwater anglers in each region. Thus, total days spent fishing in saltwater was broken down by region by applying the proportion of saltwater anglers in each region to the nationwide total number of saltwater days. Annual estimates of landings and effort by species for 1981 to 1985 were extracted from the MRFSS database. In this case, effort is defined as the estimated number of saltwater fishing trips taken by individual anglers (including coastal, non-coastal, and out-of-state residents). However, each fishing trip may last multiple days, so the number of days spent fishing is not directly equal to the number of fishing trips. To apply CPUE estimates from the MRFSS database to estimates of effort from the FHWAR surveys, the annual number of days spent saltwater fishing was converted to trips using the mean ratio of trips to days. FHWAR surveys from 1955 and 1960 as well as more recent years (starting in the 1990s) provided annual estimates of both saltwater days and trips nationwide. The mean ratio of trips to days for 1955, 1960, 1991, and 1996 was equal to 0.86 (range: 0.840 – 0. 885). Additionally, the spatial definition of regions in the FHWAR survey data differed from the definition used in this study, so region-specific estimates of effort from FHWAR surveys were adjusted as needed using the average ratio of state trips to region trips calculated from the MRFSS database for 1981 to 1985. To ensure that MRFSS estimates of effort for 1981 to 1985 were compatible with effort estimated from the FHWAR surveys, the total number of saltwater trips was estimated for the 1985 FHWAR survey and compared to the total saltwater trips estimated by the MRFSS in 1985. For this common year, the FHWAR survey data resulted in an estimate that was 2.6 times greater than that from the MRFSS database. This result is not surprising given the issues of inaccuracies and bias described by Wheeland (1973). To avoid overestimating catch for 1950 to 1980, the calculated number of trips from the FHWAR surveys were adjusted using the ratio of the MRFSS total trips to the FHWAR survey total in 1985 (ratio = 0.384). It was necessary to estimate the likely number of fishing trips taken during 1950, even though no data were available for this year. As the annual number of trips estimated from FHWAR survey data clearly increased in a linear fashion, a linear model was fitted to these data and used to predict the number of trips in 1950. The number of trips during the missing years (i.e., 1951-1954, 1956-1959, 1961-1964, 1966-1969, 1971-1974, 1976-1979) was then estimated using linear interpolation. Mean CPUE for 1981 to 1985 was calculated for each species in the MRFSS database. For each species, annual landings were summed over multiple states to produce region-specific estimates. Annual landings of each species in each region were divided by the total number of trips summed over all species in the corresponding region and year. Regions were defined according to the management jurisdictions of the regional Fisheries Management Councils. Estimates of likely landings of each species in each region were then calculated for 1950 to 1980 by multiplying the species-specific mean CPUE for each region by the total number of estimated trips in each year.
13

The initiation of the MRFSS in 1981 facilitated access to more reliable, publicly available data regarding recreational catch and effort in the Atlantic and Gulf of Mexico, as well as Pacific regions of the US. Estimates of annual, taxon-specific landings (in terms of weight) by region for 1981 to 2004 were kindly supplied by Will Figueria and Felicia Coleman (Coleman et al. 2004, Figueira and Coleman 2010). This database is based primarily on the MRFSS, and data gaps were filled using information provided by the Texas Department of Fish and Wildlife and the NMFS headboat survey program. Recreational landings for 2005 to 2010 were obtained from the Marine Recreational Information Program (MRIP). For each species or higher-order taxonomic group, annual landings (in terms of weight and number of fish) by state were downloaded from the publically accessible website. The MRIP database does not include party or headboat data from North Carolina to Florida and the Gulf of Mexico states. These data were provided by the NMFS Southeast Region Headboat Survey program. For all higher-order taxonomic groups and some species, some or all of the data records indicated only landings in terms of fish; the weight of the landings was not calculated. This represented approximately 8.5% of the total landings in terms of fish for 2005 to 2010. To estimate landings in terms of weight when this information was missing for a particular species, the mean weight of an individual fish was calculated for each region for 2005-2010 using those species-specific records in which both landings in number and weight were known. When possible, missing annual landings in terms of weight of a species in a given state were estimated by multiplying the mean individual weight in the corresponding region by the number of fish landed. To fill in the gaps in the records of higher-order genus or family groups, mean individual fish weight was computed over all member species for which this information was available in a particular region for 2005-2010. Annual landings of each genus or family in a particular state were approximated by multiplying the number of fish landed by the mean genus or family fish weight. Commercial discards With the exception of discards from shrimp trawl fisheries in the Gulf of Mexico and the South Atlantic, estimates of annual discards from commercial fisheries were derived using information reported by Harrington et al. (2005). This study was chosen as the basis for the reconstruction of commercial discards due to the comprehensive scope of fisheries and data sources considered. While stock assessments report estimates of discards for some species (especially during more recent years), these stock assessments typically only list the discards of the targeted species of a particular fishery. Thus, in any year, it is difficult or impossible to gather complete data regarding the total discards of a single species over all fisheries from publically available documents. Harrington et al. (2005) reports total discards in weight for 2002 for each federally-managed commercial fishery in the Atlantic and GOM. Discards are reported for both targeted and non-targeted species based on publically available data from discard monitoring programs, estimates from stock assessments as well as information available in the peer-reviewed literature. Due to the exhaustive number of data sources referenced and species considered by Harrington et al. (2005), it was assumed for each species that total discards summed over all fisheries represented the best available estimate of total commercial discards of that species during 2002. For species landed by commercial fisheries, a ratio of total discards to reported landings was computed for each species in each region by dividing the region-specific estimate of total discards in 2002 by the total reported commercial landings of that species in the corresponding region in 2002. This ratio of discards to landings was then used to estimate annual commercial discards in all other
14

years; annual commercial landings of each species in each region were multiplied the corresponding 2002 discard to landings ratio to estimate discards over the full time series.
It was also necessary to estimate the discards of non-targeted species included in Harrington et al. (2005) for which there are no reported commercial landings. To accomplish this, the discards reported by Harrington et al. (2005) for each of these species in 2002 were summed in each region and the proportion of discards of each species was calculated. An aggregate discard to landings ratio for these non-targeted species was computed by dividing the total non-targeted discards in each region in 2002 by the total landings of all species that were both discarded and commercially targeted in the same region in 2002. Total annual discards of non-targeted species were then estimated for each region during all other years by multiplying this aggregate discard to landings ratio by the region-specific total annual landings of those species that were both discarded and commercially targeted. Total annual non-targeted discards in each region were then disaggregated using the proportions estimated for each species in 2002.
Discards from the penaeid shrimp trawl fishery in the GOM were estimated using data available in Harrington et al. (2005) and Scott-Denton et al. (2012). While species-specific estimates of discards from this fishery exist for more vulnerable species, estimates of the total annual discards of all finfish were only available for the years 1972 through 1997 (Harrington et al. 2005). To estimate total finfish discards prior to 1972, the ratio of finfish discards to total reported shrimp landings was calculated over known years. As this ratio demonstrated a significant linear decrease over time, the annual discard/landing ratio for each year between 1950 and 1971 was estimated using the results of a linear regression of the data for 1972 to 1997. Total annual finfish discards for earlier years were then calculated by multiplying the reported shrimp landings for these years by the estimated annual discard/landing ratio. To estimate total annual finfish discards between 1998 and 2010 (i.e., the years following the introduction of Bycatch Reduction Devices [BRDs]), the post-BRD discard/landing ratio reported by Scott-Denton et al. (2012) was multiplied by annual reported shrimp landings. Total annual finfish discards over the entire study period were then disaggregated and assigned to specific taxa based on the results of the study by Scott-Denton et al. (2012) to estimate catch rates of targeted and non-targeted species in this fishery. According to this study, 153 taxa were recorded by observers as discarded from this fishery during 2007 to 2010. The proportional representation of each taxon between 2007 to 2010 was then applied to total annual finfish discards.
Similar methods were used to estimate the discards from the South Atlantic penaeid and rock shrimp fisheries. While no data were available for either fishery regarding total annual finfish discards, Scott-Denton et al. (2012) provided estimates of the ratio of total discards to targeted shrimp landings for the years prior to the introduction of BRDs (i.e., 1997 in the South Atlantic) as well as the years post-BRD. These ratios were multiplied by annual reported shrimp landings to estimate the total annual discards of targeted and non-targeted species. Total annual discards were then disaggregated according to the proportional representation of individual taxa in the observed discards from each fishery during 2007 to 2010.
Recreational discards
Estimates of live discards (i.e., the number of released fish) for 645 species and higher-order taxa were compiled from three sources; the MRFSS database for 1981 to 2003, the MRIP database for 2004-2010, and the SHBS database for 2004-2010 (information regarding released fish was not available from the SHBS prior to 2004). To determine the probable number of released fish that
15

subsequently died (i.e., the number of ‘dead discards’), estimates of release mortality were gathered from Muoneke and Childress (1994) and Bartholomew and Bohnsack (2005). For each Atlantic and GOM marine species included in the two reviews, multiple estimates (resulting from multiple studies of release mortality) were equally weighted (according to the methodology described by Bartholomew and Bohnsack (2005)) and averaged, resulting in species- and corresponding family-specific estimates of release mortality. For each species or higher order taxa, the number of fish released each year was multiplied by the corresponding species- or family-specific average release mortality in order to estimate the annual number of dead discards. For those species for which there was no estimate of release mortality, an overall average of 0.152 for Atlantic and GOM marine species was applied each year to estimate the annual number of dead discards. Unfortunately, information regarding the size of released fish is not collected by the NMFS surveys of recreational fishing. However, Harrington et al. (2005) estimated the average weight per discarded fish for 23 species caught by recreational fishers off the east coast and GOM, including summer flounder, scup, bluefish, targeted species in the south Atlantic and GOM snapper-grouper fisheries, red drum, mackerel, little tunny, cobia, wahoo and dolphinfish. These estimates were based on weight-at-age data and assumed that only sub-legal sized fish were discarded (Harrington et al. 2005). While this is a relatively small number of species, these taxa represent over one third of the total discarded fish reported between 1981 and 2010 (ranging from 18.5% of discarded fish in 1985 to 39% in 2010). For each of these 23 species, Harrington et al. (2005) reported the estimated annual weight of released fish for 1981 to 2002. To determine the weight per discarded fish, the annual weight of released fish was divided by the known, annual number of released fish in each region. The total annual weight of recreational discards for 1981 to 2010 was estimated by multiplying the average weight per discarded fish by the corresponding reported number of released fish each year. To reconstruct recreational discards in weight during 1950 to 1980, annual discard to landing ratios were computed for each of these 23 species by region for 1981 to 1985. The mean discard to landing ratio of each species in each region over 1981 to 1985 was then multiplied by corresponding recreational landings for 1950 to 1980. This methodology was used to compute the annual weight by region of total released fish and of those fish that were assumed to subsequently die. In the absence of information regarding the weight of the remaining taxa of released fish, it was assumed that the above 23 species represented an equal proportion of total discards in terms of both fish as well as weight. This assumption seems reasonable due to the fact that the majority of these commonly released species are mid-sized; there is not an over-representation of very large fish (e.g., sharks) or very small fish (e.g., bait fish). Additionally, very large and small species ranked comparatively lower in terms of the total number of released fish over 1981 to 2010. All other species and higher order taxa that lacked an estimate of average weight per discarded fish were aggregated together into a “miscellaneous discards” category, and the annual proportion of released fish and of those presumed dead represented by this category was calculated for each region over 1981 to 2010. These proportions were then used to estimate the annual total weight of released and presumed dead “miscellaneous” fish in each region over this time period. Region-specific, average proportions calculated over 1981 to 1985 were used to estimate the weight of “miscellaneous discards” over 1950 to 1980. It was assumed that “miscellaneous discards” represented a constant proportion of total released and presumed dead fish in each region during this earlier time period.
16

Illegal commercial fishing
Illegal commercial landings for the Atlantic and Gulf of Mexico were calculated as a percentage of reported commercial landings according to information available in the peer-reviewed and grey literature. At the national scale, King et al. (2009a) estimated that illegal fishing accounted for 10-20% of the overall commercial harvest in 2007. This study was based on an analysis of NOAA OLE fisheries enforcement records from 2001 to 2006, and surveys of fishers, enforcement agents, regulators, researchers and others. Specific estimates of the proportion of commercial landings caught illegally were available for 5 fisheries in the Atlantic and Gulf of Mexico. Sutinen and Gauvin (1989) estimated that 6-14% of total Northeast groundfish landings in 1988 resulted from fishing in violation of fishing regulations. King et al. (2009a) later estimated that this proportion was between 12 and 24% in 2007. Illegal landings in the Atlantic scallop fishery amounted to 6-7.5% of the reported landings in 1988 (Sutinen et al. 1989). King et al. (2009a) also reported on the results of unpublished studies of illegal landings in the Rhode Island quahog fishery and the Massachusetts lobster fishery in the 1980s. Illegal landings accounted for 5% of reported landings of quahogs in Rhode Island and 6% of reported landings of lobster in Massachusetts. Lastly, King et al. (2009a) also estimated that approximately 17% of total landings of red snapper in the Gulf of Mexico in 2007 was illegally harvested.
To calculate the magnitude of illegal landings from the East coast and Gulf of Mexico over 1950 to 2010, reported commercial landings of species targeted by the fisheries in the aforementioned studies were multiplied by available year- and region-specific proportions. State-specific estimates of illegal fishing for sea scallop, quahog and lobster fisheries were assumed to be applicable to the entire region in which the state is located. When rate of illegal fishing was estimated to fall within a specific range, the midpoint of that range was used in this study. For those years and species for which no estimates were available, it was necessary to apply an assumed proportion based on general trends in enforcement and the behavior of fishers. Between 1950 and the passage of the MSA in 1976, the proportion of total commercial landings resulting from illegal fishing was assumed to equal 5% (i.e., the lowest rate ever reported for any fishery). Under the MSA, Fishery Management Plans became a requirement, creating a generally more restrictive regulatory environment. The proportion was assumed to remain constant at 5% until 1980 to account for a lag in the enforcement of the MSA. After 1980, illegal landings were assumed to increase linearly from 5% of commercial landings to either the specific proportions extracted from the literature cited in the previous paragraph or to 15% in 2007 (i.e., the midpoint of the national range reported by King et al. (2009a)) for all other species. Between 2007 and 2010, illegal landings for all species where assumed to increase at a linear rate equal to that prior to 2007.
It was not possible to estimate illegal recreational landings due to a lack of data. However, the results reported by Duda et al. (1995) indicate that recreational fisheries are not exempt from illegal fishing, and efforts should be made to better understand this problem.
17

RESULTS
Commercial landings
During the 61 years spanning 1950 to 2010, the NMFS reports that commercial fisheries in the Atlantic and GOM landed over 131 million t of fish (Figure 1a). Approximately 38% of this total was landed at ports located in the Gulf of Mexico, 35% in the Middle Atlantic, 20% in the Northeast, and only 7% was landed in the South Atlantic. During the 1950s and early 1960s, the majority of commercial landings occurred in the Middle Atlantic, reaching a peak of nearly 50% of total landings in the early 1950s (Figure 1b). As landings in this region declined, landings in the GOM increased. With the exception of the early 1990s, the GOM has remained the dominant source of commercial landings when compared to the Atlantic. Using our definition of ‘artisanal’ versus ‘industrial’ commercial fisheries sectors (Martin 2012), artisanal fisheries caught only 20% of total reported commercial landings in the Atlantic and GOM over 1950 to 2010 while industrial fisheries caught 80% (Figure 2). Annual percentages of artisanal vs. industrial landings remained relatively steady over time, fluctuating around 20% and 80%, respectively. Regionally, artisanal fisheries have been responsible for the greatest percentage of landings relative to industrial fisheries in the South Atlantic, averaging 43% of annual commercial landings in that region and reaching a maximum of 68% in 2008 (Figure 3). In contrast, the magnitude of artisanal landings has been smallest in the GOM, averaging only 14% of the annual total in that region and reaching a maximum of 27% in 1995 and 1996 (Figure 3).
Commercial fisheries reportedly landed a total of 339 taxa (including individual species, aggregated groups of similar species, and unclassified categories of confidential landings) during the full time series, 300 of which were distinct. The number of reported taxa increased from 157 during the 1950s to 317 during 2000 to 2010. Total landings were dominated by Gulf and Atlantic menhaden (24% and 16%, respectively), Eastern oyster (13%), Atlantic surf clam (5%) and sea scallop (5%; Figure 4). It is evident that menhaden fisheries in the GOM and Atlantic have been the primary driver of variability in annual commercial landings over this time period. Landings of these two species have fluctuated annually from a low of 25% (over 465,000 t) of total commercial landings in 1950 to a maximum of 50% (nearly 1.4 million t) in 1983. Landings of all other taxa remained within 1 and 1.6 million t during this time, reaching a peak of nearly 1.6 million t in 1984 and declining to low of just over 1.1 million t in 2010.
Commercial landings in the Northeast during 1950 to 2010 amounted to over 26 million t and included 176 reported taxa, primarily sea scallop (15%), Atlantic herring (13%), Acadian redfish(6%), haddock (6%) and Atlantic cod (5%) (Figure 5a). While average annual landings in during 2000 to 2010 were only 10% lower than those during the 1950s, the landings in this region demonstrated a severe decline during the 1960s and early 1970s due to increasing competition from foreign vessels prior to the passage of the MSFCMA in 1976, falling nearly 50% from a peak over 568,000 t in 1950 to nearly 267,000 t in 1972 (Figure 3a). During the 1950s and 1960s, nearly 50% of average annual landings in this region resulted from the Northeast groundfish fishery (Figure 6). Despite a temporary recovery following the exclusion of foreign vessels as a result of the MSFCMA, landings from this fishery have gradually declined throughout the time series. During 2000 to 2010, Northeast groundfish comprised an average of 8% of total landings, and reached a low of 5% in 2006. As the abundance of groundfish has declined, sea scallop and Atlantic herring have been more important components of total landings.
18
East coast landings have been greatest in the Mid-Atlantic due primarily to reduction (i.e., fishmeal and fishoil) and bait fisheries for Atlantic menhaden. Over 45 million t of 192 reported taxa were landed in this region during 1950 to 2010, including Atlantic menhaden (37%), Eastern oyster (17%), Atlantic surf clam (15%), ocean quahog (7%) and blue crab (5%) (Figure 5b). Maximum annual landings occurred during the 1950s, reaching over 1 million t in 1954 (Figure 3b). While menhaden landings more than doubled during this decade (increasing from over 247 million t in 1950 to nearly 519 million t in 1956), landings of Eastern oyster declined by almost 50% (from a peak of 376 million t in 1954 to 193 million t in 1960). Most of the variability in annual landings in this region during 1950 to 2010 can be attributed to expansions and contractions of the Atlantic menhaden fisheries (Smith 1991, ASMFC 2010). As the Eastern oyster fishery collapsed, landings of this species were replaced by Atlantic surf clam and ocean quahog. In contrast, landings of blue crab remained relatively stable throughout the entire time series. The magnitude of annual commercial landings in the South Atlantic has remained relatively small when compared to all other regions included in this study, never reaching more than 13% (in 1981) of total annual landings in the East coast and GOM (Figure 1b). A total of approximately 9.66 million t of 217 taxa were reportedly landed in this region over 1950 to 2010, including primarily Atlantic menhaden (39%), blue crab (13%), eastern oyster (9%), calico scallop (6%), and white shrimp (2%) (Figure 5c). Average annual landings in the South Atlantic during 2005 to 2010 declined by 64% relative to that during the 1950s (Figure 3c). This decline is largely the result of the contraction of the Atlantic menhaden fishery as well as a decline in eastern oyster landings. The significant peak in total landings in 1984 is due to the calico scallop fishery, centered off of Cape Canaveral, Florida. A combination of favorable biological conditions and advances in catch technology enabled a massive catch of almost 161,000 t in 1984 (Blake and Shumway 2006), far greater than the annual landings of any other species over the study period. However, this trend was short-lived, and no landings were reported for this fishery after 2001. Total landings in the GOM over 1950 to 2010 were higher compared to the Atlantic regions due to the high productivity of the Gulf menhaden fishery (Figure 3d). During this time, the NMFS reports that almost 50 million t of 208 reported taxa was landed at ports along the GOM, including primarily Gulf menhaden (62%), eastern oyster (16%), brown shrimp (5%), white shrimp (3%) and blue crab (2%; Figure 5d). Growth and technological advances in the Gulf menhaden fishery spurred a greater than six-fold increase in annual landings from 335,000 t in 1950 to over 1.4 million t in 1984 (Figure 3d). The general decline in annual landings in the years since 1984, (falling to an annual average of 796,000 t∙year-1 during 2000 to 2010), has been attributed to a decline in the number of fishing boats and processing plants, lower product prices and a series of hurricanes (Vaughan et al. 2011). Since 1963, the magnitude of annual Gulf menhaden landings has remained higher than that of Atlantic menhaden. As oyster production declined dramatically on the East coast, oyster landings in the GOM have increasingly contributed to total U.S. production, reaching 80-90% of the total oyster landings during 2000-2010. Variability in oyster landings is primarily due to changes in consumer demand and the deleterious effects of hurricanes on oyster beds. Overall, landings of brown and white shrimp have remained relatively stable over the study period, while landings of blue crab nearly tripled between from the 1950s to the 1980s and declined slightly between the early 1990s and 2010. Overall, approximately 2.69 million t or 2.2% of total reported landings for the East coast and GOM over 1950 to 2010 were deemed confidential by NMFS and assigned to unclassified categories of finfish and shellfish. The majority of confidential landings occurred in the North
19

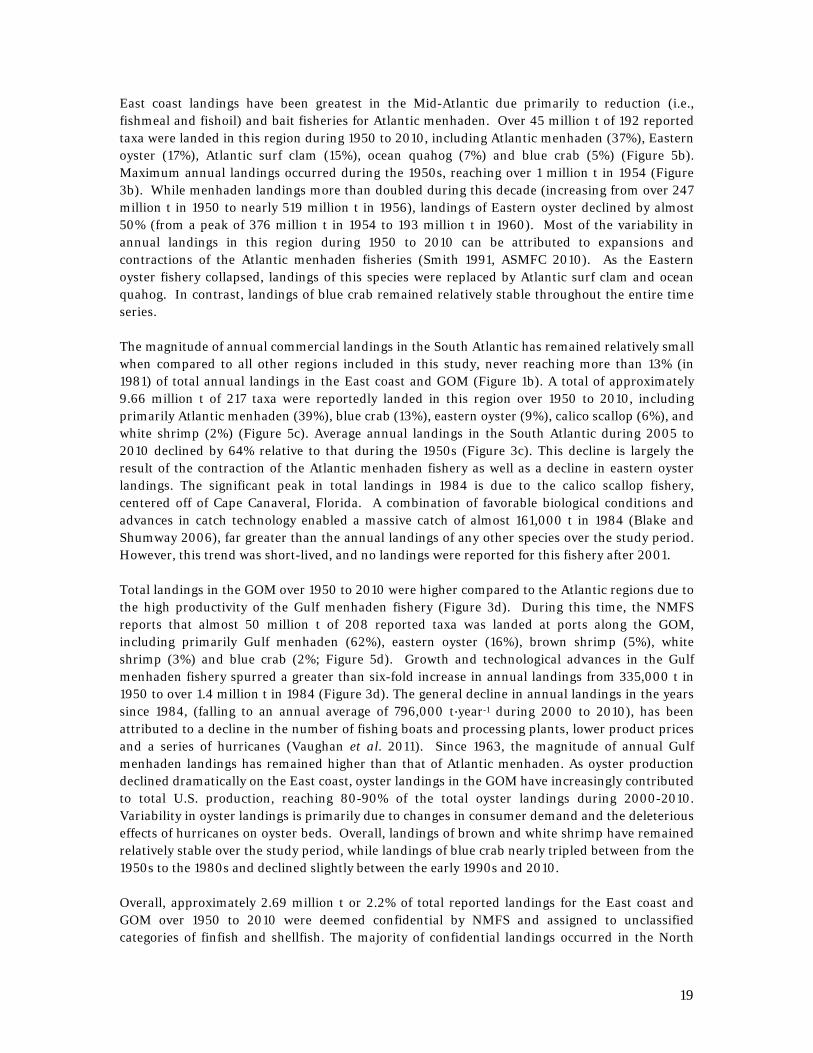
Atlantic (46%) and GOM (34%), while 19% of the total was reported in the Middle Atlantic and only 1% was reported in the South Atlantic (Figure 7a). The magnitude of confidential landings was generally higher during early years, varying from over 6% of total annual landings in 1965 to 0.3% of the total in 2010 (Figure 7b). Recreational catch Total reconstructed recreational landings for the Atlantic and GOM for the years spanning 1950 to 1980 using the two alternative methods described previously are depicted in Figure 8. Initial reconstruction of recreational landings using raw data from the 1960, 1965, and 1970 Salt-Walter Angling Surveys (Clark 1962; Deuel andClark 1968; Deuel 1973) predicted that landings increased from over 400,000 t in 1950 to a maximum of almost 620,000 t in 1970 and then declined to approximately 435,000 t in 1980 (Figure 8a). After adjusting these data to account for the problem of overestimation (Wheeland 1973), landings were estimated to have increased from 134,000 t in 1950 to a maximum of over 206,000 t in 1970 and then decreased to approximately 145,00 t in 1980. While landings of this magnitude appear more reasonable than those initially predicted, the idea that recreational fishing achieved its maximum catch during the 1970s and has since declined is not consistent with general perception regarding trends in saltwater fishing popularity and effort. The reconstruction of recreational landings based on raw effort data obtained from the 1955, 1960, 1965, and 1970 FHWAR surveys result in a more realistic, increasing trend over 1950 to 1980; however, the magnitude of landings are also high. Recreational landings were estimated to have increased from over 93,000 t in 1950 to a maximum of nearly 400,000 t in 1975 (Figure 8b). After adjusting effort estimates due to the likely problem of overestimation, predicted recreational landings appear more realistic when compared to previous predicted trends, and were consequently used in the final reconstruction. Landings were estimated to have increased from almost 36,000 t in 1950 to 153,000 t in 1975, reaching a peak of over 178,000 t in 1986, before declining to 83,000 t by 2010. It was estimated that 6.3 million t of fish were landed by recreational fishers in the Atlantic and GOM between 1950 and 2010 (Figure 9). This amount is 3.2% of the total reconstructed catch estimated for these areas over the same time period and 95% less than the magnitude of total commercial landings. Of this total, 55% was landed by fishers in Northeast and Middle Atlantic states combined, 15% in the South Atlantic, and 30% in the GOM. Reported landings include 599 taxa (including individual species and aggregated groups of similar species), which was reduced to 368 taxa in accordance with the Sea Around Us taxon list. Recreational catches consisted primarily of bluefish (19%), summer flounder (5%), spotted seatrout (5%), Atlantic cod (4%) and red drum (4%) (Figure 10). When analyzed together, the greatest percentage of recreational landings occurred in the Northeast and Middle Atlantic regions. Over 3.4 million t were landed along the coast between Maine and Virginia between 1950 and 2010 (Figure 11a). During this time, bluefish were heavily targeted by recreational fishers, and landings amounted to an estimated 1.09 million t (i.e., nearly one third of the times series total). Summer flounder, Atlantic cod, striped bass and winter flounder were also dominant species in the landings, equaling 9%, 6%, 5% and 5% of the total, respectively. While landings of bluefish, summer flounder, Atlantic cod, and winter flounder have generally declined since their peak in the early 1980s, landings of striped bass have increased by an order of magnitude. In fact, striped bass landings have exceeded those of all other species since 1996.
20

It was estimated that approximately 0.92 million t were landed by recreational fishers in the South Atlantic over 1950 to 2010. These landings were primarily composed of dolphinfish (13%), king mackerel (10%), bluefish (6%), spotted seatrout (3%), and sheepshead (3%) (Figure 11b). With the exception of bluefish, landings of these species did not exhibit a clear increasing or decreasing trend in the years since the early 1980s. In contrast, bluefish landings fell from a peak of nearly 2,600 t in 1981 to less than 150 t in 1996 before increasing to over 1,100 t in 2010. The marked rise in total South Atlantic landings during the final 10 years is primarily the result of high landings of yellowfin tuna and mullet. Almost 2 million t of fish were recreationally landed in the GOM between 1950 and 2010. The dominant species targeted included spotted seatrout (13% of the total landings during this time period), red drum (10%), king mackerel (5%), red snapper (4%) and sheepshead (4%) (Figure 11c). While total landings in this region remained relatively stable between 1980 and 2010, spotted seatrout and red drum accounted for increasingly larger proportions of the total. Landings of seatrout increased from a low of 8.5% of total landings in 1985 to a high of nearly 20% in 2009, and red drum landings rose from only 4% of the total in 1988 to also reach 20% in 2010. Commercial discards Total reconstructed legal commercial catch in the Atlantic and GOM for 1950 to 2010 amounted to over 182 million t (Figure 12). An estimated 28% of this total, or nearly 51 million t was discarded. Total discards generally declined over the study period, falling from a high of 40% of the total commercial catch in 1951 to 23% in 2010, and reaching a low 17% in 2002. Nearly half of all discards occurred in the GOM, primarily as a result of the shrimp trawl fishery (Figure 13), while 27% of discards occurred in the Northeast, 18% in the Middle Atlantic, and 7% in the South Atlantic. Discards were primarily composed of taxa caught by the GOM shrimp trawl and Northeast groundfish fisheries: Atlantic croaker (14%), skates and rays (11%), seatrouts (5%), scup (3%), and longspine porgy (3%) (Figure 14). The magnitude of discarding in the GOM exceeded that occurring in each Atlantic region until the latter half of the 1990s, following the introduction of Bycatch Excluder Devices (BRDs) to the shrimp trawl fishery in 1996 (Figure 13b). Total discards in the GOM between 1950 and 2010 were estimated to equal one third of the total catch in this region (i.e., over 24.4 million t), and fell from a high of 65% of the total catch in 1951 to 15% in 2010(Figure 15d). Annual GOM discards were estimated to have peaked at almost 850,000 t in 1954. An estimated 34% of the total commercial catch in the Northeast (i.e., over 13.6 million t), was discarded between 1950 and 2010 (Figure 15a), and primarily included silver hake, ocean pout, skates and rays, and red hake. Discards in this region were estimated to have reached a maximum value of over 508,000 t in 1984. It is interesting to note that the trend in discards in the Northeast, resulting primarily from the groundfish fishery, generally followed an inverse pattern to that of the GOM. Commercial discards in the Middle Atlantic were estimated to equal 17% (i.e., over 9 million t) of the total commercial catch during 1950 to 2010 (Figure 15b), and were predominately composed of scup, skates and rays, blueback herring, summer flounder and sea scallop. South Atlantic discards amounted to 28% of the total commercial catch (i.e., over 3.6 million t) over the study period (Figure 15c), and primarily included Atlantic croaker, thread herring, spot, jellyfish and star drum.
21

Recreational discards
It was estimated that total recreational catch in the Atlantic and GOM increased from a minimum of over 46,000 t in 1950 to a height of nearly 240,000 t in 2004 (Figure 16a). The discarded proportion of this catch more than doubled from 1950 to 2010, increasing from approximately 23% during the 1950s through 1980 to over 56% in 2010 (Figure 16b). Of these discards, it was estimated that 87% was released alive while 13% of discards died as a result of the fishing activity. For the purposes of this reconstruction, only dead discards were included in estimates of total catch over all fishing sectors in the Atlantic and GOM.
Recreational fishers in the Northeast and Middle Atlantic regions combined caught nearly 4.5 million t of fish over 1950 to 2010 (Figure 17a). Approximately 20% of this catch was released alive while 3% was discarded dead. It was estimated that dead discards in these regions reached a maximum of nearly 6,300 t in 2006. Total recreational catch in the South Atlantic amounted to over 1.4 million t during 1950 to 2010, of which 31% was caught and released and 4.6% was discarded dead (Figure 17b). Dead discards in the South Atlantic were highest in 2010, reaching nearly 2,700 t. In the GOM, 3.7 million t of fish were caught during 1950 to 2010, of which 41% was released alive and 6% was discarded dead (Figure 17c). Peak dead discards in the GOM occurred in 2008 and equaled 8,000 t.
Overall, it is clear from Figure 16 that merely considering recreational landings in the Atlantic and GOM masks the actual trend in total recreational catch over 1950 to 2010. While total recreational landings in the Atlantic and GOM declined during the 1980s and remained relatively stable thereafter, discards due to catch and release fishing steadily increased over the study period.
Illegal commercial catches
Using the limited information available regarding the potential quantity of unreported, illegal landings from commercial fisheries in the Atlantic and GOM, it was estimated that 7.8% of total reported commercial landings or 10.2 million t of fish was illegally caught and landed between 1950 and 2010 (Figure 18a). Following the assumptions of the methods used to calculate these landings, the annual magnitude of illegal, unreported landings has increased from approximately 5% of total reported, commercial landings during the 1950s, 1960s and 1970s to 16.9% in 2010 and has ranged from a minimum of approximately 88,000 t in 1967 to a peak of 311,000 t in 2009 (Figure 18b). The majority (39%) of illegal landings during this time occurred in the GOM, while 33% was landed in the Middle Atlantic, 21% in the Northeast, and 6.5% in the South Atlantic.
DISCUSSION
Overall, it was estimated that marine fisheries operating off the U.S. East Coast and in the GOM caught nearly 200 million t of fish between 1950 and 2010 (Figure 19a). The majority of this catch was comprised of legal commercial landings (66%), of which 80% was landed by industrial fisheries and 20% by artisanal fisheries. The remaining catch was composed of commercial and recreational discards (26%), illegal commercial landings (5%) and recreational landings (3%). Catches in the GOM represented 41% of the total, while catches in the Middle Atlantic represented 30%, 22% in the Northeast and only 8% in the South Atlantic (Figure 19). The total reconstructed catch was dominated by commercial landings of Gulf menhaden (16%), Atlantic
22

menhaden (11%), eastern oysters (9%) and sea scallops (3%), as well as commercial discards of Atlantic croaker (4%) (Figure 4).
The total reconstructed catch summed over 1950 to 2010 was 61% greater than the total U.S. catch of nearly 124 million t reported by the U.S. to the FAO for FAO Areas 21 and 31 combined. Annually, the difference between the total catch estimated in this study and that reported by the FAO was greatest in 1951 (i.e., the reconstructed catch was 94% greater) and least in 1988 (i.e., only 44% greater) (Figure 19a).
U.S. catch reported by the FAO in Area 21 was compared to reconstructed catch in the Northeast and Middle Atlantic, and U.S. catch reported by the FAO in FAO Area 31 was compared to reconstructed catch in the South Atlantic and GOM. The FAO reports a total of over 70 million t of fish was caught in Area 21 between 1950 and 2010 (Figure 19b). According to the results of this study, over 103 million t of fish were actually caught in the Northeast and Middle Atlantic; 47% more than that reported by the FAO in Area 21. When compared annually, it was estimated that reconstructed catch in the Northeast and Middle Atlantic was 72% greater than that reported by the FAO in 1998 while reconstructed catch was only 31% greater in 1972. On average, the reconstruction of catches in this region resulted in an annual increase of 47% relative to that reported by the FAO for Area 21.
According to the FAO, approximately 53.5 million t of fish was caught in Area 31 between 1950 and 2000 (Figure 19c). However, this study estimated that over 95 million t was caught in the South Atlantic and GOM over the same time period. This is 78% more than the time series total reported by the FAO in Area 31. Annual reconstructed catch was 205% greater than that reported by the FAO in 1954 and only 43% greater in 1984, and averaged 87% greater annually over the complete time series.
It appears that the NMFS reports only commercial landings to the FAO; however, this reporting is not exact for all taxa. According to the NMFS, 334 taxa were landed by U.S. commercial fisheries in the Atlantic and GOM between 1950 and 2010. The FAO reports the catch of 230 taxa by U.S. fisheries in the same region, so some aggregation of taxa has occurred.
Acknowledgements This is a contribution of the Sea Around Us, a scientific collaboration between the University of British Columbia and The Pew Charitable Trusts. The author thanks the large number of people who provided data and insights into U.S. fisheries, including a special thanks to all NOAA staff for their willingness and openness with regards to data.
23

REFERENCES
Atlantic States Marine Fisheries Commission (ASMFC). 2010. Atlantic Menhaden Stock Assessment and Review Panel Reports. Stock Assessment Report No. 10-02. 325 p.
Bean, C. 1990. An Economic Analysis of Compliance and Enforcement in the Quahaug Fishery of Narragansett Bay. Unpublished Masters Thesis, University of Rhode Island.
Blake, N.J and S.E. Shumway. 2006. Chapter 17, Bay scallop and calico scallop fisheries, culture and enhancement in eastern North America. Developments in Aquaculture and Fisheries Science 35: 945–964.
Bureau of Sport Fisheries and Wildlife. 1960. National Survey of Fishing and Hunting. U.S. Department of the Interior, Fish and Wildlife Service, Circular 120. 73 p.
Bureau of Sport Fisheries and Wildlife. 1970. National Survey of Fishing and Hunting. U.S. Department of the Interior, Fish and Wildlife Service, Resource Publication 95. 108 p.
Clark, J.R. 1962. The 1960 Salt-Water Angling Survey. U.S. Department of the Interior, Bureau of Sport Fisheries and Wildlife, Circular 153. 32 p.
Deuel, D.G. and J.R. Clark. 1968. The 1965 Salt-Water Angling Survey. U.S. Department of the Interior, Bureau of Sport Fisheries and Wildlife, Resource Publication 67, 51 p.
Deuel, D.G. 1973. The 1970 Salt-Water Angling Survey. U.S. Department of Commerice, National Oceanic and Atmospheric Administration, National Marine Fisheries Service, Current Fisheries Statistics No. 6200. 54 p.
Duda, M.D., S.J Bissell and K.C. Young. 1995. Factors related to hunting and fishing participation in the United States, Phase V: Final Report. U.S. Fish and Wildlife Service. 43 p.
FAO. 2014. The State of World Fisheries and Aquaculture 2014. Rome. 223p. Froese, R., K. Kleisner, D. Zeller and D. Pauly. 2012. What catch data can tell us about the status of
global fisheries. Marine Biology 159 (6): 1283-1292. Guillory, V. 1993. Ghost Fishing by Blue Crab Traps. North American Journal of Fisheries
Management 13: 459-466. Hanna, S., H. Blough, R. Allen, S. Iudicello, G. Matlock, and B. McCay. 2000. Fishing Grounds:
Defining a New Era for American Fisheries Management. Island Press, Washington, D.C. Harrington, J.M., R.A. Myers, and A. Rosenberg. 2005a. Wasted fishery resources: discarded by-catch
in the USA. Fish and Fisheries 6: 350-361. Harrington, J.M., R.A. Myers, and A. Rosenberg. 2005b. Wasted fishery resources: Bycatch and
discards in US fisheries. Oceana, Washington, D.C. 282 p. Kelleher, K. (2005). Discards in the world’s marine fisheries: an update. FAO Fisheries Technical
Paper No. 470, Food and Agriculture Organization of the United Nations, Rome, Italy, 131 pp. King, D.M., E. Price, A. Van Buren, C, Shearin, K.J. Mengerink, R.D. Porter, J.G. Sutinen, A.
Rosenberg, and J.H. Swasey. 2009a. An economic, legal and institutional assessment of enforcement and compliance in federally managed U.S. commercial fisheries. A report supported by the Lenfest Ocean Program. 213 p.
King, D.M., R.D. Porter, and E.W. Price. 2009b. Reassessing the value of the U.S. Coast Guard at-sea fishery enforcement. Ocean Development and International Law 40: 350-372.
King, D.M., and J.G. Sutinen. 2010. Rational noncompliance and the liquidation of Northeast groundfish resources. Marine Policy 43: 7-21.
Martin, J.I. 2012. The small-scale coastal fleet in the reform of the common fisheries policy. European Parliament, Directorate-General for Internal Policies, Policy Department B: Structural and Cohesion Policies, Fisheries. 38 p.
McCay, B. 1984. The pirates of piscary: ethnohistory of illegal fishing in New Jersey. Ethnohistory 31: 17-37.
Morgan LE and Chuenpagdee R. 2003. Shifting gears: addressing the collateral impacts of fishing methods in US waters. Pew Science Series. Washington, DC: Island Press.
National Marine Fisheries Service. 1998. Managing the Nation’s Bycatch: Priorities, Programs and Actions for the National Marine Fisheries Service. U.S. Dep. Commer. 190 p.
National Marine Fisheries Service. 2004. Evaluating Bycatch: A National Approach to Standardized
Bycatch Monitoring Programs. U.S. Dep. Commer., NOAA Technical Memorandum NMFS-F/SPO-66, 108 p.
24

National Marine Fisheries Service. 2011. U.S. National Bycatch Report [ W. A. Karp, L. L. Desfosse, S. G. Brooke, Editors ]. U.S. Dep. Commer., NOAA Tech. Memo. NMFS-F/SPO-117C, 508 p.
National Research Council. 2000. Improving the Collection, Management, and Use of Marine Fisheries Data. National Academy Press, Washingtion, D.C. 222 p.
Northeast Fisheries Science Center. 2010. 50th Northeast Regional Stock Assessment Ref Doc. 10-17; 844 p.
Okey, T.A. 2003. Membership of the eight Regional Fishery Management Councils in the United States: are special interests over-represented? Marine Policy 27(3): 193-206.
Pitchon, A. and K. Norman. 2012. Fishing off the dock and under the radar in Los Angeles County: demographics and risks. Bulletin of the Sounthern California Academy of Sciences 11: 141-152.
Randall, J.K. 2004. Improving compliance in U.S. federal fisheries: an enforcement agency perspective. Ocean Development and International Law 35: 287-317.
Schmied, R.L. and E.E. Burgess. 1987. Marine Recreational Fisheries in the Southeastern United States: An Overview. Marine Fisheries Review 49: 2-7.
Scott-Denton, E., P.F. Cryer, M.R. Duffy, J.P. Gocke, M.R. Harrelson, D.L. Kinsella, J.M. Nance, J.R. Pulver, R.C. Smith, and J.A. Williams. 2012. Characterization of the U.S. Gulf of Mexico and South Atlantic Penaeid and Rock Shrimp Fisheries Based on Observer Data. Marine Fisheries Review 74: 1-27.
Smith, J.W. 1991. The Atlantic and Gulf Menhaden Purse Seine Fisheries: Origins, Harvesting Technologies, Biostatistical Monitoring, Recent Trends in Fisheries Statistics, and Forecasting. Marine Fisheries Review 53: 28-41.
Sutinen, J.G., A. Rieser, and J.R. Gauvin. 1990. Measuring and Explaining Noncompliance in Federally Managed Fisheries. Ocean Development and International Law 21: 335-372.
Sutinen, J.G., and J.R. Gauvin. 1989. An Econometric Study of Regulatory Enforcement and Compliance in the Commercial Inshore Lobster Fishery of Massachusetts. In P.A. Neher, R. Arnason, and N. Mollet (eds.), Rights-Based Fishing. Kluwer Academic Publishers, Dordrecht, Boston, London.
Sutinen, J.G., A. Rieser, and J.R. Gauvin. 1989. Compliance and Enforcement in Northeast Fisheries. A Report for the New England Fishing Management Council, Saugus, Mass.
Sutinen, J.G. and J.R. Gauvin. 1988. A Study of Law Enforcement and Compliance in the Commercial Inshore Lobster Fishery of Massachusetts. Volumes I and II. An unpublished report to the Environmental Enforcement Division, State of Massachusetts.
U.S. Commission of Fish and Fisheries. 1884-1887. The Fisheries and Fishing Industries of the United States. U.S. Government Printing Office, Washington, D.C.
U.S. Coast Guard. (2004). Ocean Guardian: Fisheries Enforcement Strategic Plan 2004-2014. Vaughan, D., A. Schueller, J. Smith, and S. VanderKooy. 2011. SEDAR 27: Gulf Menhaden Stock
Assessment Report. 432 p. Watson, R., W.W.L. Cheung, J. Anticamara, R.U. Sumaila, D. Zeller and D. Pauly. 2012. Global marine
yield halved as fishing intensity redoubles. Fish and Fisheries. DOI: 10.1111/j.1467-2979.2012.00483.x
Weber, M.L. 2002. From Abundance to Scarcity: A History of U.S. Marine Fisheries Policy. Island Press, Washington, D.C. 245 pp.
25

Figure 1: Total U.S. commercial landings reported by the NMFS for all regions in the Atlantic and GOM (a), and the proportion of total annual commercial landings in each region (b) (mt = metric ton or tonnes, 1 mt = 1,000 kg).
26

Figure 2: Reported commercial landings by artisanal and industrial fisheries in the Atlantic and GOM, combined (mt = metric ton or tonnes, 1 mt = 1,000 kg).
27

Figure 3: Commercial landings by artisanal and industrial fisheries in the Northeast (a), Middle Atlantic (b), South Atlantic (c) and GOM (d) (mt = metric ton or tonnes, 1 mt = 1,000 kg).
28

Figure 4: Reported commercial landings of major taxa in the Atlantic and GOM, combined. The top 5 taxa in terms of their proportional representation in the total landings over the full time series are indicated; landings of all other taxa represented as “Misc.” (mt = metric ton or tonnes, 1 mt = 1,000 kg).
29

Figure 5: Reported commercial landings of major taxa in the Northeast (a), Middle Atlantic (b), South Atlantic (c) and GOM (d) (mt = metric ton or tonnes, 1 mt = 1,000 kg).
30

Figure 6: Reported commercial landings of groundfish (i.e., American plaice, Atlantic cod, Atlantic halibut, haddock, ocean pout, offshore hake, pollock, red hake, redfish, silver hake, white hake, windowpane flounder, winter flounder and yellowtail flounder) and all other taxa (i.e., “Misc”) in the Northeast region (mt = metric ton or tonnes, 1 mt = 1,000 kg).
31

Figure 7: Reported commercial landings of confidential, aggregated taxa by region for the Atlantic and GOM, combined (a), and the proportion of annual reported landings in the Atlantic and GOM that are confidential (b) (mt = metric ton or tonnes, 1 mt = 1,000 kg).
32
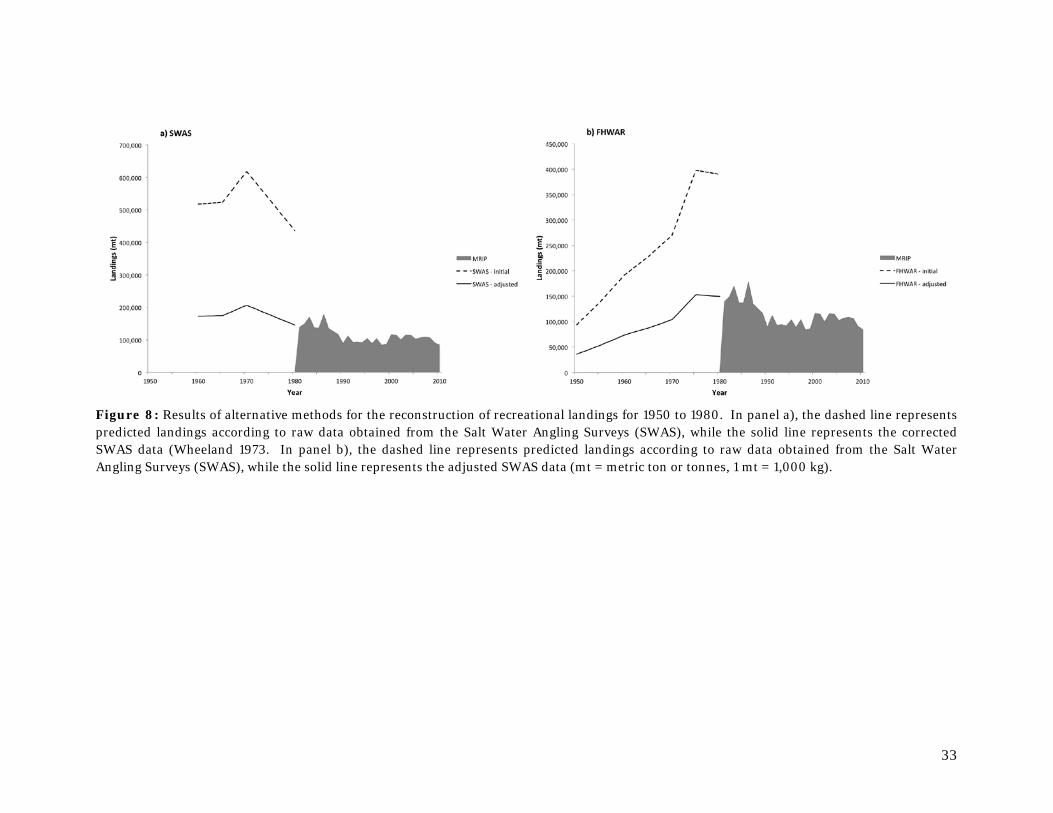
Figure 8: Results of alternative methods for the reconstruction of recreational landings for 1950 to 1980. In panel a), the dashed line represents predicted landings according to raw data obtained from the Salt Water Angling Surveys (SWAS), while the solid line represents the corrected SWAS data (Wheeland 1973. In panel b), the dashed line represents predicted landings according to raw data obtained from the Salt Water Angling Surveys (SWAS), while the solid line represents the adjusted SWAS data (mt = metric ton or tonnes, 1 mt = 1,000 kg).
33

Figure 9: Reconstructed recreational landings for all regions in the Atlantic and GOM (a), and the proportion of total annual recreational landings in each region (b) (mt = metric ton or tonnes, 1 mt = 1,000 kg).
34
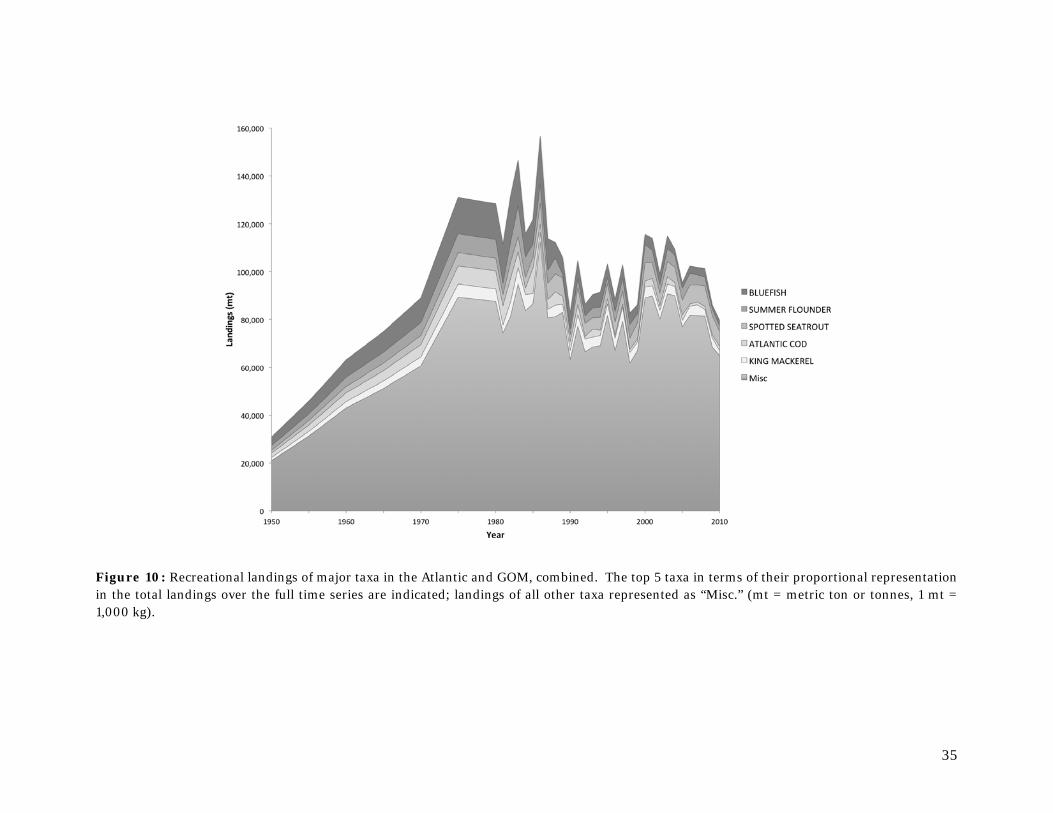
Figure 10: Recreational landings of major taxa in the Atlantic and GOM, combined. The top 5 taxa in terms of their proportional representation in the total landings over the full time series are indicated; landings of all other taxa represented as “Misc.” (mt = metric ton or tonnes, 1 mt = 1,000 kg).
35

Figure 11: Recreational landings of major taxa in the Northeast and Middle Atlantic (a), South Atlantic (b) and GOM (c) (mt = metric ton or tonnes, 1 mt = 1,000 kg).
36

Figure 12: Reconstructed commercial catch in the Atlantic and GOM, combined, including reported landings and discards (mt = metric ton or tonnes, 1 mt = 1,000 kg).
37

Figure 13: Reconstructed commercial discards for all regions in the Atlantic and GOM (a), and the proportion of total annual commercial discards in each region (b) (mt = metric ton or tonnes, 1 mt = 1,000 kg).
38

Figure 14: Commercial discards of major taxa in the Atlantic and GOM (mt = metric ton or tonnes, 1 mt = 1,000 kg).
39

Figure 15: Reconstructed commercial catch, including reported landings and discards in the Northeast (a), Middle Atlantic (b), South Atlantic (c) and GOM (d) (mt = metric ton or tonnes, 1 mt = 1,000 kg).
40

Figure 16: Reconstructed recreational catch, including landings, catch and release, and dead discards in the Atlantic and GOM in terms of the weight of fish (a), and the proportion of total recreational catch that was landed, caught and released, and discarded dead (b) (mt = metric ton or tonnes, 1 mt = 1,000 kg).
41

Figure 17: Reconstructed recreational catch, including landings, catch and release, and dead discards in the Northeast and Middle Atlantic (a), South Atlantic (b) and GOM (c) (mt = metric ton or tonnes, 1 mt = 1,000 kg).
42

Figure 18: Unreported, illegal commercial landings and reported commercial landings in the Atlantic and GOM, combined (a), and total unreported, illegal commercial landings for all regions region in the Atlantic and GOM (b) (mt = metric ton or tonnes, 1 mt = 1,000 kg).
43

Figure 19: Total reconstructed U.S. fisheries catches by sector within the U.S. EEZ in the Atlantic and the GOM over 1950 to 2010. Both the reconstructed total catch and catches reported by the FAO (dotted line) are demonstrated. Panel a depicts the total catch in the Atlantic and GOM combined; panels b and c show total catches in FAO Areas 21 and 31, respectively (mt = metric ton or tonnes, 1 mt = 1,000 kg).
44
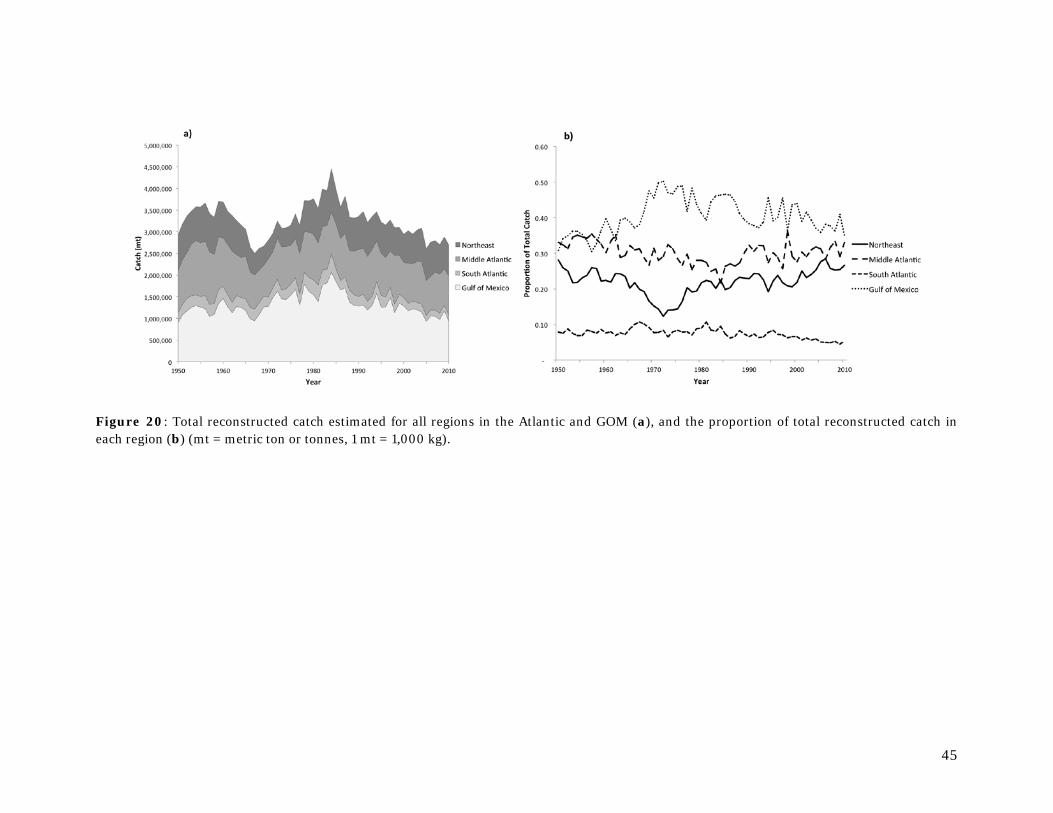
Figure 20: Total reconstructed catch estimated for all regions in the Atlantic and GOM (a), and the proportion of total reconstructed catch in each region (b) (mt = metric ton or tonnes, 1 mt = 1,000 kg).
45

Figure 21: Total reconstructed catch by sector for the Northeast (a), Middle Atlantic (b), South Atlantic (c) and GOM (d) (mt = metric ton or tonnes, 1 mt = 1,000 kg).
46