Embed Size (px)
Citation preview

ISSN 1198-6727
Fisheries Centre Research Reports
2006 Volume 14 Number 6
CATCHING MORE BAIT: A BOTTOM-UP RE-ESTIMATION OF
GLOBAL FISHERIES SUBSIDIES
Fisheries Centre, University of British Columbia, Canada

CATCHING MORE BAIT: A BOTTOM-UP RE-ESTIMATION OF GLOBAL FISHERIES
SUBSIDIES edited by Ussif Rashid Sumaila and Daniel Pauly Fisheries Centre Research Reports 14(6) 114 pages © published 2006 by The Fisheries Centre, University of British Columbia 2202 Main Mall Vancouver, B.C., Canada, V6T 1Z4 ISSN 1198-6727

Fisheries Centre Research Reports 14(6) 2006
CATCHING MORE BAIT: A BOTTOM-UP RE-ESTIMATION OF GLOBAL FISHERIES SUBSIDIES
edited by
Ussif Rashid Sumaila and Daniel Pauly
CONTENTS
Page
DIRECTOR’S FOREWORD .................................................................................................................................... 1 EXECUTIVE SUMMARY ....................................................................................................................................... 2 LIST OF ACRONYMS ............................................................................................................................................ 3 CHAPTER 1 THE NATURE AND MAGNITUDE OF GLOBAL NON-FUEL FISHERIES SUBSIDIES
KHAN, A. S., U. R. SUMAILA, R. WATSON, G. MUNRO AND D. PAULY............................................. 5 CHAPTER 2 FUEL SUBSIDIES TO GLOBAL FISHERIES
SUMAILA, U.R., L. TEH, R. WATSON, P. TYEDMERS AND D. PAULY .............................................. 38 CHAPTER 3 SUBSIDIES TO HIGH SEAS BOTTOM TRAWL FLEETS
SUMAILA, U.R., A. KHAN, L. TEH, R. WATSON, P. TYEDMERS AND D. PAULY............................... 49 CHAPTER 4 OVERSEAS DEVELOPMENT ASSISTANCE TO FISHERIES AS A SUBSIDY
ALDER, J., H. FOX AND M. JORGE .............................................................................................. 54 CHAPTER 5 A HISTORICAL ACCOUNT OF BRAZILIAN POLICY ON FISHERIES SUBSIDIES
ABDALLAH, P. R. AND U.R. SUMAILA..........................................................................................68 APPENDICES
APPENDIX 1: Regional fisheries subsidy estimates by categories ........................................................ 78
APPENDIX 2: Global compendium of national fisheries subsidy programs.......................................... 84
A Research Report from the Sea Around Us Project, Fisheries Centre, UBC 114 pages © Fisheries Centre, University of British Columbia, 2006
FISHERIES CENTRE RESEARCH REPORTS ARE ABSTRACTED IN THE FAO AQUATIC SCIENCES AND FISHERIES ABSTRACTS (ASFA)
ISSN 1198-6727


Catching More Bait: a bottom-up re-estimation of global fisheries subsidies, Sumaila and Pauly (eds.) 1
DIRECTOR’S FOREWORD
This report on fisheries subsidies explores a theme that may seem baffling to the uninitiated: all but the fisheries industry seem to think subsidies are a bad thing, but nevertheless, “cosi fan tutte” (roughly: “they all do it”) in Amadeus Mozart’s immortal words (he also provided the music, which helped). Most opera houses, by the way, survive only because they are subsidized.
In the 1950s and 1960s, the more boat-building subsidies you gave, the more fish you got, and so it is not surprising that the young aides to managers kept on believing in this magic when, in the subsequent decades, they became managers themselves.
Things have changed, however: the resource base is too diminished for all these fishing boats to turn a profit, and the subsidies, far from having the effect they had earlier, now contribute to overfishing, i.e., more fish being caught than should be, as explained in the second chapter of this report. This is not intuitive, and most managers and policy makers either cannot wrap their heads around it, or do not act on it.
Another reason for inaction is that, in most countries, fisheries subsidies are, in budget terms, part of agricultural subsidies… and these are a nightmare that few persons awake would want to get into.
As a result, subsidies not only stay – particularly in Europe and the East Asia – but grow inexorably, and are now conservatively estimated between US$30-34 billion per year for the period from 1995 to 2005. This is nearly double the figure US$14-20 billion accepted until now, which was issued by the World Bank.
This discrepancy is due to this report explicitly accounting for countries which do not quantify the subsidies they give to (or receive for) their fisheries. Thus, in official statistics (e.g., those of the World Bank), they are treated as having zero subsidies. The ‘missing data = 0 problem’ also occurs in the official fishing catch statistics of many maritime countries, and is now known to have misinformed policy-making in numerous instances.
Here, this problem is overcome through an explicit procedure for filling the gaps, which was applied, however, only to countries known to have the subsidy type in question (i.e., that the subsidy was given was known, but not the amount).
Another thing that this report does is differentiate between subsidy types – fuel and non-fuel, subsidies that are considered ‘good’ (e.g., management and surveillance), ‘bad’ (e.g., boat building), and ‘ugly’, i.e., subsidies whose evaluation depends on context. Moreover, subsidies amount and their sources are presented in tables or appendices for all countries, thus allowing skeptical readers to check for themselves. This may contribute toward transparency, and perhaps even assist those who think that ‘cosi fan tutte’ is not an excuse.
Daniel Pauly,
September 2006

2 Executive Summary, Sumaila and Pauly (eds.)
EXECUTIVE SUMMARY
Ussif Rashid Sumaila and Daniel Pauly1 Fisheries Centre, Aquatic Ecosystems Research Laboratory (AERL), University of British Columbia.
2202 Main Mall, Vancouver, BC., V6T 1Z4, Canada [email protected]; [email protected]
Subsidies that reduce the cost of fisheries operations and those that enhance revenues make fishing enterprises more profitable than they would otherwise be. This results directly or indirectly in the build-up of excessive fishing capacity, leading to the overexploitation of fishery resources.
We present in this report five contributions on the issue of fisheries subsidies. The first four contributions have a global scope, while chapter 5 looks at the history of fisheries subsidies in one country, Brazil. Chapter 1 identifies, categorizes, and compiles a database of fisheries subsidies for 144 maritime countries spanning 1995 to 2005. Using this database, an annual non-fuel subsidy amount for the year 2000 was computed that explicitly deals with data gaps. Global annual non-fuel subsidies were estimated at US$26 billion. The proportion of subsidies contributing to an increase in fishing capacity globally is estimated at US$ 15 billion, while subsidies that contribute to fisheries management and conservation programs come to approximately US$7 billion.
The objective of the second contribution is twofold. First, it explores the theoretical basis for the expectation that increasing fuel price faced by fishing enterprises will, everything being equal, reduce fishing pressure. Second, it estimates the amount of fuel subsidies paid to the fishing sector by governments globally. Results from the study indicate that global fuel subsidies stand at between US$4 to 8 billion per year. This implies that, depending on how much of this subsidy existed before the recent fuel price increases, fishing enterprises can, in the aggregate, absorb as much as an US$8 billion increase in their fuel budget before we begin to see any conservation benefits from fuel price increases. The sum of fuel and non-fuel subsidies ranges between US$30-34 billion, which is nearly two times the earlier World Bank estimate of US$14-20 billion.
Chapter 3 estimates the global amount of subsidies paid to bottom trawl fleets operating in the high seas, i.e., outside of the Exclusive Economic Zones of maritime countries, to be at least US$152 million per year. This constitutes 15% of the total landed value of the fleet. Economic data for bottom trawlers suggest that the profit achieved by this vessel group is normally not more than 10% of landed value. The implication of this finding is that, without subsidies, the bulk of the world’s bottom trawl fleet operating in the high seas will operate at a loss (unable to fish), thereby reducing the current threat to deep sea and high seas fish stocks.
Chapter 4 explores the effects of Overseas Development Assistance (ODA), i.e., the transfer of funds from developed to less developed countries’ capture fisheries sector. Overall, this study found that ODA, while in many cases, helping to jump-start the development of modern fisheries, has not helped developing countries to address the issue of overfishing. In some cases, this has contributed to current problems.
Chapter 5 provides the only country-level analysis in this report. It presents a historical account of Brazil’s national policy on fisheries subsidies. Brazil is important both in its own right as an important developing country with a lot of influence, and as a strong voice in international fora, where it defends the subsidization of fisheries in developing countries. The chapter discusses problems and limitations resulting from this policy.
1 Cite as: Sumaila, U.R., Pauly, D., 2006. Executive Summary. In Sumaila, U.R., Pauly, D. (eds.), Catching more bait: a bottom-up re-estimation of global fisheries subsidies. Fisheries Centre Research Reports 14(6), pp. 2. Fisheries Centre, the University of British Columbia, Vancouver, Canada.

List of Acronyms 3
LIST OF ACRONYMS
ACP African, Carribean and Pacific countries associated with the European Union
ADB Asian Development Bank
AFDB African Development Bank
APEC Asian Pacific Economic Cooperation
ASCM Agreement on Subsidy and Countervailing Measures
BANCEN Central Bank of Brazil
CARICOM Caribbean Community
CIDA Canadian International Development Agency
CFFA Coalition for Fair Fisheries Arrangement
DANIDA Danish International Development Agency
DFID Department for International Development
DFO Department of Fisheries and Ocean, Canada
ECOWAS Economic Community of West African States
EEC European Economic Community
EEZ Exclusive Economic Zone
EFF European Fisheries Fund
EU European Union
FAD Fish Aggregating Device
FAO Food and Agricultural Organization of the United Nations
FAS Fish Agro-food System
FED Foundation for Enterprise Development
FIFG Financial Instrument for Fisheries Guidance
FISET Regional and Sectorial Investment Fund
GATT General Agreement on Tariffs and Trade
GEF Global Environment Fund
GFT Government Financial Transfers
GRT Gross Registered Tons
GTZ German Technical Cooperation
HACCP Hazard Analysis and Critical Control Point
IBAMA Brazilian Institute for the Environment and Renewable Natural Resources
ICEIDA Icelandic International Development Agency
ICES International Council for the Exploration of the Seas
ICZM Integrated Coastal Zone Management
IDAF Integrated Development for Artisanal Fisheries
IDRC International Development Research Council
IFAD International Fund for Agricultural Research
IFREMER Institut français de recherche pour l’exploitation de la mer
INFOFISH Intergovernmental Organization for Marketing Information and Technical
Advisory Services for Fishery Products within the Asia Pacific Region
IPEA/COMIF Institute of Applied Economic Research
IRD Institut Français de Recherche Scientifique pour le Développement en
Coopération (formerly OSTROM)
IUCN International Union for the Conservation of Nature

4 Catching More Bait: a bottom-up re-estimation of global fisheries subsidies, U. R. Sumaila and D. Pauly (eds.)
IUU Illegal, Unregulated and Unreported fishing
LV Landed Value
LME Large Marine Ecosystems
JICA Japanese International Cooperation Agency
MC&S Monitoring, Control and Surveillance
MMA Ministry of Environment, Brazil
MPA Marine Protected Areas
MRAG Marine Resources Assessment Group, London
NEPAD New Partnership for African Development
NGO Non Government Organization
NOAA National Oceanographic and Atmospheric Administration, U.S.
NORAD Norwegian Agency for Development Cooperation
ODA Overseas Development Agency
OECD Organization for Economic Cooperation and Development
R&D Research and Development
REVIZEE Living Resources of the Exclusive Economic Zone (of Brazil)
RFMO Regional Fisheries Management Organization
SEAP Special Secretary for Aquaculture and Fisheries
SFLP Sustainable Fisheries Livelihood Project
SIFAR Support Unit for International Fisheries and Aquatic Research
SIFR Study of International Fisheries Research
SUDEPE Superintendency for the Development of Fisheries (Brazil)
UN United Nations
UNCLOS United Nations Convention on the Law of the Sea
UNDP United Nations Development Program
UNEP United Nations Environment Program
WB World Bank
WSSD World Summit on Sustainable Development
WTO World Trade Organization
WWF World Wildlife Fund

The nature and magnitude of global non-fuel fisheries subsidies, Khan et al. 5
CHAPTER 1
THE NATURE AND MAGNITUDE OF GLOBAL NON-FUEL FISHERIES SUBSIDIES1
Ahmed S. Khan, U. Rashid Sumaila, Reg Watson, Gordon Munro and Daniel Pauly Fisheries Centre, Aquatic Ecosystems Research Laboratory (AERL), University of British Columbia.
2202 Main Mall, Vancouver, BC., V6T 1Z4, Canada
ABSTRACT
Fishery subsidies greatly impact the sustainability of fishery resources. Subsidies that reduce the cost of fisheries operations and those that enhance revenues make fishing enterprises more profitable than they would be otherwise. Such subsidies result in fishery resources being overexploited, as they contribute directly or indirectly to the build-up of excessive fishing capacity, thereby undermining the sustainability of marine living resources and the livelihoods that depend on them.
In this contribution, fishery subsidies are identified and categorized, taking into consideration the policy relevance of fishery subsidies worldwide, subsidy program descriptions, sources of funding, scope and coverage, annual total amounts, administering authority, and the recipients of the subsidy. Using this taxonomy, a database of subsidy programs reported in marine capture fisheries for 144 coastal countries was compiled spanning 1995 to 2005. From this, an annual estimate of subsidies paid to the fishing sector by governments globally is computed for 2000. This static estimate accounts explicitly for data gaps.
Total global fishery subsidies were estimated at about US$26 billion for the eleven subsidy types identified in this study (excluding fuel subsidies). About 60% of this amount was provided by 38 developed countries and the remaining 40% by 103 developing countries. The proportion of estimated subsidies that contributed towards an increase in fishing capacity globally amounted to about US$15 billion, while subsidies that contributed to fisheries management and conservation programs were approximately US$7 billion. The remaining US$4 billion are defined as ugly subsidies, i.e., they may lead either to fisheries conservation or to overcapacity depending on the context. Japan and the EU were the highest subsidizers of their fisheries, with about US$4.2 billion and US$3.0 billion, respectively.
The results from this study have policy implications for fisheries subsidy reforms at the on-going WTO negotiations on rules to eliminate subsidies that cause overcapacity, and in achieving sustainable fisheries management. In conclusion, three major areas are highlighted for future research, the impact of subsidies on: (i) resource exploitation, (ii) industrial profits, and (iii) food sufficiency and livelihoods.
INTRODUCTION
Fishery subsidies are financial payments from public entities to the fishing sector, which help the sector make more profit than it otherwise would. Subsidies have gained worldwide attention because of their complex relation to trade, ecological sustainability and socioeconomic development. It is widely acknowledged that global fisheries are overcapitalized, resulting in the depletion of fishery resources. Although many reasons have been ascribed for the decline of fishery resources, the role of subsidies in the issue of overcapacity and overfishing cannot be sufficiently emphasized. These issues were reiterated at the WSSD (2002) in Johannesburg, the Doha 2001 Ministerial Conference (Doha Conference, 2001), by the FAO (1995) Code of Conduct and Responsible Fisheries, and in the Millennium Ecosystem Report (2005), and have thus prompted significant research interests.
1 Cite as: Khan, A., Sumaila, U.R., Watson, R., Munro, G., Pauly, D., 2006. The nature and magnitude of global non-fuel fisheries subsidies. In Sumaila, U.R., Pauly, D. (eds.), Catching more bait: a bottom-up re-estimation of global fisheries subsidies. Fisheries Centre Research Reports 14(6) , pp. 5-37. Fisheries Centre, the University of British Columbia, Vancouver, Canada.
6 Catching More Bait: a bottom-up re-estimation of global fisheries subsidies, Sumaila and Pauly (eds.)
Subsidies provided by governments have been identified as a driving factor for the build- up of excessive fishing capacity, thereby undermining the sustainability of marine resources and the livelihoods that depend on them (WWF, 2001). Subsidies that enhance revenue and those that reduce cost lead to a marginal increase in profit, thereby increasing participation and fishing effort (Sumaila, 2003). Subsidies that promote fishery resource conservation and management are however, regarded as good and necessary (Milazzo, 1998).
This contribution aims to contribute to our understanding of the present nature of fishery subsidies and to estimate the size and extent of subsidies worldwide. It is divided into five parts: Part I provides background information on the status of fish stocks, and presents the issues of concerns and lays out a set of research questions. Part II presents an overview of fishery subsidies and provides a set of criteria for identifying and categorizing fishery subsidies. Part III describes the methods and steps in computing fisheries subsidies globally. Part IV gives the results of the global magnitude of non-fuel fisheries subsidies, and delves into a discussion of the results by subsidy categories and geographic regions. Part V, finally, concludes with a summary of major findings, policy implications and suggestions for further research.
Appendix 1 presents the results of the subsidy estimates by geographic regions, and Appendix 2 presents an inventory of the subsidy programs for each maritime country worldwide.
BACKGROUND INFORMATION
Context: Status of global fish stocks
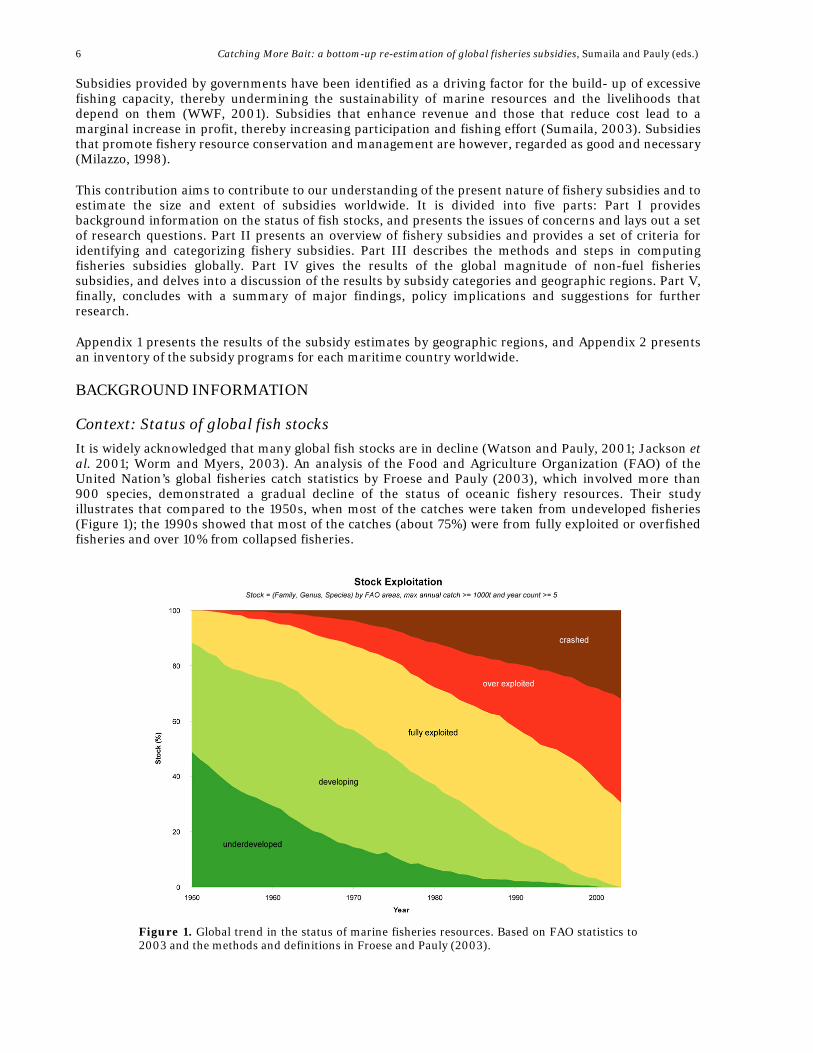
It is widely acknowledged that many global fish stocks are in decline (Watson and Pauly, 2001; Jackson et al. 2001; Worm and Myers, 2003). An analysis of the Food and Agriculture Organization (FAO) of the United Nation’s global fisheries catch statistics by Froese and Pauly (2003), which involved more than 900 species, demonstrated a gradual decline of the status of oceanic fishery resources. Their study illustrates that compared to the 1950s, when most of the catches were taken from undeveloped fisheries (Figure 1); the 1990s showed that most of the catches (about 75%) were from fully exploited or overfished fisheries and over 10% from collapsed fisheries.
Figure 1. Global trend in the status of marine fisheries resources. Based on FAO statistics to 2003 and the methods and definitions in Froese and Pauly (2003).

The nature and magnitude of global non-fuel fisheries subsidies, Khan et al. 7
The dire situation of many commercially important species, such as Southern Bluefin tuna (Thunnus maccoyi) and Northern cod (Gadus morhua), led the World Conservation Union (IUCN) to add these to its ‘Red List’ of critically endangered and vulnerable species, respectively
(IUCN, 2003). The number of
threatened fish species for both the endangered and vulnerable categories increased from 144 to 238 and from 452 to 682, respectively, for the years 2000 to 2006 (IUCN, 2006). Furthermore, fishing effort increasingly targets species lower down the marine food web, such as sardines, herring and anchovies (Pauly et al. 1998). Such ‘fishing down of marine food webs’ greatly disrupts the structure of marine ecosystems, simplifying their food webs and consequently lowering the resilience of ecosystems to environmental variations, and further increasing the risk of collapse.
Despite the collapse of major world fisheries within the past couple of decades, the global expansion of fishing effort has continued unabated and trade in fish products has intensified to the extent that they have become one of the most globalize commodities (Sumaila, 2002). Fisheries today are an important source of food, contributing about 19% of animal protein for human consumption, a valuable source of foreign exchange; with more than 60% of global fish production from developing countries (FAO, 2002). The fishery industry is now global in scope, employing close to 200 million people worldwide, with international trade of fisheries products reaching over US$ 50 billion per year (Vannuccini, 2003). Commercial fisheries are driven by global markets with capital flows being largely unregulated and tied to multinational investments (NOAA, 1999). The result is that “over 75% of the world catch is sold and consumed in other countries, rather than the countries in whose EEZ the fish were landed” (Hempel and Pauly, 2002). However, global landings are in decline from a peak of 80 million tonnes since the late 1980s (Watson and Pauly, 2001).
It has been suggested that this crisis is the result of unspecified environmental changes (Sinclair et al. 1997). However, an examination of the history of fisheries reveals that overfishing by humans is one of the fundamental causes of the decline of marine species (Jackson et al. 2001; Pauly et al. 2002). Factors that drive this overfishing include the increasing demand for fish, international global fish trade, poor management and ineffective monitoring of open access fisheries, illegal, unreported and unregulated (IUU) fishing, technological innovations, short term economic and social pressures, subsidies and overcapacity (Sumaila, 2002).
The contention that the depletion of fishery resources should lead to rising prices and consequent reduction in consumption has not been well supported (Sadovy and Vincent, 2002). This is partly due to the prevalence of subsidies, which distort market price. Global negotiations on trade issues in fisheries have led to the identification of subsidies and non-tariff barriers as areas of concern. Political considerations, however, make global wholesale change in ‘perverse’ subsidies unlikely (Stone, 1997). At present, plans and calls to action for the use of sustainable fishery techniques, the reduction of harmful subsidies, and the minimization of by-catch and discards are meeting a strong opposition (Butcher, 2002).
Given this bleak state of the marine fisheries worldwide, there is a growing recognition that the management of fisheries must be put in an ecosystem context (Pauly et al. 2002; Pikitch et al. 2004), which includes creation of marine protected areas. Other solutions to the global fishery crisis includes right-based fishery management, eco-labeling of fishery products, reduction of fishing capacity and the abolition of fishery subsidies which contributes directly to the overcapacity problem (Pauly, 2005a).
Issues: Overcapacity, overfishing and fisheries subsidies
One of the most severe impediments to responsible fishing is that on a global scale, there are too many vessels chasing too few fish (Porter, 1998; Cunningham and Gréboval, 2001). The FAO (2003a) International Plan of Action for the Management of Fishing Capacity (IPOA-Capacity) calls on states to achieve an efficient, equitable and transparent management of fishing capacity to reduce, and eventually eliminate, all factors, including subsidies, which contribute, directly or indirectly, to the build-up of excessive fishing capacity (FAO, 1998). According to Milazzo (1998), capacity refers essentially to vessels, gears and labor and how all of these are put to use. Excess capacity (i.e., overcapacity) can be defined as the difference between current fishing capacity and target capacity (FAO, 1998). Fishery subsidies contribute to overcapacity and overfishing in two major ways:

8 Catching More Bait: a bottom-up re-estimation of global fisheries subsidies, Sumaila and Pauly (eds.)
i. Subsidies that reduce the cost of fisheries operation both in terms of capital and operational cost provides an incentive for fishers to increase their catch and profit, with an aggregate impact to further stimulate effort and compound resource overexploitation problems (Milazzo, 1998);
ii. Revenue enhancing subsidies makes fishing enterprises far more profitable even when the fishery resources are in decline (Pauly et al. 2002).
The consistent conclusion from a number of studies and reports (FAO, 1992; Milazzo, 1998; OECD, 2000; FAO, 2000; WWF, 2001; Munro and Sumaila, 2002) is that overcapacity exists worldwide, with government subsidies contributing to the problem. Government assistance takes all forms, including state-owned enterprises and parastatals, direct capital infusion, financing assistance and preferential tax treatment, market promotion, government management and research, and negotiating access agreements for distant water fishing operations (NOAA, 1999).
Fishing gear and vessel technology has achieved the capacity to radically impact the marine ecosystems with fishing fleets becoming so powerful as to overexploit essentially all stocks in the world (Sumaila, 2002). Global fishing fleets were estimated to be more than twice what the oceans can sustainably support (Porter, 1998), with some current estimates even higher (Pauly, 2005a).
Within the recently hit tsunami regions of South East Asia, there were concerns about the potential harmful build-up of excessive fishing capacity as some of the region's coastal fisheries were already overcapitalized prior to the disaster (Pauly, 2005b). The European Union (EU) Fisheries Council in July 2004 voted for the promotion of European investments and the transfer of technology and vessels to developing countries, which would be detrimental to sustainable fisheries management (CFFA, 2005). In the Gulf of Guinea, it has also been demonstrated that providing subsidized fishing access by the European Union to fishing fleets in countries with poor control measures may lead to stock depletion2. With the recently concluded New Partnership for African Development (NEPAD) Fish for All Summit in Abuja (August, 2005) and the World Bank ‘profish’ Partnership, the issue of fisheries subsidies have gained new momentum.
The overcapitalization of the fishing industry is in turn the result of a number of factors, including the classic tragedy of the commons (Hardin, 1968), a self-defeating race to grab dwindling fish stocks. The massive payments made by a number of governments to support their national fishing industries are, however the main cause, with high levels of fishery subsidies worldwide significantly contributing to the present poor status of fishery resources (WWF, 2001). Recommendations from a coalition of NGOs concerned with marine conservation called the Green Group during the 2005 Hong Kong World Trade Organization (WTO) Ministerial Meeting included:
• Strong disciplines under the WTO Agreement on Subsidies and Countervailing Measures (ASCM) on the prohibition of harmful subsidies that lead to overcapacity, overfishing and IUU fishing;
• Significant improvements in transparency and accountability in subsidy reporting and effective WTO notification requirements;
• Appropriate treatment of the special concerns of developing countries and small-scale fishers; • Recognition of subsidies that improve fisheries management by reducing fishing capacity and
effort, minimizing by-catch and promoting important policy goals.
Research Questions
The specific research questions for this study include:
i. What are the types and categories of fishery subsidies provided worldwide? ii. What is the present amount and extent of each subsidy type (with the exception of fuel) nationally,
regionally and globally? iii. What proportion of the estimated subsidies contributes toward the increase in fishing capacity?
2 http://www.seaaroundus.org/Dakar?ScientificDocs.html last accessed 01/12/04

The nature and magnitude of global non-fuel fisheries subsidies, Khan et al. 9
Justification
Fishery subsidies are topical because of the concern that they contribute directly or indirectly to overcapacity and overfishing. Previous global estimates of fishery subsidies have ranged from US$ 14-20 billion (Milazzo, 1998) to US$ 54 billion (FAO, 1992). Reports by two respected intergovernmental bodies—the Organization for Economic Cooperation and Development (OECD) and the Asia-Pacific Economic Cooperation (APEC)—have produced significant new data (WWF, 2001). Regional estimates have also been provided for the Asia Pacific Rim of about US$ 12 billion (APEC, 2000) and for the North Atlantic at about US$ 2.5 billion (Munro and Sumaila, 2002). A better and more robust estimate that is composed of various subsidies, in both the industrial and small-scale sectors is needed, so that policy makers can target reducing specific harmful subsidies. Currently, within the OECD, fishery subsidy data are published annually as part of the review of fisheries and country statistic bulletin (OECD, 2004; 2005). In other regions, such as the Pacific Island States and the Caribbean Islands, subsidies are reported in the grey literature and usually not quantitatively (Haughton, 2002). Studies and reports done on fishery subsidies and other related issues in the Gulf of Guinea, including those by Mabawonku (1990), Everett (1994), Kaczynski and Fluharty (2002), Alder and Sumaila (2004) and United Nations Environment Program-UNEP (2004a) are either limited in scope or qualitative in nature. Two research areas remain little explored: (i) subsidies provided by donors to developing countries under international aid / bilateral agreements, and (ii) domestic subsidies provided within both the small-scale and industrial fisheries sector in developing countries.
There is also a need for a comprehensive inventory of fishery subsidies both regionally and globally, as well as a current estimation of the magnitude considering all coastal countries for marine capture fisheries. The results of this research is an improvement on existing global subsidy estimates, which will provide a basis for further studies on subsidies and fisheries sustainability.
THE NATURE OF FISHERY SUBSIDIES
Antecedents
Fishery subsidies provided by governments in the early 1930s and 1940s were originally intended towards investment in the fishing sector – the “infant industry” argument (Schrank, 2003). With rapid technological advancement in boat building, gear design and preservation methods in the early 1940s to the 1970s, and the inclusion of 200 nautical miles under national jurisdiction (FAO, 1992), fishery subsidies acted as catalysts for the ‘race to fish’ phenomenon.
The global subsidy debate was prompted by the FAO in the early 1990s in preparation for the May 1992 Conference on Responsible Fishing in Mexico (Milazzo, 1998). The FAO (1992) made an argument that subsidies are a major causal factor in the creation and perpetuation of excess fishing capacity, with a gross estimate of global fisheries subsidies of about US$ 54 billion. A further review of a wide range of direct and implicit assistance programs that encourage and promote the building, repair, modernization, and operations of the world's fishing fleets was done by Milazzo (1998) with an estimate of about US$ 14-20 billion accounting for about 20-25 % of landed value. Regional fisheries subsidy estimates by APEC (2000), and Munro and Sumaila (2002), have to shed more light on these issues.
Attempts were earlier made in the OECD and the WTO to fashion rules that could be applied to fisheries subsidies (Milazzo, 1998). In the OECD, the context was shipbuilding negotiations; in the WTO, it was the Uruguay round agreement on agriculture. In both instances, the fisheries sector was explicitly excluded. This led to New Zealand’s submission3 to the WTO highlighting the implication of fishing subsidies for fishers, vessel builders and vessel owners, and the enhancement and expansion of fishing fleet capacity. A submission by the United States4 also raised the issue of overcapitalization and overfishing and raised concerns about ecological impact and the need for conservation measures.
3 WT/CTE/W/52 Committee on Trade and the Environment - Item 6: The Fisheries Sector - Submission by New Zealand. http://docsonline.wto.org/gen_home.asp?language=1and_=1, last accessed 10/08/06. 4 WT/CTE/W/51 Committee on Trade and the Environment - Item 6: Environmental and Trade Benefits of Removing Subsidies in the Fisheries Sector - Submission by the United States. http://docsonline.wto.org/gen_home.asp?language=1and_=1, last accessed 10/08/06.

10 Catching More Bait: a bottom-up re-estimation of global fisheries subsidies, Sumaila and Pauly (eds.)
During the WTO Uruguay round of negotiations, fisheries were discussed in the negotiating group as natural resource based products, based on the recommendations from a working party report (Milazzo, 1998). Fishery issues were moved to the market access group along with other negotiating subjects. As a result of the Uruguay round, fisheries subsidies were therefore included under the remit of the WTO agreement on subsidies and countervailing measures, which covers all goods except for agriculture (Porter, 2004).
Further impetus for the inclusion of fisheries subsidies in trade negotiations developed from the emergence of a broader international coalition in support of subsidy reforms in the fisheries sector, because of the overcapacity problem. Following this, ‘The Friends of Fish’, a group of states including Australia, Iceland, New Zealand, Norway, Peru, Chile, the Philippines and the United States, was formed to work on the inclusion of fisheries subsidies in the multilateral trade round5. Also, fishing interests in developing countries centered on the implication of heavily subsidized fishing fleets from wealthier nations out competing with local fishers in developing countries in meeting food security needs (Sumaila, 2003; Stokkes and Coffey, 2003).
The WTO agreement on subsidies and countervailing measures represents a significant improvement in the rules and disciplines governing both the use of subsidies and countervailing measures to offset their effects. This agreement constitutes the existing international legal regime governing subsidies in the fisheries sector; and applies to more than 140 WTO member countries. The creation of the WTO Committee on Trade and Environment reflected an effort by the WTO to be more sensitive to trade implications of environmental policy measures, which has allowed discussions on the potential environmental advantages of eliminating harmful subsidies.
Among subsidies that are to be reported to the WTO, only that contingent on export performance or which favor domestic over imported goods are prohibited. Other subsidies can be actionable under the ASCM, if they can be shown to have adverse effects on the interests of another party (WTO, 1994). According to WWF (2001), notifications to the WTO of fishery subsidies have been very limited in terms of the amount of subsidies reported, the range of subsidies covered, and the quality of information provided. Stone (1997) further pointed out that several key concepts in the ASCM are defined in ways which make it difficult to determine whether many of the most prolific government expenditures and other interventions in the fisheries sector fall within the domain of the agreement. A central challenge for WTO subsidy reform is to clarify which part of a large grey area should be placed definitely in the class of government financial transfers (GFT), which should be disciplined under WTO rules (Stokke and Coffey, 2003).
Fishery subsidy issues are now widely addressed worldwide by national agencies; inter governmental organizations including the Organization for Economic Corporation and Development (OECD, 2000) and the Asian Pacific Economic Community (APEC, 2000); and regional organizations including New Partnership for African Development (NEPAD), the Caribbean Community (CARICOM), Associations of Southeast Asian Nations (ASEAN) and the South Pacific island nations. The roles played by the International Centre for Trade and Sustainable Development (ICTSD) and of a coalition of NGOs such as the World Wildlife Fund for Nature, BirdLife International, Greenpeace, The Fisheries Secretariat and Oceana, on public outreach and advocacy on these issues cannot be emphasized.
The issue of subsidies that leads to IUU fishing and fishing overcapacity was addressed by the UN General Assembly in its resolution 59/25 of 17 November 2004 and, more recently, at the sixth meeting of the United Nations Open-ended Informal Consultative Process on Oceans and the Law of the Sea6. The Millennium Ecosystem Assessment (2005) also highlighted the need to eliminate subsidies that promote excessive use of ecosystem services and, where possible, to transfer those subsidies to payments for non-marketed ecosystem services.
The work of the UN agencies, notably the FAO and the UNEP has probably been salient in bringing understanding and dialogue on fisheries policy reforms. This has culminated in a multi-stakeholder workshop7, reports by UNEP (2002; 2003; 2004b), and expert consultations in partnership with international agencies by FAO (2000; 2001; 2003b). These efforts have also brought particular attention
5 An opposition bloc, the ‘friends of fishers’ have formed in Europe, with Spain and France as leading members. 6 http://www.un.org/Depts/los/consultative_process/consultative_process.htm, last accessed 10/08/06. 7 http://www.unep.ch/etb/events/FishMeeting2004.php, last accessed 20/06/06.

The nature and magnitude of global non-fuel fisheries subsidies, Khan et al. 11
to the impacts of fisheries subsidies on developing countries, notably in relation to fishing agreements and food sufficiency issues. Subsidies towards fishing access agreements and their impact in developing countries have been examined by Porter (1997), Acheampong (1997), Grynberg (1993), IFREMER (1999), Kaczynski and Fluharty (2002) and Mwikya (2006). Policy research conducted in collaboration with the Support Unit for International Fishery and Aquatic Research (SIFAR) has improved our understanding of the implication of subsidies and trade liberalization for four countries including: Guinea, India, Bangladesh and Vietnam (Bostock, et al. 2004).
The workshop on overcapacity, overcapitalization and subsidies in European fisheries in Portsmouth - UK in 1998 (see Hatcher and Robinson, 1999), concluded with an assessment of subsidies to the fishery sector and their effect on trade, and resource sustainability. In addition, the international workshop on fishing vessel and license buyback programs in La Jolla, California in 2004, concluded with numerous case studies on the benefits of decommissioning schemes in general. The workshop also stressed on the need for better design and implementation of such programs for effectiveness fisheries management. Attempts to provide empirical results on the impact of subsidies on fishery resources have been limited both in scope or time. Anderson (1986) showed the impact of subsidies on the cost and revenue structure in open access fisheries using the Gordon-Schaefer equilibrium model. The underlying theory still holds on the effect of subsidies even though most fisheries are not open access. Arnason (1999) proposed a model for fishery subsidies impact using a change in profits approach, considered far more effective than the government cost approach. This involves modelling resource and effort dynamics to understand the impact on fish biomass and profits. Chuang and Zhang (1999) reviewed subsidy schemes in Taiwan, and how they relate to fish stock sustainability and trade. Seijo (1999) further suggested exploring the potential effect of subsidies for technological development and gear selectivity and recruitment enhancement technologies, which are all relevant to sustainable fisheries management. The UNEP (2004b) provided a matrix approach of analysing the impact of subsidies on fishery resources using two main parameters, i.e., the degree of exploitation and the management system.
However, the data needed in analyzing the impact of subsidies on fishery sustainability requires amongst others, an understanding of the nature and extent of fishery subsidies in different regions. This comprehensive study will contribute significantly to an understanding of the current nature of fishery subsidies, and will provide an estimate of the present magnitude of fishery subsidies worldwide. The results of such an estimate, for each maritime fishing country, in major geographical regions, will be useful for policy reforms toward the reduction of overcapacity in marine fisheries worldwide and for long term socioeconomic development.
What are fisheries subsidies?
The FAO (2001) expert consultation on the economic incentives and responsible fisheries failed to come to an agreement on the definition of a fishery subsidy, partly because of conceptual issues relating to policy relevance and effects of subsidies (Steenblik, 1999; Schrank, 2003). Despite conceptual disagreements, the forms of government financial transfers (GFT) or subsidies that were prioritized were compatible with the conventional definition of subsidies espoused by the WTO: capital expansion such as vessel purchase or modernization grants, tax waivers and deferrals, and fish price support programs.
According to the Marine Resources Assessment Group-MRAG (2002), fishery subsidies may be given for different reasons depending on the government’s policy objectives. Broadly speaking, fishery subsidies are provided for the following reasons:
i. To support and develop local fishing industry; ii. To protect employment and to improve income distribution in fishing communities;
iii. To manage the marine environment (Cox and Schmidt, 2003).
Fisheries subsidy issues have been of interest to policymakers because of the potential impact of subsidies on trade, fishery sector development, social issues and the environment. What to include and exclude, therefore, in terms of the analysis of subsidy programs may change according to the reason for such an analysis (Cox and Schmidt, 2003). This also helps to explain the wide range of aggregated subsidy data that has been put forward by various organizations (Porter, 2002).

12 Catching More Bait: a bottom-up re-estimation of global fisheries subsidies, Sumaila and Pauly (eds.)
In economic terms, subsidies may be defined as “a payment by government to consumers or producers which makes the factor cost received by producers greater than the market price charged by producers” (Black, 1997). Schrank and Keithly (1999) defined a subsidy in terms of profits to industry as “any government program that potentially permits the firm to increase its profit through time beyond what they would have been in the absence of the government program”. According to MRAG (2000), producer subsidies may benefit richer groups such as industrialized fishing companies in developed countries at the expense of poorer fishing communities in developing countries.
The Organization for Economic Cooperation and Development (OECD) defines subsidies (GFTs) as the monetary value of government interventions associated with fisheries policies. Here, eight program classifications are recognized: (i) management, research, enforcement and enhancement; (ii) fisheries infrastructure; (iii) investment and modernization of vessels and gear; (iv) tax exemptions; (v) decommissioning of vessels and license retirements; (vi) expenditures to obtain access to other countries EEZs; (vii) income support and unemployment insurance, and (viii) other government financial transfers (OECD, 2000).
The Asian Pacific Economic Cooperation (APEC) describe subsidies as a combination of GFTs and support programs that fall within the auspices of the Pacific Economic Cooperation Council, with six generic modalities or types: (i) direct assistance to fishers and fisheries workers; (ii) lending support programs; (iii) tax preferences and insurance support programs; (iv) capital and infrastructure support programs; (v) marketing and price support programs; and (vi) fisheries management and conservation programs (APEC, 2000).
Milazzo (1998) categorized subsidies into budgeted and unbudgeted and further added cross-sectoral subsidies, conservation and resource pricing subsidies to his categories in obtaining a global estimate of US$ 15-20 billion (see Table 1).
Table 1: Estimates of global fisheries subsidy by major categories (Milazzo, 1998). Subsidy categories Major types Amount (US$ billion) Budgeted Subsidies • Development grants 3.5-4.5
• Domestic • State investment • Foreign access • Market promotion
• Price support • Foreign access payments Unbudgeted subsidies • Subsidized loans 6.0-7.0 • Loan guarantees • Loan restructuring • Fuel tax exemptions • Income tax deferral • Accelerated depreciation Conservation subsidies • Vessel/permit buybacks Cross sectoral subsidies • Aid to shipbuilders 1.5-2.0 • Targeted infrastructure Resource rent subsidies • User fees 3.0-7.0 Total (US$ billion) All types 14.0-20.5
Mabawonku (1990) in his analysis of subsidies in West Central Africa considers subsidies as a means by which certain economic objectives can be achieved in a cost-effective manner. The major types of subsidies identified were: (i) rebate on fishing inputs, (ii) provision of infrastructure, and (iii) fuel subsidies (see Sumaila, et al. 2006a). He argued that in many cases, subsidies and other economic instruments are used in various combinations to achieve specific economic objectives.
WTO (1994) define subsidies are direct or potentially direct transfers of funds from governments to firms or individuals (e.g. grants, loans, loan guarantees, equity infusions), government revenue foregone (e.g. tax waivers or deferrals), government provision of goods and services other than infrastructure at less than market prices, and government support of prices and incomes. To be a subsidy the action must confer a benefit on the firm or individual and must be specific to an industry or a group of industries. This

The nature and magnitude of global non-fuel fisheries subsidies, Khan et al. 13
definition, however, serves the purpose of setting a standard for fair international trade. There are two schools of thought on the impacts of subsidies which concern economists. One is the ‘injury-only’ school, which addresses the concerns from subsidized trade, and the other is the ‘antidistortion’ school, which focuses on the inefficient consequences of government interventions (Hufbauer and Erb, 1984).
According to the WWF (2001), determining the definition of ‘fishing subsidy’ is not a policy-neutral exercise, especially in the context of growing debate over calls for subsidy reforms. Broadly defined in environmental terms, subsidies include all government support to the fishing industry that may play a significant role in encouraging overfishing. However, the most comprehensive and widely accepted definition with a legal standing is that given by the WTO (GATT, 1994).
Subsidies identified and classified
There is no single criterion for classifying fishery subsidies; the various categories (Milazzo, 1998; OECD, 2000; APEC, 2000) mostly overlap depending on the nature of the subsidy and the purpose of classification. The complexity of this issue is based on the fact that there is no single agreement on what a subsidy is or how its effect can be measured. Subsides, support programs, financial support, economic assistance, and government financial transfers are just five of the most commonly used names for payments that governments provide to the fisheries sector.
The following guidelines were useful in identifying and assessing fisheries subsidies: (i) policy objective of the subsidy; (ii) the subsidy program descriptions; (iii) scope, coverage and duration; (iv) annual US$ amounts; (v) sources of funding; (vi) administering authority; (vii) subsidy recipients, and (viii) the mechanisms of transfer (FAO, 2003b; Westlund, 2004).
The objective criterion for the classification of a subsidy in this study lies in the potential impact on the sustainability of the fishery resource. The effect of a subsidy, however, depends on the status of the fishery and the management system in place. According to Munro and Sumaila (2002), economists have now come to regard fishery resources, like all other natural resources, as natural capital. A set of fishery resources in a particular region can be viewed as a portfolio of natural capital assets capable of yielding a stream of economic benefits (both market and non-market) to society through time. If natural capital is renewable then one can within limits engage in ‘investment’ in the natural capital assets, such as refraining from harvesting and allowing the resource to rebuild to a biological optimum. Similarly, one can also engage in ‘disinvestment’ in the natural resource, for example, through activities such as biological and economic overfishing that take the fishery resource away from its optimal use. Based on this theory three categories of subsidies can be identified: (i) ‘good’ subsidies, (ii) ‘bad’ subsidies, and (iii) ‘ugly’ subsidies.
Good subsidies
‘Good subsidies’ are programs that lead to investment in natural capital assets to a social optimum, which is defined here as the maximum allocation of natural resources to society as a whole, i.e., by maximizing economic rent. Good subsidies enhance the growth of fish stocks through conservation, and the monitoring of catch rates through control and surveillance measures to achieve a biological optimal use. Good subsidies are made up of the following two types:
i. Fisheries management programs and services: These are subsidy programs to ensure that publicly-owned fisheries resources are appropriately managed and that regulations are enforced (OECD, 2005a). Sub categories include: (a) monitoring, control and surveillance programs, (b) stock assessment and resource surveys, (c) fishery habitat enhancement programs, (d) implementation and maintenance of MPAs, and (e) stock enhancement programs.
ii. Fishery research and development (R&D): These are subsidy programs geared towards improving methods for fish catching and processing, and other strategies that enhance the fishery resource base through scientific and technological breakthroughs. Sub categories include: (a) fishery frame surveys, (b) oceanographic studies, (c) fishery socio-economic studies, (d) fishery planning and implementation, (e) setting fishery information systems, (f) creating database and statistical bulletin supportive of fishery management plans, and (f) setting up marine protected areas (MPA) and reserves.

14 Catching More Bait: a bottom-up re-estimation of global fisheries subsidies, Sumaila and Pauly (eds.)
Fisheries management programs and services have been questioned on the basis that the services mostly benefits the private sector, and not the public, i.e., the rightful owners of marine resources (WWF, 2001). However, most countries have justified it as their sovereign right to manage and conserve their marine resources within their EEZs as espoused under the United Nations Convention on the Law of the Sea (UNCLOS, 1980).
Bad subsidies
‘Bad subsidies’ are defined as subsidy programs that lead to disinvestments in natural capital assets once the fishing capacity develops to a point where resource exploitation exceeds the Maximum Economic Yield (MEY). This is equal to the maximum rent obtainable from the fishery, computed as the largest positive difference of total cost and total revenues. As such, MEY corresponds to an effort level lower than the maximum sustainable yield (MSY). Excessive disinvestment can lead in some cases to outright destruction of the natural resources (Bjorndal and Munro, 1998).
Fishery economics theory holds that, in an open access fisheries, in which fishing cost is assumed to be proportional to fishing effort, effort will continue to increase even though revenues per unit of effort are declining, and that ultimately revenues will decline until they equal costs (Gordon, 1954). The point at which total revenue equals total cost is commonly regarded as the bionomic equilibrium (BE), where both industry profits and resource rents have been completely dissipated (Figure 2). With subsidies, the fishing effort can actually exceed E3 (Sumaila, 2002).
MEY
MSY
BE
Total cost of fishing effort (TC)
Total Revenue (TR)
Fishing effort (E)
Total revenue and
Total cost ($)
E1 E2 E3
Max. rent
Figure 2: Gordon Schaefer bioeconomic model (Gordon, 1954).
Figure 3 demonstrates that subsidies that lower cost from TC1 to TC2, will also lower the bionomic equilibrium from BE1 to BE2, thus encouraging the growth of fishing effort from E3 to E4.

The nature and magnitude of global non-fuel fisheries subsidies, Khan et al. 15
TC1
TC2 BE2
BE1
TR
Total revenue and
Total cost ($)
E3 E4 Fishing effort (E)
Effect of cost-reducing subsidies
Figure 3: Schematic representation of how subsidies induce overfishing (see text).
Bad subsidies include all forms of capital inputs and infrastructure investments from public sources that reduce cost or enhance revenue and include the following types:
i. Boat construction, renewal and modernization programs: These support programs include lending programs below market rate and geared toward fishing vessel construction, renewal and modernization such as loan guarantees, restructuring and other lending programs. This subsidy type also involves support programs to enhance fishing technology from public funds for fishing enterprises, parastatals and firms;
ii. Fishing port construction and renovation programs: These support programs include public funds toward the provision of fish landing site infrastructures, port improvements for fishing fleets (APEC, 2000), harbor maintenance, jetty and landing facilities and low or free moorage for fishing fleets;
iii. Marketing support, processing and storage infrastructure programs: These are support programs towards market interventions such as export promotion, value addition and price support. They also include infrastructure investment programs from public funds toward processing and storage of fishery products and fish auction facilities;
iv. Fishery development projects and support services: These are support programs towards fisheries enterprises development. It also includes support programs such as the provision of institutional support and services, the provision of baits, and search and rescue programs. The nature and sources for such support programs are diverse and includes development grants and concession credit either from national sources or through bilateral and multilateral assistance programs;
v. Tax exemptions: These are subsidy programs for investment in the fisheries sector that have a direct impact on profits such as rebates and other government-funded insurance support programs including: (a) income tax deferral for fishers; (b) crew insurance (OECD, 2004); (c) duty free imports of fishing inputs; (d) vessel insurance programs, and (e) other economic incentive programs;
vi. Foreign access agreements: This program entails a combination of one of the following: (a) explicit monetary transfer; (b) the transfer of fishing technology, and (c) the provision of market access in another fishing country (OECD, 2005a). Out of these varied combinations, three types of access agreements can be identified worldwide: (i) reciprocal access; (ii) access for trade agreements, and (iii) access fees for third country agreements (Milazzo, 1998).
The aggregate impact of subsidies that enhance overcapacity and overfishing through increased revenues or profits is to further stimulate effort and compound resource overexploitation problems (Milazzo, 1998). Certain types of subsidies therefore create incentives for overfishing under certain management conditions (Munro and Sumaila, 2002).

16 Catching More Bait: a bottom-up re-estimation of global fisheries subsidies, Sumaila and Pauly (eds.)
Ugly subsidies
‘Ugly subsidies’ are defined as programs that have the potential to lead to either investment or disinvestment in the fishery resource. These subsidy programs can lead to positive impacts such as resource enhancement programs or to negative impacts such as resource overexploitation. Subsidies in this category include controversial ones such as fisher assistance programs, vessel buyback programs and rural fisher community development programs:
i. Fisher assistance programs: These are payments to fishers to stop fishing temporarily or to ensure income during bad times. These subsidies can also be given due to a lack of alternative employment opportunities in regions where fishing is the main activity (OECD, 2005b). This subsidy type could be revenue enhancing from government budgets and increase community dependence on government funds; or may reduce fishing pressure through retraining programs into other economic sectors. They include the following types: (a) income support programs; (b) unemployment insurance; (c) worker adjustment programs, and (d) fisher retraining, and other direct payments to fishers;
ii. Vessel buybacks programs: These are fishing capacity reduction programs including two types: (a) permit buybacks, and (b) license retirements. These subsidies reduce fishing pressure and foster resource management goals; however their effectiveness has been seriously questioned (Holland et al. 1999; Munro and Sumaila, 2002; Clark et al. 2005);
iii. Rural fishers’ community development programs: These consist of programs that are geared towards rural fisher development with an overall objective of poverty alleviation and food sufficiency. These programs include multiple stakeholder participation within local communities involving cooperatives, with assistance from donor agencies and NGOs for integrated livelihood development policy objectives. Despise such development policy objectives, a number of fisheries development donor consultations8 have concluded that projects concentrated on enhancing productive capacity in developing countries are contributing to overcapacity, and with poor rate of management success (SIFR, 1992).
In summary, three categories of subsidies with eleven program types are identified globally in this study:
A. ‘Good subsidies’ • Fisheries management programs and services; • Fishery research and development.
B. ‘Bad subsidies’ • Tax exemption programs; • Foreign access agreements; • Boat construction renewal and modernization programs; • Fishing port construction and renovation programs; • Fishery development projects and support services; • Marketing support, processing and storage infrastructure programs.
C. ‘Ugly subsidies’ • Fisher assistance programs; • Vessel buyback programs; and • Rural fishers’ community development programs.
Although fuel tax rebates can be classified as a sub category of tax exemption, this study does not consider subsidies towards vessel fuel usage, which have recently been estimated at about US$ 6.5 billion by Sumaila et al. (this volume).
8 http://www.onefish.org/global/archive/sifar/onefish.htm, last accessed 12/08/06.

The nature and magnitude of global non-fuel fisheries subsidies, Khan et al. 17
METHODOLOGY FOR COMPUTING SUBSIDY ESTIMATES
Data collection and compilation
Information was recorded on 144 coastal countries for the eleven fishery subsidy types identified in this study. Overseas territories of European countries, whatever their legal status, are not included in this study9. Within a matrix framework, quantitative data was collected and recorded in each cell for any given country and subsidy type, and summed to provide subsidy category totals.
The coastal countries were grouped (using the UNDP Human Development Index-HDI) into two categories: developed (Group I) and developing (Group II) countries. The HDI10 is a composite index that measures country’s development by taking into account three basic components of human development: (i) longevity; (ii) level of education; and (iii) standard of living. Longevity is a measure of life expectancy, level of education is measured by a combination of adult literacy (two-thirds weight) and mean years of schooling (one-third weight), and standard of living is measured by real GDP per capita at purchasing power parity.
Countries with HDI scores ranging from 0.80-1.00 were classified as Group I, and those with HDI scores from 0.00-0.79 were classified as Group II. Some adjustments were made to this general rule, i.e., Russia, China and Taiwan with HDI of less than 0.80 were nonetheless assigned to the Group I category. This is due to their highly developed industrial fishery sectors and high public expenditures in this sector. This step lessened problems of outliers in statistical estimations for the two country groupings. Similarly, countries such as Trinidad and Tobago, Cuba, and Uruguay with HDI scores greater than 0.80 but with less developed fishery sectors were placed in Group II. Out of the 144 coastal countries, 38 countries were categorized in Group I (developed) and the remaining 106 countries were categorized in Group II (developing). Sumaila et al. (this volume) used the same categorization, and hence their fuel subsidy estimates can be added to those presented here by categories.
Fishery subsidy data were compiled mainly from secondary sources in the primary and grey literature, including newspaper articles. Internet web resources and search tools were also widely utilized. The study targeted information on the major fishing nations around the world in all six FAO fishery regions (Africa, Asia, Europe, North America, Oceania, South and Central America plus Caribbean). They were obtained mainly through the publications of intergovernmental organizations and multilateral agencies.
The first step was targeted at developed countries’ fisheries subsidy statistics available from intergovernmental agencies. The next effort was targeted at developing countries statistics through publications of multilateral agencies such as the FAO and UNEP, intergovernmental organizations such as CARICOM, and at individual country levels.
Data were obtained from the following major sources: (a) Organization for Economic Cooperation and Development (OECD, 2000; 2004; 2005); (b) Asian Pacific Economic Cooperation (APEC, 2000); (c) European Commission (www.europa.eu); (d) Food and Agricultural Organization of the United Nations (FAO), web resources on sections that dealt with ‘aid’ and ‘international cooperation’ under specific country profiles and ‘investment’ or ‘subsidies’ under the fisheries management information link for any given country (www.fao.org); (e) national fisheries department web links, financial and budgetary reports, and fishery reports and documents; (f) the web resources of the Support for International Fisheries and Aquatic Research, now known as the ‘onefish’ community directory program (www.onefish.org); (g) United Nations Environment Program reports (UNEP, 2002; 2003; 2004b); (h) regional financial institution portfolios such as the African Development Bank; (i) overseas development project reports on fishery issues such as the UK’s Department for International Development (DFID); (j) World Trade Organization (WTO) trade notifications; and (ix) NGO reports on marine issues, such as WWF (2001).
9 The reason is that the landings are summed up under the major countries within ‘territorial EEZs’ in the Sea Around Us Project database, from which landed values were obtained. For example, landings from the Azores and the Madeira Islands are grouped under Portugal. For each coastal country, four types of landings were considered (i) from their own EEZs (ii) from their territories’ EEZs (iii) landings from other countries’ EEZs (iv) from the high seas. 10 http://hdr.undp.org/reports/global/2003/pdf/hdr03_HDI.pdf Last accessed 12/06/06.

18 Catching More Bait: a bottom-up re-estimation of global fisheries subsidies, Sumaila and Pauly (eds.)
According to Insull and Orzeszko (1991), international assistance in fisheries is provided in the form of capital aid or technical assistance from bilateral cooperation, multilateral donors and regional financial development banks. Thus, for developing countries, fisheries subsidies were identified from both domestic and international sources, and data was collected from both the subsidy providers and the recipients.
Analysis of collected data
A database of ten subsidy types identified for 144 coastal countries engaged in fishing activity in the year 2000 was created, spanning 1995 to 2005. Even though this is a static analysis for the year 2000, for countries for which year 2000 data was not available, the closest available data within the period 1995 to 2005 was used. The data from years prior or after 2000 were normalized to constant 2000 US dollars by applying the consumer price index (CPI), extracted from the International Financial Statistics website11. The estimate for the magnitude of fishery subsidies is therefore a static estimate, with the eleven year information used explicitly for data gaps.
For each data cell entry within the matrix, comments were provided on the year or duration of the subsidy program, the source(s) of information, the nature of the subsidy program, and the subsidy recipients. For each country where a subsidy was provided with information on the amount and duration, the absolute annual amounts in United States dollars (US$) were recorded in the database. This information is referred to as ‘known subsidy amounts’. In the OECD (2004) report, from which subsidy amounts were obtained, the government financial transfer (GFT) categories were reclassified under the eleven types of subsidies identified in the study. The values of the GFT from this report were converted from OECD member countries’ local currency to US$. This study focuses on marine capture fisheries only, and subsidies within other fishery sectors such as aquaculture and inland capture fisheries were not considered.
Several steps were taken to normalize the available data: (a) subsidy programs towards capital cost such as infrastructure were annualized by considering depreciation costs (if available), or by using World Bank statistics; (b) subsidy programs towards fishery projects were assumed to last five years if the project cycle was not provided; (c) subsidy programs in the form of concession loans were calculated on the basis of forgone interest rate. For instance, the African Development Fund of the African Development Bank provides interest-free loans for artisanal fishery rural development projects, fisheries harbor complexes and fish markets. The real subsidy benefit were calculated as the market cost of the loan less the total cost of subsidized loan which is estimated at 4%-5% of the principal loan amount. This estimate however, depends on available information on subsidized lending such as: (i) the subsidization rate; (ii) the amount of reduced interest rate; (iii) the time of maturities associated with government-guaranteed loans; and (iv) the amount of forgiven loans. According to Milazzo (1998), in the absence of such information, 10% of the principal amount is a better measure of benefits for all subsidized lending. The 10% rule by Milazzo (1998) is applied when information on subsidized loans was not available.
Three types of data cell entries can be found in the matrix worksheets: (i) cell entries with annual subsidy figures, i.e., known amounts; (ii) cell entries where subsidies are known to exist but without absolute figures; and (iii) cell entries where information was not available.
Out of the 144 countries under investigation, subsidy information (both qualitative and quantitative) was collected for 141 countries ranging from one to all ten subsidy types identified above. Croatia, Lebanon and the Democratic Republic of Congo had no information on fishery subsidies, and they were assumed not to provide any.
The total available subsidy amounts for the ten identified subsidy types (excluding fishing access agreements), was US$ 11.0 billion. Data were mostly obtained from developed countries, amounting to about 85% of the collected information. Developed countries also contributed about 60% of global total landed values in year 2000. The bulk of the information from developing countries was qualitative, (i.e., with unknown amounts), for which estimates are provided below (see section 3.3).
Payments for fishing access are provided by only a few countries, mostly the EU, USA and some Asian countries, including Japan, China, Taiwan and South Korea. The most significant is the European Union – African, Caribbean and Pacific Countries (EU-ACP) fishing agreement, which involves lump sum
11 http://pacific.commerce.ubc.ca/ifs/ , last accessed 28/06/04.

The nature and magnitude of global non-fuel fisheries subsidies, Khan et al. 19
payments from the EU to the African, Caribbean and Pacific countries. Other kinds of payments from the US and Japan included access fees for tuna fishing fleets to the Pacific Island States. MRAG (2000) reported that the EU devotes one third of its budget to these agreements, resulting in a subsidy of some US$ 400 million in total. These foreign agreements are funded mainly for the benefit of Spanish, French and Portuguese fleets (see Milazzo, 1998). Spain has been particularly successful with EU assistance subsidies for joint ventures, with over 250 vessels in 22 countries with catches reaching 190,000 tons (MRAG, 2000). The EU lump sum payments to its member countries are prorated by LV with about 60% of the amount to Spain, France and Portugal and the remaining 40% to the rest of the EU membership. The known subsidy amounts for fishing access payments are about three quarter billion (Milazzo, 1998), which was scaled up to about a billion considering other payments from Russia, China, USA, Taiwan and South Korea (Milazzo, 1998; MRAG, 2000; Mwikya, 2006).
Filling the data gaps
Out of the 1152 cell entries12 within the global subsidy matrix worksheets, 22% are known subsidy data entries (252 cells), and 34% of the data cell entries were qualitative with unknown quantities (396 cells). The remaining 44% were cell entries where subsidy information was not available (504 cells). Given this absence of information, the 504 data cells were assigned zero amounts, i.e., the assumption was made that subsidies were not provided. Estimates were computed for the 396 data cell entries where subsidies were reported, but with unknown amounts (Figure 4).
For each country with annual subsidy amount, a ratio of the known subsidy amount to the country’s total landed value (LV) was obtained. The expressed ratio of subsidy amount per LV was then averaged for each group of countries, i.e., developed (Group I) and developing countries (Group II) to obtain a group mean. The group mean for each subsidy type was noted, and used for the data cells where subsidies were reported, but with unknown amounts. Here, subsidies were estimated as the group mean multiplied by the 2000 LV for the country in question. The LV for the year 2000 is obtained from the Sea Around Us Project database13. The LV data is computed as the ex-vessel price multiplied by the country landings (see Sumaila et al. 2006b).
The magnitude of global fishery subsidies is the sum of the data cell entries for both the known subsidy amounts and the estimates for the unknown amounts.
12 Data entries for fisher assistance programs and vessel buybacks are limited to Group I countries and rural community fishery development program entries was limited to Group II countries; thereby excluding 288 data cell entries with no information. 13 http://www.seaaroundus.org/eez/eez.aspx Last accessed July 13th, 2006.

20 Catching More Bait: a bottom-up re-estimation of global fisheries subsidies, Sumaila and Pauly (eds.)
0 10 20 30 40 50 60 70 80 90
Fish. mngt programs & serv ices
Fisheries R&D
Boat construct. &modernization
Fish. port construct. &renovation
Market./process./storageinfrastruct.
Tax exemptions
Vessel buy backs
Fisher assistance
Fish. dev . projects & serv ices
Rural fish. communityprograms
Total number of countries for which data were estimated
Dev eloping countries
Dev eloped countries
Figure 2: Number of data cells for which subsidy estimates were computed.
RESULTS AND DISCUSSION
Global total estimate of fisheries subsidies
The total magnitude of fishery subsidies in marine capture fisheries was estimated at US$ 25.7 billion for the eleven types of subsidies identified, excluding fuel subsidies. Table 2 shows that more than half of the total estimated subsidies were provided by developed countries (US$ 13.4 billion), with the rest being provided by developing countries (US$ 12.3 billion). The zeroes in brackets in Table 2 are subsidies for which data were not available, and which were assumed to be zero.
Table 2 also shows that, subsidies towards vessel buyback programs, fishing access agreements and fisher assistance programs were provided by developed countries only. Likewise, rural fishers’ community development programs are provided in developing countries only. Developed countries contributed about 80% to the estimated amount for fisheries management programs and services (US$ 5 billion). Boat construction, renovation and modernization programs in developed countries contributed about 60% of the program total amounting to US$ 1.2 billion.
The results further shows that developing countries provided appreciable amounts towards fishing port construction and renovation programs, about 86% of the program totals of about US$ 4.6 billion. Fishery development projects and support services from developing countries contributed significantly as well, about 85% to the global total of US$ 2.6 billion (US$ 2.2 billion). This result is well supported by Insull and Orzeszko (1991), who reported earlier on management type aid to the fishery sector in developing countries. This included capital aid projects and technical assistance provided and coordinated by multilateral agencies, international development agencies and regional development banks. At present, these wide ranging donor funded fishery development program activities can be located at a number of web resources including the OECD14, the DFID15 and the ‘onefish’ web portal16.
14 http://www.oecd.org/dataoecd/50/17/5037721.htm, last accessed 25/08/09. 15 http://www.fmsp.org.uk/fmsp/faces/Logout.jsp, last accessed 25/08/09. 16http://www.onefish.org/global/index.jsp , last accessed 25/08/06.
The nature and magnitude of global non-fuel fisheries subsidies, Khan et al. 21
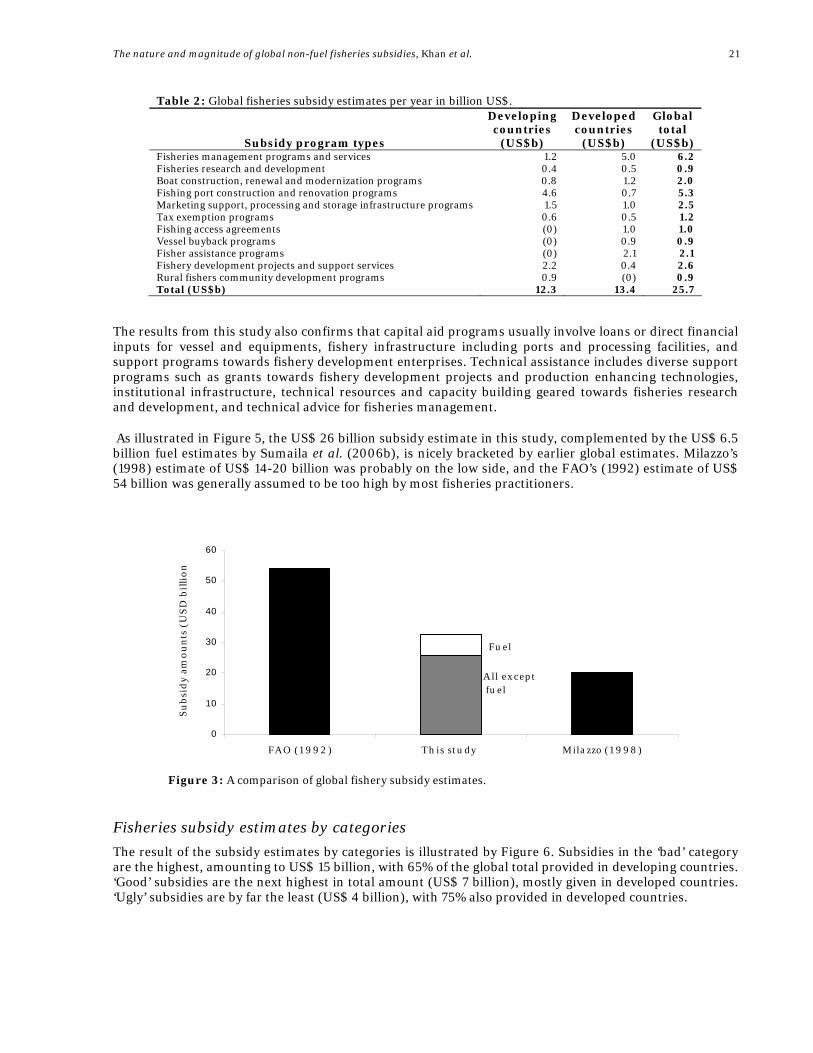
Table 2: Global fisheries subsidy estimates per year in billion US$.
Subsidy program types
Developing countries
(US$b)
Developed countries
(US$b)
Global total
(US$b) Fisheries management programs and services 1.2 5.0 6.2 Fisheries research and development 0.4 0.5 0.9 Boat construction, renewal and modernization programs 0.8 1.2 2.0 Fishing port construction and renovation programs 4.6 0.7 5.3 Marketing support, processing and storage infrastructure programs 1.5 1.0 2.5 Tax exemption programs 0.6 0.5 1.2 Fishing access agreements (0) 1.0 1.0 Vessel buyback programs (0) 0.9 0.9 Fisher assistance programs (0) 2.1 2.1 Fishery development projects and support services 2.2 0.4 2.6 Rural fishers community development programs 0.9 (0) 0.9 Total (US$b) 12.3 13.4 25.7
The results from this study also confirms that capital aid programs usually involve loans or direct financial inputs for vessel and equipments, fishery infrastructure including ports and processing facilities, and support programs towards fishery development enterprises. Technical assistance includes diverse support programs such as grants towards fishery development projects and production enhancing technologies, institutional infrastructure, technical resources and capacity building geared towards fisheries research and development, and technical advice for fisheries management.
As illustrated in Figure 5, the US$ 26 billion subsidy estimate in this study, complemented by the US$ 6.5 billion fuel estimates by Sumaila et al. (2006b), is nicely bracketed by earlier global estimates. Milazzo’s (1998) estimate of US$ 14-20 billion was probably on the low side, and the FAO’s (1992) estimate of US$ 54 billion was generally assumed to be too high by most fisheries practitioners.
A ll ex cept fu el
Fu el
0
10
20
30
40
50
60
FA O (1 9 9 2 ) Th is stu dy Mila zzo (1 9 9 8 )
Su
bsi
dy
amo
un
ts (
US
D b
illi
on
Figure 3: A comparison of global fishery subsidy estimates.
Fisheries subsidy estimates by categories The result of the subsidy estimates by categories is illustrated by Figure 6. Subsidies in the ‘bad’ category are the highest, amounting to US$ 15 billion, with 65% of the global total provided in developing countries. ‘Good’ subsidies are the next highest in total amount (US$ 7 billion), mostly given in developed countries. ‘Ugly’ subsidies are by far the least (US$ 4 billion), with 75% also provided in developed countries.

22 Catching More Bait: a bottom-up re-estimation of global fisheries subsidies, Sumaila and Pauly (eds.)
0
2
4
6
8
10
12
14
16
The Good The Bad The Ugly
Su
bsi
dy
esti
mat
es (
US
D b
illi
on
s)
Dev eloped cou n tr ies
Dev elopin g cou n tr ies
Figure 4: Fishery subsidy estimates by categories.
Appendix 1 details country estimates of good, bad and ugly subsidies by regions, with country subsidy intensity provided, i.e. subsidy as a percentage of landed value (LV).
Good subsidies
The total amount of good subsidies was estimated at US$ 7.1 billion, as the sum of two subsidies types: fisheries management and services, and fisheries research and development. The results for the good subsidies amounts reflects on the fact that in most developing countries with limited budgets, subsidies are obtained for fisheries management (including enforcement) and research and development mostly through international assistance programs. This is demonstrated by numerous international fishery research and management programs, such as the R/V Dr Fridtjof Nansen Resource Surveys. This program jointly funded by NORAD and FAO have conducted regional fish stock assessments spanning three decades in several developing countries in Asia, Africa, Latin America and the Caribbean (Saetersdal et al. 1999).
This study has established that a very large number of countries (about 95% worldwide) provided some form of management subsidies to their fishing sectors (see appendix 2, subsidy program compendium). With major commercial fish stocks in decline (FAO, 2004) and an increase in international trade of fishery products (Vannunccini, 2003), there is an increasing and concerted effort towards fisheries management and conservation programs, research and development globally (Hempel and Pauly, 2002). The notion that public management of fisheries can be a subsidy has generated significant debate among economists and policy makers, due to the role of the public sector in managing fishery resources as a public good, and transferring management cost to the private sector (WWF, 2001).
It is widely believed that subsidizing an open access fishery resource by reducing operational cost leads to overexploitation of the resource, but with negligible resource consequences in a privatized fishery (Sumaila, 2003). The argument for and against subsidies under privatized fishery has been widely debated (see Clark et al. 2005). Nonetheless, Milazzo (1998) commended user fees on fishery resources as a form of good subsidy, i.e., resource rent subsidies, since natural resources are typically under priced and overexploited. This is justified on the basis that user groups should meet the recovery cost of resource use and collateral environmental impacts. In some countries such as New Zealand and Iceland, user fees are instrumental in recovering government’s expense in managing the fishery. In Australia, about 2.5% of landed value is levied on domestic fishers operating in marine fisheries, whilst in Canada; the rate is about 5% of landed value for fisheries managed with individual quotas. Furthermore, Clark et al. (2006) suggested the use of right-based schemes in conjunction with taxes for effective fisheries management. The challenge however, lies in developing broad rules by which management cost can be recovered from resource users.

The nature and magnitude of global non-fuel fisheries subsidies, Khan et al. 23
Bad subsidies
The total amount estimated for the six subsidy types under the bad subsidy category was US$ 15 billion, with fishing port construction and renovation programs contributing up to 36% (US$ 5.3 billion), next to fishery development projects and support services amounting to 18% (US$ 2.6 billion) as shown in Table 3.
The fisheries subsidy debate has been topical because of the concern that some subsidies aggravate the management of fishery resources by increasing fishing capacity to an unsustainable level (Milazzo, 1998; Munro and Sumaila, 2002). A build up of excess fleet capacity generally results in economic waste and undermines the capacity of resource managers to manage fish resources sustainably (Sumaila, 2003).
FAO (2001) further illustrates the effect of subsidies on fishery profits using case studies in specific fisheries from both developing and developed countries. The findings showed that within the European Union and India, almost all types of vessels which received subsidies would also have been profitable without subsidies. The subsidies played a role, however, in significantly increasing their earnings and profitability, thus encouraging participation. In South Korea, the situation was ambivalent, while in Thailand, vessels that received tax exemptions on fuel required that exemption in order to make profits.
The now largely abandoned 2004 European Commission ban on subsidies for more powerful engines was a significant move towards sustainable management of fishery resources. The reform sought to restrict modernization or investment to the whole vessel except for the sole purpose of safety on decks. Gear replacement or renovations programs were to be funded within the context of recovery plans only, or in improving gear selectivity and in meeting sustainable environmental criteria. However, these reforms are undergoing a wave of disproval because of two new developments: (i) enlargement of the EU membership and the needs of new members in securing EU benefits in the areas of fisheries subsidies, and (ii) a worsening economic situation due to increasing fuel prices, eroding the viability of an industry already weakened by overcapacity and depleted stocks (Coffey, 2006). Most of the disapproval comes from a pro-subsidy coalition including France, Spain, Italy, Greece, Portugal, and two new members Poland and Estonia. This new group also known as the ‘friends of fishers’ have successfully requested aid to support engine replacements and general modernization. Moreover, a new proposal by some member states to outright reverse the 2002 EU subsidy reform that prohibits public aid to joint ventures and the exports of vessels to third countries is far more troubling; as this has been a turning point in phasing out damaging subsidies within both the WSSD and the WTO contexts (Coffey, 2006).
Certain types of subsidies such as vessel construction, renovation and modernization are contingent on countries that have a long history of industrial development (Milazzo, 1998). It is predominantly governments in the North that can afford to subsidize fisheries (Sumaila, 2003), both locally within their EEZs and internationally as distant water fleets (Hempel and Pauly, 2002). According to WTO notification, six countries provided over US$ 8.4 billion in aid to the shipbuilding sector in 1996, and in 1997 eight countries reported almost US$ 4.5 billion as shown in Table 4 (WWF, 2001).
There are three impacts of subsidies from the North on fish and fishers in the South: (i) they tend to distort prices and/or costs of fishing in favor of fishers in the North, with a consequent uncompetitive market; (ii) decommissioned vessels in the North posed a threat of vessel transfer to the South with fear of resource overexploitation and a threatened fisher livelihood; and (iii) the purchase of access rights by governments in the North is a subsidy that has negative consequences on the resource biomass and food security of people in the South (Sumaila, 2003).
Table 3: Estimate of bad subsidy types. Bad Subsidy types Amounts (US$b) (%) Boat construction, renewal and modernization programs 2 (14) Fishing port construction and renovation programs 5 (36) Marketing, processing and storage infrastructure programs 3 (17) Tax exemption programs 1 (8) Fishing access agreements 1 (7) Fishery development projects and services 3 (18) Total 15 (100)

24 Catching More Bait: a bottom-up re-estimation of global fisheries subsidies, Sumaila and Pauly (eds.)
The results from this study shows that fishing access payments for distant water fleets (DWF) are provided by only a handful of countries but with a significant share of world catches, including the EU, Japan, Russia, Korea, Taiwan, China and the USA, amounting to about a billion US$ (see Table 5). The access payments are in the form of (i) bilateral access such as the EU-ACP agreement, which involved financial compensation for a defined quantity of a specified fishery species. The EU also administers several joint ventures programs, and ‘trade for access’ arrangements to developing countries for preferential access to markets for various fishery products. In addition to these, Argentina signed a second generation agreement with the EU, which allows quota access to EU vessels in Argentinean EEZ (Mwikya, 2006); (ii) the US has negotiated the only multilateral tuna fisheries access agreements with seventeen pacific island countries. In 2003, the annual fee was US$ 21 million for approximately 16 purse seiners. About 86% of this amount is disbursed from the State Department and the 14% comes from the American Tuna Association (Mwikya, 2006); (iii) The Japanese and other far eastern distant water fleets from Korea, China and Taiwan usually fish under private access agreements with payments from the private sector organizations, as joint ventures or payments made in the form of aid from the governments. These payments are based on the amount of catch reported at specific ports, and the payments are often not disclosed. Milazzo (1998) reported payments from Japan towards DWF and securing fishing rights in developing countries to the tune of about US$ 200 million. China also continues its DWF and high seas fisheries policy with payments in the North pacific, Indian Oceans, off Western Africa and recently in the Caribbean (Milazzo, 1998; Bonfil et al. 1998).
Fishing access subsidies are not only subsidies under the terms of the WTO agreement, but also effectively contribute to the transfer of excessive fishing capacity from Northern to Southern waters, and thereby undermine the economic and conservation interests of coastal developing countries. Fishing access agreements pretend to reconcile trade and aid, but have barely contributed to the developments to the local fishing industries of the coastal states (Milazzo, 1998). These arrangements can be of mutual long-term benefit only if it is effectively enforced and measures are in place to ensure compliance (Atta-Mills et al. 2004). Most of the EU agreements signed with West African states, nonetheless, do not contain catch quotas for EU vessels and this usually results in resource overexploitation (Kaczynski and Fluharty, 2002). Between 1992 and 2000 EU companies signed 152 joint ventures involving 241 boats, representing about 88,319 GRT; these deals were highly subsidized by the EU. Half of these companies were Spanish, and the rest were Portuguese, Italian, Greek, French and Danish. As of 2000, these vessels were fishing in the waters of 28 countries; 77% of them in Africa, 22% in South and Central America and 1% in Europe (COFREPECHE, 2000). Bonfil et al. (1998) using Senegal and Mauritania to exemplify the problem of transfer of protein and wealth from developing countries to relatively rich DWF nations; they estimated that over 80% of the catch was taken by DWF nations from 1950 to 1994.
Fishery subsidies provided in developing countries are going through a transition from ‘capture component’, i.e., poorly managed, state controlled semi- industrial fisheries, to ‘export stimulating mechanisms’ (UNEP, 2002). According to Milazzo (1998), in developing countries, where government agencies responsible for fisheries generally have modest budgets, it appears that the bulk of subsidies are provided in the form of subsidized loans and tax breaks. Lately, in the 1990s, the emphasis has been on management aid and technical assistance programs in value adding and quality control, as shown by the results of this study and confirmed by other reports (see FAO, 2003c). This could also justify the huge
Table 4: World Trade Organization ship building notifications 1996-1997 in US$ million (WWF, 2001).
Country 1996 1997 Australia 19 17 Belgium - 2 Germany 500 99 Italy - 676 Japan 6,893 3,553 Norway 191 92 Portugal - 13 Spain 503 - United Kingdom 302 8 Total (US$m) 8,408 4,460
Table 5: Fishing access subsidy payments for 18 fishing nations.
Country
Access subsidies amounts
(US$’000) (%) Japan 200,000 (20)China 193,418 (19)Spain 124,910 (12)France 100,090 (10)Russia 70,878 (7)Denmark 48,736 (5)Portugal 45,000 (5)Korea 43,606 (4)United Kingdom 36,112 (4)Iceland 25,523 (3)Italy 22,937 (2)Taiwan 21,098 (2)US 21,000 (2)Netherlands 14,953 (1)Ireland 10,723 (1)Greece 7,041 (1)Germany 6,274 (1)Sweden 4,679 (~0)Belgium 1,726 (~0)Finland 1,297 (~0)Total (US$’000) 1,000,000 (100)

The nature and magnitude of global non-fuel fisheries subsidies, Khan et al. 25
investments in capital infrastructure and marketing programs, from both domestic and international sources (see Appendix 2).
Ugly subsidies
The total estimate of ugly subsidies worldwide is about US$ 4.0 billion, with fisher assistance programs in developed countries contributing more than 50%. Fisher assistance programs, though applauded for their social welfare objectives in many instances, have also been criticized for their role in creating a subsidy-dependent community.
The argument against fisher assistance programs is that it encourages fishers to stay in the fishing industry rather than leave it and diversify into other economic activities (Schrank, 2003). The impact of such subsidies is basically to artificially raise the price of harvested fish or reduce the cost of fishing (Munro and Sumaila, 2002). Subsidy policies that are directed either implicitly and/or explicitly at social objectives need to be analyzed to ensure that they do not hamper the effective management of fish stocks (OECD, 2005a). The policies should at least be coherent and mutually supportive for sustainable resource management.
With the decline of fisheries within the North Atlantic (Pauly and Mclean, 2003) and grossly overcapitalized global fleets (Gréboval, 1999), vessel buyback programs are generally regarded as good subsidies due to their capacity reduction goals (Milazzo, 1998). Buyback programs were estimated close to a billion US$ and provided only by developed countries. These programs though with good intent in reducing fishing capacity, have been criticized for their ineffectiveness as the fishing capacity usually seeps back into the fishery over time (Cunningham and Gréboval, 2001; Holland et al. 1999; Clark et al. 2005). Munro and Sumaila (2002) also pointed out that buybacks can be good when not anticipated by fishers, but bad when anticipated because fishers will accumulate effort in anticipation, thereby neutralizing the expected benefits. Furthermore, there is the general fear of a ‘spillover effect’ of vessels from one fishery to another either in the high seas or as distant water fleets into other EEZs (Munro, 1998). It has been reported that vessels decommissioned from the Canadian cod fishery, for e.g., were transferred to Argentinean waters (UNEP, 2003).
The EU for instance has developed sets of criteria and sustainability reference points for sustainable vessel buyback programs including: (i) an entry/exit ratio for the introduction of new vessels of 1 to 1; (ii) vessel buybacks supported by public aid non-replaceable; and (iii) for any new vessels over 100 GRT built with public aid, the entry/exit ratio should be 1 to 1.35 to counter technological advancement17. However, EU common fishing policy rules are often poorly enforced and monitored, resulting in breaches and infringements18 and the export of fishing capacity to other countries (Milazzo, 1998). According to COFREPECHE (2000), from 1992 to 2000, Kenya, Guinea Conakry and Angola had about 110%, 96% and 85% increase in GRT respectively, due to vessels imported as a result of EU joint venture agreements. An earlier common fisheries policy (CFP) Regulation (2371/2002) sought to strengthen the link between fleet management and public aid but without any success. This was because monitoring and control was ineffective, and aid was conditional upon compliance with reference points. With recent developments in the CFP such as vessel modernization, it appears that the EU may be stepping from some of the key subsidy reforms committed to a few years ago (Coffey, 2006).
Case study analysis in West Central Africa by Mabawonku (1990) demonstrated that fishery subsidies can achieve specific economic objectives, such as increasing income through the reduction of input prices (mainly for food) and the provision of infrastructure and services, such as extension and training. It is important from a sustainability perspective, to assess subsidies in small scale fisheries that would be directly ‘capacity-enhancing’ and to distinguish it from other subsidy types without such effects (Schorr, 2005).
Rural fisher community development programs in developing countries are synonymous to fisher assistance programs in developed countries; however, the major difference is that the former has livelihood program activities integrated within coastal communities. In several developing countries,
17 http://www.fao.org/fi/fcp/en/GBR/body.htm , last accessed 18/06/06. 18http://europa.eu/rapid/pressReleasesAction.do?reference=IP/06/992andformat=HTMLandaged=0andlanguage=ENandguiLanguage=en, last accessed 12/08/06.

26 Catching More Bait: a bottom-up re-estimation of global fisheries subsidies, Sumaila and Pauly (eds.)
excess capacity in the form of human capital or labor is likely to be more significant than capital in the form of fleets, particularly where barriers to labor mobility are commonplace (Clark et al. 2005). This is further exacerbated by intergenerational shift into fishing activities from other sectors (Tietze et al. 2000), and the lack of access to alternative income generating activities in several coastal communities. Subsidy support programs in such circumstances are regarded as unsustainable if they promote indiscriminate gear use by coastal fishers (Pauly et al. 1989; CECAF, 2000), and/or promote large excess of rural labor that may lead to Malthusian overfishing as shown in Figure 7 (Pauly, 1993; 1997; Teh and Sumaila, 2006). This can have negative impact in sustaining fishery resources and the very livelihoods they aim to support. To remedy such situation, Teh and Sumaila (2006) recommended the integration of food sufficiency program goals within a sustainable coastal management framework.
TC1
TC2
BE2
BE1
TR
Value of
catch ($)
E3 E4 Fishing effort (E)
Old costs
New costs
Excessive labor and subsidized gear
Figure 5: Subsidies and Malthusian overfishing (adapted from Pauly, 1997).
Also, the effect of subsidies and development assistance in most developing countries does not seem to meet the expected outcome of the intended policy goals (SIFR, 1992). For instance, most external assistance programs on research in developing countries tend to target high value species such as tuna for export rather than species that could be harvested by the local fishermen to supply domestic markets (Milazzo, 1998). Moreover, there are indications to show that some of the subsidy programs geared towards small scale fisheries development in general are intended to enhance fishing capacity to target commercial fish species for export (FAO, 1996; Khan, 1998) with a consequent shortage of protein to the local population (UNEP, 2002).
Fisheries subsidy estimates by region With seven geographical regions of the world identified (Sub Saharan Africa, Asia, North Africa and the Mediterranean, Europe, North America, Oceania, Latin America and the Caribbean), information is provided on the size and extent to which subsidies contribute to fisheries conservation programs and the increase in fishing pressure. Figure 8 illustrates that Asia provided the largest amount of subsidies, about US$ 11.6 billion, representing about 16% of total LV, and with more than 50% in the bad subsidies category. The next highest subsidizing region is Europe, with more than 50% in the bad subsidies category as well, representing about 22% of the total LV (see Figure 9 for regional subsidy intensity).

The nature and magnitude of global non-fuel fisheries subsidies, Khan et al. 27
0 1 2 3 4 5 6 7 8 9 10 11 12 13
Asia
Europe
Latin America & theCaribbean
North America
Sub Saharan Africa
North Africa & Mediterranean
Oceania
Subsidy amount (billion USD)
Good su bsidies Ba d su bsidies Ug ly su bsidies
Figure 6: Subsidy amounts, by major geographic regions.
Oceania provided the least amount of subsidies to its fishery, about US$ 755 million, with two of its regional members (Australia and New Zealand) being proponents for the ban of subsidies with the Friends of Fish Alliance.
0
5
1 0
1 5
2 0
2 5
3 0
3 5
4 0
Nor th A fr ica& Medit .
Su b Sa h .A fr ica
Nor thA m er ica
Eu r ope Ocea n ia A sia La t . A m er ic.& Ca r ib.
Subs
idy
inte
nsi
ty
Figure 7: Subsidy as a percentage of total landed value for major geographic regions.
In contrast to developed countries, industrial fisheries of many developing countries in Asia, Oceania, Africa etc., deal with the high capital investment and operating costs by one or more of the following: (i) national inputs: import or export duty waivers and concessions; (ii) bilateral or overseas development assistance: technical assistance in the form of infrastructure support; (iii) multilateral assistance such as marketing supports programs, and (vi) joint venture arrangements (UNEP, 2003).
A breakdown of the results of this study by subsidy categories provided by major fishing nations is illustrated in Figure 10, with Japan being the highest subsidizer (US$ 4.2 billion), representing 19% of its LV. Next are the EU, Russia, China, Peru and the USA in decreasing order; with subsidy intensity ranging from 4% in Peru to 23% in the USA (see Appendix 1 for a list of countries’ subsidy intensities).
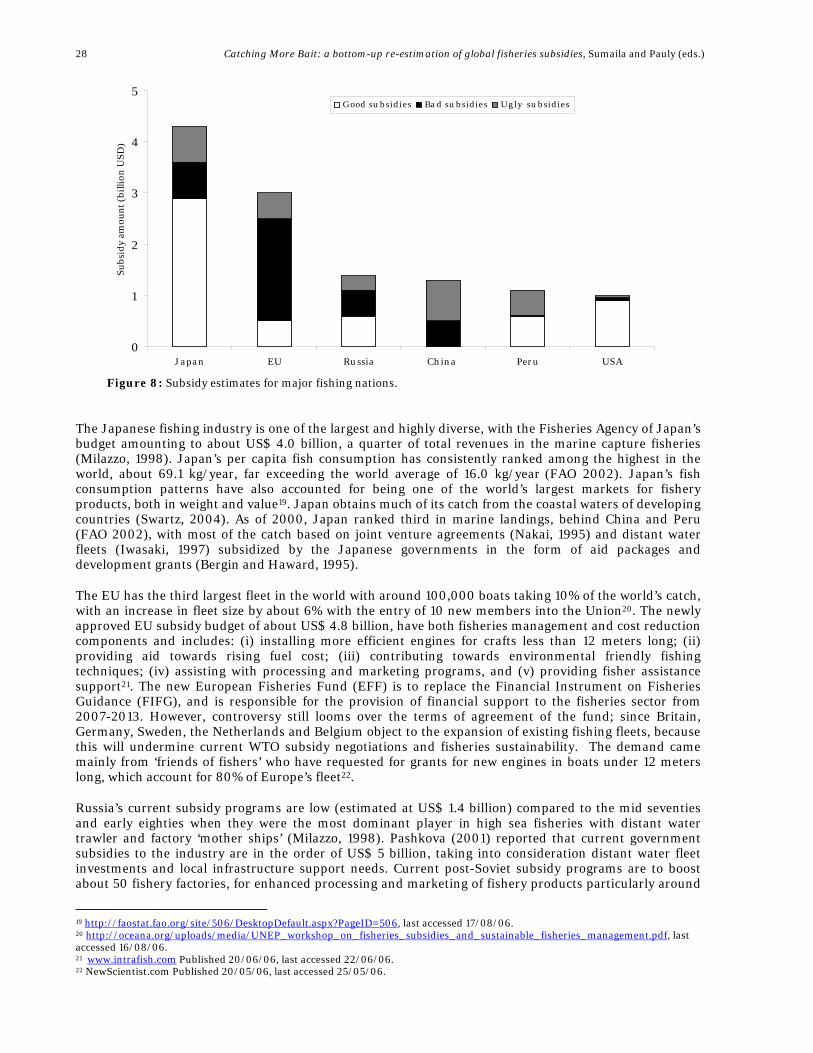
28 Catching More Bait: a bottom-up re-estimation of global fisheries subsidies, Sumaila and Pauly (eds.)
0
1
2
3
4
5
Japan EU Russia China Peru USA
Su
bsi
dy
amo
un
t (b
illi
on
US
D)
Good su bsidies Ba d su bsidies Ug ly su bsidies
Figure 8: Subsidy estimates for major fishing nations.
The Japanese fishing industry is one of the largest and highly diverse, with the Fisheries Agency of Japan’s budget amounting to about US$ 4.0 billion, a quarter of total revenues in the marine capture fisheries (Milazzo, 1998). Japan’s per capita fish consumption has consistently ranked among the highest in the world, about 69.1 kg/year, far exceeding the world average of 16.0 kg/year
(FAO 2002). Japan’s fish
consumption patterns have also accounted for being one of the world’s largest markets for fishery products, both in weight and value19. Japan obtains much of its catch from the coastal waters of developing countries (Swartz, 2004). As of 2000, Japan ranked third in marine landings, behind China and Peru (FAO 2002), with most of the catch based on joint venture agreements (Nakai, 1995) and distant water fleets (Iwasaki, 1997) subsidized by the Japanese governments in the form of aid packages and development grants (Bergin and Haward, 1995).
The EU has the third largest fleet in the world with around 100,000 boats taking 10% of the world’s catch, with an increase in fleet size by about 6% with the entry of 10 new members into the Union20. The newly approved EU subsidy budget of about US$ 4.8 billion, have both fisheries management and cost reduction components and includes: (i) installing more efficient engines for crafts less than 12 meters long; (ii) providing aid towards rising fuel cost; (iii) contributing towards environmental friendly fishing techniques; (iv) assisting with processing and marketing programs, and (v) providing fisher assistance support21. The new European Fisheries Fund (EFF) is to replace the Financial Instrument on Fisheries Guidance (FIFG), and is responsible for the provision of financial support to the fisheries sector from 2007-2013. However, controversy still looms over the terms of agreement of the fund; since Britain, Germany, Sweden, the Netherlands and Belgium object to the expansion of existing fishing fleets, because this will undermine current WTO subsidy negotiations and fisheries sustainability. The demand came mainly from ‘friends of fishers’ who have requested for grants for new engines in boats under 12 meters long, which account for 80% of Europe’s fleet22.
Russia’s current subsidy programs are low (estimated at US$ 1.4 billion) compared to the mid seventies and early eighties when they were the most dominant player in high sea fisheries with distant water trawler and factory ‘mother ships’ (Milazzo, 1998). Pashkova (2001) reported that current government subsidies to the industry are in the order of US$ 5 billion, taking into consideration distant water fleet investments and local infrastructure support needs. Current post-Soviet subsidy programs are to boost about 50 fishery factories, for enhanced processing and marketing of fishery products particularly around
19 http://faostat.fao.org/site/506/DesktopDefault.aspx?PageID=506, last accessed 17/08/06. 20 http://oceana.org/uploads/media/UNEP_workshop_on_fisheries_subsidies_and_sustainable_fisheries_management.pdf, last accessed 16/08/06. 21 www.intrafish.com Published 20/06/06, last accessed 22/06/06. 22 NewScientist.com Published 20/05/06, last accessed 25/05/06.

The nature and magnitude of global non-fuel fisheries subsidies, Khan et al. 29
the Murmansk region, one of the biggest fish processing complexes in the world (Euro Arctic news, March 11th 2006)23. The estimates for Russian subsidies may be on the conservative side.
Most of the subsidies provided by the USA as illustrated in Figure 10 are good subsidies, aimed at management and conservation purposes.
Research Limitations
The accuracy of the estimation techniques used in this study are determined by a number of factors: (a) the availability of information provided by most countries to multilateral and intergovernmental organizations, such as the FAO, OECD and APEC; (b) the type of normalization and standardization applied to the available data sets; (c) the appropriateness of grouping countries into developed and developing country categories based on economic indicators25; (d) the reliability in the secondary information collated without cross checking or validation; (e) the use of weighted averages based on countries landed value for interpolation purposes; (f) the criteria for excluding certain information from the estimates (e.g. subsidies towards aquaculture); (g) the taxonomy of subsidies used in the study; and (h) the nature of the data sources.
Despite the attempt in obtaining detailed information on all countries and on all types of subsidies, there have been several challenges and drawbacks. These include the following:
i. The WTO notifications on actionable subsidies submitted to the negotiation group mostly lacked information on specific amounts of the various subsidies reported. Table 5 shows that from 1995 to 2001, about 191 submissions were made (Cox and Schmidt, 2002);
ii. Information from WTO records does not reflect the true nature of the subsidies provided, nor is the values corroborated and updated. According to WWF (2001), the twelve countries with the largest total fishing subsidies officially reported by OECD (2000) and the APEC (2000) showed considerable discrepancies in their figures reported to the various intergovernmental organizations as shown in Table 5;
iii. Some under-reporting has also been noted and include the following:
23 http://www.sr.se/cgi-bin/euroarctic/amnessida.asp?programID=2460andNyheter=0andgrupp=2604andartikel=813284, last accessed 22/06/06. 24 NA: Not Available. 25 http://earthtrends.wri.org, last accessed 10/06/06.
Table 6: WTO fisheries subsidy notifications from 1995-2001.
Country24 Capture sector
Ship building Processing Others
Total No. by country
Canada 4 NA NA NA 4 Japan 6 NA NA 1 7 S. Korea 6 2 2 1 11 Norway 16 1 1 4 22 Philippines 1 NA NA NA 1 Poland 3 NA NA NA 3 Senegal 1 NA NA NA 1 Slovakia 1 NA NA NA 1 USA 5 NA NA NA 5 EU countries 75 9 9 34 127 Iceland 1 NA 1 3 5 Tunisia NA NA NA 1 1 Singapore 1 NA NA NA 1 Turkey 1 NA NA NA 1 Thailand NA NA NA 1 1 Total 121 12 13 45 191
Table 7: Some discrepancies in fisheries subsidies reported from 1996 to 1997 (WWF, 2001).
Country/ States
Officially reported government subsidies
to the OECD and APEC (US$b)
Amount of government subsidies
reported to the WTO (US$b) Year 1996 1997 1996 1997 Japan 8.2 3.0 5.0 0 EU 0.9-1.0 0.8-1.0 0.6 0.7 Canada 0.8 0.7-0.8 0.6 0.7 Korea 0.4 0.3-0.4 0.04 0.05 Taiwan 0.1 0.2 NA NA Norway 0.2 0.2 0.01 0.02 Spain 0.1 0.2 0.07 0.07 Italy 0.08 0.07 0 0 China 0.06 0.05 NA NA

30 Catching More Bait: a bottom-up re-estimation of global fisheries subsidies, Sumaila and Pauly (eds.)
• The USA provided subsidies under the capital construction fund (APEC, 2000), with known costs of administration, but without the actual subsidy figures enjoyed by the fishing industry (WWF, 2001);
• China provided rough estimates of about US$ 700–800 million in annual subsidies to the fish-harvesting sector (Milazzo, 1998), yet only US$ 50 million was officially reported to APEC (2000);
• Japan reported US$ 5 billion subsidies to the WTO in 1996 for tax preference programs, that was not included in either the OECD or APEC studies (WWF, 2001).
Detailed information and clarity on the amount and nature of the subsidies provided by countries worldwide will set the stage for better negotiation rules on setting sustainable fishing criteria and also measuring the impact of these subsidies on fishery resources.
In order to encourage transparency, the data used for this exercise, given in Appendix 2, will be made available, by country, via the website of the Sea Around Us Project (www.seaaroundus.org). We hope this will lead to feedback and correction/amplification of the database.
SUMMARY AND CONCLUSION
Summary of major findings
Major findings of this research are:
• The magnitude of global fishery subsidies was estimated at US$ 26 billion for marine capture fisheries for eleven subsidy types identified (excluding fuel subsidies). The eleven subsidy types were (i) fisheries management programs and services; (ii) fishery research and development; (iii) tax exemption programs; (iv) foreign access agreements; (v) boat construction renewal and modernization programs; (vi) fishing port construction and renovation programs; (vii) fishery development projects and support services; (viii) marketing support, processing and storage infrastructure programs; (xi) fisher assistance programs; (x) vessel buyback programs; and (xi) rural fishers’ community development programs;
• Fisheries subsidies can be classified into three categories based on their potential impact on fish stocks as: the ‘Good’, the ‘Bad’ and the ‘Ugly’. For these three subsidy categories, bad subsidies were the highest, estimated at US$ 15 billion. Next were the good subsidies at about US$ 7 billion; and the ugly subsidies being the least provided at about US$ 4 billion;
• A total of 1152 entries were made within the subsidy matrix in computing for the magnitude of fishery subsidies. This information was obtained for 141 countries where subsidies were provided and documented;
• Out of the eleven subsidy types identified, fishery management programs and services amounted to the highest provided, almost a quarter of the global totals (US$ 6.2 billion), provided by 138 coastal countries;
• Vessel buyback programs, fishing access agreement and fisher assistance programs were common to developed countries only, with estimates of US$ 1 billion, US$ 1 billion and US$ 2 billion, respectively;
• Rural fisher community development programs are only provided in developing countries and estimated at US$ 1.0 billion;
• Subsidies for fishery access agreement payments were estimated at US$ 1 billion, and they are given by a handful of nations with a huge share of global catch including the EU, Japan, China, USA, Russia, Taiwan and Korea;
• About 52% of the total global fisheries subsidy estimate is provided by 38 developed countries (US$ 13.4 billion) and the remaining 48% from 103 developing countries (US$ 12.3 billion);
• By geographical regions, Asia (East, South and West) provided the largest share of the global fishery subsidies about US$ 11.6 billion, next to Europe with US$ 5 billion, with subsidy intensity of 16% and 22% respectively;

The nature and magnitude of global non-fuel fisheries subsidies, Khan et al. 31
• Amongst the major fishing nations, Japan provided the highest subsidy amount about US$ 4.2 billion, next to the EU with about US$ 3 billion, followed by Russia, China, Peru and the USA with US$ 1.4 billion, US$ 1.3 billion, US$ 1.1 billion and US$ 1.0 billion respectively.
Policy implications
The debate on fisheries subsidies no longer deals exclusively, or even largely with trade injury, but increasingly with fishery resource conservation issues (Milazzo, 1997) and economic waste (Munro, 1998). Other concerns have been socio-economic regarding rural development, coastal employment and food security issues (Fluharty and Kaczynski, 2002; Sumaila, 2003; Alder and Sumaila, 2004).
Most policy reforms on fishery subsidies have been within multilateral trade talks by the negotiation group on subsidy rules at the World Trade Organization (WTO) in collaboration with the United Nation agencies such as the Food and Agricultural Organization (FAO), the United Nations Environment Program (UNEP), intergovernmental organizations and a coalition of Non Governmental Organizations (NGOs). The emphasis has been to eliminate subsidies that distort trade and also those that lead to overcapacity and overfishing based on the Doha rounds of trade talks and the Johannesburg Summit on Sustainable Development.
At the moment, out of the numerous position papers and proposals to the WTO negotiation group, two submissions for policy reforms are noteworthy. One approach is to have a top-down broad-based prohibition of all fishery subsidies, and the other is a bottom-up approach that prohibit subsidies that are explicitly listed as trade distorting or that lead to overcapacity. The difference between the two approaches, i.e., top-down and bottom-up is simply about what is at stake. The argument for the bottom-up approach led by Japan, the EU, Korea and Taiwan is that, by addressing overcapacity through reduction in vessel construction, modernization and overseas transfers, would inevitably curtail problems of overfishing. Also, the bottom-up proponents are arguing that ineffective fisheries management is also a contributing factor as much as subsidies to the present status of global fish stocks.
Alternatively, the ‘Friends of Fish’ countries and several other countries including Iceland, New Zealand, Pakistan, Australia, Brazil, Chile and India, are advocating for a total ban of all subsidies, but with exemptions, such as considering the needs of developing countries under a special and differential (S&D) provision. The benefits of this blanket prohibition are that it is simple, leads to transparency, and still allow for some exceptions. However, the top-down prohibition imposes stronger disciplines and notification requirements, which are neither within the Doha mandate nor within the ASCM and may have impact on other non fishing sectors. There are several challenges to this proposal as well, such as compliance to rules, and the cost of notification and enforcement. Some countries including the US and a coalition of NGOs have been advocating for subsidies that support conservation efforts, and disaster relief programs.
The contention with the S&D provision is that, since some developing countries have large catches, extending such a rule will undermine the effectiveness of any new fisheries rules. Further proposal on the negotiations of rules on the S&D provision are on-going, but the needs of small and vulnerable coastal states have emphasized with particular reference to the exemption of access payments, research related fisheries management programs and certain social insurance programs for fisher communities and disaster relief programs. Beneficiaries of such de minimis, i.e., developing country subsidies prohibition package will then need to meet certain other eligibility criteria. One suggestion has been to give exceptions to fisheries in developing economies with a gross national income per capita of less than a thousand US$26. Another proposal is to provide a basis for itemizing small scale fishing boats by size, length or volume of catch landed, and to set a limit to which rules should apply in identifying which fisheries are artisanal and small scales. Another issue has been the ambiguous definition of small scale or artisanal fisheries, which requires the provision of guidelines or sets of criteria to measure the effect of subsidies that enhance overcapacity (Schorr, 2005). To this effect, the best proposals is to apply S&D only to those
26 TN/RL/GEN/57/REV.2 Paper submitted to the WTO negotiation group on rules. http://docsonline.wto.org/gen_home.asp?language=1and_=1, last accessed 10/08/06.

32 Catching More Bait: a bottom-up re-estimation of global fisheries subsidies, Sumaila and Pauly (eds.)
countries that fall below a certain threshold based on weight in terms of world market share of traded fish27.
According to Schorr (2005), because subsidies to artisanal fisheries appear to take on a wide variety of forms, their effect is always hard to measure. Subsidies are most likely to be associated with the following: (i) vessel/gear modernization including motorization and the use of efficient gear such as purse seines; (ii) landing and processing infrastructure including fishing port facilities, refrigeration, roads and transport infrastructure; (iii) export including value adding and quality control; (iv) fuel subsidies; (v) other inputs such as ice; (vi) training programs and capacity building, and (vii) capital for investment. However, the outcomes of some of these policies on fishery sustainability in small scale fisheries have not been well studied, and needs further investigation.
A turning point in the WTO negotiations has been the suggestion by Brazil28 and other developing countries to include regional fisheries management organizations (RFMO) in the subsidies discussion, since they have regional management responsibilities (see Abdallah and Sumaila, this volume, for more on Brazil). Sumaila and Keith (2006) further emphasized on the positive role of RFMOs in stimulating discussion amongst regional members and the sharing of information towards the WTO negotiation on rules. The suggestion to include fishery subsidy talks within multilateral environmental agreements with the collaboration of the UN agencies, and ways to improve on the reporting and clarification of subsidy information is highly relevant to policy development.
However, the challenges to these contributions are many, ranging from non-membership role within RFMOs, the legal procedures for international environmental agreements and the cost of monitoring and compliance. How to address these issues within the WTO requires more negotiations and proposals on better reporting of subsidies and understanding the impact on subsidies on resource sustainability. Defining working guidelines and sustainability criteria for specific fishery sectors, using both ecological and economic indicators is highly desirable, and needed for the following goals:
• To monitor subsidies aimed at reducing fishing capacity, but results in seepages and spill over effects;
• To assess certain subsidies in developing countries that are effort-enhancing such as access agreements, using the criteria ‘patently at risk’ in terms of fish stocks and ‘effective fishery management’ in terms of monitoring and control should be considered;
• To examine subsidies that may lead to Malthusian overfishing in rural coastal communities and to develop coherent policies for rural communities;
• To investigate subsidy programs that promote food sufficiency and poverty alleviation and to distinguish them from subsidies that promote fish exports;
• To develop national fisheries subsidy report cards, with rules on transparent reporting, and compliance on notifications. Such a report card can be used for S&D provisions, RFMO management programs and for negotiation rules on subsidy reforms within the WTO.
SUGGESTIONS FOR FURTHER RESEARCH
Three major areas have been less investigated in the analysis of impacts of subsidies. Future research should therefore focus on the following three areas, both for policy reforms in sustaining fishery resources and for sustainable fishery livelihoods:
• To assess the impact of subsidies on resource exploitation and sustainability in different fishery sectors, i.e., artisanal and industrial fishing sector;
• To examine the impact of subsidies on industrial profits;
27 http://www.ictsd.org/weekly/06-06-21/story4.htm, last accessed 20/08/06. 28 TN/RL/GEN/79/REV.1 Paper submitted to the WTO negotiation group on rules. http://docsonline.wto.org/gen_home.asp?language=1and_=1, last accessed 10/08/06.

The nature and magnitude of global non-fuel fisheries subsidies, Khan et al. 33
• To investigate the impact of subsidies on exports, food sufficiency and livelihoods in artisanal fisheries;
• To corroborate subsidy data in Appendix 2 (and available online at www.seaaroundus.org) with reporting agencies to account for biases and uncertainties in the computation of fishery subsidy estimates.
ACKNOWLEDGEMENTS
We thank members of the Fisheries Economics Research Unit and the Sea Around Us Project at the Fisheries Centre for their inputs into this study. We also thank Sylvie Guénette and Patrizia Abdallah for French and Spanish translations, respectively; and to Andrew Sharpless of Oceana, for access to various information sources. A. Khan is indebted to the World University Service of Canada, UBC Chapter for the financial support during his study at UBC. Finally, we thank the Sea Around Us Project and the Pew Charitable Trusts for their financial support.
REFERENCES Abdallah, P.R., Sumaila, U.R. 2006. An historical account of Brazilian public policy on fisheries subsidies. In Sumaila, U.R., Pauly,
D. (eds.), Catching more bait: A bottom-up re-estimation of global fisheries subsidies. Fisheries Centre Research Reports 14(6) , pp. 67-76. Fisheries Centre, the University of British Columbia, Vancouver, Canada.
Acheampong, A. 1997. Coherence between EU fisheries agreements and EU development cooperation: The case of West Africa. ECDMP Working Paper No. 52. European Centre for Development Policy Management. Maastricht, Netherlands.
Afful, K., Kebe, M. 1996. Fiscal policy and the artisanal fisheries sector in Ghana and Senegal. Programme for the integrated development of artisanal fisheries in West Africa., FAO, Cotonou.
Ahmed, M., Dey, M.M. Rab, M. 2002. Socioeconomics of freshwater fish farming in Asia. Policy research and impact assessment program. The WorldFish Center, Penang, Malaysia.
Alder, J., Sumaila, U.R. 2004. Western Africa: a fish basket of Europe past and present. Journal of Environment and Development, 13, (2): 156-178.
Anderson, L.G. 1986. The economics of fisheries management. Revised and enlarged edition, MD. The John Hopkins University Press.
APEC. 2000. Study into the nature and extent of subsidies in the fisheries sector of APEC member economies. PricewaterhouseCoopers Report No. CTI 07/99T. 1-228.
Arnason, R. 1999. Fisheries subsidies, overcapitalization and economic losses. In: A. Hatcher and K. Robinson (eds). Overcapacity, overcapitalization and subsidies in European fisheries. CEMARE, University of Portsmouth, Portsmouth: 27-46.
Millennium Ecosystem Assessment. 2005. Ecosystem and human well-being: Synthesis Report. Island Press. Washington, D.C.
Atta-Mills, J., Alder, J., Sumaila, U.R. 2004. The decline of a fishing nation: the case of Ghana and West Africa. Natural Resources Forum, 28: 13-21.
Bahamas Mission Report. 1998. Fisheries management action plan for the Bahamas. BREEF / MacAllister Elliot & Partners Ltd. 1061/R/01/D.
Bergin, A. Haward, M. 1995. Japan’s tuna fishing industry: A setting sun or new dawn? Nova Science Publishers, New York.
Bjorndal, T., Munro, G.R. 1998. The economics of fisheries management: a survey. In: T. Tietenberg and H. Fomer (eds.) The international yearbook of environmental and resource economics 1998/1999. A survey of current issues, Cheltenham, Edward Elgar: 153-187.
Black, J. 2003. Oxford dictionary of economics. Oxford University Press, Oxford, New York.
Bonfil, R., Munro, G., Sumaila, U.R., Valtysson, H., Wright, M., Pitcher, T., Preikshot, D., Haggan, N. and Pauly, D. (eds). 1998. Distant water fleets: An ecological, economic and social assessment. Fisheries Centre Research Reports. The University of British Columbia, Vancouver: Vol. 6 (6), 1-111.
Bostock, T., Greenhalgh, P., Klein, U. 2004. Policy research - Implications of liberalization of fish trade for developing countries- Synthesis report. Natural Resources Institute. Chatham, UK.
Butcher, J.G. 2002. Getting into trouble: the diaspora of Thai trawlers, 1965-2002. International Journal of Maritime History, 14: 85-121.
CECAF. 2000. Implementation of the Code of Conduct for Responsible Fisheries in the CECAF region. Mimeo, FAO, Accra.
CFFA. 2005. EU fisheries subsidies: Significance for developing countries, Coalition for Fair Fisheries Arrangement, Brussels.
Chuang, C. Zhang, X. 1999. Review of vessel buyback schemes and experience in Chinese Taipei. In: M. Riepen (ed.) The Impact of government financial transfers on fisheries management, resource sustainability and international trade. Report of the Proceedings of the Pacific Economic Co-operation Council-PECC Workshop held on 17-19 August, 1998. PECC, Manila.

34 Catching More Bait: a bottom-up re-estimation of global fisheries subsidies, Sumaila and Pauly (eds.)
Clark, C.W., Munro, G.R., Sumaila, U.R. 2005. Subsidies, buybacks, and sustainable fisheries. Journal of Environmental Economics and Management, 50: 47-58.
Clark, C.W., G.R. Munro, Sumaila, U.R. 2006. Buyback subsidies, the time consistency problem and the ITQ alternative. Fisheries Centre Working Paper #2006-08, The University of British Columbia, Vancouver, B.C., Canada [In press: Land Economics].
Coffey, C. 2006. Fisheries subsidies – Will the EU turn its back on the 2002 reforms? WWF, Washington, D.C.
COFREPECHE. 2000. Etude de bilan des sociétés mixtes dans le contexte des interventions structurelles dans le domaine de la pêche. Rapport exécutif. Commission Européenne. Direction Générale Pêche. 16 juin 2000.
Cox, A., Schmidt C-C. 2003. Subsidies in the OECD Fisheries Sector: A review of recent analysis and future directions. Background paper for the FAO expert consultation on identifying, assessing and reporting on subsidies in the fishing industry. 3-6 December 2002, FAO, Rome.
Cunningham, S. Gréboval, D. 2001. Managing fishing capacity: a review of policy and technical issues. FAO Fisheries Technical Paper No. 409. FAO, Rome.
Doha Conference 2001. Doha Ministerial Declaration, November 20, 2001. WT/MIN (01)/DEC/1. http://docsonline.wto.org/gen_home.asp?language=1and_=1, Accessed 10/08/06.
Estonia-EU Single Programming Document. 2003. National development plan for the implementation of the EU structural funds. Brussels, Belgium.
Everett, G. 1994. Promoting industrial fisheries in W/Africa. FAO Fisheries Circular No. 857. FAO, Rome.
FAO. 1992. Marine fisheries and the law of the sea: A decade of change. FAO Fisheries Circular No.853. FAO, Rome.
FAO. 1995. Code of conduct for responsible fisheries. FAO Fisheries Technical Paper No. 350 (1). FAO, Rome.
FAO. 1996. Report of the regional consultation on institutional credit for sustainable fish marketing, capture and management in Asia and the Pacific (Manila, Philippines, July 3-7, 1995. FAO Fisheries Technical Paper No. 540. FAO, Rome.
FAO. 1998. Report of the technical working group on the management of fishing capacity. La Jolla, USA, 15-18 April 1998. FAO Fisheries Report, No. 585. FAO, Rome.
FAO. 2000. Report of the expert consultation on economic incentives and responsive fisheries. FAO Fisheries Report No. 638. FAO, Rome.
FAO. 2001. Report on the expert consultation on economic incentives and responsible fisheries. Rome, Italy, 28 November 01 December 2000. Paper presented to the Committee on Fisheries, 24th session. Fisheries FAO Fisheries Report No. 638. Suppl. Rome, Italy, FAO, Rome.
FAO. 2002. The State of world fisheries and aquaculture 2002. FAO, Rome.
FAO. 2003a. International plan of action (IPOA) to prevent, deter and eliminate illegal, unreported and unregulated fishing. Preliminary Draft Appendix D, FAO, Rome.
FAO. 2003b. Report on the expert consultation on identifying, assessing and reporting on subsidies in the fishing industry. FAO Fisheries Report No. 698. FAO, Rome.
FAO. 2003c. Descriptions of projects supported by the common fund for commodities Committee on Fisheries. Sub Committee on Fish Trade. Ninth session, Bremen, Germany, 10-14 February 2004, FAO COFI:FT/IX/2004/Inf.7, Rome.
FAO, 2004. The state of world fisheries and aquaculture. FAO, Rome.
Froese, R., Pauly, D. 2003. Warnsignale aus Nordsee und Wattenmeer - eine aktuelle Umweltbilanz. In: J.L. JLozán, E. Rachor, K. Reise, J. Sündermann and v.H. Westernhagen (ed.) Warnsignale aus Nordsee und Wattenmeer - eine aktuelle Umweltbilanz, Hamburg: GEO.
GATT. 1994. The general agreement on tariffs and trade 1994: Agreement establishing the World Trade Organization, WTO, Geneva.
Gordon, H.S. 1954. The economic theory of common property resource: the fishery. Journal of Political Economy, 62: 124-143.
Gréboval, D., Munro, G. 1998. Overcapitalization and excess capacity in world fisheries: Underlying economics and methods of control. Paper prepared for the FAO working group on the management of fishing capacity, FAO, La Jolla, USA.
Gréboval, D. (ed.) 1999. Managing fishing capacity: selected papers on underlying concepts and issues. FAO Fisheries Technical Paper No. 386. FAO, Rome.
Grynberg, R. 2003. WTO fisheries subsidies negotiations: implications for fisheries access arrangements and sustainable management. Marine Policy, 27: 499.
Hardin, G. 1968. The tragedy of the commons. Science, 162: 1243-1248.
Hatcher, A, Robinson, K. (eds). 1999. Overcapacity, overcapitalization and subsidies in European fisheries. Proceedings of the first workshop held in Portsmouth, UK, 28-30 October, 1998. CEMARE, University of Portsmouth. Portsmouth.
Haughton, M. 2002. Fisheries subsidy and the role of regional fisheries management organizations: the Caribbean experience. Paper presented at the UNEP Workshop on fisheries subsidies and sustainable fisheries management, 26-27 April, 2001. UNEP, Geneva.
Hempel, G. Pauly, D. 2002. Fisheries and fisheries science in their search for sustainability. In: J.G. Field, G. Hempel and C.P. C. Summerhayes (eds.) Oceans 2020: Science, trends, and the challenge of sustainability, Island Press, Washington, D.C: 109-135.

The nature and magnitude of global non-fuel fisheries subsidies, Khan et al. 35
Holland, D., Gudmundsson, E., Gates, J. 1999. Do fishing vessel buyback programs work: a survey of the evidence. Marine Policy, 23: 47-69.
Hufbauer, G.C., Erb, J.S. 1984. Subsidies in international fisheries. Institute for International Economics, MIT Press, Cambridge, MA and London, U.K.
IFREMER. 1999. Evaluation of fishing agreements concluded by the European Commuinty. IFREMER/CEMARE/CEP, Final report. September, Brussels, Belgium.
Insull, D., Orzesko, J. 1991. A survey of external assistance to the fishery sectors of developing countries. FAO Fisheries Circular No. 755, Rev. 3. FAO, Rome.
IUCN. 2003. The 2003 IUCN red list of threatened species. Internet publication: http://www.redlist.org. World Conservation Union. Gland, Switzerland and Cambridge, UK.
IUCN. 2006. The 2006 IUCN red list of threatened species: Summary statistics. Internet publication: http://www.redlist.org. Last accessed August 15th, 2006, World Conservation Union. Gland, Switzerland and Cambridge, UK.
Iwasaki, H. 1997. Development process of Japanese fisheries [Nihon gyogyo no tenkai katei]. Kajisha, Tokyo: 1- 301. [in Japanese]
Jackson, J.B., Kirby, M., Berger, W., Bjorndal, K., Botsford, L., Bourque, B., Bradbury, R., Cooke, R., Erlandson, J. Estes, J., Hughes, T., Kidwell, S., Lange, C., Lenihan, H., Pandolfi, J., Peterson, C.H., Steneck, R., Tegner, M., Warner, R. 2001. Historical overfishing and the recent collapse of coastal ecosystems. Science, 293: 629-638.
Kaczynski, V.M., Fluharty, D.L. 2002. European policies in West Africa: who benefits from fisheries agreements? Marine Policy, 26: 75-93.
Khan, A. 1998. Impacts of fisheries inputs and services on coastal districts of the artisanal fishery of Sierra Leone: An investigation based on the 1990 fishery frame survey data. Honors thesis, submitted as partial requirements for the degree of BSc., Fourah Bay College, University of Sierra Leone, Freetown: 1- 97.
Khatun, F.A., Rahman, M., Bhattacharya, D. 2004. Fisheries subsidies and marine resources management: Lessons from Bangladesh. UNEP/ETB/2004/1. UNEP, Geneva.
Mabawonku, A.F. 1990. The role and effect of subsidies on fisheries development in West Africa (Nigeria, Côte d'Ivoire, The Gambia and Senegal. FAO Non serial publications - CECAF/ECAF SERIES/90/53., FAO, Rome.
Milazzo, M. 1998. Subsidies in world fisheries: a re-examination. World Bank Technical Paper. No. 406. Fisheries series, The World Bank., Washington, DC.
MRAG. 2000. Summary reviews of the impact of fishery subsidies on developing countries. DFID policy research program project, Contract No. CNTR 98 6509.
Munro, G. 1998. The economics of overcapitalization and fishery resource management: A review and discussion paper No.: 98-2. Prepared for the economics and the Common Fisheries Policy workshop on overcapacity, overcapitalization and subsidies in European fisheries, CEMARE, Portsmouth.
Munro, G., Sumaila, U.R. 2002. The impact of subsidies upon fisheries management and sustainability: the case of the North Atlantic. Fish and Fisheries, 3: 233-250.
Mwikya, M.S. 2006. Fisheries access agreements: Trade and development issues. ICTSD Series: Natural Resources, International Trade and Sustainable Development Series No: 2, ICTSD, Geneva.
Nakai, A. 1995. Overview of the fisheries joint ventures (Kaigai gyogyo goben jigyo no gairan). Overseas Fisheries Cooperation Foundation, Tokyo: 1-282. [In Japanese]
N’dia, Y. 2004. Policy research-implications of liberalization of fish trade for developing countries. A case study of Guinea. FAO, Rome.
NOAA. 1999. Federal fisheries investment taskforce: Report to US Congress. Part1: Background and conceptual basis. Baltimore, MD.
OECD. 1997. Towards sustainable fisheries: Economic aspect of the management of living marine resources. Organization for Economic Community and Development, Paris.
OECD. 2000. Transition to responsible fisheries: Economic and policy implications. Organization for Economic Cooperation and Development, Paris.
OECD. 2004. Review of fisheries in OECD countries. Country statistics 2000-2002, Organization for Economic Cooperation and Development, Paris.
OECD. 2005a. Subsidies: a way towards a sustainable fisheries? Policy Brief. Organization for Economic Cooperation and Development, Paris.
OECD. 2005b. Review of fisheries in OECD countries. Country statistics 2001-2003. Organization for Economic Cooperation and Development, Paris.
Pashkova, E. 2001. Russia distant water fishing: A shoulder to lean on. Samudra Triannual Report. ICFS, Chennai and Brussels: 24-27.
Pauly, D. 1990. On Malthusian overfishing. NAGA, the ICLARM Quarterly, 13: 3-4.
Pauly, D. 1993. From growth to Malthusian overfishing: stages of fisheries resources misuse. Traditional Marine Resource

36 Catching More Bait: a bottom-up re-estimation of global fisheries subsidies, Sumaila and Pauly (eds.)
Management and Knowledge Information Bulletin, South Pacific Commission, 3: 7-14.
Pauly, D. 1997. Small-scale fisheries in the tropics: Marginality, marginalization, and some implications for fisheries management. In: E.K. Pikitch, D.D. Huppert and M.P. Sissenwine (ed.) Global Trends: Fisheries Management., American Fisheries Society, Bethesda: 40-49.
Pauly, D. 2005a. On Solutions to the global fisheries crisis. The Sea around Us Project Newsletter, 31: 1-2.
Pauly, D. 2005b. Rebuilding fisheries will add to Asia's problems. Nature, 433: 457.
Pauly, D., Christensen, V. Dalsgaard, J., Froese, R., Torres, F. Jr. 1998. Fishing down marine food webs. Science, 279: 860-863.
Pauly, D., Christensen, V., Guénette, S., Pitcher, T.J., Sumaila, U.R., Walters, C.J., Watson, R. Zeller., D. 2002. Towards sustainability in world fisheries. Nature, 418: 689-695.
Pauly, D., Maclean, J. 2003. In a perfect ocean: The state of fisheries and ecosystem in the North Atlantic Ocean. Island Press, Washington, DC.
Pauly, D., Silvestre, G., Smith, I.R. 1989. On development, fisheries, and dynamite: a brief review of tropical fisheries management. Natural Resource Modeling, 33: 307-329.
Pikitch, E.K., Santora, C., Babcock, E. A., Bakun, A., Bonfil, R., Conover, D. O., Dayton, P.,Doukakis, P., Fluharty, D., Heneman, B., Houde, E.D., Link, J., Livingston, P. A., Mangel, M., McAllister, M. K., Pope, J., Sainsbury, K., J. 2004. Ecosystem-Based Fishery Management. Science, 305: 346 – 347.
Porter, G. 1997. Euro-African fishing agreements: Subsidizing overfishing in African waters. In subsidies and depletion of world fisheries: Case studies. WWF’s Endangered Seas Campaign. Washington, D.C.
Porter, G. 1998. Estimating overcapacity in the global fishing fleets. WWF, Washington, D.C.
Porter, G. 2002. Fisheries subsidies and overfishing: Toward a structured discussion. Paper Prepared for the United Nations Environment Programme Fisheries Workshop. Economics and Trade Unit. UNEP, Geneva, Switzerland.
Porter, G. 2004. Incorporating impacts on resources into disciplines on fisheries subsidies: Issues and options. Economics and Trade Branch Discussion paper, UNEP, Geneva.
Sadovy, Y.J., Vincent., A.C.J. 2002. Ecological issues and the trades in live reef fishes. In: P.F. Sale (ed.) Coral reef fishes: dynamics and diversity in a complex ecosystem. Academic Press, Amsterdam and Boston: 391-420.
Sætersdal, G., Bianchi, G., Strømme, T., Venema, S.C. 1999. The Dr. Fridtjof Nansen Programme 1975–1993. Investigations of fishery resources in developing countries. History of the programme and review of results. FAO Fisheries Technical Paper. No. 391. FAO, Rome.
Salagrama, V. 2004. Policy research-implications of liberalization of fish trade in developing countries. A case of India. FAO, Rome.
Schorr, D. 2005. Artisanal fishing: promoting poverty reduction and community development through new WTO rules on fisheries subsidies. Economics and Trade Branch. An option and issue paper, UNEP, Geneva.
Schrank, W.E. 2000. Subsidies for fisheries: A review of concepts. FAO papers presented at the expert consultation on economic incentives and responsible fisheries. Fisheries FAO Fisheries Report No. 638. Suppl. FAO, Rome: 11-40.
Schrank, W.E., Keithly., W.B.J. 1999. The concept of subsidies. Marine Resource Economics 14: 151-164.
Seijo, J.C. 2000. Estimating fisheries subsidies and their impact on sustainability of fish resources: Dealing with dynamics, risk and uncertainty. FAO Papers presented at the expert consultation on economic incentives and responsible fisheries. Fisheries FAO Fisheries Report No. 638. Suppl. FAO, Rome: 41-56.
SIFR. 1992. A study of international fisheries research. The World Bank, UNDP, CEC, FAO-World Bank Policy and Research Series 19. Washington, D.C.
Sinclair, M., O’Boyle, R. Burke, D.L., Peacock, G. 1997. Why do some fisheries survive and others collapse? In: D.A. Hancock, D. C. Smith, a. A. Grant and J.P. Beumer (ed.) Developing and sustaining world fisheries resources: the state of science and management., CSIRO, Collingwood: 23-35.
Steenblik, R.P. 1999. Previous multilateral efforts to discipline subsidies to natural resource based industries. In: M. Riepen (ed.) Report of proceedings on workshop on the impact of government financial transfers on fisheries management, resource sustainability, and international trade, 17-19 August 1998, Manila, The Philippines. Singapore: Pacific Economic Co-Operation Council., PECC, Manila: 39-80.
Steenblik, R.P., Wallis, P.F. 2001. Subsidies to marine capture fisheries: the international information gap. Fishing in the dark: World Wildlife Fund, endangered seas campaign. A symposium on access to environmental information and government accountability in fishing subsidy programmes, 28-29 November 2000. WWF, Brussels: 17-39.
Stokke, O.S., Coffey, S. 2003. Combating subsidies, developing precaution: Institutional interplay and responsible fisheries. Project Deliverable No. D 9, Final Draft, The Fridtjof Nansen Institute and Institute for European Environmental Policy.
Stone, C. 1997. Too many fishing boats, too few fish: Can trade laws trim subsidies and restore the balance in world fisheries? Ecology Law Quarterly, 24: 505-544.
Sumaila, U., Teh, L., Watson, R., Tyedmers, P., Pauly, D. 2006a. Fuel subsidies to fisheries globally: Magnitude and impacts on resource sustainability. In Sumaila, U.R., Pauly, D. (eds.), Catching more bait: A bottom-up re-estimation of global fisheries subsidies. Fisheries Centre Research Reports 14(6), pp. 35-45. Fisheries Centre, the University of British Columbia, Vancouver, Canada.

The nature and magnitude of global non-fuel fisheries subsidies, Khan et al. 37
Sumaila, U., Marsden, D., Watson, R., Pauly, D. 2006b. Global ex-vessel fish price database: Construction and applications. In press: Journal of Bioeconomics.
Sumaila, U. R., Keith, H. 2006. Regulating fisheries subsidies-A role for RFMOs. Bridges Monthly, No. 2, 3-4: 2006. ICTSD, Geneva: 21-22.
Sumaila, U.R. 2003. A fish called Subsidy. Science and the Environment. Vol. 12, No. 12. Online, available at: http://www.downtoearth.org.in/fullprint.asp, Last accessed 25/08/06.
Sumaila, U.R. 2002. Achieving sustainable fisheries: The economic dimension. Paper presented at the UNEP Workshop on Fisheries Subsidies and Sustainable Fisheries Management, 26-27 April, 2001. UNEP, Geneva.
Swartz, W.K. 2004. Global maps of the growth of Japanese marine fisheries and fish consumption. Thesis submitted to the Faculty of Graduate Studies in partial fulfillment for the degree of Masters of Science. Resource Management and Environmental Studies Program, the Fisheries Centre. The University of British Columbia, Vancouver: 1-74.
Teh, L., Sumaila, U.R. 2006. Malthusian overfishing in Pulau Banggi. Fisheries Centre Working Paper #2006-21, The University of British Columbia, Vancouver, B.C., Canada [Available http://www.fisheries.ubc.ca/publications/working/2006/2006-21.pdf].
Tietze, U., Groenewold, G., Marcoux, A. 2000. Demographic change in coastal fishing communities and its implication for the coastal environment: Findings of an international study, FAO Fisheries Technical Paper No. 421. FAO, Rome.
UNCLOS. 1982. The United Nations Convention on the Law of the Sea. Part I to Part IX [http://www.un.org/Depts/los/convention_agreements/texts/unclos/closindx.htm], United Nations, New York.
UNEP. 2002. Integrated assessment of trade liberalization and trade related policies. A country study on fisheries sector in Senegal. UNEP/ETB/2002/10. UNEP, Geneva.
UNEP. 2003. Fisheries subsidies and marine resources management: Lessons learned from studies in Argentina and Senegal. UNEP/ETB/2005/5 (Vol. II). United Nations, Geneva.
UNEP. 2004a. Analyzing the resource impact of fishery subsidies: A matrix approach. UNEP/ETB/2004/10, UNEP, Geneva.
UNEP. 2004b. Policy implementation and fisheries resource management: Lessons from Senegal Fisheries and the Environment. UNEP/ETB/2004/13, UNEP, Geneva.
Vannuccini, S. 2003. Overview of fish production, utilization, consumption and trade - based on 2001 data. Food and Agriculture Organization of the United Nations, Rome.
Watson, R., Pauly, D. 2001. Systematic distortions in world fisheries catch trends. Nature, 414: 534-536.
Westlund, L. 2004. Guide for identifying, assessing and reporting on subsidies in the fisheries sector. FAO Fisheries Technical Paper No. 438. FAO, Rome.
Worm, B. and R.A. Myers. 2003. Rapid worldwide depletion of predatory fish communities. Nature, 423: 280-283.
WSSD. 2002. Report of the World Summit on Sustainable Development, United Nations publication, New York., Johannesburg, South Africa: 1-173.
WTO. 1994. Uruguay Round Agreement on Subsidies and Countervailing Measures. Article 1-32. WTO, Geneva.
WTO. 2001. GATT/WTO Rules on Subsidies and Aids Granted in the Fishing Industry: Addendum Committee on Trade and the Environment, WTO, Geneva.
WWF. 1997. Subsidies and Depletion of World Fisheries: Case Studies, WWF, Washington, D.C.
WWF. 2001. Hard facts, hidden problems: A review of current data on fishing subsidies. WWF, Washington, D.C.
WWF. 2004. Healthy fisheries and sustainable trade. Crafting new rules on fishing subsidies in the WTO. A WWF position paper and technical resources. WWF, Washington, D.C.

Catching More Bait: a bottom-up re-estimation of global fisheries subsidies, Sumaila and Pauly
38
CHAPTER 2
FUEL SUBSIDIES TO GLOBAL FISHERIES: MAGNITUDE AND IMPACTS ON RESOURCE SUSTAINABILITY1
Ussif Rashid Sumaila1, Louise Teh1, Reg Watson1, Peter Tyedmers2 and Daniel Pauly1 1Fisheries Centre, Aquatic Ecosystems Research Laboratory (AERL), University of British Columbia.
2202 Main Mall, Vancouver, BC., V6T 1Z4, Canada 2School for Resource and Environmental Studies (SRES), Faculty of Management,
Dalhousie University, Halifax, NS, Canada
ABSTRACT
It is generally accepted that global fisheries are grossly overcapitalized, resulting in overfishing in most of the world’s fisheries. Fuel prices have recently seen significant increases. Given that fuel constitutes a significant component of fishing costs, it is obvious that, other things being equal, increasing fuel prices will reduce overcapacity and overfishing, because they will reduce the profits that can be made, thereby driving marginal fishers out of fishing. But, other things are hardly equal. Here, the willingness of governments to provide the fishing sector fuel subsidies reduce, if not completely negate, the conservation value of increasing fuel costs. The objective of this contribution is twofold. First, we explore the theoretical basis for the expectation that increasing fuel price faced by fishing enterprises will, everything being equal, reduce fishing pressure. Second, we estimate the amount of fuel subsidies (defined narrowly here as the price differential between what others and fishers pay in an economy) paid to the fishing sector by governments globally. Results from our study indicate that global fuel subsidies stand at between US$ 6±2 billion per year. This implies that, depending on how much of this subsidy existed before the fuel price increase, fishing enterprises can, in the aggregate, absorb as much as this amount of increase in their fuel budget before we begin to see any conservation benefits from fuel price increases.
INTRODUCTION
A key motivator for commercial fishing is profits. That is, the more profitable it is to fish the more fishing will take place, everything else being equal. Given that many fisheries in the world are currently overfished, and that fuel constitutes a significant component of fishing costs, reaching up to 60% in some fisheries, an obvious question to ask is whether the recent sharp increase in fuel price will help reduce overfishing, as this reduces the profitability of fishing. The chances of this happening can be reduced significantly where fuel subsidies are given to the fishing sector by governments. Fuel subsidies, defined narrowly here as the price differential between what others and fishers pay in an economy, are an example of fisheries subsidies usually defined as direct or indirect financial transfers by the government of a country to its fishing sector. They are given in various forms including grants, loans and loan guarantees, equity infusions, tax preferences or exemptions, and price or income support programmes (OECD, 1997; Milazzo, 1998; Schrank and Keithly, 1999; Clark et al., 2005; Khan et al., this volume).
To help provide research inputs into the debate on the conservation value of fuel subsidies, we estimate global fuel subsidies to the fishing sector, and discuss the potential impact of this on the ability to manage fishery resources sustainably through time. We collected and analyzed time series data on (i) the price differential, if any, enjoyed by the fishing sector in each country relative to other economic sectors due to subsidies, and (ii) the quantity of fuel consumed by the fishing sector. We applied statistical techniques to
1 Cite as: Sumaila, U.R., L. Teh, Watson, R., P. Tyedmers, D. Pauly. 2006. Fuel subsidies to fisheries globally: Magnitude and impacts on resource sustainability. In Sumaila, U.R., Pauly, D. (eds.), Catching more bait: a bottom-up re-estimation of global fisheries subsidies. Fisheries Centre Research Reports 14(6), pp. 38-48. Fisheries Centre, the University of British Columbia, Vancouver, Canada.

Fuel subsidies to global fisheries, Sumaila et al.
39
scale this up to estimate, at the global level, the annual dollar amount paid to the fishing sector as fuel subsidies by governments around the world.
To our knowledge, there is currently no global estimate of fuel subsidies to the fishing sector in the literature. However, global estimates of fishery subsidies in general have been provided earlier by the FAO (1992) and Milazzo (1998). A more recent estimate of global subsidies less fuel subsidies, with intermediate value between the two earlier estimates is given in Khan et al. (this volume). Regional estimates of fisheries subsidies have also been provided for the Asia Pacific Rim by APEC (2000), and for the North Atlantic by Munro and Sumaila (2002). The OECD publishes annual fisheries subsidies estimates for its member countries (OECD, 2004; 2005a). The current study is the first to provide a global estimate of fisheries fuel subsidies. Our results indicate that global fuel subsidies are in the range of between US$ 4.2 to 8.5 billion per year, or around 8% of the annual commercial fish catch value of about US$80 billion (Sumaila et al., 2006).
THEORETICAL FRAMEWORK
It is generally accepted that commercial fishing operations fish for profit. The more profits they can make by going fishing the more they will fish, other things being equal. Profit, π , is determined here by the difference between total revenue, TR, and total cost, TC. TR is a function of price (p) and catch (H) while TC is a function of fishing effort, which in turn is a function of fuel cost (f) and other costs (o) such as the
cost of labour. Let profit without fuel price increase, and no fuel subsidies, 0π , be expressed as
)),((),(0 ofECExpH −=π (1)
Where x is the stock size and E is the fishing effort. Note that well-behaved cost functions, 0/ <∂∂ fπ . That is, the higher f the lower the profit, other things being equal.
With a fuel price increase from f to f’, the profit can be expressed as
)),((),( ''0 ofECExpH −=π (2)
Since f’ is greater than f, the profit will be less.
With fuel subsidies, ),(0 'ffs −≤< the effect of the increase in fuel cost is either reduced or completely negated. Or, in the case of a fishery that is well connected politically, a fuel price increase could be exploited to get a subsidy that is higher than the fuel price increase, resulting in a higher level of fishing effort than before the fuel price increase.
The scenario given above is captured neatly in the case of open access fisheries by Figure 1 below. Figure 1 a, b, c, and d illustrate what could happen with an increase in fuel prices to fishing effort using the simple Gordon-Schaefer model (Gordon, 1954). In Figure 1a, we have the standard model with total revenue curve (TR) and the initial linear total cost function (TC0). Under open access the equilibrium effort is E.
Figure 1b shows a swing in the total cost curve from TC0 to '0TC with an equilibrium effort of '
0E . If this
was all that happened, the fuel price increase will have a conservation value. However, as seen in many countries after the recent increases in fuel prices, the fishing sector normally advocates for fuel subsidies
in the face of increasing fuel cost. Depending on how successful the sector is in this regard, '0TC can swing
to anywhere between TC0 and '0TC (Figure 1c) or to
20 fTC (Figure 1d).
The outcomes under open access illustrated in Figure 1 can be shown to apply under a sole owner profit maximizing economic agent model by setting up a Hamiltonian function and solving it with the objective of maximizing discounted profit under the relevant stock constraint (Clark, 1990).

Catching More Bait: a bottom-up re-estimation of global fisheries subsidies, Sumaila and Pauly
40
COMPUTING FUEL SUBSIDIES
Data collection and compilation
We researched printed and online sources to compile data on fuel subsidies worldwide. We also enlisted the help of colleagues worldwide, including academics, government officials, and NGOs. We categorized countries into those that provided (or were likely to provide) fuel subsidies, and those not likely to do so. For each country in the former group with available relevant and useable fuel subsidies data, we computed the cost of a subsidized litre of fuel (usually diesel). We then estimated the country’s total fuel subsidies based on the fleets’ fuel consumption. Fuel consumption data was obtained from Tyedmers et al. (2005).
TR = ph (x,e)
0 E Effort
TCo
Cost
/ Re
venu
e ($
)
a) b)
c) d)
TR = ph (x,e)
0 EoEffort
TCo
TCo´
Eo´
Cost
/ Re
venu
e ($
)
TR = ph (x,e)
0 Eo Effort
TCoTCo
TCo´
Eo´
TCof
Eof
Cost
/ Re
venu
e ($
)
TR = ph (x,e)
0 EoEffort
TCo
TCo´
Eo´
TCof2
Eof2
Cost
/ Re
venu
e ($
)
Figure 1. Figure 1a illustrates the standard model with total revenue curve (TR) and the initial total linear cost
function (TC0). Figure 1b shows a swing in the total cost curve from TC0 to '0TC .Depending on the size of fuel
subsidies, '0TC can swing to anywhere between TC0 and
'0TC (Figure 1c) or to
20 fTC (Figure 1d).
We created a database of fuel subsidies for 144 coastal countries which had engaged in fishing activity in the year 2000, and were not territories or dependences. Information related to fuel subsidies was compiled from primary and grey literature, the internet, and newspaper articles. Even though this is a static analysis for 2000, we used the closest available data within the period from 1995 to 2006, for countries for which we did not have year 2000 data, Data from years prior or after 2000 were normalized to constant 2000 US dollars by applying the consumer price index (CPI). CPI rates were extracted from the International Financial Statistics website available at http://pacific.commerce.ubc.ca/ifs/.
Information for each country was filtered into three groups, progressing from countries with specific fuel subsidy data to those with coarse or no information. Group 1 countries had the best data, i.e., the actual monetary value of fuel subsidy per litre, or total cost of fuel subsidies. In the case of countries where the total value of subsidies was provided, we calculated the per litre subsidy by dividing total subsidies by the country’s total fuel consumption (based on data Tyedmers et al. 2005). Group 2 countries were those with

Fuel subsidies to global fisheries, Sumaila et al.
41
qualitative information available about the provision of fuel subsidies in the respective countries. Group 3 countries were those for which we have no information. There were 24, 25, and 60 countries in Groups 1, 2, and 3, respectively. In addition, there were 35 countries which, according to our research, did not provide subsidies (Table 1).
Table 1: List of data sources
Country Subsidies provided?
Y/N
$/Litre (US$) bracket = estimated
Source (s)
Albania Y 0.33 Albania Directorate of Fisheries Policies, 2004. Fisheries Economy Analysis. http://www.dfishery.gov.al Accessed 21 Aug 2006
Angola Y (0.15) WTO (2006) Antigua and Barbuda
N - Caribbean Regional Fisheries Mechanism (CRFM) http://www.caricom-fisheries.com/members/antigua.asp Accessed 21 Aug 2006
Argentina Y (0.18) Onestini, M. and G. Gutman 2001 Australia Y 0.20 Parliament of Australia Library. Research Note 24 2000-01
http://www.aph.gov.au/library/Pubs/rn/2000-01/01RN24.htm. Accessed 24 Aug 2006
Bahamas N3 CRFM http://www.caricom-fisheries.com/members/bahamas.asp Accessed 21 Aug 2006
Bangladesh Y 0.04 Khatun, 2004 Barbados Y (0.15) a. Barbados Fisheries Division – Fisheries Management Plan.
http://grid2.cr.usgs.gov/cepnet/barbados/czmu/bbsoc/barbados.htmBarbados Accessed 21 Aug 2006 b. CRFM http://www.caricom-fisheries.com/members/barbados.asp Accessed 21 Aug 2006
Belgium N2 -- a. OECD, 2005c b. Cox, 2003
Benin N - Personal communication (E. Fiogbe, 2006) Brazil Y 0.11 Brazil Secretariat of Agriculture and Fisheries.
www.planalto.gov.br/seap Accessed 22 Aug 2006 Cameroon N FAO fisheries management profile.
http://www.fao.org/fi/fcp/fr/CMR/body.htm Accessed 22 Aug 2006 Canada Y (0.18) a. http://www.gnb.ca/acts/acts/g-03.htm (fuel tax exemption in New
Brunswick) b.http://www.finances.gouv.qc.ca/en/ministre/discours/20050902.asp (fuel tax exemption in Quebec)
Cape Verde Y (0.15) FAO Fishery Profile. http://www.fao.org/fi/fcp/fr/CPV/body.htm China Y (0.18) Xinhua Online news, 27 March 2006. Fuel prices jump to aid battered
refiners. http://news.xinhuanet.com/english/2006-03/27/content_4349323.htm Accessed 24 Aug 2006
Colombia N1 - FAO Fishery Profile. http://www.fao.org/fi/fcp/en/COL/profile.htm Congo (Dem Rep) N1 - FAO Fishery Profile.
http://www.fao.org/fi/fcp/en/COD/profile.htm Congo (Rep) N1 - Sustainable Fisheries Livelihoods Programme Bulletin 16.
http://www.sflp.org/eng/007/pub1/bul16_1.htm#_ftn1 Costa Rica Y 0.20 La Nacion online news, 12 March 2006. Pescadores anclados a pobreza pese
a millonaria ayuda estatal. http://www.nacion.com/ln_ee/2006/marzo/12/pais1.html Accessed 24 Aug 2006
Cote d’Ivoire Y (0.15) Overa, 2001 Denmark N2 OECD, 2005c Dominica Y (0.15) CRFM http://www.caricom-fisheries.com/members/dominica.asp Accessed
24 Aug 2006 Ecuador N1 - FAO Fisheries management country profile.
http://www.fao.org/fi/fcp/es/ECU/BODY.HTM Accessed 24 Aug 2006 El Salvador N4 - FAO Fishery Profile. http://www.fao.org/fi/fcp/es/SLV/profile.htm Fiji N1 - a. Fiji Times, 2 January 2 2006. Fiji fishing industry in crisis.
http://www.ecsiep.org/index.php?option=com_content&task=view&id=533&Itemid=63 Accessed 24 Aug 2006 b. http://www.fijivillage.com/budget/index.html
France Y 0.14 Financial Times Online, 27 April 2006. Federation chief wants answers on French fuel move. http://www.fishupdate.com/news/fullstory.php/aid/4426/Federation__chief_wants_answers_on_French__fuel___move__.html Accessed 22 Aug 2006
Gabon Y 0.23 Personal communication (G. Bernart, 2006) Gambia Y (0.15) FAO, 2003 Germany N2 - OECD, 2005c

Catching More Bait: a bottom-up re-estimation of global fisheries subsidies, Sumaila and Pauly
42
Country Subsidies provided?
Y/N
$/Litre (US$) bracket = estimated
Source (s)
Georgia N1 - FAO Fishery Profile. http://www.fao.org/fi/fcp/en/GEO/profile.htm Ghana Y 0.10 EUROPA i centre. http://trade-
info.cec.eu.int/doclib/cfm/doclib_section.cfm?sec=168&lev=2&order=date Accessed 24 Aug 2006
Greece Y 0.20 OECD, 2005b Grenada Y (0.15) CRFM. http://www.caricom-fisheries.com/members/grenada.asp Accessed
24 Aug 2006 Guinea N1 - FAO Fishery Profile. http://www.fao.org/fi/fcp/fr/GIN/profile.htm
Accessed 24 Aug 2006 Guyana N1 - Associated Press, 1 September 1 2005. Guyana deep-sea fishermen suspend
operations due to high fuel costs. http://www.icsf.net/jsp/english/externalnews/newsDetails.jsp?id=23189 Accessed 24 Aug 2006
Hong Kong Y 0.40 China Fisheries, 17 May 2006 Hong Kong :Fishermen's fuel-subsidy call rejected. http://en.cappma.com/news/readnews.asp?newsid=21140 Accessed 24 Aug 2006
Iceland Y (0.18) Scottish Executive Publications online. http://www.scotland.gov.uk/library3/environment/ccna-11.asp Accessed 24 Aug 2006
India Y 0.11 The Hindu Online, 26 Oct 2004. No sales tax on diesel for fishermen. http://www.hindu.com/2004/10/26/stories/2004102608930400.htm Accessed 22 Aug 2006
Indonesia Y 0.07 LKBN Antara. 19 April 2006. Government provides subsidized fuel supply for fishermen. http://www.antara.co.id/en/ Accessed 22 Aug 2006
Italy N2 OECD, 2005c Jamaica Y (0.15) CRFM. http://www.caricom-fisheries.com/members/jamaica.asp Japan Y 0.25 Milazzo, 1998. Marshall Islands N1 Marshall Island Chamber of Commerce.
http://www.majurochamber.net/Marshall%20Isls%20Journal%20News.htm Accessed 22 Aug 2006
Malaysia Y 0.11 a. New Straits Times, 16 March 2006. Petrol price for coastal fishermen reduced. http://www.nst.com.my Accessed 22 Aug 2006 b. Pertubuhan Berita Nasional Malaysia, 4 Jan 2006. Syndicates Lure Fishermen to Sell their Subsidised Diesel. http://www.bernama.com Accessed 22 Aug 2006
Malta N1 - FAO Fishery Profile. http://www.fao.org/fi/fcp/en/MLT/profile.htm Accessed 24 Aug 2006
Mexico Y (0.18) FAO country fisheries management profile. http://www.fao.org/fi/fcp/en/MEX/body.htm Accessed 24 Aug 2006
Mozambique N1 Tembe, 2004 Namibia Y (0.15) FAO Fisheries management profile.
http://www.fao.org/fi/fcp/en/NAM/body.htm Accessed 24 Aug 2006 Netherlands N2 - OECD, 2005c New Zealand N - OECD, 2005c Nigeria N - Personal communication (C. Isebor, 2006) Norway Y (0.18) Tietze et al., 2001 Pakistan N - Daily Times Newspaper, February 12, 2006. Government considering
subsidy on diesel sales to fishermen. http://www.dailytimes.com.pk/default.asp?page=2006%5C02%5C12%5Cstory_12-2-2006_pg5_6 Accessed 22 Aug 2006
Panama N - FAO country fisheries management profile. http://www.fao.org/fi/fcp/es/PAN/body.htm Accessed 24 Aug 2006
Papua New Guinea N - Sokimi and Chapman, 2005 Peru N - EUROPA i centre http://trade-
info.cec.eu.int/doclib/cfm/doclib_section.cfm?sec=168&lev=2&order=date Accessed 22 Aug 2006
Philippines Y (0.15) Rab et al., 2002 Poland Y (0.18) a. OECD, 2005c
b. FAO Fishery Profile. http://www.fao.org/fi/fcp/en/POL/profile.htm Accessed 24 Aug 2006
Portugal N2 - OECD, 2005c Russian Federation
Y (0.18) Milazzo, 1998
Saint Lucia Y (0.15) FAO Fishery Profile. http://www.fao.org/fi/fcp/en/LCA/profile.htm Accessed 22 Aug 2006
Saint Kitts and Nevis
N - CRFM. http://www.caricom-fisheries.com/members/stkitts.asp Accessed 22 Aug 2006
Samoa Y (0.15) SPC Samoa profile. http://www.spc.int/coastfish/Sections/Community/samoa.htm Accessed 22

Fuel subsidies to global fisheries, Sumaila et al.
43
Country Subsidies provided?
Y/N
$/Litre (US$) bracket = estimated
Source (s)
Aug 2006 Accesssed 24 Aug 2006 Senegal Y 0.22 UNEP, 2002 Seychelles Y (0.15) a. FAO Fishery Profile. http://www.fao.org/fi/fcp/en/SYC/PROFILE.HTM
Accessed 22 Aug 2006 b. International Trade Centre UNCTAD/WTO, 1999
Soloman Islands Y (0.15) Hand, 1999 South Africa Y 0.10 South Africa Budget Review 2000.
http://www.treasury.gov.za/documents/budget/2000/review/chapter_4.pdf Accessed Aug 21 2006
South Korea Y (0.18) Tietze et al., 2001 Spain Y 0.10 Pravda.Ru, 27 October 2005. Spanish fishermen keep up protests against
fuel prices. http://newsfromrussia.com/world/2005/10/27/66385_.html. Accessed April 26,
Sri Lanka Y (0.15) Parliament Speech by President of Sri Lanka 25 Nov 2005. http://www.presidentsl.org/data/html/speeches/2005/new_session_of_parliament.htm
Sweden N2 - OECD, 2005c Taiwan Y 0.09 a. Taipei Times Online, 22 Dec 2004. EPA tackles air pollution, illegal diesel.
http://www.taipeitimes.com/News/taiwan/archives/2004/12/22/2003216188 Accessed 24 Aug 2006 b. Hong Kong Legislative Council Secretariat Information Note IN09/05-06. http://www.legco.gov.hk/yr05-06/english/sec/library/0506in09e.pdf Accessed 22 Aug 2006
Tanzania N3 - Budget speech 2004. http://www.tanzania.go.tz/budgetspeech/2004/financeE.htm Accessed 24 Aug 2006
Thailand Y 0.13 Bangkok Post Online, 11 June 2006. Fuel prices hit southern fishermen. http://www.bangkokpost.com/breaking_news/breakingnews.php?id=100889 Accessed 22 Aug 2006
Togo Y 0.12 Personal communication (Sedzro, 2006) Tonga Y (0.15) Commission for the Conservation and Management of Highly Migratory Fish
Stocks in the Western and Central Pacific Ocean. National Report Tonga, December 2005. http://www.wcpfc.org/tcc1/pdf/WCPFC-TCC1-NR8-TO.pdf#search=%22SPC%20report%20Tonga%20fisheries%20subsidies%22
Trinidad and Tobago
Y (0.15) CRFM. http://www.caricom-fisheries.com/members/tt.asp Accessed 22 Aug 2006
Tunisia Y 0.20 Fishing Development Strategy in Tunisia. http://www.utap.org.tn/htmlang/pech_agr/bas_1_6.htm Accessed 24 Aug 2006
Turkey Y 0.09 EU Twinning Project TR/2004/I/AG/01 February 2006. www.tarim.gov.tr/AB_Tarim/balikcilik/ayrintili_tarama_sunumlar/7-state_aid_in_fisheries.ppt Accessed 22 Aug 2006
Ukraine Y (0.15) FAO Fishery Profile. http://www.fao.org/fi/fcp/en/UKR/profile.htm Accessed 22 Aug 2006
United Kingdom N - OECD, 2005c Uruguay N FAO Information on fisheries management in the country.
http://www.fao.org/fi/fcp/es/URY/body.htm Accessed 22 Aug 2006 USA Y 0.06 a. Weber, 1994
b.http://www.chevron.com/products/prodserv/fuels/bulletin/diesel/L2_3_11_fs.htm Accessed 24 Aug 2006
Vanuatu Y 0.23 Asian Development Bank, 2000 Vietnam N Impacts of Oil Price to Vietnamese Fisheries Sector. Global News Wire. 15
Nov 2005. Lexis Nexis. Yemen Y (0.15) Yemen embassy economic report.
http://www.yemenembassy.org/economic/Reports/Heritage%20Foundation/Yemen_2004%20Index%20Of%20Economic%20Freedom.pdf Accessed 22 Aug 2006
1 Likely no subsidies due to limited fuel supplies for fishing fleet or high fuel cost with no reported subsidies. 2 No fuel subsidies listed under direct government transfers in OECD Fisheries Review (2005). 3 Other types of input subsidies (e.g. gear, boats) available, but fuel subsidies not mentioned. 4 The government has set up the PESCA Trust to use tax from fuel to support artisanal fishing organizations. Note: Countries with insufficient or no information include: Bahrain, Chile, Cyprus, Estonia, Finland, Ireland, Israel, Kuwait, Lithuania, Qatar, Singapore, United Arab Emirates, Algeria, Belize, Brunei Darussalam, Bulgaria, Cambodia, Comoros, Croatia, Cuba, Djibouti, Dominican Rp, Egypt, Equatorial Guinea, Eritrea, Guatemala, Guinea Bissau, Haiti, Honduras, Iran, Jordan, Kenya, Kiribati, Latvia, Lebanon, Liberia, Libya, Madagascar, Maldives, Mauritania, Mauritius, Micronesia, Morocco, Myanmar, Nauru, Nicaragua, Oman, Palau, Romania, Sao Tome and Principe, Saudi Arabia, Sierra Leone, Somalia, St. Vincent, Sudan, Suriname, Syria, Venezuela.

44 Catching More Bait: a bottom-up re-estimation of global fisheries subsidies, Sumaila and Pauly
Within each group, countries were divided into two categories – developed, and developing - based on their score on the Human Development Index (HDI) of the United Nations. This was to take into account the fact that developed and developing countries face different economic constraints, and therefore, are likely to have different abilities to provide fuel subsidies.
The HDI runs from 0 to 1, and we assumed in this study (as in Khan et al., this volume) that countries with scores ranging from 0 to 0.79 were developing countries, and those with scores above 0.79 were developed countries. Some adjustments were made to this general rule as follows: Russia, China and Taiwan with HDI of less than 0.79 were nonetheless assigned to the developed country category. This was because their fisheries are highly industrial with the potential for high fuel subsidies to be advanced to the fishing sector. Also, countries such as Trinidad and Tobago, Cuba, and Uruguay had HDI scores greater than 0.79, but were classified as developing countries due to the less developed nature of their fishing sectors (this also follows Khan et al., this volume).
For Group 1 countries, we multiplied each country’s per unit fuel subsidy by the annual amount of fuel consumed by the country’s fishing fleets. This gave the total annual fuel subsidies provided by each country to their fishing sector in constant 2000 US$.
For Group 2 countries we estimated total fuel subsidy per country by multiplying each country’s fuel consumption by the average real cost per litre of subsidized diesel obtained from Group 1 countries. Fuel consumption data was obtained from a global database of fisheries fuel consumption (Tyedmers et al. 2005).
For Group 3 countries, that is, the remaining 60 countries with no information, we assumed that no fuel subsidies were provided. This is clearly a strong assumption, with the implication that our estimates are conservative. It should be noted, however, that the total fuel consumption for these countries was 0.8 and 2.8 billion litres for the developed and developing countries, respectively, and accounted for only about 8% of the total fuel consumed for all countries in our analysis.
Finally, we obtained an estimate of global fuel subsidies to the world’s fishing sector by adding the Group 1 and 2 estimates.
RESULTS
Subsidy cost for Group A countries
As of August 25, 2006 we had information for 86 out of 144 countries. Of the 86 countries with information, 52 were believed to have subsidies, and 34 did not. There were altogether 24 Group 1 countries, of which 8 were categorized as developed, and 16 as developing countries.
For Group 1 developed countries, we calculated an average real (2000) cost per litre of subsidized diesel to be US$ 0.18 ± 0.11 (S.D.). The total cost of subsidies for this group was US$ 1.75 billion (Table 2). For the developing countries, corresponding values were US$ 0.15 ± 0.08 per litre, with a total subsidy cost of almost US$ 1 billion (Table 3).

Fuel subsidies to global fisheries, Sumaila et al.
45
Table 2. Estimated fuel subsidy for Group 1 developed countries Country Subsidies
(US$ per Litre) Fuel consumption
(m litres) Total subsidy cost
US$m) Australia 0.20 205 41 France* 0.14 673 94 Greece* 0.20 68 14 Hong Kong 0.40 155 62 Japan 0.25 4,459 1,115 Spain 0.10 1,259 122 Taiwan1 0.09 1,329 120 USA 0.06 3,010 184 Total 11,158 1,752 * Total subsidy value provided. 1 Average of subsidies from two separate sources: a) The Taipei Times online http://www.taipeitimes.com/News/taiwan/archives/2004/12/22/2003216188 and b) Taiwan Legislative Counil Secretariat Information Note IN09/05-06 Available at http://www.legco.gov.hk/yr05-06/english/sec/library/0506in09e.pdf. Table 3. Estimated fuel subsidy for Group 1 developing countries Country Subsidies
(US$ per litre) Fuel consumption
(m litres) Total subsidies
(US$m) Albania 0.33 2 1 Bangladesh 0.04 203 8 Brazil 0.11 550 61 Costa Rica 0.20 48 10 Gabon 0.23 20 5 Ghana 0.10 176 18 India 0.11 2,304 233 Indonesia 0.07 3,127 171 Malaysia 0.11† 1,012 116 Senegal 0.22 139 30 South Africa 0.10 256 27 Thailand 0.13 1,856 241 Togo (artisanal sector) 0.12 6 1 Tunisia 0.20 77 15 Turkey* 0.09 190 17 Vanuatu 0.23 107 25 Total 10,073 976 * Total subsidy provided. † Subsidy for Malaysia is the average between diesel and petrol subsidy.
Subsidy cost for Group 2 countries
Our research suggested that 28 Group 2 countries provide fuel subsidies, although the amount was not known. Of these, 9 were developed countries, and 19 were developing countries. The total fuel consumption for Group 2 developed and developing countries was around 18 and 2.3 billion litres, respectively. We multiplied total fuel consumption with the average fuel subsidy cost to obtain total subsidy costs of US$ 3.2 billion and US$ 0.3 billion for developed, and developing countries, respectively (Tables 4 and 5). In addition, a high and low estimate was obtained by using the upper and lower ranges (one standard deviation) of the Group 1 subsidy means. This produced an upper and lower range estimate of US$ 5.3 billion and US$ 1.3 billion for Group 2 developed countries. Subsidy costs for developing countries ranged from a high of US$ 0.5 billion to a low of US$ 0.2 billion.

46 Catching More Bait: a bottom-up re-estimation of global fisheries subsidies, Sumaila and Pauly
Table 4. Estimated fuel subsidy for Group 2 developed countries (based on subsidy of US$ 0.18 per litre) Country Fuel consumption
(m litres) Real 2000 subsidy cost (US$m)
Argentina 640 115 Canada 519 93 China 10,087 1,814 Iceland 530 95 Mexico 974 175 Norway 786 116 Poland 80 15 Russian Federation 2,732 491 South Korea 1,841 331 Total 18,189 3,246
Table 5. Estimated fuel subsidy for Group 2 developing countries (based on subsidy of US$ 0.15 per litre) Country Fuel consumption
(m litres) Real 2000 subsidy cost
(US$m) Angola 119 17.6 Barbados 4 0.6 Cape Verde 13 2.0 Cote d’Ivoire 34 5.0 Dominica 1 0.2 Gambia 7 1.0 Grenada 2 0.4 Jamaica 4 0.6 Namibia 319 47.1 Philippines 1,122 165.6 Samoa 9 1.4 Seychelles 53 7.8 Soloman Islands 27 4.0 Sri Lanka 282 41.7 St. Lucia 2 0.3 Trinidad and Tobago 14 2.1 Tonga 3 0.4 Ukraine 150 22.1 Yemen 82 12.0 Total 2,249 332.0
Total global cost of fuel subsidies
The sum of Group 1 and 2 countries gave us a global estimate for fisheries fuel subsidies of US$ 4.6 billion, ranging from US$ 4.2 to US$ 8.5 billion (Table 6).
Table 6. Estimate of global fisheries fuel subsidies (US$b) Group 1 Group 2 Total subsidies (US$b) Developed Developing Developed Developing Average 1.75 1.00 3.27 0.33 6.35 High 1.75 1.00 5.27 0.51 8.53 Low 1.75 1.00 1.27 0.16 4.18
CONCLUDING REMARKS
We have presented in this paper the theoretical expectation that an increase in fuel price increase paid by fishers to go fishing should have conservation value. We also demonstrated that fuel subsidies to the fishing sector could subvert the workings of the market, and completely negate the expected conservation value of a fuel price increase. In fact, recent events have demonstrated this to be true, as rises in fuel price

Fuel subsidies to global fisheries, Sumaila et al.
47
have led to an increase in fisheries fuel subsidies in some countries. For example, in June 2006, the Malaysian government started providing coastal fishers with subsidized petrol at RM1 per litre, a RM0.92 (US$0.25) subsidy (New Straits Times, 2006). In October 2005, the Spanish government agreed to a 60% increase in fuel subsidies after fishers blockaded several Mediterranean ports (PravdaRU, 2005) in the country. The preceding cases illustrate that in some instances, the decision to provide fuel subsidies is influenced more by political and social concerns, rather than on the sustainability of fisheries resources.
We have determined the amount of fuel subsidies globally of up to US$8.5 billion, implying that global fishing enterprises can, in the aggregate, absorb as much as this amount of increase in their fuel budget before we begin to see any conservation benefits from fuel price increases. Comparing this amount to the US$ 25.7 billion of global fisheries subsidies less fuel subsidies reported in Khan et al. (this volume) means that fuel subsidies amount to about 25% of total fisheries subsidies. Fuel subsidies inflate the proportion of global subsidies defined as ‘bad subsidies’ or subsidies that lead to overcapitalization in Khan et al., (2006) to about US$21 billion or over 65% of total global fisheries subsidies.
ACKNOWLEDGEMENTS
We are grateful to the Sea Around Us Project, a Partnership of the Pew Charitable Trusts, for support. R. Sumaila also acknowledges the support of the European Community’s Program for International Scientific Co-operation (INCO) through Contract 003739 for INCOFISH project.
REFERENCES
Asian Development Bank, 2000. Vanuatu: Agriculture and Fisheries Sector Review. Available from www.adb.org. Accessed 22 Aug 2006.
APEC, 2000. Study into the nature and extent of subsidies in the fisheries sector of APEC member economies. PricewaterhouseCoopers Report No. CTI 07/99T.
Clark, C.W., 1990. Mathematical Bioeconomics: The optimal Management of Sustainable Resources. Wiley-Interscience, New York.
Clark, C.W., Munro, G.R., Sumaila, U.R., 2005. Subsidies, buybacks, and sustainable fisheries. J. Environ. Econ. Manage. 50, 47-58.
Cox, A., 2003. OECD Work on Defining and Measuring Subsidies in Fisheries. OECD Publication.
Dahou, K., Déme, M., Dioum, A., 2001. Socio-economic and Environmental Impact of Senegalese Fishery Support Mechanisms. UNEP, Geneva.
FAO, 1992. Marine Fisheries and the Law of the Sea: A Decade of Change. FAO Fisheries Circular No.853. FAO, Rome.
FAO, 2003. The role and effect of subsidies on fisheries. Available from http://www.fao.org/DOCREP/003/U1990E/U1990E02.htm Accessed 24 Aug 2006
Gordon, H.S., 1954. The Economic Theory of Common Property Resource: the Fishery. J. Polit. Economy 62, 124-143.
Hand, T., 1999. A Review of Fisheries Taxation & Licensing in the Soloman Islands. Asian Development Bank Report. p.34. Available from http://www.adb.org/Documents/Reports/Consultant/Review_Fisheries_Taxation_Licensing_SOL.pdf Accessed 22 Aug 2006.
International Trade Centre UNCTAD/WTO, 1999. Supply survey on Seychelles’ fish and fish products. Available from http://www.intracen.org/sstp/Survey/fish/fishsey.html Accessed 22 Aug 2006.
Khan, A., Sumaila, U.R., Reg Watson, Gordon Munro Pauly, D., 2006. The nature and magnitude of global non-fuel fisheries subsidies. In: Sumaila, U.R., Pauly, D. (ed.) Catching more bait: a bottom-up re-estimation of global fisheries subsidies. Fisheries Centre Research Reports 14(6). Fisheries Centre, University of British Columbia.
Khatun, F., 2004. Fish Trade Liberalization in Bangladesh: Implications of SPS Measures and Eco-Labelling for the Export-Oriented Shrimp Sector. FAO, Rome.
Milazzo, M., 1998. Subsidies in world fisheries: a re-examination. World Bank Technical Paper No. 406. Fisheries series, The World Bank., Washington, DC.
Munro, G., Sumaila, U.R., 2002. The impact of subsidies upon fisheries management and sustainability: the case of the North Atlantic. Fish Fish 3, 233-250.
OECD, 1997. Towards sustainable fisheries: Economic aspect of the management of living marine resources. Organization for Economic Community and Development, Paris.
OECD, 2004. Review of fisheries in OECD countries. Country statistics 2000-2002, Organization for Economic Cooperation and Development, Paris.

48 Catching More Bait: a bottom-up re-estimation of global fisheries subsidies, Sumaila and Pauly
OECD, 2005a. Subsidies: a way towards a sustainable fisheries? Policy Brief. Organization for Economic Cooperation and Development, Paris.
OECD, 2005b. Review of Fisheries in OECD Countries. Country statistics 2001-2003. OECD Publishing, Paris.
OECD, 2005c. Review of Fisheries in OECD Countries. Policies and summary statistics. OECD Publishing, Paris.
Onestini, M. Gutman, G., 2001. Subsidies in Argentine Fisheries. In Fisheries and the Environment. Fisheries Subsidies and Marine Resources Management: Lessons learned from Studies in Argentina and Senegal. UNEP. p.1-22.
Overa, R., 2001. Institutions, mobility and resilience in the Fante migratory fisheries of West Africa. Chr. Michelsen Institute Working Papers. Available from http://www.cmi.no Accessed 22 Aug 2006.
Rab, M., Dey, M.M., Ahmed, M., 2002. Sustaining Fisheries and Aquaculture Production To Benefit Poor Households in Asia. March-August 2002 Semi-annual progress report. WorldFish Centre, Penang, Malaysia.
Schrank, W.E., Keithly, W.B.J., 1999. The concept of subsidies. Marine Resource Econ. 14, 151-164.
Sumaila, U.R., Marsden, A.D., Watson, R., Pauly, D., (In press). Global Ex-Vessel Fish Price Database: Construction, Spatial and Temporal Applications. J. Bioecon.
Sokimi, W., Chapman, L., 2005. Field Report No. 27 on Technical Assistance Provided to the National Fisheries College, To Review the Small Fishing Operations (SFO) Course. Secretariat of the Pacific Community. Noumea, New Caledonia.
Tembe, H.L., 2004. Access agreements within the context of fiscal reforms – The Mozambican context. In Cunningham, S. and T. Bostock (Eds.). Papers presented at the Workshop and Exchange of Views on Fiscal Reforms for Fisheries - to Promote Growth, Poverty Eradication and Sustainable Management. Rome, 13-15 October 2003. FAO Fisheries Report R732, Suppl.
Tietze, U., Prado, J., Le Ry, J.M., Lasch, R. (Eds.), 2001. Techno-economic performance of marine capture fisheries. FAO Fisheries Technical Paper 421. FAO, Rome.
Tyedmers, P., Watson, R., Pauly, D., 2005. Fuelling global fishing fleets. Ambio 34: 59-62.
Weber, P.K., 1994. Net Loss: Fish, Jobs and the Marine Environment. World Watch Paper 120, July 1994.
WTO, 2006. Angola Trade Policy Review Report no. WT/TPR/S/158. p.68 Available from http://www.docsonline.wto.org Accessed 22 Aug 2006.

Subsidies to high seas bottom trawl fleets, Sumaila et al. 49
CHAPTER 3
SUBSIDIES TO HIGH SEAS BOTTOM TRAWL FLEETS AND THE SUSTAINABILITY OF DEEP SEA BENTHIC FISH STOCKS1
Ussif Rashid Sumaila1, Ahmed Khan1, Louise Teh1, Reg Watson1, Peter Tyedmers2 and Daniel Pauly1
1Fisheries Centre, Aquatic Ecosystems Research Laboratory (AERL), University of British Columbia. 2202 Main Mall, Vancouver, BC., V6T 1Z4, Canada
2School for Resource and Environmental Studies (SRES), Faculty of Management, Dalhousie University, Halifax, NS, Canada
ABSTRACT
The life spans of demersal species of fishes occurring in deep waters are much longer and their potential growth rates much lower than those of related shallow water species. As a result, deep-sea demersal fish species are more vulnerable to exploitation. This is because low growth rates relative to the available market discount rate for capital makes it desirable for fishing firms to mine, rather than sustainably exploit, these resources even in the absence of fisheries subsidies. However, it is common knowledge that governments around the world do provide subsidies to their fishing industries. The objective of this contribution is to estimate the global amount of subsidies paid to bottom trawl fleets operating in the high seas, i.e., outside of the Exclusive Economic Zones of maritime countries. Our study suggests that fisheries subsidies to these fleets stand at about US$152 million per year, which constitutes 15% of the total landed value of the fleet. Economic data for bottom trawlers suggest that the profit achieved by this vessel group is normally not more than 10% of landed value. The implication of this finding is that without subsidies, the bulk of the world’s bottom trawl fleet operating in the high seas will be operating at a loss, and unable to fish, thereby reducing the current threat to deep-sea and high seas fish stocks.
INTRODUCTION
There is evidence that bottom trawling is extending into the deep ocean, where fishing effort, especially on seamounts, has intensified (Morato et al., 2006). The life spans of deep-sea fishes are much longer and their potential growth rates are much lower than those of related shallow water species. As a result, deep-sea fish species are more vulnerable to exploitation (Koslow et al., 2000; Roberts, 2002; Froese and Sampang, 2004; Morato et al., 2004). The point is reinforced when one takes into account the incentives that commercial fishers face. The low growth rates of the fishes that inhabit the deep and high seas make it desirable for fishing firms to mine rather than sustainably exploit these resources. In the absence of effective regulation, fleets compete to catch as much as they can before others do (Gordon, 1954). Fisheries subsidies make matters worse by keeping fleets at sea beyond the time when fishing is profitable (Clark et al., 2005). Even if there were no competition for deep-sea resources, low biological regeneration rates provide economic incentives to run down fish stocks as quickly as possible, and then invest the profits in other sectors of the economy (Clark, 1973; Sumaila and Walters, 2005).
Global estimates of fishery subsidies in general have been provided earlier by the FAO (1992) and Milazzo (1998). Khan et al. (this volume) provide the latest estimate of global non-fuel subsidies, while Sumaila et al. (this volume) provide an estimate of global fuel subsidies. The sum of the two recent estimates provides an
1 Cite as: Sumaila, U.R., Khan, A., Teh, L., Watson, R., Tyedmers, P., Pauly, D. 2006. Subsidies to high seas bottom trawl fleet and the sustainability of deep sea benthic fish stocks. In Sumaila, U.R., Pauly, D. (eds.), Catching more bait: a bottom-up re-estimation of global fisheries subsidies. Fisheries Centre Research Reports 14(6), pp. 49-53. Fisheries Centre, the University of British Columbia, Vancouver, Canada.

50 Catching More Bait: a bottom-up re-estimation of global fisheries subsidies, Sumaila and Pauly (eds.)
intermediate global fishery subsidy value that is nicely bracketed by the two earlier estimates. The current contribution is the first to provide a global estimate of subsidies to the global bottom trawl fleets operating in the high seas, and belonging to the 12 leading high seas bottom trawl fishing nations.
This study is timely because of the current ecological concerns expressed on the increasing activity by bottom trawlers in the high seas, and the general view that this could not be possible without the existence of fisheries subsidies (Pauly et al., 2003; Gianni, 2004). Of the three major gear types targeting deep-sea bottom species, i.e., gillnets, longlines and bottom trawlers, the latter are by far the most commonly used and most damaging. Around 80% of high seas catch of bottom species are taken by bottom trawlers (Gianni, 2004). The main species fished by these trawlers on the high seas are roundnose grenadier (Coryphaenoides rupestris), blue ling (Molva dypterigia), smoothheads (Alepocehalus spp.), black scabbardfish (Aphanopus carbo), Greenland halibut (Rheinhardtius hippoglossoides), orange roughy (Hoplostethus atlanticus) and deep-water sharks (Gianni, 2004).
METHOD
We first generated a list of all countries that have landings by bottom trawlers in the Sea Around Us Project catch database (www.seaaroundus.org). We then identified the world’s 12 current leading high seas bottom trawl fishing nations. The countries that made this list were: Japan, Russia, Spain, Korea, Australia, Ukraine, Faeroe Island/Denmark, Estonia, Iceland, Lithuania, Latvia and France (Table 1). New Zealand would have been in this list but for the fact that our research informs us that the country does not give subsidies to its fisheries. It should be noted that the 10 countries included in Gianni (2004) are all included in our list. Gianni (2004) notes that fishing vessels flagged by 13 countries took over 95% of the reported high seas bottom trawl catch in 2001. We then estimated the amount of fisheries subsidies received by their high seas bottom trawlers using the results reported in Sumaila et al. (this volume) and Khan et al. (this volume), as explained below.
Khan et al., (this volume) and Sumaila et al. (this volume) identified 12 types of subsidies, i.e., (i) boat construction, renewal and modernization; (ii) fishing port construction and renovation; (iii) marketing support, processing and storage infrastructure; (iv) tax exemption; (v) vessel buyback; (vi) fuel subsidies; (vii) rural fisheries community development; (viii) fisheries management and services; (ix) fishery research and development; (x) fishery development projects and support services; (xi) foreign access agreements; and (xii) fisher assistance programs. Of these, only (i)-(vi) appeared to be applicable to high seas bottom trawlers. We therefore estimated and ascribed only these subsidies to the class of vessels under study.
Estimating fuel subsidies to high seas bottom trawlers
We obtained the quantity of fuel consumed by bottom trawlers operating in the high seas (defined as ocean areas outside of countries’ EEZ) from each of these countries from Tyedmers et al. (2005), and subsidy per liter by country reported in Sumaila et al. (this volume). From these two sets of data, the total subsidy to bottom trawlers in each of the 12 countries was calculated. For the purposes of further analysis, we also compiled total catch, and catch by high seas bottom trawlers in each of these countries based on the geo-referenced catches of the Sea Around Us Project (see www.seaaroundus.org; Watson et al., 2004). Finally, we assessed the total landed value of bottom trawl catches using information in Sumaila et al. (2006).
Estimating non-fuel subsidies to high seas bottom trawlers
Non-fuel subsidy estimates relevant to bottom trawlers active in the high seas, for the 12 high seas bottom trawling nations being studied, were taken from Khan et al. (this volume). We then used the ratio of bottom trawl catch to total catch by all the fleets active in each of the 12 countries to prorate the total relevant non-fuel subsidies in each country to the portion of the relevant non-fuel subsidies that can be ascribed to high seas bottom trawlers.
How profitable are bottom trawlers?
According to Statistics Iceland, profit per revenue of about 3.5% was recorded in 2000 (the year for our analysis); while Statistics Norway reported 7% operating profits for trawlers that process fish onboard in 2002.

Subsidies to high seas bottom trawl fleets, Sumaila et al. 51
We assumed that profits from other trawl fisheries from around the world are not likely to be higher than these numbers.
Table 1. Summary of data in fisheries subsidies to high seas bottom trawl (HSBT) fleets.
Country
HSBT fuel used
(m liters)a
Subsidy per liter (US$) b
HSBT fuel
subsidy (US$m) c
HSBT non-fuel subsidy
(US$m)d
HSBT total
subsidy (US$m) e
Total catch all species (‘000 t) f
HSBT catch
(‘000 t) g
Total real catch value all species (US$m) h
HSBT real value (US$m) i
Japan 101.76 0.25 25.44 9.48 34.92 4,895 92 20,567 290 South Korea 96.57 0.18 17.38 9.74 27.12 1,805 88 5,538 146 Russia 90.93 0.18 16.37 13.69 30.06 3668 66 9,001 163 Spain 69.70 0.10 6.97 12.70 19.68 183 6 1,748 22 Australia 5.17 0.20 1.03 8.92 9.95 552 37 1,354 92 Ukraine 24.40 0.15 3.66 3.20 6.86 393 27 963 66 Faeroe Isl. j 19.01 0.15 2.85 12.49 15.34 454 18 1,114 45 Estonia 8.37 0.15 1.26 3.68 4.94 109 14 267 34 Iceland 9.88 0.18 1.78 0.16 1.94 1,981 11 853 33 Lithuania 3.04 0.15 0.46 0.00 0.46 77 5 189 13 Latvia 1.94 0.15 0.29 0.00 0.29 135 3 333 8 France 2.66 0.14 0.37 0.24 0.61 621 2 1,386 6 Total 433 - 78 74 152 15,453 400 43,851 985 a) Adapted from Tyedmers et al. (2005.); b. based on Sumaila et al. (this volume); c) this is the product of high seas bottom trawl fuel consumption, and subsidy per liter; d) calculated using data in Khan et al. (this volume); e) this is the sum of (c) and (d); f ) and g) are calculated using data in Watson et al. (2004); (h) and (i) are obtained from Sumaila et al. (2006); and j) Data for Denmark reported in Sumaila et al. (this volume) is used to make the calculation here. We assumed that Estonia, Lithuania and Latvia give fuel subsidies to their fishing fleets.
RESULTS
The results of the analysis are given in Table 1. The following observation can be made from that table:
• Total amount of fuel consumed by the high seas bottom fleet (HSBT) of the 12 countries studied is 433 million litres a year;
• Total catch by those countries by all fishing gear in all areas including the high seas stands at just over 15.5 million tonnes, while the equivalent catch by only the HSBT fleet is 400 thousand tonnes. Thus, the HSBT catch is about 2% of the total catch of the 12 countries and less than 1% of the global marine catch;
• The total landed value from all fish catch of the 12 countries is about $44 billion a year. The total HSBT landed value is estimated at about $985 million, which is less than 3% of the total landed value of these countries, and about 1% of total global marine catch value;
• Total fuel subsidies to this fleet are estimated at about $78 million, while the non-fuel subsidy estimate stands at $74 million per year. Therefore, fuel subsidies account for just over 5o% of the total subsidy to the HSBT fleet of about $152 million a year;
• Total subsidy to the HSBT fleet is about 15% of the total landed values from the catch of these fleets in the high seas, which is higher than the reported profit per landed value of not more than 10% for trawlers (Anon, 2005a; 2005b).
DISCUSSION
Our analysis shows that the bottom trawl fleets operating in the high seas contribute only small percentages of global marine fish catch and landed values, as was also found by Gianni (2004). The fleets consume a large quantity of fuel, which is subsidized by governments around the world. In fact, these subsidies represent the overwhelming portion of the financial transfers received by these fleets.
Expressing the numbers in percentage of the world’s catch reveals that the HSBT of the 12 countries do not contribute much, and therefore should not subject the high seas ecosystem and species to such high risk. Simply put, the risk-return equation does not favor continued exploitation in the high seas by bottom trawlers.

52 Catching More Bait: a bottom-up re-estimation of global fisheries subsidies, Sumaila and Pauly (eds.)
There is at present two fora to which these findings are relevant (see Gianni, 2004):
i) WTO negotiations on global subsidies disciplines in agriculture and fisheries (see Khan et al., 2006); and
ii) The ongoing debate at the U.N., where a proposal is being considered to establish a moratorium on high seas bottom trawling due to the damage to the habitats that trawlers cause.
Given the current profitability of trawlers, it appears that subsidies, in particular, fuel subsidies may prove to be the Achilles’ heel of the deep sea trawl fleets: their huge fuel consumption makes them extremely sensitive to fuel price increases (Tyedmers et al., 2005).
Thus, combining (i) and (ii) above, we believe that given continued increases in petroleum prices, many of the conservation goals of NGOs may be achieved by focusing their efforts on persuading governments not to increase fuel subsidies in particular, to these fleets (Pauly et al., 2003). The key argument in favor of this stance is that – given climate change driven by the burning of fossil fuels – there surely is a better way for governments to spend money than by increasing subsidies to a fleet that wastes fuel to maintain paltry catches of fish, from highly vulnerable stocks, while destroying their habitat in the process.
ACKNOWLEDGEMENTS
We are grateful to the Sea Around Us Project, a Partnership of the Pew Charitable Trusts, for support. R. Sumaila also acknowledges the support of the European Community’s Program for International Scientific Co-operation (INCO) through Contract 003739 for INCOFISH project, the Lenfest Ocean Program and the Marine Conservation Biology Institute. We also thank Gianni Matt Gianni for useful comments on an earlier draft of this paper.
REFERENCES
Anonymous, 2005a. Profitability in fishing and fish processing 2003. (Available at: www.statice.is/lisalib/getfile.aspx?ItemID=975)” (Statistics Iceland, 2005).
Anonymous, 2005b. Operating results of whole-year operated fishing vessels 13 meters and more, by fishery. Average per vessel. 2002. Available at: www.ssb.no/english/subjects/10/05/nos_fiskeri_en/nos_d321_en/tab/tab-52.html” (Statistics Norway, 2005).
Clark, C.W., 1973. The economics of overexploitation. Science 181, 630-634.
Clark, C.W., Munro, G.R., Sumaila, U.R., 2005. Subsidies, buybacks, and sustainable fisheries. J. Environ. Econ. Manage. 50, 47-58.
FAO, 1992. Marine Fisheries and the Law of the Sea: A Decade of Change. FAO Fisheries Circular No.853, FAO, Rome.
Froese, R., Sampang, A., 2004. Taxonomy and biology of seamount fishes. In: Morato, T., Pauly, D. (Eds.), Seamounts: Biodiversity and Fisheries, pp. 25–31. Fisheries Centre Research Reports 12(5). [Available at: http://www.seaaroundus.org/report/seamounts/08_RFroese/RF_TEXT.pdf].
Gianni, M., 2004. High seas bottom fisheries and their impact on the biodiversity of vulnerable deep-sea ecosystems: Summary findings. International Union for Conservation of Nature & Natural Resources. Available at: http://www.iucn.org/themes/marine/pdf/MattGianni-CBDCOP7-Impact-HS-BottomFisheries-Complete.pdf#search=%22Gianni%20high%20seas%22.
Gordon, H.S., 1954. The Economic Theory of common property resource: the fishery. J. Polit. Economy. 62, 124-143.
Khan, A., Sumaila, U.R., Watson, R., Munro, G., Pauly, D., 2006. The nature and magnitude of global non-fuel fishery subsidies. In: Sumaila, U.R., Pauly, D. (ed.) Catching more bait: a bottom-up re-estimation of global fisheries subsidies. Fisheries Centre Research Reports 14(6). Fisheries Centre, University of British Columbia.
Koslow, J.A., Boehlert, G., Gordon, J.D.M., Haedrich R.L., Lorance P., Parin, N., 2000. Continental slope and deep-sea fisheries: implications for a fragile ecosystem. ICES J. Mar. Sci. 57, 548–557.
Milazzo, M., 1998. Subsidies in world fisheries: a re-examination. World Bank Technical Paper. No. 406. Fisheries series, The World Bank, Washington, DC.
Morato, T., Watson, R., Pitcher, T., Pauly, D., 2006. Fishing down the deep. Fish Fish 7 (1), 23-33.
Morato, T., Cheung, W., Pitcher, T.J., 2006. Vulnerability of seamount fish to fishing: fuzzy analysis of life-history attributes. J. Fish Biol. 68, 209–221.
Pauly, D., Alder, J., Bennett, E., Christensen, V., Tyedmers, P., Watson, R., 2003. The future for fisheries. Science. 302, 1359-1361.

Subsidies to high seas bottom trawl fleets, Sumaila et al. 53
Roberts, C.M., 2002. Deep impact: the rising toll of fishing in the deep-sea. Trends Ecol. Evol. 17, 242–45.
Sumaila, U.R., Marsden, A.D., Watson, R., Pauly, D., (In press). Global Ex-Vessel Fish Price Database: Construction, Spatial and Temporal Applications. J. Bioecon.
Sumaila, U.R., Teh, L., Watson, R., Tyedmers, P., Pauly, D., 2006. Fuel subsidies to fisheries globally: Magnitude and impacts on resource sustainability. In Sumaila, U.R., Pauly, D. (eds.), Catching more bait: A bottom-up re-estimation of global fisheries subsidies. Fisheries Centre Research Reports 14(6), pp. 35-45. Fisheries Centre, the University of British Columbia, Vancouver, Canada.
Sumaila, U.R., Walters, C., 2005. Intergenerational discounting: a new intuitive approach. Ecolog. Econ. 52, 135-142.
Tyedmers, P., Watson, R., Pauly, D., 2005. Fuelling global fishing fleets. Ambio. 34, 59-62.
Watson, R., Kitchingman, A., Gelchu, A., Pauly, D., 2004. Mapping global fisheries: sharpening our focus. Fish and Fish 5, 168-177.

Catching More Bait: a bottom-up re-estimation of global fisheries subsidies, Sumaila and Pauly (eds.)
54
CHAPTER 4
OVERSEAS DEVELOPMENT ASSISTANCE TO FISHERIES AS A SUBSIDY1
Jackie Alder1, Helen Fox2 and Miguel Jorge3
1Fisheries Centre, Aquatic Ecosystems Research Laboratory (AERL), University of British Columbia. 2202 Main Mall, Vancouver, BC., V6T 1Z4, Canada
2WWF-US, Washington DC 3WWF-International, Gland Switzerland
ABSTRACT
Overseas development assistance (ODA) serves a multitude of purposes depending on the type of aid, the perceived needs of the recipient country and the foreign policies of the donor country. This study documents that ODA, while jump-starting modern fisheries in many areas, has not helped toward countries establishing management and enforcement infrastructures for these fisheries, thus indirectly contributing to the overfishing now occurring in most developing countries. Among ODA-recipient countries the trade-off with overfishing is seen in either increasing value of exported fish or in increasing consumption of seafood, and in some regions, both benefits occur.
ODA, like other fisheries subsidies, can be considered as either good, bad or ugly, depending on whether they contribute to sustainability and long-term human well-being or not. Data extracted from the OECD development assistance online database and other sources suggest that OECD assistance contributed to the development of the industrial fisheries sectors in recipient regions throughout the world. Bad subsidies, such as capital, infrastructure and technical support, which peaked by the 1990s, facilitated growth in fishing capacity, which is a major driver of overfishing today. Despite a shift in ODA to focusing on management, the significant decline in ODA to the fisheries sector, which commenced in the early 1990s, prevents many countries from addressing the issue of overfishing – a case of too little money, too late. Policy-makers in developed countries as well as in financial institutions need to reconsider the levels of assistance to these countries if they are genuinely interested in stemming overfishing.
INTRODUCTION
Economic development of many fisheries in the developing world has been achieved mainly by trading off the sustainability of fish stocks, food security and foreign exchange, and has been made possible through overseas development assistance (ODA). The impetus for donor countries to assist recipient countries in developing their economies through resource extraction sectors including fisheries ranges from altruism to economic or strategic (i.e., military) advantage. Overseas development assistance (ODA) has been effective in boosting the fisheries sectors in many developing countries as well as increasing food security directly or indirectly through exports, generating foreign exchange in the process. However, it has not contributed to halting the result of the growth of the sector, i.e., the decline of fish stocks in these same countries.
Overseas development assistance can be described as aid given by developed countries to support economic development in developing countries. This form of aid has been practiced by many countries with strong economies for decades and is distinct from humanitarian aid which is focused on short-term aid to relieve human suffering caused by a crisis such as war or natural disasters. ODA has been a significant component of the world economy since the 1960s, and in some countries a significant source of revenue (Berlage and Stokke, 1992).
1 Cite as: Alder, J., Fox, H., Jorge, M. 2006. Overseas development assistance to fisheries as a subsidy. In: Sumaila, U.R., Pauly, D (eds.), Catching more bait: a bottom-up re-estimation of global fisheries subsidies. Fisheries Centre Research Reports 14(6) , pp. 54-67. Fisheries Centre, the University of British Columbia, Vancouver, Canada.

Overseas development assistance to fisheries as a subsidy, Alder et al.
55
Colonial powers such as the United Kingdom and France provided capital to their colonies to develop selected sectors of their economies and this has led to relationships which have transcended the independence of these colonies. In other countries, especially in Europe, foreign policy included assistance to newly independent countries of what was to become the Third World for altruistic reasons in a few cases, and for economic and/or military gains in most other cases. Developed countries such as Canada, Australia, New Zealand and more recently Japan have a history of also providing substantial assistance to developing countries (Bailey 1988). The nature and scope of ODA varies from country to country as well as from sector to sector (e.g., health, education and governance) making it difficult to generalize the nature, scope and extent of ODA. However, fisheries development and more recently and in particular, fisheries management, is often included in ODA programs because of its strong links to food security, jobs for the unskilled or poorly educated, and potential to generate foreign exchange.
ODA to the fisheries sector in this paper can be described as the transfer of funds from developed to less developed countries’ capture fisheries sector, which is used to assist the recipient country to develop or manage its capture fisheries resources. The funds are generally in the form of gratis grants without any repayment obligations. These grants can be considered as subsidies and as such can be good, bad or ugly (Khan et al. this volume). Many countries have provided grants to countries to develop their fishing sectors to meet their constituency’s humanitarian aid expectations as well as for economic opportunities including gaining access to new fishing grounds (Bailey, 1988). While adequate ODA funds were provided to develop a range of fisheries over the last 30 years, recent funding levels have not been sufficient to effectively manage the fisheries they assisted in developing. This paper reviews the history of ODA with reference to the fisheries sector, presents trends in ODA and looks at the potential impacts it has had on fish stocks, food security and foreign exchange through exported fish products and evaluates ODA to determine whether it is a good, bad or ugly subsidy.
BACKGROUND
History of overseas development assistance
Overseas development assistance has existed in one form or another since countries established colonies throughout the world. The metropolitan countries would provide capital to cover costs of establishing and maintaining various institutions and infrastructure (e.g. ports and road) and indirect support through forced labour as seen in sending convicts to Australia. ODA in its current form did not begin until the latter half of the 20th century when colonies gained independence and received direct support from formerly metropolitan or other wealthy countries (e.g. Germany, or the Scandinavian countries) as they began to consider the need to assist communities that were economically or socially disadvantaged. This has become institutionalized in the European Union, which concentrates on the former colonies of its member countries in Africa, the Caribbean and the Pacific, i.e., the ‘ACP countries’, with which it has numerous agreements, including fisheries aid. Similarly, the (British) Commonwealth provided a framework for the emergence of Canada and Australia as significant donor countries.
In some countries, development assistance was also perceived as securing military or economic alliances regionally or internationally, as seen in the US and its support for some African and Asian countries, and in the USSR in its support of Cuba and a contrasting set of African and Asian countries (Bach 1987). The value and purpose of ODA expanded from initially supporting newly-formed countries with governance, health and welfare services such as hospitals and basic economic and infrastructure development such as banking, roads and electricity to sector specific initiatives, which often focused on natural resources extraction until the early 1990s. Although financial assistance was often provided to former colonies to assist in gaining economic independence and social development, it has not been that effective in facilitating development or reducing poverty (Alesini and Dollar 2000).
Despite calls for greater altruism through development assistance from developed nations starting in the late 1980s in the Bruntland Report, and following on at the Earth Summit in Rio in 1992 in which specific calls were made for increased funding to developing nations, no significant increases in funding eventuated in the 1990s. Spin-off UN conferences on sustainable development throughout the 1990s, as well as calls for ODA in the Millennium Development Goals and at the most recent World Summit on Sustainable Development in 2002 have also not generated significant funding for fisheries. The reality is shrinking development funding and ‘donor fatigue’ (Amalric 2000) is same situation occurs for ODA in the fisheries sector throughout the developing world.

Catching More Bait: a bottom-up re-estimation of global fisheries subsidies, Sumaila and Pauly (eds.)
56
ODA in the Fisheries Sector
While many colonies gained independence in the 1950s and 1960s, the modern era of fisheries ODA began in the early 1950s, when Norway introduced shrimp trawling in Kerala, India (Bailey 1988). However, substantial fisheries ODA did not begin until the mid 1960s, and only gained momentum in the 1970s (Figure 1). Bailey (1988) provided the first global analysis of the growth of ODA in the fisheries sector and pointed out that while ODA was successful in expanding fisheries in developing countries, it also contributed to overexploitation of fish resources and social disruptions. Intensive capitalization of the fisheries sector combined with technical assistance, which benefited industrial scale fishers and often marginalized small-scale fishers were identified as the main drivers of these changes. Where ODA included access to fish resources, it did not necessarily capture resource rents as well as it could (ICTSD 2000).
Figure 1. Overseas development assistance to the fisheries sector in four regions from 1973 to 2004, represented as a five-year moving average of the values in OECD (2006).
Fisheries ODA as a Subsidy
Fisheries ODA can be described as a subsidy as defined in Khan et al. (this volume), since it is a form of financial payment from public entities (donor governments) to the fishing sector, and it helps the sector improve its profitability, more than it would otherwise. Although considerable effort has been expended to define and categorize fisheries subsidies (Cox 2003) they can be described as either impacting sustainability positively (good), negatively (bad) or unknown (ugly). Like all subsidies some ODA transfers are good, bad or ugly subsidies (Khan et al. this volume).
The subsidy categories described by Cox (2003) form the framework for the categories used for ODA in this report, and include capital, infrastructure, technical assistance (i.e., to improve production), research, training and management (which includes enforcement). Capital, infrastructure, technical assistance, increased effort and fishing efficiencies are therefore considered bad subsidies. Management is considered a good subsidy since it attempts to regulate exploitation and (usually) to make it sustainable. Research and training are generally considered good subsidies because they can have a positive impact of fisheries sustainability - by improving the information base on which decisions are made, and training can improve managers’ capacity to manage fisheries. However, when research and training is then used to increase exploitation rates, they are considered bad subsidies.
SOURCES OF DATA
Data used in this report were derived from four publicly available sources: Organization of Economic Cooperation and Development (OECD), the Food and Agricultural Organization of the UN (FAO), the United Nations (UN) and the Sea Around Us Project, as summarized in Table 1. Some processing, as

Overseas development assistance to fisheries as a subsidy, Alder et al.
57
described below, for the OECD and FAO datasets, was required to ensure datasets were harmonized as much as possible. Although the data stem from a range of sources of varying quality, within a defined database, all data were consistent across countries and regions. Nevertheless, the results presented are more representative of relative, rather than absolute, differences between regions.
Table 1. Sources of data used. Agency Database Access Site Accessed OECD International Development
Statistics http://www.oecd.org/dataoecd/50/17/5037721.htm 19 Sept ‘06
FAO Fisheries Commodities Production and Trade (FishStat)
http://www.fao.org/figis/servlet/static?dom=root&xml=index.xml
19 Sept ’06
FAO Food Quantity http://faostat.fao.org/site/346/default.aspx 11 Sept ‘06 FAO Protein http://faostat.fao.org/site/346/default.aspx 11 Sept ‘06 United Nations United Nations Common
Database http://unstats.un.org/unsd/cdb/cdb_help/cdb_quick_start.asp
10 Sept 2006
Sea Around Us Catches www.seaaroundus.org 02 Sept ‘06 IFS database International Monetary Fund http://www.imf.org/external/data.htm 02 Sept ‘06
Organization of Economic Cooperation and Development
The OECD maintains a database of international development statistics on transfers from OECD countries to developing countries since the early 1970s. The data contains a range of information including commitment year, region, donor and recipient countries, value, description and sector. The database was initially filtered to capture only grants to the fisheries sector. Non-spurious records were then classified into the purpose categories based above, or based on the title and description provided for each project. Also, a filter was applied to distinguish capture fisheries from aquaculture projects and whether the assistance was bilateral or multilateral. This yielded a total of 4060 records that could be used in our analyses. The start and end dates of most projects were often missing, so it was assumed (as in Khan et al. this volume) that the funds committed were expended over a 5-year period starting on the commitment date. Finally, a 5-year moving average was applied to all time-series computed for and presented in this contribution. The regions used by the OECD (Table 2) formed the spatial basis for the analyses and reporting since country level information was highly variable over the last 30 years (Figure 2). Regional data was also aggregated to report on a continent basis. For the purpose of our analysis, Australia and New Zealand were excluded from Oceania. Because LME 32 spans two OECD regions, it was counted twice: West and South Asia (Table 2).
Table 2. Countries, regions and continents within the OECD Development Statistics database and corresponding large marine ecosystem (LME). Continent OECD Region LME Countries Latin America
5 Caribbean and Central America
4, 11,12 All countries
6 South America 13,14,15,16,17 All countries (except land-locked Paraguay and Bolivia) Africa 2 North of Sahara 27 Morocco, Egypt, Tunisia, Algeria, Mauritania 2 South of Sahara 28, 29, 30, 31 Guinea, Tanzania, Cape Verde, Seychelles, Angola, Uganda, Namibia,
Comoros, Guinea Bissau, Gambia, Côte d’Ivoire, Nigeria, Ghana, Benin, Togo, Madagascar, Kenya, Eritrea, Senegal
Asia 11 West Asia 32, 33 Palestine, Yemen, Iran, Saudia Arabia, Oman, United Arab Emirates, Lebanon, Bahrain, Iran
South Asia 32, 34 India, Bangladesh, Maldives, Sri Lanka, Myanmar, Pakistan Southeast and
East Asia 35,36,37,38,47,48 China, Indonesia, Philippines, Malaysia, Thailand, Vietnam, Cambodia,
Korea, Brunei, East Timor Oceania 12 Oceania No LME All states, except Australia and New Zealand

Catching More Bait: a bottom-up re-estimation of global fisheries subsidies, Sumaila and Pauly (eds.)
58
Figure 2. OECD regions and the large marine ecosystem (LMEs) selected here to correspond to these regions (see Table 2 for countries and LMEs included in each region).
FAO Stats
Food quantity (pelagic and demersal [marine] fish and invertebrates) was extracted for each country, expressed on a per capita basis using population estimates from the United Nations Common Database. Import and export quantities and value were also extracted, and export values were converted to real values for the year 2003 based on the International Monetary Fund’s IFS database as described below, making them compatible with the real 2003 prices expressed in the OECD dataset. Fish food quantity and daily fish protein were used to examine food security and ODA.
United Nations Common Database
Annual population estimates were extracted for each of the regions to estimate the per-capita consumption of food quantity as described in Table 1.
Sea Around Us
Catch data from the Sea Around Us Project (Watson et al. 2004) were extracted by large marine ecosystem (Figure 2) and LME’s corresponding to the broad regions and continents. The data were used to estimate the proportion of fish stocks that were either overexploited or collapsed since 1950 based on the method described by Froese and Pauly (2004).
International Monetary Fund
The IFS database was used to extract consumer price index information needed to adjust export values to the year 2003 so that they could be compared to real values adjusted to year 2003 in the OECD database.

Overseas development assistance to fisheries as a subsidy, Alder et al.
59
RESULTS
Global and Regional Trends
ODA to the fisheries sector increased globally from the early 1970s to the late 1980s, and has declined since (Figure 1). The OECD database for fisheries related information includes aquaculture initiatives, but the value of ODA for aquaculture is much lower; generally one-tenth of the funding (Figure 3). Like ODA to capture fisheries, funding declined significantly beginning in the early 1990s and this declining trend continues today.
Figure 3. Proportion of overseas development assistance targeting aquaculture within a broadly defined ‘fisheries’ sector (%).
Although the former USSR had a significant assistance program in many developing countries (Cuba, West Africa, and Vietnam), the value of their assistance relative to OECD levels is low. In 1989, 90% of total ODA was from OECD members (Berlage and Stokke 1992). A comparison of OECD (Butterfield and Williams 2004) and the former USSR (Bach 1987) assistance in the 1970s and 1980s also supports Berlage and Stokke’s (1992) estimate. In the following, the USSR is therefore ignored.
Regionally, the funding for ODA peaked at different times: in the early 1980s in Asia and Latin America, the late 1980s in Africa and the early 1990s in Oceania (Figure 1). The purpose of ODA has also changed over time, with funding over the last 30 years primarily targeted to technical assistance, which has focused primarily in increasing fishing efficiency (Figure 4). The levels of funding for other forms of assistance have also changed over time with funding for capital assistance was higher in the late 1970s and early 1980s and declined to current very low levels. A similar pattern emerges for infrastructure (e.g. harbour, ice plants), which peaked in the mid 1980s and then declined steadily. Funding for management began to increase until the early 1990s, peaked in 2000, and has since declined. Research funding has been low relative to other forms of assistance. Training and other unknown transfers are a small part of total ODA to the fisheries sector on a global scale.

Catching More Bait: a bottom-up re-estimation of global fisheries subsidies, Sumaila and Pauly (eds.)
60
Figure 4. Overseas development assistance to the fisheries sector, by purpose, from 1973 to 2004, expressed as a five-year moving average of data in OECD (2006).
Fish Stocks
In all four regions of the world the proportion of stocks over-exploited or collapsed increased over the period of study (Figure 5). In Africa and Oceania, declining stocks track ODA quite closely until funding drops until the early 1990s, the proportion of stocks continue to increase despite much lower ODA funding levels throughout the 1990s. In Asia and Latin America the correspondence between ODA funding and degraded fish stocks is not as strong, but reflects a similar trend (Figure 5).

Overseas development assistance to fisheries as a subsidy, Alder et al.
61
Overexploited/collapsed stocks
Overexploited/collapsed stocks
Overexploited/collapsed stocks
Overexploited/collapsed stocks
Overexploited/collapsed stocks
Overexploited/collapsed stocks
Overexploited/collapsed stocks
Overexploited/collapsed stocks
Figure 5. Trends in overseas development assistance (5–year moving averages of OECD data) and cumulative % of stocks overexploited or collapsed (as defined in Froese and Pauly (2004).
Food Security
Fish (as food) available on a per-capita basis (Figure 6) and per-capita fish protein (Figure 7) consumption were used to investigate the impact of ODA on food security. Because of varying differences in cultures and food preferences, as well as levels of food security across the developing world, regional analyses were considered more appropriate. In some regions, such as Africa and Latin America, sub-regional analyses were also undertaken (Figures 6 and 7).

Catching More Bait: a bottom-up re-estimation of global fisheries subsidies, Sumaila and Pauly (eds.)
62
Figure 6. Trends in overseas development assistance (5-year moving averages of OECD data) and per-capita seafood availability (from FAO).

Overseas development assistance to fisheries as a subsidy, Alder et al.
63
Figure 7. Trends in overseas development assistance (5-year moving averages of OECD data) and per-capita fish protein consumption (based on FAO data).
South of the Sahara, food security in the form of fish food and fish protein increases with ODA increases. When ODA value declines in the 1990s, food security also declines, although not strongly; food security increases again when ODA increases (Figure 6 and 7). North of the Sahara, where fish is not the preferred protein, the pattern is quite different. The value of ODA, per capita food quantity and per-capita protein are much lower than South of the Sahara (Figures 6 and 7). Food quantity increases independent of food quantity; however, per-capita fish protein consumption increases with increasing ODA value (Figure 7).
In Latin America, levels of per-capita fish food available and per-capita fish protein consumption in South America and Central America and the Caribbean are similar. However, in South America, both indicators of food security are independent of ODA value in the fisheries sector. In Central America and the Caribbean, changes in ODA value are reflected in changes in fish food availability but not in per-capita fish protein consumption (Figures 6 and 7). Per-capita fish food available and per-capita fish protein consumption are independent of the value of ODA in West Asia and Southeast and East Asia. In South Asia, changes in per-capita fish protein consumption follow changes in the value of ODA but changes in fish food availability do not follow the value of ODA (Figures 6 and 7). In Oceania, both food security indicators increase with increasing ODA until the mid 1990s when ODA levels decline and food security continues to increase (Figures 6 and 7).

Catching More Bait: a bottom-up re-estimation of global fisheries subsidies, Sumaila and Pauly (eds.)
64
Exports
In all regions, the value of exports has increased since the early 1970s (Figure 8). Africa and Latin America have similar trends in the value of exports and ODA until the 1970s and 1980s. The value of fish exports is similar to the value of ODA and the value of exports increases along with increasing ODA until it begins to decline in the 1990s. Although ODA declines from the 1990s onward, exports continue to increase in both regions (Figure 8).
In Asia, the value of exports is much higher than the value of ODA; much are invertebrates, with some of that value derived from aquaculture beginning in the late 1980s. Therefore, export values reported here could be overestimated, since only ODA to the fisheries sector is used in the analyses. Nevertheless, increasing export value follows increasing ODA in the 1980s, but not in the 1990s and later, when ODA declines and export values continue to increase along with the proportion of fish stocks that are overexploited or collapsed.
In Oceania, export value is highly variable and does not reflect the trend in ODA to the region. Throughout much of the 1980s and 1990s, the value of ODA to the region is much higher than exports (Figure 8). Unlike the other three regions, changes in export values over the study period do not correspond to changes in the proportion of fish stocks that are overexploited until the late 1990s, when the value of exports exceeds ODA.
Figure 8. Trend in overseas development assistance (5-year moving averages of OECD data) and export value of seafood (values are ex-vessel; Sumaila et al. in press).

Overseas development assistance to fisheries as a subsidy, Alder et al.
65
DISCUSSION
The analysis of the proportion of stocks overexploited or collapsed over the study period indicates that ODA has had little, if any, positive impact on declining fish stocks. The analyses suggest that the high proportion of capital, infrastructure and technical assistance in the early 1970s and 1980s (Figure 4) was effective in increasing fish catches and establishing industrial fishing sectors, also as suggested by Bailey (1988). However, the decline of ODA funding, especially for management, in the 1990s also reduced the capacity of developing countries to heed scientists’ warnings over the number of overexploited fish stocks globally and answer calls for improved fisheries management (van Santen 2005). The likelihood of developed countries providing the necessary funding to reverse the current trend (which they have contributed to bringing about) is remote based on current funding levels (Figure 4).
The countries receiving ODA to develop and maintain their fisheries sectors have traded fish resources for food security directly or indirectly, and economic development. Throughout the regions changes in food security as measured by fish food availability and fish protein consumption, and exports have been observed in relation to trends in ODA and for these indicators the trade-offs with fish stocks can be assessed.
The impact of ODA on food security is not consistent across the regions. North of the Sahara, which includes Morocco with its rich marine resources, fish is not the primary source of food or protein, and so it is not surprising that ODA has not had a direct impact on food security. However, it is likely that ODA has assisted in increasing catches that are destined for export and generating foreign exchange, which in theory, ultimately returns to the economy and indirectly affects food security. In South America, where fish consumption is low in many countries including Peru and Chile with some of the world’s largest fisheries ODA is also not directly linked to food security. However, it likely facilitated the development of industrial fisheries and ultimately the generation of foreign currency, which contributes to development of the national economy. ODA has impacted food security in Central America and the Caribbean, where fish consumption is higher than in South America and contributes to the economies of many countries in the region.
Fish consumption in West Asia is also low and the value of fish exports is also low, suggesting that ODA has not had a direct or indirect the impact on fish food security in West Asia. ODA has been effective in South Asia, which includes India, since the value of exports has increased with increasing ODA, and after ODA declines exports continue to increase, as well food security also increased especially over the last 10 years. The impact of ODA on the food security of Southeast and East Asia has been minimal despite the high consumption of fish in the region. Assessing the impact of ODA on exports in Asia is difficult because the FAO export statistics do not differentiate between wild capture fish and farmed fish. Prior to the expansion of aquaculture in the region, exports grew as ODA increased suggesting that at least in the 1980s ODA contributed to increasing exports. ODA has also impacted positively on the food security of Oceania where fish are an important and cheap source of protein.
In regions where fish resources are abundant but not consumed, increasing ODA has increased fish landings, much of it being exported since it surplus to domestic demand or the value is much higher and the foreign exchange earned on the exports is used to fund imports cheaper food, but at the cost of fish stocks. The increasing exports out of Africa and Latin America reflect increasing fish catches and most likely increasing numbers of over-exploited fish stocks as discussed above. While exporting more valuable fish in return for more, but cheaper fish, is an optimal use of a public resource, there are few cases of where this is undertaken as seen in Africa, especially West Africa, where exports are high, but imports of cheaper fish are low. As a result many West African countries are classified as low income and food deficit countries (FAO 2006).
The trend in ODA and stocks, exports and food security also demonstrates a ratchet effect (Ludwig et al. 1993). In the case of ODA, the sequential changes in the type of ODA granted from capital to infrastructure and then technical assistance were incremental changes which increased fishing capacity, effort and in some cases fishing efficiency. These inputs are considered to be major drivers of the current overfished state of many stocks globally. The decline in funding, especially for management, since the early 1990s also avoids addressing the issue of reducing effort because for many fishers there are few alternative employment options or for excess vessels few other uses.

Catching More Bait: a bottom-up re-estimation of global fisheries subsidies, Sumaila and Pauly (eds.)
66
Bailey (1988) with limited data pointed out that ODA was a major factor in declining fish stocks in developing countries. More than 10 years later and with continuing calls for better management of fisheries including monitoring and enforcement (good subsidies) throughout the world (United Nations 2002) , the establishment of global and regional fisheries agreements (Alder and Lugten 2004), the Millennium Development Goals (United Nations 2006) and other targets, little if any progress has been made. Donor countries and financial institutions have reduced ODA funding globally and regionally making it difficult for developing countries to address overfishing in their Exclusive Economic Zones. Suggestions for improved management of fisheries often includes training and building capacity within government agencies, establishing monitoring and enforcement programs and in some countries reducing capacity. All of these initiatives require funding, often from government, and beyond the budgets of most governments. Recovering these costs from industry would be difficult and subject to corruption and where there is a significant artisanal sector, it would negatively impact on fisher incomes.
While it can be argued that ODA is not the only source of funding for developing countries to address their overfishing challenges, bank loans and selling access rights for their fish resources either increase government debt, or put fish resources at further risk. Donor countries, either through direct grants or through access agreements and joint ventures, are in part, responsible for the current state of fisheries and they need to also consider being part of the solution and need to reconsider levels of funding for managing fisheries as well as new models for delivering assistance.
CONCLUSION
Overseas development assistance, as a subsidy, is good, bad or ugly depending on the type of ODA that is delivered in the fisheries sector. An analysis of the data from the OECD and other sources suggests that OECD assistance was effective in improving the fishing capacity and efficiency of fishers in recipient regions through capital, infrastructure and technical support (bad subsidies) resulting in overfished stocks throughout many developing countries. This form of assistance peaked by the 1990s and has since declined. However, despite a shift in ODA to focusing on management (good subsidy), countries with fisheries ODA budgets have failed to stop the trend in overfishing, – a case of too little money, too late. Policy makers in developed countries as well as in financial institutions need to reconsider the levels of development assistance needed to address the challenge of overfishing in these countries and to explore new models that balance sustainable resource use, economic development and human well-being to deliver such assistance if they are genuine in stemming overfishing.
ACKNOWLEDGEMENT
We would like to thank Brooke Campbell and Daniel Pauly for their assistance in preparing this report.
REFERENCES Alder, J, Lugten, G. 2004. Frozen fish block: how committed are North Atlantic states to accountability, conservation and
management of fisheries? Marine Policy 26 345-357.
Alesina, A., Dollar, D. 2000. Who gives foreign aid to whom and why? Journal of Economic Growth 101, 33-63.
Amalric, F. 2000. Challenges in the governance of North-South solidarity in the age of globalization. Development, Rome, 434, 6-10.
Bach, Q. V. S. 1987. Soviet economic assistance to the less developed countries: A statistical analysis. Oxford, Clarendon Press.
Bailey, C. 1988. The political economy of fisheries development in the third world. Agriculture and Human Values, Winter Spring, 35-48.
Berlage, L., Stokke, O. 1992. Evaluating development assistance: State of the art and main challenges ahead, pp. 1–32. In: Stokke, O., Berlage L. (eds.), Evaluating Development Assistance : Approaches and Methods, EADI Book Series 14, London. Frank Cass.
Butterfield, S. H., Williams, M. 2004. U. S. development aid - An historic first. Westport, Connecticut, Praeger.
Cox, A. 2003. Environmental aspects of fisheries subsidies. OECD, Directorate for Food, Agriculture and Fisheries, Paris.
FAO. 2006. Low-Income Food-Deficit Countries (LIFDC). [Available at http://www.fao.org/countryprofiles/lifdc.asp?lang=en. Accessed 21 September 2006].
Froese, R., Pauly, D. 2003. Dynamik der Überfischung. p. 288-295. In: Lozán, J.L., Rachor, E., Reise, K., Sündermann, J., von Westernhagen, H. (Hrsg.). Warnsignale aus Nordsee und Wattenmeer – eine aktuelle Umweltbilanz. GEO, Hamburg.
International Centre for Trade and Sustainable Development (ICTSD). 2000. Ensuring trade rules affecting fisheries are supportive of sustainable development International Centre for Trade and Sustainable Development, Geneva, Switzerland.

Overseas development assistance to fisheries as a subsidy, Alder et al.
67
Khan, A., Sumaila, U.R., Watson, R., Munro, G., Pauly, D. 2006. The nature and magnitude of global non-fuel fisheries subsidies., p. 1-34. In: Sumaila, U.R., Pauly, D. (ed.) Catching more bait: a bottom-up re-estimation of global fisheries subsidies. Fisheries Centre Research Reports 14(6). Fisheries Centre, University of British Columbia.
Ludwig, D., Hilborn, R., Walters, C. 1993. Uncertainty, resource exploitation, and conservation: lessons from history. Science 260, 36-37.
United Nations. 2000. 55/2 United Nations Millennium Declaration. [Available at http://www.un.org/millennium/. Accessed 21 September 2006].
United Nations. 2002. Report of the World Summit on Sustainable Development. United Nations, New York.
van Santen, G. 2005. Governance of marine fisheries and its impact on rural poverty: past,present and future. Paper presented at Changing Currents Forum, Feb 2005. Vancouver, British Columbia. Simon Fraser University, Burnaby, BC. [Available at http://lnweb18.worldbank.org/ESSD/ardext.nsf/26ByDocName/Workshop-Chapter1/$FILE/Workshop-Chapter1.pdf ].
Watson, R., Alder, J., Kitchingman, A., Pauly, D. 2004. Catching some needed attention. Marine Policy 29, 281-284.

68 Catching More Bait: a bottom-up re-estimation of global fisheries subsidies, Sumaila and Pauly (eds.)
CHAPTER 5
A HISTORICAL ACCOUNT OF BRAZILIAN POLICY ON FISHERIES SUBSIDIES1
Patrizia R. Abdallah1 and Ussif Rashid Sumaila2
1Department of Economics, Federal University of Rio Grande, Italia Avenue km 08, Rio Grande RS, 96201-900, Brazil
2Fisheries Economics Research Unit, Fisheries Centre, University of British Columbia. 2202 Main Mall, Vancouver BC, V6T 1Z4, Canada
ABSTRACT
We present a historical account of Brazilian public policy on fisheries subsidies, and discuss problems and limitations resulting from this policy. From the 1960s to the mid-1980s, this policy led to a great increase in fisheries catch, but without appropriate consideration for the long-term sustainability of the resources, resulting in declining catches over the years. The goals of current Brazilian public policy on fisheries will not help towards reducing overexploitation. These policies are too optimistic about the abundance of fish in Brazil’s EEZ, and are not accompanied by a fisheries management plan that is likely to work.
INTRODUCTION
The fishery is one of the earliest productive activities in Brazil. Since the 1990s, a large decline and even collapse of many fish species has attracted considerable attention from the media and society. The increasing world awareness regarding the need for preservation and conservation of natural resources has pushed the fisheries sector into dedicating more research into the formulation of effective public policies. Such policies are necessary for the development of sustainable fisheries management practices.
The impact of subsidies on fisheries management is a subject of frequent debate among researchers around the world (Millazzo 1998; Munro and Sumaila, 2002; Clark et al., 2005; Khan et. al., this volume). Are subsidies harmful economic instruments, contributing negatively to fisheries management and sustainability? International bodies and researchers have been paying increasing attention to the importance of this debate which is of great importance to developing countries such as Brazil. Yet, discussing the impact of subsidies on fisheries management in Brazil requires an understanding of how these subsidies work.
Given the importance of fish as a natural and economically exploitable resource, evaluating Brazil’s fishing incentive program is fundamental. This paper analyzes the effect of fishing incentive policy on the evolution of Brazilian fish catch.
Subsidies provided by the Federal Government to fisheries in Brazil will be characterized and described, as well as their evolution through the years (from the 1960s to the 1990s), and the possible relationship between their evolution and the evolution of the Brazilian fish catches. Finally, current Brazilian fisheries public policy will be characterized and analyzed.
1 Cite as: Abdallah, P. R., U. R. Sumaila. 2006. A historical account of Brazilian policy on fisheries subsidies. In Sumaila, U.R., Pauly, D. (eds.), Catching more bait: a bottom-up re-estimation of global fisheries subsidies. Fisheries Centre Research Reports 14(6) , pp. 68-77. Fisheries Centre, the University of British Columbia, Vancouver, Canada.

A historical account of Brazilian policy on fisheries subsidies, Abdallah and Sumaila 69
FEDERAL FISHERIES PUBLIC POLICY IN FISHERIES ACTIVITY IN BRAZIL – 1960S TO THE 1990S
Beginning in the 1960s, the Fish Agro-food System (FAS), a system that unites fishery activity (catch and sale of fresh fish), provision of fishing inputs (ships and nets, mainly), and the industrial manufacture and marketing of processed fish and fish products, started to be affected by two significant public policies implemented by the Brazilian government: fiscal incentives and rural credit. These were the main support lines used for the promotion of fishery activities in Brazil. Both policies played a fundamental role in the increase of fish catch. Other kinds of fisheries incentives were also implemented during this period, but were of little significance. Fishery policy is understood to be an action intended to regulate and/or stimulate fishery activity. According to Abdallah (1998), there is a lack of interaction between policies that regulate the activity and policies that promote the activity in Brazil. While the legislation is concerned with regulating the access and use of the natural resource (although there is still a lack of experience to accomplish effective regulation), a policy to promote the activity intends to increase fish catch and to advance the fishing sector (FAS).
As mentioned, this study explains two kinds of public policies implemented in Brazil’s fisheries (fiscal incentives and rural credit). Additional types of public policies regarding fisheries activities in Brazil can be found in Abdallah (1998), Souza (2001), Souza et al. (2001), Abdallah and Bacha (2003), Souza and Abdallah (2003), and Vasconcellos et al. (2003).
The fiscal incentive policy to increase fish catch in Brazil
On February 28th, 1967, the Brazilian Decree-Law No. 221/67 was promulgated. It allowed enterprises to take tax deductions for investment in fishery projects2 and remained in effect until 1972. Enterprises registered in Brazil could deduct up to 25% of their income tax burden to compensate for investment expenditures on projects to improve the capture, transport, processing, marketing, and sale of fish. The projects had to be approved by the Federal Fishing Development, which was under SUDEPE until 1989 when it was placed under IBAMA. The beneficiary firms had to provide investment capital matching one-third of the funds arising from the Government’s fiscal incentive program.
The fishing fiscal incentive program was part of the Federal Government’s policy to develop regions or sectors in Brazil. Thus, fiscal incentives were not only granted to fishery enterprises, but also for activities to develop Brazil’s North-East and Amazon regions, forestry enterprises and tourism activities, among others (Bacha, 1995).
From 1967 to 1973, there was no central authority exercising control over the allocation of these incentives and according to Bacha (1995), the demand for fiscal incentives was bigger than the supply. This imbalance caused two serious problems for the fishing industry: Planned investments were delayed due to the shortage of financial resources, and excessive commissions were charged for access to investment capital.
In order to solve these problems, the Federal Government promulgated Decree-Law No. 1,376 on December 12, 1974, establishing the Regional and Sectional Investment Fund (FISET). The Fishing Investment Fund (FISET/Fishing) was created specially for fishery enterprises, and was to be supervised by SUDEPE, with Banco do Brasil S/A as its financial agent.
Decree-Law No. 1,217 was enacted on May 09, 1972. It extended the validity of the fishing fiscal incentives to 1977. According to Neiva (1990), the validity of the incentives was further extended to 1981, and later to 1986. However, its upper tax deferment limit was reduced from 25% to 12.5%. The fishing incentive program was terminated at the end of 1986 (see Figure 1).
2 This mechanism is known in the literature as the ‘fishing fiscal incentive program’.

70 Catching More Bait: a bottom-up re-estimation of global fisheries subsidies, Sumaila and Pauly (eds.)
0
100
200
300
400
500
600
700
800
1960 1965 1970 1975 1980 1985 1990 1995 2000
y e ars
Ca
tch
( '
00
0 t
on
ne
s
0
50
100
150
200
250
Va
lue
(m
illi
on
US
$)L a n d i n g s
F i sc a l i n c e n t i v e
R u r a l c r e d i t s
Figure 1 Marine fisheries landings in Brazil, 1960-2002 (Source: www.seaaroundus.org; accessed August 2006); Fiscal Incentive (1967-1986) and Rural Credit (1969-1997) in fisheries activity in Brazil (Source: Abdallah, 1998 and BANCEN, 2002).
A sum of US$1.130 million of the volume of fiscal incentives was received by fishery enterprises from 1967 to 1986 (Abdallah, 1998). Of the total incentives, 78% were granted in the first period of the program, which lasted from 1967 to 1974. Only 22% of the resources were captured by fishery enterprises from 1975 to 1986 (period when the Fishing Investment Fund - FISET/Fishing was created).
According to IPEA/COMIF (1986), this reduction in the amount of incentives received by the FISET/Fishing (22%) was caused by the lack of a development plan for fishing activities. The fact that Decree-Law No. 221 of 1967 was promulgated without planning reflected the situation. This caused several problems for the development of the fisheries from 1967 to 1974, including a shortage of research and of appropriate technology, inefficient monitoring, lack of qualified labor, and deviation of resources to businesses other than those approved by the project. In combination with other external problems, such as the increase in the price of petroleum and difficulties involving the commercialization of fish in the external market, fisheries in Brazil faced negative prospects that discouraged future investments.
Rural Credit – Public Policy
Since the 1960s, rural credit has been a very important public policy instrument for the promotion of agricultural development in Brazil. The policy was originally implemented with the approval of Law No. 4,829 of 1965. The rural credit was a loan provided by financial institutions to rural producers and cooperatives (Pinto, 1980). The objectives of the policy are to stimulate rural investments and to support activities, investment and commercialization.
The rural credit is financed with lower nominal interest rates as compared to those rates that existed in the market. The rural credit was orientated for three main purposes: maintenance, investment and commercialization. The credit for maintenance is used for purchasing the required supplies for the fishery (such as nets, small repairs, food and ice.). The credit therefore provides the conditions necessary to support the capture and to improve the quality of the fish (on board the fishing boats). The credit for investment is used for the acquisition of boats, while the objective of the credit for commercialization is to facilitate the transaction and sale of the fish.
The evolution of the implementation of rural credit policy to fisheries in Brazil is presented in Figure 1. During most of the period in question, the implementation of rural credit to fishing activities revealed a

A historical account of Brazilian policy on fisheries subsidies, Abdallah and Sumaila 71
decreasing tendency. In the first half of the 1980s, however, high volumes of resources were invested (Figure 1). In 1983, about US$1.3 billion were allocated to fishing activities in Brazil. This was the maximum amount of resources ever invested by the country in a year in this sector. After the second half of the 1980s, there was a drastic reduction in the amount of resources allocated to fishing activities through rural credit. During the 1990s there was again a significant reduction, which maintained the annual average at US$19.5 million (Figure 1).
The information in Table 1 refers to the percentage of rural credit applied to fisheries activities in Brazil, by type, in three decades (1970s, 1980s and 1990s). In the first two decades, a larger amount of resources was targeted at investments (39% and 45%, respectively). These numbers were reduced to 24% in the 1990s. Even though there was a high volume directed to investments in both the 1970s and 1980s, in general the amount of resources allocated to fisheries activities was the largest in the 1980s (Figure 1).
Table-1: Percentage of rural credit allocated to fisheries, by type and decade, Brazil. Decade Maintenance Investment Commercialization 1970s 25.4 39.0 35.6 1980s 43.7 45.1 11.2 1990s 69.1 23.8 7.1 Source: Souza and Abdallah (2003).
Throughout the three decades, the amount of rural credit targeted at maintenance increased over time. In the 1980s, similar amounts were allocated to maintenance and to investments (44% and 45%, respectively). In the 1990s, however, as the allocation of credit for investments decreased (reaching 23.8%), the volume directed to maintenance increased to about 70% of the total amount of rural credit. It is worth mentioning that the total volume of credit during the 1990s was still much smaller than the amount that was allocated to fisheries during the 1980s.
The credit for commercialization decreased throughout the three decades, representing only 7% of the total in the 1990s.
Analyzing the allocation of resources to each separate target helps explain the mechanisms through which incentives may lead to an increase in fish catch.
Fishery landings and public policy – an analysis
Brazilian fisheries catch expanded impressively from 1960 to 2001, increasing from about 281 to 710 thousand tonnes per year. Nevertheless, large variations are observed in the pattern of catch, which indicate two opposite tendencies. The catch increased from 1960 to 1985. However since 1986, the catch followed a decreasing trend (Figure 1). The first take off in Brazilian fish catch took place from 1960 to 1962. From 1963 to 1967, fish catch remained relatively stable. A new catch growth phase began in 1968 and lasted until 1974. It was followed by fluctuations without a well-defined tendency from 1975 to 1980. Again, fish catch undertook a third growth phase from 1981 to 1985. And lastly, from 1986 to 1999 a decreasing tendency dominated. However, in the first half of the 1990s, catch showed a slight upward tendency. It remained, nonetheless, below the annual average observed in the second half of the 1990s.
Fish catch growth from 1968 to 1974 was linked to the Government’s provision of fiscal incentives through the mechanism created by Decree-Law No. 221. These incentives amounted to about US$ 883 million (August 1994 as base), an annual average of US$ 110 million from 1967 to 1974. According to Neiva (1990), the incentive policy facilitated the creation of a modern industrial park devoted to fish handling, expanded the range of domestic fishery ships and contributed to increasing Brazilian fish catch during this period. Giulietti and Assumpção (1995) found that 51% of the fishing fiscal incentives granted from 1967 to 1972 were invested in the industrial plant, 20% in fish harvesting (capture), while the remaining was invested in other FAS activities. Conversely, absolutely nothing was invested in research on native Brazilian fish, or in gathering data on native fish stocks (native fishable biomass). In other words, the subsidies were spent on activities that increase overfishing. These types of subsidies have been described in the literature as bad subsidies (e.g. Milazzo, 1998; Khan et. al., this vololume).

72 Catching More Bait: a bottom-up re-estimation of global fisheries subsidies, Sumaila and Pauly (eds.)
From 1975 to 1980, annual fiscal incentives granted to fishery activities averaged US$31 million annually (August 1994 as base). These resources proved insufficient to support domestic fish catch growth. According to IPEA/COMIF (1986), during this period, SUDEPE prioritized the maintenance of enterprises that had received fiscal incentives in the 1967 to 1974 period.
From 1981 to 1986 (mainly in 1983, 1984 and 1986), barriers erected to hinder fish importation stimulated a great jump in domestic fish catch. Gain in price due to domestic demand for fish compensated for the reduction of US$9.8 million in average annual fiscal incentives. During this period, overfishing reduced fish stocks; in 1986 fish catch began a steady decline.
The resources from the rural credit policy, applied to fisheries activity also acted in the direction of increasing the capture of fish in Brazil. The rural credit destined to investment was larger than that aimed at other types of fiscal incentives in the 1970s and 1980s. Such credit was generally allocated for the purchase of boats. However, after the 1980s, investments in fisheries by rural credit were reduced. This fact is associated with declines in the stock of important fish species and, consequently, with a decreasing tendency in fish landings (Figure 1). On the other hand, the rural credit for maintenance (outlay costs) of fisheries increased through the years, and acted as a support mechanism to the dynamics of the activity. In the late 1990s, the rural credit for maintenance was very significant as a public policy. In spite of its small volume, it retained about 70% of total rural credit to the fishery activity in Brazil.
The problem of overfishing has been noted by many authors interested in the exploitation of Brazil’s fisheries resources (Freire, 2005; Paez, 1993; Giulietti and Assumpção, 1995; Tremel, 1993, and Neiva, 1990). All of them share a common view, arguing that the Brazilian Government did not consider the potential effect of its fishing fiscal incentive program on the sustainability of the marine fish resources found off the Brazilian coast when the program was established in 1967.
The incentive policy expedited the creation of a large fishing fleet specialized in the harvest of specific fish species (devastating specific fishery resources) and created a large infrastructure. Industrial plant capacity was enlarged to the point that it exceeded maximum sustainable domestic fish catch (Giulietti and Assumção, 1995).
From the 1960s to the 1980s, Federal Economic Policy linked to fishery activities did not significantly impact freshwater fishing despite the 4th Article of Decree-law number 221/67, which authorized fiscal incentives for freshwater fish projects. The majority of the program’s financial resources went to stimulate marine fish projects (IPEA/COMIF, 1986).
From 1960 to 1994, domestic marine fish catch represented around 78% of the country’s fish landings from domestic stocks while freshwater fish made up the remaining catch. Freshwater fish now make up nearly 30% Brazil’s annual fishery catch, due to the overfishing of marine fishery resources.
Studying the exploitation of fishery resources, Paez (1993) gives evidence that a great part of the fish species harvested commercially along the Brazilian coast comes from overfished stocks. According to the author, the species traditionally harvested in Brazil, other than in the country’s Northern Region, are lobster, shrimp, croaker, sardine, weakfish, hake, and mullet, among others. As these species were exploited to nearly the maximum sustainable level in the early 1990s, we can infer that they now are overfished, given that the effort on them has grown widely since then (Freire, 2005).
As a typical example of overfishing, Paez (1993) mentions the case of sardines. He writes that the total catch in Brazil’s Southeast Region jumped from nearly 38,000 tonnes in 1964 to nearly 114,000 tonnes in 1969, reaching a maximum of 228,000 tonnes in 1973. Since 1974, the annual sardine catch has been decreasing. In 1990, only 32,000 tonnes of sardines were harvested, less than the amount caught in 1964. According to Paez (1993, p.58):
“In that case, we observe overfishing and partial use of the fishing fleet and related industrial plants, and the country is now largely dependent on imports to maintain the domestic industry and to satisfy the domestic market.”

A historical account of Brazilian policy on fisheries subsidies, Abdallah and Sumaila 73
Brazilian lobster is another domestic resource that is being overexploited. According to IBAMA (1998), the lobster catch in the State of Ceara (the principal Brazilian lobster ground) fell 7.5% in 1997 and from 1991 to 1997 catch decreased 46%. For all of Brazil, the estimated annual sustainable harvest is around 8,900 tonnes of lobster (whole body), and 3,000 tonnes of lobster tail (exported product). Until 1993/1994, lobster catch showed a downward tendency, which stabilized at around 8,000 tonnes per year. However, in 1995, catch reached 10,838 tonnes, a harvest above the estimated sustainable level. IBAMA (1998) believes that the increase in catch is an irrational exploitation of the resource, occurring despite laws that prohibit harvest during part of the year and restrict the harvest of lobsters below a minimum size.
In a recent study about fishing impact on marine ecosystems in Brazil, Freire (2005) pointed out that several species in the Brazilian northeastern ocean are currently overexploited. She states that:
“In northeastern Brazil, fisheries targeting tunas and tuna-like fishes, lobsters, southern red snapper, shrimps, and demersal fishes are very important as a result of their bulk catch or the revenue generated by their exports. Many of the stocks in this region are considered overexploited” (Freire 2005, p.178).
Figure 1 illustrates a pattern of general increase in Brazilian fishery landings from 1960 to 1985, and a general catch decline beginning 1986. In the 1990s, annual fishery landings has been a little above the level observed in 1976 (nearly 660,000 tonnes).
CURRENT FISHERIES POLICIES IN BRAZIL
After 17 years of neglect [1986 – 2003], generated by the absence of concrete plans for Brazil’s fishing sector, the government issued an edict [July 2003] aimed at the development of the sector (see SEAP, 2003). The project "Strategic Plan for Sustainable Development of Aquaculture and Fisheries" has the following as its general objectives:
• to determine key stakeholders primarily concerned with fisheries; • to improve all aspects of catch in the sector; • to promote social inclusion; • to foster awareness of food safety; • to create awareness of the sector’s contribution to the well-being of the Brazilian nation.
Among the specific goals set for 2006 are:
• to increase catch by 50%: from 1 to 1.5 million tonnes (aquaculture & fisheries) per year; • to increase the local per capita consumption of fish and seafood from the current 6.8
kg/person/year to the FAO’s recommended level of 12kg/person/year; and • to triple the commercial surplus via the increase of exports in the sector.
In order to achieve its objectives, the Brazilian government promulgated Law No. 10,849 on March 23rd, 2004. This Law created the National Program of Finance for the Development and Modernization of the National Fishery denoted ‘Profrota’.
The ‘Profrota’ program intends to encourage investment in the acquisition, construction, conversion (from coastal to oceanic fishing), modernization and equipping of fishing vessels. The initial target was to build and equip a fleet of more than 500 vessels of medium and large scale capacity. The government set up two funds - the Constitutional Fund and the Merchant Marine Fund – to finance the creation of the fleet. Interest rates on loans from these funds were set between 7 and 12% per year3. Entrepreneurs were offered a bonus to encourage the catching of less popular species, and of species deemed not overexploited. The proposal is to invest, over four years, around R$1.5 billion (approximately US$ 682 million or US$ 170 million per year4). The ‘Proforta’ program relies to a large extent on high subsidies and government support, which Brazil considers essential for the development of fisheries in developing countries. The
3 These subsidized rates compare favorably to the current average market rates for farmers in Brazil of between 16 and 20% per year. The average market interest rate for business, in general, is 35% per year, well below the average rate of 62% per year for consumer credit. The terms for the subsidized agricultural credit programs also vary by length of time and commodity. 4 Exchange rate: R$2.20 = US$1.00

74 Catching More Bait: a bottom-up re-estimation of global fisheries subsidies, Sumaila and Pauly (eds.)
‘Profrota’ program represents the current position of the Brazilian government towards the WTO framework for disciplining fisheries subsidies, and suggest the inclusion of a ‘Green Box’ concept (denoted non-actionable subsidies), as part of special treatments by the World Trade Organization (WTO) towards developing countries (Anon., 2005).
Participants in this program range from industrial fishing companies to ordinary citizens, lawyers, fishermen’s associations, cooperatives and private individuals.
Under the ‘Profrota’ program, around 140 projects will be approved per year for the renewal of the national fishery fleet. In September of 2005, 49 projects had prospects of approval, according to SEAP/PR (2005).
The main objective of the ‘Profrota’ program is the formation of a national oceanic fishing fleet, meant to operate in Brazil’s Exclusive Economic Zone (EEZ). According to SEAP/PR (2005), the motivation behind this approach is that in the EEZ, due to the lack of appropriate equipment, there are fish species and seafood of high economic value that are either not captured or are underexploited. For example, it is claimed that even though Brazil could potentially catch as much as 100 thousand tonnes of tuna per year, it presently catches only about 50 thousand tonnes.
The new policy was necessary mainly because currently, the Brazilian fishing fleet is not appropriately equipped to operate far away from the coast (SEAP/PR, 2005). To become a dynamic player in the field of deep ocean explotation, Brazil’s fisheries industry needs to step up catch and fish processing. However, SEAP/PR’s sub-secretary of fisheries and aquaculture, David Lourenço claimed that most of the Brazilian fishing fleet vessels engaged in ocean fishing belonged to foreigners, and were being leased by Brazilian companies. Also, the Brazilian industry exported the catch largely unprocessed (“in natura”) with the consequent low financial return to Brazil.
Concerns with the sustainability of the fishing resource are implicit in the presuppositions of the government's political project. When detailing the goals of the ‘Profrota’ program for renewal of the national fleet, for example, it is claimed that the execution of its goals will be accomplished while respecting the limits of sustainable effort (defined according to each fishery resource). Also, it is stated that the established criteria will be respected by competent institutions (in this case, SEAP/PR and/or MMA/IBAMA5).
At the time of writing, information on the level of investments in Brazilian fisheries was not readily available. Therefore, only the outline of the potential impact of the new policies can be given with any assurance.
RELATIONSHIPS BETWEEN THE OLD AND THE NEW PUBLIC POLICY FOR FISHERY ACTIVITIES IN
BRAZIL
The relationships between the new and the old public policy concerning fisheries activity in Brazil are best understood by examining a time-line of the social, economic, political and environmental conditions. A summary of these relationships is presented below, considering three different historical Periods: period I, from 1967 to 1985; Period II, from 1986 to 2003; and Period III, from 2003 to the present.
The fiscal incentives and rural credit designed for the fisheries were created in a developmental context, with the government's political program organized to promote the sector’s development and regional development. In this period, in spite of the existence of the Superintendency for the Development of Fisheries (SUDEPE), the institutional body responsible for the supervision of fishery activities in Brazil, there was not sufficient concern with the environmental aspect and the rational exploitation of the natural resource. The programs of fiscal incentives and rural credit were implemented in a ‘top down’ management approach. This style of management hindered free participation and discussions on sustainable fishery resources. In fact, the political program was set up for the growth of the sector. The
5 Ministry of Environment/Brazilian Institute of the Environment and Renewable Natural Resources.

A historical account of Brazilian policy on fisheries subsidies, Abdallah and Sumaila 75
result of this political action in Period 1 was the growth of Brazilian fish catch (Abdallah (1998), Abdallah and Bacha (1999), Vasconcellos et al. (2003), Abdallah and Castello (2003). This growth occurred, however, without appropriate planning6.
Rural credit was maintained as a supporting instrument to the activity, among others. Period II was marked by (i), a declining trend in fish catch in Brazil; (ii) a depreciation of the national fishery fleet; (iii) a decline in the amount of fish processed locally by the industry and, above all, (iv) by the overexploitation of some economically important species (mainly during the second half of the 1980s). A major institutional mark in Period II was the disbanding of SUDEPE. IBAMA became the institution responsible for motivating research, enforcing regulations, control and monitoring of the environment and natural resources of Brazil. In the period managed by IBAMA, concerns with the sustainability of natural resources were more evident at the national level. This, however, was partly the result of a worldwide tendency (Pauly et. al. 2002). Nevertheless, there has been strong and rigid control of wild fisheries, mainly starting in the mid-1990s (Abdallah and Bacha, 2003).
Period III, covering the current fishing policies, is marked by a significant change in the Brazilian government's ideology: consolidated with the left holding reins of authority (Partido dos Trabalhadores - PT). For the first time in Brazilian history, the government created a department specifically intended to oversee the development of fisheries and aquaculture (SEAP/PR). It is in this atmosphere that the current fishery public policy in Brazil began to be articulated and implemented.
In Period III, the technician-scientific environment was more developed, with more qualified Brazilians to support fisheries management as compared to previous periods. The government has adopted the co-management process as its mark of integrated government management. The government is actively involved in the preservation and conservation of natural resources. In this period, environmental concerns from several stakeholders are taken into account - NGOs, environmentalists, the media, the scientific community, and the government.
In spite of the positive outlook in Period III, many questions still remain regarding the new public policy for the fishery employed by the present Brazilian government. With actions geared towards increase in fish catch, the government has developed an incentive program for the fisheries; it has created lines of credit to finance and to equip the national fishing fleet, in a moment where technician-scientific pronouncements confirm the concern with the survival of marine fishery resources.
Research done by REVIZEE fail to find any stock of fish in sufficient volume that can sustain the increase in fish catch instigated by the policies of the current government (Castello, 2005). The highly valued fish stocks, like tuna, are considered overexploited all over the world. Hence, Brazil should not expect sustainable higher yields of these species. A technical document sent by scientists to SEAP/PR claims that the current resources are subject to overexploitation, so there are no new resources that will justify the expansion of the fishing fleet advocated by the government (Novaes, 2005).
Regarding the sustainability of fisheries in Brazil, simulations with an ecosystem model (Ecopath with Ecosim; see www.ecopath.org) indicate that the biomass of several fish groups will be at lower levels by 2028 if current fishing pressure is maintained (Freire, 2005). Also, some fisheries would collapse in the not too distant future. Given these results, increasing the fishing fleets as proposed by the Brazilian government does not make sense.
The goals of the current public policy relating to the fishery in Brazil, in the way it is being implemented, will tend to follow a process of similar evolution that was observed in Period I, with the aggravating factor that many stocks are already identified as overexploited.
In spite of additional advantages in terms of fisheries management from Period III to the present, contemporary policies are intended to increase fish catch, and are not being accompanied by a management plan concerned with the specific species that will be captured. This is the aggravating point of the current fishing politics in Brazil. According to Novaes (2005), the documents sent by technicians
6 The studies done by Abdallah (1998), Abdallah et al. (2000), Sousa and Abdallah (2003) show that these public policies led to increasing fish catch. Other studies on fisheries activity in Brazil show the effect these public policies on the fishing industry in 1970s and the decline of the fishing industries after the 1980s. This information is in Simões and Abdallah (2003) and Vieira et al. (2004).

76 Catching More Bait: a bottom-up re-estimation of global fisheries subsidies, Sumaila and Pauly (eds.)
and scientists of the area demonstrate that “some promising resources, located in the deepest areas, already show alarming signs of overexploitation after three or four years of fisheries expansion, thus, demanding immediate reductions in the capture levels.” This is because these deepsea fishes are usually long-lived with very low growth rates and therefore very vulnerable (Sumaila et. al., this volume).
FINAL CONSIDERATIONS
On the national scale, Brazil’s fisheries sector is not important, representing only 0.2% of GDP. However, there are many isolated segments within the sector that benefit from significant returns. On the other hand, the scientific community has been calling attention to the overexploitation and even the disappearance of species that are important to the Brazilian coastal community in many ways (economically, socially and culturally).
Policies for the fisheries sector, from 1960s to the mid-1980s, led to a great increase in fisheries harvest, without appropriate consideration for the long term sustainability of the marine resource. The main consequence of this short-sighted policy was the decline in fish catch in the following years, simultaneously with a decline in the output of the post-harvest sector.
In the face of declining fish harvest over time, the present government instigated an incentive program to increase catches, without formulating management plans with regard to the species that were to be caught. This program drew many criticisms. The goal of having more than 500 fishing vessels without an appropriate background analysis of the availability of species is simply irrational, and it can lead to further depletion of Brazil’s fishery resources.
Besides the need for scientific management of fisheries resources, there is an economic need to add value to the raw resource. This would entail the improvement of the processing of fish and the utilization of some of the parts of the resource presently being discarded.
Finally, if the economic logic does not consider the biological logic of renewable natural resources, the result will be the extinction of the natural capital, resulting in terrible consequences on the nutritional requirement of generations of Brazilians to come.
ACKNOWLEDGEMENTS
Support for this research was provided by Fisheries Economics Research Unit, Fisheries Centre, University of British Columbia – FERU/FC/UBC, Post-doctorate program, 2005/2006, supervised by Ussif Rashid Sumaila, FERU’s Director. The authors wish to thank Dr. Daniel Pauly at the UBC Fisheries Centre for the helpful comments and suggestions on the ideas reported in this paper.
REFERENCES Abdallah, P.R., 1998. Atividade pesqueira no Brasil: política e evolução. Escola Superior de Agricultura Luiz de Queiroz- Universidade
de São Paulo, Piracicaba, Brazil. PhD Thesis: 232 p.
Abdallah, P.R. and Bacha, C.J.C., 1999. A benefit-cost analysis of the Brazilian fishery fiscal incentive policy. Brazilian Review of Agricultural Economics and Rural Sociology. 37, 151-200.
Abdallah, P.R. and Bacha, C.J.C., 2003. Las políticas de reglamentación de la pesca en Brasil. Revista Cubana de Investigaciones Pesqueras. 23, 21-25.
Abdallah, P.R. and Castello, J.P., 2003. O momento de repensar a economia pesqueira no Brasil. ConCiência. 41, 1-4.
Abdallah, P.R., Souza, M.A.A. and Mielit Neto, C.C.G.A., 2000. Impactos da política de crédito rural no segmento industrial, valor da captura e emprego da atividade pesqueira no Rio Grande do Sul. In: XXXVIII Congresso Brasileiro de Economia e Sociologia Rural. Anais. Rio de Janeiro, Brazil.
Anon. (2005). Contribution to the discussion on the framework for disciplines on fisheries subsidies. Paper from Brazil. TN/RL/W/176. http://docsonline.wto.org, Accessed in August 31st, 2006.
Bacha, C.J.C., 1995. Análise custo-benefício dos programas federais de incentivo ao reflorestamento no Brasil. Piracicaba, Brazil. [Unpublished manuscript].
BANCEN, 2002. Bulletin of Central Bank of Brazil about rural credit statistics. Brasilia, Brazil.
Castello, J.P., 2005. Uso e Apropriação dos Recursos Costeiros - Projeto Recos- Instituto do Milênio. Technical Report 01, FURG: Oceanography Department, Rio Grande.

A historical account of Brazilian policy on fisheries subsidies, Abdallah and Sumaila 77
Clark, C.W., Munro, G. and Sumaila, U.R., 2005. Subsidies, buybacks, and sustainable fisheries. Journal of Environmental Economics and Management. 50, 47-58.
Giulietti, N., Assumpção, R., 1995. Indústria pesqueira no Brasil. Agricultura em São Paulo. 42, 95-127.
Freire, K.M.F., 2005. Fishing impacts on marine ecosystem off Brazil, with emphases on the Northeastern Region. University of British Columbia. Ph D Thesis: 254 p.
IPEA-COMIF, 1998. Relatório de avaliação dos incentivos fiscais regidos pelo Decreto-Lei No. 1,376 de 12 de dezembro de 1974, Brasília, Brazil.
Khan, A., Sumaila, U.R., Watson, R., G. Munro, Pauly, D., 2006. The nature and magnitude of global non-fuel fishery subsidies. In Sumaila, U.R., Pauly, D. (eds.), Catching more bait: A bottom-up re-estimation of global fisheries subsidies. Fisheries Centre Research Reports 14(6) , p. 1-34. Fisheries Centre, the University of British Columbia, Vancouver, Canada.
Millazzo, M., 1998. Subsidies in world fisheries - a re-examination. World Bank Technical Paper No. 406, Washington.
Munro, G., Sumaila, U.R., 2002. The impact of subsidies upon fisheries management and sustainability: the case of the North Atlantic, Fish and Fisheries. 3, 233-250.
Neiva, G.S., 1990. Subsídios para a política pesqueira nacional. Santos, Brazil.
Novaes, W., 2005. Os limites do nosso mar. http://www.abdl.org.br/article, Accessed in April 27th, 2006.
Paez, M.L.D., 1993. Exploração de recursos pesqueiros no Brasil. Revista de Administração. 28, 51-61.
Pauly, D., Christensen, V., Guénette, S., Pitcher, T.J., Sumaila,U.R., Walters, C.J., Watson, R. and Zeller, D., 2002. Towards sustainability in world fisheries. Nature 418: 689-695.
Pinto, L.C.G., 1980. Notas sobre Politica Agricola e Credito Rural, Techinical Report 01, UNICAMP: Economics Department, Campinas, Brazil.
SEAP, 2003. Projeto Político-Estrutural, Secretaria Especial de Aquicultura e Pesca, Presidencia da Republica, Brasília, Brazil.
SEAP, 2005. Notícias. http://www.presidencia.gov.br/seap, Accessed in March 12th, 2006.
Simões, J.M., Silva, R.F.C. and Abdallah, P.R., 2003. A evolução do setor industrial pesqueiro do Rio Grande do Sul. In: III Seminário de Economia do Meio Ambiente da UNICAMP, Anais, Campinas, Brazil.
Sousa, T.V. and Abdallah, P.R., 2003. Políticas Públicas e Atividade Pesqueira no Estado do Rio Grande do Sul. In: XLI Congresso Brasileiro de Economia e Sociologia Rural, Anais, Passo Fundo, Brazil.
Souza, M.A.A., 2001. Política e Evolução da Atividade Pesqueira no Rio Grande do Sul: 1960 a 1997. Programa de Pós-Graduação em Desenvolvimento Rural, Universidade Federal do Rio Grande do Sul, Porto Alegre, Brasil. MSc Dissertation: 252 p.
Souza, M.A.A., Mielitz Neto, C.G.A. and Abdallah, P.R., 2001. Pesca no estado do Rio Grande do Sul de 1960 a 1997: política, produção e mercado. In: XXXIX Congresso Brasileiro de Economia e Sociologia Rural, Anais, Recife, Brazil.
Tremel, E., 1993. Pesca, novos rumos. Ciclo de palestras sobre temas relacionados ao poder marítimo. Ministério da Marinha, Florianópolis, Brazil.
IBAMA, 1998. Defesa da Lagosta, http://www.ibama.gov.br.
Vasconcellos, M.C., Kalikoski, D.C., Haimovici, M. and Abdallah, P.R., 2003. Capacidad excesiva del esfuerzo pesquero en el sistema estuarino-costero del sur de Brasil: efectos y perspectivas para su gestión. FAO, Thechinical Report (in press), Rome.
Vieira, M.M.F., Silva, R.C., Darbilly, L.V.C., Simões, J.M. and Abdallah, P.R., 2004. Fatores institucionais determinantes da configuração dos campos organizacionais da indústria da pesca no Rio de Janeiro e no Rio Grande do Sul. Revista de Administração Pública. Rio de Janeiro. 38, 947-77.

78 Catching More Bait: a bottom-up re-estimation of global fisheries subsidies, Sumaila and Pauly (eds.)
APPENDIX 1: REGIONAL FISHERIES SUBSIDY ESTIMATES BY CATEGORIES (US$ ‘000)
Region - Asia
Country 2000 HDI
Score 2000 LV
(US$'000) Good
subsidies Bad
subsidies Ugly
subsidies
Total Amounts
(US$ '000)
Subsidy intensity
(%)
Bangladesh 0.51 819,152 29,442 266,990 16,576 313,008 38
Cambodia 0.57 95,138 3,419 13,485 1,925 18,830 20
China Main 0.75 24,562,885 11,999 492,036 827,082 1,331,117 5
Hong Kong 0.90 69,918 2,564 777 0 3,341 5
India 0.60 1,817,110 188,246 2,008,631 36,771 2,233,648 123
Indonesia 0.69 1,608,348 84,546 226,077 32,546 343,170 21
Japan 0.94 20,567,316 2,807,057 684,617 711,553 4,203,227 20
South Korea 0.89 5,537,726 53,511 276,845 29,453 359,809 6
Malaysia 0.79 3,028,474 1,723 455,934 0 457,657 15
Myanmar 0.55 2,157,127 77,530 588,587 43,652 709,769 33
Pakistan 0.50 1,073,885 38,597 152,277 21,731 212,605 20
Philippines 0.75 1,608,830 57,824 315,616 32,556 405,996 25
Singapore 0.90 13,176 0 4,000 0 4,000 30
Sri Lanka 0.74 619,851 22,278 8,447 0 30,725 5
Taiwan 2,679,357 25,875 212,214 14,500 273,687 9
Thailand 0.77 2,252,243 24,625 253,758 45,576 323,959 14
Vietnam 0.69 3,142,600 49,357 331,335 0 380,692 12 Regional total 71,653,135 3,478,594 5,854,603 1,813,922 11,584,142 16

Appendix 1: Regional fisheries subsidy estimates by categories 79
Region - Europe
Country 2000 HDI
Score 2000 LV
(US$'000) Good
subsidies Bad
subsidies Ugly
subsidies
Total amounts
(US$ '000)
Subsidy intensity
(%)
Albania 0.78 3,868 38 1,287 0 1,325 34
Belgium 0.94 57,677 2,514 2,415 7,829 12,758 22
Bulgaria 0.80 15,036 307 2,769 304 3,380 22
Croatia 0.83 48,963 0 0 0 0 0
Denmark 0.93 1,628,873 111,105 1,048,736 97,847 1,257,688 77
Estonia 0.85 267,479 18,245 20,129 17,900 56,274 21
Finland 0.94 43,359 7,072 7,280 1,492 15,844 37
France 0.93 1,514,739 61,513 188,072 16,697 266,282 18
Georgia 0.74 4,317 155 402 87 644 15
Germany 0.93 209,687 6,936 32,168 5,970 45,074 21
Greece 0.90 235,337 29,352 26,764 19,727 75,843 32
Iceland 0.94 853,043 23,742 54,820 127 78,689 9
Ireland 0.94 358,371 54,057 15,209 39,245 108,511 30
Italy 0.92 766,591 50,576 83,451 92,549 226,576 30
Latvia 0.81 332,721 11,958 30,983 0 42,942 13
Lithuania 0.84 189,131 6,798 0 0 6,798 4
Malta 0.88 2,560 481 311 481 1224 48
Netherlands 0.94 499,748 3,138 17,228 9,755 30,121 6
Norway 0.96 1,204,872 84,403 17,955 51,476 153,834 13
Poland 0.85 116,017 8,968 141 0 9,109 8
Portugal 0.90 313,006 23,889 70,244 20,947 115,080 37
Romania 0.77 6,057 218 885 0 1,103 18
Russian Federation 0.80 9,001,066 613,960 527,674 299,291 1,440,925 16
Spain 0.92 1,890,375 30,847 333,786 92,729 457,362 24
Sweden 0.95 156,374 20,977 7,037 6,052 34,065 22
Turkey 0.75 868,138 1,746 138,149 144 140,039 16
Ukraine 0.78 963,299 34,622 136,543 19,493 190,658 20
UK 0.94 1,206,938 64,091 42,735 42,313 149,139 12
Regional total 22,757,641 1,271,707 2,807,174 842,024 4,920,905 22

80 Catching More Bait: a bottom-up re-estimation of global fisheries subsidies, Sumaila and Pauly (eds.)
Region - Latin America and the Caribbean
Country 2000 HDI
Score 2000 LV
(US$‘000) Good
subsidies Bad
subsidies Ugly
subsidies
Total amounts
(US$ '000)
Subsidy intensity
(%)
Antigua & Barbuda 0.80 4,404 158 5,941 0 6,099 139
Argentina 0.85 2,173,591 52,224 206,279 145,462 403,945 19
Bahamas 0.82 27,161 976 6,721 0 7,697 28
Barbados 0.89 7,610 274 9,471 154 9,899 130
Belize 0.74 60,543 2,176 8,343 21 10,540 17
Brazil 0.78 1,197,170 43,028 1,289,430 3,708 1,336,166 112
Chile 0.84 985,030 7,204 40,886 0 48,090 5
Colombia 0.77 256,315 9,212 33,606 5,187 48,005 19
Costa Rica 0.83 84,413 3,034 23,409 876 27,319 32
Cuba 0.81 133,938 2,732 12,472 0 15,204 11
Dominican Rep. 0.74 26,609 2,796 5,967 0 8,762 33
Dominica 0.74 2,942 106 879 60 1,044 35
Ecuador 0.74 1,450,403 52,130 136,562 0 188,692 13
El Salvador 0.72 16,587 596 1,545 0 2,141 13
Grenada 0.75 4,162 150 5,214 0 5,363 129
Guatemala 0.65 78,288 1,217 11,446 1,584 14,247 18
Guyana 0.72 118,007 4,241 10,989 2,388 17,618 15
Haiti 0.46 11,046 397 284 0 681 6
Honduras 0.67 33,048 1,188 6,439 669 8,295 25
Jamaica 0.76 12,825 262 2,305 260 2,826 22
Nicaragua 0.67 49,775 2,467 5,316 0 7,783 16
Panama 0.79 537,720 10,968 149,116 10,881 170,965 32
Peru 0.75 26,077,223 545,893 10,702 527,698 1,084,293 4
St. Kit & Nevis 0.84 1,148 23 168 0 191 17
St. Lucia 0.78 4,552 164 1,262 92 1,518 33
ST. Vin & Grenadines 0.75 20,253 728 3,946 410 5,084 25
Suriname 0.78 50,617 1,032 4,154 1,024 6,211 12
Trini. & Tobago 0.80 21,139 431 6,890 0 7,321 35
Uruguay 0.83 250,997 5,120 0 0 5,120 2
Venezuela 0.78 817,432 16,673 226,683 16,542 259,897 32 Regional total 34,514,948 767,399 2,226,422 717,015 3,710,836 11

Appendix 1: Regional fisheries subsidy estimates by categories 81
Region - North Africa and Mediterranean
Country 2000 HDI
Score 2000 LV
(US$‘000) Good
subsidies Bad
subsidies Ugly
subsidies
Total amounts
(US$'000)
Subsidy intensity
(%)
Algeria 0.70 254,804 9,158 331,575 5,156 345,889 136
Bahrain 0.84 28,756 492 2,169 968 3,630 13
Brunei Daruss. 0.87 3,132 113 855 0 967 31
Cyprus 0.88 164,758 2,843 12,752 440 16,034 10
Egypt 0.65 309,572 11,126 28,828 0 39,954 13
Iran 0.73 645,513 23,201 176,133 13,063 212,396 33
Israel 0.91 12,344 842 554 0 1,396 11
Jordan 0.75 245 5 23 0 28 11
Kuwait 0.84 14,724 1,004 1,108 0 2,112 14
Lebanon 0.76 8,942 0 0 0 0 0
Libya 0.79 71,108 2,556 0 0 2,556 4
Morocco 0.62 809,172 29,083 220,788 16,374 266,245 33
Oman 0.77 295,516 13,830 80,633 5,980 100,443 34
Qatar 0.83 17,527 895 727 590 2,213 13
Saudi Arabia 0.77 121,987 4,384 5,932 2,469 12,784 10
Syria 0.71 4,913 100 0 0 100 2
Tunisia 0.75 219,318 4,473 60,819 0 65,293 30
UAE 0.82 258,649 17,642 0 0 17,642 7
Yemen 0.48 281,594 5,744 78,089 0 83,833 30 Regional total 3,522,574 127,492 1,000,984 45,040 1,173,516 33
Region - North America
Country 2000 HDI
Score 2000 LV
(US$'000) Good
subsidies Bad
subsidies Ugly
subsidies
Total amounts
(US$ ‘000)
Subsidy intensity
(%)
Canada 0.94 2,382,416 202,550 162,550 267,498 632,598 27
Mexico 0.80 1,198,443 41,719 113,748 0 155,467 13
USA 0.94 4,545,906 936,600 92,210 29,900 1,058,710 23 Regional total 8,126,765 1,180,869 347,508 297,398 1,846,775 23

82 Catching More Bait: a bottom-up re-estimation of global fisheries subsidies, Sumaila and Pauly (eds.)
Region – Oceania
Country 2000 HDI
score 2000 LV
(US$’000) Good
subsidies Bad
subsidies Ugly
subsidies
Total amounts
(US$’000)
Subsidy intensity
(% )
Australia 0.95 1,747,995 55,873 56,318 199,000 311,191 18
Fiji 0.76 68,573 1,399 6,386 1,388 9,172 13
Kiribati NA 57,392 1,171 11,178 0 12,349 22
Maldives 0.75 324,979 6,829 33,755 0 40,584 12
Marshall Islands NA 19,779 711 27,803 0 28,514 144
Micronesia NA 57,353 2,061 187,975 0 190,036 331
Nauru NA 248 9 323 0 331 134
New Zealand 0.93 1,356,210 33,246 0 0 33,246 2
Palau 2,690 55 603 0 658 24
P. N. Guinea 0.54 203,878 7,328 66,451 4,126 77,904 38
Samoa 0.77 31,907 1,147 8,848 646 10,641 33
Solomon Islands 0.62 62,212 1,269 7,769 1,259 10,297 17
Tonga 0.79 9,230 332 2,309 0 2,641 29
Vanuatu 0.57 168,218 3,431 23,844 0 27,275 16
Regional total 4,110,663 114,859 433,562 206,418 754,838 18

Appendix 1: Regional fisheries subsidy estimates by categories 83
Region - Sub Saharan Africa
Country 2000 HDI
Score 2000 LV
(US$’000) Good
subsidies Bad
subsidies Ugly
subsidies
Total amounts
(US‘000m)
Subsidy intensity
(%)
Angola 0.38 569,576 20,471 30,595 1,235 52,302 9
Benin 0.42 14,466 1,178 803 3,177 5,158 36
Cameroon 0.50 139,960 5,030 6,805 0 11,836 8
Cape Verde 0.72 26,555 1,271 9,303 0 10,574 40
Comoros 0.53 32,391 541 59 140 740 2
Congo 0.49 10,547 379 982 0 1,361 13
Congo D. R. 0.37 50,175 0 0 0 0 0
Cote d'Ivoire 0.40 159,968 5,749 195,683 0 201,432 126
Djibouti 0.45 854 17 112 17 147 17
Equat. Guinea 0.70 6,270 128 584 127 839 13
Eritrea 0.44 30,943 1,604 7,687 626 9,917 32
Gabon 0.65 89,567 3,667 748,835 132 752,634 840
Gambia 0.45 64,894 1,060 17,996 1,313 20,369 31
Ghana 0.57 888,744 31,943 138,366 17,985 188,293 21
Guinea 0.43 214,761 3,524 17,652 366 21,542 10
Guinea-Biss. 0.35 11,480 413 0 232 645 6
Kenya 0.49 11,691 420 9,431 0 9,851 84
Liberia 18,413 376 977 373 1,725 9
Madagascar 0.47 250,536 5,110 0 0 5,110 2
Mauritania 0.47 100,928 1,829 136,694 2,042 140,565 139
Mauritius 0.79 23,603 481 2,198 0 2,679 11
Mozambique 0.35 63,596 1,297 10,088 1,287 12,672 20
Namibia 0.61 239,257 8,599 53,649 0 62,248 26
Nigeria 0.47 755,208 11,859 600 1,200 13,659 2
Sao T. & Pri. 0.65 8,466 173 788 171 1,132 13
Senegal 0.44 924,791 14,487 10,635 411 25,533 3
Seychelles 0.85 80,431 2,891 4,911 1,628 9,429 12
Sierra Leone 0.27 147,406 3,007 21,550 2,983 27,540 19
Somalia 49,080 1,001 4,570 993 6,565 13
South Africa 0.67 1,216,811 43,734 0 0 43,734 4
Sudan 0.51 12,270 441 3,403 248 4,092 33
Tanzania 0.41 129,521 4,655 29,043 0 33,698 26
Togo 0.50 42,398 865 6,199 858 7,921 19 Regional total 6,385,555 178,201 1,470,198 37,545 1,685,944 26

84 Catching More Bait: a bottom-up re-estimation of global fisheries subsidies, Sumaila and Pauly (eds.)
APPENDIX 2: GLOBAL COMPENDIUM OF NATIONAL FISHERIES SUBSIDY PROGRAMS.
INTRODUCTION
The information herein is a summary of subsidy support programs reported from 1995 to 2005, the information is reported by fishery subsidy types, as summarized below.
A. ‘Good subsidies’
A.1 Fisheries management programs and services;
A.2 Fishery research and development.
B. ‘Bad subsidies’
B.1 Boat construction renewal and modernization programs;
B.2 Fishery development projects and support services;
B.3 Fishing port construction and renovation programs;
B.4 Marketing support, processing and storage infrastructure programs;
B.5 Tax exemption programs;
B.6 Foreign access agreements.
C. ‘Ugly subsidies’
C.1 Fisher assistance programs;
C.2 Vessel buyback programs, and;
C.3 Rural fisheries community development programs
C.4 Others.
Reported subsidy amounts are given where available, annualized and adjusted for the year 2000 as explained in the text; estimates in brackets were obtained using the method outlined in the text. They are provided only for countries for which there was positive indication that the type of subsidy in question existed. Subsidy types not listed in the country inventory means that information was not available, even after a thorough search. This absence of information was interpreted as meaning the subsidy type in question does not exist in that country. This implies that the global estimate of subsidies given to marine fisheries is an underestimate.
Information from web links such as the FAO web resources are provided, and reference is made to the date the links were last accessed, at the end of the country report.

Appendix 2: Global compendium of national fisheries subsidy programs 85
Subsidy program description Amounts
(US$000) Source(s) of information Group I: Argentina 403,945 A.1 Fisheries management and services . 15,000 UNEP, 2003. A.1 UNDP/GEF/WB project for the technical preparation for
ITQ management system. http://www.fao.org/fi/fcp/es/ARG/body.htm A.1 FAO provided technical expertise for fishery data
statistical analysis. http://www.fao.org/fi/fcp/es/ARG/body.htm A.1 Naval patrol and surveillance programs . http://www.fao.org/fi/fcp/es/ARG/body.htm A.2 Funds from Japan to the fisheries research institute EL
INIDEP for research on fish stocks. http://www.fao.org/fi/fcp/es/ARG/profile.htm A. 2 Funds for research and technology development funded
by JICA, WB and OFCF. UNEP, 2003. Fishery research and development. (37, 203) B.1 Subsidies towards industrial boat construction and
development. http://www.fao.org/fi/fcp/es/ARG/profile.htm Boat construction, renewal and modernization programs (73,351) B. 2 Financial support through trade missions and public-
private partnership projects, partly funded by the World Bank and the Inter-American Development bank. UNEP, 2003.
Fishing port construction and renovation programs. (24,163) B.4 Government support with credit lines in order to
promote exports. UNEP, 2003. B.4 Subsidies programs for the reimbursements of exported
fisheries products. http://www.fao.org/fi/fcp/es/ARG/body.htm Marketing support, processing and storage infrastructure
programs. (90,220) B.5 Tax exemption programs. UNEP, 2003. Tax exemption programs. (18,545) C.1 Employment and other social benefits. UNEP, 2003. C.1 Worker retraining programs. UNEP, 2003. Fisher assistance programs. (73,189) C.2 Capacity reduction programs. http://www.fao.org/fi/fcp/es/ARG/body.htm Vessel buyback programs. (72,273) FAO Web links last accessed 28/03/06. Group I: Australia 311,191 A.1 Stock enhancement programs. http://www.daff.gov.au/ A.1 MPA programs. Australian Commodity Vol. 13 no. 1/03/05. A.1 Fisheries management and services. 25,954 OECD, 2004. A.2 R and D programs to develop new fisheries technology;
business Rand D programs. APEC, 2000. Fishery research and development programs. (29,919) B.1 Lending support programs such as loan guarantees to
Australia’s Commonwealth fishery program. APEC, 2000. B.1 Cost reducing transfers excluding the Agribiz package
and the shipbuilding bounty. 56,318 OECD, 2004. C.1 Community grants to boost economic activity after
fishing adjustment programs. 20,000 Australian Commodity Vol. 13 no. 1/03/05. C.1 Fishing business restructuring assistance programs. 30,000 Australian Commodity Vol. 13 no. 1/03/05. C.1 Assistance for skippers and crews. http://www.affa.gov.au/ C.2 Vessel buyback programs. 149,000 Australian Commodity Vol. 13 no. 1/03/05. C.2 Support for permanent withdrawal of fishing vessels. OECD, 2004.
Australian govt. fisheries web pages, last accessed 02/06/06.
Group I: Bahrain 3,630 A.1 Support towards fishery management programs from
Japanese government. http://www.fao.org/fi/fcp/en/BHR/profile.htm Fishery research and development programs. (492) B.1 Fishing equipment subsidies, equipment repair and bank
loans. http://www.fao.org/fi/fcp/en/BHR/profile.htm Boat construction, renewal and modernization programs. (970) B.3 Maintenance of fishing vessels facilities. http://www.fao.org/fi/fcp/en/BHR/profile.htm Fishing port construction and renovation programs. (953) B.5 Fishing equipment tax exemption programs. http://www.fao.org/fi/fcp/en/BHR/profile.htm Tax exemption programs. (245) C.1 Various aid programs and government loan programs to
assist local fishermen. http://www.fao.org/fi/fcp/en/BHR/body.htm Fisher assistance programs. (968) FAO Web links last accessed 02/06/06.

86 Catching More Bait: a bottom-up re-estimation of global fisheries subsidies, Sumaila and Pauly (eds.)
Subsidy program description Amounts
(US$000) Source(s) of information Group I: Belgium 12,758 A.1 Flemish government contribution to fishery management
programs. 1,527 http://www.fao.org/fi/fcp/en/BEL/body.htm A.1 EU and Belgian government fishery recovery plans. http://www.fao.org/fi/fcp/en/BEL/body.htm A.2 R&D towards research and support to the Foundation
Sustainable Fisheries Program. http://www.fao.org/fi/fcp/en/BEL/body.htm Fishery research and development programs. (987) B.4 Direct payments for marketing and processing programs. 689 OECD, 2004 B.6 Foreign fishing access agreements (EU). Milazzo, 1998. MRAG, 2000. Foreign access agreements. (1,726) C.1 Direct payments for fisher assistance packages. C.2 Direct payments for vessel buyback programs. C.2 Fishing capacity reduction programs. http://www.fao.org/fi/fcp/en/BEL/body.htm Vessel buyback programs. (1,918) C.4 Direct payments for marine capture fisheries programs
including C.1 & C.2 5,911 OECD, 2004 FAO Web links last accessed 02/06/06 Group I: Canada 632,598 A.1 Provincial funds for fishery enhancement and renewal
programs. Examples includes: the Pacific salmonid enhancement program, the Atlantic groundfish strategy, etc. http://www.fao.org/fi/fcp/en/CAN/body.htm
A.1 Annual stock assessment programs undertaken by DFO (not included in estimate). 57,700 APEC, 2000
A.1 Annual fisheries enforcement programs undertaken by DFO (not included in estimates). 52,500 APEC, 2000
A.1 User charges 32,214 A.1 Fisheries management programs and services. 121,074 OECD, 2004 A.2 R&D towards research and development. 49,262 OECD, 2004 B.1 Annual loan guarantee payment. 4,228 OECD, 2004 B.1 Loan guarantees and other lending support programs on
coastal Quebec and Atlantic Canada. APEC, 2000 B.1 Contributions under cost reducing transfer. 64,966 OECD, 2004 B.3 Payments towards fishing harbor facilities. 59,060 OECD, 2004 B.4 Direct payments under marketing and processing
programs. 34,296 OECD, 2004 C.1 Unemployment insurance programs 168,188 OECD, 2004 C.1 Older worker adjustment schemes and other retraining
programs 2,550 OECD, 2004 C.1 Other assistance programs 23,960 OECD, 2004 C.1 Annual support program towards the Atlantic fishery
assistance payments in mid 90s (not included in estimates) 239,048 APEC, 2000
C.1 Payments per license fisher per year, CAD $ 30,000 per year irrespective of other earnings, provided they fish for 12 wks of the year (not included in estimates). 20,204 http://www.fao.org/fi/fcp/en/CAN/body.htm
C.1 Payments made per year from 1990 to 1998 to minimize disruption by the cod fishery collapse (not included in estimates). 253,053 http://www.fao.org/fi/fcp/en/CAN/body.htm
C.2 DFO payments for license & vessel retirement programs overall in Canada 72,800 APEC, 2000
FAO Web links last accessed 05/06/06 Group I: Chile 48,090 A.1 Fishery enhancement and management programs
excluding aquaculture . 3,204 http://www.fao.org/fi/fcp/es/CHL/profile.htm A.2 Fisheries research fund. 4,000 APEC, 2000 A.2 Fisheries research collaboration (by the provision of
technical assistance) between Chile and Japan, Denmark, Norway, Iceland and Spain. http://www.fao.org/fi/fcp/es/CHL/profile.htm
B.4 Export oriented market programs. http://www.fao.org/fi/fcp/es/CHL/profile.htm Marketing support, processing and storage
infrastructure programs. (40,886) FAO Web links last accessed 14/04/06 Group I: China 1,331,117 A.1 State investments in firms, cooperatives & parastatals. APEC, 2000
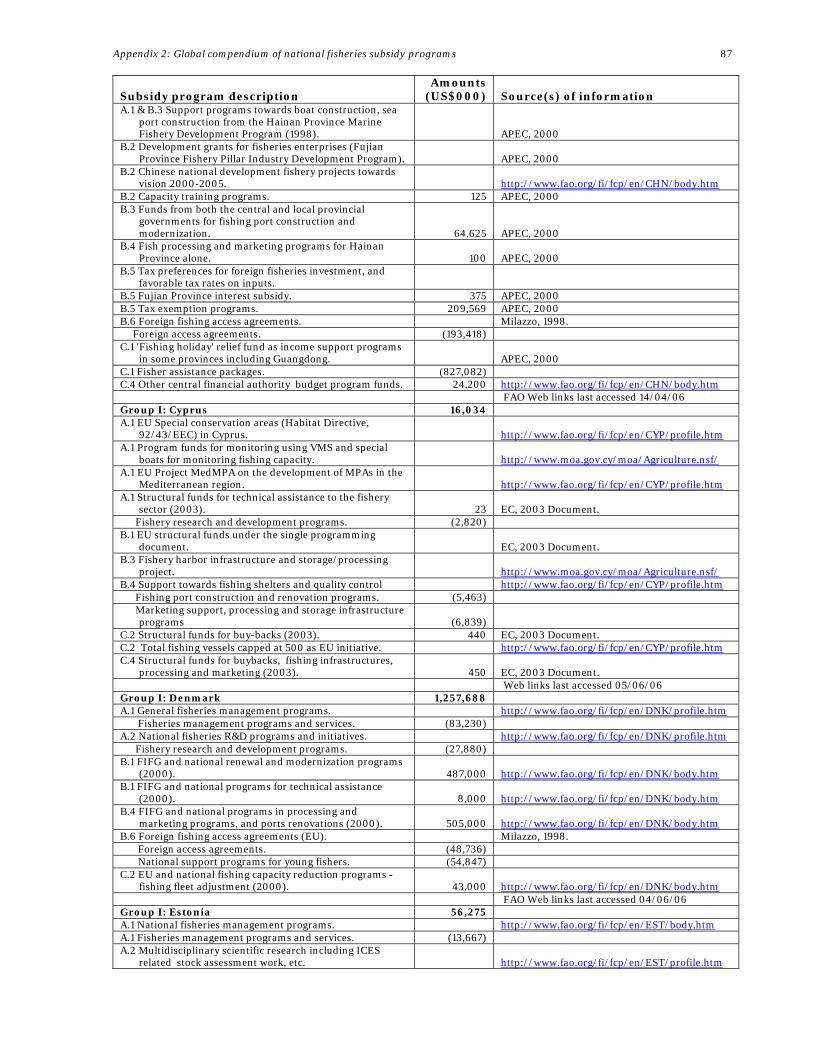
Appendix 2: Global compendium of national fisheries subsidy programs 87
Subsidy program description Amounts
(US$000) Source(s) of information A.1 & B.3 Support programs towards boat construction, sea
port construction from the Hainan Province Marine Fishery Development Program (1998). APEC, 2000
B.2 Development grants for fisheries enterprises (Fujian Province Fishery Pillar Industry Development Program). APEC, 2000
B.2 Chinese national development fishery projects towards vision 2000-2005. http://www.fao.org/fi/fcp/en/CHN/body.htm
B.2 Capacity training programs. 125 APEC, 2000 B.3 Funds from both the central and local provincial
governments for fishing port construction and modernization. 64,625 APEC, 2000
B.4 Fish processing and marketing programs for Hainan Province alone. 100 APEC, 2000
B.5 Tax preferences for foreign fisheries investment, and favorable tax rates on inputs.
B.5 Fujian Province interest subsidy. 375 APEC, 2000 B.5 Tax exemption programs. 209,569 APEC, 2000 B.6 Foreign fishing access agreements. Milazzo, 1998. Foreign access agreements. (193,418) C.1 'Fishing holiday' relief fund as income support programs
in some provinces including Guangdong. APEC, 2000 C.1 Fisher assistance packages. (827,082) C.4 Other central financial authority budget program funds. 24,200 http://www.fao.org/fi/fcp/en/CHN/body.htm FAO Web links last accessed 14/04/06 Group I: Cyprus 16,034 A.1 EU Special conservation areas (Habitat Directive,
92/43/EEC) in Cyprus. http://www.fao.org/fi/fcp/en/CYP/profile.htm A.1 Program funds for monitoring using VMS and special
boats for monitoring fishing capacity. http://www.moa.gov.cy/moa/Agriculture.nsf/ A.1 EU Project MedMPA on the development of MPAs in the
Mediterranean region. http://www.fao.org/fi/fcp/en/CYP/profile.htm A.1 Structural funds for technical assistance to the fishery
sector (2003). 23 EC, 2003 Document. Fishery research and development programs. (2,820) B.1 EU structural funds under the single programming
document. EC, 2003 Document. B.3 Fishery harbor infrastructure and storage/processing
project. http://www.moa.gov.cy/moa/Agriculture.nsf/ B.4 Support towards fishing shelters and quality control http://www.fao.org/fi/fcp/en/CYP/profile.htm Fishing port construction and renovation programs. (5,463) Marketing support, processing and storage infrastructure
programs (6,839) C.2 Structural funds for buy-backs (2003). 440 EC, 2003 Document. C.2 Total fishing vessels capped at 500 as EU initiative. http://www.fao.org/fi/fcp/en/CYP/profile.htm C.4 Structural funds for buybacks, fishing infrastructures,
processing and marketing (2003). 450 EC, 2003 Document. Web links last accessed 05/06/06 Group I: Denmark 1,257,688 A.1 General fisheries management programs. http://www.fao.org/fi/fcp/en/DNK/profile.htm Fisheries management programs and services. (83,230) A.2 National fisheries R&D programs and initiatives. http://www.fao.org/fi/fcp/en/DNK/profile.htm Fishery research and development programs. (27,880) B.1 FIFG and national renewal and modernization programs
(2000). 487,000 http://www.fao.org/fi/fcp/en/DNK/body.htm B.1 FIFG and national programs for technical assistance
(2000). 8,000 http://www.fao.org/fi/fcp/en/DNK/body.htm B.4 FIFG and national programs in processing and
marketing programs, and ports renovations (2000). 505,000 http://www.fao.org/fi/fcp/en/DNK/body.htm B.6 Foreign fishing access agreements (EU). Milazzo, 1998. Foreign access agreements. (48,736) National support programs for young fishers. (54,847) C.2 EU and national fishing capacity reduction programs -
fishing fleet adjustment (2000). 43,000 http://www.fao.org/fi/fcp/en/DNK/body.htm FAO Web links last accessed 04/06/06 Group I: Estonia 56,275 A.1 National fisheries management programs. http://www.fao.org/fi/fcp/en/EST/body.htm A.1 Fisheries management programs and services. (13,667) A.2 Multidisciplinary scientific research including ICES
related stock assessment work, etc. http://www.fao.org/fi/fcp/en/EST/profile.htm

88 Catching More Bait: a bottom-up re-estimation of global fisheries subsidies, Sumaila and Pauly (eds.)
Subsidy program description Amounts
(US$000) Source(s) of information A.2 Fishery research and development programs. (4,578) B.1 FIFG modernization and renewal of fishing fleet
programs. Estonia-EU SPD, 2003. Boat construction, renewal and modernization programs. (9,027) B.4 FIFG Investment support measures for fisheries chain. Estonia-EU SPD, 2003. Marketing support, processing and storage infrastructure
programs . (11,102) C.1 FIFG measures for restructuring of the fisheries sector
from unfavorable socio-economic impacts. http://www.fao.org/fi/fcp/en/EST/body.htm Fisher assistance packages. (9,007) C.2 Fishing capacity reduction under the FIFG scheme. http://www.fao.org/fi/fcp/en/EST/profile.htm Vessel buyback programs. (8,894) C.4 Other fisheries related measures, which include social
and market research (FIFG). Estonia-EU SPD, 2003. FAO Web links last accessed 16/06/06 Group I: Finland 15,844 A.1 Monitoring control & surveillance program. 926 OECD, 2004 A.1 Protection of marine areas for the rearing of juvenile
salmon smolts. 235 OECD, 2004 A.1 Support towards management programs. 2,161 OECD, 2004 A.2 Fishery research and development programs. 2,623 OECD, 2004 B.1 Vessel construction and modernization 477 OECD, 2004 B.2 Fisheries transportation subsidies. 442 OECD, 2004 B.3 Support for fishing ports. 2,000 OECD, 2004 B.4 Export promotion programs. 1,127 OECD, 2004 B.4 Investment in marketing and processing programs. 1,953 OECD, 2004 B.6 Foreign fishing access agreements (EU). Milazzo, 1998. Foreign access agreements. (1,297) B.5 Insurance towards the Aland County scheme. 1,111 OECD, 2004 C.1 Compensation to salmon fishers (in Aland County) from
damage caused by seals. 50 OECD, 2004 C.2 Fishing capacity adjustment programs in tune with the
EU fisheries common policy. http://www.fao.org/fi/fcp/en/FIN/body.htm Vessel buyback programs. (1,442) Group I: France 266,282 A.1 Management and administrative cost including
enforcement. 11,972 OECD, 2004 A.2 Fishery research and development programs. 49,541 OECD, 2004 B.1 Renewal and modernization of fleets in the form of direct
payments to the fishing sector. 9,908 OECD, 2004 B.2 Funds for rebuilding the fishery after storm Erika. 38,807 OECD, 2004 B.3 Fishing port & harbor construction, & renovation
programs 1,835 OECD, 2004 B.4 Marketing support, processing and storage
infrastructure programs 28,716 OECD, 2004 B.5 Interest rebates 8,716 OECD, 2004 B.6 Foreign fishing access agreements (EU). Milazzo, 1998. Foreign access agreements. (100,090) C.1 Unemployment insurance programs 5,229 OECD, 2004 C.1 Compensation for geographic remoteness. 5,688 OECD, 2004 C.2 Vessel buyback programs in tune with EU fisheries
common policy. 5,780 OECD, 2004 Group I: Germany 45,074 A.1 Federal depleted fishery recovery program. 3,347 http://www.fao.org/fi/fcp/en/DEU/profile.htm A.2 German and EU research and conservation policy and
programs. 3,589 http://www.fao.org/fi/fcp/en/DEU/profile.htm B.1 Annual lending programs towards purchase and renewal
of fishing vessels. 1,079 OECD, 2004 B.1 Grants for the purchase and modernization of fishing
vessels. 6,427 OECD, 2004 B.4 Marketing support, processing & storage infrastructure
programs 18,013 OECD, 2004 B.5 Interest subsidies. 375 OECD, 2004 B.6 Foreign fishing access agreements (EU). Milazzo, 1998. Foreign access agreements. (6,274) C.1 Federal capacity aid program to ameliorate the fishing
sector difficulties. 5,172 http://www.fao.org/fi/fcp/en/DEU/profile.htm

Appendix 2: Global compendium of national fisheries subsidy programs 89
Subsidy program description Amounts
(US$000) Source(s) of information C.2 Payments for both the temporary and permanent
withdrawal of fishing vessels. 798 OECD, 2004 FAO Web links last accessed 05/06/06 Group I: Greece 75,843 A.1 Control, monitoring and surveillance programs. 28,900 OECD, 2004 A.2 Fishery research and development programs. 452 OECD, 2004 B.2 Administrative support. 1,277 OECD, 2004 B.3 Fishing port/ harbor construction, & renovation
programs 5,404 OECD, 2004 B.4 Miscellaneous market intervention programs. 11,034 OECD, 2004 B.5 Tax exemptions programs excluding fuel amounts. (2,008) OECD, 2004 B.6 Foreign fishing access agreements (EU). Milazzo, 1998. Foreign access agreements. (7,041) C.1 Fishermen assistance programs. http://www.eurofish.dk/indexSub.php?id=210 C.2 Direct payments for fleet reduction programs. 11,803 OECD, 2004 Eurofish web link, last visited 05/06/06. Group I: Hong Kong 3,341 A.1 Habitat enhancement project including artificial reefs. 2,564 APEC, 200 B.2 Development grants for fisheries enterprises. APEC, 2000 Fishery development projects and support services. (777) Group I: Iceland 78,689 A.1 Total amounts towards fisheries monitoring, control &
surveillance programs. 11,617 OECD, 2004 A.2 Total of fisheries research transfers 12,125 OECD, 2004 B.2 Development grants for fisheries enterprises. 7,990 OECD, 2004 B.4 Marketing support, processing & storage infrastructure
programs 5,796 OECD, 2004 B.5 Income tax deductions for fishers. 15,511 OECD, 2004 Foreign access agreements. (25,523) C.1 Fisher training programs. 127 OECD, 2004 Group I: Ireland 108,511 A.1 Total amount for administrative, research and fish stock
sustainability programs (2002). 54,057 OECD, 2005 B.1 Irish and EU grant-aid to promote the renewal of
whitefish fleet investments (2003). 3,297 http://www.fao.org/fi/fcp/en/IRL/profile.htm B.4 Direct total payments for marketing and processing
programs (2002). 1,189 OECD, 2005 B.6 Foreign fishing access agreements (EU). Milazzo, 1998 Foreign access agreements. (10,723) C.1 Direct payments taken for fisher assistant programs, may
include other descriptions. 39,245 OECD, 2005 FAO Web links last accessed 06/06/06 Group I: Israel 1,396 A.1 National fisheries management programs. http://www.fao.org/fi/fcp/en/ISR/body.htm Fisheries management programs and services . (631) A.2 Government funded fishery research and development
programs. http://www.fao.org/fi/fcp/en/ISR/profile.htm Fishery research and development programs. (211) B.1 Vessel renewal programs. http://www.fao.org/fi/fcp/en/ISR/body.htm Boat construction, renewal and modernization programs. (417) B.2 Government investment grants towards fishing
equipments for fishing fleets. http://www.fao.org/fi/fcp/en/ISR/body.htm Development grants for fisheries enterprises. (137) FAO Web links last accessed 16/06/06 Group I: Italy 226,576 A.1 General fisheries management programs and services. 50,576 OECD, 2004 B.4 Market intervention programs. 53,407 OECD, 2004 B.6 Foreign fishing access agreements (EU). Milazzo, 1998. Foreign access agreements. (22,937) C.1 Payments for fisher assistance packages and other
unspecified programs. 92,549 OECD, 2004 C.4 Contributions under cost reducing transfers (not
specified). 7,107 OECD, 2004 Group I: Japan 4,203,227 A.1 General fisheries management programs and services. 2,807,057 OECD, 2004 B.1 Financial support for setting up new fishing vessels. 37,491

90 Catching More Bait: a bottom-up re-estimation of global fisheries subsidies, Sumaila and Pauly (eds.)
Subsidy program description Amounts
(US$000) Source(s) of information B.1 Subsidized lending programs. APEC, 2000 B.2 Development grants towards fishery enterprises. APEC, 2000 Fishery development projects and support services. (228,640) B.4 Market intervention programs. 43,008 OECD, 2004 B.5 Tax preferences and insurance programs. APEC, 2000 Tax exemptions programs. (175,479) B.6 Foreign access payments 200,000 Milazzo, 1998 C.1 Assistance to fish workers (Fishery Trust Fund Subsidy) APEC, 2000 C.1 Fisher assistance programs. Milazzo, 1998 Fisher assistance programs. (692,543) C.2 Vessel buyback programs. 19,010 OECD, 2004 Group I: Republic of Korea 359,809 A.1 Stock enhancement programs. 48,558 OECD, 2004 A.2 Fishery research and development programs. 4,953 OECD, 2004 A.1 Cost reducing transfer for renewal and modernization of
fishing vessels. 7,695 OECD, 2004 B.1 Subsidized lending programs. APEC, 2000 B.3 Fishing port/ harbor construction, & renovation
programs. 160,977 OECD, 2004 B.4 Marketing support, processing & storage infrastructure
programs. 4,422 OECD, 2004 B.5 Support for crew insurance. 4,157 OECD, 2004 B.6 Foreign fishing access agreements. Milazzo, 1998. Foreign access agreements. (43,606) C.2 Fishing fleet reduction programs. 29,453 OECD, 2004 C.4 Other cost reducing transfers 55,988 OECD, 2004 Group I: Kuwait 2,112 A.1 Government subsidization programs to the management
of the fishery sector. http://www.fao.org/fi/fcp/en/KWT/profile.htm Fisheries management programs and services. (752) A.2 Kuwaiti government support towards fishery research
and development. http://www.fao.org/fi/fcp/en/KWT/profile.htm Fishery research and development programs. (252) B.1 Subsidy programs towards the development of the
fishery sector. http://www.fao.org/fi/fcp/en/KWT/profile.htm Boat construction, renewal and modernization programs. (497) B.4 Marketing support programs http://www.fao.org/fi/fcp/en/KWT/profile.htm Marketing support, processing & storage infrastructure
programs (611) FAO Web links last accessed 10/06/06 Group I: Malta 1,224 A.1 EU Financial cooperation and Pre-accession assistance
towards the fisheries sector for monitoring and control programs 387
http://europa.eu.int/eur-lex/budget/data/D2004_EUR25_VOL4/EN/nmc-titleN1A447/nmc-chapterN1A79E/index.html
A.2 Externally funded research programs. http://www.fao.org/fi/fcp/en/MLT/profile.htm Fishery research and development programs. (44) B.1 Financial support towards fleet renewal programs 272 http://www.maltafisheries.gov.mt/news.asp B.4 Marketing and processing support programs 209 http://www.maltafisheries.gov.mt/news.asp C.2 Fishing fleet reduction programs. 311 http://www.maltafisheries.gov.mt/news.asp Web links last accessed 10/06/06 Group I: Mexico 155,467 A.1 Fisheries management expenditures. 6,944 OECD, 2000 A.1 Enforcement expenditures. 868 OECD, 2000 A.2 Fisheries research expenditures. 33,907 OECD, 2000 B.1 Financing fisheries investment projects FIRA-FOPESCA. 61,100 APEC, 2000 B.1 Fishing fleet modernization program. 40,848 APEC, 2000 B.4 BANCOMEXT export subsidies. 11,800 APEC, 2000 Group I: Netherlands 30,121 A.1 Fisheries management expenditure. 508 OECD, 2004 A.2 Innovative actions in fisheries management. 2,630 OECD, 2004 B.4 Direct payments towards marketing and processing
programs. 2,275 OECD, 2004 B.6 Foreign fishing access agreements (EU). Milazzo, 1998. Foreign access agreements. (14,953) C.2 Decommissioning programs. 6,273 OECD, 2004 C.2 Payments for voluntary temporary stops. 3,482 OECD, 2004

Appendix 2: Global compendium of national fisheries subsidy programs 91
Subsidy program description Amounts
(US$000) Source(s) of information Group I: New Zealand 33,246 A.1 Regulatory management, fishing access and
administration programs. 7,728 OECD, 2004 A.1 Program support towards fisheries monitoring,
enforcement and prosecution. 10,973 OECD, 2004 A.1 User charges 12,272 OECD, 2004 A.1 General services towards policy framework 2,273 OECD, 2004 Group I: Norway 153,834 A.1 Monitoring, control and surveillance programs. 45,666 OECD, 2004 A.1 Departmental and agency costs. 16,330 OECD, 2004 A.2 Fishery research and development programs. 22,407 OECD, 2004 B.2 Transport subsidies. 3,750 OECD, 2004 B.5 Interest subsidies and investment support for vessel
building. 8,523 OECD, 2004 C.1 Income support programs. 1,591 OECD, 2004 C.1 Worker adjustment programs. 9,822 http://www.fao.org/fi/fcp/en/NOR/body.htm C.2 Fishing fleet reduction programs. http://www.fao.org/fi/fcp/en/NOR/body.htm Fishing fleet reduction programs. (40,063) C.4 Other cost reducing subsidies 5,682 OECD, 2004 Web links last accessed 10/06/06 Group I: Russia 1,440,925 A.1 Enforcement and control programs. Milazzo, 1998 Fisheries management programs and services. (154,063) A.2 Government research and development programs. http://www.fao.org/fi/fcp/en/RUS/profile.htm Fishery research and development programs. (459,923) B.1 The 'Ryba' program for fleet renewal and modernization. 100,000 APEC, 2000 B.1 Developing and reviving ship building facilities. http://www.fao.org/fi/fcp/en/RUS/profile.htm B.1 Government ship building facilities and programs. B.3 The Ryba program: fisheries infrastructure support,
maintenance and repairs. 280,000 APEC, 2000
B.4 Russian state grants to the Murmansk fish processing factories.
http://www.sr.se/cgi-bin/euroarctic/amnessida.asp?programID=2460&Nyheter=0&grupp=2604&artikel=813284
B.5 Tax incentives endorsed by the Russian Committee on Fisheries. Milazzo, 1998
Tax exemption programs (76,796) B.6 International fishing agreements. Pashkova, 2001. Milazzo, 1998. B.6 State committee for fisheries' partner fishing agreements http://www.fao.org/fi/fcp/en/RUS/profile.htm Fishing access payments (70,878) C.2 Fishing fleet reduction programs. Pashkova, 2001 Vessel buyback programs. (299,291) Web links last accessed 16/06/06 Group I: Singapore 4,000 B.3 Fishing port infrastructure enhancement programs. 2,000 APEC, 2000 B.4 Fish product promotion programs. 2,000 APEC, 2000 Group I: Spain 457,362 A.1 General fisheries management programs and services. 12,136 OECD, 2004 A.1 Innovative measure and pilot projects. 328 OECD, 2004 A.1 Exploratory fishing. 809 OECD, 2004 A.1 Monitoring, control and surveillance programs. 8,812 OECD, 2004 A.1 MPA programs 1,713 OECD, 2004 A.2 Fishery research and development programs, both
regional and national. 7,049 OECD, 2004 B.1 PESCA initiative. 50,562 OECD, 2004 B.1 Vessel modernization programs. 16,691 OECD, 2004 B.2 New vessel construction. 63,761 OECD, 2004 B.2 Technical assistance and educational support. 3,058 OECD, 2004 B.3 & B.4 Fishing port renovation, processing and marketing
support programs. 12,349 OECD, 2004 B.4 Marketing and processing programs. 62,455 OECD, 2004 B.6 Foreign access agreements (EU). Milazzo, 1998. Foreign access payments. (124,910) C.1 Socioeconomic measures. 260 OECD, 2004 C.2 Permanent vessel withdrawals. 8,525 OECD, 2004 C.2 Regional aids for temporary stops and permanent
withdrawals. 83,944 OECD, 2004

92 Catching More Bait: a bottom-up re-estimation of global fisheries subsidies, Sumaila and Pauly (eds.)
Subsidy program description Amounts
(US$000) Source(s) of information Group I: Sweden 34,065 A.1 General fisheries management programs and services. 17,893 OECD, 2004 A.1 User charges 407 A.2 Fisheries management and research. http://www.fao.org/fi/fcp/en/SWE/body.htm Fishery research and development programs. (2,677) B.1 Grants towards vessel modernization and renewal from
both state and EU sources. http://www.fao.org/fi/fcp/en/SWE/body.htm B.1 Cost reducing transfers 2,358 OECD, 2004 B.6 Foreign access agreements (EU). Milazzo, 1998. Foreign access payments. (4,679) C.1 Direct payments including fisher assistance packages 852 OECD, 2004 C.2 EU capacity reduction programs. http://www.fao.org/fi/fcp/en/SWE/body.htm Vessel buyback programs. (5,200) FAO web links last accessed 16/06/06 Group I: Taiwan 273,687 A.1 Stock Enhancement program. 4,829 APEC, 2000 A.1 Stock assessment programs. 2,800 APEC, 2000 A.1 General fisheries management programs. 14,165 APEC, 2000 A.2 Fishery research and development programs towards
marine capture fisheries. 4,081 APEC, 2000 B.1 State investment in capital and infrastructural support
towards fishing fleets. 79,400 APEC, 2000 B.3 Funds towards fishing ports infrastructure and fishery
development programs. 126,514 APEC, 2000 B.4 Fish product market promotion programs. 6,300 APEC, 2000 B.6 Foreign access agreements Milazzo, 1998 Foreign access payments (21,098) C.1 Marine insurance to fishing vessels and fishermen. 4,800 APEC, 2000 C.1 Worker adjustments and retraining programs. 9,700 APEC, 2000 Group I: United Arab Emirates 17,643 A.1 Government fisheries management support programs. http://www.fao.org/fi/fcp/en/ARE/body.htm A.1 Government fisheries MPA programs in place. http://www.fao.org/fi/fcp/en/ARE/body.htm Fisheries management programs and services. (13,216) Fishery research and development programs. (4,427) FAO web links last accessed 16/06/06 Group I: United Kingdom 149,139 A.1 Monitoring, control and surveillance programs. 42,727 OECD, 2004 A.2 Fishery research and development programs. 21,364 OECD, 2004 B.1 Boat construction, renewal and modernization programs. 364 OECD, 2004 B.3 Fishing port construction, & renovation programs. 1,546 OECD, 2004 B.4 Marketing support, processing and storage
infrastructure programs. 4,713 OECD, 2004 B.6 Foreign access agreements (EU). Milazzo, 1998. Foreign access payments. (36,112) C.1 PESCA Program. 2,182 OECD, 2004 C.2 EU common fishery policy on capacity reduction. http://www.fao.org/fi/fcp/en/GBR/profile.htm Vessel buyback programs. (40,131) FAO web links last accessed 16/06/06 Group I: United States 1,058,710 A.1 Conservation and management programs. 168,700 OECD, 2004 A.1 Fishery data collection support programs. 225,900 OECD, 2004 A.1 Monitoring, control and surveillance programs. 542,000 OECD, 2004 B.1 NMFS industrial fisheries financed programs. 2,250 OECD, 2004 B.2 Fisheries development program funds and grants. 25,380 OECD, 2004 B.4 Promotion programs under marketing and processing. 41,080 OECD, 2004 B.5 NMFS Capital Construction Fund tax deferral programs. 2,500 OECD, 2004 B.6 Foreign access payments. 21,000 Mwikya, 2006 C.1 NMFS Fishermen’s contingency funds. 1,000 OECD, 2004 C.1 Fisheries disaster relief. 28,900 OECD, 2004 Group II: Albania 1,325 A.1 Stock enhancement programs http://www.fao.org/fi/fcp/en/ALB/profile.htm A.1 ADRIAMED project funded by the Italian government
for monitoring, control and surveillance. http://www.fao.org/fi/fcp/en/ALB/profile.htm A.1 Coastal zone management programs including artificial
reefs and other management programs. 38 http://www.fao.org/fi/fcp/en/ALB/profile.htm

Appendix 2: Global compendium of national fisheries subsidy programs 93
Subsidy program description Amounts
(US$000) Source(s) of information A.2 INTEREG Project funded by the EU towards marine
resources research and environmental protection. http://www.fao.org/fi/fcp/en/ALB/profile.htm B.2 World Bank fishery development project 670 http://www.fao.org/fi/fcp/en/ALB/profile.htm B.3 The rehabilitation and improvement of nine marine
fishing ports. 69 Albania Government Project Appraisal Doc., 2001.
B.3 Technical assistance through the World Bank pilot fishery development project. 41
Albania Government Project Appraisal Doc., 2001.
B.5 The EU Phare Sector Operative Project funds and technical assistance for marketing and fishery infrastructures http://www.fao.org/fi/fcp/en/ALB/profile.htm
Marketing support, processing and storage infrastructure programs. (507)
FAO web links last accessed 15/03/06 Group II: Antigua and Barbuda 6,099 A.1 Stock enhancement programs. http://www.fao.org/fi/fcp/en/ATG/profile.htm Fisheries management programs and services. (90) A.2 Fisheries research and development http://www.fao.org/fi/fcp/en/ATG/profile.htm Fishery research and development programs. (68) B.1 Subsidized lending from the Antigua and Barbados
Development Bank and the National Development Foundation. 191 http://www.fao.org/fi/fcp/en/ATG/body.htm
B.2 Assistance from JICA in berthing and harbor facilities. http://www.fao.org/fi/fcp/en/ATG/profile.htm B.2 Capacity building projects by CIDA and the
Commonwealth fund for technical cooperation. http://www.fao.org/fi/fcp/en/ATG/profile.htm Fishery development projects and support services. (410) B.3 Fishing port construction and renovation programs. http://www.fao.org/fi/fcp/en/ATG/profile.htm Fishing port construction and renovation programs. (4,529) B.4 Assistance from JICA for processing and gear
technology. http://www.fao.org/fi/fcp/en/ATG/profile.htm Marketing support, processing and storage infrastructure
programs. (577) B.5 Tax and duty-free concessions for new vessels, engines,
fishing gear and other related fishing equipment. http://www.fao.org/fi/fcp/en/ATG/body.htm Tax exemption programs. (234) Web links last accessed 18/06/06. Group II: Bahamas 7,697 A.1 Fishery management programs. http://www.breef.org/fisheries.pdf Fisheries management programs and services. (554) A.2 Fisheries R&D programs http://www.breef.org/fisheries.pdf Fishery research and development. (422)
B.1 Subsidized lendngs for fishery investments and a small boat loan program towards the lobster fishery.
http://filaman.ifm-geomar.de/Training/Reports/Belize/mr_crb01.htm
Boat construction renewal and modernization programs. (1,321) B.1 Subsidized loan programs towards fishing input such as
boats http://www.breef.org/fisheries.pdf Fishery research and development. (2,529) B.5 Duty exemption on fishing equipments and inputs. 2,871 http://www.breef.org/fisheries.pdf Web links last accessed 24/03/06. Group II: Bangladesh 313,008 A.1 Support provided towards resource surveys and stock
assessment. http://www.fao.org/fi/fcp/en/BGD/profile.htm A.1 GEF support towards biodiversity and marine
conservation. http://www.fao.org/fi/fcp/en/BGD/profile.htm Fisheries management programs and services. (16,708)
A.2 Fisheries R&D programs http://www.fao.org/fi/fcp/en/BGD/profile.htm Fishery research and development. (12,733)
B.1 State assistance towards fishery inputs for fishery enterprises Khatun et al. 2004. Boat construction renewal and modernization programs. (39,831)
B.2 Institutional support to the fisheries sector by UNDP, World Bank, DFID amongst others. http://www.fao.org/fi/fcp/en/BGD/profile.htm
B.2 Technical assistance and infrastructure support for fishery development from EU, DANIDA etc. http://www.fao.org/fi/fcp/en/BGD/profile.htm Fishery development projects and support services. (76,280)
B.4 Support for HACCP programs by the FAO, i.e., export subsidies. Khatun et al. 2004.
Marketing support, processing and storage infrastructure programs. (107,401)

94 Catching More Bait: a bottom-up re-estimation of global fisheries subsidies, Sumaila and Pauly (eds.)
Subsidy program description Amounts
(US$000) Source(s) of information B.5 Duty free imports of capital machinery and fishing
inputs, custom clearance for fish exports and other tax rebates. Khatun et al. 2004.
B.5 Financial incentives provided by the government UNEP, 2000. Tax exemption programs. (43,479)
C.3 Rural fishers’ community programs and projects funded by DFID, ICLARM, World Bank and UNDP. UNEP, 2000. Rural fisheries community development programs. (15,576)
Web links last accessed 19/03/06. Group II: Barbados 9,899 A.1 Support towards stock assessment, monitoring and
control programs. http://www.fao.org/fi/fcp/en/BRB/profile.htm Fisheries management programs and services. (155)
A.1 & A.2 Fishery management, research and development programs. http://www.fao.org/fi/fcp/en/BRB/profile.htm Fishery research and development. (118)
B.1 Subsidized loans for fisheries enterprises including the support from the Rural Enterprise Fund. 243 http://www.fao.org/fi/fcp/en/BRB/profile.htm
B.3 Inter American Development support for the Bridgetown fisheries complex. http://www.fao.org/fi/fcp/en/BRB/profile.htm Fishing port construction and renovation programs. (7,826)
B.4 European Development Fund (EDF) for fisheries marketing infrastructure. http://www.fao.org/fi/fcp/en/BRB/profile.htm
Marketing support, processing and storage infrastructure programs. (998)
B.5 Duty free concessions on fishing inputs. http://www.agriculture.gov.bb/default.asp?V_DOC_ID=786
Tax exemption programs. (404)
C.3 Assistance to fisher organizations. http://www.agriculture.gov.bb/default.asp?V_DOC_ID=788
Rural fishers community development programs. (154) Web links last accessed 17/06/06. Group II: Belize 10,540 A.1 Government fisheries MPA programs in place. http://www.fao.org/fi/fcp/en/BLZ/profile.htm A.1 Overseas development agencies (ODA) technical
assistance programs towards fishery management. http://www.fao.org/fi/fcp/en/BLZ/profile.htm Fisheries management programs and services. (1,235)
A.2 GEF funded projects and CARICOM research projects. http://www.fao.org/fi/fcp/en/BLZ/profile.htm Fishery research and development. (941)
B.1 Subsidized benefits from loans towards the fishery sector. 2,117 http://www.belize.gov.bz/cabinet/d_silva/welcome.shtml
B.5 Belize enjoys export subsidies to the U.S.A. under the Caribbean Basin Initiative 6,226 http://www.fao.org/fi/fcp/en/BLZ/profile.htm
C.3 Assistance to fisher organizations. 21 http://www.fao.org/fi/fcp/en/BLZ/profile.htm Web links last accessed 18/06/06. Group II: Benin 5,158 A.1 Fisheries management programs towards stock
replenishment and assessment. 120 http://www.fao.org/fi/fcp/fr/BEN/profile.htm A.1 Fisheries management programs the coastal zone,
funded by the Netherlands. 833 http://www.fao.org/fi/fcp/fr/BEN/profile.htm A.2 Fisheries management, research and development
programs http://www.fao.org/fi/fcp/fr/BEN/profile.htm Fishery research and development. (225) B.2 JICA project funds for the provision of fishing
equipments. 802 http://www.fao.org/fi/fcp/fr/BEN/profile.htm C.3 Subsidies towards the artisanal fishery development
project funded by AfDB 3,177 Web links last accessed 18/06/06. Group II: Brazil 1,336,166 A.1 Government funded fishery management programs. http://www.fao.org/fi/fcp/en/BRA/body.htm
Fisheries management programs and services. (24,418) A.2 Research towards appraisal of fishery resources, socio-
economics, fishery statistics etc. http://www.fao.org/fi/fcp/en/BRA/body.htm Fishery research and development. (18,610)
B.1 Enhancing and renovating ocean fleets with support from the government and the banks. http://www.fao.org/fi/fcp/en/BRA/body.htm Boat construction renewal and modernization programs. (58,211)

Appendix 2: Global compendium of national fisheries subsidy programs 95
Subsidy program description Amounts
(US$000) Source(s) of information B.3 Modernizing port infrastructures with support from the
government and the banks. http://www.fao.org/fi/fcp/en/BRA/body.htm Fishing port construction and renovation programs. (1,231,219)
B.5 Fiscal incentives are provided including about 25% tax reduction in fishery investment projects.
Abdallah and Sumaila, this volume; Bank of Brazil
C.3 Subsidized rural credit programs towards fishing activities. 3,708
Abdallah and Sumaila, this volume; Bank of Brazil
Web links last accessed 18/06/06. Group II: Brunei Darussalam 967 A.1 General fisheries mngt programs including
enhancement. http://www.fisheries.gov.bn/potentials/index.htm
Fisheries management programs and services. (64) A.2 Stock appraisal and surveys for tuna and other capture
fisheries. http://www.fisheries.gov.bn/potentials/index.htm
Fishery research and development. (49) B.1 & B.2 General government incentive and support
programs towards the fishery sector. http://www.fisheries.gov.bn/potentials/index.htm
Boat construction renewal and modernization programs. (152) Fishery development projects and support services. (292)
B.4 Government incentive and support programs towards the processing sector.
http://www.fisheries.gov.bn/potentials/index.htm
Marketing support, processing and storage infrastructure programs. (411)
Web links last accessed 18/06/06. Group II: Bulgaria 3,380 A.1 Stock enhancement programs. http://www.fao.org/fi/fcp/en/BGR/profile.htm A.1 Fishery management programs with EU assistance in
information and statistical installations. http://www.fao.org/fi/fcp/en/BGR/profile.htm A.1 Monitoring and surveillance programs. http://www.fao.org/fi/fcp/en/BGR/profile.htm
Fisheries management programs and services. (307) B.4 Provision of marketing infrastructure. http://www.fao.org/fi/fcp/en/BGR/profile.htm Marketing support, processing and storage infrastructure
programs. (1,971) B.5 Tax exemptions on fishery inputs and outputs. http://www.fao.org/fi/fcp/en/BGR/profile.htm
Tax exemption programs. (798) C.3 Rural fisher development programs. http://www.fao.org/fi/fcp/en/BGR/profile.htm
Rural fishers’ community development programs. (304) FAO web links last accessed 17/06/06. Group II: Cambodia 18,830 A.1 SEAFDEC regional projects through training, research
and information services. http://www.fao.org/fi/fcp/en/KHM/profile.htm Fisheries management programs and services. (1,941)
A.2 Research towards appraisal of fishery resources, R&D, etc. http://www.fao.org/fi/fcp/en/KHM/profile.htm Fishery research and development. (1,479)
B.1 Fisheries enterprise development through economic incentives through the state monopoly company, KAMFIMEX. http://www.fao.org/fi/fcp/en/KHM/profile.htm Boat construction renewal and modernization programs. (4,626)
B.2 World Bank funded projects in various areas of fisheries with loans and grants in biodiversity protection programs. http://www.fao.org/fi/fcp/en/KHM/profile.htm Fishery development projects and support services. (8,859)
C.3 Government support of rural fisheries development and the implementation of cooperative management. http://www.fao.org/fi/fcp/en/KHM/profile.htm Rural fishers’ community development programs. (1,925)
FAO web links last accessed 19/06/06.
Group II: Cameroon 11,836 A.1 General fisheries management programs including
enhancement. http://www.fao.org/fi/fcp/fr/CMR/profile.htm Fisheries management programs and services. (2,855) A.2 Oceanographic, ecological and socio-economic research
activities. http://www.fao.org/fi/fcp/fr/CMR/profile.htm Fishery research and development. (2,176) B.1 Microfinance towards local fishery investments http://www.fao.org/fi/fcp/fr/CMR/profile.htm Boat construction renewal and modernization programs. (6,805) FAO web links last accessed 19/06/06.

96 Catching More Bait: a bottom-up re-estimation of global fisheries subsidies, Sumaila and Pauly (eds.)
Subsidy program description Amounts
(US$000) Source(s) of information Group II: Cape Verde 10,574 A.1 The government of the Netherlands financed a marine
resource conservation project. http://www.fao.org/fi/fcp/fr/CPV/profile.htm A.1 LUXDEV surveillance project 188 http://www.fao.org/fi/projects/722lux.asp A.2 European development funds towards research in
computer system information and fisheries analysis. 1,083 http://www.fao.org/fi/fcp/fr/CPV/profile.htm B.1 The Cape Verde fishery is a beneficiary of lot of
assistance from bilateral co operations and multilaterals. Within 1997 to 2001, 87% of the investment is towards vessels, of which half of the funds is provided through overseas development agencies. http://www.fao.org/fi/fcp/fr/CPV/profile.htm
B.1 The fishery sector benefits from grants and aid from international development assistance. 2,258 http://www.fao.org/fi/fcp/fr/CPV/body.htm
B.1 The African Development Bank financed a development project (BAD/BADEA) towards industrial boat construction (of about 10 in number) with lengths up to 26 meters. 954 http://www.fao.org/fi/fcp/fr/CPV/profile.htm
B.2 Fisheries development projects including: FAO, DFID ICEIDA, EU, and GTZ particularly at the islands of de Fogo and Brava. 2,609 http://www.fao.org/fi/fcp/fr/CPV/body.htm
B.4 The African Development Bank financed 5 cold storage facilities the Islands of Santiago, S.Nicolau and S. Antao and office infrastructure at the INDP office at Mindelo. http://www.fao.org/fi/fcp/fr/CPV/profile.htm
Marketing support, processing and storage infrastructure programs. (3,482)
FAO web links last accessed 29/06/06. Group II: Columbia 48,005 A.1& A.2 State funded management and research programs. http://www.fao.org/fi/fcp/en/COL/profile.htm Fisheries management programs and services. (5,228) Fishery research and development. (3,984) B.4 Processing and marketing support programs http://www.fao.org/fi/fcp/en/COL/profile.htm Marketing support, processing and storage infrastructure
programs. (33,606) C.3 UN funded rural fisher community development
programs towards food security. http://www.fao.org/fi/fcp/en/COL/profile.htm Rural fishers’ community development programs. (5,187) FAO web links last accessed 19/06/06. Group II: Comoros 740 A.1 EU funded monitoring and surveillance programs. 38 http://www.fao.org/fi/fcp/fr/COM/profile.htm A.2 Fishery research and development support programs. http://www.fao.org/fi/fcp/fr/COM/profile.htm Fishery research and development. (503) B.2 Technical assistance programs funded by the WB, FAO,
JICA, and AfDB. http://www.fao.org/fi/fcp/fr/COM/profile.htm B.2 Technical assistance from the EU. 59 http://www.fao.org/fi/fcp/fr/COM/profile.htm C.3 EU artisanal fishery funded programs http://www.fao.org/fi/fcp/fr/COM/profile.htm FAO web links last accessed 19/06/06. Group II: Congo 1,361 A.1 Fishery management support programs http://www.fao.org/fi/fcp/fr/COG/profile.htm Fisheries management programs and services. (215) A.2 R&D funded programs in socio-economics and maritime
fisheries. http://www.fao.org/fi/fcp/fr/COG/profile.htm Fishery research and development. (164) B.2 Externally ODA funded projects. http://www.fao.org/fi/fcp/fr/COG/profile.htm Fishery development projects and support services. (982) FAO web links last accessed 19/06/06. Group II: Congo Democratic Republic 0 Subsidies assumed to be absent. Information not available. Group II: Costa Rica 27,319 A.1 Fishery management support programs through
INCOPESCA. http://www.fao.org/fi/fcp/en/CRI/profile.htm Fisheries management programs and services. (1,722) A.2 Both domestic and international support (e.g. Taiwan
Project '04) programs towards R&D. http://www.fao.org/fi/fcp/en/CRI/profile.htm Fishery research and development. (1,312) B.2 Externally ODA funded projects. http://www.fao.org/fi/fcp/es/CRI/body.htm Fishery development projects and support services. (7,861) B.4 Processing and marketing support programs http://www.fao.org/fi/fcp/es/CRI/body.htm

Appendix 2: Global compendium of national fisheries subsidy programs 97
Subsidy program description Amounts
(US$000) Source(s) of information Marketing support, processing and storage infrastructure
programs. (11,068) B.5 Tax exemptions and rebates on fishing inputs including
fuel. La Nation newspaper, 12/03/06. Tax exemption programs. (4,480) C.3 Social development fund. 876 La Nation newspaper, 12/03/06. FAO web links last accessed 19/06/06. Group II: Cote d'Ivoire 201,432 A.1 Fisheries management support programs. http://www.fao.org/fi/fcp/fr/CIV/profile.htm
Fisheries management programs and services. (3,263) A.2 Fisheries research and development support programs
with both domestic and international funds. http://www.fao.org/fi/fcp/fr/CIV/profile.htm Fishery research and development. (2,487)
B.1 & B. 2 Fisheries development project support programs mostly funded by ODAs. http://www.fao.org/fi/fcp/fr/CIV/profile.htm Boat construction renewal and modernization programs. (7,778) Fishery development projects and support services. (14,896)
B.3 Fishing port construction with funds from JICA. http://www.fao.org/fi/fcp/fr/CIV/profile.htm Fishing port construction and renovation programs. (164,517)
B.5 Tax waivers for fishery inputs and outputs. http://www.fao.org/fi/fcp/fr/CIV/profile.htm Tax exemption programs. (8,491)
FAO web links last accessed 19/06/06. Group II: Croatia 0 Subsidies are assumed to be absent. Information not available. Group II: Cuba 15,204 A.1 Fishery management support programs both from
domestic and international sources (FAO and UNDP). http://www.fao.org/fi/fcp/es/CUB/profile.htm Fisheries management programs and services. (2,732)
B.2 Fishery research and development funded programs. http://www.fao.org/fi/fcp/es/CUB/profile.htm B.2 Technical assistance from bilateral cooperation since the
1960s. Until 1990, as the USSR disintegrated, more infrastructural support is provided by the FAO and the UNDP. http://www.fao.org/fi/fcp/es/CUB/profile.htm Fishery development projects and support services. (12,472)
FAO web links last accessed 29/03/06. Group II: Djibouti 147 A.1 Fisheries management support programs. http://www.fao.org/fi/fcp/en/DJI/profile.htm
Fisheries management programs and services. (17) B.4 AfDB funded export support programs. http://www.fao.org/fi/fcp/en/DJI/profile.htm Marketing support, processing and storage infrastructure
programs. (112) C.3 Program support funds from the Djibouti Agriculture
Integrated Fisheries Development Project. http://www.fao.org/fi/fcp/en/DJI/profile.htm Rural fishers' community development programs. (17)
FAO web links last accessed 19/06/06. Group II: Dominican Republic 8,762 A.1 Government support towards the National Directorate
for Fisheries for management purposes. 2,353 http://www.fao.org/fi/fcp/es/DOM/profile.htm A.1 Support programs towards CARICOM 29 http://www.fao.org/fi/fcp/es/DOM/profile.htm A.2 Fishery research and development funded programs. http://www.fao.org/fi/fcp/es/DOM/profile.htm Fishery research and development. (414) B.2 Externally funded fishery projects (JICA, Taiwan, FAO
etc). http://www.fao.org/fi/fcp/es/DOM/profile.htm Fishery development projects and support services. (2,478) B.4 Marketing support programs towards value addition and
standards. http://www.fao.org/fi/fcp/es/DOM/profile.htm Marketing support, processing and storage infrastructure
programs. (3,489) FAO web links last accessed 29/03/06. Group II: Dominica 1,045 A.1 Resource surveys and external cooperation and support
from the FAO. http://www.fao.org/fi/fcp/es/DOM/profile.htm Fisheries management programs and services. (60)
A.2 Fishery research and development funded programs. http://www.fao.org/fi/fcp/es/DOM/profile.htm Fishery research and development. (46)
B.2 JICA Project towards the financing of CARICOM initiatives and technical assistance for fisheries management. 493 http://www.fao.org/fi/fcp/es/DOM/profile.htm

98 Catching More Bait: a bottom-up re-estimation of global fisheries subsidies, Sumaila and Pauly (eds.)
Subsidy program description Amounts
(US$000) Source(s) of information B.3 JICA funded fishing port construction programs. http://www.fao.org/fi/fcp/es/DOM/profile.htm B.4 JICA funded storage repairs and marketing programs. http://www.fao.org/fi/fcp/es/DOM/profile.htm Marketing support, processing and storage infrastructure
programs. (386) C.3 Rural fisheries infrastructure development & micro
finance programs by IFAD & the government. http://www.fao.org/fi/fcp/es/DOM/profile.htm Rural fishers' community development programs. (60)
FAO web links last accessed 19/06/06. Group II: Ecuador 188,692 A.1 Provision of naval patrol vessels from Norway for
monitoring and control of marine resources. http://www.fao.org/fi/fcp/es/ECU/profile.htm A.1 & A.2 FAO continue to coordinate and implement
projects dealing with fisheries resource management. http://www.fao.org/fi/fcp/es/ECU/profile.htm Fisheries management programs and services. (29,584) Fishery research and development. (22,546) Fisheries enterprise project in the Galapagos. 1,500 Globefish databank, 13/04/06.
B.2 Provision of support programs towards fishing equipments and boats from Japan and previous aid from the EU towards the artisanal sector. http://www.fao.org/fi/fcp/es/ECU/profile.htm
B.2 Technical assistance for capacity building in the small scale fisheries and technical resources/facilities from Belgium. http://www.fao.org/fi/fcp/es/ECU/profile.htm
Fishery development projects and support services. (135,062) FAO web links last accessed 29/03/06. Group II: Egypt 39,954 A.1 Fisheries management programs funded both locally and
internationally (e.g. the PERSGA program). http://www.fao.org/fi/fcp/en/EGY/profile.htm Fisheries management programs and services. (6,314) A.2 Maritime and fisheries funded research programs http://www.fao.org/fi/fcp/en/EGY/profile.htm Fishery research and development. (4,812) B.3 JICA funded programs in fishing harbor modernization. http://www.fao.org/fi/fcp/en/EGY/profile.htm Fishing port construction and renovation programs. (28,828) FAO web links last accessed 20/06/06. Group II: El Salvador 2,141 A.1 Fisheries management support programs. http://www.fao.org/fi/fcp/es/SLV/profile.htm Fisheries management programs and services. (338) A.2 Central America regional fishery resource evaluations
(with biological and socio-economic recommendations) under the PREPAC/OSPESCA project (2001-2005). http://www.fao.org/fi/fcp/es/SLV/profile.htm
Fishery research and development. (258) B.2 Technical assistance provided by FAO, JICA, Chinese
and other overseas development agencies towards fisheries development. http://www.fao.org/fi/fcp/es/SLV/profile.htm
Fishery development projects and support services. (1,545) FAO web links last accessed 28/03/06. Group II: Equatorial Guinea 839 A.1 Fisheries management and conservation support
programs. http://www.fao.org/fi/fcp/es/GNQ/body.htm Fisheries management programs and services. (128) B.2 International cooperation and support programs
including FAO, UNDP, CUBA, etc. http://www.fao.org/fi/fcp/es/GNQ/profile.htm Fishery development projects and support services. (584) C.3 Rural small scale fishery development support programs
(including Arab Bank support programs). http://www.fao.org/fi/fcp/es/GNQ/body.htm Rural fishers' community development programs. (127) FAO web links last accessed 20/06/06. Group II: Eritrea 9,916 A.1 UNDP funded project for coastal and marine biodiversity
conservation of total budget US$ 6.1 million. 1,165 http://www.fao.org/fi/fcp/en/ERI/profile.htm A.1 Government support programs in fishery management. http://www.fao.org/fi/fcp/en/ERI/profile.htm A.1 French government funded stock assessment program. 439 http://www.fao.org/fi/fcp/en/ERI/profile.htm B.3 Support programs from ODAs and the AfDB in fishing
harbor infrastructures. 3,630 http://www.fao.org/fi/fcp/en/ERI/profile.htm B.4 Government support programs in processing, marketing
and HACCP standards. http://www.fao.org/fi/fcp/en/ERI/profile.htm Marketing support, processing and storage
infrastructure programs. (4,057) C.3 Government support programs in rural credit and
artisanal fishery development. http://www.fao.org/fi/fcp/en/ERI/profile.htm

Appendix 2: Global compendium of national fisheries subsidy programs 99
Subsidy program description Amounts
(US$000) Source(s) of information Rural fishers' community development programs. (625) FAO web links last accessed 20/06/06. Group II: Fiji 9,173 A.1 & B.1 Fisheries management, development and
conservation support programs. http://www.fao.org/fi/fcp/en/FJI/profile.htm A.1 Monitoring and surveillance programs. http://www.fao.org/fi/fcp/en/FJI/profile.htm Fisheries management programs and services. (1,399) Fisheries development support projects from FAO, ODAs
and NGOs. (6,386) C.3 Government support programs in rural artisanal fisher
development programs. http://www.fao.org/fi/fcp/en/FJI/profile.htm Rural fishers' community development programs. (1,388) FAO web links last accessed 21/06/06. Group II: Gabon 752,634 A.1 ADB fishery management and development project. 2,247 http://www.fao.org/fi/fcp/fr/GAB/profile.htm A.1 JICA project high speed naval boat for coastal patrol and
surveillance. 28 http://www.fao.org/fi/fcp/fr/GAB/profile.htm A.2 Marine fisheries research programs http://www.fao.org/fi/fcp/fr/GAB/profile.htm Fishery research and development. (1,392) B.1 JICA Project towards fishing inputs and equipments. 105 http://www.fao.org/fi/fcp/en/FJI/profile.htm B.2 Fisheries development projects from ODAs. http://www.fao.org/fi/fcp/fr/GAB/profile.htm Fishery development projects and support services. (8,341) B.3 JICA fisheries harbor project per year, a non refundable
amount of 4732 billion CFA 728,646 http://www.fao.org/fi/fcp/en/FJI/profile.htm IDAF Project (GCP/RAF/198/DEN) funded by DANIDA
and implemented by FAO. Subsequently continued by DFID as the SFLP project (GCP/INT/735/UK). (11,743)
C.3 Japanese project funds for rural artisanal fishery development. 132 http://www.fao.org/fi/fcp/en/FJI/profile.htm
FAO web links last accessed 29/03/06. Group II: Gambia 20,369 A.1 LUXDEV surveillance project funds, pro rated by LV. 52 http://www.fao.org/fi/projects/722lux.asp A.2 Fisheries research programs. http://www.fao.org/fi/fcp/en/GMB/profile.htm Fishery research and development. (1,009) B.2 Project funded by various ODAs and the EU. http://www.fao.org/fi/fcp/en/GMB/profile.htm Fishery development projects and support services. (6,043) B.3 ADB funded fishery port construction and development. http://www.fao.org/fi/fcp/en/GMB/profile.htm B.4 DFID project on post harvest spoilage, and other govt.
support programs in the provision of ice and oven infrastructure http://www.fao.org/fi/fcp/en/GMB/profile.htm
Marketing support, processing and storage infrastructure programs. (8,508)
B.5 Duty waiver on fishery inputs and exports http://www.fao.org/fi/fcp/en/GMB/profile.htm Tax exemption programs. (3,444) C.3 Support for cooperative credits and rural artisanal
fishery development. http://www.fao.org/fi/fcp/en/GMB/profile.htm Rural fishers' community development programs. (1,313) FAO web links last accessed 21/06/06. Group II: Georgia 644 A.1 World Bank GEF Project on fisheries and ICZM. http://www.fao.org/fi/fcp/en/GEO/profile.htm Fisheries management programs and services. (88) A.2 Fisheries research programs. http://www.fao.org/fi/fcp/en/GEO/profile.htm Fishery research and development. (67) B.1 EU Project for fishery resource development. (402) Fishery development projects and support services. http://www.fao.org/fi/fcp/en/GEO/profile.htm C.3 FAO TCP Project TCP/GEO/2904 (A). Support for
fishery sector rehabilitation. http://www.fao.org/fi/fcp/en/GEO/profile.htm Rural fishers' community development programs. (87) FAO web links last accessed 31/07/06. Group II: Ghana 188,294 A.1 Resource surveys by the Marine Fisheries Research
Division with support from the FAO and ICCAT. http://www.fao.org/fi/fcp/en/GHA/body.htm A.1 Fridtjof Nansen resource surveys. http://www.fao.org/fi/fcp/en/GHA/body.htm A.1 FAO assistance in the implementation of the Code of
Conduct for Responsible Fishing. http://www.fao.org/fi/fcp/en/GHA/body.htm Fisheries management programs and services. (18,128) A.2 DFID funded fisheries research with the National
Resources Institute . http://www.fao.org/fi/fcp/en/GHA/body.htm Fishery research and development. (13,815)

100 Catching More Bait: a bottom-up re-estimation of global fisheries subsidies, Sumaila and Pauly (eds.)
Subsidy program description Amounts
(US$000) Source(s) of information B.1 Support to the fishery sector through fishing input with a
total grant of US$ $ 5 million from China. Fishing vessel restructuring program partly funded by DANIDA and the Ghanaian government. Dutch grant of 500,000 Euros towards fiberglass boats. 5,662 http://www.fao.org/fi/fcp/en/GHA/body.htm
B.1 Special government development funding for fishing input acquisition. 151 http://www.fao.org/fi/fcp/en/GHA/body.htm
B.2 Development projects funded by various ODAs. http://www.fao.org/fi/fcp/en/GHA/profile.htm B.2 World Bank fisheries sector's capacity and institutional
projects. http://www.fao.org/fi/fcp/en/GHA/body.htm Fishery development projects and support services. (82,760) B.3 Infrastructure development subsidies towards the Albert
Bosomtwe Sam Fishing Harbor Complex funded by Japan. 2,600 http://www.fao.org/fi/fcp/en/GHA/body.htm
B.4 UNDP pilot project sponsorship towards smoke fish exporting strategy 20 http://www.fao.org/fi/fcp/en/GHA/body.htm
B.4 EU funded initiatives with the fish export sector with storage facilities etc (not included in analysis). Business news, Ghana web April 4th 2006.
B.5 Ghanaian government tax breaks about 40% towards fishing inputs http://www.fao.org/fi/fcp/en/GHA/body.htm
B.5 Subsidies premix fuel to fishers (not included in analysis). http://www.fao.org/fi/fcp/en/GHA/body.htm
Tax exemption programs. (47,173) C.3 Support for rural artisanal fishery development. http://www.fao.org/fi/fcp/en/GHA/body.htm Rural fishers' community development programs. (17,985) FAO web links last accessed 02/04/06. Group II: Grenada 5,364 A.1 Fisheries management and conservation support
programs. http://www.fao.org/fi/fcp/en/GRD/profile.htm Fisheries management programs and services. (85)
A.2 CARICOM fisheries research support programs. http://www.fao.org/fi/fcp/en/GRD/profile.htm Fishery research and development. (65)
B.1 Technical assistance programs and projects such as those from the FAO. http://www.fao.org/fi/fcp/en/GRD/profile.htm Fishery development projects and support services. (388)
B.3 JICA fishery jetty construction programs. http://www.fao.org/fi/fcp/en/GRD/profile.htm Fishing port construction and renovation programs. (4,280)
B.4 JICA funded fishery processing and preservation infrastructure. http://www.fao.org/fi/fcp/en/GRD/profile.htm
Marketing support, processing and storage infrastructure programs. (546)
FAO web links last accessed 21/06/06. Group II: Guatemala 14,246 A.1 Fisheries management and conservation support
programs. http://www.fao.org/fi/fcp/en/GTM/profile.htm Fisheries management programs and services. (1,217)
B.1 Technical assistance programs and projects such as those from the FAO. http://www.fao.org/fi/fcp/en/GTM/profile.htm Fishery development projects and support services. (7,290)
B.5 Tax breaks for fishery inputs. http://www.fao.org/fi/fcp/en/GTM/profile.htm Tax exemption programs. (4,155)
C.3 Technical assistance to artisanal fishery development http://www.fao.org/fi/fcp/en/GTM/profile.htm Rural fishers' community development programs. (1,584)
FAO web links last accessed 21/06/06. Group II: Guinea 21,542 A.1 LUXDEV surveillance project funds, pro rated by LV. 170 http://www.fao.org/fi/projects/722lux.asp A.1 Training in maritime surveillance, funded by DFID &
FAO. 16 N’dia, 2004. A.2 Fisheries research programs. http://www.fao.org/fi/fcp/fr/GIN/profile.htm
Fishery research and development. (3,338) B.2 Fisheries Community development project funded by
World Bank. 202 N’dia, 2004. B.3 Wharf and jetty construction funded by JICA and from
Cooperation Canadien. 1,721 N’dia, 2004. B.4 Support programs for post harvest spoilage from ADB
and JICA. 4,330 N’dia, 2004. B.5 Vessel motorization rebates (both vessels and outboard
engines). N’dia, 2004. Tax exemption programs. (11,399)

Appendix 2: Global compendium of national fisheries subsidy programs 101
Subsidy program description Amounts
(US$000) Source(s) of information C.3 Rural credit facilities to processors provided by FAO. 366 N’dia, 2004. FAO web links last accessed 21/06/06. Group II: Guinea Bissau 645 A.1 LUXDEV surveillance project funds, pro rated by LV. 1 http://www.fao.org/fi/projects/722lux.asp A.1 Fisheries management and conservation support
programs. http://www.fao.org/fi/fcp/en/GNB/profile.htm Fisheries management programs and services. (234) A.2 Fisheries research programs. http://www.fao.org/fi/fcp/en/GNB/profile.htm Fishery research and development. (178) C.3 Technical assistance towards rural artisanal fishing
sector. http://www.fao.org/fi/fcp/en/GNB/profile.htm Rural fishers' community development programs. (232) FAO web links last accessed 21/06/06. Group II: Guyana 17,618 A.1 Fisheries management and conservation support
programs. http://www.fao.org/fi/fcp/en/GUY/profile.htm Fisheries management programs and services. (2,407) A.2 Collaboration and support from CARICOM on fishery
research. http://www.fao.org/fi/fcp/en/GUY/profile.htm A.2 Fisheries research programs. http://www.fao.org/fi/fcp/en/GUY/profile.htm Fishery research and development. (1,834) B.1 Fishery development projects mostly funded by ODA and
the multilaterals (FAO and UNDP). http://www.fao.org/fi/fcp/en/GUY/profile.htm Fishery development projects and support services. (10,989) C.3 Technical assistance from overseas development
agencies to rural fisheries. http://www.fao.org/fi/fcp/en/GUY/profile.htm Rural fishers' community development programs. (2,388) FAO web links last accessed 20/06/06. Group II: Haiti 681 A.1 Fisheries management and conservation support
programs. http://www.fao.org/fi/fcp/fr/HTI/profile.htm A.1 The provision of technical resources under marine
environment management by UNDP. http://www.fao.org/fi/fcp/fr/HTI/profile.htm Fisheries management programs and services. (225) A.2 Fisheries research programs. http://www.fao.org/fi/fcp/fr/HTI/profile.htm Fishery research and development. (172) B.1 Capacity building programs from Japan, Taiwan and
USA/Canada LASPAU Program http://www.fao.org/fi/fcp/fr/HTI/profile.htm B.1 Sum of project contributions towards CARICOM
mandates, EU fishery project at both Grande Anse and Chardonnieres. 284 http://www.fao.org/fi/fcp/fr/HTI/profile.htm
FAO web links last accessed 02/04/06. Group II: India 2,233,648 A.1 World Bank support project of for fishery management,
research and conservation programs. 160,000 http://www.fao.org/fi/fcp/en/IND/profile.htm A.1 Grants for safety equipments and disaster preparedness. Salagrama, 2004. A.1 Support programs towards marine reserves and artisanal
reefs. Salagrama, 2004. A.1 Fishery management programs including regulations and
scientific advice. Salagrama, 2004. A.2 Fisheries research programs. http://www.fao.org/fi/fcp/en/IND/profile.htm
Fishery research and development. (28,246) B.1 State investment in fisheries enterprises-Fisheries
Development Cooperation. Salagrama, 2004. B.1 Grants for buying or modernizing boats and fishing
equipments. Salagrama, 2004. B.1 Subsidized lending support for trawler development
funds. Salagrama, 2004. B.1 Subsidized loans from commercial and cooperative banks Salagrama, 2004.
Boat construction renewal and modernization programs. (88,355) B.2 Support programs toward fisheries development funds. 27,838 http://www.fao.org/fi/fcp/en/IND/profile.htm B.3 Support for fishing harbors and processing
infrastructure http://www.fao.org/fi/fcp/en/IND/profile.htm B.3 Interest subsidies for modernization of processing plants
to achieve conformity with international standards. Salagrama, 2004. Fishing port construction and renovation programs. (1,868,790)
B.4 subsidies for infrastructural development including roads, jetties, fuel stations, markets etc. Salagrama, 2004.
B.4 Export marketing supporting programs 23,350 Salagrama, 2004.

102 Catching More Bait: a bottom-up re-estimation of global fisheries subsidies, Sumaila and Pauly (eds.)
Subsidy program description Amounts
(US$000) Source(s) of information B.5 Income and sales tax exemption for seafood exporters
and fishery products and for cooperative societies. 298 Salagrama, 2004. B.5 Increase in fuel price from 1991-1996 led to massive fuel
subsidies (not included in analysis). Salagrama, 2004. C.3 Bay of Bengal artisanal fishery development project +
welfare programs for local fishers. http://www.fao.org/fi/fcp/en/IND/profile.htm Rural fishers' community development programs. (36,771)
FAO web links last accessed 21/06/06. Group II: Indonesia 343,169 A.1 WB, ADB & GEF program funds for fisheries
management and enhancement. 24,100 APEC, 2000. A.1 Stock assessment programs 46,500 APEC, 2000. A.1 Aid from Australia towards illegal fishing. 13,946 Globefish databank, 16/03/06. B.1 Development grants towards fisheries enterprise. 36,677 APEC, 2000. B.3 Infrastructure developments and other miscellaneous
support programs. 91,200 APEC, 2000. B.4 Investment in cooperatives for fish product promotion
and price support. 98,200 C.3 Integrated small scale fishery development. APEC, 2000. Rural fishers' community development programs. (32,546) Group II: Iran 212,397 A.1 Fisheries management and conservation support
programs. http://www.fao.org/fi/fcp/en/IRN/profile.htm Fisheries management programs and services. 13,166
A.2 Fisheries research programs. http://www.fao.org/fi/fcp/en/IRN/profile.htm Fishery research and development. 10,034
B.1 Development support programs towards fisheries enterprise. http://www.fao.org/fi/fcp/en/IRN/profile.htm Boat construction renewal and modernization programs. (31,388)
Technical assistance for fishery development from the JICA, FAO and UNDP. http://www.fao.org/fi/fcp/en/IRN/profile.htm Fishery development projects and support services. (60,111)
B.3 Support for fish processing and marketing programs. http://www.fao.org/fi/fcp/en/IRN/profile.htm Marketing support, processing and storage infrastructure
programs. (84,635) C.3 Support for rural artisanal fishery development. http://www.fao.org/fi/fcp/en/IRN/profile.htm
Rural fishers' community development programs. (13,063) FAO web links last accessed 20/06/06. Group II: Jamaica 2,827 A.1 Fisheries management and conservation support
programs. http://www.fao.org/fi/fcp/en/JAM/profile.htm Fisheries management programs and services. (262)
B.1 Development support programs towards fisheries enterprise. http://www.fao.org/fi/fcp/en/JAM/profile.htm Boat construction renewal and modernization programs. (624)
B.3 Technical assistance towards jetties, cold storage and marketing programs. http://www.fao.org/fi/fcp/en/JAM/profile.htm
Marketing support, processing and storage infrastructure programs. (1,681)
C.3 Assistance and support programs towards rural artisanal fishery development. http://www.fao.org/fi/fcp/en/JAM/profile.htm Rural fishers' community development programs. (260)
FAO web links last accessed 20/06/06. Group II: Jordan 28 A.1 Fishery management support programs. http://www.fao.org/fi/fcp/en/JOR/profile.htm
Fisheries management programs and services. (5) B.2 Technical assistance such as the USAID marine park. http://www.fao.org/fi/fcp/en/JOR/profile.htm
Fishery development projects and support services. (23) FAO web links last accessed 20/06/06. Group II: Kenya 9,851 A.1 Fisheries management and conservation support
programs. http://www.fao.org/fi/fcp/en/KEN/profile.htm Fisheries management programs and services. (238)
A.2 Fisheries research programs. http://www.fao.org/fi/fcp/en/KEN/profile.htm Fishery research and development. (182)
B.1 Development support programs towards fisheries enterprise. http://www.fao.org/fi/fcp/en/KEN/profile.htm Boat construction renewal and modernization programs. (568)

Appendix 2: Global compendium of national fisheries subsidy programs 103
Subsidy program description Amounts
(US$000) Source(s) of information B.2 Technical and financial assistance projects from ODA
and the UN agencies. 8,863 http://www.fao.org/fi/fcp/en/KEN/profile.htm FAO web links last accessed 21/06/06. Group II: Kiribati 12,350 A.1 Fisheries management and conservation support
programs. http://www.fao.org/fi/fcp/en/KIR/profile.htm Fisheries management programs and services. (1,171)
B.1 National aid to fishing parastatals (Le Matauri Ltd). http://www.fao.org/fi/fcp/en/KIR/profile.htm Boat construction renewal and modernization programs. (2,791)
B.2 International donor assistance programs towards fishery development. http://www.fao.org/fi/fcp/en/KIR/profile.htm
B.2 Oversea aid towards training in fisheries research programs. 863 http://www.fao.org/fi/fcp/en/KIR/profile.htm
B.4 Storage and processing support programs from state aid. http://www.fao.org/fi/fcp/en/KIR/profile.htm Marketing support, processing and storage infrastructure
programs. (7,525) FAO web links last accessed 27/06/06. Group II: Latvia 42,941 A.1 Fisheries management and conservation support
programs. http://www.fao.org/fi/fcp/en/LVA/profile.htm Fisheries management programs and services. (6,786)
A.2 Fisheries research programs. http://www.fao.org/fi/fcp/en/LVA/profile.htm Fishery research and development. (5,172)
B.2 EU pre-accession support programs http://www.fao.org/fi/fcp/en/LVA/profile.htm Fishery development projects and support services. (30,983)
FAO web links last accessed 27/06/06. Group II: Lebanon 0 Subsidies are assumed to be absent Information not available. Group II: Liberia 1,726 A.1 Fisheries management and conservation support
programs. http://www.fao.org/fi/fcp/en/LBR/profile.htm Fisheries management programs and services. (376)
B.5 Fishing input duty waivers. http://www.fao.org/fi/fcp/en/LBR/profile.htm Tax exemption programs. (977)
C.3 Technical assistance to rural artisanal fisheries from the FAO. http://www.fao.org/fi/fcp/en/LBR/profile.htm Rural fishers' community development programs. (373)
FAO web links last accessed 22/06/06. Group II: Libya 2,555 A.1 Fisheries management and conservation support
programs. http://www.fao.org/fi/fcp/en/LBY/profile.htm Fisheries management programs and services. (1,450)
A.2 COPEMED research surveys http://www.fao.org/fi/fcp/en/LBY/profile.htm Fishery research and development. (1,105)
FAO web links last accessed 21/06/06. Group II: Lithuania 6,798 A.1 Fisheries management and conservation support
programs. http://www.fao.org/fi/fcp/en/LTU/profile.htm Fisheries management programs and services. (3,858)
A.2 Fisheries research programs. http://www.fao.org/fi/fcp/en/LTU/profile.htm Fishery research and development. (2,940)
FAO web links last accessed 21/06/06. Group II: Madagascar 5,110 A.1 National government and international collaboration in
fishery management. 5,110 http://www.wcs.org/international/marine/marineafrica/madagascarmarine
Web link last accessed 21/11/05. Group II: Malaysia 457,657 A.1 Fisheries management and conservation support
programs. 467 APEC, 2000. A.1 MPA support programs 735 APEC, 2000. A.2 Fisheries research programs. 521 APEC, 2000. B.1 Subsidized lending to the fishery sector particular for
fleet support 11,720 APEC, 2000. B.2 Bilateral and ODA project support assistance. http://www.fao.org/fi/fcp/en/MYS/profile.htm
Fishery development projects and support services. (282,013) B.4 Subsidized lending towards marketing programs. 1,456 APEC, 2000. B.5 Tax waivers and investment incentives to the fishery
sector. Ahmed et al. 2002.

104 Catching More Bait: a bottom-up re-estimation of global fisheries subsidies, Sumaila and Pauly (eds.)
Subsidy program description Amounts
(US$000) Source(s) of information B.5 Tax rebates to the fishery sector. http://www.fao.org/fi/fcp/en/MYS/profile.htm
Tax exemption programs. (160,745) FAO web links last accessed 22/06/06. Group II: Maldives 40,584 A.1 Fisheries management and conservation support
programs. http://www.fao.org/fi/fcp/en/MDV/profile.htm Fisheries management programs and services. (6,629) A.2 Support programs in R&D (FAD) from national
government international donor agencies and Banks (ADB, IFAD, OPEC funds etc). 200 http://www.fao.org/fi/fcp/en/MDV/profile.htm
B.1 Development support projects from DFID and FAO. http://www.fao.org/fi/fcp/en/MDV/profile.htm Fishery development projects and support services. (30,262) B.3 Support programs in fishing port facilities from national
government, international donor agencies and Banks (ADB, IFAD, OPEC funds etc). 1,623 http://www.fao.org/fi/fcp/en/MDV/profile.htm
B.4 Support programs in processing and marketing from national government, international donor agencies and Banks (ADB, IFAD, OPEC funds etc). 1,870 http://www.fao.org/fi/fcp/en/MDV/profile.htm
FAO web links last accessed 22/06/06. Group II: Marshall Islands 28,513 A.1 Fisheries management and conservation support
programs. http://www.fao.org/fi/fcp/en/MHL/body.htm Fisheries management programs and services. (403) A.2 FAO marine resources management project with birds
and sharks in the longline fishery. http://www.fao.org/fi/fcp/en/MHL/body.htm Fishery research and development. (307) B.2 Fishery development projects such as the Arno Atoll
project funded by JICA; monitoring vessel support by the US government, NMFS grant of US$ 80,000 per year from 1992-1997; JICA overseas fisheries funds US$ 1.5 million 2,050 http://www.fao.org/fi/fcp/en/MHL/body.htm
B.2 ADB institutional support program (aid of US$ 2.4 million). US provision of patrol vessels amounting to US$ 370,000 through the Compact Free Association. NZ training and institutional support programs amounting to US$ 48,000. 2,818 http://www.fao.org/fi/fcp/en/MHL/body.htm
B.4 Government funded fishery loin infrastructures, and JICA aid for fisheries infrastructure funding. http://www.fao.org/fi/fcp/en/MHL/body.htm
Fishing port construction and renovation programs. (20,342) B.4 Support programs towards marketing programs. http://www.fao.org/fi/fcp/en/FSM/profile.htm Marketing support, processing and storage infrastructure
programs. (2,593) FAO web links last accessed 29/07/06. Group II: Mauritania 140,565 A.1 Japanese funds for two naval patrol and research boats:
the 'Amrigue' and the El Awam' http://www.fao.org/fi/fcp/fr/MRT/profile.htm A.1 German project towards maritime fishery surveillance
and enforcement. http://www.fao.org/fi/fcp/fr/MRT/profile.htm A.1 LUXDEV surveillance project funds, pro rated by LV. 260 http://www.fao.org/fi/projects/722lux.asp A.2 Project assistance towards R&D from ORSTROM and
Russia with the Centre for Research Marine Research Mauritania. http://www.fao.org/fi/fcp/fr/MRT/profile.htm Fishery research and development. (1,569)
B.1 The CEAO bank subsidized financing and support to the fishing sector. http://www.fao.org/fi/fcp/fr/MRT/profile.htm Boat construction renewal and modernization programs. (4,908)
B.2 DANIDA and JICA fishery development projects for the small scale sector. http://www.fao.org/fi/fcp/fr/MRT/profile.htm Fishery development projects and support services. (9,398)
B.3 French l'AFD Project (port infrastructure) at Nouakchott-du Port Autome de Nouadhibou. http://www.fao.org/fi/fcp/fr/MRT/profile.htm Fishing port construction and renovation programs. (103,798)
B.4 JICA projects with fish marketing infrastructure at Nouakchott, and other sites http://www.fao.org/fi/fcp/fr/MRT/profile.htm
Marketing support, processing and storage infrastructure programs. (13,233)
B.5 Tax exemptions and fuel subsidies. Milazzo, 1998. Tax exemption programs. (5,357)
C.3 Technical assistance to rural artisanal fisheries. http://www.fao.org/fi/fcp/fr/MRT/profile.htm

Appendix 2: Global compendium of national fisheries subsidy programs 105
Subsidy program description Amounts
(US$000) Source(s) of information Rural fishers' community development programs. (2,042)
FAO web links last accessed 02/04/06. Group II: Micronesia 190,037 A.1 Fisheries management and conservation support
programs. http://www.fao.org/fi/fcp/en/FSM/body.htm Fisheries management programs and services. (1,170)
A.2 Fisheries research programs. http://www.fao.org/fi/fcp/en/FSM/profile.htm Fishery research and development. (892)
B.1 Government fisheries enterprise programs 23,000 http://www.fao.org/fi/fcp/en/FSM/body.htm B.1 ADB US$ 6.5 million subsidized loan for fleet
development 650 http://www.fao.org/fi/fcp/en/FSM/profile.htm B.2 Development aid from Governments of Japan, Australia,
New Zealand, and through the Compact arrangements with the United States. In addition to multilateral aid packages. http://www.fao.org/fi/fcp/en/FSM/body.htm
B.2 Technical cooperation has included the provision of four technical experts and supporting grant-aid to the Fisheries and Maritime Institute in Yap. http://www.fao.org/fi/fcp/en/FSM/body.htm Fishery development projects and support services. (5,341)
B.3 Extension and renovation of fishing ports in Pohnpei and Chuuk. http://www.fao.org/fi/fcp/en/FSM/body.htm Fishing port construction and renovation programs. (58,984)
B.4 International fish marketing freight programs supported by government of Japan and FS of Micronesia. 100,000 http://www.fao.org/fi/fcp/en/FSM/body.htm
FAO web links last accessed 31/07/06. Group II: Mauritius 2,679 A.1 Fisheries management and conservation support
programs. http://www.fao.org/fi/fcp/en/MUS/profile.htm Fisheries management programs and services. (481) B.2 Aid towards the fishing sector from ODAs. http://www.fao.org/fi/fcp/en/MUS/profile.htm Fishery development projects and support services. (2,198) FAO web links last accessed 22/06/06. Group II: Morocco 266,245 A.1 Fisheries management and conservation support
programs. http://www.fao.org/fi/fcp/fr/MAR/profile.htm Fisheries management programs and services. (16,505) A.2 Fisheries research programs. http://www.fao.org/fi/fcp/fr/MAR/profile.htm Fishery research and development. (12,578) B.1 Government fisheries enterprise programs, with support
from FAO. http://www.fao.org/fi/fcp/fr/MAR/profile.htm Boat construction renewal and modernization programs. (39,345) B.2 World bank fishery projects and support from other
ODAs or bilateral assistance. http://www.fao.org/fi/fcp/fr/MAR/profile.htm Fishery development projects and support services. (75,351) B.4 Value adding and export support programs from the
World Bank. http://www.fao.org/fi/fcp/fr/MAR/profile.htm Marketing support, processing and storage infrastructure
programs. (106,092) C.3 National support programs towards rural fisheries
development. http://www.fao.org/fi/fcp/fr/MAR/profile.htm Rural fishers' community development programs. (16,374) FAO web links last accessed 21/06/06. Group II: Mozambique 12,672 A.1 Fisheries management and conservation support
programs. http://www.fao.org/fi/fcp/en/MOZ/profile.htm Fisheries management programs and services. (1,297) B.2 Bilateral (JICA, ICEIDA, DANIDA etc) and multilateral
assistance (EU, IFAD etc) programs to the fishery sector. 10,088 http://www.fao.org/fi/fcp/en/MOZ/profile.htm B.3 Support program for fishing harbor renovation. http://www.fao.org/fi/fcp/en/MOZ/profile.htm C.3 Artisanal rural fishery development support programs. http://www.fao.org/fi/fcp/en/MOZ/profile.htm C.3 Artisanal fishery development project funded by AfDB 1,287 http://www.onefish.org/global/index.jsp Web links last accessed 27/06/06. Group II: Myanmar 709,770 A.1 National fishery management programs with technical
support from FAO and other ODAs. http://www.fao.org/fi/fcp/en/MMR/profile.htm Fisheries management programs and services. (43,999)
A.2 Fisheries research programs. http://www.fao.org/fi/fcp/en/MMR/profile.htm Fishery research and development. (33,532)
B.1 Government fisheries enterprise programs. http://www.fao.org/fi/fcp/en/MMR/profile.htm

106 Catching More Bait: a bottom-up re-estimation of global fisheries subsidies, Sumaila and Pauly (eds.)
Subsidy program description Amounts
(US$000) Source(s) of information Boat construction renewal and modernization programs. (104,888)
B.2 Technical assistance from ODAs and aid packages towards fishery development. http://www.fao.org/fi/fcp/en/MMR/profile.htm Fishery development projects and support services. (200,873)
B.4 FAO funded quality control and marketing programs. http://www.fao.org/fi/fcp/en/MMR/profile.htm Marketing support, processing and storage infrastructure
programs. (282,826) C.3 Artisanal rural fishery development support programs. http://www.fao.org/fi/fcp/en/MMR/profile.htm
Rural fishers' community development programs. (43,652) FAO web links last accessed 21/06/06. Group II: Namibia 62,248 A.1 Fisheries management and conservation support
programs. http://www.fao.org/fi/fcp/en/NAM/profile.htm Fisheries management programs and services. (4,880)
A.2 Fisheries research programs. http://www.fao.org/fi/fcp/en/NAM/profile.htm Fishery research and development. (3,719)
B.2 ODA and multilateral technical assistance programs in fisheries development. http://www.fao.org/fi/fcp/en/NAM/profile.htm Fishery development projects and support services. (22,280)
B.4 Government support programs in quality control and marketing. http://www.fao.org/fi/fcp/en/NAM/profile.htm
Marketing support, processing and storage infrastructure programs. (31,369)
FAO web links last accessed 19/06/06. Group II: Nauru 331 A.1 Fisheries management and conservation support
programs. http://www.fao.org/fi/fcp/en/NRU/body.htm Fisheries management programs and services. (5)
A.2 Fisheries research programs. http://www.fao.org/fi/fcp/en/NRU/profile.htm Fishery research and development. (4)
B.1 Government investment in fishery enterprises. http://www.fao.org/fi/fcp/en/NRU/body.htm Boat construction renewal and modernization programs. (12)
B.2 Japanese projects funded through the Japan Overseas Fish Cooperation Foundation. http://www.fao.org/fi/fcp/en/NRU/body.htm Fishery development projects and support services. (23)
B.3 Support program for fishing harbor renovation. http://www.fao.org/fi/fcp/en/NRU/body.htm Fishing port construction and renovation programs. (255)
B.4 Support programs fish marketing programs. http://www.fao.org/fi/fcp/en/NRU/body.htm Marketing support, processing and storage infrastructure
programs. (32) FAO web links last accessed 31/07/06. Group II: Nicaragua 7,782 A.1 Financial assistance through bilateral overseas
development agencies and multilateral organizations for marine conservation (including MPAs). 708 http://www.fao.org/fi/fcp/es/NIC/profile.htm
A.1 Technical assistance for monitoring, control and surveillance provided by DANIDA. 200 http://www.fao.org/fi/fcp/es/NIC/profile.htm
A.2 Financial assistance through bilateral overseas development agencies and multilateral organizations for fisheries research and development, including pilot projects. 1,559 http://www.fao.org/fi/fcp/es/NIC/profile.htm
B.4 Infrastructure support through bilateral overseas development agencies including Japanese JICA and Spanish FAD. 2,674 http://www.fao.org/fi/fcp/es/NIC/profile.htm
B.5 Tax waivers and duty free import of fishery inputs and equipments including exemption from value added tax, fuel and diesel tax. Exemption from export tax on fishery products of about 1.5%. http://www.fao.org/fi/fcp/es/NIC/body.htm Tax exemption programs. (2,642)
FAO web links last accessed 23/03/06. Group II: Nigeria 13,659 A.1 ADB subsidized loan for fisheries management program. 120 http://www.fao.org/fi/fcp/en/NGA/profile.htm A.1 Subsidized lending for monitoring, control and
surveillance programs from the World Bank. http://www.fao.org/fi/fcp/en/NGA/profile.htm A.2 Fisheries research programs. http://www.fao.org/fi/fcp/en/NGA/profile.htm
Fishery research and development. (11,739) B.2 UN coordinated fishery development projects. http://www.fao.org/fi/fcp/en/NGA/profile.htm B.4 Federal support towards quality control and assurance
for fishery products. 600 http://www.fao.org/fi/fcp/en/NGA/body.htm

Appendix 2: Global compendium of national fisheries subsidy programs 107
Subsidy program description Amounts
(US$000) Source(s) of information C.3 IFAD and ECOWAS support programs for rural artisanal
fishery development. 1,200 http://www.fao.org/fi/fcp/en/NGA/profile.htm FAO web links last accessed 22/06/06. Group II: Oman 100,444 A.1 Fisheries management and conservation support
programs. http://www.fao.org/fi/fcp/en/OMN/profile.htm Fisheries management programs and services. (6,028)
The national Fisheries Research Funds for projects in fisheries research. 7,802 http://www.fao.org/fi/fcp/en/OMN/profile.htm
B.1 Government support in fishery enterprises. http://www.fao.org/fi/fcp/en/OMN/profile.htm Boat construction renewal and modernization programs. (14,369)
B.3 Support program for fishing harbor renovation. http://www.fao.org/fi/fcp/en/OMN/profile.htm Fishing port construction and renovation programs. (27,519)
B.4 Support programs fish marketing programs. http://www.fao.org/fi/fcp/en/OMN/profile.htm Marketing support, processing and storage infrastructure
programs. (38,746) C.3 Artisanal rural fishery development support programs. http://www.fao.org/fi/fcp/en/OMN/profile.htm
Rural fishers' community development programs. (5,980) FAO web links last accessed 24/06/06. Group II: Pakistan 212,605 A.1 Fisheries management and conservation support
programs. http://www.fao.org/fi/fcp/en/PAK/profile.htm Fisheries management programs and services. (21,904) A.2 Fisheries research programs. http://www.fao.org/fi/fcp/en/PAK/profile.htm Fishery research and development. (16,693) B.1 Government support in fishery enterprises. http://www.fao.org/fi/fcp/en/PAK/profile.htm Boat construction renewal and modernization programs. (52,217) B.2 ODA and multilateral technical assistance programs in
fisheries development. http://www.fao.org/fi/fcp/en/PAK/profile.htm Fishery development projects and support services. (100,001) B.4 Support programs fish marketing programs. 59 http://www.fao.org/fi/fcp/en/PAK/profile.htm C.3 Artisanal rural fishery development support programs. http://www.fao.org/fi/fcp/en/PAK/profile.htm Rural fishers' community development programs. (21,731) FAO web links last accessed 25/06/06. Group II: Palau 658 A.1 Fisheries management and conservation support
programs. http://www.fao.org/fi/fcp/en/PLW/profile.htm Fisheries management programs and services. (55) B.2 Bilateral and multilateral assistance to the fishing sector. http://www.fao.org/fi/fcp/en/PLW/profile.htm Fishery development projects and support services. (250) B.3 State aid towards fishing wharves construction and
renovation. http://www.fao.org/fi/fcp/en/PLW/profile.htm B.4 State aid towards processing and storage facilities. http://www.fao.org/fi/fcp/en/PLW/profile.htm Marketing support, processing and storage infrastructure
programs. (353) FAO web links last accessed 27/06/06. Group II: Panama 170,965 A.1 Fisheries management and conservation support
programs. http://www.fao.org/fi/fcp/en/PAN/profile.htm Fisheries management programs and services. (10,968) B.2 ODA fishery development projects http://www.fao.org/fi/fcp/en/PAN/profile.htm Fishery development projects and support services. (50,073) B.4 Fishery products export support programs. http://www.fao.org/fi/fcp/es/PAN/body.htm Marketing support, processing and storage infrastructure
programs. (70,502) B.5 Tax rebates to the fishery sector. http://www.fao.org/fi/fcp/es/PAN/body.htm Tax exemption programs. (28,541) C.3 JICA rural fisher community development projects. http://www.fao.org/fi/fcp/en/PAN/profile.htm Rural fishers' community development programs. (10,881) FAO web links last accessed 25/06/06. Group II: Papua New Guinea 77,903 A.1 Fisheries management and conservation support
programs. http://www.fao.org/fi/fcp/en/PNG/profile.htm Fisheries management programs and services. (4,158) A.2 Fisheries research programs. http://www.fao.org/fi/fcp/en/PNG/profile.htm Fishery research and development. (3,169) B.1 Government support in fishery enterprises. http://www.fao.org/fi/fcp/en/PNG/profile.htm Boat construction renewal and modernization programs. (9,913)

108 Catching More Bait: a bottom-up re-estimation of global fisheries subsidies, Sumaila and Pauly (eds.)
Subsidy program description Amounts
(US$000) Source(s) of information B.2 ODA fishery development programs and donor
assistance from IFAD, UN agencies, EU and WB. http://www.fao.org/fi/fcp/en/PNG/profile.htm Fishery development projects and support services. (18,985) B.3 INFOFISH support programs in fish product assurance. http://www.fao.org/fi/fcp/en/PNG/profile.htm B.4 Marketing support, processing and storage
infrastructure programs. (26,731) B.5 Duty free imports of fishery inputs/ infrastructure items. http://www.fao.org/fi/fcp/en/PNG/body.htm Tax exemption programs. (10,821) C.3 GEF-UNDP project on community based fishery
management. http://www.fao.org/fi/fcp/en/PNG/profile.htm Rural fishers' community development programs. (4,126) FAO web links last accessed 25/06/06. Group II: Peru 1,084,293 A.1 Fisheries management and conservation support
programs. http://www.fao.org/fi/fcp/en/PER/profile.htm Fisheries management programs and services. (531,893) A.2 Fisheries research programs, and the provision of a
research vessel. 14,000 http://www.fao.org/fi/fcp/en/PER/profile.htm A.2 Fisheries research programs, and the provision of a
research cruises. APEC, 2000. B.1 Fishery development programs towards modernizing
small scale fishery enterprises. http://www.fao.org/fi/fcp/en/PER/profile.htm B.1 Fleet renewal and modernization programs. APEC, 2000. B.1 Subsidized lending support programs to the fishery
sector, from FONDEPES. 1,188 APEC, 2000. B.2 Development grants for fisheries enterprises. 1,364 APEC, 2000. B.3 National fund for fisheries port development and
renovation programs 6,000 APEC, 2000. B.4 Development grant for fish processing infrastructures. 2,150 APEC, 2000. C.3 Rural artisanal fisher community development
programs. APEC, 2000. http://www.fao.org/fi/fcp/en/PER/profile.htm
Rural fishers' community development programs. (527,698) FAO web links last accessed 25/06/06. Group II: Philippines 405,996 A.1 Fisheries management and conservation support
programs. http://www.fao.org/fi/fcp/en/PHL/profile.htm Fisheries management programs and services. (32,815)
A.2 Fisheries research programs. http://www.fao.org/fi/fcp/en/PHL/profile.htm Fishery research and development. (25,009)
B.1 Subsidized state loan and credit programs towards the fishing sector for mostly equipments. Ahmed et al. 2002. Boat construction renewal and modernization programs. (78,228)
B.2 Grants and loans towards fishery development from ODA support and other foreign donor contributions. http://www.fao.org/fi/fcp/en/PHL/profile.htm Fishery development projects and support services. (149,815)
B.4 Infrastructure support programs towards ports, markets and price support promotions. 2,180 APEC, 2000.
B.5 Tax exemptions towards fishing activities and enterprise development. Tax exemption programs. (85,393)
C.3 Small scale fisher integrated development support programs. Ahmed et al. 2002. Rural fishers' community development programs. (32,556)
FAO web links last accessed 25/06/06. Group II: Romania 1,103 A.1 Fisheries management and conservation support
programs. http://www.fao.org/fi/fcp/en/ROM/profile.htm Fisheries management programs and services. (124)
A.2 Fisheries research programs. http://www.fao.org/fi/fcp/en/ROM/profile.htm Fishery research and development. (94)
B.2 EU Phare funds for fisheries development. http://www.fao.org/fi/fcp/en/ROM/profile.htm Fishery development projects and support services. (564)
Tax (VAT) exemptions for fishing fleets within the Baltic sea. http://www.fao.org/fi/fcp/en/ROM/body.htm Tax exemption programs. (321)
FAO web links last accessed 25/06/06. Group II: St. Kitts and Nevis 191 A.1 Fisheries management and conservation support
programs. http://www.fao.org/fi/fcp/en/KNA/profile.htm
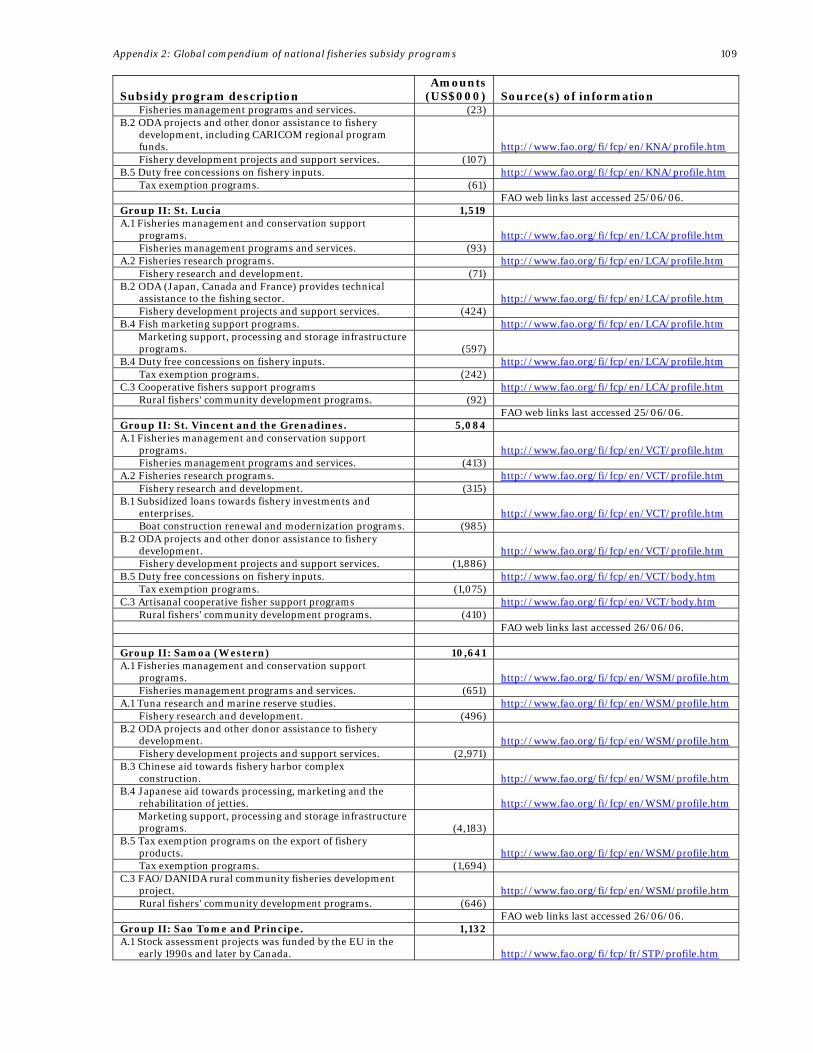
Appendix 2: Global compendium of national fisheries subsidy programs 109
Subsidy program description Amounts
(US$000) Source(s) of information Fisheries management programs and services. (23)
B.2 ODA projects and other donor assistance to fishery development, including CARICOM regional program funds. http://www.fao.org/fi/fcp/en/KNA/profile.htm Fishery development projects and support services. (107)
B.5 Duty free concessions on fishery inputs. http://www.fao.org/fi/fcp/en/KNA/profile.htm Tax exemption programs. (61)
FAO web links last accessed 25/06/06. Group II: St. Lucia 1,519 A.1 Fisheries management and conservation support
programs. http://www.fao.org/fi/fcp/en/LCA/profile.htm Fisheries management programs and services. (93)
A.2 Fisheries research programs. http://www.fao.org/fi/fcp/en/LCA/profile.htm Fishery research and development. (71)
B.2 ODA (Japan, Canada and France) provides technical assistance to the fishing sector. http://www.fao.org/fi/fcp/en/LCA/profile.htm Fishery development projects and support services. (424)
B.4 Fish marketing support programs. http://www.fao.org/fi/fcp/en/LCA/profile.htm Marketing support, processing and storage infrastructure
programs. (597) B.4 Duty free concessions on fishery inputs. http://www.fao.org/fi/fcp/en/LCA/profile.htm
Tax exemption programs. (242) C.3 Cooperative fishers support programs http://www.fao.org/fi/fcp/en/LCA/profile.htm
Rural fishers' community development programs. (92) FAO web links last accessed 25/06/06. Group II: St. Vincent and the Grenadines. 5,084 A.1 Fisheries management and conservation support
programs. http://www.fao.org/fi/fcp/en/VCT/profile.htm Fisheries management programs and services. (413)
A.2 Fisheries research programs. http://www.fao.org/fi/fcp/en/VCT/profile.htm Fishery research and development. (315)
B.1 Subsidized loans towards fishery investments and enterprises. http://www.fao.org/fi/fcp/en/VCT/profile.htm Boat construction renewal and modernization programs. (985)
B.2 ODA projects and other donor assistance to fishery development. http://www.fao.org/fi/fcp/en/VCT/profile.htm Fishery development projects and support services. (1,886)
B.5 Duty free concessions on fishery inputs. http://www.fao.org/fi/fcp/en/VCT/body.htm Tax exemption programs. (1,075)
C.3 Artisanal cooperative fisher support programs http://www.fao.org/fi/fcp/en/VCT/body.htm Rural fishers' community development programs. (410)
FAO web links last accessed 26/06/06. Group II: Samoa (Western) 10,641 A.1 Fisheries management and conservation support
programs. http://www.fao.org/fi/fcp/en/WSM/profile.htm Fisheries management programs and services. (651)
A.1 Tuna research and marine reserve studies. http://www.fao.org/fi/fcp/en/WSM/profile.htm Fishery research and development. (496)
B.2 ODA projects and other donor assistance to fishery development. http://www.fao.org/fi/fcp/en/WSM/profile.htm Fishery development projects and support services. (2,971)
B.3 Chinese aid towards fishery harbor complex construction. http://www.fao.org/fi/fcp/en/WSM/profile.htm
B.4 Japanese aid towards processing, marketing and the rehabilitation of jetties. http://www.fao.org/fi/fcp/en/WSM/profile.htm
Marketing support, processing and storage infrastructure programs. (4,183)
B.5 Tax exemption programs on the export of fishery products. http://www.fao.org/fi/fcp/en/WSM/profile.htm Tax exemption programs. (1,694)
C.3 FAO/DANIDA rural community fisheries development project. http://www.fao.org/fi/fcp/en/WSM/profile.htm Rural fishers' community development programs. (646)
FAO web links last accessed 26/06/06. Group II: Sao Tome and Principe. 1,132 A.1 Stock assessment projects was funded by the EU in the
early 1990s and later by Canada. http://www.fao.org/fi/fcp/fr/STP/profile.htm

110 Catching More Bait: a bottom-up re-estimation of global fisheries subsidies, Sumaila and Pauly (eds.)
Subsidy program description Amounts
(US$000) Source(s) of information A.1 Fisheries management and conservation support
programs. http://www.fao.org/fi/fcp/fr/STP/profile.htm Fisheries management programs and services. (173)
B.2 Beneficiary of the FAO implemented IDAF Project in West Africa (ended in 1998), funded by DANIDA and the on-going DFID SFLP project. JICA provided fishing inputs and services to the fishing sector. http://www.fao.org/fi/fcp/fr/STP/profile.htm Fishery development projects and support services. (788)
C.3 Artisanal cooperative fisher support programs http://www.fao.org/fi/fcp/fr/STP/profile.htm Rural fishers' community development programs. (171)
FAO web links last accessed 29/03/06. Group II: Saudi Arabia 12,784 A.1 Fisheries management and conservation support
programs. http://www.fao.org/fi/fcp/en/SAU/profile.htm Fisheries management programs and services. (2,488)
A.2 Marine and fishery research in collaboration with the national fishery agency (Fisheries Affairs Directorate). http://www.fao.org/fi/fcp/en/SAU/profile.htm Fishery research and development. (1,896)
B.1 National support for fishery development (loans, modernization etc) to the Saudi Fisher company (parastatals). http://www.fao.org/fi/fcp/en/SAU/profile.htm Boat construction renewal and modernization programs. (5,932)
C.3 Soft loans, grants and technical assistance to the artisanal fishers community sector. http://www.fao.org/fi/fcp/en/SAU/profile.htm Rural fishers' community development programs. (2,469)
FAO web links last accessed 26/06/06. Group II: Senegal 25,533 A.1 LUXDEV surveillance project funds, pro rated by LV. 111 http://www.fao.org/fi/projects/722lux.asp A.2 Fisheries research programs. http://www.fao.org/fi/fcp/fr/SEN/profile.htm
Fishery research and development. (14,376) B.1 Support to the restructuring of the Senegalese fishery
industry to EU standards. 725 UNEP, 2003. B.2 Fond de Promotion Economique in collaboration with
AfDB finances industrial fisheries under medium size enterprises. UNEP, 2003.
B.2 Aid towards the fishery sector from bilateral and multilateral assistances. 4,846 http://www.fao.org/fi/fcp/fr/SEN/profile.htm
B.4 Export subsidy to the trawling fishing industry and fish market renovation programs 1,711 UNEP, 2002; UNEP, 2003.
B.5 Tax reduction for outboards engines, purse seines, and other fishing inputs. 3,353 UNEP, 2003.
C.3 Financial support to rural fishers and fishing cooperatives. 411 UNEP, 2003.
FAO web links last accessed 26/06/06. Group II: Seychelles 9,430 A.1 Fisheries management and conservation support
programs. http://www.fao.org/fi/fcp/en/SYC/profile.htm Fisheries management programs and services. (1,641)
A.2 Fisheries research programs. http://www.fao.org/fi/fcp/en/SYC/profile.htm Fishery research and development. (1,250)
B.2 FAO technical assistance projects towards fishery development. http://www.fao.org/fi/fcp/en/SYC/profile.htm
B.2 JICA grant in aid project towards fishery infrastructure enhancement programs. 1,000 http://www.fao.org/fi/fcp/en/SYC/profile.htm Fishery development projects and support services. (3,911)
C.3 Rural artisanal fisher assistance programs. http://www.fao.org/fi/fcp/en/SYC/profile.htm Rural fishers' community development programs. (1,628)
FAO web links last accessed 26/06/06. Group II: Sierra Leone 27,541 A.1 Fisheries management and conservation support
programs. http://www.fao.org/fi/fcp/en/SLE/profile.htm Fisheries management programs and services. (3,007)
B.2 Bilateral (such as GTZ) and multilateral (FAO) technical assistance to the fishery sector. http://www.fao.org/fi/fcp/en/SLE/profile.htm Fishery development projects and support services. (13,727)
B.5 Tax exemptions on boat and gear supplied by the EU AFCOD (Artisanal Fisheries and Community Development) Project. Khan, 1998. Tax exemption programs. (7,824)

Appendix 2: Global compendium of national fisheries subsidy programs 111
Subsidy program description Amounts
(US$000) Source(s) of information C.3 Artisanal fishery development project funded by AfDB http://www.onefish.org/global/index.jsp C.3 EU AFCOD artisanal fisher assistance programs http://www.fao.org/fi/fcp/en/SLE/profile.htm
Rural fishers' community development programs. (2,983) Web links last accessed 27/06/06. Group II: Solomon Islands 10,297 A.1 Fisheries management and conservation support
programs. http://www.fao.org/fi/fcp/en/SLB/profile.htm Fisheries management programs and services. (1,269)
B.1 Financial support to parastatals for fishing enterprise development 1,975 Globefish databank, 13/04/06.
B.2 Fishery project with assistance from ODA and multilaterals. http://www.fao.org/fi/fcp/en/SLB/profile.htm Fishery development projects and support services. (5,793)
C.3 National support programs and EU funded projects towards rural fishers and livelihood programs. http://www.fao.org/fi/fcp/en/SLB/profile.htm Rural fishers' community development programs. (1,259)
Web links last accessed 27/06/06. Group II: Somalia 6,564 A.1 Fisheries management and conservation support
programs. http://www.fao.org/fi/fcp/en/SOM/profile.htm Fisheries management programs and services. (1,001)
B.2 UNDP/FAO funded development projects. http://www.fao.org/fi/fcp/en/SOM/profile.htm Fishery development projects and support services. (4,570)
B.4 & B.5 The Las Korey canning factory rehabilitation project by UNDP (not included in analysis). http://www.fao.org/fi/fcp/en/SOM/profile.htm
C.3 UNDP artisanal fisher development programs. http://www.fao.org/fi/fcp/en/SOM/profile.htm Rural fishers' community development programs. (993)
Web links last accessed 26/06/06. Group II: South Africa 43,734 A.1 Fisheries management and conservation support
programs. http://www.fao.org/fi/fcp/en/ZAF/profile.htm Fisheries management programs and services. (24,819)
A.2 Fisheries research programs. http://www.fao.org/fi/fcp/en/ZAF/profile.htm Fishery research and development. (18,915)
Web links last accessed 26/06/06. Group II: Sri Lanka 30,725 A.1 Fisheries management and conservation support
programs. http://www.fao.org/fi/fcp/en/LKA/profile.htm Fisheries management programs and services. (12,643)
A.2 Fisheries research programs. http://www.fao.org/fi/fcp/en/LKA/profile.htm Fishery research and development. (9,635)
B.2 ADB fishery resources development project funds. 1,933 http://www.fao.org/fi/fcp/en/LKA/profile.htm B.3 Fishery harbor rehabilitation aid programs funded by
China, Japan, USA and ADB. 5,034 http://www.fao.org/fi/fcp/en/LKA/profile.htm B.5 Japanese funded program towards storage facilities. 1,480 http://www.fao.org/fi/fcp/en/LKA/profile.htm Web links last accessed 26/06/06. Group II: Sudan 4,092 A.1 Fisheries management and conservation support
programs. http://www.fao.org/fi/fcp/en/SDN/profile.htm Fisheries management programs and services. (250) A.2 Fisheries research programs. http://www.fao.org/fi/fcp/en/SDN/profile.htm
Fishery research and development. (191) B.2 ODA (IDRC, JICA etc) and multilateral (FAO, UNDP,
etc) assistance support programs. http://www.fao.org/fi/fcp/en/SDN/profile.htm Fishery development projects and support services. (1,143)
B.4 OPEC/UNDP funded programs in fish storage and transport facilities. http://www.fao.org/fi/fcp/en/SDN/profile.htm
Marketing support, processing and storage infrastructure programs. (1,609)
B.5 Fisheries investment incentive programs including duty waivers and tax exemptions on exports. http://www.fao.org/fi/fcp/en/SDN/profile.htm Tax exemption programs. (651)
C.3 UN technical assistance towards food security and rural fishery development http://www.fao.org/fi/fcp/en/SDN/profile.htm Rural fishers' community development programs. (248)
FAO web links last accessed 26/06/06. Group II: Suriname 6,210 A.1 Fisheries management and conservation support
programs. http://www.fao.org/fi/fcp/en/SUR/profile.htm

112 Catching More Bait: a bottom-up re-estimation of global fisheries subsidies, Sumaila and Pauly (eds.)
Subsidy program description Amounts
(US$000) Source(s) of information Fisheries management programs and services. (1,032)
B.3 Central fishing harbor construction with Belgian assistance 2,454 http://www.fao.org/fi/fcp/en/SUR/profile.htm
B.4 JICA assistance programs towards storage and processing. 1,700 http://www.fao.org/fi/fcp/en/SUR/body.htm EU support programs towards artisanal fishermen. http://www.fao.org/fi/fcp/en/SUR/profile.htm Rural fishers' community development programs. (1,024)
FAO web links last accessed 26/06/06. Group II: Syria 100 A.1 Fisheries management and conservation support
programs. http://www.fao.org/fi/fcp/en/SYR/body.htm Fisheries management programs and services. (100)
FAO web link last accessed 26/06/06. Group II: Tanzania 33,698 A.1 Fisheries management and conservation support
programs. http://www.fao.org/fi/fcp/en/TZA/profile.htm Fisheries management programs and services. (2,642)
A.2 Fisheries research programs. http://www.fao.org/fi/fcp/en/TZA/profile.htm Fishery research and development. (2,013)
B.2 ODA and multilateral development assistance to the fishery sector (fishing inputs mostly) http://www.fao.org/fi/fcp/en/TZA/profile.htm Fishery development projects and support services. (12,061)
B.4 Post harvest support programs (Holland, Denmark and FAO). http://www.fao.org/fi/fcp/en/TZA/profile.htm
Marketing support, processing and storage infrastructure programs. (16,982)
FAO web links last accessed 26/06/06. Group II: Thailand 323,959 A.1 Stock assessment and fishery resource surveys 11,200 APEC, 2000. A.1 Fish conservation and coral management programs 5,082 APEC, 2000. A.1 Fish stock enhancement programs 5,964 APEC, 2000. A.2 Fisheries research programs. 2,379 APEC, 2000. B.2 Subsidized loans towards industrial fishery development 67,254 APEC, 2000. B.4 Post harvest and quality control programs. 66,960 B.5 Duty tax exemption on fishery inputs and outputs. Ahmed et al. 2002.
Tax exemption programs. (119,544) C.3 Programs to assist small scale fisher communities. Ahmed et al. 2002.
Rural fishers' community development programs. (45,576) Group II: Togo 7,921 A.1 Fisheries management and conservation support
programs. http://www.fao.org/fi/fcp/fr/TGO/profile.htm Fisheries management programs and services. (865)
B.2 Bilateral and multilateral development assistance to the fishery sector. http://www.fao.org/fi/fcp/fr/TGO/profile.htm Fishery development projects and support services. (3,948)
B.5 Fishery inputs and export waivers and concessions. http://www.fao.org/fi/fcp/fr/TGO/profile.htm Tax exemption programs. (2,250)
C.3 FED artisanal fishery development project. http://www.fao.org/fi/fcp/fr/TGO/profile.htm Rural fishers' community development programs. (858)
FAO web links last accessed 26/06/06. Group II: Tonga 2,640 A.1 Fisheries management and conservation support
programs. http://www.fao.org/fi/fcp/en/TON/profile.htm Fisheries management programs and services. (188)
A.2 Fisheries research programs. http://www.fao.org/fi/fcp/en/TON/profile.htm Fishery research and development. (143)
B.1 Fishery enterprise and parastatals development http://www.fao.org/fi/fcp/en/TON/profile.htm Boat construction renewal and modernization programs. (449)
B.2 Aid and assistance from FAO, UNDP, EU, USAID, JICA, AUSAID and CIDA. Aids have variously been concerned with the provision of technical assistance and capital aid. Amount represents Australian Tonga fishery development project. 650 http://www.fao.org/fi/fcp/en/TON/body.htm
B.4 Fish marketing support programs. http://www.fao.org/fi/fcp/en/TON/body.htm Marketing support, processing and storage infrastructure
programs. (1,210) FAO web links last accessed 31/07/06.

Appendix 2: Global compendium of national fisheries subsidy programs 113
Subsidy program description Amounts
(US$000) Source(s) of information Group II: Trinidad and Tobago 7,321 A.1 Fisheries management and conservation support
programs. http://www.fao.org/fi/fcp/en/TTO/profile.htm Fisheries management programs and services. (431)
B.1 Loans, fishing equipments and other economic incentives towards fisheries enterprise development. http://www.fao.org/fi/fcp/en/TTO/profile.htm Boat construction renewal and modernization programs. (1,028)
B.2 Bilateral and multilateral development assistance to the fishery sector. http://www.fao.org/fi/fcp/en/TTO/profile.htm Fishery development projects and support services. (1,968)
B.4 JICA support programs for fish processing facilities. http://www.fao.org/fi/fcp/en/TTO/profile.htm Marketing support, processing and storage infrastructure
programs. (2,772) Fishing input duty waivers and exemption http://www.fao.org/fi/fcp/en/TTO/profile.htm Tax exemption programs. (1,122)
FAO web links last accessed 26/06/06. Group II: Tunisia 65,292 A.1 Fisheries management and conservation support
programs. http://www.fao.org/fi/fcp/fr/TUN/profile.htm Fisheries management programs and services. (4,473)
B.2 FAO/UNDP technical assistance to the fishery sector. http://www.fao.org/fi/fcp/fr/TUN/profile.htm Fishery development projects and support services. (20,423)
B.3 Support programs to major fishing ports. http://www.fao.org/fi/fcp/fr/TUN/profile.htm B.4 National development programs for fishery product
quality assurance. http://www.fao.org/fi/fcp/fr/TUN/profile.htm Marketing support, processing and storage
infrastructure programs. (28,755) B.5 Fiscal incentives including waivers and tax concessions
according to national investment code. http://www.utap.org.tn/htmlang/pech_agr/bas_1_6.htm
Tax exemption programs. (11,641) Web links last accessed 27/06/06. Group II: Turkey 140,039 A.1 Fisheries management and conservation support
programs. http://www.fao.org/fi/fcp/en/TUR/profile.htm A.1 Fisheries monitoring support programs. 561 OECD, 2004. A.2 Fisheries research programs. 1,185 OECD, 2004. B.2 Japanese grants in aid project 500 http://www.fao.org/fi/fcp/en/TUR/profile.htm B.2 Technical assistance from multilaterals agencies. http://www.fao.org/fi/fcp/en/TUR/profile.htm B.3 State fishing port development programs http://www.fao.org/fi/fcp/en/TUR/profile.htm B.3 Fisheries infrastructure support programs 23,826 OECD, 2004. B.4 State programs towards fishery products quality
assurance. http://www.fao.org/fi/fcp/en/TUR/profile.htm Marketing support, processing and storage infrastructure
programs. (113,823)
C.3 Social welfare programs for fishermen. 144 www.abgs.gov.tr/tarama/tarama_files/08/08AT_Annotated.htm
Web links last accessed 27/06/06. Group II: Ukraine 190,658 A.1 Fisheries management and conservation support
programs. http://www.fao.org/fi/fcp/en/UKR/profile.htm Fisheries management programs and services. (19,648)
A.2 Fisheries research programs. http://www.fao.org/fi/fcp/en/UKR/profile.htm Fishery research and development. (14,974)
B.1 Public investment in fisheries enterprises. http://www.fao.org/fi/fcp/en/UKR/profile.htm Boat construction renewal and modernization programs. (46,840)
B.2 Multilateral assistance from FAO and UNDP in fishery development projects. http://www.fao.org/fi/fcp/en/UKR/profile.htm Fishery development projects and support services. (89,703)
C.3 State funds towards fishing cooperatives. http://www.fao.org/fi/fcp/en/UKR/profile.htm Rural fishers' community development programs. (19,493)
FAO web links last accessed 27/06/06. Group II: Uruguay 5,120 A.1 Fisheries management and conservation support
programs. http://www.fao.org/fi/fcp/es/URY/profile.htm Fisheries management programs and services. (5,120)
FAO web links last accessed 27/06/06.

114 Catching More Bait: a bottom-up re-estimation of global fisheries subsidies, Sumaila and Pauly (eds.)
Subsidy program description Amounts
(US$000) Source(s) of information Group II: Vanuatu 27,275 A.1 Fisheries management and conservation support
programs. http://www.fao.org/fi/fcp/en/VUT/profile.htm Fisheries management programs and services. (3,431)
B.1 State support programs towards fishery enterprise development. http://www.fao.org/fi/fcp/en/VUT/body.htm Boat construction renewal and modernization programs. (8,179)
B.2 Bilateral and multilateral assistance (FAO, UNDP, etc.) programs in fisheries development and management. http://www.fao.org/fi/fcp/en/VUT/body.htm Fishery development projects and support services. (15,665)
FAO web links last accessed 27/06/06. Group II: Venezuela 259,898 A.1 Fisheries management and conservation support
programs. http://www.fao.org/fi/fcp/es/VEN/profile.htm Fisheries management programs and services. (16,673)
B.1 ODA support programs and other donor contributions (EU, FAO) towards fishery development http://www.fao.org/fi/fcp/es/VEN/profile.htm Fishery development projects and support services. (76,120)
B.4 INFOPESCA programs in fish quality control and marketing. http://www.fao.org/fi/fcp/es/VEN/profile.htm
Marketing support, processing and storage infrastructure programs. (107,175)
B.5 Tax exemption programs towards fishing investments. http://www.fao.org/fi/fcp/es/VEN/profile.htm Tax exemption programs. (43,388)
C.3 Support programs towards rural fisher cooperatives. http://www.fao.org/fi/fcp/es/VEN/profile.htm Rural fishers' community development programs. (16,542)
FAO web links last accessed 27/06/06. Group II: Vietnam 380,692 A.1 Fisheries management and conservation support
programs. http://www.fao.org/fi/fcp/en/VNM/profile.htm A.1 Fisheries management programs and services. 507 APEC, 2000. A.2 Fisheries research programs. http://www.fao.org/fi/fcp/en/VNM/profile.htm
Fishery research and development. (48,850) B.1 Public investment in fisheries enterprises. http://www.fao.org/fi/fcp/en/VNM/profile.htm B.1 State fishery enterprise development and promotional
investment programs. 33,663 APEC, 2000. B.1 Preferential loan programs towards fishery investment
enterprises. http://www.fao.org/fi/fcp/en/VNM/profile.htm B.2 ODA (NORAD, DANIDA, AusAID, etc) and multilateral
assistance (EU, FAO, WB etc) programs in fishery development. http://www.fao.org/fi/fcp/en/VNM/profile.htm
Fishery development projects and support services. (292,641) B.3 State support in fishing harbor infrastructure programs. http://www.fao.org/fi/fcp/en/VNM/profile.htm B.3 Support programs to major fishing ports. 5,031 APEC, 2000. FAO web links last accessed 27/06/06. Group II: Yemen 83,833 A.1 Fisheries management and conservation support
programs. http://www.fao.org/fi/fcp/en/YEM/profile.htm Fisheries management programs and services. (5,744) B.2 Support programs with technical assistance from ODAs
(JICA) and donor agencies (UN, EU, Islamic Bank, WB etc) for fishery development. http://www.fao.org/fi/fcp/en/YEM/body.htm Fishery development projects and support services. (26,222)
B.4 Support programs with technical assistance for processing and storage facilities. http://www.fao.org/fi/fcp/en/YEM/body.htm
Marketing support, processing and storage infrastructure programs. (36,920)
B.5 Tax exemptions for the fisheries inputs and outputs. http://www.fao.org/fi/fcp/en/YEM/profile.htm Tax exemption programs. (14,946)
FAO web links last accessed 27/06/06.