Embed Size (px)
Citation preview

Fish to 2050 in the ASEAN RegionPh
oto
cred
it: F
ront
cov
er, F
inn
Thils
ted/
Wor
ldFi
sh

2
AuthorsChin Yee Chan, Nhuong Tran, Danh Chi Dao, Timothy B Sulser, Michael John Phillips, Miroslav Batka, Keith Wiebe and Nigel Preston
CitationThis publication should be cited as: Chan CY, Tran N, Dao CD, Sulser TB, Phillips MJ, Batka M, Wiebe K and Preston N. 2017. Fish to 2050 in the ASEAN region. Penang, Malaysia: WorldFish and Washington DC, USA: International Food Policy Research Institute (IFPRI). Working Paper: 2017-01.
AcknowledgmentsThis work was undertaken as part of the CGIAR Research Programs on Policies, Institutions and Markets (PIM) and Livestock and Fish (L&F), by a team of scientists from WorldFish and the International Food Policy Research Institute (IFPRI). Funding support for this study was provided by the Bill and Melinda Gates Foundation, L&F and PIM.
DisclaimerThis working paper has not been peer reviewed. The opinions expressed here belong to the authors, and donot necessarily reflect those of PIM, IFPRI or CGIAR.
Fish to 2050 in the ASEAN Region

3
Contents
List of tables 4
List of figures 5
List of abbreviations 6
Abstract 7
Introduction 8
Historical trends of fish in the ASEAN region 10
Methods 14
Results 17
Discussion 22
Conclusions 25
References 26
Appendix A. Improvement of model calibration for historical trends 30
Appendix B. Stakeholder consultation workshop 31
Appendix C. Calibration of the projected aquaculture production in the ASEAN region 34
Appendix D. Calibration of the projected capture fisheries production in the ASEAN region 35

4
List of tables
Table 1. ASEAN’s average per capita fish consumption and fish, animal and total protein intake 2011.
Table 2. Sixteen fish production commodity groupings in the IMPACT fish model.
Table 3. Aquaculture and capture fisheries output among ASEAN members and top producer countries worldwide, 2013.
Table 4. ASEAN’s share of global production in 2015, 2030 and 2050.
Table 5. ASEAN’s projected growth of fish production, trade, consumption and nutrients 2015–2050.

5
List of figures
Figure 1. Global and ASEAN capture fisheries and aquaculture (excluding aquatic plants) production share, 1950–2014.
Figure 2. Contribution of aquaculture (excluding aquatic plants) to ASEAN’s total fish supply in 2000, 2010 and 2014.
Figure 3. Share of major fish species farmed (A) and wild captured (B) of ASEAN’s output in 2014.
Figure 4. ASEAN fish utilization and supply, 1961–2013.
Figure 5. ASEAN net surplus of fish value (A) and tonnage (B), 1976–2013.
Figure 6. Global (A) and ASEAN (B) capture fisheries and aquaculture production (excluding aquatic plants), 1950–2050.
Figure 7. Relative shares of capture fisheries and aquaculture in ASEAN fish production (A) and fish consumption (B) in 2014, 2030 and 2050.
Figure 8. Projected global fish prices in real terms, 2000–2050.

6
List of abbreviations
AIT Asian Institute of Technology
APFIC Asia-Pacific Fishery Commission
ASEAN Association of Southeast Asian Nations
CCAFS CGIAR Research Program on Climate Change, Agriculture and Food Security
CGIAR Consultative Group on International Agricultural Research
CTI-CFF Coral Triangle Initiative on Coral Reefs, Fisheries and Food Security
FAO Food and Agriculture Organization
FIPS Fisheries and Aquaculture Statistics and Information Branch
GDP gross domestic product
GFSF Global Futures and Strategic Foresight
IFPRI International Food Policy Research Institute
IMPACT International Model for Policy Analysis of Agricultural Commodities and Trade
ISSCAAP International Standard Statistical Classification of Aquatic Animals and Plants
IUU illegal, unreported and unregulated (fishing)
L&F CGIAR Research Program on Livestock and Fish
MSY maximum sustainable yield
NACA Network of Aquaculture Centers in the Asia-Pacific
NGO nongovernmental organization
OECD Organisation for Economic Co-operation and Development
PEMSEA Partnerships in the Environmental Management for the Seas of East Asia
PIM CGIAR Research Program on Policies, Institutions and Markets
RPOA-IUU Illegal, Unregulated, and Unreported Regional Plan of Action
SEAFDEC Southeast Asian Fisheries Development Center
USDA United States Department of Agriculture

7
Abstract
The Association of Southeast Asian Nations (ASEAN) has emerged as a global fish producer, owing to the rapid growth of aquaculture in Southeast Asia and its large offshore fishing fleet. Fish is a regional commodity that is traded globally, and this region is at the frontline of the global trend toward meeting seafood demand by 2050. Fisheries and aquaculture are increasingly becoming a primary source of protein and micronutrients, foreign exchange, livelihoods and well-being for the population in the region. Therefore, it is imperative for ASEAN decision-makers to enhance policies nationally and regionally to maximize the synergies between socioeconomic development and protecting natural resources and the environment in the region.
Using the International Model for Policy Analysis of Agriculture Commodities and Trade (IMPACT) of the International Food Policy Research Institute (IFPRI), with an updated fish model developed in collaboration with WorldFish, the Fisheries and Aquaculture Department of the Food and Agriculture Organization (FAO), and the University of Arkansas at Pine Bluff, the business-as-usual projection of Fish to 2050 in the ASEAN region was created taking into account industry-specific biophysical and socioeconomic factors, such as environmental management and ecosystem carrying capacity plus socioeconomic targets defined by national governments during a stakeholder consultation workshop at WorldFish in June 2016.
In the ASEAN region, fish production will continue to grow and likely to reach nearly a quarter share of global fish output in 2030 and then sustain this share to 2050. Aquaculture is expected to supply more than half of the fish consumed in the ASEAN region in the coming decade. Pangasius and other catfish, carp and tilapia will continue to be the major species produced from aquaculture. Continued dominance of capture fisheries as a source of fish supply is projected in the region through to 2050. Higher per capita fish and fish oil consumption will increase the nutrient intake from fish in the ASEAN region. Regional fish and fishery products will continue to be broadly traded given the balance of regional supply and demand in the near future. Aquaculture and capture fisheries have important, complementary roles to play in ensuring that fish remains available and affordable in the region. Policies to promote sustainable aquaculture expansion and law enforcement in fisheries management are critical to ensuring sustainable growth of both sectors. WorldFish has made significant updates to the current IMPACT fish model in producing these ASEAN projection results. Yet continued efforts are needed to address several limitations of the current model and enhance the robustness of future projections.

8
Introduction
The world’s population is estimated to reach 9.7 billion by 2050 from its current level of 7.3 billion [1], with most of the increase occurring in developing countries. In a context of climate change, economic uncertainty and increasing competition for natural resources, feeding this population will be an important challenge. To meet this demand without significant price increases, it is estimated that food production will need to rise approximately 70–100% from the current production level by 2050 [2, 3]. Currently representing 20% of all animal protein supply [4, 5], fish will be a prominent future contributor to global food and nutrition security. Global demand for seafood continues to rise, driven by population growth, higher incomes, urbanization, growing international fish trade and increasing relative preference for seafood protein [6]. Preliminary estimates for 2015 showed that global annual per capita fish consumption reached a new record high of more than 20 kg [7].
However, fish production is not homogeneously distributed. In 2014, Asia accounted for 70.8% of global fish production (88.9% of aquaculture and 56.5% of capture production), excluding aquatic plants. China alone produced 37.5% and consumed 37.1% of the world’s food fish [8]. South Asia accounted for 9.3% of global fish supply, with India and Bangladesh as the region’s top producers, while Southeast Asia accounted for 18.3% [8]. Africa, Latin America, Europe and North America accounted for 6.2%, 8.1%, 10% and 4% respectively. Over the past two decades, most of the growth in global fish production has come from aquaculture [8] as world capture fisheries have leveled off since the 1990s at about 90 million tons annually (approximately 70 million tons for food) [7, 9]. The majority of fish production, especially for farmed fish, occurs in developing countries in the south where competition for natural resources for food production, such as land, water and ecosystem services, is high.
The fish sector provides income, opens up employment opportunities, alleviates poverty and improves food and nutrition security in developing countries directly through production and indirectly across value chains. FAO [7] estimated that 56.6 million people globally (36% full time, 23% part time) were engaged in the primary sector of capture fisheries and aquaculture in 2014. Of this, 84% were based in Asia, followed by 10% in Africa. Although statistics are in many cases unreliable, particularly for small-scale fisheries, the number of people employed in capture fisheries appears to have remained steady since 2000, while the proportion of workers engaged in aquaculture has nearly doubled, from 17% in 1990 to 33% in 2014. Of the 18 million people engaged in fish farming, 94% were in Asia [7]. Also, three quarters of the countries where fish contributes more than one-third of animal protein in the diet are from low-income, food-deficit nations [10].
With this uneven distribution of global fish production, international fish trade becomes an important mechanism to satisfy the rising fish demand worldwide. Fish represents one of the most traded agricultural products, with an estimate of about 78% of seafood products traded internationally [11]. Global fish trade has increased rapidly in the past few decades with rising net trade flows from developing to developed countries. About 10% of agricultural exports are fish products from capture fisheries and aquaculture. The value of the global fish trade exceeds the value of international trade in all other combined animal source foods [12]. Low- and medium-income countries play a pivotal role as they supply half of all fish exports by value and two-thirds by quantity [12]. Fish trade represents an important source of foreign currency earnings for many developing countries in the south.
Given the dynamic contexts of regional fish production, consumption and trade in the global food system, multiple issues need to be addressed to sustain fish as a critical future contributor to food and nutrition security worldwide. This is especially true given the rapid expansion of aquaculture production and the challenges for managing associated socioeconomic and environmental impacts. There is a strong need for decision-makers to understand the future trends of fish supply and demand, taking into account complex interactions across fish commodities and fish producing and consuming countries. To date, several foresight modeling reports, including the Organisation for Economic Co-operation and Development (OECD) agriculture outlook [9] and Fish to 2030 [13], have provided an overview of future fish supply and demand observed in fish commodities and countries globally and regionally.

9
Fish is a regional commodity that is shared globally. ASEAN—defined by a 10-member bloc of Brunei, Cambodia, Indonesia, Laos, Malaysia, Myanmar, the Philippines, Singapore, Thailand and Vietnam—is at the frontline of the global trend of meeting expanding seafood demand out to 2050. The ASEAN region has a combined gross domestic product (GDP) of more than USD 2.6 trillion, growing 4.7% per annum, and a population of 632 million in 2015 (8.6% of the world’s population) [14]. Its population is projected to reach 790 million by 2050 [1], which will require a significant increase in food supply to meet the rising demand. By volume, fish production is four times that of poultry and 20 times that of cattle in the ASEAN region [5]. Over the past 15 years, ASEAN fish output has more than doubled. Aquaculture production in the ASEAN region has increased four-fold from 2000 to 2014, showing stunning high growth compared to other regions in the world. The ASEAN region has transitioned from small-scale capture fisheries, sold domestically or regionally, toward a mix of smaller-scale and larger-scale export-oriented fisheries. This transition was driven by the enormous increase in aquaculture production over the past 20 years. In terms of the value of aquaculture production, the 10 ASEAN countries combined earned around USD 23.8 billion in 2014 [8]. The ASEAN capture fisheries sector has doubled in the past 25 years. For aquatic plants, overwhelmingly seaweeds, three of the 10 ASEAN members are among the world’s top 10 producing countries, with Indonesia accounting for more than one-third of world seaweed output. Combined production of aquatic plants from the ASEAN countries has also increased more than seven-fold over the past decade [8]. The growth of the ASEAN region’s fish supply for human consumption is more than twice the population growth, inducing a rise in average per capita fish consumption. Among other regions, ASEAN’s annual per capita fish consumption in 2013 was the highest in the world at 35.2 kg [8].
The importance of the contribution by fisheries and aquaculture to national economies is well recognized among ASEAN countries, particularly as a source of foreign exchange earnings, an employment creator and income generator, as well as in food and nutrition security. The region’s fisheries and aquaculture sectors have exhibited sustained growth in both production and consumption. Nonetheless, future fish supply and demand in the ASEAN region also face a number of challenges, especially climate change, which will cause disruptions in ocean and aquatic ecosystems [15-18]. Other global challenges such as increasing demand for fishmeal and fish oil and the associated price increases of fish will also become key drivers of change, shaping the future seafood industry in the region.
This paper presents a baseline (business-as-usual) projection of fish supply, net trade, consumption and nutrition in the ASEAN region to 2050. It extends the previous work (Fish to 2030 [13] by the World Bank, IFPRI and FAO) with the effort of updating parameters of the IMPACT model to replicate observed trends of fish supply in ASEAN countries and other top 10 fish producers in the world. The modeling process was also informed by a stakeholder workshop organized at WorldFish in Penang, Malaysia, in June 2016. This helped improve the model calibration by taking into account sector-specific biophysical and socioeconomic factors, such as environmental and ecosystem carrying capacity and socioeconomic targets defined by national governments in the ASEAN region.

10
Historical trends of fish in the ASEAN region
Production In 2014, the 10 ASEAN countries together accounted for 18.3% (30.6 million tons) of world fish production (167.3 million tons) (Figure 1) [8]. Indonesia, Vietnam and Myanmar are among the top 10 fish producing countries globally. Excluding aquatic plants, Indonesia alone accounted for 6.4% of world output and Vietnam 3.8% in 2014. Aquatic plant production is as important as fish output in Indonesia. In 2014, the ASEAN region supplied 11.9 million tons of aquatic plants (41.8% of world output), with Indonesia alone producing 10.1 million tons of seaweed, almost equal to its total fish supply of 10.7 million tons [8]. The Indonesian government aims to continue this high growth rate in its national policy.
Over the past 25 years, aquaculture has been the fastest-growing food production sector in the world, surpassing rates of increase in terrestrial livestock and dairy production by a wide margin [5, 6, 13]. The ASEAN region is an important aquaculture producer, with its members together producing around 14.7% (10.9 million tons) of the world total in 2014. Growth in aquaculture production in the region has been dramatic at an annual average of 14% from 2008 to 2013. During the same period, China showed a growth rate of 6% annually, South America 6.9% and
Africa 10.4%. Compared to other regions in the world, the ASEAN countries have shown an exceptional rate of aquaculture growth. At the national level, more than half of Vietnam’s fish production came from aquaculture. Nevertheless, not all ASEAN region contribute to the high growth of the aquaculture sector. Brunei, Laos and Singapore have almost no commercial aquaculture development [8].
World capture fisheries production has remained stable at approximately 90–95 million tons per year over the past two decades, albeit with some fluctuations. Nevertheless, capture fisheries in the ASEAN region increased their output at 2.8% per annum between 2000 and 2014 (Figure 1). The region’s contribution to global fishery production has gradually increased from 5% in 1950 to 21.1% in 2014 [8]. Indonesia was the second-largest fisheries producer (6.9% of world capture fisheries tonnage) after China in 2014. Indonesia, Myanmar and Vietnam each increased its catch by more than 100 thousand tons in 2014 compared to 2013 [8]. Despite notable increases from capture fisheries, the ASEAN region’s share of aquaculture in total fish production has grown from 17% in 2000 to 35.5% in 2014, which implies that more than one-third of the current total production of food fish came from aquaculture (Figure 2) [8].
Figure 1. Global and ASEAN capture fisheries and aquaculture (excluding aquatic plants) production share, 1950–2014.
Rest of the world (Aquaculture)
Rest of the world (Capture)
ASEAN (Aquaculture)
ASEAN (Capture)
40
20
60
80
100
120
140
160
180
1950 19701960 1980 1990 2000 2010
Mill
ion
tons

11
Figure 3A illustrates the share of five main fish species cultured in the ASEAN region by weight: catfish (22%), tilapia (17%), shrimp (14%), carp (12%) and milkfish (9%) [8, 19, 20]. Catfish output has increased rapidly predominantly because of Vietnam, the top pangasius producer in the world. Vietnam’s output has increased more than 12-fold since 2000 [8], accounting for 45.8% of regional catfish production in 2014. Farmed shrimp constitutes the highest value of all cultured species. In 2014, shrimp accounted for 31.9% of the total value of all aquaculture output. The value of all farmed
species has steadily increased from 2000 to 2014. Catfish value has risen 18-fold since 2000, versus a 12-fold increase in quantity. Similarly, within the same period, tilapia has shown a 7-fold increment in value. Notwithstanding this strong growth trend, shrimp in the region demonstrated significant fluctuations in value because of disease outbreaks. On the other hand, of a diverse set of landings, mollusks, tuna, mackerel and shrimp accounted for a large portion of capture volume (22.9%) in 2014 (Figure 3B) [8].
Figure 2. Contribution of aquaculture (excluding aquatic plants) to ASEAN’s total fish supply in 2000, 2010 and 2014.
% of aquaculture productionCapture fisheriesAquaculture
2000 2010 2014
5%
0%
10%
15%
20%
25%
30%
35%
40%20
15
10
5
0
Mill
ion
tons
Figure 3. Share of major fish species farmed (A) and wild captured (B) of ASEAN’s output in 2014.
Total aquaculture output: 10.8 million tons
Mollusks
Milkfish
Carp
9%
12%
14%
17%
19%
22%
2%5%
Shrimp
Tilapia
Other freshwater and diadromous
Catfish
OtherA
Total capture fisheries output: 19.7 million tons
Mollusks
14%
5%
5%
6%
3%
19%
30%
11%
7%
Shrimp
Mackerel
Tuna
Other
Other freshwater and
diadromous
Other demersal fish
Other pelagic fish
Other marine species
B

12
Consumption Food security exists when people have year-round access to sufficient, safe and nutritious food that meets their dietary needs for an active and healthy life [21]. FAO identified poverty as one of the root causes of food insecurity globally [22]. Economically, ASEAN is comprised of high (Brunei, Singapore), upper middle (Malaysia), lower middle (Thailand, Indonesia, the Philippines) and low income countries (Vietnam, Laos, Cambodia, Myanmar) [23, 24]. An estimated 59.6 million people in the ASEAN region are chronically undernourished [25]. Furthermore, other factors such as population growth, urbanization, food price volatility, land acquisition, environmental degradation and climate change are potentially aggravating the multidimensional food insecurity threat in the region [26].
Figure 4 shows that about 95% of the fish supply in the ASEAN region was used for human consumption [8]. Growth in the region’s supply of fish for human consumption has outpaced population growth in the past five decades, increasing at an average annual rate of 4.6% from 1961 to 2013, more than double the rate of population growth (2.0%) [8], resulting in increasing average per capita availability.
The ASEAN population relies heavily on fish for food and protein. In 2011, seafood accounted for about 38% of animal protein in the region’s diet, followed by meat (33%), milk (20%), eggs (6%) and animal fats and offal (3%) [5]. Table 1 depicts average fish consumption and fish protein intake, as well as the contribution of fish to animal and total protein intake in 2011 [5]. The ASEAN region exhibited a remarkably high per capita fish consumption of 33.4 kg compared to Asia as a whole (21.3 kg) and the lowest of 10.9 kg in Africa. Per capita fish consumption in the region has more than doubled over the past four decades and is now 1.8 times higher than the world average in 2013 (19.2 kg/person/year). Overall, the ASEAN region consumes less animal protein daily per person (24.2 g) than the world average of 31.8 g. However, both the proportion of fish in animal protein intake and in total protein intake is more than double the global average. Fish exceeds half of the animal protein intake in Indonesia and Cambodia. This implies that fish plays a disproportionally important role for food security and nutrition in this region of low animal protein consumption, where fish is often a cheaper and more accessible animal-source food [27, 28]. Other than protein, the main contribution of fish to food and nutrition security is its lipid, micronutrients (fatty acid and vitamins A, B and D) and minerals (calcium, phosphorus, iodine, zinc, iron and selenium) [10, 29-32], which are crucial for combating malnutrition in low-income ASEAN countries.
Figure 4. ASEAN fish utilization and supply, 1961–2013.
Population (x10 millions) and per capita availability (kg/person)
Fish Utilization (Million tons)
7030
5020
205
6025
3010
4015
10
0020111991 200119811971 20061986 1996197619661961
Food Non-food uses Population Per capita availability

13
TradeThe fish trade in the ASEAN region has grown dramatically in value, with aggregate exports increasing from USD 0.5 billion in 1976 to USD 20.8 billion in 2013 at an average annual of 11% in nominal terms and 7% in real terms [8]. This region was responsible for 15.1% of global fish exports (USD 20.8 billion) and 5.2% of global fish imports (USD 6.9 billion) in 2013 [8]. Improved long-distance refrigeration, transport infrastructure and faster communications have all contributed to this vast expansion of trade.
Fish trade generally stimulates regional economic growth and development. However, due to the Asian financial crisis in 1997, regional exports and imports dropped 5.4% and 21.2% respectively in 1998 compared with 1997 [8]. A similar trend occurred during the global economic crisis in 2008 when regional exports and imports decreased by 6.9% and 7.9% in 2009 compared with 2008 [8]. Among the
top five fish exporters in the world in 2014, Vietnam became the third biggest exporter (USD 8.0 billion), overtaking Thailand (USD 6.6 billion), which has experienced a substantial decline in exports since 2013. This is mainly linked to reduced shrimp production because of disease outbreaks. Thailand exports further declined in 2015 primarily because of its reduced shrimp production and lower prices of shrimp and tuna [7].
Overall, the ASEAN region has become a net fish exporter. From 1976 to 2011, it showed a gradually increasing surplus of both value and tonnage (Figure 5), and in 2013 it had a surplus of USD 13.9 billion and 2 million tons in fish seafood trade [8]. Malaysia, the Philippines, Laos and Singapore are net fish importers in this region. However, the seafood trade deficits of these countries were more than offset by large surpluses in Indonesia, Vietnam, Myanmar, Thailand and Cambodia.
Countries Population (million)
Under-nourished (%)
Fish consumption (kg/person/year)
Fish protein (g/person/year)
Animal protein (g/person/day)
Fish/animal protein (%)
Fish/total protein (%)
Cambodia 14.6 17.0 35.5 11.3 17.8 63.4 17.9
Indonesia 244.8 13.5 28.9 9.6 17.4 54.8 35.4
Laos 6.4 22.8 16.6 5.0 13.2 37.6 27.3
Malaysia 28.6 <5.0 58.1 16.8 43.1 39.0 28.0
Myanmar 52.1 20.2 55.3 14.5 34.1 42.6 29.9
Philippines 94.5 13.0 32.7 9.7 25.0 38.7 27.9
Thailand 66.9 9.3 25.0 8.4 24.2 34.7 25.8
Vietnam 87.8 14.5 33.3 8.6 31.8 27.2 21.4
ASEAN region
595.7 13.2 33.5 10.1 24.2 41.7 15.2
World 7,007.4 12.1 18.9 5.2 31.8 16.4 6.5
Table 1. ASEAN’s average per capita fish consumption and fish, animal and total protein intake 2011.
* Brunei and Singapore are excluded due to data unavailability [5].
* Net trade represents total exports minus total imports.
Figure 5. ASEAN net surplus of fish value (A) and tonnage (B), 1976–2013.
Exports Imports
5
0
10
15
20
25
1976 200119911986 20111981 20061996
Billi
on U
SD
A. Value surplus
Mill
ion
tons
B. Tonnage surplus
2
1
0
3
4
5
6
1976 19961986 20061981 20011991 2011

14
Methods
The IMPACT model was first used by Delgado et al [33] to produce projections of global food fish production, consumption and trade from 1997 to 2020. This was also the first time that fish was included in a major global agricultural production and trade model. Approximately 10 years after the publication of the Fish to 2020 report (2003) by IFPRI and WorldFish [33], a follow-up study was commissioned by the World Bank in collaboration with the IMPACT modeling team at IFPRI, the Fisheries and Aquaculture Department of the FAO and the University of Arkansas at Pine Bluff. Incorporating the lessons learned in Fish to 2020, a new fish module of the IMPACT model was developed and used to create the Fish to 2030 report in 2013 [13] covering 2000–2030. Fish to 2030 also incorporated new developments in global seafood markets and the aquaculture sector. Whereas Fish to 2020 used a fish species aggregation model based on market characteristics from the consumer perspective, the new model used aggregation primarily based on production systems, feeding regimes and fish diets. The disaggregation is aimed at better reflecting the rising role of fish farming and the resulting closer linkages between fish and agricultural markets. These linkages operate through feed markets, where the livestock and fish farming sectors compete for marine ingredients that are also used in livestock feed. At the same time,
the livestock and aquaculture sectors compete for agriculturally produced, plant-based feeds, which are now major inputs in aquaculture production.
The increasingly important linkages between agricultural and fish sectors, and the increasing role of fish farming versus capture fisheries, also provide justification for conducting an analysis of the seafood markets using economic modeling tools such as the IMPACT model. Aquaculture production can readily be modeled as a farming activity, and agriculture and aquaculture are now linked more closely than ever. The model differentiates capture and aquaculture production of 16 fish commodities (Table 2) and two fish products (fishmeal and fish oil) in 115 regions. At the time of writing, the lack of disaggregate data required that trade and consumption be modeled at a more aggregate level of just nine fish commodities. Part of the reason for the lack of reliable data is the rapid growth of aquaculture species such as tilapia and pangasius, which only became prevalent worldwide relatively recently and thus lack a sufficient historical dataset. Another reason is that the data collection streams for FAO databases differ between the domains of production, trade and consumption. Even so, the IMPACT model used here remains the global agricultural and fish model with the highest level of fish commodity detail.
Production fish commodities Description
Shrimp Shrimp and prawns
Crustaceans Aggregate of all other crustaceans
Mollusks Aggregate of mollusks and other invertebrates
Salmon Salmon, trout and other salmonids
Tuna Tuna
Tilapia Tilapia and other cichlids
Pangasius and other catfish Pangasius and other catfish
Carp Major carp and milkfish species
Other carp Silver, bighead and grass carp
Eel and Sturgeon Aggregate of eels and sturgeon
Other freshwater and diadromous Aggregate of other freshwater and diadromous species
Major demersals Major demersal fish
Mullet Mullet
Cobia and swordfish Aggregate of cobia and swordfish
Other pelagics Other pelagic species
Other marine Other marine animals
Table 2. Sixteen fish production commodity groupings in the IMPACT fish model.
Source: Fish to 2030 report [13]

15
IMPACT is a recursive-dynamic model [34] that finds a global market equilibrium in each year and continues solving sequentially over the projection time horizon. The solution for a given period is based on the solution for the previous period, without foresight, price expectations, stock holding or speculation. As such, this type of model is suited for analyzing alternative sets of long-term equilibria rather than short-term market fluctuations. For each commodity market, the model reaches equilibrium by solving for a single, market-clearing world price that balances global net trade across all regions. At the country level, the supply and demand of each commodity adjust according to price movements where the adjustment is regulated by commodity-specific price elasticities of supply and demand, and there can be either a net trade surplus or deficit, which is to be reconciled on the global market through international trade.
The model begins its projections in 2000 and carries forward to 2050. To introduce dynamics, the IMPACT model incorporates exogenously specified trends in the drivers of change for demand and supply. Key exogenous drivers of demand are per capita income and population growth such that per capita demand, endogenously regulated by price and income elasticities, is scaled each year according to projected income and population levels. Exogenous drivers on the supply side represent productivity and efficiency gains in agricultural production, essentially shifting the intercepts of the supply curves over time. In contrast, supply changes in response to price changes are treated endogenously in the model using supply functions, which embed price elasticities. In this study, exogenous trends are the only determinants of supply growth in capture fisheries production, while the growth of aquaculture supply is regulated by both endogenous price responses and exogenous trends in production and efficiency surrounding feed and feeding practices [13, 35].
Data and model updateThe latest available FAO historical production data of fisheries and aquaculture from 2000 to 2013 was reviewed and disaggregated into fish species groupings according to the IMPACT fish model used to generate the Fish to 2030 report. Historical data was then compared with model projections to ensure that model solutions replicate observed trends for the 2000–2013 period. This time period effectively serves as a calibration tool for the model parameters and a validation tool for verifying the model’s ability to accurately represent reality. The current updating effort focuses on ASEAN members and the top aquaculture and capture fisheries producing countries in 2013. A total of 18 model regions
were identified: Bangladesh, Cambodia and Laos, Chile, China, India, Indonesia, Japan, Korea, Malaysia, Mexico, Myanmar, the Philippines, Russia, Scandinavia (Denmark, Finland, Norway and Sweden), Singapore, Thailand, the United States and Vietnam. Overall, these countries accounted for 91.6% of global aquaculture production and 66.8% of global capture fisheries production in 2013 and are the primary drivers of underlying global trends with the substantial share of global output (Table 3).
From the supply side, fish production data was compiled by the Statistics and Information Branch, Fisheries and Aquaculture Statistics and Information Branch (FIPS) of the FAO Fisheries and Aquaculture Department [8]. The data series available in the FishStatJ software [8] include primary production by systems (aquaculture and capture), which are highly disaggregated by fish species (over 2000 species or groups of species). The International Standard Statistical Classification of Aquatic Animals and Plants (ISSCAAP) was used to ensure consistency of our fish species groupings of the historical production data from 2011 to 2013 with those disaggregated in the Fish to 2030 report [13].
After validation of production data from 2011 to 2013, fish production growth rates of the ASEAN region and top producer countries worldwide from 2010 to 2015 were calculated using a compound annual growth rate based on three-year moving averages and used to update the model assumptions for the 2010–2015 period. To ensure that the projected trajectory replicated the observed trend between 2000 and 2013, a major effort was made to test, calibrate and review the growth rate to sufficiently match global and ASEAN trends. Calibration was implemented by sequentially and manually fine-tuning model parameters, rather than using an algorithm to calibrate all parameters at once. In this study, all simulations were initiated in the base year of 2000. To evaluate the quality of projections, the model results for aquaculture, capture fisheries and total fish outputs, under the business-as-usual scenario, were compared against the observed production data for 2000–2013 globally and for the ASEAN region. The projected growth rates were extended from 2014 to 2050 using fitted logistic functions.
The final step in the model update was to adjust parameter values so that subsequent model projections were sufficiently close to the historical production data for the calibration period (2000–2013). The results showed that the previous Fish to 2030 model projections closely followed the global fisheries and aquaculture statistics from 2000 to 2009. However,

16
because 2009 was the latest year that had historical data at the time of writing of the Fish to 2030 report, the model projections and the latest historical data start exhibiting discrepancies from 2010 to 2013. In the ASEAN region, aquaculture and capture fisheries growth was underestimated from 2000 to 2013. This provides valid justification for the need to update IMPACT model fish parameters by the team of experts at WorldFish, as this type of exercise requires detailed knowledge of trends and structural changes in the region, industry and policy. Appendix A compares the Fish to 2030 and updated Fish to 2050 projections of global and ASEAN capture and aquaculture production with the actual data over the 2000–2013 period. The updated parameters were calibrated to minimize the difference between the projections and the actual data, even more so than the previous Fish to 2030 projections, both at the global and ASEAN-regional level.
After the calibration to historical trends up to 2013, the production growth rates for capture fisheries and aquaculture were further adjusted by country and fish commodity based on the observed trends and extrapolated from 2014 to 2050. These calibration attempts take into account national fisheries and
Countries Rank Output (thousand tons) Share of world output (%)
Capture Aquaculture Total Capture Aquaculture Total
Bangladesh 9 1,550 1,860 3,410 1.7 2.6 2.1
*Cambodia & Laos 674 198 872 0.7 0.3 0.5
Chile 13 1,771 1,033 2,804 1.9 1.5 1.7
China 1 16,275 43,552 59,827 17.6 62.0 36.7
India 3 4,645 4,550 9,195 5.0 6.5 5.6
Indonesia 2 6,103 3,849 9,952 6.6 5.5 6.1
Japan 8 3,657 609 4,266 3.9 0.9 2.6
Korea 14 1,598 402 2,000 1.7 0.6 1.2
Malaysia 16 1,489 261 1,750 1.6 0.4 1.1
Mexico 15 1,627 169 1,796 1.8 0.2 1.1
Myanmar 6 3,787 929 4,716 4.1 1.3 2.9
Philippines 11 2,335 815 3,150 2.5 1.2 1.9
Russia 7 4,346 155 4,501 4.7 0.2 2.8
Scandinavia 10 2,074 1,248 3,322 2.2 1.8 2.0
Singapore 2 5 7 0.0 0.0 0.0
Thailand 12 1,844 1,057 2,901 2.0 1.5 1.8
United States 4 5,231 441 8,573 5.6 0.6 5.3
Vietnam 5 2,804 3,207 6,011 3.0 4.6 3.7
Total 61,811 64,340 126,151 66.8 91.6 77.5
ASEAN region 19,036 10,322 29,358 20.6 14.7 18.0
World 92,582 70,224 162,806 100.0 100.0 100.0
Table 3. Aquaculture and capture fisheries output among ASEAN members and top producer countries worldwide, 2013.
* Cambodia and Laos are combined into one region in the IMPACT model.Brunei is included in an aggregate region, but not modeled separately in the IMPACT model due to its small agricultural footprint and a lack of data.
aquaculture targets, as well as the biological resource growth potentials and constraints.
A stakeholder consultation workshop was conducted in June 2016 in Penang to collect further data and information as well as expert inputs from individual ASEAN countries. The workshop details are presented in Appendix B. Calibration of the projected aquaculture and capture fisheries in eight ASEAN countries to 2050 is illustrated in Appendixes C and D. A revised projection was made taking into account the inputs and comments from the stakeholder consultation for individual countries at the fish species-level, according to national government targets and a country-level understanding of maximum carrying capacities. For aquaculture production, almost all countries have optimistic expectations of higher output until 2050. The exceptions are Vietnam, Indonesia and Thailand, which remain the same as the original projections (Appendix C). Indonesia, the Philippines and Malaysia expect to increase their capture fisheries production compared to previous model projections, while Vietnam expects lower total output. The remaining countries are consistent with the original projections (Appendix D).

17
Future trends of fish in the ASEAN regionThe business-as-usual scenario in this study is characterized by a set of model parameters that were considered to reflect the past trends that will continue into the future. These trends take into account knowledge from published sources and regional experts, along with feedback from stakeholder consultation on national government targets and the maximum carrying capacity of the sector. They also need to be consistent with the expected changes in the future. These projected results should not be considered as forecasts, but rather as a benchmark for exploring plausible future scenarios on how this sector will evolve until 2050, taking into account assumptions on the biophysical, socioeconomic and technological factors influencing future fish production, consumption and trade at the global and regional level. This paper focuses on the business-as-usual scenario analysis. Further analysis on other alternative scenarios, such as the impact of climate change on capture fisheries and aquaculture production, will be emphasized in a follow-up publication.
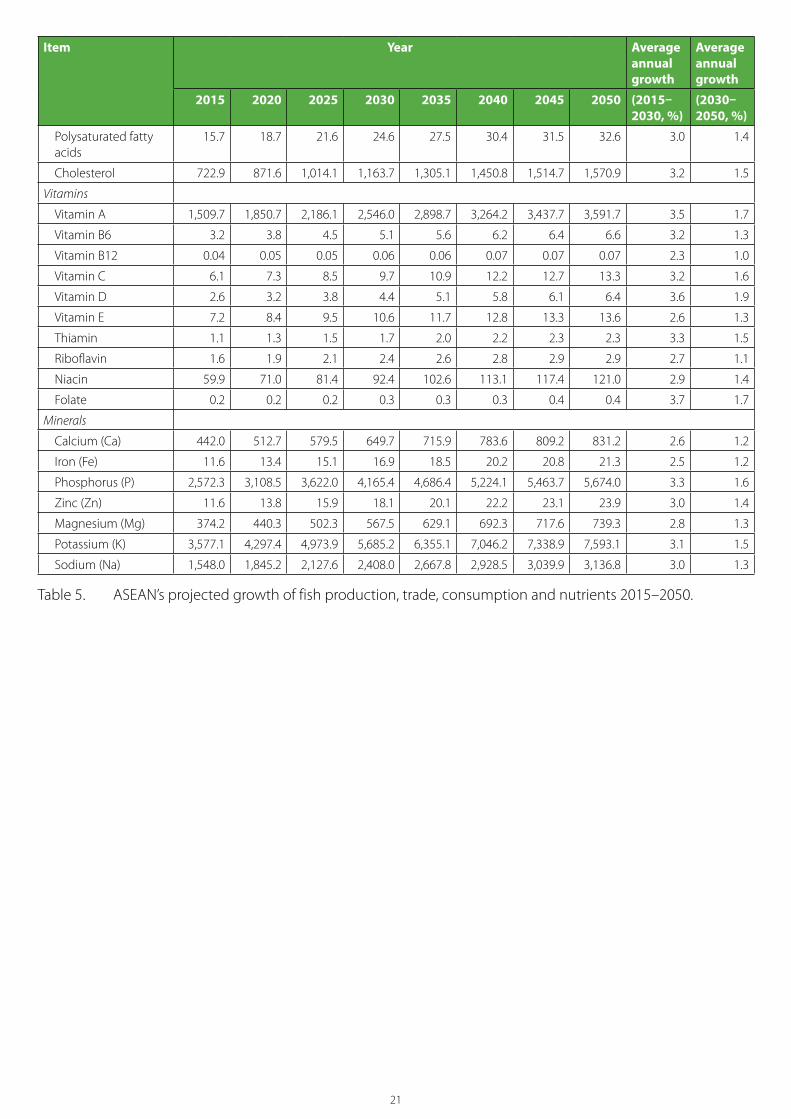
Business-as-usual projectionProductionTable 5 lists the key projections for the business-as-usual scenario of fish production, net trade and consumption in the ASEAN region from 2015 to 2050. The projections describe plausible future trends for the fisheries and aquaculture sectors in the next 35 years. Overall, slower growth is projected for production, consumption and net trade from 2030 to 2050 (second phase) compared with that from 2015 to 2030 (first phase).
Total fish production in the ASEAN region is likely to expand at about 2.9% annually in the first phase and 0.2% annually in the second phase, reaching 54.2 million tons in 2050. The total output of aquaculture is projected to double from 13.3 million tons in 2015 to 26.7 million tons in 2050. This will occur at an
Results
average annual growth rate of 4.2% in the first phase and then slow to 0.5% in the second. The absolute growth is projected to be 14.1 million tons from 2015 to 2050, the majority of which will be from Indonesia (8.6 million tons) and the Philippines (1.8 million tons). On the other hand, capture fisheries production will rise 1.8% annually in the first phase and then remain stagnant at 26.8 million tons from 2030 onwards. Despite the relatively faster rate of expansion of aquaculture, capture fisheries will remain the dominant source of fish supply in the ASEAN region until 2050 when it will approximately equal aquaculture production (Figure 6B), whereas the global production of fisheries and aquaculture will be approximately equal by 2030 (Figure 6A) due to the relative production trends. Nonetheless, the share of aquaculture output in the region will rise from 36% in 2014 to 48% in 2030 and then reach slightly more than half of the total production by 2050 (Figure 7A). The ASEAN region’s share of total global fish supply is estimated to increase from 18.9% in 2015 to 23.8% in 2030 (Table 4). Aquaculture will increase to a sizable share of 22%, while capture fisheries will reach more than a quarter of the global output in 2030. The share is expected to drop slightly for aquaculture, but remain the same for capture fisheries in the second phase of the projection in 2050 (Table 4).
Freshwater species, such as pangasius and other catfish, carp and tilapia, are expected to remain the major sources, by tonnage, of aquaculture output. These three commodity groups, combined, are projected to increase in annual growth from 4.3% to 5.3% in the next 15 years. They represent 62.6% of all aquaculture production in the ASEAN region in 2015 and will continue to increase slightly to 68.9% by 2030 and then gradually decline to 66.2% by 2050. However, high value species such as shrimp are estimated to grow in terms of the share of total tonnage of aquaculture production from 14.8% in 2015 to 16.9% by 2050. In 2015, Indonesia and Vietnam were the top regional farmed shrimp producers, with a 43.2%
Table 4. ASEAN’s share of global production in 2015, 2030 and 2050.
Production Share of global production (%)2015 2030 2050
Aquaculture 16.4 22.0 19.6
Capture fisheries 20.9 25.8 25.8
Total fish 18.9 23.8 22.3

18
and 31.7% share of the total regional farmed shrimp output, respectively. This trend is likely to continue through out the entire projection period.
Among the diverse set of landings in capture fisheries, tuna is expected to have the highest annual growth rate (by tonnage) at 5.8% in the first phase. Tuna and shrimp shares of total landings were 6.5% and 4.3% in 2015. The biggest producer of tuna and shrimp from capture fisheries is Indonesia, which will contribute 2.5 million tons (81%) of tuna production and 2.2 million tons (45%) of shrimp output in 2030. However, the largest share of the fish landings from the “other marine” fish group will experience a reduction in output throughout the first phase, declining 0.3% annually.
ConsumptionAccording to OECD-FAO Agricultural Outlook [9], capture fisheries for human consumption refer to capture production that excludes ornamental fish and fish destined for the production of fishmeal, fish oil and other non-food uses. All aquaculture production is assumed to be destined for human consumption [9]. Figure 6B depicts that approximately 97% of fish in the ASEAN region are projected to be utilized for human consumption during the simulation period. A new milestone was achieved in 2014 when global aquaculture contributed more than half of the fish supply for human consumption. In the ASEAN region, this milestone is expected to be met by 2033. Above all, aquaculture in the region is expected to further increase its share of the total fish supply for human consumption to 52% (27.4 million tons) in 2050 (Figure 7B).
Fish consumption in the ASEAN region is projected to rise from 24.5 million tons in 2015 to 36.9 million tons in 2030 and then reach 47.1 million tons in 2050, while per capita fish consumption is expected to increase from 38.4 kg in 2015 to 51.5 kg in 2030 and then 61.5 kg in 2050. Similar to the production growth trend, per capita fish consumption increases 2.0% annually in the first phase then grows at a slower pace (0.9%) in the second phase (Table 5). In spite of the increased availability of fish for food, the rise of per capita fish consumption will not be uniform among ASEAN countries. The Philippines, Myanmar, Cambodia and Laos are at or below the projected average per capita fish consumption in the region over the simulation period. Throughout the projection period, the region’s population is expected to consume about 50 g of fish oil per person annually, which is more than double the average world per capita consumption of about 22 g.
Estimates of the nutrient composition of consumed portions of different fish species were obtained by connecting IMPACT’s modeled fish with the United States Department of Agriculture (USDA) food composition databases [36]. Higher per capita fish and fish oil consumption suggests that the potential nutrients from fish consumption available to the population are also expected to grow. On a per capita basis, the increase in protein, energy, lipid, vitamin and mineral intake from fish consumption is expected to rise to between 2.3% and 3.6% from 2015 to 2030 and then slightly decline to between 0.6% and 1.4% annually from 2030 to 2050 (Table 5).
Figure 6. Global (A) and ASEAN (B) capture fisheries and aquaculture production (excluding aquatic plants), 1950–2050.
Capture (historical data)
Capture (model)
Capture for human consumption (historical data)
Capture for human consumption (model)
Aquaculture (historical data)
Aquaculture (model)
60
40
20
0
80
100
120
140
1950 20101970 20301990 2050
Mill
ion
tons
A. World
10
5
0
15
20
25
30
1950 20101970 20301990 2050
Mill
ion
tons
B. ASEAN

19
Trade and PricesInternational net trade of fish in the ASEAN region is expected to expand at 3.7% annually from 2015 to 2030 and then decline by 5.4% per year from 2030 to 2050. In addition, net trade of fish is also estimated to rise from 6.3 million tons in 2015 to 11 million tons in 2030 and then to drop to 3.6 million tons in 2050 (Table 4). All aggregate fish species in the model, except salmon and mollusks, are estimated to have surpluses for export throughout the simulation period.
Figure 8 shows the historical (2000–2014) and projected (2015–2050) global aquaculture and capture fisheries prices in real terms. From 2000 to 2014, the global aquaculture price grew faster than capture fisheries (0.9% versus 0.3% per year, respectively) reaching USD 2059 per ton for aquaculture and USD 1463 per ton for capture fisheries. Using an estimation by the FAO Fish Price Index [11], although the real prices of farmed fish are higher than wild species, their prices are likely to increase and may reduce the gap significantly by 2050. The model projects that the real prices of all fish species will increase during the projection period.
Figure 7. Relative shares of capture fisheries and aquaculture in ASEAN fish production (A) and fish consumption (B) in 2014, 2030 and 2050.
AquacultureCapture fisheries
A. ASEAN fish production
B. ASEAN fish consumption
201464%
63%
52% 49%
48%50%
36%
37%
48% 51%
52%50%2014
2030
2030
2050
2050
Historical data source: OECD [9] and FAO [11]
Figure 8. Projected global fish prices in real terms, 2000–2050.
20000
2500
2000
1500
1000
500
2005 2015 2025 2035 20452010 2020 2030 2040 2050
USD
/ton
s
Aquaculture (historical data) Capture (historical data)
Aquaculture (model) Capture (model)
Global Fish Food Prices in Real Terms
Total volume: 30.5 million tons
Total volume: 29.4 million tons
Total volume: 51.6 million tons
Total volume: 50.0 million tons
Total volume: 54.2 million tons
Total volume: 52.7 million tons

20
Item Year Average annual growth
Average annual growth
2015 2020 2025 2030 2035 2040 2045 2050 (2015–2030, %)
(2030–2050, %)
thousand tons
Total fish production 33,298.7 41,662.7 46,918.7 50,313.9 51,287.8 52,032.9 52,592.7 53,301.6 2.8 0.3
Aquaculture production
13,292.6 18,387.7 22,241.8 24,793.1 25,921.4 26,658.3 27,055.0 27,400.2 4.2 0.5
Carp 2,596.6 3,959.1 4,914.1 5,636.8 5,825.0 5,887.4 5,914.8 5,921.5 5.3 0.2
Crustacean 107.5 121.8 127.3 130.6 133.7 136.5 134.0 131.6 1.3 0.0
Major demersals 54.4 67.0 81.0 95.1 109.2 123.6 138.1 152.7 3.8 2.4
Mollusks 480.4 649.2 1,019.2 1,003.0 963.2 986.1 972.4 960.9 5 -0.2
Mullet 10.6 12.4 14.2 16.1 18.3 20.7 23.0 25.5 2.8 2.3
Other carp 84.5 86.6 93.0 96.2 97.2 97.8 98.2 98.5 0.9 0.1
Other freshwater and diadromous
1,879.6 2,014.3 2,003.1 2,078.9 2,339.5 2,573.7 2,710.9 2,838.6 0.7 1.6
Other marine 386.8 436.6 447.8 435.9 437.1 438.0 408.0 426.7 0.8 -0.1
Pangasius and other catfish
3,320.5 4,780.7 5,564.3 6,272.0 6,517.8 6,564.2 6,556.1 6,533.8 4.3 0.2
Shrimp 1,962.8 2,659.6 3,360.7 3,851.8 4,133.5 4,343.4 4,508.2 4,634.9 4.6 0.9
Tilapia 2,409.0 3,600.3 4,617.3 5,176.8 5,346.9 5,486.9 5,591.3 5,675.4 5.2 0.5
Capture production 20,481.1 23,956.7 25,626.9 26,757.5 26,770.7 26,791.9 26,751.1 26,767.8 1.8 0.0
Shrimp 890.0 945.3 977.9 1,002.3 1,002.3 1,002.3 1,001.6 1,001.1 0.8 0.0
Crustacean 303.2 365.4 430.0 495.6 495.2 494.9 494.7 494.5 3.3 0.0
Mollusks 1,351.0 1,456.9 1,511.9 1,550.6 1,548.4 1,548.1 1,548.3 1,548.7 0.9 0.0
Major demersals 2,245.1 3,705.9 4,099.4 4,337.8 4,348.7 4,355.5 4,362.9 4,369.4 4.5 0.0
Tuna 1,327.2 2,195.0 2,755.1 3,076.3 3,062.3 3,058.1 3,056.9 3,056.5 5.8 0.0
Cobia and swordfish 17.1 18.1 19.2 20.5 20.5 20.5 20.5 20.5 1.2 0.0
Eel and sturgeon 6.4 7.3 8.3 9.6 9.6 9.6 9.7 9.7 2.8 0.1
Tilapia 129.5 144.0 155.8 167.7 169.4 170.9 172.3 173.6 1.7 0.2
Pangasius and other catfish
124.6 163.0 178.4 184.5 183.1 182.7 182.6 182.6 2.6 -0.1
Carp 24.1 26.8 28.2 29.1 29.2 29.2 29.3 29.3 1.3 0.0
Mullet 82.0 99.3 106.8 111.0 110.2 109.8 109.6 109.4 2.0 -0.1
Other freshwater and diadromous
3,060.1 3,168.6 3,221.7 3,255.7 3,263.4 3,269.2 3,273.7 3,277.1 0.4 0.0
Other pelagics 4,652.5 5,534.7 6,116.0 6,555.2 6,555.1 6,554.9 6,533.9 6,534.1 2.3 0.0
Other marine 6,268.1 6,126.5 6,018.1 5,961.7 5,973.3 5,986.1 5,955.3 5,961.5 -0.3 0.0
Shrimp 890.0 945.3 977.9 1,002.3 1,002.3 1,002.3 1,001.6 1,001.1 0.8 0.0
Net Trade 6,348.2 10,173.3 11,463.7 10,982.6 8,341.0 5,793.6 4,426.1 3,648.9 3.7 -5.4
kilogram/person/year
Per capita consumption
38.4 43.1 47.3 51.5 55.5 58.9 60.5 61.5 2.0 0.9
Nutrients from fish consumption milligram/person/day
Protein 198.8 238.8 276.7 316.8 354.8 394.1 411.0 425.8 3.2 1.5
Energy, Kcal 1,403.4 1,679.6 1,942.7 2,221.1 2,485.4 2,758.1 2,874.7 2,976.4 3.1 1.5
Total lipid (fat) 60.4 71.9 82.9 94.7 105.9 117.4 122.3 126.5 3.0 1.5
Lipids
Saturated fatty acids 13.7 16.2 18.6 21.3 23.8 26.4 27.5 28.5 3.0 1.5
Monosaturated fatty acids
22.4 26.7 31.0 35.5 39.8 44.3 46.3 48.0 3.1 1.5
21
Table 5. ASEAN’s projected growth of fish production, trade, consumption and nutrients 2015–2050.
Item Year Average annual growth
Average annual growth
2015 2020 2025 2030 2035 2040 2045 2050 (2015–2030, %)
(2030–2050, %)
Polysaturated fatty acids
15.7 18.7 21.6 24.6 27.5 30.4 31.5 32.6 3.0 1.4
Cholesterol 722.9 871.6 1,014.1 1,163.7 1,305.1 1,450.8 1,514.7 1,570.9 3.2 1.5
Vitamins
Vitamin A 1,509.7 1,850.7 2,186.1 2,546.0 2,898.7 3,264.2 3,437.7 3,591.7 3.5 1.7
Vitamin B6 3.2 3.8 4.5 5.1 5.6 6.2 6.4 6.6 3.2 1.3
Vitamin B12 0.04 0.05 0.05 0.06 0.06 0.07 0.07 0.07 2.3 1.0
Vitamin C 6.1 7.3 8.5 9.7 10.9 12.2 12.7 13.3 3.2 1.6
Vitamin D 2.6 3.2 3.8 4.4 5.1 5.8 6.1 6.4 3.6 1.9
Vitamin E 7.2 8.4 9.5 10.6 11.7 12.8 13.3 13.6 2.6 1.3
Thiamin 1.1 1.3 1.5 1.7 2.0 2.2 2.3 2.3 3.3 1.5
Riboflavin 1.6 1.9 2.1 2.4 2.6 2.8 2.9 2.9 2.7 1.1
Niacin 59.9 71.0 81.4 92.4 102.6 113.1 117.4 121.0 2.9 1.4
Folate 0.2 0.2 0.2 0.3 0.3 0.3 0.4 0.4 3.7 1.7
Minerals
Calcium (Ca) 442.0 512.7 579.5 649.7 715.9 783.6 809.2 831.2 2.6 1.2
Iron (Fe) 11.6 13.4 15.1 16.9 18.5 20.2 20.8 21.3 2.5 1.2
Phosphorus (P) 2,572.3 3,108.5 3,622.0 4,165.4 4,686.4 5,224.1 5,463.7 5,674.0 3.3 1.6
Zinc (Zn) 11.6 13.8 15.9 18.1 20.1 22.2 23.1 23.9 3.0 1.4
Magnesium (Mg) 374.2 440.3 502.3 567.5 629.1 692.3 717.6 739.3 2.8 1.3
Potassium (K) 3,577.1 4,297.4 4,973.9 5,685.2 6,355.1 7,046.2 7,338.9 7,593.1 3.1 1.5
Sodium (Na) 1,548.0 1,845.2 2,127.6 2,408.0 2,667.8 2,928.5 3,039.9 3,136.8 3.0 1.3

22
Discussion
Model projections are results of complex interactions among commodity groups and countries across the regions. Under the business-as-usual scenario, several salient findings are projected. Fish production in the ASEAN region will likely grow faster than the regional population growth. Consequently, people in the region will benefit from fish food and nutrition via increasing per capita fish consumption. In absolute volume, fish production in the ASEAN region is projected to grow and reach nearly a quarter share of the global fish output, by tonnage, in 2030 and will remain at that level until 2050. Per capita fish consumption in the region will likely have tripled from 1980 to 2030, while regional net trade will continue to increase in the first phase of the projection period (2015–2030) but will slowdown in the second phase (2030–2050). It is noted that real prices of wild fish will grow slightly faster than farmed fish.
In past trends, ASEAN countries showed an exceptionally high growth of 7% in aquaculture production over the previous five decades. This growth was from both extensive and intensive production systems [37]. The presence of strong institutional networks in the region have also played an important role in supporting the development of the aquaculture sector. These include the Network of Aquaculture Centers in the Asia-Pacific (NACA), the Southeast Asian Fisheries Development Center (SEAFDEC), the Asian Institute of Technology (AIT) and CGIAR’s WorldFish [38]. In the next four decades, aquaculture production will continue to be one of the fastest-growing animal-based food sectors of the ASEAN region’s economy with a projected growth rate of 2%. Aquaculture is likely to supply more than half of the fish consumed in the region in the coming decade. Pangasius and other catfish, carp and tilapia are projected to remain the major sources of aquaculture output. Capital investment is needed to advance aquaculture technologies to improve efficiency gains and reduce production costs that will increase the competitiveness of farming operations. Relative sluggishness from 2030 to 2050 is projected because of several principal constraints: fish farming in the region reaching near maximum carrying capacity, limited access to quality freshwater, limited availability of quality fish seeds and feeds, competition for land use, fish price volatility, challenges of regional governance and regulation, environmental degradation and climate change.
At the global level, capture fisheries are projected to be stagnant at about 103 million tons annually to 2030. Our analysis showed that ASEAN capture fisheries are still growing (3% annually from 1976 to 2014). This is supported by the fact that coastal waters in the region are among the most productive and biologically diverse in the world [39, 40], although they are significantly at risk from climate change [41]. Capture fisheries are projected to increase 2% annually from 2015 but will likely remain stagnant after 2030. Several factors influence capture fisheries growth in the region, including expansion of the geographical range of fishing activities and an increase in the overall biomass of the fisheries as a result of overfishing long-lived, larger species, benefiting smaller, short-lived species [39]. Capture fisheries are projected to continue to be the dominant source of fish supply in the ASEAN region through to 2050. However, there is a critical role for improved capture fisheries management and governance to sustain fish supply. Rapid population growth and surging food demand are creating tremendous stress on coastal and inshore fishery resources in the region [39]. Fish stocks there are under threat from over depletion due, in part, to overfishing and overcapacity [39, 42-44]. Weak marine governance, socioeconomic uncertainties and ecosystem change can add further uncertainties, which negatively impact future trends of ASEAN capture fisheries. In response to the compelling challenges and emerging issues, existing regional fisheries institutions such as SEAFDEC, the Coral Triangle Initiative on Coral Reefs, Fisheries and Food Security (CTI-CFF), the Illegal, Unregulated, and Unreported Regional Plan of Action (RPOA-IUU), the Asia-Pacific Fishery Commission (APFIC) and Partnerships in the Environmental Management for the Seas of East Asia (PEMSEA) are facing significant workloads to support fisheries management [39]. These efforts need to be strengthened and connected to science- and evidence-based policy analyses for improved management.
On the demand side, per capita consumption in the ASEAN region has doubled from 1980 to 2013 and will likely triple by 2030. While fish is relatively expensive compared to other food commodities, income elasticities of demand for fish are generally high, which indicate that seafood is highly preferred [13, 45]. As a consequence, rising incomes across the region induce a notable increase of fish consumption. The trend of migration to urban areas is projected to increase rapidly in the region by 2050 with the urban

23
population projected to surpass the rural population by 2020 [1]. Urbanization will contribute to higher fish consumption because it offers a bigger and more comprehensive market, offering a wider choice for consumers and incentives for producers to supply a dense population that can no longer grow food of its own. Consumer food preferences also seem to be shifting from meat toward fish because of the benefits of fish for human nutrition and health, which are well documented [46-51]. Compared to most terrestrial meats, fish has a higher protein content, is leaner on an edible fresh weight basis, has a higher concentration of omega-3 fatty acids and is a richer source of most essential minerals and key water soluble and fat soluble vitamins [32, 36]. Projected higher per capita fish and fish oil consumption will lead to increased nutrition benefits for the ASEAN region.
Fish trade will become a more prominent source of foreign exchange earnings for the ASEAN region. Regional fish and fishery products will continue to be heavily traded in the future, fueled by higher consumption of fish, the removal of regional tariffs and quotas [39], globalization of the food system and improvement in long distance refrigerated transport and large-scale shipments. After a slow but gradual economic recovery from the global economy crisis in 2008, fish exports in the ASEAN region have been revitalized. Currently, Vietnam and Thailand are two of the top five fish exporters globally. By tonnage, shrimp, tuna, catfish and various forms of marine fish are important export species [52]. As the region’s population continues to grow and incomes catch up with more developed regions, fish exports may decrease in the second phase of the projections (2030–2050) to meet the domestic demand. Import substitution and the desire to save on foreign exchange are rationales to motivate ASEAN national governments to support aquaculture expansion. In addition, with the development of export-oriented aquaculture, especially in Indonesia and Vietnam, fish surplus in the region will likely be sustained in the near future. Even if exports of seafood do taper off in the later decades, as indicated in the projections, the strong scientific and technological base that spurred the growth of the aquaculture sector might offer an opportunity to export technical know-how and afford investment opportunities for Southeast Asian companies in other regions in the world. On the other hand, due to the pivotal role of aquaculture production, unless cost-effective alternatives to fishmeal and fish oil can be found [53], ASEAN countries, particularly Vietnam and the Philippines, will remain net importers of both until 2050.
During the recent global food price spikes, fish prices grew at a relatively moderate pace to record highs [11, 54]. They were less volatile than those of cereals, dairy and oils, and were thus more competitive than meat. In addition, fish prices are not expected to revert to lower levels from the projections, but will continue to rise as a result of population growth, increased demand and supply constraints. Although aquaculture will help to minimize the gap by stabilizing fish supply, the price of some farmed species tends to be higher than that of capture fisheries, which is comprised of a great volume of small, low-value capture species. Farming herbivorous fish, such as carps in Myanmar (about the same price as small pelagic fish), and milkfish in Indonesia and the Philippines, needs continued emphasis to maintain accessibility to relatively affordable fish products in the region. Both capture fisheries and aquaculture have specific susceptibilities to production volatility from stock fluctuations in fishing and the risk of disease outbreak in aquaculture, but these do not often occur simultaneously. Both sectors have highly complementary roles in ensuring that fish becomes available and affordable to poor consumers in the ASEAN region.
While the fish sector’s contribution to regional economic growth has been prioritized, the challenges of environmental degradation, such as mangrove depletion, declining water quality and disease in farmed fish, will provoke tensions between the efforts for sustainable economic growth and ecosystem protection [55, 56]. Furthermore, climate change, variability and extreme weather events are compounding threats to the sustainability of capture fisheries and aquaculture development in marine, brackish and freshwater environments in the region [57]. Climate change will have serious consequences for fishers and fish farmers. Governments’ preparedness to mitigate climate change risks and impacts requires a thorough understanding of the sector’s vulnerability at the local and national levels. Of the 10 countries worldwide most vulnerable to climate change (in terms of the number of people likely to be affected), four are in the ASEAN region: Vietnam, Cambodia, Thailand and the Philippines [41]. Vietnam is already taking action to select a salinity-tolerant catfish strain to mitigate the climate change risks in the aquaculture sector [58]. Aquaculture in the ASEAN region is dominated by small-scale producers. A strong focus should be on building general adaptive capacity that supports poor and small-scale aquaculture producers and value chain actors to make the most of new opportunities and cope with the challenges related to adverse climate change impacts [59].
24
Capture fisheries and aquaculture in the ASEAN region are important, therefore policies and priorities should be balanced for maximizing sustainable growth and benefits of both sectors. Various stakeholders, including governments, private sector, consumers, nongovernmental organizations (NGOs) and donor agencies, need to foster cooperation to strengthen strategic partnerships for implementing effective management for sustained growth while mitigating potential impacts on biodiversity and natural resources in the region. Policies to promote sustainable and climate-adaptable aquaculture are crucial and should focus on alternatives such as improved feed and seed production, reduced dependence on imported fishmeal and fish oil, increased investment in durable infrastructure, and strategies to adapt and mitigate climate change impacts [19]. On the other hand, governance in the fisheries sector requires greater adherence to, and enforcement of, existing laws to combat illegal, unreported and unregulated (IUU) fishing activities. There is also a need to increase the understanding of the environmental constraints and options for the various modeled growth scenarios, such as in recent research in Indonesia [56, 60].
Modeling work for generating an evidence base for decision-making is also crucial. While the IMPACT fish model has been greatly improved so that it can generate reasonable fish sector projections at both global and regional levels, the current setup suffers some limitations in terms of data and model structure. Available data is inconsistent and the lack of trade data at the desirable species classification leads to the inability to analyze bilateral trade flows, which makes analysis of specific trade policy difficult without complementary work. Global markets with homogenized commodities is a necessary simplifying assumption that might be more contentious in the seafood market than, for example, in the cereal, meal or oil markets, where products are commoditized to a larger degree. On the other hand, the sheer number of different fish species being caught and farmed requires some form of simplification to be modeled at all. Other potential issues to address in the modeling framework include dealing with climate change and environmental stresses more explicitly, updating the underlying database with the latest available data and embedding the ability to develop new and alternative fisheries where they might not have previously been considered.
The benefits of the structural modeling approach, such as with the IMPACT model, are manifold. Larger-scale modeling work enforces discipline on inconsistent data, either in the form of requiring the maintenance
of basic physical balances or by applying simple laws of economics (supply equals demand, global exports equal global imports, etc.). The modeling efforts expose data inconsistencies that would not become obvious in narrowly focused analyses. The model also exposes important data gaps and identifies the areas where improved data collection is needed. Fisheries and aquaculture are a relatively new realm of analysis using these types of foresight modeling tools, but further refinement will greatly improve their applicability for policymaking. Examples of the successful use of partial-equilibrium models for policy analysis can be found in the IMPACT model’s past, as well as with other modeling systems (GLOBIOM, AgLINK-COSIMO, and CAPRI). For future efforts, it is important to advance fish foresight modeling to position fish into global and regional food systems while paying attention to national and subnational foresight modeling needs. This will help national partners in improving fish sector planning, priority setting and policy interventions.

25
Conclusions
Both aquaculture and capture fisheries production in the ASEAN region will continue to grow. Capture fisheries will remain the dominant fish supply by 2050, and aquaculture will supply more than half of fish consumed in the coming decade. Recognizing the interactions of the growth of both sectors with the regional socioeconomic development of coastal and rural communities, as well as the contribution to
food nutrition and security and the implications for environmental sustainability, the focus of regional policies should not only be to promote aquaculture expansion, but also to strengthen regional fisheries governance and management. Future effort to enhance national data sharing and improve model structure development will provide a better foresight modeling tool for fish sector policy formulations.
ASEAN workshop group in Penang.
Phot
o cr
edit:
Chi
n H
ooi B
ing/
Wor
ldFi
sh
25

26
1. [UN] United Nations. 2015. Department of Economic and Social Affairs, Population Division. World population prospects: The 2015 revision, key findings and advance tables. ESA/P/WP.241. Accessed 28 June 2016. https://esa.un.org/unpd/wpp/Publications/Files/WPP2015_Methodology.pdf
2. Godfray HC, Beddington JR, Crute IR, Haddad L, Lawrence D, Muir JF, Pretty J, Robinson S, Thomas SM and Toulmin C. 2010. Food security: The challenge of feeding 9 billion people. Science 327:812–18.
3. Pretty J, Sutherland WJ, Ashby J, Auburn J, Baulcombe D, Bell M, Bentley J, Bickersteth S, Brown L, Burke J, et al. 2010. The top 100 questions of importance to the future of global agriculture. International Journal of Agricultural Sustainability 8:219–36.
4. [FAO] Food and Agriculture Organization. 2015. Statistical pocketbook: World food and agriculture. Rome: FAO. Accessed 28 June 2016. http://www.fao.org/3/a-i4691e.pdf
5. [FAO] Food and Agriculture Organization. 2015. FAOSTAT statistics database. Food balance sheets. Updated June 2016. http://faostat3.fao.org/home/E
6. Naylor RL. 2016. Oil crops, aquaculture, and the rising role of demand: A fresh perspective on food security. In press. Global Food Security.
7. [FAO] Food and Agriculture Organization. 2016. The state of world fisheries and aquaculture 2016: Contributing to food security and nutrition for all. Rome: FAO. Accessed 28 June 2016. http://www.fao.org/3/a-i5555e.pdf
8. FishStatJ. 2016. Database and software for fishery statistical analysis. United Nations FAO. Accessed 28 June 2016. http://www.fao.org/fishery/statistics/software/fishstatj/en
9. [OECD/FAO] Organisation for Economic Co-operation and Development, and Food and Agriculture Organization. 2015. OECD-FAO agricultural outlook 2015. Paris: OECD Publishing. Accessed 28 June 2016. http://dx.doi.org/10.1787/agr_outlook-2015-en
10. Kawarazuka N and Béné C. 2011. The potential role of small fish species in improving micronutrient deficiencies in developing countries: Building evidence. Public Health Nutrition 14:1927–38.
11. Tveterås S, Asche F, Bellemare MF, Smith MD, Guttormsen AG, Lem A, Lien K and Vannucchi S. 2012. Fish is food: The FAO’s fish price index. PLoS ONE 7: e36731.
12. World Bank. 2011. The global program on fisheries: Strategic vision for fisheries and aquaculture. Washington, DC: World Bank. Accessed 29 November 2016. http://documents.worldbank.org/curated/en/890791468315322576/The-global-program-on-fisheries-strategic-vision-for-fisheries-and-aquaculture
13. World Bank. 2013. Fish to 2030: Prospect for fisheries and aquaculture. Washington, DC: World Bank. Accessed 28 June 2016. http://www.fao.org/docrep/019/i3640e/i3640e.pdf
14. ASEAN statistics. Accessed December 2015. http://www.asean.org/resources/category/asean-resources-kit
15. Cheung WWL, Lam VWY, Sarmiento JL, Kearney K, Watson REG, Zeller D and Pauly D. 2010. Large-scale redistribution of maximum fisheries catch potential in the global ocean under climate change. Global Change Biology 16:24–35.
References

27
16. Heenan A, Pomeroy R, Bell J, Munday PL, Cheung W, Logan C, Brainard R, Yang Amri A, Aliño P, Armada N et al. 2015. A climate-informed, ecosystem approach to fisheries management. Marine Policy 57:182–92.
17. Keskinen M, Chinvanno S, Kummu M, Nuorteva P, Snidvongs A, Varis O and Västilä K. 2010. Climate change and water resources in the Lower Mekong River Basin: Putting adaptation into the context. Journal of Water and Climate Change 1:103–17.
18. Lassa JA, Lai AYH and Goh T. 2016. Climate extremes: An observation and projection of its impacts on food production in ASEAN. Natural Hazards 84 (supplement 1):19–33.
19. Hishamunda N, Bueno P and Yap WG. 2009. Analysis of aquaculture development in Southeast Asia: A policy perspective. FAO Fisheries and Aquaculture Technical Paper. No. 509, Rome. Accessed 28 June 2016. http://www.fao.org/docrep/012/i0950e/i0950e00.pdf
20. Hishamunda N, Ridler NB, Bueno P and Yap WG. 2009. Commercial aquaculture in Southeast Asia: Some policy lessons. Food Policy 34:102–07.
21. World Food Summit. 1996. Rome declaration on world food security. Rome: World Food Summit. Accessed 28 June 2016. www.fao.org/docrep/003/w3613e/w3613e00.htm
22. [FAO] Food and Agriculture Organization. 2015. The state of food insecurity in the world. Meeting the 2015 international hunger targets: Taking stock of uneven progress. Rome: FAO. Accessed 28 June 2016. http://www.fao.org/3/a-i4646e.pdf
23. Dans A, Ng N, Varghese C, Tai ES, Firestone R and Bonita R. 2011. The rise of chronic non-communicable diseases in southeast Asia: Time for action. Lancet 377:680–89.
24. Tahlil T, ed. 2016. Food issues facing new and emerging economics of Southeast Asia. In Caraher M and Coveney J, eds. Food Poverty and Insecurity: International Food Inequalities. Switzerland: Springer International Publishing. 19-27.
25. [FAO] Food and Agriculture Organization. 2015. FAOSTAT statistics database. Food security sheets. Updated June 2016. http://faostat3.fao.org/download/D/FS/E
26. Silfvast S, ed. 2015. Food security as a driver of regional integration in ASEAN. In Philomena M and Louis B, eds. Drivers of Integration and Regionalism in Europe and Asia. London and New York: Routledge. 164-177
27. Belton B and Thilsted SH. 2014. Fisheries in transition: Food and nutrition security implications for the global South. Global Food Security 3:59–66.
28. World Bank. 2006. Aquaculture: Changing the face of the waters: Meeting the promise and challenge of sustainable aquaculture. Washington, DC. Accessed 28 June 2016. http://documents.worldbank.org/curated/en/322181468157766884/pdf/416940PAPER0Fa18082137015501PUBLIC1.pdf
29. Béné C, Barange M, Subasinghe R, Pinstrup-Andersen P, Merino G, Hemre GI and Williams M. 2015. Feeding 9 billion by 2050 – Putting fish back on the menu. Food Security 7:261–74.
30. Karapanagiotidis IT, Yakupitiyage A, Little DC, Bell MV and Mente E. 2010. The nutritional value of lipids in various tropical aquatic animals from rice-fish farming systems in northeast Thailand. Journal of Food Composition and Analysis 23:1–8.
31. Roos N, Chamnan C, Loeung D, Jakobsen J and Thilsted SH. 2007. Freshwater fish as a dietary source of vitamin A in Cambodia. Food Chemistry 103:1104–11.

28
32. Tacon AGJ and Metian M. 2013. Fish matters: Importance of aquatic foods in human nutrition and global food supply. Reviews in Fisheries Science 21:22–38.
33. Delgado CL, Wada N, Rosegrant MW, Meijer S and Ahmed M. 2003. Fish to 2020: Supply and demand in changing global markets. WorldFish Center Technical Report, 62. Washington, DC: International Food Policy Research Institute.
34. Rosegrant MW, Paisner MS, Meijer S and Witcover J. 2001. Global food projections to 2020: Emerging trends and alternative futures. Washington, DC: International Food Policy Research Institute.
35. Kobayashi M, Msangi S, Batka M, Vannuccini S, Dey MM and Anderson, JL. 2015. Fish to 2030: The role and opportunity for aquaculture. Aquaculture Economics & Management 19:282–300.
36. United States Department of Agriculture. 2016. National nutrient database for standard reference. Accessed 13 July 2016. http://ndb.nal.usda.gov/
37. Edwards P. 2015. Aquaculture environment interactions: Past, present and likely future trends. Aquaculture 447:2–14.
38. Msangi S and Batka M. 2015. The rise of aquaculture: The role of fish in global food security. In Global Food Policy Report, 12. Accessed 29 November 2016. https://www.ifpri.org/sites/default/files/gfpr/2015/feature_3087.html
39. Pomeroy R, Parks J, Courtney K and Mattich N. 2016. Improving marine fisheries management in Southeast Asia: Results of a regional fisheries stakeholder analysis. Marine Policy 65:20–29.
40. Pomeroy R. 2013. Marine fisheries in crisis: Improving fisheries management in Southeast Asia. In Hathaway R and Mills M, eds. New Security Challenges in Asia. Washington, DC: Woodrow Wilson Center Press.
41. Handisyde NT, Ross LG, Badjeck MC and Allison EH. 2006. The effects of climate change on world aquaculture: A global perspective. Final Technical Report. Stirling, U.K.: Stirling Institute of Aquaculture, 151. Accessed 29 November 2016. http://www.ecasa.org.uk/Documents/Handisydeetal_000.pdf
42. [FAO] Food and Agriculture Organization. 2012. The state of world fisheries and aquaculture: Opportunities and challenges. Rome: FAO. Accessed 28 June 2016. http://www.fao.org/docrep/016/i2727e/i2727e.pdf
43. Pomeroy RS. 2012. Managing overcapacity in small-scale fisheries in Southeast Asia. Marine Policy 36:520–27.
44. Stobutzki IC, Silvestre GT and Garces LR. 2006. Key issues in coastal fisheries in South and Southeast Asia, outcomes of a regional initiative. Fisheries Research 78:109–18.
45. Byerlee D, Falcon WP and Naylor RL. 2016. The Tropical Oil Crops Revolution: Food, Feed, Fuel, and Forests. Oxford: Oxford University Press.
46. Smith JD, Hou T, Ludwig DS, Rimm EB, Willett W, Hu FB and Mozaffarian D. 2015. Changes in intake of protein foods, carbohydrate amount and quality, and long-term weight change: Results from 3 prospective cohorts. American Journal of Clinical Nutrition 101:1216–24.
47. Zhao LG, Sun JW, Yang Y, Ma X, Wang YY and Xiang YB. 2016. Fish consumption and all-cause mortality: A meta-analysis of cohort studies. European Journal of Clinical Nutrition 70:155–61.
48. Mozaffarian D and Rimm EB. 2006. Fish intake, contaminants, and human health: Evaluating the risks and the benefits. JAMA 296:1885–99.

29
49. Lim SS, Vos T, Flaxman AD, Danaei G, Shibuya K, Adair-Rohani H et al. 2012. A comparative risk assessment of burden of disease and injury attributable to 67 risk factors and risk factor clusters in 21 regions, 1990-2010: A systematic analysis for the Global Burden of Disease Study 2010. Lancet 380:2224–60.
50. Ezzati M and Riboli E. 2013. Behavioral and dietary risk factors for noncommunicable diseases. New England Journal of Medicine 369:954–64.
51. Thilsted SH, Thorne-Lyman A, Webb P, Bogard JR, Subasinghe R, Phillips MJ and Allison EH. 2016. Sustaining healthy diets: The role of capture fisheries and aquaculture for improving nutrition in the post-2015 era. Food Policy 61:126–31.
52. Marschke M, ed. 2016. Fisheries transition in Southeast Asia. In Natural resource management for sustainable growth. Singapore: RSIS Centre for NTS Studies. Accessed 29 November 2016. https://www.rsis.edu.sg/wp-content/uploads/2016/04/RSIS_Balanced-Growth-content_web.pdf
53. Glencross B, Irvin S, Arnold S, Blyth D, Bourne N and Preston N. 2014. Effective use of microbial biomass products to facilitate the complete replacement of fishery resources in diets for the black tiger shrimp, Penaeus monodon. Aquaculture 431:12–19.
54. Troell M, Naylor RL, Metian M, Beveridge M, Tyedmers PH, Folke C, Arrow KJ, Barrett S, Crepin AS, Ehrlich PR et al. 2014. Does aquaculture add resilience to the global food system? Proceedings of the National Academy of Sciences, USA 111:13257–63.
55. Bala BK and Hossain MA. 2009. Modeling of food security and ecological footprint of coastal zone of Bangladesh. Environment, Development and Sustainability 12:511–29.
56. Tran N, Rodriguez UP, Chan CY, Phillips MJ, Mohan CV, Henriksson PJG, Koeshendrajana S, Suri S and Hall S. 2017. Indonesian aquaculture futures: An analysis of fish supply and demand in Indonesia to 2030 and role of aquaculture using the AsiaFish Model. Marine Policy (accepted).
57. [FAO] Food and Agriculture Organization. 2016. Climate change and food security: Risks and responses. Rome: FAO. Accessed June 28 2016. http://www.fao.org/3/a-i5188e.pdf
58. Nguyen AL, Dang VH, Bosma RH, Verreth JA, Leemans R and De Silva SS. 2014. Simulated impacts of climate change on current farming locations of striped catfish (Pangasianodon hypophthalmus; Sauvage) in the Mekong Delta, Vietnam. Ambio 43:1059–68.
59. Phillips MJ, Subasinghe R, Tran N, Kassam L and Chan CY. 2016. Aquaculture big numbes. FAO Fisheries and Aquaculture Technical Paper No 601. Rome: FAO. Accessed 29 November 2016. http://www.fao.org/3/a-i6317e.pdf
60. Phillips MJ, Henriksson PJG, Tran N, Chan CY, Mohan CV, Rodriguez UP, Suri S, Hall S and Koeshendrajana S. 2015. Exploring Indonesian aquaculture futures. Penang, Malaysia: WorldFish Program Report 2015-39. Accessed 28 June 2016. http://pubs.iclarm.net/resource_centre/2015-39.pdf

30
Appendix A. Improvement of model calibration for historical trends
2000 20082004 2012
Mill
ion
tons
A. World
0
40
20
60
90
10
50
80
30
70
100
2000 20082004 2012
Mill
ion
tons
B. ASEAN
0
8
4
12
18
2
10
16
6
14
20
Data capture
Projected capture (Fish to 2050)
Projected capture (Fish to 2030)
Data aquaculture
Projected aquaculture (Fish to 2050)
Projected aquaculture (Fish to 2030)

31
To address future challenges, as well as improve priority setting and decision-making, there are increasing interests in food commodity foresight modeling and projections from policy-oriented researchers and national policymakers. Understanding the dynamics of fish production, consumption, trade, prices and their implications on food and nutrition security are critical to support policy and decision-making for ensuring sustained fish production growth while minimizing unexpected socioeconomic and environmental impacts. Nevertheless, fish commodities are commonly excluded in agriculture projection models. The IMPACT model is among a few taking into account fish projection at the disaggregated level. The Fish to 2030 report in 2013 was the effort of a collaboration between the World Bank, IFPRI, the Fisheries and Aquaculture Department of the FAO and the University of Arkansas at Pine Bluff. This report built on the foundation of the Fish to 2020 report conducted by IFPRI and WorldFish in 2003. These comprehensive global overview reports highlighted challenges, opportunities and roles that fisheries and aquaculture will play to meet the increasing global fish demand in the future.
As a research activity of the Global Futures and Strategic Foresight project, the IMPACT fish model was delivered to the WorldFish foresight modeling team in 2015. This is an interim step for the development of a full fish module linking to the updated version of IMPACT version 3. An updating effort was completed from the current dataset and parameters of the IMPACT fish model. The update focused on the ASEAN region and the top 10 aquaculture and capture fisheries producer countries. A stakeholder consultation workshop at WorldFish in June 2016 focused on improving the model calibration from the previous Fish to 2030 report, with respect to industry-specific biophysical and socioeconomic factors, such as environmental and ecosystem carrying capacity and socioeconomic targets defined by national governments, among other dimensions in the ASEAN region.
The specific objectives of the stakeholder consultation workshop were to• validate business-as-usual results of the region’s fish supply and demand to 2050; • explore maximum potentials/carrying capacity for fisheries and aquaculture among ASEAN countries; • identify government targets/plans for fisheries and aquaculture in the ASEAN region;• explore plausible futures of fisheries and aquaculture in the region by suggesting alternative scenarios.
The consultation brought together 20 specialists from 10 different countries (Australia, Bangladesh, Cambodia, Indonesia, Malaysia, Myanmar*, Philippines, Thailand, United States and Vietnam) from academia, government and NGOs representing a diverse range of expertise covering fisheries, aquaculture, trade and economics. The participants brought diverse experiences to explore the maximum carrying capacity and national government targets, as well as to the scenario setting and future visioning process.
*Myanmar’s participant was absent during the workshop but attended the scenario meeting to provide input on 4–5 July 2016 in WorldFish, Penang.
Appendix B. Stakeholder consultation workshop

32
List of workshop participantsNo Name Affiliation Organization country Organization name
1 Benoy Kumar Barman Senior Scientist Bangladesh WorldFish Bangladesh office
2 Olivier Joffre Visiting Scientist Cambodia WorldFish Mekong Office
3 So Nam Fisheries Team Leader Cambodia Mekong River Commission Secretariat (MRCS)
4 Dedi Adhuri Guest Lecturer Indonesia University of Diponegoro
5 Sonny Koeshendrajana Professor Indonesia Ministry of Marine Affairs and Fisheries (MMAF)
6 Zulkafli bin Abd. Rashid Deputy Director General of Fisheries
Malaysia Department of Fisheries, Malaysia
7 Haji Mazuki bin Hashim Director of Aquaculture Development Section
Malaysia Department of Fisheries, Malaysia
8 Zaki bin Haji Mokri Head of Fisheries Data Collection Planning and Development Division
Malaysia Department of Fisheries, Malaysia
9 Sallehudin Bin Jamon Research Officer Malaysia Fisheries Research Institute Kampung Acheh
10 Khin Maung Soe Consultant Myanmar WorldFish Myanmar office
11 Len Garces Fisheries Management Specialist
Philippines USAID Oceans: The Oceans and Fisheries Partnership
12 Paul Ramirez Research Fellow Philippines WorldFish Philippines office
13 U-Primo E. Rodriguez Professor Philippines University of The Philippines Los Baños
14 Ayut Nissapa Associate Professor Thailand Prince of Songkla University Hat Yai
15 Pongpat Boonchuwong Advisor Thailand Department of Fisheries, Thailand
16 Cao Le Quyen Deputy Director Vietnam Vietnam Institute of Fisheries Economics and Planning (VIFEP)
17 Nguyen Thanh Viet Associate Dean Faculty of Development Economics
Vietnam Vietnam National University
18 Chu Hoang Long Senior Lecturer Australia Australian National University
19 Chen Oai Li PhD graduate United States University of Arkansas at Pine Bluff
20 Shahnila Islam Research Analyst United States International Food Policy Research Institute (IFPRI)
Workshop processWorldFish welcomed the participants in the opening remarks. The project leader facilitated the workshop and invited all participants to briefly introduce themselves. An overview of the research project, workshop agenda, objectives and expected output was given. The two-day workshop program was divided into five sessions: (1) overview of the IMPACT model, (2) present status and future prospects of country fisheries and aquaculture, (3) group discussion on country fisheries and aquaculture future prospects and maximum output/carrying capacity, (4) ASEAN alternative fisheries and aquaculture scenarios, and (5) fish foresight modeling alternatives and follow-up. During the first session, the IMPACT multimarket model and the IMPACT fish model were presented by IFPRI and WorldFish, respectively. This was followed by WorldFish’s presentation on the updated parameters on the business-as-usual results of fish supply and demand in the ASEAN region to 2050 using the IMPACT fish model. In session two, the country teams presented the state of capture fisheries and aquaculture in their countries. Then in session three, using several specific questions, participants commented on the business-as-usual results/trajectories by exploring maximum carrying capacity and government targets for fisheries and aquaculture in their countries. This input allowed for a participatory approach to calibrate the future projection of the IMPACT fish model by the WorldFish foresight modeling team.
During the second day, in session four on scenario development, WorldFish narrowed down a major topic of interest that the participants could focus on for the region—climate change impact on both capture fisheries and aquaculture. The participants worked in three groups to develop narratives to come up with plausible scenarios for the future of fish. These were later quantified for the model. In addition to the IMPACT fish model, in

33
session five, other foresight models were presented: Firstly, the capture fisheries model to explore the maximum sustainable yield (MSY), then the AsiaFish model as an alternative country-level model and, lastly, the USFish model of demand side behaviors that could be adapted for use in other countries.
Workshop agendaTuesday June 7, 2016 (Day 1)
8:30 Registration of participants
8:45 Opening remarks and welcome by WorldFish
Session 1Overview of IMPACT model
9:00 IMPACT model introduction
9:20 IMPACT fish model introduction (Fish to 2030)
10:00–10:20 Coffee break
10:20 IMPACT fish model update and preliminary baseline projection in ASEAN (Fish to 2050)
Session 2Country fisheries and aquaculture present status and future prospects
11:00 Country presentations – Bangladesh, Cambodia, Indonesia
12:00–1:10 Lunch
1:10 Country presentations – Malaysia, Philippines, Thailand, Vietnam
2:30–3:00 Coffee break
Session 3Group discussion on country fisheries and aquaculture future prospects & maximum output/
carrying capacity3:00 Country group discussions
4:00 Country group presentations
4:30 Workshop adjourned for the day
Wednesday June 8, 2016 (Day 2)Session 4
ASEAN alternative fisheries and aquaculture scenarios 8:30 Scenarios development introduction
9:00 General discussion on scenarios development for ASEAN
10:00–10:20 Coffee break
10:20 Group discussions on selected scenario
11:20 Group presentations on selected scenario
12:00–1:10 Lunch
Session 5Fish foresight modeling alternatives and follow-up
1:10 Overview of fish foresight modeling approaches
1:30 Alternative fisheries modeling presentation (capture fisheries model, AsiaFish model, USFish model)
2:30–3:00 Coffee break
3:00General discussion on fish foresight modeling ideas (group 1)Review of country consumption and trade projection results (group 2)
4:00 Concluding remarks and feedback
4:15 Adjournment

34
Appendix C. Calibration of the projected aquaculture production in the ASEAN region
0
100
200
300
400
1970 1990 2010 2030 2050
Thou
sand
tons
A. Cambodia and Laos
0
5000
10000
15000
20000
1970 1990 2010 2030 2050
Thou
sand
tons
B. Indonesia
0
200
400
600
800
1970 1990 2010 2030 2050
Thou
sand
tons
C. Malaysia
0
500
1000
1500
2000
1970 1990 2010 2030 2050
Thou
sand
tons
D. Myanmar
0
1000
2000
3000
1970 1990 2010 2030 2050
Thou
sand
tons
E. Philippines
0
2000
4000
6000
8000
1970 1990 2010 2030 2050
Thou
sand
tons
G. Vietnam
Original projection Revised projection Historical data
0
500
1000
1500
2000
2500
1970 1990 2010 2030 2050
Thou
sand
tons
F. Thailand

35
Appendix D. Calibration of the projected capture fisheries production in the ASEAN region
Original projection Revised projection Historical data
0
200
400
600
800
1000
1970 1990 2010 2030 2050
Thou
sand
tons
A. Cambodia and Laos
0
5000
10000
15000
1970 1990 2010 2030 2050
Thou
sand
tons
B. Indonesia
0
500
1000
1500
2000
1970 1990 2010 2030 2050
Thou
sand
tons
C. Malaysia
0
1000
2000
3000
4000
5000
1970 1990 2010 2030 2050
Thou
sand
tons
D. Myanmar
0
1000
2000
3000
4000
1970 1990 2010 2030 2050
Thou
sand
tons
E. Philippines
0
1000
2000
3000
4000
1970 1990 2010 2030 2050
Thou
sand
tons
F. Thailand
0
2000
4000
1970 1990 2010 2030 2050
Thou
sand
tons
G. Vietnam

This publication should be cited as: Chan CY, Tran N, Dao CD, Sulser TB, Phillips MJ, Batka M, Wiebe K and Preston N. 2017. Fish to 2050 in the ASEAN region. Penang, Malaysia: WorldFish and Washington DC, USA: International Food Policy Research Institute (IFPRI). Working Paper: 2017-01.
© 2017. WorldFish. All rights reserved. This publication may be reproduced without the permission of, but with acknowledgment to, WorldFish.
Phot
o cr
edit:
Bac
k co
ver,
Mik
e Lu
smor
e/D
uckr
abbi
t
www.worldfishcenter.org100%RECYCLED


