Embed Size (px)
Citation preview
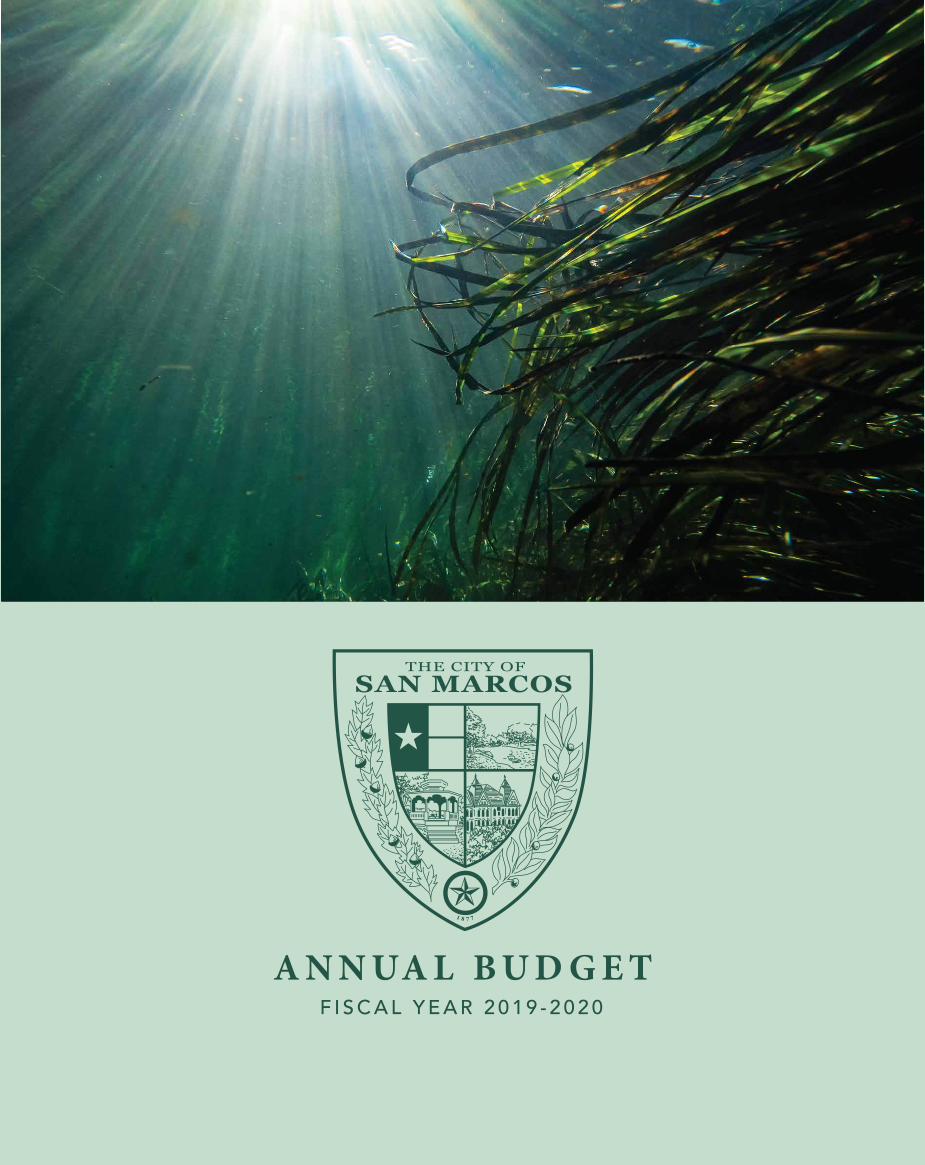
A N N UA L B U D G E TF I S C A L Y E A R 2 0 1 9 - 2 0 2 0
Adopted FY 2019/20 Budget City of San Marcos, Texas
Annual Budget
City Council
Jane Hughson, Mayor
Lisa Prewitt, Place 1
Saul Gonzales, Place 2
Ed Mihalkanin, Place 3
Mark Rockeymoore, Place 4
Joca Marquez, Place 5
Melissa Derrick, Place 6
Administrative Staff
Bert Lumbreras, City Manager
Steve Parker, Assistant City Manager
Stephanie Reyes, Interim Assistant City Manager
Heather Hurlbert, Director of Finance
Melissa Ann Neel, Assistant Director of Finance

City of San Marcos | FY20 Adopted Budget
City of San Marcos | Finance
2
THIS BUDGET WILL RAISE MORE TOTAL PROPERTY TAXES THAN LAST YEAR’S BUDGET BY $3,609,774
OR 11.7%, AND OF THAT AMOUNT $815,568 IS TAX REVENUE TO BE RAISED FROM NEW PROPERTY
ADDED TO THE ROLL THIS YEAR.
Tax Rate Adopted FY 2020
Adopted FY 2019
Property Tax Rate .6139 .6139 Effective Tax Rate .5686 .5899 Effective M&O Rate .6315 .6406 Rollback Rate .6217 .6596 Debt Rate .2069 .2262
Council Member 9-17-19 Vote
Jane Hughson Yes Lisa Prewitt No
Saul Gonzales Yes Ed Mihalkanin Yes
Mark Rockeymoore Yes Joca Marquez Yes
Melissa Derrick Yes

City of San Marcos | FY20 Adopted Budget
City of San Marcos | Finance
3
The Government Finance Officers Association of the United States and Canada (GFOA) presented an award for Distinguished Budget Presentation to the City of San Marcos, Texas for its annual budget for the fiscal year beginning October 1, 2018.
In order to receive this award, a governmental unit must publish a budget document that meets program criteria as a policy document, as an operations guide, as a financial plan and as a communications device.
The award is valid for a period of one year only. We believe our current budget continues to conform to program requirements, and we are submitting it to GFOA to determine its eligibility for another award.

City of San Marcos | FY20 Adopted Budget
City of San Marcos | Finance
4

City of San Marcos | FY20 Adopted Budget
City of San Marcos | Finance
5
Table of Contents
Introduction Municipal Court Security Fee Fund 198
Mission Statement 7 Municipal Court Juvenile Fee Fund 199 Transmittal Letter 8 Municipal Court Efficiency Fee Fund 200
Executive Summary 12 Seized Assets Fund 201
Budget Discussion 19 Community Development Block Grant Program Fund 202
Budget Policy Statement 54 Women, Infant and Children Program Fund 203
Financial Policy 59 Cemetery Operations Fund 210 Reader’s Guide 82 Tax Increment Reinvestment Zone 211
Budget Summary Public Education Governmental Fund 214
Consolidated Fund Balance Statement 97 Enterprise Funds
Consolidated Summary of Major Revenue and Expenditures 98 Electric Utility Fund 215
Consolidated Revenue Comparison 100 Water/Wastewater Utility Fund 231
Consolidated Expense Comparison 101 Stormwater Utility Fund 244
Consolidated Fund Balance Comparison 102 Municipal Airport Fund 249
Property Tax Valuation and Revenue 103 Resource Recovery Fund 251
Organization Chart 104 Transit Fund 254
General Fund 106 Permanent Funds 257
Debt Service Fund 185 Capital Improvement Program 258
Special Revenue Funds Miscellaneous and Statistical 274
Hotel Occupancy Tax Fund 192 Glossary 300
Municipal Court Technology Fund 197


City of San Marcos | FY20 Adopted Budget
City of San Marcos | Finance
7
The Mission of the City of San Marcos
The goals of the City Government are to safeguard the health, safety and welfare of the City’s residents, provide for a high quality of life, foster intergovernmental liaison and communication, encourage responsible citizenship, promote sound community and economic development, conserve and protect the City’s natural resources and environment.
– San Marcos City Charter

City of San Marcos | FY20 Adopted Budget
City of San Marcos | Finance
8
TO: Honorable Jane Hughson & Members of the City Council
FROM: Bert Lumbreras, City Manager
SUBJECT: 2019-2020 Adopted Budget
DATE: September 17, 2019
I am honored to present the adopted fiscal year 2019-2020 City of San Marcos Operating Budget and Capital Improvements Plan. This budget is structurally balanced, with operating revenues meeting operating expenditures. The annual budget is the outline of the programs and services to be provided to our citizens during the upcoming year and will stand as the foundation for enhancing the City’s vision as adopted by the City Council in Spring 2019. It also lays the groundwork for future growth and development through the planning of capital improvements and new service levels expansions. A structurally balanced budget will set the foundation for prudent fiscal management of City operations in the coming years and ensure the City will have the tools to achieve the City Council goals.
The fiscal year 2020 adopted budget uses the Strategic Initiatives set by City Council in 2019 as a framework. These Strategic Initiatives are the top priorities for the upcoming fiscal year:
Workforce Housing Multi-modal Transportation Workforce Development Downtown Vitality City Facilities
The development of the adopted budget reflects the local and regional economic projections which have continued to remain extremely strong over the past several years. San Marcos and the surrounding areas have been recognized as one of the fastest growing areas in the Unites States. Property tax appraisals have increased by 11 percent for fiscal year 2020 and the City is seeing indications of continued growth for the future with the addition of residential developments, business growth, and continued economic development opportunities.
The General Fund continues to grow due to strong property valuation growth and increased sales tax collections. The average home value continues to increase with the strong residential growth. The average home value for tax year 2019 is $208,000, an increase of $13,000 or 6.7% from tax year 2018.
City of San Marcos | FY20 Adopted Budget
City of San Marcos | Finance
9
The City continues to move forward with the projects approved by voters in the May 2017 bond election. The Library expansion broke ground in October and anticipate Fire Station #2 to break ground in December 2019. The Police Headquarters renovation and Fire training facility are anticipated to break ground in 2020. In addition to the bond projects, the Public Services Center a combined service facility will begin design phase in 2020 with an estimated completion in 2022.
The Water/Wastewater Utility continues to move forward to secure the future water supply for the next 50 years. Rates have been increased steadily, in small annual increments, over the past 5 years in preparation for this project. The first phase of the project of building a water line between Kyle, Buda and San Marcos is under construction and the second phase will begin in fiscal year 2020.
The Electric Utility continues to serve the city while improving infrastructure and expanding the utility to accommodate the growth in the area. This has been achieved without the need for a rate adjustment over the past several years.
San Marcos experienced major flooding during 2015 and additional smaller flood events over the past several years. The City was awarded $33.7 million in Community Development Block Grant-Disaster Recovery (CDBG-DR) funding to fund selected projects and for use in community and housing needs. In Fiscal Year 2019 the City was awarded a new grant of $24 million (CDBG-MIT) focused on disaster mitigation.
We believe the adopted budget reflects a fiscally responsible approach that allows the City to improve the current infrastructure and meets growth demands while maintaining the City’s strong financial position. This budget ensures the quality services our citizens expect and focus the resources necessary to meet the demands of future growth and development while maintaining an affordable cost of services. This budget was created with guidance and input from the City Council on behalf of the Citizens of San Marcos. We feel this budget and the policies that guide it will make San Marcos sustainable for many years into the future.
Respectfully submitted,
Bert Lumbreras
City Manager

City of San Marcos | FY20 Adopted Budget
City of San Marcos | Finance
10
Core Values

City of San Marcos | FY20 Adopted Budget
City of San Marcos | Finance
11
Strategic Initiatives
Downtown Vitality
• Create a revised downtown master plan • Review and address underground electric ordinances • Review and amend the downtown tax increment reinvestment zone (TIRZ) #5 • Complete the San Marcos River bike and pedestrian trail project • Approve and implement the parking management plan
Workforce Development
• Coordinating community wide conversations for career development • Identifying and developing local outreach opportunities • Developing enhanced career training web content • Developing GED, English language, and computer classes • Identifying challenges and unmet needs in the business community
Workforce Housing
• Adopted updated affordable housing policy • Formed housing task force • Executed housing study contract • Hired a housing coordinator • Completed 13 CDBG housing rehabilitation projects
Multi Model Transportation
• Held 4 transit stakeholder meetings • Executed CARTS interlocal agreement • Completed coordinated transit plan (CTP) study phase I • Passed direct recipient resolution • Began CTP study phase II
City Facilities
• Purchased portable building to house 30 staff members • Relocated equipment to provide 22+ staff parking spots • Hired Jacobs Engineering as city’s project manager • Included project control dashboard on city website • Awarded contract for fire training master plan

City of San Marcos | FY20 Adopted Budget
City of San Marcos | Finance
12
Executive Summary Fiscal year 2020 City Council Budget Policy decisions Per City Charter, City Council adopted a Budget Policy in March 2019 providing the City Manager and staff direction on base budget assumptions. The following are the major policy items included in the city’s adopted fiscal year 2020 budget. Each of these items were discussed during City Council’s public review sessions:
• General Fund’s budgeted fund balance of $18.2 million meets the 25 percent requirement as set by the city’s Financial Policy. All other funds meet required fund balance levels
• The city maintains a property tax rate of 61.39 cents per $100 of property valuation • All department operating budgets held flat • Utility franchise fee reduced to 7 percent (prior two fiscal years it was 8 percent) • General Fund fees increased either according to fee policy guidelines or the 2018 calendar year
CPI (consumer price index) which totaled 2.44 percent • $800 thousand appropriated to fund the new Meet and Confer agreement for civil service
personnel • $715 thousand General Fund ($105 thousand all other funds) appropriated for the citywide pay
for performance and cost of living adjustment, through which employees may receive pay increases of 4 percent increase (up to the maximum of their salary range) effective April 1st
• $5.5 million General Fund ($2.2 million all other funds) appropriated for a 5 percent increase in the city’s health insurance cost
• $1.9 million General Fund use of Sales Tax revenue from the Best Buy Call Center appropriated for one-time expenses
• $800 thousand (General Fund, Electric and Water/Wastewater Funds) accumulated balance for Economic Development allocated to special projects (Strategic Initiatives)
• Rate adjustments for utilities are included based on CUAB (Citizen Utility Advisory Board) recommendation (rate study performed by 3rd party consultants)
How the adopted budget will affect citizens’ property tax rates The fiscal year 2020 property tax levy will be used to pay debt service on outstanding General Fund obligations and support General Fund maintenance and operations. Of the 61.39 cents per $100 of valuation levied, 20.69 cents goes to debt payments and 40.7 cents goes to maintenance and operations. Operations include police and fire protection, parks operation and maintenance, activity center, library, animal services, road maintenance, traffic control, and other general governmental functions. General Fund obligations include certificate obligation bonds (COs) and voter approved general obligation bonds (GOs) including the 2017 bond projects to renovate and expand the library, police headquarter renovations, two additional fire stations, and a fire training facility.

City of San Marcos | FY20 Adopted Budget
City of San Marcos | Finance
13
For fiscal year 2020, the city’s total property tax levy of $23 million is an increase of $3.6 million over the current tax year levy of $19.6 million, of that $815 thousand was revenue from new properties. The adopted property tax rate of 61.39 cents remains unchanged from the prior year tax. Total valuation of all property increased 11.7% or $588 million from prior year. Existing property consists of $5.4 billion and new property makes up $132.8 million of total valuation.
In fiscal year 2020 citizen tax bills will reflect 61.39 cents per $100 of assessed property value. Based on this rate, an owner of a home value of $100,000 will pay approximately $613 in city property taxes. The Hays County appraisal district assesses the real property values used to calculate property tax bills.
How the adopted budget will affect staffing levels and compensation • The fiscal year 2020 budget includes $822 thousand for a 4 percent non-civil service
performance and cost of living increase. • $800 thousand is included to fund a new civil service agreement under the three year 2020 Meet
& Confer agreement. The new agreement added additional pay grades (steps) to allow compensation growth within each rank
• Health insurance for all city employees is through self-funded claims pool. To insure adequate funding levels, the city and employee contribution increased by 5 percent over prior year resulting in additional $462 thousand in expense to the city across all funds.
• The budget also includes an increase in the longevity benefit from $4 to $5 a month to move toward more competitive benefits for city employees.
Staffing Changes The city’s total headcount for fiscal year 2020 is 850 which is an increase of 33 positions from the prior year adopted budget. The positions that were added were spread across all departments where needs had been identified.
General Fund – (18)
City Manager - Management assistant Grant Administrator Economic/Business Development Mgr Video Technician Watershed Engineer Adoption Counselor Shelter Technician Police - Volunteer Program Coordinator Police - Training/Compliance Coordinator
(2x) Part-time Police Officer Paramedic Program Procurement Specialist Natural Area Maintenance Crew Leader
Natural Area Maintenance Worker Construction Technician Librarian I GIS Analyst
Enterprise Funds – (15)

City of San Marcos | FY20 Adopted Budget
City of San Marcos | Finance
14
Water Quality Technician Water Distribution Crew Leader (3x) Water Distribution Equipment Operator 1 (2x) Electric Line worker III-IV Electric Service Technician
Electric GIS Technician Stormwater Crew Leader Stormwater Operator 2 (2x) Stormwater Operator 1 Stormwater Technician
Transit Support Specialist
Fund Highlights Total FY20 budget of $239 million is made up of four major fund types: General Fund, Enterprise Funds, Special Revenue Funds, and Debt Service Fund.
General Fund – Sources General Fund - Uses
Enterprise Fund – Sources Enterprise Fund - Uses
General Fund and Enterprise Funds make up over 85 percent of total sources and uses of the city budget. In addition to these major funds, Special Revenue has sources of $11.4 million (5 percent) and Debt Service has $17 million (7 percent).
General Fund - Sources The General Fund supports core services with the greatest potential for revenue fluctuations. Forecasted General Fund sources for fiscal year 2020 are $86.4 million, approximately $6 million (7.5 percent) more than the fiscal year 2019 adopted budget.

City of San Marcos | FY20 Adopted Budget
City of San Marcos | Finance
15
General Fund – Uses The adopted fiscal year 2020 General Fund uses budget is projected to be approximately $87.9 million, $7.3 million (9.1 percent) more than the fiscal year 2019 adopted budget. In addition to the items added according to budget policy increases in contractual obligations and economic incentives, $840 thousand in new recurring department expenses were added to the budget.
Enterprise Funds Enterprise Funds account for the city’s electric utility, water and wastewater utility, stormwater utility, resource recovery utility, transit system, and the municipal airport. These funds are wholly supported by rates charged for services.
Electric Utility Fund – The Electric Utility Fund accounts for the transactions related to the city’s operation, maintenance, and improvement of electric utility services. Projected sources of funding for the fiscal year 2020 budget are $62 million with fund balance of $9.6 million (or 60 days of operation). Total Electric Utility Fund uses budget adopted for fiscal year 2020 of $62.9 million, increased $46 thousand (less than one percent) from prior year adopted budget. Funding for $1.3 million in new recurring and $257.5 thousand for one-time uses was included in the operating budget.
Water/Wastewater Utility Fund – The Water/Wastewater Utility Fund accounts for the operating, maintenance, and improvement of the city’s water/wastewater utility including production, distribution and wastewater collection and treatment system. Revenue requirements for Water/Wastewater Fund are impacted by contractual obligations with OMI and GBRA to operate the treatment plants, personnel, debt service, and capital expenditures. The funds sources are $46.3 million with fund balance of $10.7 million or 25%. Total Water/Wastewater Fund FY20 appropriated uses of $45.6 million, increasing $2.8 million (6.5 percent) from prior year adopted budget. Funding of $448.3 thousand in recurring and $525 thousand for one-time uses was added to operating budgets. Adopted rate adjustments in water were 5 percent and wastewater 3 percent with average citizen impact of $3.95 monthly.
Stormwater Utility Fund – The Stormwater Utility Fund accounts for operations of the city’s planning, engineering, construction, maintenance, improvement and reconstruction of drainage projects throughout the city. The funding sources for fiscal year 2020 are $6.9 million with projected fund balance of $1.6 million or 25 percent. Total Stormwater Fund fiscal year 2020 appropriated uses of $6.8 million, increasing $1.2 million (23 percent) from prior year adopted budget. Funding of $351.8 thousand in recurring and $330 thousand for one-time uses was added to operating budgets.
Resource Recovery Utility Fund – The Resource Recovery Utility Fund accounts for operations of the city’s residential solid waste collection, residential and multi-family recycling, residential
City of San Marcos | FY20 Adopted Budget
City of San Marcos | Finance
16
green waste, household hazardous waste disposal, bulky items, and brush collection. The sources are expected to be about $4.8 million with a fund balance of $1.4 million or 31.2 percent. Total fiscal year 2020 appropriated uses of $4.8 million, increasing $354.7 thousand (8 percent) from prior year adopted budget. Resource Recovery Fund adopted a rate adjustment with an average citizen impact of $0.98 monthly.
Transit System Fund – The Transit System Fund accounts for the operations of the city’s transit system. Effective October 1, 2019 the City of San Marcos became the direct recipient of federal and state funds to operate the local transit system for the community. The sources are projected to be $2 million with fund balance of $37 thousand. Fiscal year 2020 adopted uses are approximately $1.9 million. With the expansion of the city’s management of the transit program the impact to uses of funds reflects a 208 percent increase over prior year adopted budget. Funding of $60 thousand in recurring expenditures was added to the operating budget.
Municipal Airport Fund – The Municipal Airport Fund accounts for operations of the city’s airport with three runways, 60 acres of maintained parking ramps, and 38 hangars and shelters. The sources are estimated to be $689 thousand with no anticipated transfer from the General Fund to cover the cost of operations.
Special Revenue Funds The city accounts for sources earmarked for specific purposes by law or the adopted budget through Special Revenue Funds. There are eleven Special Revenue Funds: Hotel Occupancy Tax, Municipal Court (Technology Fee, Security Fee, Juvenile Fee, and Efficiency Fee), Seized Assets, TIRZ (#2, #3, #5, TRZ #1), CDBG Program, Cemetery Operations, and PEG Funds.
The Hotel Occupancy Tax Fund is special revenue fund for the hotel occupancy tax of 7 percent and venue tax of 2 percent. The fund currently has annual sources of $3.9 million, and a projected fund balance of $190 thousand. Projected uses for FY20 of $2.6 million, increasing $310 thousand (14 percent overall) over prior year adopted budget. In FY19 revenue projections reflected a decline due to lower average room rates. As a precaution, a budget reduction to operating funds of 15 percent (non-personnel reductions) were part of the adopted budget. The FY19 Hotel Occupancy Tax revenue exceeded revenue projections therefore the budget was amended to reinstate prior operating budgets. The budget levels for FY20 are based on the amended revenue and expenditure amounts.
The Municipal Court special revenue funds accounts for the specific use of funding across four funds.
• Municipal Court Technology Fund currently has sources of $25 thousand, uses of $5 thousand, and a projected fund balance of $218 thousand. The revenues collected are legally restricted for making technological enhancements to the Municipal Court, which may include computer systems, networks, hardware, software, imaging systems, electronic kiosks, electronic ticket writers or docket management systems
City of San Marcos | FY20 Adopted Budget
City of San Marcos | Finance
17
• Municipal Court Security Fee Fund currently has sources of $18.5 thousand, uses of $87 thousand, and a projected fund balance of $47.3 thousand. This fund was established to help enhance security within municipal courts. This sole use of this fund is to enhance security within the court operations
• Municipal Juvenile Fee Fund has sources of $36 thousand, uses of $28 thousand, and a fund balance of $65.5 thousand. The use of this fund is to fund the Juvenile Case Manager position, which is now being budgeted as a full-time position and funded equally by the General Fund and the Juvenile Fee
• Municipal Court Efficiency Fee Fund has sources of $4 thousand, uses of $20 thousand, and a projected fund balance of $4.9 thousand
The Seized Assets Fund currently has sources of $5 thousand, uses of $5 thousand, and a projected fund balance of $126 thousand. This fund, established in 2001, provides budgeting and accountability for revenues collected from the sale of forfeited and seized assets. Revenues from these seized assets are used to fund one-time expenses and projects including technology and equipment in our Police Department. The use of these funds must be approved by City Council. The TIRZ Funds collectively has sources of $5.1 million with a projected fund balance of $3.3 million.
• Tax Increment Reinvestment Zone #2 Blanco Vista Development Fund was established in 2010. This fund collects the property tax growth increment from the City and Hays County which is specifically restricted for the repayment of the cost to construct the Yarrington Road Overpass. The restricted property tax revenues are estimated to be $1.5 million.
• Tax Increment Reinvestment Zone #3 Conference Center Fund was established in 2010. This fund collects property tax growth increment from the City and Hays County which is specifically restricted for the repayment of debt related to the building of the City of San Marcos Conference Center. The restricted property tax revenues are estimated to be $198 thousand.
• Tax Increment Reinvestment Zone #4 Kissing Tree Development Fund was established in 2011. This fund collects property tax revenues from the City and Hays County which is specifically restricted for the repayment of improvements made by the developer for Kissing Tree. The restricted property tax revenues are estimated to be $341 thousand.
• Tax Increment Reinvestment Zone #5 Downtown Fund was established in 2012. This fund collects property tax growth increment from the City and Hays County which is the dedicated source of sustainable funding for downtown improvements in support of the adopted Downtown Master Plan. The restricted property tax revenues are estimated to be $1 million.
• Transportation Reinvestment Zone #1 Loop 110 Fund was established in 2013. This fund collects property tax growth increment which is specifically restricted for the

City of San Marcos | FY20 Adopted Budget
City of San Marcos | Finance
18
construction of Loop 110. The restricted property tax revenues are estimated to be $2 million.
In fiscal year 1994, the United States Department of Housing and Urban Development designated the City of San Marcos as an Entitlement City for the Community Development Block Grant (CDBG). The program is designed to eliminate slum and blight conditions and to serve the needs of low to moderate-income residents. The CDBG Program Fund has sources of $680 thousand with a projected fund balance of $0. The WIC Program Fund currently has sources of $2 million with fund balance of $0. The Women, Infants and Children Program provides nutritional food supplements, nutritional counseling, clinical assessments, and education to pregnant women, breast-feeding mothers, infants and children up to five years of age. The City of San Marcos operates a five-county regional WIC program that is funded through the Texas Department of Health and Human Services and the United States Department of Agriculture. The Cemetery Operations Fund has sources of $252 thousand with a fund balance of $3.6 thousand. This fund provides for maintenance and upkeep of the historic San Marcos City Cemetery.
The PEG Funds (Public Education Grant) is a special revenue fund earmarked for technical equipment used to broadcast public meetings and announcements. This fund has sources of $97 thousand.

City of San Marcos | FY20 Adopted Budget
City of San Marcos | Finance
19
Budget Discussion
Employee Retention and Compensation
As we experience a strong economy with low unemployment rates the job market has been quite competitive. To compete in the job market as a top employer the City must remain focused on employee retention and competitive compensation.
In the fiscal year 2020 budget non-civil personnel were allocated 4% cost of living and performance pay increases, the longevity benefit paid per month after the first 12 months of service was increased by $1 per month to $5, and in the Electric Utility (SMEU) a line worker career progression plan was implemented. During the year SMEU experienced high turnover rates due to lack of career mobility. The career progression plan offers line workers advancement opportunities as they progress through the lineman program.
Police and Fire Meet and Confer
The Meet and Confer process is established through the Texas Local Government Code, Chapter 142, Subchapters B & C, which establish the manner by which a municipality with a population of 50,000 or more and its Police and Fire Associations can discuss wages, hours of employment and other working conditions. This process provides an opportunity to pre-empt state statutes. On February 7, 2006 the City Council approved the San Marcos Police Officers’ Association and the San Marcos Professional Fire Fighters’ Association petitions to become the sole and exclusive bargaining agent for the City of San Marcos Police Officers and Fire Fighters.
The first negotiation between the City and Associations was in 2009 with a three-year subsequent agreement in 2012 through 2015. The 2015 agreement was extended for an optional fourth year. During 2019 a new agreement was negotiated between both associations effective October 1, 2019 through September 30, 2022. The new agreement focused on market competitiveness and provides career growth for sworn officers.
City Beatification and Enhancement
In recent years the City conducted several citizen satisfaction surveys that compared the City of San Marcos to regional and national standards across America. The results indicated that the citizens are concerned with the overall beautification of the City. In fiscal year 2016 the City

City of San Marcos | FY20 Adopted Budget
City of San Marcos | Finance
20
Council approved the Community Enhancement fee that provides a source of additional funding for continuing and one-time projects, programs, education and enhanced services.
The monthly fee has provided funding that has enhanced mowing and trash pick-up across the city and large projects such as the Craddock Median improvement. City Council committed $200,000 to unsafe structures from fiscal year 2019 Community Enhancement Funds to continue to enhance the neighborhoods throughout our community.
Economic Development, Small Business Development, and Strategic Initiatives
This year’s budget allocates $400,000 for economic and small business development along with $214,000 for legislative representation with the expense being shared equally between the General Fund, Water/Wastewater Fund, and Electric Fund since development benefits all funds. In prior fiscal years the City has budgeted $200,000 each fiscal year since 2015 to establish an economic reserve that could be used to replicate 4A/4B funding in order to potentially attract a prospective new employer in future years. The fiscal year 2020 allocation of $200,000 was allocated to fund a new Economic/Business Development Manager within the City Manager’s Office and supporting program funds.
As of fiscal year 2019 an accrued balance of $800,000 remained in the economic development reserve. The fiscal year 2020 Budget Policy designates this funding for special projects to support council initiatives. City Council appropriated $700,00 to fund strategic initiatives with a remaining balance of $100,000 in the reserve for future economic development. Workforce Housing: $225K, Workforce Development: $75K, Downtown Vitality: $200K, and Multi-modal Transportation: $200K. The following projects were approved within the strategic initiatives.
Workforce Housing
Workforce Development
Downtown Vitality Multi-modal Transportation
Land acquisition
Scholarship funds Landscaping & benches
Design for shared use path
Design competition Marketing Art within sidewalks Additional bus shelters
Unsafe structures City facility location Street signage & wayfinding
Social Services
City Council appropriated $500,000 in social service program funding from the general fund for fiscal year 2020. The Human Services Advisory Board (HSAB) is tasked with developing a recommendation for distributing the social service program allotment to the various social service agencies operating within San Marcos. The following agencies were awarded funds: CASA, Community Action, SMCISD PEP Program, Greater San Marcos Youth Council, Hays Caldwell

City of San Marcos | FY20 Adopted Budget
City of San Marcos | Finance
21
Women’s Center, Hays County Child Protective, Nosotro La Gente, Hays County Area Food Bank, San Marcos Housing Authority, San Marcos Youth Services Bureau, Scheib Opportunity Center, Southside Community Center, Society of St Vincent de Paul, Salvation Army, Any Baby Can, Cenikor Foundation, Hands of Hope, San Marcos Community Radio, and Central Texas Dispute Resolution.
In addition to the funding administered through HSAB, City Council appropriated $45,000 to the Family Crisis Center, $25,000 to support a staff position with Community Action for youth services, $45,000 CASA, and approved a multi-year plan to fund $400,000 to the Hays Caldwell Women’s Center - Transitional Housing campaign (FY20 $150,000).
Hotel Occupancy Tax Fund
In Fiscal Year 2008, voters adopted a 2% venue tax to be implemented in the Hotel/Motel Fund to help offset debt payments associated with the City of San Marcos Conference Center. Revenues collected from the Embassy Suites Hotel along with the 2% venue tax are restricted for the debt service related to the City’s Conference Center which opened November 2009. The Conference Center has performed well and has exceeded revenue projections. In fiscal year 2014 a portion of the bonds issued for the conference center were refunded and the City was able to apply $3.5 million of the excess hotel occupancy tax and venue tax collections against the debt principal lowering the debt service payments. If collections continue at the current pace, the City will be able to pay off the bonds several years early.
In fiscal year 2017, the Convention and Visitors Bureau (CVB) was brought into the City as a city department. The CVB has been part of the Chamber of Commerce’s organization, but the City has provided the majority of the funding for the operations through the Hotel Motel Tax Fund. During City Council Visioning for fiscal year 2017, Council directed staff to begin negotiations to bring the CVB organization into the City as a city department. The integration of the CVB into the City as a City department was effective October 1, 2016.
Capital Outlay
In fiscal year 2016 the City began a program of leasing light duty fleet vehicles for the General Fund using a five-year replacement cycle. This program was expanded to all funds in fiscal year 2017. The City expects to realize savings though reduced maintenance cost and improved fuel efficiency as a result of replacing older vehicles in the fleet.
The funding for capital outlay in the General Fund has increased incrementally over the last few fiscal years in an effort to build funding to an appropriate level with $2,000,000 budgeted in fiscal year 2020 for new and existing positions and facilities. Incremental increases to the current funding has allowed the City to continue catching up on a backlog of equipment and vehicle

City of San Marcos | FY20 Adopted Budget
City of San Marcos | Finance
22
replacements, technology infrastructure and other one-time expenses and to maintain a timely replacement schedule going forward.
Cash Funded Capital Maintenance
The fiscal year 2020 budget continues to allocate amounts into the Cash-Financed Capital Funds for Information Technology, Parks Improvements, and Facility Improvements. These funds are budgeted annually as one-time expenses and are funded if revenues allow. These funds will be used to finance capital projects in these areas through cash funds instead of bond funding.
The Cash-Financed Capital Funds provide a funding source for capital projects such as:
• Non-routine infrastructure improvements • Continuing Technology infrastructure upgrades and improvements • Street rehabilitation and maintenance projects • Park improvements, rehabilitation, and acquisition
The capital funds along with other one-time expenses are listed below:
• Routine Capital Outlay-Parks $ 50,000 • Routine Capital Outlay-Police $ 50,000 • Routine Capital Outlay-Fire $ 50,000 • Capital Outlay $2,000,000 • Building Capital Maintenance $ 200,000 • Parks Capital Maintenance $ 200,000 • Technology Capital Maintenance $ 200,000
Capital Improvements Program – Certificate of Obligation Projects
For the fiscal year 2020 budget, projects were submitted by all departments and prioritized. Staff vetted all projects and totals were constrained based on the Engineering Department’s capacity for project management and the individual funds’ capacity. The compiled projects were then presented to Planning and Zoning Committee. Planning and Zoning made their recommendations and the recommended projects were taken to the City Council for approval. The top five projects by fund:

City of San Marcos | FY20 Adopted Budget
City of San Marcos | Finance
23
May 2017 Bond Election
In May 2017 voters approved a $32M bond package for public safety and library expansion. The projects include the Police Facility renovation, construction of a Fire Training Field, relocation of Fire Station #2, construction of a new Fire Station #8, and expansion of the Library. The total tax rate impact for construction of and operational expense for the projects was 8.37 cents. City Council chose to increase the full amount for fiscal year 2018. The initial debt was issued in spring
Project Name FY20 AdoptedMulti Fund
WWTP Electric Backup Feed $6,000,000AMI Generation 2 Upgrade $5,367,000Purgatory Creek Improvements Ph 1 $3,367,000WWTP Electric Backup Feed $6,000,000Purgatory Creek Improvements Ph 1 $3,367,000
General FundCity Park - ADA Playground $750,000Cemetery Land Acquisition $700,000Gary Softball Complex Renovation- Existing Fields Ph 1. $600,000Parks - ADA Access to River $500,000City Facility Renovations $450,000
Electric FundRattler Electric Substation $2,000,000Underground Electric Conversion $1,000,000Customer Extensions - New Service $478,247SMEU Substation Feeder Breaker Upgrade $400,000Carlson Circle Streetlight Repair and Replace $210,000
Water/Wastewater FundHighway 80 Lift Station and 12-Inch Force Main $5,000,000ARWA Delivery Improvements $4,000,000West Purgatory Creek 18-inch Wastewater Interceptor $1,725,000Red Sky Water Improvements $1,100,000WWTP Misc. Improvements Ph 2 $1,000,000
Stormwater FundWallace Addition Offsite Drainage Imps $825,000Cemetery/Franklin Stormwater Imps $250,000Various Stormwater Imps $230,000William Pettus Improvements $200,000Stormwater System Improvements $120,000

City of San Marcos | FY20 Adopted Budget
City of San Marcos | Finance
24
of 2018. Revenues generated by the debt service portion of 4.60 cents will be used to pay future bond debt. The revenues generated by the operations portion of 3.77 cents will be held in reserve as a contingency for the projects or used for operating expenses related to the projects. The status summary of all bond projects:
The Library has received outside pledges to cover the additional costs of $1M. Future CIP funds were adjusted to fund the Police station additional costs of $6M, and interest income from bond reserves will be used to supplement the remaining additional costs.
Fund Balances
In the Budget Policy Statement, the City Council directed that the Water/ Wastewater Utility, Stormwater Utility and General Fund meet a fund balance level of at least 25%. The Electric Utility maintains a fund balance equivalent to 60 days of operating expenses including the cost of purchase power. These percentages indicate what percentage of annual recurring operation expenses are maintained in the fund balance, or reserve, of each fund. This goal was established to provide a minimum of three months operating capital for each of the major funds.
Ground Breaking
Est. Completion
Original Cost Estimate
Revised Budget
Police May-20 Nov-21 $5.6M $11.6MLibrary Oct-19 Mar-21 $14.6M $15.6MFire Station #2 Dec-19 Nov-20 $5.3M $6.2KFire Station #6 Sep-20 Aug-21 $6.8M $7.6KFire Training Sep-20 Jul-21 $2M $2M

City of San Marcos | FY20 Adopted Budget
City of San Marcos | Finance
25
Individual Fund Discussion
The General Fund
The General Fund is the primary operating fund for the City. It is viewed as the general government fund and accounts for most of the City’s financial resources, except for resources required to be accounted for in other funds.
Revenues
Revenue forecasting is a complex and difficult task that involves collecting historical data, researching economic data, and formulating forecasting assumptions. At a minimum, ten years of historical data are compiled and analyzed as part of the forecasting procedure. Qualitative and quantitative forecasting techniques such as consensus forecasting, expert forecasting and trend analysis are utilized when preparing revenue estimates. In some cases, more than one technique is used to predict revenues for the next fiscal year. Expert forecasting is perhaps the most useful technique because it relies on extensive technical knowledge of the economic activity that generates the revenue and is sensitive to changes in the national, regional, and local economies.
This method is quite useful for the City because a significant amount of our sales tax base is generated through retail sales from the Prime and Tanger Outlet Malls. The General Fund receives revenues from a variety of sources, including taxes, licenses and permits, fines and penalties, interest income, other agencies, service fees, and transfers for indirect costs. Revenue projections are based on a variety of factors such as the economy, historical collections, known changes that will occur, and growth factors. In all events, conservative estimates are used.

City of San Marcos | FY20 Adopted Budget
City of San Marcos | Finance
26
Ad Valorem Tax
In the budget, property taxes represent 26.7% of total General Fund revenue. Property taxes are based on the assessed value of land, buildings and structures in the City as appraised by the Hays, Guadalupe, and Caldwell County Appraisal Districts. Certified assessed values in San Marcos are estimated at $5.6 billion an increase of 11% above the previous tax year assessed values. The City has experienced rapid growth over the last few years and expects this trend to continue. As a result of this growth, the City was named as the Fastest Growing City three years running but was unseated by several surrounding cities in 2017. A 98.0% current tax collection rate and a 2.0% delinquent tax collection rate are assumed for the budget. Revenue forecasting techniques are not used with the ad valorem tax, as the revenue is relatively simple to calculate. The calculation for ad valorem tax revenue is based on the certified assessed value using the tax rate.
The adopted property tax rate for fiscal year 2020 is 61.39 cents per $100 valuation. The tax rate was increased 8.37 cents to 61.39 cents in fiscal year 2018 as a result of the May 2017 bond election approved by voters for the construction of and operating expense for public safety and library facilities. The operations and maintenance tax rate will pay operations and maintenance (O&M) costs in the General Fund, producing revenues of $23 million. The debt service rate is allocated to repay tax supported debt in the Debt Service Fund. The debt service revenue of $18.5 million will be used to pay long-term debt. One-cent of the property tax rate will generate $564,461 in revenue.
Actual FY 2017-18
Revised FY 2018-19
Adopted FY 2019-20
Percent of Total
Ad Valorem Tax 16,584,266 19,626,697 23,074,153 26.71%Sales Tax 34,733,037 37,519,111 38,088,295 44.09%Franchise Fees - City 7,523,959 7,448,680 7,457,321 8.63%Franchise Fees - Other 1,470,349 1,534,194 1,563,318 1.81%Other Taxes 823,135 969,977 1,018,476 1.18%Licenses and Permits 3,250,606 3,598,452 3,361,754 3.89%Fines and Penalties 1,235,900 1,205,500 1,249,990 1.45%Interest Income 438,949 463,586 463,801 0.54%Cultural and Recreational 752,371 782,411 772,872 0.89%Other Agencies 533,934 691,068 786,344 0.91%Current Services 735,208 911,763 910,337 1.05%Other Revenue 945,393 1,020,281 1,074,222 1.24%Reimbursements from Other Funds 5,728,020 6,272,291 6,563,052 7.60%Total 74,755,128 82,044,010 86,383,933 100.00%
2019/2020 Annual Budget General Fund Revenue Summary

City of San Marcos | FY20 Adopted Budget
City of San Marcos | Finance
27
Historically, property taxes represent a relatively stable source of revenue for the City. In general, property tax revenues tend to increase and are not subject to dramatic shifts in the economy. There was a slight decline in tax year 2010 of 1.2%. The City’s property tax base has grown consistently since the decline in 2010 and due to the current economic climate this trend should continue.
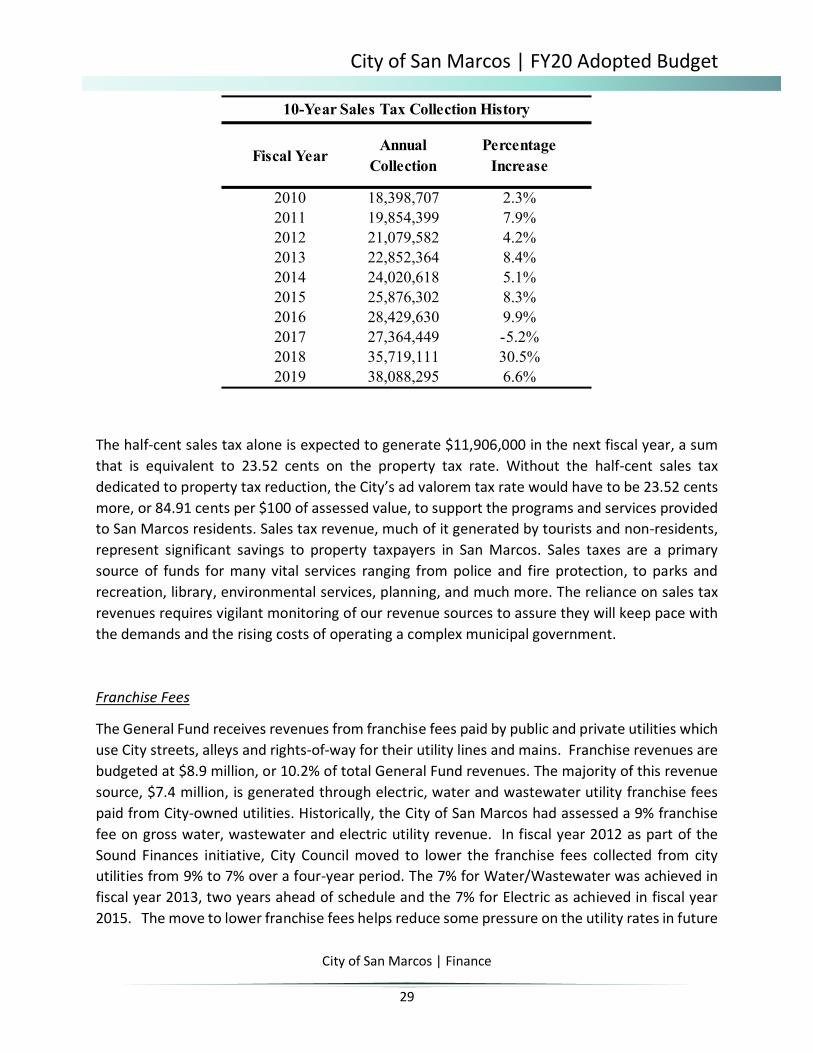
Sales Taxes
Sales taxes represent 44.4% of total General Fund revenue projected for fiscal year 2020. Sales tax receipts are the largest single revenue source supporting general governmental services in San Marcos. Consistent retail sales have kept this revenue stream steady for the past several years. When comparing historical sales tax collections by segment, the percentage represented by retail collections has decreased while other segments have increased, indicating a small diversification in the sales taxes produced in the City. It is important to note that sales tax revenues are a volatile funding source and are subject to shifts in local, state and national economies. Our reliance on this revenue source is approached with caution.
The City’s adopted Financial Policy utilizes conservative forecast guidelines for projecting budgetary sales tax estimates. The current financial policy states that the estimated percentage increase in sales tax revenue may not exceed the actual percentage increase of the most recently completed fiscal year that resulted in a positive increase. The previous financial policy was revised in 2011 to account for those years when a decrease in sales tax occurs within the City, as
10-Year Appraisal Roll History (Property Tax Year)
0
1,000
2,000
3,000
4,000
5,000
6,000
2010 2011 2012 2013 2014 2015 2016 2017 2018 2019
Mill
ions

City of San Marcos | FY20 Adopted Budget
City of San Marcos | Finance
28
was the case in 2009 when sales taxes decreased by 1.95%. The fiscal year 2017 collections fell below the fiscal year 2016 collections due to significant one-time revenue generated by the construction and purchase of construction materials and robotics for the Amazon Distribution Center in fiscal year 2016. Per the budget policy statement that was adopted by City Council, an estimate of 2% increase in base sales tax, 2% increase in sales taxes from the outlet malls, and 2% in sales taxes expected to be generated by the new Best Buy call center.
As sales taxes represent 44.4% of the total General Fund revenues, they represent the greatest single source of revenue for the General Fund. Any excess collection above the fiscal year 2019 estimate goes directly into General Fund balance or the budget can be amended to allocate these amounts. The City Council has entered into a performance based 380 economic development agreements which include sales tax and/or property tax rebates with several businesses including HEB for construction of additional warehouse space and job creation, Epic Piping for relocation of their manufacturing facility, Urban Mining for construction and operations of a manufacturing facility, Humpty Dumpty LTD for the Springtown Shopping Center redevelopment, Tanger Properties for improvements at the Tanger Outlet Mall, Amazon.com for the construction and operations of a distribution center, Best Buy for 75% of sales tax revenues generated by the call center located in San Marcos and anticipate more as the City continues to grow and attract quality businesses.
The City of San Marcos collects one and one-half cents on every dollar spent on taxable goods and services within the City limits. The State of Texas allows home rule cities like San Marcos to adopt a one-cent sales tax to support general governmental services. Local voters authorized another half-cent in 1987 dedicated solely to the reduction of property taxes. The one and one half cents collected by the City represents the maximum we may adopt.
City of San Marcos | FY20 Adopted Budget
City of San Marcos | Finance
29
The half-cent sales tax alone is expected to generate $11,906,000 in the next fiscal year, a sum that is equivalent to 23.52 cents on the property tax rate. Without the half-cent sales tax dedicated to property tax reduction, the City’s ad valorem tax rate would have to be 23.52 cents more, or 84.91 cents per $100 of assessed value, to support the programs and services provided to San Marcos residents. Sales tax revenue, much of it generated by tourists and non-residents, represent significant savings to property taxpayers in San Marcos. Sales taxes are a primary source of funds for many vital services ranging from police and fire protection, to parks and recreation, library, environmental services, planning, and much more. The reliance on sales tax revenues requires vigilant monitoring of our revenue sources to assure they will keep pace with the demands and the rising costs of operating a complex municipal government.
Franchise Fees
The General Fund receives revenues from franchise fees paid by public and private utilities which use City streets, alleys and rights-of-way for their utility lines and mains. Franchise revenues are budgeted at $8.9 million, or 10.2% of total General Fund revenues. The majority of this revenue source, $7.4 million, is generated through electric, water and wastewater utility franchise fees paid from City-owned utilities. Historically, the City of San Marcos had assessed a 9% franchise fee on gross water, wastewater and electric utility revenue. In fiscal year 2012 as part of the Sound Finances initiative, City Council moved to lower the franchise fees collected from city utilities from 9% to 7% over a four-year period. The 7% for Water/Wastewater was achieved in fiscal year 2013, two years ahead of schedule and the 7% for Electric as achieved in fiscal year 2015. The move to lower franchise fees helps reduce some pressure on the utility rates in future
Fiscal YearAnnual
CollectionPercentage
Increase
2010 18,398,707 2.3%2011 19,854,399 7.9%2012 21,079,582 4.2%2013 22,852,364 8.4%2014 24,020,618 5.1%2015 25,876,302 8.3%2016 28,429,630 9.9%2017 27,364,449 -5.2%2018 35,719,111 30.5%2019 38,088,295 6.6%
10-Year Sales Tax Collection History

City of San Marcos | FY20 Adopted Budget
City of San Marcos | Finance
30
years. There was a temporary increase in fiscal years 2018 and 2019 but City Council lowered franchise fees back to 7% for fiscal year 2020.
The remaining portion of franchise fees, $1.5 million, is collected from telephone, cable and gas utility companies operating within the jurisdictional limits of the City. These smaller franchise fees are estimated through the conservative forecasting technique. This conventional technique assumes that historic collections will remain constant and that the revenue source is stable. Several outside entity franchise agreements were renegotiated in 2010 and several more agreements expire in future years. City staff will be examining other providers to ensure that all agreements are consistent and in the best interest of the City.
Licenses and Permits
Licenses and permits represent the various fees collected for such activities as construction, plumbing, electrical, development and food service operation. Various permits such as building, mechanical, plumbing, zoning, site development, food handler, moving and alarm permits are required for business operation. These monies are used to fund the operating costs of functions associated with enforcing codes and building regulations.
The City has experience steady growth in the past few years and have seen tremendous growth in all areas of construction including single family, commercial and especially multi-family structures. Approximately 60% of all multi-family structures constructed since 2007 have been student oriented. The fiscal year 2020 budgeted revenue from licenses and permits is $3.3 million or 3.9% of total General Fund revenues. This amount is consistent with the previous budget growth and reflects a conservative estimate of the future commercial and residential development occurring within the City. Projections are based on an assessment of development trends in the area.
Fines and Penalties
Revenues from fines and penalties for fiscal year 2020 are budgeted at $1.2 million, or 1.45% of total General Fund revenues. The City once again participated in the regional warrant round-up in March 2019. Eighteen regional courts participate in the warrant round-up which gains tremendous media coverage leading to the actual round-up. In 2006, a Deputy Marshal position was added to improve the professionalism of the court operations and to further increase our collection rate and in 2010, an additional part-time Deputy Marshal position was added to further improve the City’s collection efforts.

City of San Marcos | FY20 Adopted Budget
City of San Marcos | Finance
31
Interest Income
Total revenues from interest for fiscal year 2020 are budgeted at $464,000 or .5% of total General Fund revenues. Anticipated interest earnings are based on market projections of interest rates, which have increased from the historic low rates seen since 2010. The current rate of return is approximately 1.5%. Some funds are invested over longer periods for a higher return and per the Investment Policy Reserve Funds can be invested up to 5-years.
Cultural and Recreational
Total revenues from cultural and recreational services for fiscal year 2020 are budgeted at $772,000 or 0.89% of total General Fund revenues. Cultural and recreational revenue sources include library fees, and other various fees and service charges from Parks and Recreation programs and Activity Center usage fees. The program fees and service charges are dependent upon usage of City facilities and program attendance. The City operates a wide variety of recreational programs throughout the year. Included in these fees is the Hays County contribution of $85,000 per year that helps in the funding of the City Library.
In fiscal year 2019 City Council adopted a Fee Policy based on cost recovery methodology. Cultural and Recreational fees will be evaluated and proposed to City Council based on cost recovery and the Fee Policy during the year.
Charges for Current Services
Total revenue from current services is estimated at $910,000 or 1.0% of General Fund revenues. Revenues within this category include animal shelter charges, birth and death certificate fees, passport fees, various fees assessed through the Police Department such as accident report fees, and the Community Enhancement Fee which was increased 50 cents per month for all residents and businesses in fiscal year 2019. Revenue projections are based on historical collection data.
Other Revenues
Other revenues include reimbursements from other governmental agencies for various services performed by the City and from a variety of other sources that do not meet the classification requirement of other categories. The total other revenues for fiscal year 2020 are estimated at $1,074,000, or 1.2% of total General Fund revenues.
The City and SMCISD are parties to a contract that calls for the school district to reimburse the City for 50% of the annual salaries and benefit costs for providing four uniformed officers within

City of San Marcos | FY20 Adopted Budget
City of San Marcos | Finance
32
the school system. Another significant portion of this revenue source is a reimbursement received from Texas State University-San Marcos. The University reimburses the City 50% of the cost of salary and benefits for our Habitat Conservation position. Also, the City of Kyle, City of Buda and Hays County participate in the City’s Regional Animal Shelter funding each year. That contribution commitment has been adjusted to reflect actual operating costs and is budgeted at $515,000 in 2020.
The other revenues include ordinance copies, insufficient funds service charges, rebates generated from the purchase card program and sales tax discounts. Revenue assumptions for this category are based on historical collection data.
Reimbursements from Other Funds and Operating Transfers
The General Fund bears the costs for administrative services such as legal, human resources, purchasing, finance, administration, information technology, and building and equipment usage. These costs are reviewed and calculated annually by an independent firm, which then recommends the reimbursements assigned to each fund. Reimbursements from other funds represent $6.5 million, or 7.6% of total general fund revenues.
Expenditures
The General Fund is the primary operating fund for city government. Several internal service departments, including City Manager’s Office, Legal, City Clerk, City Council, Finance, Human Resources, and Technology Services, have costs allocated among the General Fund, Enterprise Funds and Special Revenue Funds, reflecting the cost of providing these services. Total General Fund expenditures for fiscal year 2020 are budgeted at $87,913,319 a 8.8% increase from the adopted FY 2019 budget. General Fund departments include:
- Administrative Services (City Manager, City Clerk, Communications, Human Resources, Information Technology, GIS, Finance and Legal)
- Community Development (Development Services Admin, Planning, Permit Center, Inspections, Engineering, Real Estate, and Library)
- Public Safety (Fire Service, Police Service, Municipal Court, and Office of Emergency Management)
- Public Services (Transportation Admin, Traffic Control, and Streets) - Neighborhood Enhancement (Neighborhood Services, Animal Services, Community

City of San Marcos | FY20 Adopted Budget
City of San Marcos | Finance
33
Enhancement, and Code Compliance) - General Services (General Services Admin, Facilities, Grounds and Maintenance, and
Fleet) - Parks & Recreation (Parks and Recreation, Activity Center, Outdoor Pool, Park Rangers) - General Government (Social Services and Special Services)
Fund Balance
Each fund maintains a fund balance that is available to cover operating expenses in the event of revenue shortfalls or other unforeseen events. The anticipated General Fund balance at the end of fiscal year 2020 is $18.0 million or 25.0% of expenditures. This large fund balance represents our commitment to using best business practices and conservative revenue estimates.
The Debt Service Fund
The Debt Service Fund is used to account for the debt service portion of property tax revenues received. Debt service taxes are specifically assessed for the payment of general long-term debt principal and interest. The use of a separate fund ensures that debt service tax revenues are not commingled with other revenues and not used for any purpose other than debt repayment. Debt
Actual FY 2017-18
Revised FY 2018-19
Adopted FY 2019-20
Percent of Total
Personnel 47,354,777 49,195,236 54,591,889 62.10%Contracted Services 7,309,680 7,264,857 8,048,079 9.15%Materials and Supplies 4,872,265 4,540,971 4,843,879 5.51%Other Charges 4,115,260 3,930,720 4,499,925 5.12%Social Services 450,000 500,000 500,000 0.57%Operating Transfers 1,418,405 2,819,172 4,360,093 4.96%Capital Outlay and Maintenance 2,734,871 2,783,359 3,142,234 3.57%Economic Development Incentives 6,117,307 7,232,883 7,727,220 8.79%Other Incentives 207,020 200,000 200,000 0.23%Total 74,579,585 78,467,197 87,913,319 100.00%
2019/2020 Annual Budget General Fund Expenditure Summary by Expense Category
City of San Marcos | FY20 Adopted Budget
City of San Marcos | Finance
34
limits regarding general obligation debt can be found within the City’s Financial Policy in this document.
Revenues and Expenditures
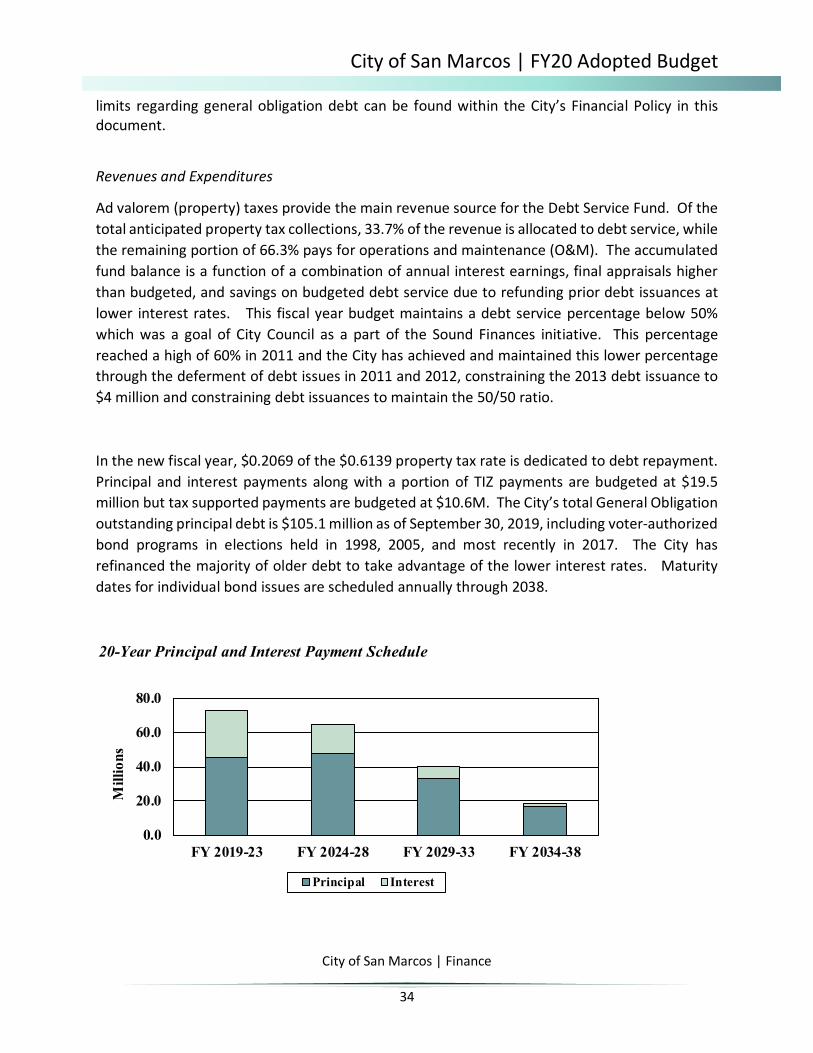
Ad valorem (property) taxes provide the main revenue source for the Debt Service Fund. Of the total anticipated property tax collections, 33.7% of the revenue is allocated to debt service, while the remaining portion of 66.3% pays for operations and maintenance (O&M). The accumulated fund balance is a function of a combination of annual interest earnings, final appraisals higher than budgeted, and savings on budgeted debt service due to refunding prior debt issuances at lower interest rates. This fiscal year budget maintains a debt service percentage below 50% which was a goal of City Council as a part of the Sound Finances initiative. This percentage reached a high of 60% in 2011 and the City has achieved and maintained this lower percentage through the deferment of debt issues in 2011 and 2012, constraining the 2013 debt issuance to $4 million and constraining debt issuances to maintain the 50/50 ratio.
In the new fiscal year, $0.2069 of the $0.6139 property tax rate is dedicated to debt repayment. Principal and interest payments along with a portion of TIZ payments are budgeted at $19.5 million but tax supported payments are budgeted at $10.6M. The City’s total General Obligation outstanding principal debt is $105.1 million as of September 30, 2019, including voter-authorized bond programs in elections held in 1998, 2005, and most recently in 2017. The City has refinanced the majority of older debt to take advantage of the lower interest rates. Maturity dates for individual bond issues are scheduled annually through 2038.
20-Year Principal and Interest Payment Schedule
0.0
20.0
40.0
60.0
80.0
FY 2019-23 FY 2024-28 FY 2029-33 FY 2034-38
Mill
ions
Principal Interest

City of San Marcos | FY20 Adopted Budget
City of San Marcos | Finance
35
The types of projects financed through long-term general obligation debt include major street projects, public safety facilities and equipment, library, parks and recreational facilities. Debt payments for revenue bonds which finance water, wastewater, electric and drainage projects are repaid separately through those respective enterprise funds.
Special Revenue Funds
Special revenue funds are used to account for the proceeds of certain specific revenue sources that are legally restricted to expenditures for specified purposes. The City utilizes this type of fund to account for revenues such as hotel occupancy tax, grants, special fines authorized by the State, and forfeiture revenue from seized assets.
Hotel Occupancy Tax Fund
The Hotel Occupancy Tax Fund is used to account for a local bed tax of 7%. During fiscal year 2008, San Marcos residents approved an additional Venue Tax of 2% to pay for the debt related to the City’s Conference Center. Tax monies collected are used for tourist development activities in accordance with State law.
Revenues
The 9% occupancy tax is charged to occupants of rooms rented from hotels, motels and inns located in the City. The tax is collected by owners of each facility and is remitted to the City monthly. Hotel Tax receipts received from the Embassy Suites Hotel are restricted solely for the repayment of conference center debt. Since fiscal year 2012, approximately 1,000 hotel rooms have been added with the majority being branded hotels.

City of San Marcos | FY20 Adopted Budget
City of San Marcos | Finance
36
Expenditures
The Hotel Occupancy Tax Fund supports tourist development activities, downtown revitalization and the arts. In fiscal year 2017, the Convention and Visitors Bureau (CVB) was brought into the City as a city department. The CVB has been part of the Chamber of Commerce’s organization, but City has provided the majority of the funding for the operations through HOT funding. During City Council fiscal year 2017 Visioning, Council directed staff to bring the CVB organizations into the City as a city department. Effective October 1, 2016 the CVB is part of the City organization.
The following table depicts the revenue distribution made from hotel occupancy taxes.
10-Year Hotel Occupancy Tax Collection History (Fiscal Year)
0
500,000
1,000,000
1,500,000
2,000,000
2,500,000
2010 2011 2012 2013 2014 2015 2016 2017 2018 2019

City of San Marcos | FY20 Adopted Budget
City of San Marcos | Finance
37
Community Development Block Grant Program Fund
In fiscal year 1994, the United States Department of Housing and Urban Development designated the City of San Marcos as an Entitlement City for the Community Development Block Grant (CDBG). The program is designed to eliminate slum and blight conditions and to serve the needs of low to moderate-income residents.
Women, Infants and Children (WIC) Program Fund
The Women, Infants and Children Program provides nutritional food supplements, nutritional counseling, clinical assessments, and education to pregnant women, breast-feeding mothers, infants and children up to five years of age. The City of San Marcos operates a five-county regional WIC program that is funded through the Texas Department of Health and Human Services and the United States Department of Agriculture. The budget of $2.0 million will provide nutritional food supplements, nutritional counseling, clinical assessments, and education to pregnant women, breast-feeding mothers, infants and children up to five years of age who live in Hays, Caldwell, Comal and Guadalupe Counties. San Marcos is unique in being a municipality in Texas that administers a multi-county regional WIC program. The entire program is reimbursed with state and federal funds. Seized Assets Fund
This fund, established in 2001, provides budgeting and accountability for revenues collected from the sale of forfeited and seized assets belonging to various criminals engaged in certain illegal
Hotel Occupancy Tax Revenue DistributionFY 2019 FY 2020
Program Adopted Adopted1,441,772 1,695,236
211,250 275,000354,026 388,089126,750 50,00010,000 20,00025,350 30,00033,800 40,00050,700 60,00029,575 35,000
TOTAL 2,283,222 2,593,325
Convention & Visitors BureauArts CommissionMain Street ProgramTanger Marketing ProgramConference Building RepairsDowntown Marketing CoopEco TourismSports TourismMural Funding

City of San Marcos | FY20 Adopted Budget
City of San Marcos | Finance
38
activities. Revenues from these seized assets are used to fund various technology improvements in our Police Department. These revenues are projected at $5,000 for the fiscal year. Projections are based on historical collection assumptions. Expenditures for this fund include the annual audit of this fund, specific police projects and enhancements, and purchase of specialized equipment and software. Other Special Revenue Funds
The Cemetery Operations Fund provides for maintenance and upkeep of the historic San Marcos City Cemetery. The Cemetery Operations Fund, with a budget of $239,000 provides for maintenance of the historic San Marcos City Cemetery. The General Fund transfer is the largest source of Cemetery Operations Fund revenue. Revenues such as burial permits, monument permits, and cemetery lot sales are calculated based on the current fees and the annual estimated number of sales. The transfer from the General Fund is $180,000 for operations and includes an additional appropriation for $50,000 to make improvements to the cemetery and perform needed repairs. In its 1999 legislative session, the Texas Legislature established the Municipal Court Technology Fund through Senate Bill 601 to provide a funding source to local municipal courts for future technological enhancements to their respective court systems. In response, the City of San Marcos established the Municipal Court Technology Fund to provide budgeting and accountability for the funds received through the collection of the technology fee. The revenues collected are legally restricted for making technological enhancements to the Municipal Court, which may include computer systems, networks, hardware, software, imaging systems, electronic kiosks, electronic ticket writers or docket management systems. Revenue is projected at $25,000. Revenue estimates are based on historical trend information and follow the same assumptions as Fines & Penalties revenues within the General Fund. Expenditures for technology improvements are estimated at $5,000.
The Municipal Court Juvenile Fee was established in 2009. This sole use of this fund is to establish a funding source for a Juvenile Case Manager position, which is now being budgeted as a full-time position and funded equally by the General Fund and the Juvenile Fee. The revenue for this fund is estimated at $36,000.
The Municipal Court Security Fee was established to help enhance security within municipal courts. This sole use of this fund is to enhance security within the court operations. Revenue from the fund is used to wholly fund one of the Municipal Court Marshal’s. The revenue for this fund is estimated at $18,000.

City of San Marcos | FY20 Adopted Budget
City of San Marcos | Finance
39
The Tax Increment Reinvestment Zone #2 Blanco Vista Development Fund was established in 2010. This fund tracks property tax revenues from the City and Hays County which are specifically restricted for the repayment of debt to the developers of the Yarrington Road Overpass. The restricted property tax revenues are estimated to be $1,308,000.
The Tax Increment Reinvestment Zone #3 Conference Center Fund was established in 2010. This fund tracks property tax revenues from the City and Hays County which are specifically restricted for the repayment of debt related to the building of the City of San Marcos Conference Center. The restricted property tax revenues are estimated to be $224,000.
The Tax Increment Reinvestment Zone #4 Kissing Tree Development Fund was established in 2011. This fund tracks property tax revenues from the City and Hays County which are specifically restricted for the repayment of improvements to the developers. The restricted property tax revenues are estimated to be $108,000.
The Tax Increment Reinvestment Zone #5 Downtown Fund was established in 2012. This fund tracks property tax revenues from the City and Hays County which are dedicated source of sustainable funding for downtown improvements in support of the adopted Downtown Master Plan. The restricted property tax revenues are estimated to be $1,100,000.
The Transportation Reinvestment Zone #1 Loop 110 Fund was established in 2013. This fund tracks property tax revenues which are specifically restricted for the repayment of debt related to the construction of Loop 110. The restricted property tax revenues are estimated to be $1,257,000.
Capital Improvements
The City adopts a 10-year Capital Improvements Program plan annually with the first year of the 10-year plan constrained. The CIP plan is a budgetary tool for community decision-makers and suggests a variety of possible projects and particular years in which projects might be authorized. Each year the CIP plan reflects the priorities established by the City Council in their budget policy statement. A summary by major fund for the first five years of the plan is below.

City of San Marcos | FY20 Adopted Budget
City of San Marcos | Finance
40
Capital Improvement Program Five-Year Summry by FundFY20
AdoptedFY21
ProjectedFY22
ProjectedFY23
ProjectedFY24
ProjectedGeneral Fund $16,915,000 $12,636,666 $9,359,000 $28,655,000 $26,226,000
Water Fund $8,930,000 $41,325,000 $16,255,000 $18,296,000 $8,755,000Wastewater Fund $13,531,000 $13,750,666 $9,810,000 $18,261,000 $7,205,000Stormwater Fund $3,775,000 $19,370,000 $16,010,000 $24,980,000 $14,086,000
Electric Fund $15,761,247 $4,247,087 $3,422,702 $5,075,000 $5,860,000Grand Total All Funds $58,912,247 $91,329,419 $54,856,702 $95,267,000 $62,132,000

City of San Marcos | FY20 Adopted Budget
City of San Marcos | Finance
41
Enterprise Funds
Enterprise funds are used to account for governmental activities that are similar to those found in private businesses. The major revenue source for these funds is the revenue generated from customers who receive the services provided. Revenues generated through the rates pay the operating costs and debt retirement for these funds. In 2012, a Citizens Utility Advisory Board (CUAB) was formed at the direction of the City Council. This board is made up of 5 citizens and the Mayor who is a non-voting member. The charge of the board is to bring recommendations for budget and rates for both the Water/Wastewater and Electric utilities to the City Council. The Board met with staff to gain an understanding of how the utilities operate, the composition of the rates and the issues facing the utilities in the upcoming years.
Water and Wastewater Utility Fund
The City of San Marcos operates a superior water production, distribution and wastewater collection and treatment system for the community. This fund is used to account for the revenues and expenses of this utility system. Revenues
The Water/Wastewater Utility Fund receives revenue from residential, multi-family and commercial customers based on their monthly water consumption. San Marcos water and wastewater rates are provided in detail within the Miscellaneous and Statistical section of the budget.

City of San Marcos | FY20 Adopted Budget
City of San Marcos | Finance
42
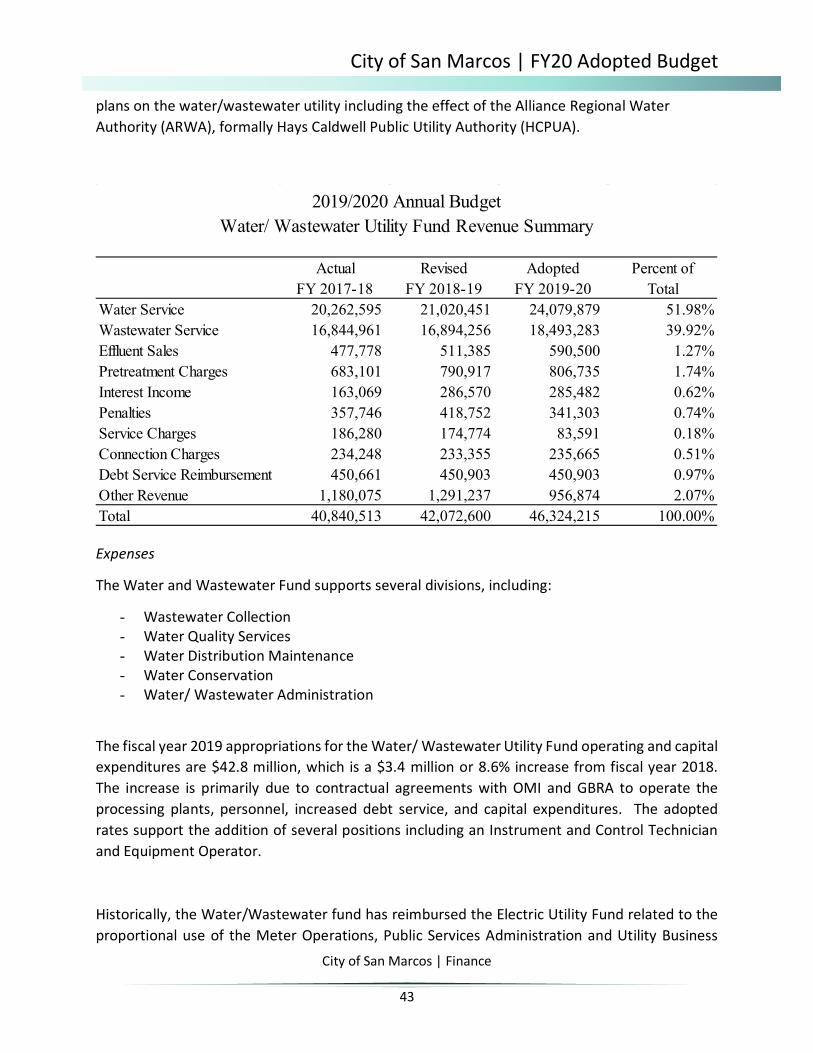
Revenue projections for water and wastewater revenues are based on factors such as historical collections, known changes that will occur, system growth factors and weather predictions. Projected revenues from all sources are budgeted at $43.2 million. Revenues from water service are estimated at $20.8 million and wastewater revenues are estimated at $18.7 million. Other revenue sources include sales of effluent, pretreatment charges, wheeling sales, service and connection charges, and interest income.
Prior to fiscal year 2012, there had not been consistent rate adjustments to support the utility but since there have been small, consistent rate increase to support the growing utility. In fiscal year 2014, the CUAB chose to implement a new tiered structure for rates instead of recommending a rate adjustment. The resulting rate structure emphasizes conservation with charges beginning at the first gallon used and modifications to the tiers to more closely resemble non-irrigation usage in the lower levels. The City implemented winter averaging in early 2008.
A Water/Wastewater Rate Study has been conducted every year for the last several years including 2018. For the 2019 budget, the CUAB recommends a 5% rate adjustment in water and a 2% rate adjustment in wastewater. The CUAB spent several months looking at the updated rate study modeling, the impacts of the newly implemented rate structure, and the long range
10-Year Water/Wastewater Service Revenue History (Fiscal Year)
0.0
5.0
10.0
15.0
20.0
25.0
30.0
35.0
40.0
2010 2011 2012 2013 2014 2015 2016 2017 2018 2019
Mill
ions
Water Wastewater
City of San Marcos | FY20 Adopted Budget
City of San Marcos | Finance
43
plans on the water/wastewater utility including the effect of the Alliance Regional Water Authority (ARWA), formally Hays Caldwell Public Utility Authority (HCPUA).
Expenses
The Water and Wastewater Fund supports several divisions, including:
- Wastewater Collection - Water Quality Services - Water Distribution Maintenance - Water Conservation - Water/ Wastewater Administration
The fiscal year 2019 appropriations for the Water/ Wastewater Utility Fund operating and capital expenditures are $42.8 million, which is a $3.4 million or 8.6% increase from fiscal year 2018. The increase is primarily due to contractual agreements with OMI and GBRA to operate the processing plants, personnel, increased debt service, and capital expenditures. The adopted rates support the addition of several positions including an Instrument and Control Technician and Equipment Operator.
Historically, the Water/Wastewater fund has reimbursed the Electric Utility Fund related to the proportional use of the Meter Operations, Public Services Administration and Utility Business
Actual FY 2017-18
Revised FY 2018-19
Adopted FY 2019-20
Percent of Total
Water Service 20,262,595 21,020,451 24,079,879 51.98%Wastewater Service 16,844,961 16,894,256 18,493,283 39.92%Effluent Sales 477,778 511,385 590,500 1.27%Pretreatment Charges 683,101 790,917 806,735 1.74%Interest Income 163,069 286,570 285,482 0.62%Penalties 357,746 418,752 341,303 0.74%Service Charges 186,280 174,774 83,591 0.18%Connection Charges 234,248 233,355 235,665 0.51%Debt Service Reimbursement 450,661 450,903 450,903 0.97%Other Revenue 1,180,075 1,291,237 956,874 2.07%Total 40,840,513 42,072,600 46,324,215 100.00%
2019/2020 Annual Budget Water/ Wastewater Utility Fund Revenue Summary

City of San Marcos | FY20 Adopted Budget
City of San Marcos | Finance
44
Office which are expensed within the Electric Utility Fund. In fiscal year 2019, the cost of these shared departments and special projects is $4.0 million. Reimbursement from the Water/Wastewater fund is $1.7 million.
The Alliance Regional Water Authority (ARWA), formally Hays Caldwell Public Utility Authority, is a joint venture between San Marcos, Kyle, Buda, and some regional water corporations to firm up future water supplies through the year 2060. The City of San Marcos’ share of the total construction cost related to Phase 1 of the project is approximately $70.0 million and the majority of the construction is anticipated to begin in 2019. A small project related to Phase I was begun in 2016 and will construct a pipeline between San Marcos, Kyle and Buda. The City is still exploring water supply alternatives in hopes that this future expense can be reduced as much as possible. The City has set aside cash reserves along with steady rate increases to make sure there is capacity to fund the future infrastructure costs related to this project without large rate increases.
Debt Service
Debt service in the Water/Wastewater Fund is budgeted at $14.4 million. The total outstanding debt of the utility system is $113.5 million as of September 30, 2019. It is important to note that the significant investments in water and wastewater infrastructure projects undertaken by the City of San Marcos were required to respond to regional, state or federal mandates. Significant investments in upgrading the wastewater treatment plant and collection system were made to meet high level treatment standards mandated by the U.S. Environmental Protection Agency and
Actual FY 2017-18
Revised FY 2018-19
Adopted FY 2019-20
Percent of Total
Personnel 4,616,326 4,915,431 5,354,194 11.73%Contracted Services 8,997,094 10,798,524 11,469,409 25.12%Materials and Supplies 1,068,704 1,444,818 1,520,388 3.33%Other Charges 10,248,645 9,660,729 10,326,913 22.61%Operating Transfers 69,856 137,607 161,514 0.35%Capital Outlay 454,061 343,000 240,000 0.53%Transfer to Capital Reserves 2,600,000 1,400,000 2,193,928 4.80%Debt Service 12,219,133 13,361,334 14,397,947 31.53%Total 40,273,819 42,061,443 45,664,293 100.00%
Water/ Wastewater Utility Fund Expense Summary by Category

City of San Marcos | FY20 Adopted Budget
City of San Marcos | Finance
45
the Texas Commission on Environmental Quality, and to add plant capacity for future growth. Debt payments on these significant projects are scheduled through fiscal year 2037.
Fund Balance
We anticipate an ending fund balance of $10.8 million or 25.0% of operating expenses. Fund balance transfers are incorporated into this budget to reduce the fund balance down to 25%. The transfers will be used to fund or offset future debt issuances related to capital improvement projects.
Rate Stabilization
This budget establishes a rate stabilization fund which is funded at 10% of water revenues and 5% of wastewater revenues. This will help the City alleviate future rate increases that are needed due to fluctuations in seasonal weather patterns. This is a component in achieving our sound finance initiative.
Stormwater Utility Fund
The City of San Marcos began assessing a stormwater utility rate in fiscal year 2000 on all residential and commercial property located in the City. The stormwater charge was established to provide funding for the planning, engineering, construction, maintenance, improvement and reconstruction of drainage projects throughout the City.
20-Year Principal and Interest Payment Schedule Water/Wastewater
0.0
10.0
20.0
30.0
40.0
50.0
60.0
FY 2019-23 FY 2024-28 FY 2029-33 FY 2034-38
Mill
ions
Principal Interest

City of San Marcos | FY20 Adopted Budget
City of San Marcos | Finance
46
Revenues and Expenses
The San Marcos Stormwater Utility Fund is an enterprise fund supported by assessment of stormwater utility fees. The Stormwater Utility was created in July 1999 by Council to address the need for drainage improvements throughout the City. Revenues from the fees are used to maintain stormwater areas and right of ways and providing debt service in future years to pay for future bond issuances related to drainage improvements. Over the past four years the rate has been adjusted as follows: 2014-5%, 2015-5%, 2016-12%, 2017-10%, 2018 and 2019 15%. In fiscal year 2020 a new rate study will be completed to with anticipated rate adjustments recommended to City Council. Projected revenues from fees for fiscal year 2020 budget are $6.8 million.
Operating expenses are budgeted at $6.4 million, which includes an additional maintenance crew and equipment.
Debt Service
Debt service in the Stormwater Utility Fund is budgeted at $3.4 million. As of September 30, 2020 the Stormwater Utility has outstanding debt of $36.7 million for improvements to the stormwater utility system. The current debt will be repaid annually until fiscal year 2038.
Fund Balance
We anticipate an ending fund balance reserves of $1.5 million in the Drainage Utility Fund at September 30, 2019.
Electric Utility Fund
20-Year Principal and Interest Payment Schedule Stormwater
0.0
5.0
10.0
15.0
20.0
FY 2019-23 FY 2024-28 FY 2029-33 FY 2034-38
Mill
ions
Principal Interest

City of San Marcos | FY20 Adopted Budget
City of San Marcos | Finance
47
The City of San Marcos purchases and distributes electric power to the San Marcos community. San Marcos has some of the lowest electric rates in Texas. The utility operates at a 99.7% reliability rate and has a system capacity of 210 megawatts. Revenues
The Electric Utility Fund is an enterprise fund established to purchase and distribute electric power to the San Marcos community. The utility receives revenues through rates charged to customers for electric service, from other operating revenues and interest income. The projected revenues from all sources are budgeted at $62.8 million with $58.0 million generated by electric services. This is a decrease of $1.0 million primarily due to a reduction in the pass-through cost of purchased power to the customer. This reduction in budget results in lower overall customer charges and reflects lower costs of electric power in the Texas electrical grid.
The City and LCRA executed an amended and restated Wholesale Power Agreement in March of 2011 which included a provision that granted the City a right and option to participate in ownership of any future generation capacity constructed by LCRA on a load proportional basis. LCRA announced plans for the Thomas C. Ferguson replacement plant project, creating the opportunity for the City to exercise this right and option. Staff researched the financial requirements and forecast financial net revenue associated with the plant over the life cycle of the facility and presented information to the Council on the risk/benefit issues related to the option. Participation in ownership of the facility is forecasted to enhance revenue to the City Electric Utility and benefit the ratepayers. The City of San Marcos issued Electric Utility System Revenue Bonds in July 2013 totaling $18.5 Million to finance this project. The project came in on-time and within the construction budget. The plant began producing power during the summer of 2014 and the electric utility has benefited from the participation not only from the operations of the plant, but also the opportunity to receive power at a reduced cost to the city.
Actual FY 2017-18
Revised FY 2018-19
Adopted FY 2019-20
Percent of Total
Electric Service 56,128,647 53,990,594 57,203,312 92.24%Interest Income 156,283 164,816 281,959 0.45%Penalties 539,630 623,152 568,428 0.92%Service Charges 110,964 422,378 190,072 0.31%Connection Charges 713,408 673,877 697,985 1.13%Other Revenue 890,678 621,453 381,455 0.62%Indirect Costs 1,910,907 2,252,585 2,675,413 4.31%Operating Transfers 22,055 21,615 19,720 0.03%Total 60,472,572 58,770,470 62,018,343 100.00%
2019/2020 Annual Budget Electric Utility Fund Revenue Summary

City of San Marcos | FY20 Adopted Budget
City of San Marcos | Finance
48
The City and American Electric Power (AEP) entered a Power Purchase Agreement in 2018 for a portion of the power generated at the AEP Trent wind farm located in west Texas between Abilene and Sweetwater. The City will begin to receive power from the 150 MW plant in July 2021 under an 8-year agreement. This project is the third renewable energy contract the City has entered, with a previous NextEra contract expiring in 2015 and the current Calpine agreement ending in June 2021.
For the 2020 budget, the Citizens Utility Advisory Board (CUAB) recommends no rate adjustment. The CUAB spent several months looking at the updated rate study modeling and the results indicated that no rate adjustment is necessary in fiscal year 2020.
Expenses
The Electric Utility Department provides efficient electric service to the San Marcos community. The expenditures for fiscal year 2020 are budgeted at $59 million. At $33 million, the cost of wholesale power from LCRA represents the largest expense in this fund. Departmental divisions include:
- Public Services Admin - Conservation
- Meter Operations - Administration
10-Year Electric Service Revenue History
0.0
10.0
20.0
30.0
40.0
50.0
60.0
70.0
2010 2011 2012 2013 2014 2015 2016 2017 2018 2019
Mill
ions
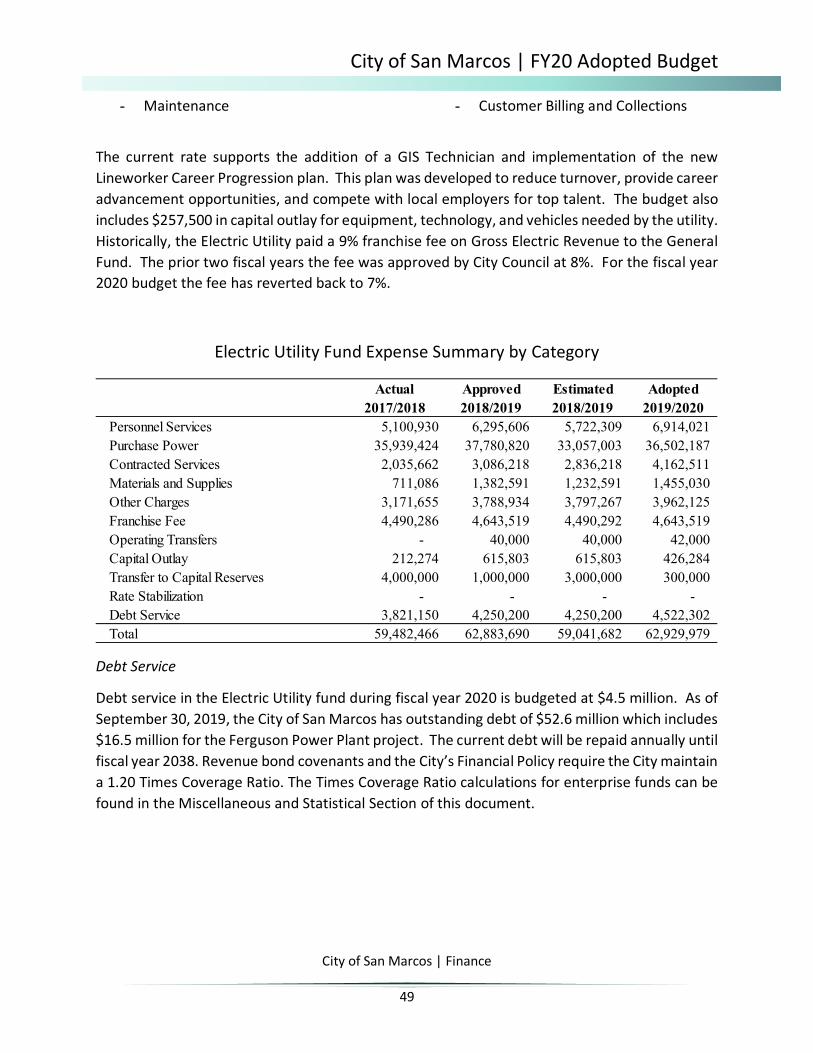
City of San Marcos | FY20 Adopted Budget
City of San Marcos | Finance
49
- Maintenance - Customer Billing and Collections
The current rate supports the addition of a GIS Technician and implementation of the new Lineworker Career Progression plan. This plan was developed to reduce turnover, provide career advancement opportunities, and compete with local employers for top talent. The budget also includes $257,500 in capital outlay for equipment, technology, and vehicles needed by the utility. Historically, the Electric Utility paid a 9% franchise fee on Gross Electric Revenue to the General Fund. The prior two fiscal years the fee was approved by City Council at 8%. For the fiscal year 2020 budget the fee has reverted back to 7%.
Electric Utility Fund Expense Summary by Category
Debt Service
Debt service in the Electric Utility fund during fiscal year 2020 is budgeted at $4.5 million. As of September 30, 2019, the City of San Marcos has outstanding debt of $52.6 million which includes $16.5 million for the Ferguson Power Plant project. The current debt will be repaid annually until fiscal year 2038. Revenue bond covenants and the City’s Financial Policy require the City maintain a 1.20 Times Coverage Ratio. The Times Coverage Ratio calculations for enterprise funds can be found in the Miscellaneous and Statistical Section of this document.
Actual Approved Estimated Adopted2017/2018 2018/2019 2018/2019 2019/2020
Personnel Services 5,100,930 6,295,606 5,722,309 6,914,021 Purchase Power 35,939,424 37,780,820 33,057,003 36,502,187 Contracted Services 2,035,662 3,086,218 2,836,218 4,162,511 Materials and Supplies 711,086 1,382,591 1,232,591 1,455,030 Other Charges 3,171,655 3,788,934 3,797,267 3,962,125 Franchise Fee 4,490,286 4,643,519 4,490,292 4,643,519 Operating Transfers - 40,000 40,000 42,000 Capital Outlay 212,274 615,803 615,803 426,284 Transfer to Capital Reserves 4,000,000 1,000,000 3,000,000 300,000 Rate Stabilization - - - - Debt Service 3,821,150 4,250,200 4,250,200 4,522,302 Total 59,482,466 62,883,690 59,041,682 62,929,979

City of San Marcos | FY20 Adopted Budget
City of San Marcos | Finance
50
Fund Balance
Fund balance at the end of fiscal year 2019 in the Electric Utility Fund is budgeted at $9.7 million or a reserve totaling 60 days of expenses. The Electric Utility, with millions of dollars worth of valuable substations and aboveground distribution facilities, is particularly vulnerable to weather-related disasters.
Rate Stabilization
This budget also establishes a rate stabilization fund which is funded at 5% of electric revenues. This will help the City alleviate future rate increases that are needed due to fluctuations in seasonal weather patterns. This is an initiative in achieving sound finances.
Municipal Airport Fund
The Municipal Airport has three runways and is situated on 1,356 acres. Additionally, there are 60 acres of maintained parking ramps and 38 City-owned hangars and shelters. Revenue sources such as storage rentals, hangar rentals, storage rentals, gross receipts fees and land leases partially support the daily operational costs. There are more than 300 based aircraft at the airport and more than 100,000 annual takeoffs, landings and approaches.
Revenues and Expenses
The San Marcos Municipal Airport Fund is an enterprise fund supported by revenues from hangar and shelter rentals, commercial and agricultural leases, and if required, a transfer from the General Fund for airport management. In fiscal year 2020 the Airport will not require a general fund transfer to support operations and operating revenue will exceed operating expenses. The
20-Year Principal and Interest Payment Schedule Electric Utility
0.05.0
10.015.020.025.0
FY 2019-23 FY 2024-28 FY 2029-33 FY 2034-38
Mill
ions
Principal Interest

City of San Marcos | FY20 Adopted Budget
City of San Marcos | Finance
51
Airport serves the general aviation needs of our residents and citizens in the surrounding region. Other revenues are relatively minor and are simple to forecast. Revenues such as T-hangar rentals, storage area rentals, facility rentals and shelter rentals are calculated based on the rental charge and the number of rental units rented. Other revenues such as gross receipt revenues are forecasted based on historical data.
The operational budget for the Airport Fund is $615,915. The Airport is managed by Texas Aviation Partners who oversees the daily operations and ongoing development. The Airport works closely with the Texas Department of Transportation and the Federal Aviation. Due to City Council and lobbying efforts, the City continues to receive federal appropriations funding. The City of San Marcos opened a new Air Traffic Control tower at the end of Fiscal Year 2011. Incentive payments to Texas Aviation Partners based on performance of the airport are estimated to be $99,865 in 2020.
Resource Recovery Utility Fund
The City of San Marcos outsources its residential solid waste collection through the use of a competitive bidding process. The solid waste collection company charges its monthly fee to the City on a per customer basis. This fee along with expenses for administration, education, household hazardous waste disposal and brush collection is used to set the rates charged to each resident within the City.
Revenues and Expenses
The Resource Recovery Utility Fund is an enterprise fund supported by assessment of residential waste collection, recycling service, and administrative and education charges. Projected revenues from service charges are budgeted at $4.8 million. Expenditures are $4.8 million for solid waste hauling, recycling and household hazardous waste collection and disposal. In fiscal year 2009 the City Council added single stream recycling to the services provided, Green Waste Collection was added for all residental customers fiscal year 2016. Hazardous Household Waste expenses are now budgeted within this fund.
Permanent Funds

City of San Marcos | FY20 Adopted Budget
City of San Marcos | Finance
52
The City serves as trustee for funds collected through its cemetery perpetual care fee. This fee is assessed on all municipal cemetery plots sold. Interest earned from the Cemetery Perpetual Care Fund is used to support the maintenance costs at the municipal cemetery. The principal amount of the fund cannot be used for any purpose. A true-up is done at the end of each year to ensure that estimated interest income budgeted is aligned properly with actual revenues received after a fiscal year has been closed. Interest earnings were not sufficient to make a transfer out of the Perpetual Care Fund and into the Cemetery Operations Fund since fiscal 2012.
The Perpetual Care Fund was dissolved in 2019 with the remaining balance of $1.1 million transferred to capital projects for the purchase of land to expand the cemetery.
Capital Improvements Program
The City of San Marcos has established an on-going ten-year Capital Improvements Program (CIP) to plan for major capital expenditures and identify funding sources for these projects. The CIP provides a ten-year strategic plan for important infrastructure investments for fiscal year 2019 to fiscal year 2028. The CIP is a budgetary tool for community decision-makers and suggests a variety of possible funding sources, ranging from operating budgets, state and federal grants, to future voter-approved bond programs. The CIP also suggests the particular year in which projects might be authorized. Only the first year of each CIP cycle is as part of the fiscal year's expenditures; the nine subsequent years are considered to be planning years.
Summary
The budget provides San Marcos with a balanced budget of $239.0 million to support essential public services and programs. We enter the new fiscal year with the most diversified property
Capital Improvement Program Ten-Year Summry by Fund
FY20 Adopted FY21 Projected FY22 Projected FY23 Projected FY24 ProjectedFY25 - FY29
Projected
General Fund $16,915,000 $12,636,666 $9,359,000 $28,655,000 $26,226,000 $77,380,000Water Fund $8,930,000 $41,325,000 $16,255,000 $18,296,000 $8,755,000 $40,855,000
Wastewater Fund $13,531,000 $13,750,666 $9,810,000 $18,261,000 $7,205,000 $40,654,000Stormwater Fund $3,775,000 $19,370,000 $16,010,000 $24,980,000 $14,086,000 $47,480,000
Electric Fund $15,761,247 $4,247,087 $3,422,702 $5,075,000 $5,860,000 $18,579,000Grand Total All Funds $58,912,247 $91,329,419 $54,856,702 $95,267,000 $62,132,000 $224,948,000

City of San Marcos | FY20 Adopted Budget
City of San Marcos | Finance
53
tax base in our history at $5.0 billion and healthy fund balances. We continue to direct our resources to fulfilling the City Council’s priorities in providing for our community development, infrastructure and excellent public service for our residents.
City staff feels that the FY2019-2020 Adopted Budget takes great strides toward achieving the City Council’s continued emphasis on Sound Finances. Several issues have been addressed:
Limiting future general debt issuances to maintain at least a 50/50 ratio. Renegotiated civil service meet and confer agreement Additional staffing in critical customer service areas including Parks and Recreation,
Animal Services, Electric, and Stormwater. Addition of funding for City Council Strategic Initiatives: Workforce Housing, Workforce
Development, Downtown Vitality, and Multi-modal Transportation. Moving forward with the bond projects approved by voters in May 2017.

City of San Marcos | FY20 Adopted Budget
City of San Marcos | Finance
54
City of San Marcos
FY2020 Adopted Budget Policy Statement
I. Fund Balance Assume no change to existing fund balance:
▫ General Fund 25% of recurring operating expenses ▫ Water/wastewater Fund: 25% of recurring operating expenses ▫ Drainage Utility Fund: 25% of recurring operating expenses ▫ Electric Utility Fund: Minimum of the equivalent of 60 days of operating
expenses including purchases power
II. Revenue
General Fund Property tax rate maintained at 61.39 cents per $100 of valuation Amend budget during fiscal year if revenue deviate from budget Revisit Over 65 tax freeze in June awaiting State Legislature ruling on Property
Tax cap on rollback rates Utility Fund franchise fee transfers to the General Fund reduced back to 7% Adjust fees according to Fee Policy (upon adoption), or CPI adjustment All other revenues will be budgeted based on historical trends Revenue generated from the increased tax rate’s operating & maintenance
capacity remaining $500,000 to be reserved for additional bond project expenses
Water/Wastewater Fund
Rate study to determine possible rate increases and structure changes Citizens Utility Advisory Board will make recommendations related tor ate
structure and future rate adjustments Meet and Confer negotiations for civil-service employees will be finalized later in
the budget process. The outcome will be reported later in the budget process. Merit and cost of living increase for non-civil service employees will be
determined later in the budget process. Estimated 10% increase in health insurance premium beginning January 1, 2020 Base operations budgets held flat. Additions to the department budgets must be
requested, justified, and ranked by priority.

City of San Marcos | FY20 Adopted Budget
City of San Marcos | Finance
55
Staffing needs will be evaluated through the department budget request process.
Electric Utility Fund Rate study to determine possible rate increases and structure changes. No rate
adjustment anticipated. Citizens Utility Advisory Board will make recommendations related tor ate
structure and future rate adjustments. Meet and Confer negotiations for civil-service employees will be finalized later in
the budget process. The outcome will be reported later in the budget process. Merit and cost of living increase for non-civil service employees will be
determined later in the budget process. Estimated 10% increase in health insurance premium beginning January 1, 2020. Base operations budgets held flat. Additions to the department budgets must be
requested, justified, and ranked by priority. Staffing needs will be evaluated through the department budget request
process.
Stormwater Utility Fund Rate study to determine possible rate increases and structure changes. Citizens Utility Advisory Board will make recommendations related tor ate
structure and future rate adjustments. Meet and Confer negotiations for civil-service employees will be finalized later in
the budget process. The outcome will be reported later in the budget process. Merit and cost of living increase for non-civil service employees will be
determined later in the budget process. Estimated 10% increase in health insurance premium beginning January 1, 2020. Base operations budgets held flat. Additions to the department budgets must be
requested, justified, and ranked by priority. Staffing needs will be evaluated through the department budget request
process.
Hotel Motel Fund Revenue budgeted based on conservative trends reflecting occupancy rate and
average room rate.

City of San Marcos | FY20 Adopted Budget
City of San Marcos | Finance
56
III. Expenditures
General Fund Strategic initiatives
▫ Workforce Housing ▫ Workforce Development ▫ Downtown Vitalization ▫ Multi modal transportation ▫ City Facilities
Animal Services – Increase live outcomes Maintenance funding
▫ Facilities ▫ Parks ▫ Streets
Meet and Confer negotiations for civil-service employees will be finalized later in the budget process. The outcome will be reported later in the budget process.
Merit and cost of living increase for non-civil service employees will be determined later in the budget process.
Estimated 10% increase in health insurance premium beginning January 1, 2020. Base operations budgets held flat. Additions to the department budgets must be
requested, justified, and ranked by priority. Staffing needs will be evaluated through the department budget request process Fuel/contractual obligations/consumer price index increases allowed. Transit operations funding requests to be presented later in the budget process Parking management funding requests to be presented later in the budget
process CIP capacity to be determined to meet the needs of -
▫ City facility projects ▫ Cape’s Dam ▫ Infrastructure projects
Continue funding Social Services at $500,000 for Human Service Advisory Board to administer application, contract, and funding process to eligible agencies.
Youth initiatives funding $150,000 to include Youth Services Manager put on hold pending application process modifications.
The annual contribution to the Economic Development reserve of $200,000 allocation between General Fund, Water Wastewater Fund, and Electric Fund will be used to fund Strategic Initiatives and/or special projects at the discretion of the City Manager.
The existing balance of the Economic Development reserve of $800,000 will be used to fund Strategic Initiatives and/or special projects at the discretion of the City Manager. The fund is a contribution of General Fund, Water Wastewater

City of San Marcos | FY20 Adopted Budget
City of San Marcos | Finance
57
Fund, and the Electric Fund. Funds will be used on projects/initiatives that support all areas of funding source.
Best Buy Call Center revenue net of sales tax rebate will be used for one-time expenses.
Water/Wastewater Fund Meet and Confer negotiations for civil-service employees will be finalized later in
the budget process. The outcome will be reported later in the budget process. Merit and cost of living increase for non-civil service employees will be
determined later in the budget process. Estimated 10% increase in health insurance premium beginning January 1, 2020. Base operations budgets held flat. Additions to the department budgets must be
requested, justified, and ranked by priority. Staffing needs will be evaluated through the department budget request process Fuel/contractual obligations/consumer price index increases allowed.
Electric Utility Fund Meet and Confer negotiations for civil-service employees will be finalized later in
the budget process. The outcome will be reported later in the budget process. Merit and cost of living increase for non-civil service employees will be
determined later in the budget process. Estimated 10% increase in health insurance premium beginning January 1, 2020. Base operations budgets held flat. Additions to the department budgets must be
requested, justified, and ranked by priority. Staffing needs will be evaluated through the department budget request process Fuel/contractual obligations/consumer price index increases allowed.
Stormwater Utility Fund Meet and Confer negotiations for civil-service employees will be finalized later in
the budget process. The outcome will be reported later in the budget process. Merit and cost of living increase for non-civil service employees will be
determined later in the budget process. Estimated 10% increase in health insurance premium beginning January 1, 2020. Base operations budgets held flat. Additions to the department budgets must be
requested, justified, and ranked by priority. Staffing needs will be evaluated through the department budget request
process.

City of San Marcos | FY20 Adopted Budget
City of San Marcos | Finance
58
Fuel/contractual obligations/consumer price index increases allowed.
Hotel Motel Fund Merit and cost of living increase for non-civil service employees will be
determined later in the budget process. Funding for special programs remains flat. Organizations can request increases
during the budget process for specific programs.

City of San Marcos | FY20 Adopted Budget
City of San Marcos | Finance
59
City of San Marcos Financial Policy
I. Purpose
The broad purpose of this policy is to enable the City to achieve and maintain a long-term stable and positive financial condition through the use of sound financial management practices. The watchwords used to epitomize the City's financial management include integrity, prudent stewardship, planning, accountability, full disclosure and communication.
The more specific purpose of this policy is to provide guidelines to the Director of Finance in planning and managing the City's daily financial affairs and in developing recommendations to the City Manager and City Council.
The City Council will annually review and approve this policy as part of the budget process.
The scope of this policy covers the operating budget, revenues, expenditures, capital improvements program, financial planning, accounting, auditing, financial reporting, treasury management, debt management, and financial condition and reserves, in order to:
A. Present fairly and with full disclosure the financial position and results of the financial operations of the City in conformity to generally accepted accounting principles (GAAP).
B. Determine and demonstrate compliance with finance-related legal and contractual issues in accordance with provisions of the City’s Charter, the City’s Code of Ordinances, the Texas Local Government Code and other pertinent legal documents and mandates.
II. Operating Budget
A. Preparation – Budgeting is an essential element of the financial planning, control, and evaluation process of municipal government. The "budget" is the City's annual financial operating plan. The budget includes all of the operating departments of the
City of San Marcos | FY20 Adopted Budget
City of San Marcos | Finance
60
governmental funds, special revenue funds, enterprise funds, and permanent funds of the City. The budget includes expenditures for personnel, contracted services, materials and supplies, other charges, operating transfers, social services, indirect costs, capital outlay and debt service. The budget is prepared by the City Manager and Director of Finance with the participation of all the City’s Department Directors within the provisions of the City Charter, on a basis that is consistent with GAAP.
B. Multi-Year Planning – The Director of Finance will prepare a multi-year financial forecast of the General Fund. This forecast is an integral part of developing the adopted budget.
1. Adopted Budget – The City Manager presents a budget to the City Council. The budget provides a complete financial plan for the ensuing fiscal year, and shall contain a budget message explaining the budget, containing an outline of the adopted financial policies of the City for the ensuing fiscal year, setting forth the reasons for salient changes from the previous fiscal year in expenditure and revenue items, and explaining any major changes in financial policy.
a) The budget should include four basic segments for review and evaluation. These segments are: (1) actual revenue and expenditure amounts for the last completed fiscal year, (2) original revenue and expenditure amounts budgeted for the current fiscal year, (3) revenue and expenditure amounts estimated for the current fiscal year, and (4) revenue and expenditure amounts for the ensuing fiscal year.
b) The City Manager, not less than 30 days prior to the time the City Council makes its tax levy for the current fiscal year, shall file with the City Clerk the adopted budget.
2. Adoption – The City Council shall call and publicize a public hearing to allow for citizen participation. The City Council will subsequently adopt by Ordinance such budget, as it may have been amended, as the City's annual budget effective for the fiscal year beginning October 1st. The budget should be adopted by the City Council no later than the expiration of the fiscal year.
City of San Marcos | FY20 Adopted Budget
City of San Marcos | Finance
61
C. Balanced Budget – The operating budget will be balanced with current revenues, which may include beginning fund balances less required reserves as established by City Council, greater than or equal to current expenditures.
D. Planning – The budget process will be coordinated so as to identify major policy and financial issues for City Council consideration several months prior to the budget adoption date. This will allow adequate time for appropriate decisions and analysis of financial impacts.
E. Reporting – Financial reports will be made available to Department Directors to manage their budgets and to enable the Director of Finance to monitor the overall budget. The Director of Finance will present summary financial and budgetary reports to the City Council to disclose the overall budget and financial condition of the City. The financial and budgetary reports will include comparisons of actual to budget, actual to prior year, appropriate ratios, and graphs to ensure full disclosure and present meaningful information.
F. Control and Accountability – Department Directors will be responsible to ensure that their department budgets will not exceed budgeted amounts. Department Directors will be responsible to ensure revenues generated by activities of their departments meet budgeted amounts.
G. Contingent Appropriation – A provision shall be made in the budget for a contingent appropriation of no more than three percent of total expenditures to be used in case of emergencies or unforeseen circumstances. The contingent appropriation shall be under the control of and distributed by the City Manager after approval of the City Council. A detailed account of contingent appropriation expenditures shall be recorded and reported.
All expenditures of the contingent appropriation will be evaluated using the following criteria:
- Is the request of such an emergency nature that it must be made immediately? - Why was the item not budgeted in the normal budget process? - Why the transfer cannot be made within the division or department?

City of San Marcos | FY20 Adopted Budget
City of San Marcos | Finance
62
III. Revenue Policies
A. Characteristics – The City Finance Department will strive for the following optimum characteristics in its revenue system:
1. Simplicity – Where possible and without sacrificing accuracy, the revenue system will be kept in simple order to reduce compliance costs for the taxpayer or service recipient.
2. Certainty – There will be a thorough knowledge and understanding of revenue sources to increase the reliability of the revenue system. Consistent collection policies will be enacted to provide assurances that the revenue base will materialize according to budgets and plans.
3. Equity – Equity will be maintained in the revenue system structure; i.e., subsidization between entities, funds, services, utilities, and customer classes will be minimized or eliminated.
4. Revenue Adequacy – There will be a balance in the revenue system; i.e., the revenue base will have the characteristics of fairness and neutrality as it applies to cost of service, willingness to pay, and ability to pay.
5. Administration – The benefits of a revenue source should exceed the cost of levying and collecting that revenue. The cost of collection should be reviewed annually for cost effectiveness as a part of the indirect cost of service analysis. Where appropriate, the administrative processes of state, federal or local governmental collection agencies will be used in order to reduce administrative cost.
6. Diversification and Stability – A diversified revenue system with a stable source of income should be maintained. This will help avoid instabilities in similar revenue sources due to factors such as fluctuations in the economy and variations in the weather.
B. Issues – The following considerations and issues will guide the City Finance Department in its revenue policies concerning specific sources of funds:
1. Cost/Benefit and Financial Impact Analysis for Tax and Fee Abatements – A cost/benefit and financial impact analysis should be performed to assess tax or fee abatement economic development incentives.

City of San Marcos | FY20 Adopted Budget
City of San Marcos | Finance
63
2. Accounts Receivable – Accounts receivable procedures will target collection for a maximum of 30 days from service. Accounts past due more than 120 days may be sent to a collection agency. The Director of Finance is authorized to write-off non-collectible accounts that are delinquent for more than 180 days.
3. Non-Recurring Revenues – One-time or non-recurring revenues should not be used to finance current ongoing operations. Non-recurring revenues should be used only for non-recurring expenditures and not be used for budget balancing purposes.
4. Deferrals or Short-Term Loans – Deferrals or short-term loans will not be used for budget balancing purposes.
5. Property Tax Revenues – All real and business personal property located within the City is valued at 100% of the fair market value for any given year based on the current appraisal supplied to the City by the Hays County Tax Appraisal District (HCTAD). A visual reappraisal and reassessment of all real and business personal property will be done every third year. The HCTAD reappraises real and business personal property every year as a standard practice.
Conservatism will be used to estimate property tax revenues. The Hays County Tax Assessor Collector will furnish an estimated property tax collection rate to the Director of Finance. The Finance Department will endeavor with the Tax Assessor Collector to collect one hundred percent (100%) of property taxes levied in each fiscal year.
6. Interest Income – Interest earned from investment of available monies, whether pooled or not, will be distributed to the funds in accordance with the equity balance of the fund from which monies were provided to be invested.
7. User Fees and Service Charges – For services associated with a user fee or service charge, the direct and indirect costs of that service will be offset by a user fee where possible. Department Directors will annually review user fees and service charges to ensure that the costs of services are recouped through user fees and service charges. The City Council will determine how much of the cost of a service should be recovered by fees and service charges.
8. Indirect Cost Allocation – All City funds will include transfers to and receive credits from other funds for general and administrative costs incurred. The most predominant fund that receives credits from other funds is the General Fund. The General Fund receives credits for bearing such costs as administration, legal counsel, finance, personnel, data processing, engineering and other costs. An
City of San Marcos | FY20 Adopted Budget
City of San Marcos | Finance
64
independent third party will conduct an indirect cost allocation study annually to determine the credits received.
9. Enterprise Fund Rates – The Director of Finance and the Department Directors of each Enterprise Fund will review rates annually to ensure sufficient coverage of operating expenses, meet the legal restrictions of all applicable bond covenants, and provide for an adequate level of working capital.
10. Franchise Fees – The Electric Fund and Water and Wastewater Utility Fund will include franchise fees as a component of utility rates. A 7% Water and Wastewater Utility and a 7.5% moving to 7% Electric Utility Fund franchise fee is levied on gross sales. The City will aim to keep these franchise fees similar to those charged to investor-owned utility franchises operating within the City.
11. Intergovernmental Revenues (Federal/State/Local) – All potential grants will be examined for matching requirements and the source of the matching requirements. These revenue sources will be expended only for intended purpose of grant aid. It must be clearly understood that operational requirements set up as a result of a grant or aid could be discontinued once the term and conditions of the project have terminated.
12. Revenue Monitoring – Revenues actually received will be compared to budgeted revenues by the Director of Finance and variances will be investigated. This process will be summarized in the appropriate financial report and reported to the City Manager and City Council on a quarterly basis.
IV. Budgetary Sales Tax Estimation
A. The estimated percentage increase in sales tax revenue for the ensuing fiscal year budget will not exceed the actual percentage increase of the most recently completed fiscal year in which a sales tax increase was realized.
B. The following example illustrates the limitation set by this policy.
Fiscal Year 1
Actual
Fiscal Year 2
Actual Percentage
Increase
Fiscal Year 3
Estimated
Fiscal Year 4
Budget Percentage
Increase
$10,000,000 $10,500,000 5.0 % $11,550,000 $12,127,500 5.0 %

City of San Marcos | FY20 Adopted Budget
City of San Marcos | Finance
65
In the example above, the Fiscal Year 4 Adopted Budget is limited to a 5.0% increase, which is the actual percentage increase of the most recently completed fiscal year (Fiscal Year 2).
C. This policy ensures that the ensuing fiscal year budget contains a sales tax revenue estimate based on actual completed fiscal years only.
V. Budgetary Sales Tax Revenue Shortfall Contingency Plan
A. The City will establish a plan to address economic situations that cause sales tax revenue to be significantly less than the adopted budget sales tax revenue. The plan is comprised of the following components:
Indicators – Serve as warnings that potential budgetary sales tax revenue shortfalls are increasing in probability. Staff will monitor state and national economic indicators to identify recessionary or inflationary trends that could negatively impact consumer spending. Staff will develop a monthly report that compares the current month’s sales tax revenue to the same month of the previous year. The report will show sales tax revenue by month for the last ten fiscal years.
Phases – Serve to classify and communicate the severity of the estimated budgetary sales tax revenue shortfall. Identify the actions to be taken at the given phase.
Actions – Preplanned steps to be taken in order to prudently address and counteract the estimated budgetary sales tax revenue shortfall.
B. The actions listed in phases 1 through 3 are short-term in nature. In the event the underlying economic situation is expected to last for consecutive years, more permanent actions, such as phases 4 and 5, will be taken.
C. Staff will apprise City Council at the regular City Council meeting immediately following any action taken through this plan. Information such as underlying economic condition, economic indicators, estimated budgetary sales tax revenue shortfall, actions taken and expected duration will be presented to City Council.
D. The City Council may appropriate fund balance as needed to cover any estimated budgetary sales tax revenue shortfall. Appropriation of fund balance must be carefully

City of San Marcos | FY20 Adopted Budget
City of San Marcos | Finance
66
weighted and long-term budgetary impacts must be considered in conjunction with the projected length of the economic downturn.
E. Actions taken through this plan must always consider the impact on revenue generation. Actions taken should reduce expenses well in excess of resulting revenue losses.
F. These are only guidelines of possible actions that may be taken in the event of sales tax revenue decreases. In the event of a catastrophic event, necessary measures will be taken by the City Manager that are in the best interest of the City.
G. The following is a summary of phase classifications and the corresponding actions to be taken. Revenue will be monitored on a quarterly basis, with action being taken in the month following the completed quarter that experiences the shortfall. Actions are cumulative, so each level will include all actions set forth in prior levels.
1. ALERT: The estimated annual sales tax revenue is 1.5% less than the adopted sales tax revenue budget.
a. Freeze newly created positions. b. Implement a time delay for hiring vacant positions.
2. MINOR: The estimated annual sales tax revenue is 2.5% less than the sales tax revenue adopted budget.
a. Suspend funding of Capital Maintenance accounts. b. Suspend capital outlay purchases. c. Reduce the number of temporary workers.
3. MODERATE: The estimated annual sales tax revenue is 3.5% less than the sales tax revenue adopted budget.
a. Implement a managed hiring program for vacant positions. b. Reduce travel and training budgets. c. Reduce office supply budgets. d. Scrutinize professional services expenses. e. Implement a salary freeze and suspend mid-year merit increases if
possible.
4. MAJOR: The estimated annual sales tax revenue is 4.5% less than the adopted sales tax revenue budget.
a. Scrutinize repairs and maintenance expense. Perform only critical maintenance and make only critical repairs.

City of San Marcos | FY20 Adopted Budget
City of San Marcos | Finance
67
b. Freeze all external printing and publication expenses, except for legally required notices.
c. Reduce overtime budgets. d. Prepare a Reduction in Force Plan. e. Defer payments to City-owned utilities for electricity, street lighting,
water and wastewater services.
5. CRISIS: The estimated annual sales tax revenue is 5% less than the adopted sales tax revenue budget.
a. Service level reductions, elimination of specific programs, reduction-in-force and other cost reduction strategies will be considered.
b. Reduce departmental budgets by a fixed percentage or dollar amount.
c. Departments will prioritize service levels and programs according to City Council goals and objectives.
d. Consider four-day work weeks to reduce personnel costs. e. Reduce external program funding – social service agencies.

City of San Marcos | FY20 Adopted Budget
City of San Marcos | Finance
68
VI. Expenditure Policies
A. Appropriations – The point of budgetary control is at the department level budget for all funds. Following formal adoption, the budget is amended or adjusted as necessary. 1. Amendment-. An amendment involves increasing the total expenditures of the
funds over the original adopted budget or changes to the total approved FTE count. The budget is amended through a submission made by a Department Director to the City Manager. The Department Director prepares a budget amendment detailing the reason, line items and amounts to be affected which is approved by the City Finance Department after verification of available dollars. The amendment is given to the City Manager or their designee for review for overall appropriate objectives and purposes. The amendment request is submitted to the City Council for formal adoption by ordinance.
2. Adjustment-An adjustment involves moving expenses between line items, departments or funds, but does not increase total expenditures over the adopted budget. The budget is adjusted through a submission made by the Department Director. If the budget adjustment requires a transfer between funds, or involves the use of contingent appropriations, the adjustment is submitted to City Council for approval by a motion. If the budget adjustment requires a transfer between departments, it must be approved by the City Manager or their designee. All other adjustments may be approved by the City Finance Director.
B. Encumbrance Accounting System – An encumbrance accounting system will be used to alert Department Directors when their maximum budget limits have been reached. Encumbrances are expenditure estimates and will reduce budgeted appropriations in the same manner as an actual expenditure. Once the actual expenditure amount is paid or the encumbrance lapses, the encumbrance will be deleted. Department Directors should use the encumbrance accounting system for all purchases.
C. Personnel Savings – No recognized or significant personnel savings in any Department will be spent by the Department Director without the prior authorization of the City Manager. This control is used to realize personnel savings each year that will be recognized in the adopted budget as a reduction in the current fiscal year’s personnel appropriations.
D. Capital Outlay-Any previously budgeted capital outlay funds not expended at year
end may be moved to a cash funded Capital Improvements Projects account for expenditure in a subsequent fiscal year. These funds may be used for a capital

City of San Marcos | FY20 Adopted Budget
City of San Marcos | Finance
69
outlay item or for other designated purpose. E. Impact Fees Reserves-Funds may be used to support projects identified in the
impact fee study, as adopted by City Council, for new growth projects. Authorization for use of impact fee funds will be provided by the City Manager or their designee.
F. Purchasing – All Department Directors will ensure their respective departments
comply with the City's Purchasing Manual when purchasing goods or services. G. Prompt Payment – All invoices approved for payment will be paid by the City
Finance Department within thirty (30) calendar days of receipt in accordance with the provisions of State law.
The Director of Finance will establish and maintain payment procedures that will make use of advance payment discounts. Advanced payment discounts will be used in all instances except when the City will earn more interest income than the advance payment discount through investing the idle cash.
VII. Capital Improvements Program – Major Projects
A. Purpose – The Capital Improvements Program (CIP) is a multi-year financial planning tool used to identify and plan for major capital projects which address growth, transportation, public safety, and utility infrastructure issues in conjunction with goals and priorities as determined by City Council. A major capital project generally involves a significant expenditure of funds, beyond operation and maintenance costs, for the acquisition or construction of a needed facility or infrastructure. A major capital project should exceed $50,000 in cost. The CIP coincides with the adoption of the budget and uses a ten-year projection.
B. Preparation – The CIP will be prepared annually and on a project basis categorized by specific program; i.e., streets, drainage, public safety, public buildings, parks and recreation, water, wastewater and electric. The CIP should contain a comprehensive description of the project, funding sources, the timing of capital projects, and the impact on operations. The CIP will be prepared by the Planning Department and reviewed by the City Manager with the involvement of responsible departments. The CIP will be submitted to the Planning and Zoning (P&Z) Commission for their review. After considerable

City of San Marcos | FY20 Adopted Budget
City of San Marcos | Finance
70
deliberation including public workshops and hearings to gather citizen participation, the P&Z will approve a recommended CIP for City Council’s approval. The City Council reviews the CIP for adherence to goals and priorities and approves the CIP for inclusion in the ensuing fiscal year budget. Capital projects within the first year of the CIP are approved for funding. Maintenance and operational costs related to capital projects are included in the ensuing fiscal year budget.
C. Funding Sources – Where applicable, assessments, impact fees, pro rata charges, or other fees should be used to fund capital projects which have a primary benefit to specific, identifiable property owners.
Recognizing that long-term debt is usually a more expensive financing method, alternative-financing sources will be explored before debt is issued. When debt is issued, it will be used to acquire major assets with expected lives that equal or exceed the average life of the debt issue. The exceptions to this requirement are the traditional costs of issuing the debt, capitalized labor for design and construction of capital projects, and small component parts which are attached to major equipment purchases such as fire trucks. The types of debt issued are listed in Section VIII of this policy.
D. Timing and Expenditure Control – The Director of Finance will work with Department Directors during the fiscal year to schedule the timing of capital projects to insure funds availability. All capital projects must be funded and appropriated. The Finance Department must certify the availability of resources before any capital project contract is presented to the City Council for approval.
E. Reporting – Financial reports will be made available to Department Directors to manage their capital projects budgets and to enable the Director of Finance to monitor the overall capital projects budget.
IX. Financial Planning, Accounting, Auditing and Reporting
A. Financial Planning – The Director of Finance provides recommendations for short-term and long-term strategic financial planning to efficiently and effectively use the City’s financial resources. This financial planning is achieved in accordance with the goals and priorities of the City Council, the City Manager, and in compliance with applicable laws and Generally Accepted Accounting Principles (GAAP).

City of San Marcos | FY20 Adopted Budget
City of San Marcos | Finance
71
B. Accounting System – The Director of Finance is responsible for the development, maintenance and administration of the City’s accounting system. Compliance with GAAP and applicable federal, state and local laws and regulations will be maintained. This responsibility also includes the implementation and maintenance of internal accounting controls for the City’s financial resources. Functions of the accounting system include payroll, accounts payable, general ledger, grants, capital projects, fixed assets, accounts receivable, self-insurance, utility billing and collections.
C. Financial Auditing –
1. Qualifications of the Auditor – In conformance with the City's Charter and according to the provisions of Texas Local Government Code, the City will be financially audited annually by an outside independent auditing firm. The auditing firm must demonstrate that it has the breadth and depth of staff to conduct the City's financial audit in accordance with generally accepted auditing standards and contractual requirements. The auditing firm must hold a license under the Civil Statutes of Texas and be capable of demonstrating that it has sufficient staff which will enable it to conduct the City's financial audit. The auditing firm will complete its financial audit within 120 days of the City's fiscal year end. The auditing firm will submit its Management Letter to the City Council within 30 days of the completion of its financial audit. The Management Letter will state the auditing firm’s findings of non-compliance and recommendations for compliance.
The Director of Finance shall respond within 60 days in writing to the City Manager and City Council regarding the auditing firm’s Management Letter, addressing the findings of non-compliance contained therein.
2. Responsibility of Auditing Firm to City Council – The auditing firm is retained by and is accountable directly to the City Council and will have access to direct communication with the City Council if the City staff is unresponsive to the auditing firm’s recommendations or if the auditing firm considers such communication necessary to fulfill its legal and professional responsibilities.
D. Financial Reporting –

City of San Marcos | FY20 Adopted Budget
City of San Marcos | Finance
72
1. External Reporting – The City Finance Department will prepare the necessary transmittal letter, financial summaries and tables, notes and miscellaneous financial information contained within the comprehensive annual financial report (CAFR). The auditing firm will audit this financial information for compliance with GAAP. The audited CAFR will be submitted to the City Council for their review and will be made available to the public for inspection.
2. Internal Reporting – The City Finance Department will prepare internal financial reports, sufficient to plan, monitor, and control the City's financial affairs. The City Finance Department will strive for excellence in its financial reporting. The following qualitative characteristics of accounting information will be incorporated in all reports that are prepared:
Definitions of Qualitative Characteristics of Accounting Information:
Bias - Bias in measurement is the tendency of a measure to fall more often on one side than the other of what it represents instead of being equally likely to fall on either side. Bias in accounting measures means a tendency to be consistently too high or too low. Financial reporting will strive to eliminate bias in accounting measures.
Comparability – The quality of information that enables users to identify similarities in and differences between two sets of economic phenomena.
Completeness – The inclusion in reported information of everything material that is necessary for faithful representation.
Conservatism – A prudent reaction to uncertainty to try to insure that uncertainty and risks inherent in financial situations are adequately considered.
Consistency – Conformity from period to period with unchanging policies and procedures.
Feedback Value – The quality of information that enables users to confirm or correct prior expectations.
Materiality – The magnitude of an omission or misstatement of accounting information that, in light of surrounding circumstances, makes it probable that the judgment of a reasonable person relying on the information would have been changed or influenced by the omission or misstatement.
Neutrality – Absence in reported information of bias intended to attain a predetermined result or to induce a particular mode of behavior.
Predictive Value – The quality of information that helps users to increase the likelihood of correctly forecasting the outcome of past or present events.
Relevance – The capacity of information to make a difference in a decision by

City of San Marcos | FY20 Adopted Budget
City of San Marcos | Finance
73
helping users to form predictions about the outcomes of past, present, and future events or to confirm or correct prior expectations.
Reliability – The quality of information that assures that information is reasonably free from error and bias and faithfully represents what it purports to present.
Representational Faithfulness – Correspondence or agreement between a measure or description and the phenomenon that it purports to represent (sometimes called validity).
Timeliness – Having information available to a decision-maker before it loses its capacity to influence decisions.
Understandability – The quality of information that enables users to perceive its significance.
Verifiability – The ability through consensus among measurers to insure that information represents what it purports to represent or that the chosen method of measurement has been used without error or bias.
X. Treasury Management
A. Investments – The Director of Finance, or designee shall promptly deposit all City funds with the City's depository bank in accordance with the provisions of the current depository bank agreement. The Director of Finance, or designee will then promptly invest all funds in any negotiable instrument that the City Council has authorized under the provisions of the State of Texas Public Funds Investment Act and in accordance with the City Council approved Investment Policy.
B. Cash – The City's cash flow will be managed to maximize the cash available to invest. Such cash management will entail the centralization of cash collection centers such as utility bills, building and related permits and licenses, parks and recreation, and other collection offices where appropriate and feasible.
Idle cash position will be determined daily to maximize interest income. The underlying theme will be that idle cash will be invested with the intent to 1) safeguard assets, 2) maintain liquidity, and 3) maximize return.
The City Finance Department will use appropriate check-signing technology tosign all checks with the signatures of the City Manager and Director of Finance. Internal controls will be established to secure the technology and to prevent its misuse.
City of San Marcos | FY20 Adopted Budget
City of San Marcos | Finance
74
The City Manager, Assistant City Manager, and Director of Finance are authorized signatories on all City depository bank accounts. Any withdrawal, transfer or payment of City funds requires a minimum of two signatures.
XI. Debt Management
A. Policy Statement – The City Council recognizes the primary purpose of major capital projects is to support provision of services to its residents. Using debt financing to meet the major capital project needs of the community must be evaluated according to two tests - efficiency and equity. The test of efficiency equates to the highest rate of return for a given investment of resources. The test of equity requires a determination of who should pay for the cost of major capital projects. In meeting the demand for major capital projects, the City will strive to balance the load between debt financing and "pay as you go" financing methods. The City Council realizes failure to meet the demands of growth may inhibit its continued economic viability, but also realizes that the amount of debt incurred may have a negative financial impact. The City will achieve an appropriate balance between service demands and the amount of debt incurred. The aforementioned tests and methods of financing will assist the City Council, City Manager and Director of Finance in achieving this appropriate balance.
B. Types of Debt –
1. General Obligation Bonds (GO's) – General obligation bonds will be issued to fund major capital projects of the general government, are not to be used to fund operating needs of the City and are backed by the full faith and credit of the City as well as the ad valorem taxing authority of the City as prescribed by law. The term of a bond issue will not exceed the useful life of the major capital projects funded by the bond issue and will generally be limited to no more than twenty years. GO’s must be authorized by a vote of the citizens of the City.
2. Revenue Bonds (RB's) – Revenue bonds may be issued to fund major capital projects necessary for the continuation or expansion of a service which produces a revenue sufficient enough to obtain investment grade ratings and credit enhancement and for which the major capital project may reasonably be

City of San Marcos | FY20 Adopted Budget
City of San Marcos | Finance
75
expected to provide for a revenue stream to fund the annual debt service requirements. The term of a bond issue will not exceed the useful life of the major capital projects funded by the bond issue and will generally be limited to no more than twenty years. RB’s do not need a vote of the citizens of the City.
3. Certificates of Obligation (CO's) and Limited Tax Notes (Notes) – Certificates of obligations may be issued to fund major capital projects, which are not otherwise covered under either General Obligation Bonds or Revenue Bonds. Notes will be used in order to fund capital requirements which the useful life does not exceed seven (7) years as authorized by State law. Debt service for CO's or Notes may be either from general revenues or backed by a specific revenue stream or streams or by a combination of both. The term of the CO’s will not exceed the useful life of the major capital projects funded by the certificate issuances and will generally be limited to no more than twenty years. Neither CO’s nor Notes require a vote of the citizens of the City.
4. Method of Sale – The Director of Finance will use a competitive bidding process in the sale of bonds unless the nature of the issue or market conditions warrant a negotiated sale. In situations where a competitive bidding process is not elected, the Director of Finance will publicly present the reasons why and will participate with the City’s Financial Advisor in the selection of the underwriter or direct purchaser.
C. Analysis of Financing Alternatives – The Director of Finance will explore alternatives to the issuance of debt for major capital projects. These alternatives will include, but are limited to: 1) grants-in-aid, 2) use of fund balance or working capital, 3) use of current revenues, 4) contributions from developers and others, 5) leases, and 6) impact fees.
D. Conditions for Using Debt – Debt financing of major capital projects will be done only when the following conditions exist:
- When non-continuous projects (those not requiring continuous annual appropriations) are desired;
- When it can be determined that future users will receive a benefit from the major

City of San Marcos | FY20 Adopted Budget
City of San Marcos | Finance
76
capital project; - When it is necessary to provide basic services to residents and taxpayers (for example,
purchase of water rights); - When total debt, including that issued by overlapping governmental entities, does not
constitute an unreasonable burden to the residents and taxpayers.
E. Costs and Fees – All costs and fees related to debt issuance will be paid out of debt proceeds.
F. Debt Limitations – The City maintains the following limitations in relation to debt issuance:
- An Ad Valorem tax rate of $1.20 per $100 of assessed value is the maximum municipal tax rate that may be levied for all General Fund tax supported expenditures and debt service.
- Debt payments made solely from ad valorem tax revenue should not exceed 20% of combined General Fund and Debt Service Fund expenditures.
- Total outstanding debt should not exceed 5% of the current year’s taxable assessed valuation.
G. Arbitrage Rebate Compliance – The City Finance Department will maintain a system of record keeping and reporting to comply with arbitrage rebate compliance requirements of the Federal tax code.
H. Sound Financing of Debt – When the City utilizes debt financing, it will ensure that the debt is soundly financed by:
- Conservatively projecting the revenue sources that will be used to pay the debt; - Financing the major capital project over a period not greater than the useful life of
the major capital project; - Maintaining a debt service coverage ratio which ensures that combined debt service
requirements will not exceed revenues pledged for the payment of debt; and - To the extent possible, the City will aim to repay at least 25% of the principal amount
of its general obligation debt within five years and at least 50% within 10 years. The City may choose to structure debt repayment so as to wraparound existing debt obligations or to achieve other financial planning goals.

City of San Marcos | FY20 Adopted Budget
City of San Marcos | Finance
77
I. Credit Enhancement – The City should seek credit enhancement (letters of credit, bond insurance, surety bonds, etc.) when such credit enhancement proves cost effective. Credit enhancement may be used to improve or establish a credit rating on a debt obligation even if such credit enhancement is not cost effective if the use of such credit enhancement meets the financial planning goals.
J. Financing Methods – The City maintains the following guidelines in relation to methods of financing used to issue debt:
- Where it is efficient and cost effective, the City will use revenue or other self-supporting bonds in lieu of tax supported/pledged debt instruments.
- When appropriate, the City will issue non-obligation debt, for example, Industrial Development Revenue bonds, to promote community stability and economic growth.
K. Refunding – Periodic reviews of all outstanding debt will be undertaken to determine refunding opportunities. Refunding will be considered if and when there is a net economic benefit of the refunding or the refunding is essential in order to modernize covenants, which impinge on prudent and sound financial management.
L. Full and Complete Disclosure – The City of San Marcos is committed to full and complete financial disclosure, and to cooperating with credit rating agencies, institutional and individual investors, City departments, other levels of government, and the general public to share clear, comprehensible and accurate financial information. Official statements accompanying debt issues, comprehensive annual financial reports, and continuous disclosure statements will meet, at a minimum, the standards articulated by the Municipal Standards Rulemaking Board, the National Federation of Municipal Analysts, the Government Accounting Standards Board (GASB), and the Securities Exchange Commission (SEC). The City Finance Department will be responsible for ongoing disclosure to nationally recognized municipal securities information repositories (NRMSIRs). Updates of budget, debt and financial information will be provided to credit rating agencies and investors when new debt is issued.
M. Credit Rating – The City of San Marcos seeks to maintain the highest possible credit ratings for all categories of debt that can be achieved without compromising the delivery of basic City services.

City of San Marcos | FY20 Adopted Budget
City of San Marcos | Finance
78
N. Elections – State law regulates which securities may be issued only after a vote of the electors of the City and approved by a majority of those voting on the issue.
1. Election Required – Securities payable in whole or in part from ad valorem taxes of the City except issues such as tax increment securities, certificates of obligation, and limited tax notes.
2. Election Not Required –
- Short-term notes (12 months or less) issued in anticipation of the collection of taxes and other revenues.
- Securities issued for the acquisition of water rights or capital improvements for water and wastewater treatment.
- Securities payable solely from revenue other than ad valorem taxes of the City. - Refunding securities issued to refund and pay outstanding securities. - Tax increment securities payable from ad valorem tax revenue derived from
increased valuation for assessment of taxable property within a plan of development or other similar area as defined by applicable State Statutes.
- Certificates of obligation. - Limited Tax Notes. - Securities for the construction or improvement of public streets and/or rights-
of-way in order to relieve congestion or for public safety matters.
XII. Financial Conditions, Reserves, and Stability Ratios
A. Operational Coverage – The City's Enterprise Funds will comply with all bond covenants and maintain an operational coverage of at least 120%, such that current operating revenues will exceed current operating expenses.
B. Fund Balances/ Working Capital –
1. The General Fund's fund balance should be at least 25% of the General Fund's annual operating expenditures. This percentage is the equivalent of three months operational expenditures. As a goal, the City will strive to achieve 30% fund balance.

City of San Marcos | FY20 Adopted Budget
City of San Marcos | Finance
79
2. The Water and Wastewater Utility Fund working capital should be maintained at 25% of total recurring operating expenses or the equivalent of three months operating expense ending fund balances above 25% will be moved to cash fund future Capital Improvement projects
3. The Electric Utility Fund working capital should be maintained at the equivalent of 60 days of recurring operating expenses. Ending fund balances above the 60 days of recurring operating expenses will be moved to cash fund future Capital Improvement projects.
4. Reserves will be used for emergencies or unforeseen expenditures, except when balances can be reduced because their levels exceed guideline minimums as stated below.
C. Capital and Debt Service Funds –
1. Monies in the Capital Improvement Program Funds should be used within twenty-four months of receipt or within a reasonable time according to construction schedules. Interest income and unspent monies from bond issuances can be used to fund similar projects as outlined by bond covenants. Any remaining monies will be used to pay the bond issuance.
2. Revenues in the Debt Service Fund are based on property tax revenues and interest income. Reserves in the Debt Service Fund are designed to provide funding between the date of issuance of new debt and the time that property tax levies are adjusted to reflect the additional debt. Article 10, Section 10.02 of the City Charter requires that the City maintain a reserve balance of two percent of all outstanding general obligation debt.
D. Ratios/Trend Analysis –
Ratios and significant balances will be incorporated into financial reports. This information will provide users with meaningful data to identify major trends of the City's finances through analytical procedures. We have selected the following ratios/balances as key indicators:
- Fund Balance: Assets Less Liabilities FB AL (Acceptable level)>25.0% of Expenditures

City of San Marcos | FY20 Adopted Budget
City of San Marcos | Finance
80
- Working Capital: Current Assets Less Current Liabilities CA - CL AL > 25.0% of Expenses
- Current Ratio: Current Assets Divided By Current Liabilities CA/CL AL> 1.00
- Quick Ratio: "Liquid" Current Assets Divided By Current Liquid Liabilities CA/CL AL > 1.00
- Debt Ratio (%): Current Liabilities Plus Long Term Liabilities Divided By Total Assets
CL+LTL/TA AL< 1.00
- Enterprise Operational Operating Revenue Divided By Operating Coverage: Expense
OR/OE AL > 1.20
Our goal is to develop minimum/maximum levels for the ratios/balances above through analyzing the City’s historical trends and anticipated future trends. We will also analyze and compare the City to other municipalities to develop these acceptable levels.
XIII. Internal Controls
A. Written Procedures – Wherever possible, the Director of Finance will establish and maintain written procedures for all functions involving cash handling and/or accounting throughout the City. These procedures will embrace the general concepts of fiscal responsibility set forth in this policy statement.
B. Department Directors’ Responsibilities – Each Department Director is responsible to ensure that good internal controls are followed throughout their Department, that all

City of San Marcos | FY20 Adopted Budget
City of San Marcos | Finance
81
City Finance Department directives or internal control recommendations are implemented, and that all independent auditor recommendations are addressed.
XIV. Personnel and Training
A. Adequate Personnel – Personnel levels will be adequate for the City Finance Department to operate effectively. Overtime will be used only to address temporary or seasonal demands that require excessive hours. Workload allocation alternatives will be explored before increasing personnel.
B. Training – The City Finance Department will support the continuing education efforts of all personnel. Personnel will be held accountable for communicating, teaching, and sharing with other personnel members all information and training materials acquired from seminars, conferences, and related education efforts.
C. Awards, Credentials, Recognition – The City Finance Department will support efforts and involvement which result in meeting standards and receiving exemplary recitations on behalf of any of the City's fiscal policies, practices, processes, products, or personnel. Certifications may include Certified Government Finance Officer, Certified Public Accountant, Management Accountant, Certified - Internal Auditor, and Certified Cash Manager.
The City Finance Department will strive to maintain a high level of excellence in its policies and procedures. The CAFR and budget will be presented annually to the Governmental Finance Officers Association for evaluation and consideration for the Certificate of Achievement for Excellence in Financial Reporting and the Distinguished Budget Presentation Award.

City of San Marcos | FY20 Adopted Budget
City of San Marcos | Finance
82
Reader’s Guide This section is meant to assist the lay reader in understanding the budget document and
components. A summary of the major sections is included in this guide to make reading this document much easier.
Introduction
The Introduction is an opportunity for management to introduce the budget to the City Council and citizenry. There are two sections of the Introduction—the Transmittal Letter and the Executive Summary.
The Transmittal Letter The Transmittal Letter formally conveys the budget document to the City Council, the governing body for the citizens of San Marcos. A summary of key initiatives is contained within this section. Executive Summary This section provides a detailed explanation of revenues, expenses and fund balances within each of the major budgeted funds. Budget Policy Statement The City Council formally adopts the Budget Policy Statement through a resolution. Staff uses the statement as a guideline for developing the budget. City of San Marcos Financial Policy The Financial Policy was last revised in January 2008. The financial policy provides long-term, organization-wide guidance from which budgetary and financial decisions are made. The policy is broad in scope and purpose and covers major financial areas such as budgeting, revenues, expenditures, capital improvements program, financial condition and reserves, and internal controls. Reader’s Guide The Reader’s Guide provides a brief summary of the information contained in the various sections of the budget. Supplemental data such as form of government, geographic location, population, demographics is contained within this section. This background information serves to familiarize the reader with the community’s demographic and economic profile.
Budget Summary
The Budget Summary is a compilation and summary of all financial information contained in the operating detail section of the budget. All summaries are gross budget presentations—meaning that interfund transfers are included.
Consolidated Fund Balance Statement

City of San Marcos | FY20 Adopted Budget
City of San Marcos | Finance
83
The Consolidated Fund Balance Statement is a detailed table that analyzes fund balances for all funds and includes revenue and expense totals for the previous fiscal year and adopted budget. Consolidated Summary of Major Revenues and Expenses This summary is a detailed table that lists the major sources of revenue and the major categories of expenses for all funds. Consolidated Summary of Operating Transfers This table shows the various operating and indirect transfers made between the various funds within the adopted budget. Consolidated Revenue, Expense and Fund Balance Comparison This summary compares three years of revenue, expense and fund balance history (prior year’s actual, current year’s estimate, and adopted for next year). Property Tax Valuation and Revenue This detailed worksheet illustrates the method for calculating property tax revenue by providing information about the tax roll, collection rates and the division of the property tax rate between debt service and operations and maintenance. Personnel Roster The Personnel Roster serves as a summary of the staffing level for all departments. Information is presented in two forms, positions and full-time equivalents (FTE’s). An FTE is a unit of measure that converts the hours worked by part-time and seasonal employees into equivalent hours worked by full-time employees. Full-time employees work 2,080 hours annually. An example of an FTE calculation would be a part-time employee that works 1,040 hours annually. The FTE calculation would be 0.5 (1,040 ÷ 2,080).
Budget Structure
The budget document is divided into the following fund groups. Not all funds reported in the audited financial statements are budgeted. Smaller, less significant, and rarely used funds such as grant and trust and agency funds are not budgeted. General Fund
The General Fund is the primary operating fund for the City. It is viewed as the general government fund and accounts for a vast number of financial resources, except for resources required to be accounted for in other funds.
Debt Service Fund
The Debt Service Fund is used to account for the debt service portion of property tax revenues received. Debt service taxes are specifically assessed for the payment of general long-term debt principal and interest. The use of a separate fund ensures that debt service tax revenues are not commingled with other revenues and not used for any purpose other than debt repayment.
City of San Marcos | FY20 Adopted Budget
City of San Marcos | Finance
84
Special Revenue Funds
Special revenue funds are used to account for the proceeds of certain specific revenue sources that are legally restricted to expenditures for specified purposes. The City utilizes this type of fund to account for revenues such as hotel occupancy tax, grants, special fines authorized by the State, and forfeiture revenue from seized assets.
Hotel Occupancy Tax The Hotel Occupancy Tax Fund is used to account for a local bed tax of 7%. Tax monies collected are used for tourist development activities in accordance with State law.
Municipal Court Technology This fund was established in fiscal year 2000 to provide budgeting and accountability for revenues collected from of a technology fee assessed through the municipal court system. The Texas Legislature established the fee in its 1999 legislative session to provide a funding source to local municipal courts for future technological enhancements to their respective court systems. The enhancements may include computer systems, network systems, software, imaging systems, electronic kiosks, electronic ticket writers or docket management systems. Municipal Security Fee This fund was established in 2006 to provide budgeting and accountability for revenues collected from a security fee assessed through the municipal court system. The fee can only be used to finance security personnel or items used for the purpose of providing security services for the building that houses the Municipal Court. Seized Assets This fund provides budgeting and accountability for revenues collected from the sale of forfeited and seized assets belonging to various criminals engaged in certain illegal activities. Revenues from these seized assets are used to fund various technology improvements in our Police Department. Community Development Block Grant In fiscal year 1994, the United States Department of Housing and Urban Development designated the City of San Marcos as an Entitlement City for the Community Development Block Grant (CDBG). The program is designed to eliminate slum and blight conditions and to serve the needs of low to moderate-income residents. Women, Infants and Children Program Fund The Women, Infants and Children Program provides nutritional food supplements, nutritional counseling, clinical assessments, and education to pregnant women, breast-feeding mothers, infants and children up to five years of age. The City of San Marcos operates a five-county regional WIC program that is funded through the Texas Department of Health and Human Services and the United States Department of Agriculture. Tax Reinvestment Zones

City of San Marcos | FY20 Adopted Budget
City of San Marcos | Finance
85
The City has several Tax Increment Reinvestment Zones across the City which have been used to stimulate development in key demographic areas. Other Special Revenue Funds The Cemetery Operations Fund provides for maintenance and upkeep of the historic San Marcos City Cemetery.
Enterprise Funds
Enterprise funds are used to account for governmental activities that are similar to those found in private businesses. The major revenue source for these enterprise funds is the rate revenue generated from the customers who receive the services provided. Expenses for these services are paid for through revenue generated from services provided.
Water/Wastewater Utility The City of San Marcos operates a superior water production and wastewater collection and treatment system for the community. This fund is used to account for the revenues and expenses of this utility system. Stormwater Utility The City of San Marcos began assessing a drainage utility rate in fiscal year 2000 to all residential and commercial property located in the City. The drainage charge was established to provide funding for the planning, engineering, construction, maintenance, improvement and reconstruction of drainage projects throughout the City. Electric Utility The City of San Marcos purchases and distributes electric power to the San Marcos community. The utility operates at a 99.9997% reliability rate and has a system capacity of 145 megawatts. Municipal Airport The Municipal Airport has four runways and is situated on 1,356 acres. Additionally, there are 60 acres of maintained parking ramps and 38 City-owned hangars and shelters. Revenue sources such as storage rentals, hangar rentals, storage rentals, gross receipts fees and land leases partially support the daily operational costs. There are more than 300 based aircraft at the airport and more than 100,000 annual takeoffs, landings and approaches. Resource Recovery Utility Fund The City of San Marcos outsources its residential solid waste collection through the use of a competitive bidding process. The solid waste collection company charges its monthly fee to the City on a per customer basis. This fee is passed on to each resident within the City. The waste collection revenue and expense were previously shown within the General Fund.
Permanent Funds
The City serves as trustee for funds collected through its cemetery perpetual care fee. This fee is assessed on all municipal cemetery plots sold. Interest earned from the Cemetery

City of San Marcos | FY20 Adopted Budget
City of San Marcos | Finance
86
Perpetual Care Fund is used to support the maintenance costs at the municipal cemetery. The principal amount of the fund cannot be used for any purpose. The Perpetual Care Fund was dissolved during fiscal year 2019 with the fund balance used to for the purchase of land at the cemetery. Miscellaneous and Statistical
Statistical and supplemental financial data is contained within this section. This background information serves to familiarize the reader with the community’s economic profile.
Glossary The glossary contains definitions of words used throughout the budget document. Most of the terminology is specific to local government budgeting and accounting and is not readily understood by a reasonably informed lay reader.
Basis of Budgeting
Fund budgets are on a basis consistent with modified and full accrual accounting basis, with exceptions, including that depreciation, amortization and bad debt expenses are not included in the budget, capital purchases are budgeted in the year of purchase, and debt principal is budgeted in the year it is to be paid. The emphasis is on cash transactions in lieu of non-cash transactions, such as depreciation and amortization. The focus is on the net change in working capital.
The General, Debt Service, Special Revenue, and Permanent funds are budgeted on a modified accrual basis, with exceptions as noted above. Revenues are recognized when susceptible to accrual (i.e., when they are “measurable and available”). Substantially all revenues are considered to be susceptible to accrual. Ad valorem, sales, hotel, and franchise tax revenues are susceptible to accrual. Licenses and permits, charges for services, fines and forfeitures, and miscellaneous revenues (except earnings on investments) are recorded as revenues when received in cash because they are generally not measurable until actually received. Investment earnings are recorded as earned since they are measurable and available. Expenditures are recognized when the related fund liability is incurred, if measurable and the liability will be liquidated with resources included in the budget, except for (1) inventories of materials and supplies which may be considered expenditures either when purchased or used; (2) prepaid insurance and similar items which need not be reported; (3) accumulated unpaid vacation, sick pay, and other employee benefit amounts which need not be recognized in the current period; (4) un-matured interest on long-term debt is recognized when due, and (5) those exceptions noted above.

City of San Marcos | FY20 Adopted Budget
City of San Marcos | Finance
87
The Enterprise funds are budgeted on a full accrual basis with exceptions as noted above. Revenues are budgeted in the year they are expected to be earned and expenses are budgeted in the year the liability is expected to be incurred.
Basis of Accounting
Basis of accounting refers to the time at which revenues, expenses and the related assets and liabilities are recognized in the accounts and reported in the financial statements.
Governmental funds and agency funds are accounted for using the modified accrual basis of accounting, revenues are recorded when susceptible to accrual (i.e., both measurable and available). Available means collectible within the current period or soon enough thereafter to be used to pay liabilities of the current period. Expenses, if measurable, are generally recognized when the related fund liability is incurred. Exceptions to this general rule include the un-matured principal and interest on general obligation long-term debt which is recognized when due and accrued vacation and sick leave, which is included in the General Long-Term Debt Account Group. These exceptions are in conformity with generally accepted accounting principles.
Property tax revenues are recognized when they become available. In this case, available means when due, or past due and receivable within the current period and collected within the current period or soon enough thereafter to be used to pay liabilities of the current period. Such time thereafter shall not exceed 60 days. Tax collections expected to be received subsequent to the 60-day availability period are reported as deferred revenue.
Sales taxes are recorded when susceptible to accrual (i.e., both measurable and available). Sales taxes are considered measurable when in the custody of the State Comptroller and are recognized as revenue at that time. Other major revenues that are considered susceptible to accrual include utility franchise taxes, grants-in-aid earned and other intergovernmental revenues. In applying the susceptible to accrual concept to intergovernmental revenues, the legal and contractual requirements of the numerous individual grant programs are used for guidance. There are essentially two types of intergovernmental revenues. In one, monies must be expended for the specific purpose or project before any amounts will be paid to the City; therefore, revenues are recognized based upon the expenses recorded. In the other, monies are virtually unrestricted as to purpose of expense and are revocable only for failure to comply with prescribed compliance requirements. These resources are reflected as revenues at the time of receipt, or earlier, if the susceptible to accrual criteria are met.

City of San Marcos | FY20 Adopted Budget
City of San Marcos | Finance
88
The accrual basis of accounting is utilized by the proprietary fund. Under the accrual basis of accounting, revenues are recognized in the accounting period in which they are earned and become measurable (i.e., water billings and accrued interest). Expenses are records in the accounting period incurred, if measurable.
Organizational Relationships
A department is a major administrative segment of the City which indicates overall management responsibility for an operation or a group of related operations within a functional area (e.g., Police Department, Parks and Recreation Department, Public Department). The smallest organizational unit budgeted is the division. The division indicates responsibility for one functional area, and in many cases these functional areas are put together to demonstrate a broader responsibility. When this is done, the divisions are combined to make up one department. For example, the Public Works Department is comprised of Public Works Administration, Streets, Traffic, and Vehicle Maintenance. Budget Amendment
Following formal adoption, the budget is amended as necessary through a submission made by a Department Director to the City Manager. A budget amendment form detailing the reason, line items and amounts to be affected is prepared. The Finance Department reviews the amendment for available dollars and the City Manager reviews the amendment for overall appropriate objectives and purposes. Should appropriations transfer between Departments, Funds, or involve fund balance or Contingency Funds, the amendment is submitted to City Council for approval; otherwise, the City Manager has authority to approve or disapprove. Budget amendments that require City Council approval are formally as an ordinance of the City.
Budget Process
(a) Strategic Planning and Visioning – Early in the budget process, the City Council and administrative staff retreat to discuss community needs and challenges. City Council develops short and long-term priorities as well as a policy statement to use for the current budget and future years.
(b) Revenue Projection – The Finance Department staff develops revenue projections based upon trend analysis, anticipated changes in the local, state and national economies, and

City of San Marcos | FY20 Adopted Budget
City of San Marcos | Finance
89
discussions with other departments. The revenue projection is used to determine the financial limitations for the development of the budget.
(c) Budget Development – Departments develop a budget that incorporates the goals outlined within the policy statement and the financial limitations as determined through revenue projections.
(d) Budget Analysis – Once department budgets are submitted, a preliminary budget estimate is constructed. Administrative and Finance staff review the preliminary budget and hold department reviews. Funding requests and target levels are discussed in an attempt to reconcile department requests with financial limitations and policy statement goals.
(e) Budget – The City Manager submits a budget that seeks to meet City Council’s goals as outlined in the policy statement. Council then reviews the budget for conformity to their overall direction and guidance. Workshops are held to review and discuss the budget. City Council may take action to make changes to the budget.
(f) Public Hearings / Budget Adoption – Public hearings on the budget and tax rate are held to give citizens an opportunity to speak for or against the budget. Citizens also have an opportunity to attend budget workshops that occur prior to the budget adoption. The budget and tax rate take effect on October 1st.

City of San Marcos | FY20 Adopted Budget
City of San Marcos | Finance
90
Budget Calendar Fiscal year 2020
FY 2020 Description
Dec 4 Fee Policy Workshop
January 11 Visioning
Feb 4 Departmental Budget Kickoff / CIP Dept meetings
Feb 13 Budget Policy Workshop Feb 28, Mar 1, Mar 13 Department budget request review & advisory with Finance, HR, IT
Mar 15 Completed Departmental Budgets due to Finance
Mar 19 Public hearing and adoption of Budget Policy
Mar 25 Review all Dept budget requests with executive team
Apr 1 - 12 Department budget review meetings with executive team (as needed)
Apr 9 CIP – Deliver to P&Z & public hearing
Apr 23 CIP – P&Z discussion item & public hearing
May 1 - 10 Budget reviewed by City Manager
May 7 Budget Work Session
May 14 CIP - P&Z recommendation
June 26 - 27 Budget workshops
June Set public hearing dates for the budget and tax rate
July Capital Outlay
July 25 Tax rolls certified
Aug 1 Workshop on Proposed Budget
Aug 20 1st public hearing on the tax rate; 1st reading of tax rate ordinances.
Sept 3
2nd public hearing on the tax rate; 1st budget public hearing; 1st reading of utility rates, and budget ordinances; 2nd reading of the tax rate ordinance.
Sept 17
2nd Reading of Utility Rates ordinance; record vote to adopt budget on 2nd reading; ratification of the tax rate reflected in the budget; Tax Rate adoption on 2nd reading (requires an affirmative vote of five if tax rate is increasing).
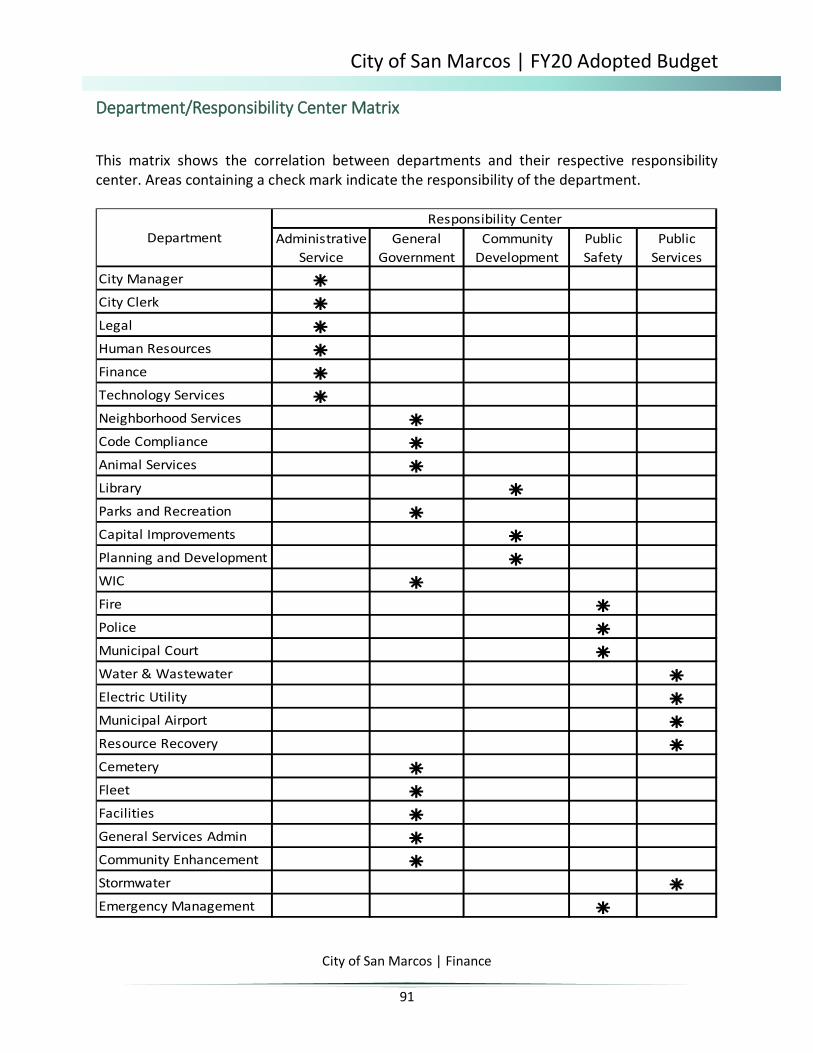
City of San Marcos | FY20 Adopted Budget
City of San Marcos | Finance
91
Department/Responsibility Center Matrix
This matrix shows the correlation between departments and their respective responsibility center. Areas containing a check mark indicate the responsibility of the department.
Responsibility CenterAdministrative
ServiceGeneral
GovernmentCommunity
DevelopmentPublic Safety
Public Services
City Manager r
City Clerk r
Legal r
Human Resources r
Finance r
Technology Services r
Neighborhood Services r
Code Compliance r
Animal Services r
Library r
Parks and Recreation r
Capital Improvements r
Planning and Development r
WIC r
Fire r
Police r
Municipal Court r
Water & Wastewater r
Electric Utility r
Municipal Airport r
Resource Recovery r
Cemetery r
Fleet r
Facilities r
General Services Admin r
Community Enhancement r
Stormwater r
Emergency Management r
Department

City of San Marcos | FY20 Adopted Budget
City of San Marcos | Finance
92
Department/Division Assignment by Fund The annual budget is presented by fund. This matrix shows the assignment of departments and divisions by fund within the budget. The departments and divisions within each fund are shown below the respective fund.

City of San Marcos | FY20 Adopted Budget
City of San Marcos | Finance
93
Community Information The City of San Marcos is a Home-Rule municipality operating under the Council-Manager form of government and is approximately 32 square miles in size with a residential population of 63,509. The city was incorporated on July 11, 1877. San Marcos is the county seat and principal commercial, educational and recreational center of Hays County. San Marcos is located on Interstate Highway 35 and U.S. Highway 81, and at the intersection of State Highways 80, 142, 21 and 123, midway between the metropolitan areas of San Antonio and Austin. San Marcos attracts millions of visitors annually that shop at the Premium Outlet Mall, Tanger Outlet Mall, and visit the Aquarena Springs Park and Wonder World Park. Beef, sorghums and cotton are the principal sources of agricultural income. Retail sales are the principal source of economic income. The climate of San Marcos is humid sub-tropical with hot summers. The annual total precipitation is 35.75 inches. Rainfall occurs in late spring and early fall. The mean length of the growing season (without freeze) is 254 days. San Marcos receives about 63% of total possible sunshine annually. San Marcos sits between 650 and 805 feet above sea level. There are 385 lane miles of streets and roads in the city, with approximately 99.9% of these paved. Transportation methods include two bus services, an airport, and two railways. There are five fire stations and one police station in the city. There are six public elementary schools, four private elementary schools, two public junior high schools, 3 private junior high schools, one public high school, two private high schools, and one public alternative education school located in San Marcos. There are currently over 49,000 registered voters within the city limits. The City’s 27,000 square-foot public library houses a collection of over 190,000 volumes. The library collection includes books, eBooks, videos, audiotapes, computer software, and audiovisual equipment. All residents of San Marcos and Hays County are eligible to borrow materials and use other library services. The library offers a wide array of programs and services including GED and English as a Second Language tutoring for adults, story time and film programs for children, inter-library loan, and reference assistance. The library is open seven days per week and makes its two meeting rooms and thirty internet-accessible computers available for public use. Regional Parks
Bicentennial Park- 3.9 acres, .2 miles of walking/biking trails, picnic facilities
Cape’s Camp- 20.1 undeveloped acres, .9 miles of walking/biking trails
Children’s Park- 6.3 acres, .4 miles of walking/biking trails, 1 playground, picnic facilities, BBQ grills, picnic pavilion, restroom facilities

City of San Marcos | FY20 Adopted Budget
City of San Marcos | Finance
94
City Park- 18.2 acres, rental facility (Rec Hall), basketball court, concessions stand, .6 miles of walking/biking trails, playground, picnic facilities, restroom facilities
Juan Veramendi Plaza Park- 3.8 acres, rental facility (gazebo), .2 miles of walking/biking trails
Meeks Property- 6.9 undeveloped acres
Ramon Lucio Park-18.5 acres, baseball/softball fields, rental facility (pavilion), concessions stand, .7 miles of walking/biking trail, picnic facilities and pavilions and restroom facilities.
Rio Vista Park- 16.8 acres, rental facility (pavilion), 2 basketball courts, 6 lighted tennis courts, concessions stand, swimming pool and splash pad, .5 miles of walking/biking trails, picnic facilities and pavilions, restroom facilities
San Marcos Plaza Park- 5.4 acres, rental facility (Fish Hatchery), stage/patio/gazebo, .3 miles of walking/biking trails
William and Eleanor Crook Park- 16.2 acres, .9 miles of walking/biking trails, picnic facilities and restroom facilities, Discovery Center
Total acreage of Regional Parks- 116
Neighborhood Parks
Anita Reyes Park- .4 acres, basketball court, playground, picnic facilities and pavilion
Conway Park- .4 acres, basketball court, skate park, .1 miles of walking/biking trails, playground, picnic facilities
Craddock Avenue Park- 4.5 undeveloped acres
Dunbar Park- 5.8 acres, 2 baseball/softball fields, rental facility (Dunbar), basketball court, .2 acres of walking/biking trails, skate park, playground, picnic facilities
Eddie Durham Park- .3 acres, .1 walking/biking trails, picnic facilities, pavilion/stage
El Camino Real Park- 37.6 acres, basketball court, .5 miles of walking/biking trail, playground, picnic facilities
Franklin Square Park- 4.5 acres, playground, picnic facilities
HEB Park- .9 acres
Haynes Street Park- .3 acres, basketball court, picnic facilities
Jaycees Park- 2.7 acres, basketball court, playground, picnic facilities
Mill Street Park- .8 acres, basketball court, .1 miles of walking/biking trails, playground, picnic facilities and pavilion
Paul Pena Park- 2.9 acres, .2 miles of walking/biking trails, playground, picnic facilities

City of San Marcos | FY20 Adopted Budget
City of San Marcos | Finance
95
Swift Memorial Park- .3 acres, basketball court, playground, picnic facilities
Victory Gardens Park- .6 acres, basketball court, playground, picnic facilities, .1 miles of walking/biking trails
Vietnam Veterans Park- 6.3 acres, skate park, .2 miles of walking/biking trails, playground, picnic facilities
Willow Springs Park, 4.8 acres, .2 miles of walking/biking trails, playground
Total acreage of Neighborhood Parks- 73
Greenspace and Natural Areas
Blanco River Village- 12.8 undeveloped acres
Blanco River Walk- 55.9 undeveloped acres
Blanco Shoals Natural Area- 91.5 undeveloped acres, 2 miles of walking/biking trails
Cottonwood Creek Park- 52.9 undeveloped acres
Lancaster Greenbelt- .9 undeveloped acres
Lower Purgatory Creek Natural Area- 142 acres, 5.9 miles of walking/biking trails, restroom facilities
Prospect Park- 9 acres, 2 miles of walking/biking trails
Retreat on Willow Creek- 33 acres
Ringtail Ridge Natural Area- 45.1 acres, 2 miles of walking/biking trails, picnic facilities
Schulle Canyon Natural Area- 21.1 acres, 1 mile of walking/biking trails
Sessom Creek Natural Area- 10.4 acres, .5 miles of walking/biking trails
Spring Lake Preserve Natural Area- 251.5 acres, 6 miles of walking/biking trails, picnic facilities, restroom facilities
Upper Purgatory Creek Natural Area- 760.2 acres, 13 miles of walking/biking trails, restroom facilities
Total acreage of Greenspace and Natural Areas- 1,486.3
Special Use Parks
Alemeda Park- 3.6 acres
Five Mile Dam Soccer Complex- 42.7 acres, soccer/cricket fields, concessions stand, 1 mile of walking/biking trails, playground, picnic facilities and restroom facilities

City of San Marcos | FY20 Adopted Budget
City of San Marcos | Finance
96
Gary Sports Complex- 42.6 acres, baseball/softball fields, concessions stand, playground, picnic facilities and restroom facilities
Hays County Veterans Memorial- 3 acres
Memorial Park- 25.2 acres, rental facility (Activity Center), basketball court, skate park, indoor swimming pool, library, restroom facilities
River Ridge Park- 3.7 acres
Total acreage of Special Use Parks -120.6
City owned total acreage 1,795.9

City of San Marcos | FY20 Adopted Budget
City of San Marcos | Finance
97
Consolidate Fund Balance Statement
Fund Estimated Estimated Fund Adopted Adopted FundBalance Revenues Expenses Balance Revenues Expenses Balance
10-01-2018 FY 2018-19 FY 2018-19 10-01-2019 FY 2019-20 FY 2019-20 09-30-2020
Governmental Funds
General Fund 16,009,441 82,084,010 78,467,197 19,626,253 86,383,933 87,913,319 18,096,868
Debt Service Fund 9,528,758 18,137,142 18,897,302 8,768,597 18,482,862 16,971,811 10,279,647
Special Revenue Funds
Hotel Occupancy Tax Fund 208,212 3,988,866 3,944,791 252,287 3,995,707 4,057,936 190,058
Municipal Court Technology Fund 178,585 25,000 5,000 198,585 25,000 5,000 218,585
Municipal Court Security Fee Fund 134,511 18,500 37,073 115,938 18,500 87,073 47,365
Municipal Court Juvenile Fee Fund 51,372 36,000 29,363 58,009 36,000 28,464 65,545
Municipal Court Efficiency Fee Fund 40,989 4,000 24,000 20,989 4,000 20,000 4,989
Seized Assets Fund 194,253 5,000 73,180 126,073 5,000 5,000 126,073
TIRZ #2, #3, #5, TRZ #1 1,604,315 3,431,140 2,668,594 2,366,861 5,138,767 4,128,767 3,376,861
CDBG Program Fund - 649,948 649,948 - 680,998 680,998 -
WIC Program Fund - 2,033,209 2,033,209 - 2,035,837 2,035,837 -
Cemetery Operations Fund 39,430 175,170 208,380 6,220 250,000 252,546 3,674
PEG Funds 545,249 96,700 70,000 571,949 97,000 100,000 568,949
Enterprise Funds
Water & Wastewater Utility Fund 10,086,852 42,072,600 42,061,443 10,098,010 46,324,215 45,664,293 10,757,932
Drainage Utility Fund 1,064,541 5,850,771 5,432,604 1,482,708 6,943,593 6,806,827 1,619,474
Electric Utility Fund 10,866,772 58,770,470 59,041,682 10,595,560 62,018,343 62,929,979 9,683,924
Municipal Airport Fund 24,863 561,894 586,668 89 615,855 615,915 29
Resource Recovery Fund 1,527,239 4,401,867 4,446,299 1,482,806 4,808,429 4,793,597 1,497,637
Transit 101,842 610,000 636,417 75,425 1,923,681 1,961,608 37,498
All Funds 52,207,223 222,952,287 219,313,151 55,846,359 239,787,720 239,058,972 56,575,108

City of San Marcos | FY20 Adopted Budget
City of San Marcos | Finance
98
Consolidated Summary of Major Revenue and Expenses
General Fund
Debt Service Fund
Hotel Occupancy Tax Fund
CDBG Program
Fund
WIC Program
Fund
Other Special Revenue Funds
Water & Wastewater Utility Fund
Drainage Utility Fund
Beginning Fund BalanceOctober 1 2019 19,626,253 8,768,597 252,287 - - 3,458,405 10,098,010 1,482,708
Major RevenuesTaxes 71,201,563 11,678,697 3,852,519 - - - - - Licenses and Permits 3,361,754 - - - - - - - Fines and Penalties 1,249,990 - - - - 88,500 - 49,048 Interest Income 463,801 90,000 1,000 - - - 285,482 16,000 Cultural and Recreational 772,872 - - - - - - - Current Services 910,337 - - - - - - - Grants - - - 680,998 2,035,837 - - - Water Service Revenue - - - - - - 24,079,879 - Wastewater Service Revenue - - - - - - 18,493,283 - Drainage Service Revenue - - - - - - - 6,837,751 Electric Service Revenue - - - - - - - - Resource Recovery Revenue - - - - - - - - Operating Transfers 6,563,052 - 142,188 - - - - - Other Revenues 1,860,566 6,714,165 - - - 5,235,767 3,465,571 40,795 One-Time Revenues - - - - - - - -
Total Revenues 86,383,933 18,482,862 3,995,707 680,998 2,035,837 5,324,267 46,324,215 6,943,593
Major ExpensesPersonnel Services 54,584,392 - - 129,990 1,577,614 60,537 5,354,194 1,265,039 Contracted Services 7,992,879 - 2,593,325 551,008 288,193 75,000 11,879,409 1,196,517 Materials and Supplies 4,843,879 - - - 129,383 10,000 1,520,388 181,805 Other Charges 4,562,622 - - - 40,647 3,930,767 10,326,913 353,527 Capital Outlay and Maintenance 200,000 - - - - 100,000 240,000 330,000 System Improvements - - - - - - - - Social Services 500,000 - - - - - - - Debt Service - 16,971,811 - - - - 14,397,947 3,469,118 Operating Transfers 4,360,093 - 1,464,611 - - 198,000 161,514 10,822 Transfer to Capital Reserves - - - - - - 1,783,928 - One-Time Expenses 10,869,454 - - - - - - -
Total Expenses 87,913,318 16,971,811 4,057,936 680,998 2,035,837 4,374,304 45,664,293 6,806,827
Ending Fund Balanceon 09/30/2020 18,096,868 10,279,648 190,058 - - 4,408,367 10,757,932 1,619,473

City of San Marcos | FY20 Adopted Budget
City of San Marcos | Finance
99
Consolidated Summary of Major Revenue and Expenses
Electric Utility Fund
Municipal Airport Fund
Resource Recovery
Fund
Cemetery Fund
Transit Fund Permanent Funds
Total from All Funds
Beginning Fund BalanceOctober 1 2019 10,595,560 89 1,482,806 6,220 75,425 - 55,846,359
Major RevenuesTaxes - - - - - - 86,732,778 Licenses and Permits - - - - - - 3,361,754 Fines and Penalties - - - - - - 1,387,537 Interest Income 281,959 - - - - - 1,138,242 Cultural and Recreational - - - - - - 772,872 Current Services - 689,855 - 80,000 1,273,681 - 2,953,873 Grants - - - - - - 2,716,835 Water Service Revenue - - - - - - 24,079,879 Wastewater Service Revenue - - - - - - 18,493,283 Drainage Service Revenue - - - - - - 6,837,751 Electric Service Revenue 57,203,312 - - - - - 57,203,312 Resource Recovery Revenue - - 4,753,429 - - - 4,753,429 Operating Transfers - - - 170,000 650,000 - 7,525,240 Other Revenues 4,533,072 (74,000) 55,000 - - - 21,830,936 One-Time Revenues - - - - - - -
Total Revenues 62,018,343 615,855 4,808,429 250,000 1,923,681 - 239,787,720
Major ExpensesPersonnel Services 6,914,021 - 403,946 - 207,315 - 70,497,049 Contracted Services 40,715,031 508,850 4,078,562 247,546 1,745,200 - 71,871,520 Materials and Supplies 1,455,030 5,000 27,000 5,000 3,000 - 8,180,485 Other Charges 8,605,644 102,065 284,089 - 6,093 - 28,212,366 Capital Outlay and Maintenance 426,284 - - - - - 1,296,284 System Improvements - - - - - - - Social Services - - - - - - 500,000 Debt Service 4,522,302 - - - - - 39,361,178 Operating Transfers - - - - - - 6,195,040 Transfer to Capital Reserves 249,667 - - - - - 2,033,595 One-Time Expenses 42,000 - - - - - 10,911,454
Total Expenses 62,929,979 615,915 4,793,597 252,546 1,961,608 - 239,058,971
Ending Fund Balanceon 09/30/2020 9,683,924 29 1,497,638 3,674 37,497 - 56,575,108

City of San Marcos | FY20 Adopted Budget
City of San Marcos | Finance
100
Consolidated Revenue Comparison
Actual Approved Estimated AdoptedFiscal Year Fiscal Year Fiscal Year Fiscal Year2017/2018 2018/2019 2018/2019 2019/2020
Governmental Funds
General Fund 74,755,128 80,378,645 82,084,010 86,383,933
Debt Service Fund 17,713,361 18,529,078 18,137,142 18,482,862
Special Revenue Funds
Hotel Occupancy Tax Fund 3,870,924 3,744,494 3,988,866 3,995,707
Municipal Court Technology Fund 25,754 25,000 25,000 25,000
Municipal Court Security Fee Fund 18,607 18,500 18,500 18,500
Municipal Court Juvenile Fee Fund 35,872 36,000 36,000 36,000
Municipal Court Efficiency Fee Fund 4,347 4,000 4,000 4,000
Seized Assets Fund 48,432 5,000 5,000 5,000
TIRZ #2, #3, #5, TRZ #1, TIZ #1 2,747,463 3,955,409 3,431,140 5,138,767
CDBG Program Fund 941,575 649,948 649,948 680,998
WIC Program Fund 1,581,731 2,033,209 2,033,209 2,035,837
Cemetery Operations Fund 177,481 235,500 175,170 250,000
PEG Funds 99,518 97,000 96,700 97,000
Enterprise Funds
Water/Wastewater Utility Fund 40,840,513 43,192,537 42,072,600 46,324,215
Drainage Utility Fund 5,005,918 5,838,920 5,850,771 6,943,593
Electric Utility Fund 60,472,572 62,843,735 58,770,470 62,018,343
Municipal Airport Fund 553,938 598,816 561,894 615,855
Resource Recovery Fund 4,258,166 4,412,733 4,401,867 4,808,429
Transit Fund 610,000 610,000 610,000 1,923,681
Total 213,761,300 227,208,525 222,952,287 239,787,720

City of San Marcos | FY20 Adopted Budget
City of San Marcos | Finance
101
Consolidated Expense Comparison
Actual Approved Estimated AdoptedFiscal Year Fiscal Year Fiscal Year Fiscal Year2017/2018 2018/2019 2018/2019 2019/2020
Governmental Funds
General Fund 74,579,585 80,659,797 78,467,197 87,913,319
Debt Service Fund 17,336,637 19,515,550 18,897,302 16,971,811
Special Revenue Funds
Hotel Occupancy Tax Fund 3,708,431 3,794,050 3,944,791 4,057,936
Municipal Court Technology Fund 105 5,000 5,000 5,000
Municipal Court Security Fee Fund 29,401 87,073 37,073 87,073
Municipal Court Juvenile Fee Fund 27,379 29,363 29,363 28,464
Municipal Court Efficiency Fee Fund - 20,000 24,000 20,000
Seized Assets Fund 9,000 73,180 73,180 5,000
TIRZ #2, #3, #5, TRZ #1, TIZ #1 2,053,727 5,197,087 2,668,594 4,128,767
CDBG Program Fund 941,575 649,948 649,948 680,998
WIC Program Fund 1,581,731 2,033,209 2,033,209 2,035,837
Cemetery Operations Fund 157,439 239,224 208,380 252,546
PEG Funds 71,934 100,000 70,000 100,000
Enterprise Funds
Water/Wastewater Utility Fund 40,273,819 42,855,299 42,061,443 45,664,293
Drainage Utility Fund 4,884,816 5,552,604 5,432,604 6,806,827
Electric Utility Fund 59,481,491 62,883,688 59,041,682 62,929,979
Municipal Airport Fund 532,407 598,882 586,668 615,915
Resource Recovery Fund 3,996,489 4,438,889 4,446,299 4,793,597
Transit Fund 585,527 636,417 636,417 1,961,608
Total 210,251,494 229,369,262 219,313,151 239,058,972

City of San Marcos | FY20 Adopted Budget
City of San Marcos | Finance
102
Consolidated Fund Balance Comparison
Actual Approved Estimated AdoptedFiscal Year Fiscal Year Fiscal Year Fiscal Year2017/2018 2018/2019 2018/2019 2019/2020
Governmental Funds
General Fund 16,009,441 15,728,289 19,626,253 18,096,868
Debt Service Fund 9,528,758 8,542,286 8,768,597 10,279,648
Special Revenue Funds
Hotel Occupancy Tax Fund 208,212 158,655 252,287 190,058
Municipal Court Technology Fund 178,585 198,585 198,585 218,585
Municipal Court Security Fee Fund 134,511 65,938 115,938 47,365
Municipal Court Juvenile Fee Fund 51,372 58,009 58,009 65,545
Municipal Court Efficiency Fee Fund 40,989 24,989 20,989 4,989
Seized Assets Fund 194,253 126,073 126,073 126,073
TIRZ #2, #3, #5, TRZ #1, TIZ #1 1,604,315 362,637 2,366,861 3,376,861
CDBG Program Fund - - - -
WIC Program Fund - - - -
Cemetery Operations Fund 39,430 35,706 6,220 3,674
PEG Funds 545,249 542,249 571,949 568,949
Enterprise Funds
Water/Wastewater Utility Fund 10,086,852 10,424,091 10,098,010 10,757,932
Drainage Utility Fund 1,064,541 1,350,857 1,482,708 1,619,473
Electric Utility Fund 10,866,772 10,826,819 10,595,560 9,683,924
Municipal Airport Fund 24,863 24,797 89 29
Resource Recovery Fund 1,527,239 1,501,083 1,482,806 1,497,638
Transit Fund 101,842 75,425 75,425 37,497
Total 52,207,224 50,046,487 55,846,360 56,575,108

City of San Marcos | FY20 Adopted Budget
City of San Marcos | Finance
103
Property Tax Valuation and Revenue
Total Market Value 5,644,609,342$ Less: Exemptions & Exempt Properties -
Net Taxable Assessed Valuations 5,644,609,342$
Assessed Value X $0.6139 Tax Rate 34,652,257$ 98.00% Collection Rate 33,959,212$ 2.00% Delinquent Rate 693,045$
Total Taxes To Be Collected:Current Collections 33,959,212$ Delinquent Collections 65.00% 450,479 Penalties and Interest 35.00% 242,566
34,652,257$
Division of Tax Rate:Debt Service 33.7026% 0.2069$ 11,678,697$ O & M 66.2974% 0.4070 22,973,560
100.0000% 0.6139$ 34,652,257$
General Fund Detail: Debt Service Fund Detail:Current Ad Valorem 19,664,108$ Current Ad Valorem 10,234,036$ TIZ 2,849,981 TIZ 1,211,087 Delinquent 298,656 Delinquent 151,823 Penalties 160,815 Penalties 81,751
22,973,560$ 11,678,697$
One-cent equals: 564,461$

City of San Marcos | FY20 Adopted Budget
City of San Marcos | Finance
104
Organizational Chart

City of San Marcos | FY20 Adopted Budget
City of San Marcos | Finance
105
Personnel Roster – Total of All Funds
Positions Full Time Equivalent
Actual Adopted Actual Adopted Actual Adopted Actual Adopted2017-18 2018-19 2018-19 2019-20 2017-18 2018-19 2018-19 2019-20
General Fund 605 628 630 646 529.48 553.05 556.69 570.14Hotel Occupancy Tax Fund 11 11 10 11 10.00 10.00 9.50 11.00Water/Wastewater Utility Fund 63 65 65 70 63.21 65.21 65.21 70.21Drainage Utility Fund 10 11 12 17 9.00 11.00 12.00 17.00Electric Utility Fund 66 68 67 72 65.33 68.33 66.33 72.33Resource Recovery 4 7 7 7 4.25 5.21 5.21 5.21Transit 1 1 1 2 1.33 1.33 1.33 2.33WIC State Program 26 26 25 25 25.75 25.75 25.50 25.50
Total 786 817 817 850 708.35 739.88 741.78 773.73

City of San Marcos | FY20 Adopted Budget
City of San Marcos | Finance
106
General Fund – Financial Forecast
FY 2019 FY 2020 FY 2021 FY 2022 FY 2023
Operating RevenuesSales Taxes 34,733,037 37,519,111 38,088,295 39,951,113 40,750,135 Ad Valorem Taxes 16,584,266 19,626,697 23,074,153 27,285,011 28,627,433 Other Taxes 9,817,443 9,952,852 10,039,116 10,899,638 13,264,350 Licenses and Permits 3,250,606 3,598,452 3,361,754 3,380,766 3,448,382 Fines and Penalties 1,235,900 1,205,500 1,249,990 1,322,506 1,348,956 Interest Income 438,949 463,586 463,801 556,731 567,865 Cultural and Recreational 752,371 782,411 772,872 816,022 832,343 Charges from Current Services 735,208 911,763 910,337 951,670 970,703 Other Revenue 1,479,327 1,711,349 1,860,566 1,906,390 1,944,518 Reimbursements from Other Funds 5,728,020 6,312,291 6,563,052 6,891,204 7,029,029
Total Operating Revenues 74,755,128 82,084,010 86,383,933 93,961,051 98,783,714 Operating Expenditures
Personnel Services 47,354,777 49,195,236 54,591,889 56,502,605 58,480,196 Contracted Services 7,309,680 7,264,857 8,048,079 8,209,040 8,373,221 Materials and Supplies 4,872,265 4,540,971 4,843,879 4,940,756 5,039,571 Other Charges 4,115,260 3,930,720 4,499,925 4,589,924 4,681,722 Social Services 450,000 500,000 500,000 500,000 500,000 Operating Transfers 1,418,405 2,819,172 4,360,093 4,403,694 4,447,731
Total Operating Expenditures 65,520,387 68,250,955 76,843,865 79,146,019 81,522,442
Operating Income/ (Loss) 9,234,741 13,833,054 9,540,069 14,815,032 17,261,272
One-Time RevenuesPrior Period Adjustment - - - - - Other Revenue - - - - -
One-Time ExpensesOne-Time Operating Transfers - - - - - Other Incentives 207,020 200,000 200,000 200,000 200,000 Economic Development Incentives 6,117,307 7,232,883 7,727,220 7,997,673 8,277,591 Capital Outlay and Maintenance 2,734,871 2,783,359 3,142,234 3,142,234 3,142,234
Net Change in Fund Balance 175,542 3,616,812 (1,529,385) 3,475,125 5,641,447 Beginning Unreserved Fund Balance 15,833,897 16,009,440 19,626,252 18,096,867 21,571,992
Ending Unreserved Fund Balance 16,009,440 19,626,252 18,096,867 21,571,992 27,213,439
Percentage of Operating Expenditures 25.0% 30.0% 25.0% 28.9% 35.3%
Days of Operation 91 109 91 105 129

City of San Marcos | FY20 Adopted Budget
City of San Marcos | Finance
107
General Fund – Fund Summary
Actual Approved Estimated Adopted2017/2018 2018/2019 2018/2019 2019/2020
Beginning Unreserved Fund Balance 15,833,899 16,009,441 16,009,441 19,626,253
Operating Revenues
Property Taxes 16,584,266 19,626,697 19,626,697 23,074,153
Sales Tax 34,733,037 35,719,111 37,519,111 38,088,295
Franchise Taxes and other Fees 9,817,443 10,555,534 9,952,852 10,039,116 Licenses and Permits 3,250,606 2,939,239 3,598,452 3,361,754 Fines and Penalties 1,235,900 1,448,666 1,205,500 1,249,990 Interest Income 438,949 263,586 463,586 463,801 Cultural and Recreational 752,371 785,411 782,411 772,872 Current Services 735,208 941,763 911,763 910,337 Other Revenue 1,479,327 1,786,349 1,711,349 1,860,566 Reimbursement from Other Funds 5,728,020 6,312,291 6,312,291 6,563,052
Total Operating Revenue 74,755,128 80,378,645 82,084,010 86,383,933
Operating ExpendituresPersonnel Services 47,354,777 50,620,236 49,195,236 54,591,889 Contracted Services 7,309,680 7,622,457 7,264,857 8,048,079 Materials and Supplies 4,872,265 4,620,971 4,540,971 4,843,879 Other Charges 4,115,260 4,155,720 3,930,720 4,499,925 Social Services 450,000 500,000 500,000 500,000 Operating Transfers 1,418,405 2,924,172 2,819,172 4,360,093
Total Operating Expenditures 65,520,387 70,443,555 68,250,955 76,843,865
Non-Recurring ExpensesOne-Time Operating Transfers - Eco Development 6,117,307 7,232,883 7,232,883 7,727,220 Other Incentives 207,020 200,000 200,000 200,000 Capital Outlay and Maintenance 2,734,871 2,783,359 2,783,359 3,142,234
One-Time Expenditures 9,059,198 10,216,242 10,216,242 11,069,454
Total Expenditures 74,579,585 80,659,797 78,467,197 87,913,319
Reserved Fund Balance
Ending Unreserved Fund Balance 16,009,441 15,728,289 19,626,253 18,096,868
Fund Balance as a Percentage of Operating Expenditures 25.0% 23.3% 30.0% 25.0%
Days of Operation 91 85 109 91
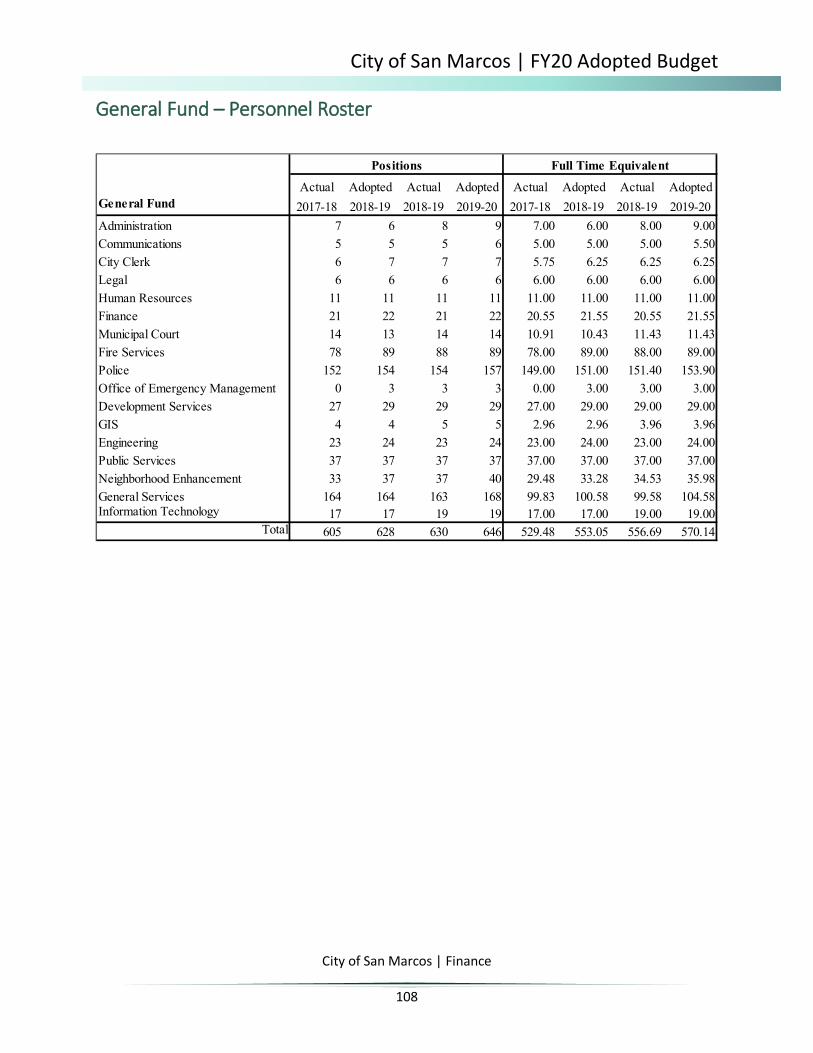
City of San Marcos | FY20 Adopted Budget
City of San Marcos | Finance
108
General Fund – Personnel Roster
Positions Full Time Equivalent
Actual Adopted Actual Adopted Actual Adopted Actual AdoptedGeneral Fund 2017-18 2018-19 2018-19 2019-20 2017-18 2018-19 2018-19 2019-20Administration 7 6 8 9 7.00 6.00 8.00 9.00Communications 5 5 5 6 5.00 5.00 5.00 5.50City Clerk 6 7 7 7 5.75 6.25 6.25 6.25Legal 6 6 6 6 6.00 6.00 6.00 6.00Human Resources 11 11 11 11 11.00 11.00 11.00 11.00Finance 21 22 21 22 20.55 21.55 20.55 21.55Municipal Court 14 13 14 14 10.91 10.43 11.43 11.43Fire Services 78 89 88 89 78.00 89.00 88.00 89.00Police 152 154 154 157 149.00 151.00 151.40 153.90Office of Emergency Management 0 3 3 3 0.00 3.00 3.00 3.00Development Services 27 29 29 29 27.00 29.00 29.00 29.00GIS 4 4 5 5 2.96 2.96 3.96 3.96Engineering 23 24 23 24 23.00 24.00 23.00 24.00Public Services 37 37 37 37 37.00 37.00 37.00 37.00Neighborhood Enhancement 33 37 37 40 29.48 33.28 34.53 35.98General Services 164 164 163 168 99.83 100.58 99.58 104.58Information Technology 17 17 19 19 17.00 17.00 19.00 19.00
Total 605 628 630 646 529.48 553.05 556.69 570.14

City of San Marcos | FY20 Adopted Budget
City of San Marcos | Finance
109
General Fund – Revenue Detail
Actual Approved Estimated Adopted2017/2018 2018/2019 2018/2019 2019/2020
Taxes
Current Ad Valorem Taxes 16,460,782 15,600,450 19,234,163 22,612,670 TIRZ Allocation - - - - Delinquent Ad Valorem Taxes 54,631 206,945 255,147 299,964 Penalty & Int On Delinq Taxes 68,853 111,432 137,387 161,519 Sales Tax 34,733,037 32,002,025 37,519,111 38,088,295 Mixed Beverage Tax 517,854 496,610 546,441 573,763 Other Utility Franchise 1,392,840 1,357,649 1,456,202 1,485,326 Telephone Franchise 77,508 92,220 77,992 77,992 Solid Waste Hauler Permit Fee 305,281 287,389 423,537 444,714 Cosm Elec Utility Franchise 4,490,286 4,735,677 4,319,248 4,204,232 Cosm W/WW Utility Franchise 3,033,673 3,027,529 3,129,433 3,253,089
Total 61,134,745 57,917,925 67,098,659 71,201,563
Licenses & Permits
Professional & Occupational 56,032 64,002 56,426 58,411 Alcohol Permit 19,545 26,218 20,322 20,403 Pet Licenses 2,297 2,527 2,845 2,866 Building Permits 1,637,481 1,383,397 2,058,325 1,751,458 Parking Permits 1,065 - 1,536 1,588 Permit Tech Fee 29,744 30,458 38,461 32,638 Mechanical (Htg/Ac) Permit 47,999 42,758 54,063 49,352 Plumbing & Gas Permits 102,763 65,767 160,893 129,022 Sign Permit Fees 23,839 25,912 27,792 35,825 Mobile Home Inspection 7,224 4,002 6,965 8,212 Zoning 36,201 50,502 51,743 40,752 Electrical Permit 67,053 44,070 90,776 77,269 Cert Of Occupancy 4,785 5,127 20,154 15,504 Specific Use Permit 22,200 28,249 25,755 25,848 Site Development Permit 274,520 214,113 326,091 302,886 Plat Review-Subdivisions 105,432 107,443 107,923 116,720 Variances & Appeals 700 4,610 0 3,289 Construction Plan Review 449,182 411,702 197,519 304,938 Temp Food Srvc Facilities (26) 1,652 3,000 75 Food Permits/Food Handler 208,403 209,144 217,774 225,444 Food Handler Cert Fee - - - - Septic Tank Permits - 2,411 1,217 30 Other Permits/Fees 13,000 13,989 13,528 13,838 Street Closure Permits 59,149 10,000 32,540 65,814 Architectural Barrier Review 26,700 33,613 22,156 20,554 Moving 6,944 8,095 8,920 8,585 Security Alarm Permit Fee 27,047 37,809 30,864 28,784 Fire Prev & Prot Permit Fee 21,326 28,853 20,866 21,649
Total 3,250,606 2,856,423 3,598,452 3,361,754

City of San Marcos | FY20 Adopted Budget
City of San Marcos | Finance
110
General Fund – Revenue Detail
Actual Approved Estimated Adopted2017/2018 2018/2019 2018/2019 2019/2020
Fines & Penalties
Parking Meter Fines 155,367 157,372 165,000 174,125 Traffic Fines 565,792 632,827 580,000 589,500 School Bus Safety Fines - 25,000 - - Mc Technology Fee - 7,573 (0) (0) Other-Expunction 46,325 135,960 45,000 44,235 Complaints 324,397 259,865 265,000 306,625 Over-Under 618 51 - - Failure To Appear Fee 482 24,701 - - Warrant Fee 28,756 38,299 60,000 31,500 False Alarm Charges 14,746 27,517 15,000 23,108 Defensive Driving Admin Fee 9,705 29,637 11,500 8,634 Arrest Fee 58,026 58,199 33,000 45,825 Mc-Special Exp Fee 9,510 318,444 6,000 3,150 Dismissal Fee 12,178 18,908 13,500 12,819 Traffic Fee 7,854 3,605 7,500 7,368 Child Safety-Sb 460 2,145 4,500 4,000 3,100
Total 1,235,900 1,742,457 1,205,500 1,249,990
Interest Income
Interest Income 438,949 134,000 463,586 463,801
Total 438,949 134,000 463,586 463,801
Cultural and Recreational
Softball/Athletic Programs 24,031 4,964 13,049 21,177 Summer Fun Program Fee 85,556 93,716 82,811 87,070 Library Lost Materials 6,834 8,345 18,750 7,469 Library Fines 20,138 32,980 24,689 22,617 Library Cards 6,868 10,510 7,195 7,397 Library Misc Fee 19,579 20,413 19,612 20,602 Aquatic 43,261 12,495 47,515 41,188 PARD Building User Fee 103,385 93,464 104,719 102,618 Swimming Lessons 7,098 11,511 8,345 7,209 Hays County Library Donations 85,000 80,000 85,000 85,000 Annual Entry Fee-Resident 110,608 25,909 104,627 102,616 Annual Entry Fee-Non Resident 53,800 170,768 66,523 66,391 Daily Entry Fee-Resident 24,604 38,339 25,850 21,908 Daily Entry Fee-Non Resident 7,399 6,339 9,690 9,242

City of San Marcos | FY20 Adopted Budget
City of San Marcos | Finance
111
General Fund – Revenue Detail
Actual Approved Estimated Adopted2017/2018 2018/2019 2018/2019 2019/2020
Basketball Court Rental 9,708 1,233 6,931 8,173 Racquetball Court Rental 101 1,041 910 1,023 Equipment Rental Fee 1,160 1,238 1,502 1,038 Aerobics Fee 54,944 81,724 50,392 56,260 Instructional Fee 15,503 20,586 29,621 25,741 Lap Swim Fee 2,178 3,565 3,445 3,086 Senior Activities 890 2,224 1,319 1,033 Travel Programs Fee 5,406 23,876 4,856 5,121 Activity Center Meeting Room 57,141 54,830 59,302 59,250 PARD-Equipment Rent 5,927 4,118 4,236 4,606 Av Equipment - 1,053 214 5 PARD-Other Revenue 1,029 10,000 1,305 5,033
Total 752,146 815,242 782,411 772,872
Charges for Current Services
Passports 152,725 164,369 198,345 170,000 Animal Shelter Chrgs (Pound) 48,029 60,941 27,041 30,676 Animal Shelter Adopt Fee 38,992 50,054 23,219 28,580 Animal Shelter Vaccine-Micro 7,180 14,500 5,284 6,132 Parking Space Leases - 953 (0) - Births-Vital Stats 41,680 46,742 39,633 40,000 Deaths-Vital Stats 2,428 3,681 2,116 2,499 Police Fees-Various 11,483 12,846 12,935 12,449 Photographs - - - - Criminal Record Name Check - 7 - - Fleet Services - - - - Fire Dept Rescue 1,637 - - - Community Enhancement Fee 431,055 410,000 603,190 620,000
Total 735,208 764,093 911,763 910,337
Other Revenues
Txdot Signal Reimbursement - - - - Land Sales - 4,215 - - TX State Reimbursement 127,808 - 65,000 65,000 SMCISD Reimbursement 169,823 171,258 172,062 173,921 Animal Shelter Svs Expansion 236,303 282,291 454,006 547,422 Auction Sales 110,798 22,993 80,515 150,000 Rebates 105,908 202,150 187,775 150,000 Misc Sales 1,729 729 938 1,000 Other Revenue 110,158 50,000 150,000 170,000 Other Revenue - Property Tax 63,509 79,166 50,813 55,000 Loan Repayment - JQH 547,925 547,924 549,894 548,222 MUD Fees 5,000 - - - NSF Service Charge 366 305 345 -
Total 1,479,327 1,361,031 1,711,349 1,860,566

City of San Marcos | FY20 Adopted Budget
City of San Marcos | Finance
112
General Fund – Revenue Detail
Actual Approved Estimated Adopted2017/2018 2018/2019 2018/2019 2019/2020
Reimbursement from Other Funds
Water/Wastewater Utility Fund 3,274,955 3,324,955 3,619,653 3,711,114 Electric Utility Fund 2,130,807 2,130,807 2,248,001 2,427,068 Drainage Utility Fund 125,000 73,222 131,500 138,075 WIC Program Fund 197,258 260,131 273,138 286,794
Total 5,728,020 5,789,115 6,272,291 6,563,052
Total Revenues 74,754,903 71,380,286 82,044,010 86,383,933
Recap of Revenues:
Taxes 61,134,745 57,917,925 67,098,659 71,201,563 Licenses & Permits 3,250,606 2,856,423 3,598,452 3,361,754 Fines & Penalties 1,235,900 1,742,457 1,205,500 1,249,990 Interest Income 438,949 134,000 463,586 463,801 Cultural and Recreational 752,146 815,242 782,411 772,872 Charges for Current Services 735,208 764,093 911,763 910,337 Other Revenue 1,479,327 1,361,031 1,711,349 1,860,566 Reimbursements from Other Funds 5,728,020 5,789,115 6,272,291 6,563,052 One-Time Revenues - - - -
Total Revenues 74,754,903 71,380,286 82,044,010 86,383,933

City of San Marcos | FY20 Adopted Budget
City of San Marcos | Finance
113
General Fund – Expense Detail
Actual Approved Estimated Adopted2017/2018 2018/2019 2018/2019 2019/2020
Administrative Services
City ManagerPersonnel Services 1,187,280 1,152,569 1,152,569 1,439,385 Contracted Services 30,785 15,457 15,457 15,207 Materials and Supplies 9,722 9,180 9,180 10,080 Other Charges 76,800 46,666 46,666 75,058
Total 1,304,587 1,223,872 1,223,872 1,539,730
CommunicationsPersonnel Services 312,234 475,633 475,633 553,416 Contracted Services 13,109 6,400 6,400 6,400 Materials and Supplies 3,471 6,120 6,120 9,720 Other Charges 22,598 29,385 29,385 32,385
Total 351,412 517,538 517,538 601,921
City ClerkPersonnel Services 450,686 502,739 502,739 533,178 Contracted Services 55,558 72,079 72,079 92,079 Materials and Supplies 55,086 60,209 60,209 58,209 Other Charges 33,403 40,033 40,033 27,033
Total 594,733 675,059 675,059 710,498
City CouncilPersonnel Services 11,113 13,060 13,060 11,228 Contracted Services 4,879 8,280 8,280 8,280 Materials and Supplies 1,005 6,000 6,000 6,000 Other Charges 261,102 308,050 308,050 303,050
Total 278,100 335,390 335,390 328,558
LegalPersonnel Services 810,641 818,477 818,477 856,664 Contracted Services 71,670 85,039 85,039 85,039 Materials and Supplies 3,536 7,300 7,300 7,300 Other Charges 7,789 11,194 11,194 11,194
Total 893,636 922,010 922,010 960,197
Human ResourcesPersonnel Services 964,062 1,086,425 1,086,425 1,161,757 Contracted Services 102,820 135,068 135,068 127,718 Materials and Supplies 18,627 17,500 17,500 19,000 Other Charges 35,951 44,346 44,346 36,107
Total 1,121,460 1,283,339 1,283,339 1,344,582
FinancePersonnel Services 1,724,794 1,852,168 1,852,168 1,952,079 Contracted Services 44,757 49,537 49,537 46,240 Materials and Supplies 37,601 34,115 34,115 40,470 Other Charges 57,726 62,680 62,680 60,795
Total 1,864,879 1,998,501 1,998,501 2,099,584
Total Administrative Services 6,408,806 6,955,708 6,955,708 7,585,071

City of San Marcos | FY20 Adopted Budget
City of San Marcos | Finance
114
General Fund – Expense Detail
Actual Approved Estimated Adopted2017/2018 2018/2019 2018/2019 2019/2020
Technology Services
Technology ServicesPersonnel Services 1,483,664 1,719,215 1,719,215 1,936,101 Contracted Services 149,644 195,855 195,855 221,732 Materials and Supplies 19,992 36,728 36,728 26,923 Other Charges 82,594 101,274 101,274 100,659
Total 1,735,894 2,053,072 2,053,072 2,285,416
GIS DivisionPersonnel Services 219,712 221,843 161,843 243,391 Contracted Services 11,265 15,900 15,900 16,200 Materials and Supplies 8,486 9,150 9,150 9,250 Other Charges 14,645 12,550 7,550 14,350
Total 254,109 259,443 194,443 283,191
Total Technology Services 1,990,003 2,312,515 2,247,515 2,568,607

City of San Marcos | FY20 Adopted Budget
City of San Marcos | Finance
115
General Fund – Expense Detail
Actual Approved Estimated Adopted2017/2018 2018/2019 2018/2019 2019/2020
Community Development
Engineering DepartmentPersonnel Services 2,202,710 2,017,615 1,967,615 2,246,829 Contracted Services 147,026 130,831 110,831 143,231 Materials and Supplies 46,692 38,697 38,697 47,720 Other Charges 59,421 62,135 62,135 61,830
Total 2,455,848 2,249,278 2,179,278 2,499,610
Real EstatePersonnel Services - 155,294 155,294 205,503 Contracted Services - 18,800 18,800 10,765 Materials and Supplies - 1,200 1,200 1,200 Other Charges - 3,635 3,635 5,270
Total - 178,929 178,929 222,738
Development Services AdminPersonnel Services 402,151 462,933 462,933 559,588 Contracted Services 39,990 49,935 49,935 50,633 Materials and Supplies 33,654 30,251 30,251 30,251 Other Charges 67,149 82,565 82,565 81,590
Total 542,944 625,684 625,684 722,062
Planning-Permit DivisionPersonnel Services 1,062,488 1,201,731 1,126,731 1,275,457 Contracted Services 147,852 134,411 134,411 143,339 Materials and Supplies - 9,064 9,064 9,443 Other Charges 4,376 5,635 5,635 5,635
Total 1,214,716 1,350,841 1,275,841 1,433,873
Inspections DivisionPersonnel Services 315,400 509,288 459,288 537,226 Contracted Services 8,146 11,115 11,115 11,115 Materials and Supplies 8,900 1,900 1,900 6,900 Other Charges 770 2,000 2,000 2,000
Total 333,215 524,303 474,303 557,241
LibraryPersonnel Services 1,495,477 1,547,227 1,447,227 1,643,888 Contracted Services 52,826 58,912 58,912 59,794 Materials and Supplies 176,390 174,380 174,380 178,790 Other Charges 21,636 21,244 21,244 23,244
Total 1,746,330 1,801,763 1,701,763 1,905,716
Total Community Development 6,293,053 6,730,798 6,435,798 7,341,240

City of San Marcos | FY20 Adopted Budget
City of San Marcos | Finance
116
General Fund – Expense Detail
Actual Approved Estimated Adopted2017/2018 2018/2019 2018/2019 2019/2020
Public Safety
Fire OperationsPersonnel Services 8,512,452 9,640,246 9,380,246 10,396,927 Contracted Services 92,460 134,072 134,072 175,293 Materials and Supplies 508,086 362,224 342,224 372,128 Other Charges 155,588 209,167 189,167 203,596
Total 9,268,587 10,345,709 10,045,709 11,147,944
Police OperationsPersonnel Services 15,761,036 15,128,086 14,878,086 16,293,459 Contracted Services 852,450 792,710 792,710 795,936 Materials and Supplies 800,100 686,913 626,913 672,750 Other Charges 123,048 102,790 102,790 168,402
Total 17,536,633 16,710,498 16,400,498 17,930,547
Municipal CourtPersonnel Services 573,768 646,534 646,534 829,100 Contracted Services 111,214 163,803 76,203 72,603 Materials and Supplies 10,650 18,860 18,860 18,860 Other Charges 9,156 17,100 17,100 17,140
Total 704,788 846,297 758,697 937,703
Office of Emergency ManagementPersonnel Services - 287,691 287,691 270,679 Contracted Services - 32,704 32,704 51,204 Materials and Supplies - 5,500 5,500 7,300 Other Charges - 11,570 11,570 13,870
Total - 337,465 337,465 343,053
Total Public Safety 27,510,008 28,239,969 27,542,369 30,359,247

City of San Marcos | FY20 Adopted Budget
City of San Marcos | Finance
117
General Fund – Expense Detail
Actual Approved Estimated Adopted2017/2018 2018/2019 2018/2019 2019/2020
Public Services Department
Transportation AdministrationPersonnel Services 561,794 596,993 586,993 644,837 Contracted Services 28,800 62,259 62,259 63,043 Materials and Supplies 13,459 20,178 20,178 21,981 Other Charges 122,064 225,146 225,146 240,182
Total 726,117 904,577 894,577 970,043
Traffic ControlPersonnel Services 772,218 755,651 755,651 768,712 Contracted Services 138,115 148,436 98,436 148,436 Materials and Supplies 247,059 199,106 199,106 249,941 Other Charges 9,147 15,734 15,734 15,734
Total 1,166,539 1,118,926 1,068,926 1,182,823
StreetsPersonnel Services 1,329,337 1,416,295 1,316,295 1,414,698 Contracted Services 249,041 202,716 202,716 200,216 Materials and Supplies 1,963,135 1,803,482 1,803,482 1,825,465Other Charges 8,047 8,525 8,525 11,025
Total 3,549,560 3,431,018 3,331,018 3,451,405
Total Public Services Department 5,442,215 5,454,521 5,294,521 5,604,270

City of San Marcos | FY20 Adopted Budget
City of San Marcos | Finance
118
General Fund – Expense Detail
Actual Approved Estimated Adopted2017/2018 2018/2019 2018/2019 2019/2020
Neighborhood Enhancement
Neighborhood ServicesPersonnel Services 713,522 318,442 298,442 473,839 Contracted Services 83,427 66,384 66,384 40,050 Materials and Supplies 72,033 31,436 31,436 43,858 Other Charges 25,234 12,160 12,160 24,860
Total 894,217 428,421 408,421 582,607
Community EnhancementPersonnel Services - 95,979 95,979 156,574 Contracted Services - - - - Materials and Supplies - 24,385 24,385 24,835 Other Charges 498,172 450,720 250,720 420,720
Total 498,172 571,084 371,084 602,129
Environmental HealthPersonnel Services 585,468 737,704 637,704 689,519 Contracted Services 22,251 39,570 39,570 43,810 Materials and Supplies 15,717 56,112 56,112 43,615 Other Charges 2,214 5,265 5,265 19,280
Total 625,649 838,651 738,651 796,224
Animal Services-ControlPersonnel Services 353,688 358,630 358,630 368,801 Contracted Services 29,744 37,550 37,550 37,085 Materials and Supplies 35,803 25,974 25,974 25,277 Other Charges 4,606 8,375 8,375 9,800
Total 423,840 430,529 430,529 440,963
Animal Services- ShelterPersonnel Services 676,259 749,276 749,276 942,697 Contracted Services 91,521 167,603 167,603 204,003 Materials and Supplies 115,082 90,732 90,732 153,012 Other Charges 7,072 10,765 10,765 10,725
Total 889,933 1,018,376 1,018,376 1,310,437
Total Neighborhood Enhancement 3,331,812 3,287,062 2,967,062 3,732,361

City of San Marcos | FY20 Adopted Budget
City of San Marcos | Finance
119
General Fund – Expense Detail
Actual Approved Estimated Adopted2017/2018 2018/2019 2018/2019 2019/2020
General Services
General Services AdminPersonnel Services 627,156 873,811 773,811 254,687 Contracted Services 341 - - - Materials and Supplies 3,794 16,700 16,700 6,200 Other Charges 4,149 3,325 3,325 3,325
Total 635,440 893,836 793,836 264,212
Fleet ServicesPersonnel Services 572,295 629,049 629,049 691,437 Contracted Services 6,539 9,120 9,120 9,295 Materials and Supplies 41,556 368,865 368,865 369,133 Other Charges 7,186 20,462 20,462 29,962
Total 627,577 1,027,495 1,027,495 1,099,827
Facilities & GroundsPersonnel Services - - - 286,991 Contracted Services 826,073 846,503 846,503 1,353,860 Materials and Supplies 93,671 67,566 67,566 51,085 Other Charges - - - -
Total 919,744 914,069 914,069 1,691,936
Total General Services 2,182,761 2,835,401 2,735,401 3,055,975

City of San Marcos | FY20 Adopted Budget
City of San Marcos | Finance
120
General Fund – Expense Detail
Actual Approved Estimated Adopted2017/2018 2018/2019 2018/2019 2019/2020
Parks and Recreation Services
Parks & RecreationPersonnel Services 2,544,521 2,612,643 2,412,643 3,173,761 Contracted Services 451,157 617,243 617,243 628,567 Materials and Supplies 405,313 256,487 256,487 344,894 Other Charges 18,953 28,735 28,735 58,864
Total 3,419,945 3,515,108 3,315,108 4,206,087
Activity CenterPersonnel Services 698,446 805,423 755,423 842,964 Contracted Services 95,978 133,200 133,200 108,200 Materials and Supplies 35,605 60,540 60,540 60,540 Other Charges - 3,500 3,500 3,500
Total 830,029 1,002,663 952,663 1,015,204
Outdoor PoolPersonnel Services 63,276 104,387 104,387 106,776 Contracted Services 10,400 - - - Materials and Supplies 31,826 39,000 39,000 39,000
Total 105,503 143,387 143,387 145,776
Park RangersPersonnel Services 366,046 404,055 404,055 424,971 Contracted Services 8,144 7,833 7,833 10,459 Materials and Supplies 46,825 40,017 40,017 47,647 Other Charges 7,901 15,920 15,920 15,920
Total 428,916 467,825 467,825 498,998
Total Parks and Recreation Servcies 4,784,393 5,128,983 4,878,983 5,866,065

City of San Marcos | FY20 Adopted Budget
City of San Marcos | Finance
121
General Fund – Expense Detail
Actual Approved Estimated Adopted2017/2018 2018/2019 2018/2019 2019/2020
Government Services
Social ServicesSocial Services 450,000 500,000 500,000 500,000
Total 450,000 500,000 500,000 500,000
Special ServicesPersonnel Services 1,083 723,125 723,125 404,768 Contracted Services 3,331,696 3,173,133 2,973,133 3,013,048 Materials and Supplies 9,390 5,100 5,100 5,100 Other Charges 2,366,763 2,173,069 2,173,069 2,455,517 Operating Transfers 1,418,405 2,924,172 2,819,172 4,360,093 Eco Development/TIZ Incentives 6,117,307 7,232,883 7,232,883 7,727,220 Other Incentives 207,020 200,000 200,000 200,000 Capital Outlay & Maintenance 2,734,871 2,783,359 2,783,359 3,142,234
Total 16,186,535 19,214,841 18,909,841 21,307,980
Total Government Services 16,636,535 19,714,841 19,409,841 21,807,980
Total General Fund Expenditures 74,579,585 80,659,797 78,467,197 87,913,319
Summary of Expenditures by Services
General Government 10,519,228 12,481,958 12,176,958 14,080,760 Technology Services 8,398,809 9,268,223 9,203,223 10,153,678 Community Development 12,410,360 13,963,681 13,668,681 15,068,460 Public Safety 2,182,761 2,835,401 2,735,401 3,055,975 Neighborhood Enhancement 4,784,393 5,128,983 4,878,983 5,866,065 Public Services 3,331,812 3,287,062 2,967,062 3,732,361 Community Services 27,510,008 28,239,969 27,542,369 30,351,750 General Services 5,442,215 5,454,521 5,294,521 5,604,270
Total General Fund Expenditures 74,579,585 80,659,797 78,467,197 87,913,319

ADMINISTRATIVE SERVICES

City of San Marcos | FY20 Adopted Budget
City of San Marcos | Finance
123
City Manager Office
Expenditures by Category
Positions Full Time Equivalent
Actual Adopted Actual Adopted Actual Adopted Actual AdoptedCity Manager 2017-18 2018-19 2018-19 2019-20 2017-18 2018-19 2018-19 2019-20City Manager 1 1 1 1 1.00 1.00 1.00 1.00Assistant City Manager 1 1 1 1 1.00 1.00 1.00 1.00Assistant City Manager/CFO 1 1 1 1 1.00 1.00 1.00 1.00Chief of Staff 1 1 1 1 1.00 1.00 1.00 1.00Economic/Business Development Manager 0 0 0 1 0.00 0.00 0.00 1.00
Economic Development Projects Coordinator 1 0 1 0 1.00 0.00 1.00 0.00Grant Administrator 0 0 1 1 0.00 0.00 1.00 1.00CMO Executive Assistant, Sr. 1 1 1 1 1.00 1.00 1.00 1.00CMO Executive Assistant 1 1 1 1 1.00 1.00 1.00 1.00Management Assistant 0 0 0 1 0.00 0.00 0.00 1.00
Total 7 6 8 9 7.00 6.00 8.00 9.00
Actual Approved Estimated Adopted2017/2018 2018/2019 2018/2019 2019/2020
City ManagerPersonnel Services 1,187,280 1,152,569 1,152,569 1,439,385 Contracted Services 30,785 15,457 15,457 15,207 Materials and Supplies 9,722 9,180 9,180 10,080 Other Charges 76,800 46,666 46,666 75,058
Total 1,304,587 1,223,872 1,223,872 1,539,730

City of San Marcos | FY20 Adopted Budget
City of San Marcos | Finance
124
DEPARTMENT SUMMARY | CITY MANAGERS OFFICEStrategic Initiative
Mission Statement
Goals Objective Performance Measure FY19 FY20 FY21Track each Strategic Initiatives progress and outcomes
Percent completed
25% 25% 25%Develop dedicated housing and revenue sources that meet the City's goal to buy and/or build affordable homes
Increase in the housing stock percent completed
7 10% 10%Continue Community Partnership meetings with Texas State, SMCISD, and Hays County
Improve or increase the number of community programs
10% 10% 10%Continuing to work with GSMP on Economic Development opportunities
Increase in Partnership Agreements Signed
10% 10% 10%Continue to diversify funding supporting the City’s existing programs and seek all Grant funding opportunities that support both existing programs, new programs and the City’s Strategic Initiatives.
Increase the Number of funders researched and approached, and Increase the Number of proposals submitted
0 50% 50%Oversee construction of new City facilities
Gain Council support of current projects 5 100% 100%
Support Diversified business activity.
Create effective and Council supported LDC
d d1 100% 100%
Develop a cohesive strategy that links the capabilities of the workforce development service providers to the needs of the San Marcos business community.
Improvements to the workforce
0% 50% 75%
The Mission of the City Manager's Office is to build and maintain, through sound management principles and community participation, an effective city government organization for the citizens of San Marcos. The City Manager's Office ensures the effective delivery of services to all citizens, businesses and community partners; implements the policies and programs approve by the City Council in an efficient and effective manner; and provides management direction and support for the planning, implementation and evaluation of all city programs. The Administrative staff provides assistance to the Mayor, City Council and other department, acts as a liaison to citizens, businesses and other agencies.
Oversee the implementation and reporting of the Council adopted Strategic Initiatives
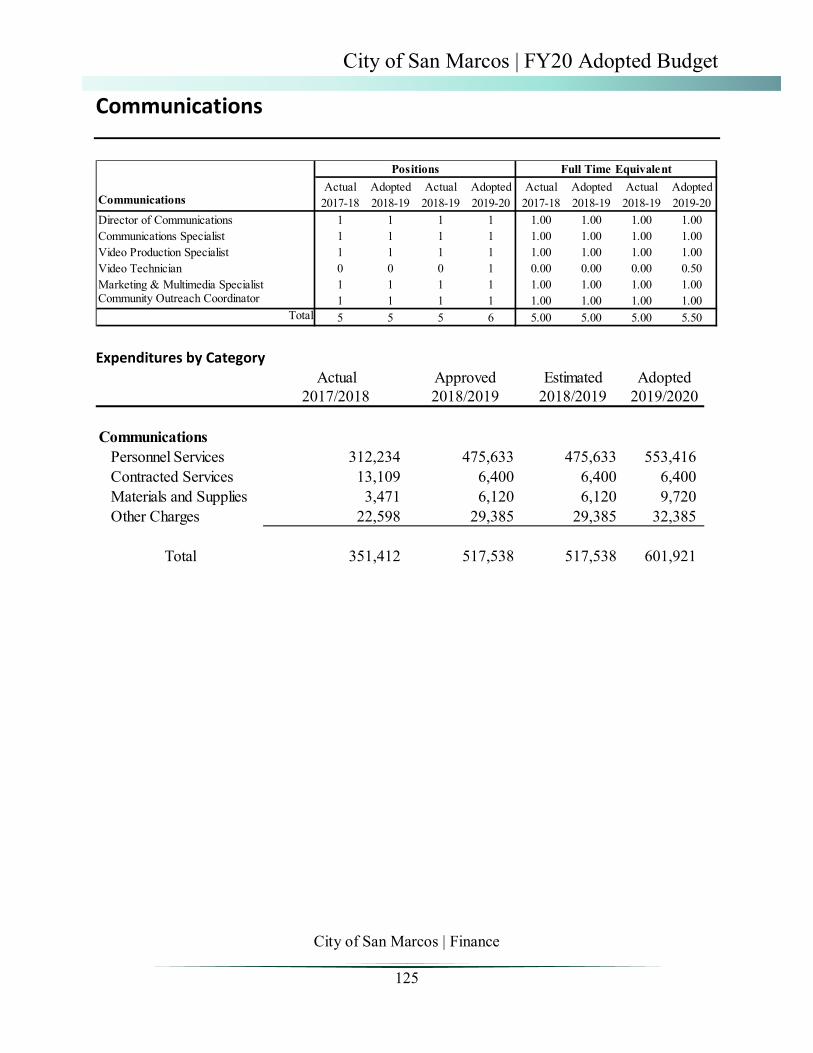
City of San Marcos | FY20 Adopted Budget
City of San Marcos | Finance
125
Communications
Expenditures by Category
Positions Full Time EquivalentActual Adopted Actual Adopted Actual Adopted Actual Adopted
Communications 2017-18 2018-19 2018-19 2019-20 2017-18 2018-19 2018-19 2019-20Director of Communications 1 1 1 1 1.00 1.00 1.00 1.00Communications Specialist 1 1 1 1 1.00 1.00 1.00 1.00Video Production Specialist 1 1 1 1 1.00 1.00 1.00 1.00Video Technician 0 0 0 1 0.00 0.00 0.00 0.50Marketing & Multimedia Specialist 1 1 1 1 1.00 1.00 1.00 1.00Community Outreach Coordinator 1 1 1 1 1.00 1.00 1.00 1.00
Total 5 5 5 6 5.00 5.00 5.00 5.50
Actual Approved Estimated Adopted2017/2018 2018/2019 2018/2019 2019/2020
CommunicationsPersonnel Services 312,234 475,633 475,633 553,416 Contracted Services 13,109 6,400 6,400 6,400 Materials and Supplies 3,471 6,120 6,120 9,720 Other Charges 22,598 29,385 29,385 32,385
Total 351,412 517,538 517,538 601,921

City of San Marcos | FY20 Adopted Budget
City of San Marcos | Finance
126
City Clerk
Expenditures by Category
Positions Full Time EquivalentActual Adopted Actual Adopted Actual Adopted Actual Adopted
City Clerk 2017-18 2018-19 2018-19 2019-20 2017-18 2018-19 2018-19 2019-20City Clerk 1 1 1 1 1.00 1.00 1.00 1.00Deputy City Clerk 1 1 1 1 1.00 1.00 1.00 1.00Records Management Program Manager 1 1 1 1 1.00 1.00 1.00 1.00Deputy Local Registrar 1 1 1 1 1.00 1.00 1.00 1.00Records Specialist 1 1 1 1 0.75 0.75 0.75 0.75Passport Administrator 1 1 1 1 1.00 1.00 1.00 1.00Administrative Assistant 0 1 1 1 0.00 0.50 0.50 0.50
Total 6 7 7 7 5.75 6.25 6.25 6.25
Actual Approved Estimated Adopted2017/2018 2018/2019 2018/2019 2019/2020
City ClerkPersonnel Services 450,686 502,739 502,739 533,178 Contracted Services 55,558 72,079 72,079 92,079 Materials and Supplies 55,086 60,209 60,209 58,209 Other Charges 33,403 40,033 40,033 27,033
Total 594,733 675,059 675,059 710,498

City of San Marcos | FY20 Adopted Budget
City of San Marcos | Finance
127
DEPARTMENT SUMMARY | CITY CLERKStrategic Initiative
Mission Statement
Goals Objective Performance Measure FY19 FY20 FY21Ensure City compliance with Texas State Library & Archives Commission and State Laws
Training record liaisons to maintain and preserve City Records
100% 100% 100%Ensure proper destruction of records and maintain and preserve City records
Yearly Training for record liaisons
N/A 1 1increase applicant numbers
Added Software & Increased Public Outreach 200 250 300
Create User Friendly option to apply for boards
Online entry
0% 50% 75%Passport Services Increase number of
passports processedword of mouth and by continuing to provide exceptional customer 5030 5500 6000
Our mission is to ensure the City's legislative processes are open and public by providing a transparent link between citizens and government. Our office is responsible for the official records and documents of the City, including minutes of the City Council, ordinances and resolutions, deeds and easements, contracts, birth and death records, the computerized indexing of Council actions and board appointments, computerized code, keeps abreast of legislative changes in elections, administers all City elections, and the City's Records Management program, provides support services to the City Council, and responds to request made by the City Manager affecting the daily business operations of the City. We are a technology driven department believing that technology provides much faster and more easily accessible information.
Implement Updated Record Management Policy
Implement New Board and Commission Software to increase applicant numbers
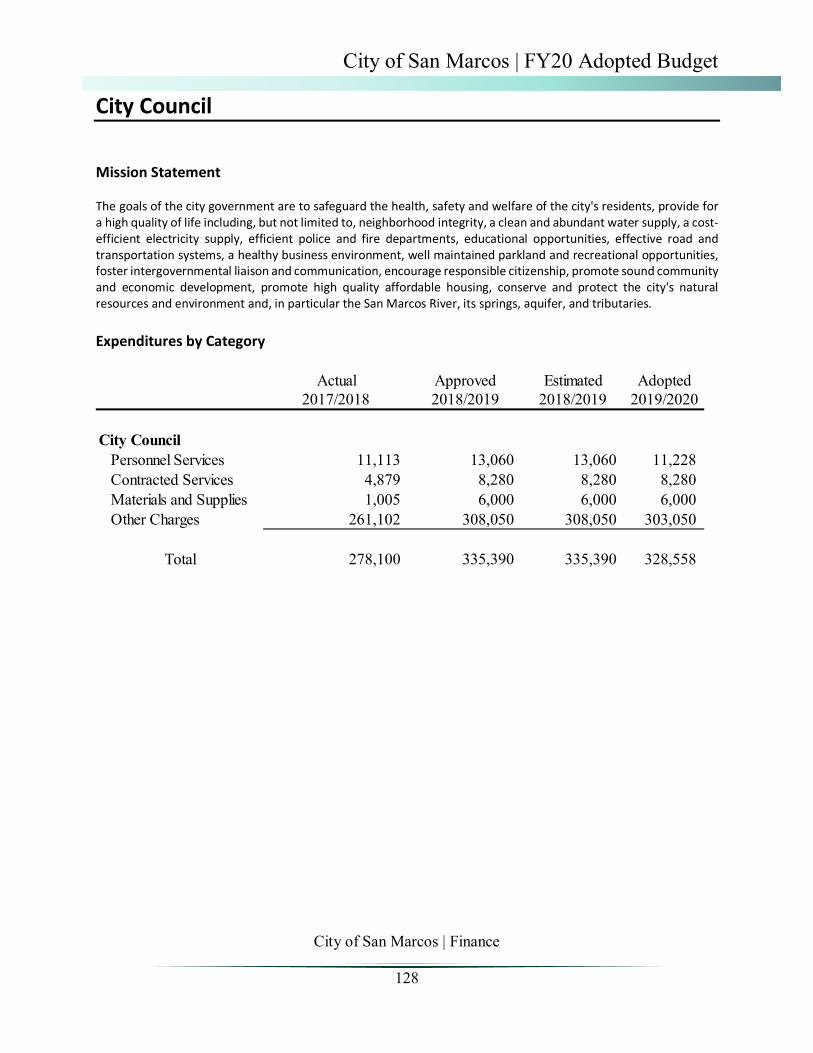
City of San Marcos | FY20 Adopted Budget
City of San Marcos | Finance
128
City Council
Mission Statement The goals of the city government are to safeguard the health, safety and welfare of the city's residents, provide for a high quality of life including, but not limited to, neighborhood integrity, a clean and abundant water supply, a cost-efficient electricity supply, efficient police and fire departments, educational opportunities, effective road and transportation systems, a healthy business environment, well maintained parkland and recreational opportunities, foster intergovernmental liaison and communication, encourage responsible citizenship, promote sound community and economic development, promote high quality affordable housing, conserve and protect the city's natural resources and environment and, in particular the San Marcos River, its springs, aquifer, and tributaries. Expenditures by Category
Actual Approved Estimated Adopted2017/2018 2018/2019 2018/2019 2019/2020
City CouncilPersonnel Services 11,113 13,060 13,060 11,228 Contracted Services 4,879 8,280 8,280 8,280 Materials and Supplies 1,005 6,000 6,000 6,000 Other Charges 261,102 308,050 308,050 303,050
Total 278,100 335,390 335,390 328,558

City of San Marcos | FY20 Adopted Budget
City of San Marcos | Finance
129
Legal
Expenditures by Category
Positions Full Time EquivalentActual Adopted Actual Adopted Actual Adopted Actual Adopted
Legal 2017-18 2018-19 2018-19 2019-20 2017-18 2018-19 2018-19 2019-20City Attorney 1 1 1 1 1.00 1.00 1.00 1.00Assistant City Attorney 2 2 2 3 2.00 2.00 2.00 3.00Contracts Manager 1 1 1 0 1.00 1.00 1.00 0.00Administrative Coordinator 1 1 1 1 1.00 1.00 1.00 1.00Administrative Assistant 1 1 1 1 1.00 1.00 1.00 1.00
Total 6 6 6 6 6.00 6.00 6.00 6.00
Actual Approved Estimated Adopted2017/2018 2018/2019 2018/2019 2019/2020
LegalPersonnel Services 810,641 818,477 818,477 856,664 Contracted Services 71,670 85,039 85,039 85,039 Materials and Supplies 3,536 7,300 7,300 7,300 Other Charges 7,789 11,194 11,194 11,194
Total 893,636 922,010 922,010 960,197

City of San Marcos | FY20 Adopted Budget
City of San Marcos | Finance
130
DEPARTMENT SUMMARY | LEGALStrategic Initiative
Mission Statement
Goals Objective Performance Measure FY19 FY20 FY21written or email communications/legal opinions/interpretations/Public
6400 6500 6600
Real Property/legal documents prepared or reviewed 275 285 295Municipal Court matters 4000 4100 4200attend meetings: City Council, Planning & Zoning Commission, Ethics Review Commission, Historic Preservation Commission, Zoning Board of Adjustments, etc.
82 85 90Ordinances 49 50 55Resolutions 263 260 270
Support the City Council; assist the City Clerk; and support other boards and commissions
The mission of the Legal Department is to provide high quality legal services to facilitate policy making by the City Council and City Manager; to provide legal support to city departments; to ensure the legality of the city's actions; to promote compliance with city regulations, state and federal laws; to represent the city's interests in litigation and legislative matters; and to provide staffing for the Ethics Review Commission, Charter Review Commission, Planning and Zoning Commission, Zoning Board of Adjustments, and Historic Preservation Commission.
Assist City Council, City Administration, and all city departments
by preparing and reviewing materials for council meetings in a timely manner for completion of agendas in accordance with council's expectations; providing legal services and legal advice
in achieving their lawful objectives by providing needed legal services and advice on a timely basis

City of San Marcos | FY20 Adopted Budget
City of San Marcos | Finance
131
Human Resources
Expenditures by Category
Positions Full Time EquivalentActual Adopted Actual Adopted Actual Adopted Actual Adopted
Human Resources 2017-18 2018-19 2018-19 2019-20 2017-18 2018-19 2018-19 2019-20Director of Human Resources 1 1 1 1 1.00 1.00 1.00 1.00Assistant Director of Human Resources 1 1 1 1 1.00 1.00 1.00 1.00Risk Manager/ADA Coordinator 1 1 1 1 1.00 1.00 1.00 1.00Human Resources Manager 1 1 1 1 1.00 1.00 1.00 1.00Benefits Manager 1 1 1 1 1.00 1.00 1.00 1.00Organizational Development Trainer 1 1 1 1 1.00 1.00 1.00 1.00Human Resources Risk/Leave Coordinator 1 1 1 1 1.00 1.00 1.00 1.00Human Resources Specialist 1 1 1 1 1.00 1.00 1.00 1.00Benefits/HR Assistant 1 1 1 1 1.00 1.00 1.00 1.00HR Assistant 1 1 1 1 1.00 1.00 1.00 1.00Customer Services Specialist 1 1 1 1 1.00 1.00 1.00 1.00
Total 11 11 11 11 11.00 11.00 11.00 11.00
Actual Approved Estimated Adopted2017/2018 2018/2019 2018/2019 2019/2020
Human ResourcesPersonnel Services 964,062 1,086,425 1,086,425 1,161,757 Contracted Services 102,820 135,068 135,068 127,718 Materials and Supplies 18,627 17,500 17,500 19,000 Other Charges 35,951 44,346 44,346 36,107
Total 1,121,460 1,283,339 1,283,339 1,344,582

City of San Marcos | FY20 Adopted Budget
City of San Marcos | Finance
132
Finance
Expenditures by Category
Positions Full Time EquivalentActual Adopted Actual Adopted Actual Adopted Actual Adopted
Finance 2017-18 2018-19 2018-19 2019-20 2017-18 2018-19 2018-19 2019-20Director of Finance 1 1 1 1 1.00 1.00 1.00 1.00Assistant Director-Budget 1 1 1 1 1.00 1.00 1.00 1.00Accounting Manager 1 1 1 1 1.00 1.00 1.00 1.00Purchasing Manager 1 1 1 1 1.00 1.00 1.00 1.00Grants Manager 0 0 1 1 0.00 0.00 1.00 1.00Accountant I 1 1 1 1 1.00 1.00 1.00 1.00Accountant II 2 2 1 1 2.00 2.00 1.00 1.00CDBG-DR Accountant 0 1 1 1 0.00 1.00 1.00 1.00Accounting Associate 1 1 1 1 1.00 1.00 1.00 1.00Payroll-AR Specialist 2 2 2 2 2.00 2.00 2.00 2.00Accounting Technician 2 2 2 2 2.00 2.00 2.00 2.00Tyler Munis Application Analyst 1 1 0 0 1.00 1.00 0.00 0.00Construction Contract Specialist 1 1 1 1 1.00 1.00 1.00 1.00Administrative Assistant, Senior 1 1 1 1 1.00 1.00 1.00 1.00Mail Services Coordinator 1 1 1 1 1.00 1.00 1.00 1.00Purchasing Specialist, Senior 2 2 2 2 2.00 2.00 2.00 2.00Contracts Coordinator 1 1 1 1 1.00 1.00 1.00 1.00Procurement Administrator 1 1 1 1 1.00 1.00 1.00 1.00Purchasing Specialist 0 0 0 1 0.00 0.00 0.00 1.00Mail Services Clerk 1 1 1 1 0.55 0.55 0.55 0.55
Total 21 22 21 22 20.55 21.55 20.55 21.55
Actual Approved Estimated Adopted2017/2018 2018/2019 2018/2019 2019/2020
FinancePersonnel Services 1,724,794 1,852,168 1,852,168 1,952,079 Contracted Services 44,757 49,537 49,537 46,240 Materials and Supplies 37,601 34,115 34,115 40,470 Other Charges 57,726 62,680 62,680 60,795
Total 1,864,879 1,998,501 1,998,501 2,099,584

City of San Marcos | FY20 Adopted Budget
City of San Marcos | Finance
133
DEPARTMENT SUMMARY | FINANCEStrategic Initiative
Mission Statement
Goals Objective Performance Measure FY19 FY20 FY21Streamline vendor processing and compliance records
Reduce erros and omissions of required documents 10% 20% 45%
Enter and track all vendor invoicing to reduce data entry
Increase staff productivity 0% 20% 30%
Implement new state legislation on property tax cap
Analyze impact to revenue and establish options for City Manager consideration
Determine options with least impact to operations
10% 85% 100%
The Finance Department will accurately and fairly manage and present the City's financial affairs; protect and advance the City's financial position by maintaining proper internal controls and recommending sound financial policies; and provide quality customer service for San Marcos residents, bond holders and employees.
Roll out vendor sign on to all vendors

City of San Marcos | FY20 Adopted Budget
City of San Marcos | Finance
134
Technology Services
Expenditures by Category
Positions Full Time EquivalentActual Adopted Actual Adopted Actual Adopted Actual Adopted
Technology Services 2017-18 2018-19 2018-19 2019-20 2017-18 2018-19 2018-19 2019-20Director of Information Technology 1 1 1 1 1.00 1.00 1.00 1.00Assistant Director of Information Technology 0 0 1 1 0.00 0.00 1.00 1.00IT Business Services Manager 1 1 1 1 1.00 1.00 1.00 1.00IT Services Delivery Manager 1 1 1 1 1.00 1.00 1.00 1.00Technology Project Manager 1 1 0 0 1.00 1.00 0.00 0.00Network Administrator 0 0 1 1 0.00 0.00 1.00 1.00Delivery Manager 1 1 0 0 1.00 1.00 0.00 0.00Support Analyst, Lead 0 0 1 1 0.00 0.00 1.00 1.00System Administrator 3 3 3 3 3.00 3.00 3.00 3.00Network Administrator 2 2 2 2 2.00 2.00 2.00 2.00Support Analyst 4 4 2 2 4.00 4.00 2.00 2.00Business Systems Analyst 2 2 3 3 2.00 2.00 3.00 3.00IT Application Analyst, Fire 0 0 1 1 0.00 0.00 1.00 1.00Tyler Munis Application Analyst 0 0 1 1 0.00 0.00 1.00 1.00Administrative Assistant, Senior 1 1 1 1 1.00 1.00 1.00 1.00
Total 17 17 19 19 17.00 17.00 19.00 19.00
Actual Approved Estimated Adopted2017/2018 2018/2019 2018/2019 2019/2020
Technology ServicesPersonnel Services 1,483,664 1,719,215 1,719,215 1,936,101 Contracted Services 149,644 195,855 195,855 221,732 Materials and Supplies 19,992 36,728 36,728 26,923 Other Charges 82,594 101,274 101,274 100,659
Total 1,735,894 2,053,072 2,053,072 2,285,416

City of San Marcos | FY20 Adopted Budget
City of San Marcos | Finance
135
DEPARTMENT SUMMARY |INFORMATION TECHNOLOGYStrategic Initiative
Mission Statement
Goals Objective Performance Measure FY19 FY20 FY21Perform disaster recovery failover/recovery exercise - on critical apps
Perform exercise twice a year
1 2 2Operate in a Disaster Recovery scenario
Operate in a DR scenario for 1 week 0 1 1
Recover data from off-line storage and test functionality
Perform data recovery and validate operations once per year
0 0 1Purchase Backup Solutions
Implement software and storage solution, due to end-of-life 0 1 0
Hire a Project Manager Inteview/hire a Project Manager 0 1 0
Povide a solution for IT Project Transparency
Implement technology solution 0 1 0
Work with IT Governance Committee to develop deliveriable
Review solution to make sure it is meeting customer expectations
0 0 1Evaluate current applications that can be migrated over to the current ERP solution
Migrate one software solution to enterpise environment
0 1 1Evaluate staffing needs to support ERP solution
Request additional FTE in budget 0 0 1
Evaluate new technology offered by ERP provider
Evaluate departmental software request against ERP offerings 0 0 1
Our mission is to deliver reliable and sustainable technology services necessary for the support and operations of the City of San Marcos. We are committed to provide cost effective recommendations, implement solutions, and oversee technological resources through teamwork, professionalism, and quality customer service.
Enhance the City's ability to recover information/data from a Cyber Security incident or any mass destruction of data
Implement a IT Project Management Solution that enhances customer experience and IT Project transparency
Reduce the number of overall number off applications by investing and leveraging our existing ERP system.

City of San Marcos | FY20 Adopted Budget
City of San Marcos | Finance
136
GIS
Expenditures by Category
Positions Full Time EquivalentActual Adopted Actual Adopted Actual Adopted Actual Adopted
GIS 2017-18 2018-19 2018-19 2019-20 2017-18 2018-19 2018-19 2019-20GIS Enterprise Manager 1 1 1 1 1.00 1.00 1.00 1.00GIS Analyst 1 1 2 2 1.00 1.00 2.00 2.00GIS Intern 2 2 2 2 0.96 0.96 0.96 0.96
Total 4 4 5 5 2.96 2.96 3.96 3.96
Actual Approved Estimated Adopted2017/2018 2018/2019 2018/2019 2019/2020
GIS DivisionPersonnel Services 219,712 221,843 161,843 243,391 Contracted Services 11,265 15,900 15,900 16,200 Materials and Supplies 8,486 9,150 9,150 9,250 Other Charges 14,645 12,550 7,550 14,350
Total 254,109 259,443 194,443 283,191

City of San Marcos | FY20 Adopted Budget
City of San Marcos | Finance
137
DEPARTMENT SUMMARY | INFORMATION TECHNOLOGY - GISStrategic Initiative
Mission Statement
Goals Objective Performance Measure FY19 FY20 FY21Recruit, Interview and Hire staff
Hire GIS Manager
0 1 0Hire GIS Coordinator 0 1 0Hire GIS Technician 0 1 1Hire GIS Analyst - Eng 0 1 0
GIS Structure Implement GIS Structure that support the entire organization. 0 1 0
Defines level of access Assign appropriate security rights to data and GIS to support the need of the organization to maintain a secure environment. 0 1 0
Open Data Create an environment that support open access to non-Homeland security data 0 0 1
Create an environment that meets the need of the organization
Create multiple environments to production, learning and testing 0 1 0
Implement GIS technology that displays data in an easy to read format
Develop dashboards, storymaps or webapps
0 1 1Maintain GIS environment to the latest release of technology
Update GIS Technology stack as required
0 1 1
GIS Technology Stack
Our mission is to practice responsive, collaborative and innovative approaches to GIS. The City GIS staff will provide geospatial information and applications to city employees and the public in order to enhance city operations, improve decision making, and provide excellent customer service.
Fully staff all open GIS positions within the City
Implement GIS Governance Model

COMMUNITY DEVELOPMENT

City of San Marcos | FY20 Adopted Budget
City of San Marcos | Finance
139
Engineering
Expenditures by Category
Positions Full Time EquivalentActual Adopted Actual Adopted Actual Adopted Actual Adopted
Engineering 2017-18 2018-19 2018-19 2019-20 2017-18 2018-19 2018-19 2019-20
Director of Engineering/Cap Improvements 1 1 1 1 1.00 1.00 1.00 1.00Senior Engineer 5 5 5 5 5.00 5.00 5.00 5.00Senior Engineer CDBG-DR 1 1 1 1 1.00 1.00 1.00 1.00Project Engineer 1 1 1 1 1.00 1.00 1.00 1.00Project Engineer CDBG-DR 1 1 1 1 1.00 1.00 1.00 1.00Watershed Engineer 0 0 0 1 0.00 0.00 0.00 1.00Engineering Technician II 1 1 1 1 1.00 1.00 1.00 1.00Engineering Inspections Manager 1 1 1 1 1.00 1.00 1.00 1.00Engineering Inspector 4 4 4 4 4.00 4.00 4.00 4.00Engineering Inspector-CDBG-DR 1 1 1 1 1.00 1.00 1.00 1.00CIP Program Coordinator 1 1 1 1 1.00 1.00 1.00 1.00GIS Transit Analyst 1 1 0 0 1.00 1.00 0.00 0.00Engineer in Training 3 3 3 3 3.00 3.00 3.00 3.00Administrative Assistant 1 1 1 1 1.00 1.00 1.00 1.00Real Estate Acquisitions Administrator 1 1 1 1 1.00 1.00 1.00 1.00Acquisitions Assistant 0 1 1 1 0.00 1.00 1.00 1.00
Total 23 24 23 24 23.00 24.00 23.00 24.00
Actual Approved Estimated Adopted2017/2018 2018/2019 2018/2019 2019/2020
Engineering DepartmentPersonnel Services 2,202,710 2,017,615 1,967,615 2,246,829 Contracted Services 147,026 130,831 110,831 143,231 Materials and Supplies 46,692 38,697 38,697 47,720 Other Charges 59,421 62,135 62,135 61,830
Total 2,455,848 2,249,278 2,179,278 2,499,610
City of San Marcos | FY20 Adopted Budget
City of San Marcos | Finance
140
DEPARTMENT SUMMARY | ENGINEERING & CIPStrategic Initiative
Mission Statement
Goals Objective Performance Measure FY19 FY20 FY21Provide thorough review of new development for compliance.
Watershed Protection Plans reviewed & approved. 39 49 59
Implement DR projects Project construction completed
0 0 3
Improve City's stormwater system to improve capacity and water quality.
CIP projects initiated or completed that improve storm water management and water quality
12 16 18
Develop standards for construction.
Updates to Downtown Pattern Book 15 5 2
Improve the public infrastructure in downtown
CIP projects initiated or completed in downtown 2 3 2
Participate in planning efforts (regional & local) to include multi-modal initiatives
Number of planning efforts participated
2 3 1
Provide multi-modal transportation improvements.
CIP projects initated or completed that add or improve multi-modal.
8 6 8
Improve multi-modal initiatives to address current and future transportation needs.
The mission of the Engineering and CIP Department is to provide comprehensive engineering and development review, capital project planning and management, and public improvement inspection services to the citizens of San Marcos and other City departments in order to manage the City's infrastructure, ensure public safety and health, protect the environment and improve the community.
Improve flood resiliency in the community and improve water quality.
Improve downtown quality of place.
City of San Marcos | FY20 Adopted Budget
City of San Marcos | Finance
141
Development Services Administration
Expenditures by Category
Positions Full Time EquivalentDevelopment Services Actual Adopted Actual Adopted Actual Adopted Actual AdoptedAdministration 2017-18 2018-19 2018-19 2019-20 2017-18 2018-19 2018-19 2019-20Director of Development Services 1 1 1 1 1.00 1.00 1.00 1.00Asst Director of Development Services 1 1 1 1 1.00 1.00 1.00 1.00
Housing/Community Development Manager 1 1 1 1 1.00 1.00 1.00 1.00CDBG-DR Housing Coordinator 1 1 1 1 1.00 1.00 1.00 1.00CDBG-DR Compliance Specialist 1 1 1 1 1.00 1.00 1.00 1.00Community Initiatives Program Administrator 1 1 1 1 1.00 1.00 1.00 1.00Community Initiatives Coordinator 1 1 1 1 1.00 1.00 1.00 1.00Administrative Coordinator 1 1 1 1 1.00 1.00 1.00 1.00
Total 8 8 8 8 8.00 8.00 8.00 8.00
Actual Approved Estimated Adopted2017/2018 2018/2019 2018/2019 2019/2020
Development Services AdminPersonnel Services 402,151 462,933 462,933 559,588 Contracted Services 39,990 49,935 49,935 50,633 Materials and Supplies 33,654 30,251 30,251 30,251 Other Charges 67,149 82,565 82,565 81,590
Total 542,944 625,684 625,684 722,062

City of San Marcos | FY20 Adopted Budget
City of San Marcos | Finance
142
Planning-Permit Division
Expenditures by Category
Positions Full Time EquivalentDevelopment Services Actual Adopted Actual Adopted Actual Adopted Actual AdoptedPlanning/Permit Center 2017-18 2018-19 2018-19 2019-20 2017-18 2018-19 2018-19 2019-20Planning Manager 1 1 1 1 1.00 1.00 1.00 1.00Permit Manager 1 1 1 1 1.00 1.00 1.00 1.00Development Services Manager 1 1 1 1 1.00 1.00 1.00 1.00Senior Planner 0 1 1 1 0.00 1.00 1.00 1.00Planner 4 4 4 4 4.00 4.00 4.00 4.00GIS Analyst 1 1 1 1 1.00 1.00 1.00 1.00Environmental Program Coordinator 1 1 1 1 1.00 1.00 1.00 1.00Environmental Inspection Specialist 1 1 1 1 1.00 1.00 1.00 1.00Planning Tech I 1 1 1 1 1.00 1.00 1.00 1.00Building Permit Specialist, Senior 1 1 1 1 1.00 1.00 1.00 1.00Building Permit Specialist 2 2 2 2 2.00 2.00 2.00 2.00
Total 14 15 15 15 14.00 15.00 15.00 15.00
Actual Approved Estimated Adopted2017/2018 2018/2019 2018/2019 2019/2020
Planning-Permit DivisionPersonnel Services 1,062,488 1,201,731 1,126,731 1,275,457 Contracted Services 147,852 134,411 134,411 143,339 Materials and Supplies - 9,064 9,064 9,443 Other Charges 4,376 5,635 5,635 5,635
Total 1,214,716 1,350,841 1,275,841 1,433,873

City of San Marcos | FY20 Adopted Budget
City of San Marcos | Finance
143
Inspections
Expenditures by Category
Positions Full Time EquivalentDevelopment Services Actual Adopted Actual Adopted Actual Adopted Actual AdoptedInspections 2017-18 2018-19 2018-19 2019-20 2017-18 2018-19 2018-19 2019-20Chief Building Official 1 1 1 1 1.00 1.00 1.00 1.00Senior Inspector and Plans Examiner 1 1 1 1 1.00 1.00 1.00 1.00Electrical Inspector 0 1 1 1 0.00 1.00 1.00 1.00Combination Inspector 3 3 3 3 3.00 3.00 3.00 3.00
Total 5 6 6 6 5.00 6.00 6.00 6.00
Actual Approved Estimated Adopted2017/2018 2018/2019 2018/2019 2019/2020
Inspections DivisionPersonnel Services 315,400 509,288 459,288 537,226 Contracted Services 8,146 11,115 11,115 11,115 Materials and Supplies 8,900 1,900 1,900 6,900 Other Charges 770 2,000 2,000 2,000
Total 333,215 524,303 474,303 557,241

City of San Marcos | FY20 Adopted Budget
City of San Marcos | Finance
144
DEPARTMENT SUMMARY | PLANNING AND DEVELOPMENT SERVICESStrategic Initiative
Mission Statement
Goals Objective Performance Measure FY19 FY20 FY21Conduct a housing study that analyzes housing supply, housing demand, and housing choice.
Adoption of housing study X
Update the Affordable Housing Policy and adopt a housing framework / blueprint based on the work of the San Marcos Workforce Housing Task Force.
Adoption of housing framework / blueprint
XDevelop internal city capacity and support capacity building efforts in community partners to advance the City's housing goals. Work with local employers such as Texas State University, San Marcos ISD, Hays County, Central Texas Medical Center, the banking community, the Greater San Marcos Partnership and area non-profits to identify and implement housing solutions.
Number of partnership agreements signed
0 1 1Build permanently affordable homes targeted to flood victims on city-owned lots with CDBG-DR funds.
Number of homes completed
3 6 3Utilize HOME funds to rehabilitate and/or reconstruct housing for households earning less than 80% AMI.
Number of applicants assisted
0 4 4Lend CDBG first-time homebuyer funds to households earning less than 80% AMI to purchase housing.
Number of applicants assisted
12 12 12Enter into cooperative agreements with other taxing entities to identify tax-forfeiture properties and make them available for construction of permanently affordable workforce housing.
Number of partnership agreements signed
0 1 1Establish a land bank and community land trust with the purpose of supporting permanently affordable workforce housing.
Program established
XEstablish an Emergency Housing Rehabilitation Program.
Number of applicants assisted 0 4 6
Develop dedicated housing and revenue sources that meet goals.
To properly manage the growth and development of the community by carrying out adopted Council policies, and providing professional expertise in the area of city planning.
To continue our commitment to providing high-quality customer service to the various groups we serve, including builders, developers, landowners, neighborhood groups, city commissions, outside agencies and the citizens of the community.
To enhance the tax base and livability of the community by encouraging high-quality growth and development.
Update, consolidate and communicate housing policies and action plans.

City of San Marcos | FY20 Adopted Budget
City of San Marcos | Finance
145
Library
Expenditures by Category
Positions Full Time EquivalentActual Adopted Actual Adopted Actual Adopted Actual Adopted
Library 2017-18 2018-19 2018-19 2019-20 2017-18 2018-19 2018-19 2019-20Director of Library 1 1 1 1 1.00 1.00 1.00 1.00Library - Division Manager 3 3 3 3 3.00 3.00 3.00 3.00Librarian 4 4 4 5 4.00 4.00 4.00 5.00Circulation Supervisor 1 1 1 1 1.00 1.00 1.00 1.00Library Assistant 5 5 5 5 5.00 5.00 5.00 5.00Library Clerk 7 7 7 7 4.55 4.55 4.55 4.55Library Page 5 5 5 5 2.20 2.20 2.20 2.20
Total 26 26 26 27 20.75 20.75 20.75 21.75
Actual Approved Estimated Adopted2017/2018 2018/2019 2018/2019 2019/2020
LibraryPersonnel Services 1,495,477 1,547,227 1,447,227 1,643,888 Contracted Services 52,826 58,912 58,912 59,794 Materials and Supplies 176,390 174,380 174,380 178,790 Other Charges 21,636 21,244 21,244 23,244
Total 1,746,330 1,801,763 1,701,763 1,905,716
City of San Marcos | FY20 Adopted Budget
City of San Marcos | Finance
146
DEPARTMENT SUMMARY | LIBRARYStrategic Initiative
Mission Statement
Goals Objective Performance Measure FY19 FY20 FY21To minimize the impact of providing library services in a construction zone, our objective is to have at least 31,000 children in attendance at an educational program appropriate for their age and development level.
Attendance at programs would remain the same over the next year and then increase the following summer. Staff will count the number of children at programs. 30,945 31,000 32,000
Staff will present 1,140 programs for children, tweens, and teens. Once the new children's and teen spaces are completed in Spring 2021, we expect to see a sharp increase in attendance.
The library will be undergoing significant inconvenience during construction and we hope to maintain the number of programs we present this year and increase in the following year.
1,135 1,135 1,200School and life success is impacted positively when children read. Over the next three years, the library expects to increase the circulation numbers of the children's and teen materials to 260,000
Library staff will monitor circulation of children's and YA items checked out.
1 75% 100%
The mission of the San Marcos Public Library is to create opportunities for our citizens to explore and expand their interests; to improve their academic, work, and life skills; and to enhance their enjoyment of leisure time through reading and lifelong learning.
Our goal is to inspire children and teens to explore and expand their interests, help them succeed in school, and develop a love of reading by providing them with an abundance of creative programs and access to books, computers, and other learning resources.

City of San Marcos | FY20 Adopted Budget
City of San Marcos | Finance
147
Goals Objective Performance Measure FY19 FY20 FY21Increasingly, historians and genealogists are researching materials online. The Hays County and San Marcos newspapers are mostly available on microfilm, a format that must be used in the library and does not provide an easy-to-use search method. The Library intends to digitize the early Hays County and San Marcos newspapers and make available on the Internet to increase their use, provide an adequate search tool, and preserve the collection.
The microfilm reels will be sent to a service that will convert microfilm to digital content. Once completed, the content will be made available on COSM Library website and staff will market this new service.
70% 100% 100%The genealogy database provided through Texshare is limited in scope. There are better databases available and the library will determine which will best provide an online searching tool for genealogy resources.
Library staff will determine which databases has the best content and negotiate a price that makes it affordable.
0 1 2The library collection contains 269,000 items in print and more online, some items are not readily available to purchase and some customers request items that are old, out of print, and not likely to be of interest to the general public. For this reason, the library will participate in the Interlibrary loan system to borrow obscure items from other library
Library staff will monitor this service and determine which items can be purchases and which must be borrowed. Staff will count the number of items borrowed and sent. This is a statistic that we hope will decrease over time as our collection continues to grow.
303 303 280
Our goal is to preserve our rich local heritage for future generations by serving as a center for the collection, preservation, and use of archival materials related to the San Marcos and Hays County area.

City of San Marcos | FY20 Adopted Budget
City of San Marcos | Finance
148
Goals Objective Performance Measure FY19 FY20 FY21Citizens enjoy coming to the library to read, learn, and connect with others. The library serves many roles in the community. A vibrant library is one that changes to meet the varying needs of the community.
An increase in the number of visitors is a reflection that the library staff is making the right choices about what items to purchase, programs to provide, and has a comfortable place to visit. Staff will continue to monitor the door count on a daily basis and minimize the impact that could be negatively impacted by the construction and then welcome the increase in attendance once the project has been completed.
383,529 384,000 430,000The library collection is well-used because it meets the recreational and educational needs of the community. Library staff with input from our customers are able to provide fun reading materials for all ages. Educational resources are kept up-to-date with enough materials of good quality to meet the needs of the community.
Library staff selects and processes about 5,000 new items per year. A reading public is an educated public. The library will purchase items of interest to the community and increase the circulation of existing and new items.
491,559 492,000 520,000The library provides citizens and visitors with access to the Internet, databases, online newspaper subscriptions, and other computer resources.
The number of people using these resources for free at the library is good for the community and continues to increase. 106,805 107,000 110,000
Our goal is to meet the informational, educational, and recreational needs of our citizens by providing them with convenient access to well-maintained, up-to-date collections of informative and entertaining library materials in a variety of formats.

PUBLIC SAFETY

City of San Marcos | FY20 Adopted Budget
City of San Marcos | Finance
150
Fire Operations
Expenditures by Category
Positions Full Time EquivalentPublic Safety Actual Adopted Actual Adopted Actual Adopted Actual AdoptedFire Operations 2017-18 2018-19 2018-19 2019-20 2017-18 2018-19 2018-19 2019-20Fire Chief 1 1 1 1 1.00 1.00 1.00 1.00Assistant Fire Chief 2 2 2 2 2.00 2.00 2.00 2.00Battalion Chief 5 5 5 5 5.00 5.00 5.00 5.00Fire Marshal 1 1 1 1 1.00 1.00 1.00 1.00Fire Captain 18 18 18 18 18.00 18.00 18.00 18.00Fire Captain-Fire Marshal 2 2 2 2 2.00 2.00 2.00 2.00Fire Engineer 15 18 18 18 15.00 18.00 18.00 18.00Fire Engineer-Fire Marshal 0 1 1 1 0.00 1.00 1.00 1.00Fire Fighter 30 36 36 36 30.00 36.00 36.00 36.00Fire Fighter-Fire Marshal 0 1 1 1 0.00 1.00 1.00 1.00Paramedic Program 0 0 0 1 0.00 0.00 0.00 1.00GIS Analyst 1 1 0 0 1.00 1.00 0.00 0.00Administrative Coordinator 1 1 1 1 1.00 1.00 1.00 1.00Administrative Assistant-Fire Marshal 1 1 1 1 1.00 1.00 1.00 1.00Administrative Assistant 1 1 1 1 1.00 1.00 1.00 1.00
Total 78 89 88 89 78.00 89.00 88.00 89.00
Actual Approved Estimated Adopted2017/2018 2018/2019 2018/2019 2019/2020
Fire OperationsPersonnel Services 8,512,452 9,640,246 9,380,246 10,396,927 Contracted Services 92,460 134,072 134,072 175,293 Materials and Supplies 508,086 362,224 342,224 372,128 Other Charges 155,588 209,167 189,167 203,596
Total 9,268,587 10,345,709 10,045,709 11,147,944

City of San Marcos | FY20 Adopted Budget
City of San Marcos | Finance
151
DEPARTMENT SUMMARY | FIRE OPERATIONSStrategic Initiative
Mission Statement
Goals Objective Performance Measure FY19 FY20 FY21Improved efficiency of fire department personnel when responding to emergencies
Reduction in amount of time to turn-out of the fire station following dispatch notification
2% 2% 2%Improved efficiency of the public-safety-answering-point (call handling, call processing, dispatching)
Reduction in amount of time to answer 911 calls, process call taker information, and dispatch appartus 2% 2% 2%
Increase capacity in Support Services to help spec, order, maintain, and support fire department equipment, appparatus, and tools.
Ensure the dependability and reliability of all emergency related tools, equipment, and appartus by following all manufacturer recommended maintance schedules
Increase support staff capacity to proactivly maintain/repair equipment 10% 20% 30%
Have a GIS/Data Analyst within the fire department to help collect and analyze data, and to make the most efficient use of existing resources.
Maintain accurate district response maps to reduce fire department response times
The reduction of respose times do to data analysis and map accuracy 2% 2% 2%
Conduct annual inspections of at least the 100 highest risk multi-family properties in the COSM.
Number of multi-family properties obtaining 100% compliance with fire code inspections. 100 100 100
Conduct annual inspections of all hotels/motels (32 in COSM) and establishments that serve alcohol with an occupancy load in excess of 100.
Number of inspections completed annually.
45 45 45Conduct risk-based inspections on an annual, 2-year, or 3-year cycle, depending on the hazard classification of a commercial business.
Number of inspections completed annually.
750 750 750
Increase citizen and visitor safety through enhancedfire prevention and education initatives.
Improve response times in under-served areas within the City Limits to improve the likelihood of postive outcomes - people or property
The San Marcos Fire Department is dedicated to providing a well-trained, motivated, and diverse team of professionals who deliver excellence in prevention, educational programs, and emergency response services to our community in a safe, responsible and efficient manner.

City of San Marcos | FY20 Adopted Budget
City of San Marcos | Finance
152
Police Operations
Expenditures by Category
Positions Full Time EquivalentPublic Safety Actual Adopted Actual Adopted Actual Adopted Actual AdoptedPolice Operations 2017-18 2018-19 2018-19 2019-20 2017-18 2018-19 2018-19 2019-20Police Chief 1 1 1 1 1.00 1.00 1.00 1.00Assistant Chief of Police 2 2 2 2 2.00 2.00 2.00 2.00Police Commander 4 4 4 4 4.00 4.00 4.00 4.00Police Sergeant 13 13 13 13 13.00 13.00 13.00 13.00Police Corporal 17 17 17 17 17.00 17.00 17.00 17.00Police Officer 69 71 71 71 69.00 71.00 71.00 71.00Police Officer-Part Time 0 0 0 2 0.00 0.00 0.00 1.00Support Services Division Manager 1 1 1 1 1.00 1.00 1.00 1.00Training/Compliance Coordinator 0 0 0 1 0.00 0.00 0.00 1.00911 Communications Manager 1 1 1 1 1.00 1.00 1.00 1.00Victim Services Coordinator 1 1 1 1 1.00 1.00 1.00 1.00Victim Services Specialist 1 1 1 1 1.00 1.00 1.00 1.00VIPS Coordinator 1 1 1 1 0.50 0.50 0.50 1.00911 Shift Supervisor 4 4 4 4 4.00 4.00 4.00 4.00Crime Scene/Evidence Supervisor 1 1 1 1 1.00 1.00 1.00 1.00Crime Analyst 1 1 1 1 1.00 1.00 1.00 1.00Police Records Supervisor 1 1 1 1 1.00 1.00 1.00 1.00CTO-Lead 6 6 6 6 6.00 6.00 6.00 6.00911 Telecommunicator 15 15 15 15 15.00 15.00 15.00 15.00Administrative Assistant, Senior 1 1 1 1 1.00 1.00 1.00 1.00Crime Scene/Evidence Technician 1 1 1 1 1.00 1.00 1.00 1.00Parking Coordinator 1 1 1 1 1.00 1.00 1.00 1.00Administrative Assistant 2 2 2 2 2.00 2.00 2.00 2.00Records Compliance Coordinator 1 1 1 1 1.00 1.00 1.00 1.00Police Records Specialist 3 3 3 3 3.00 3.00 3.00 3.00Parking Technician 4 4 4 4 1.50 1.50 1.90 1.90
Total 152 154 154 157 149.00 151.00 151.40 153.90
Actual Approved Estimated Adopted2017/2018 2018/2019 2018/2019 2019/2020
Police OperationsPersonnel Services 15,761,036 15,128,086 14,878,086 16,293,459 Contracted Services 852,450 792,710 792,710 795,936 Materials and Supplies 800,100 686,913 626,913 672,750 Other Charges 123,048 102,790 102,790 168,402
Total 17,536,633 16,710,498 16,400,498 17,930,547

City of San Marcos | FY20 Adopted Budget
City of San Marcos | Finance
153
DEPARTMENT SUMMARY | POLICE OPERATIONSStrategic Initiative
Mission Statement
Goals Objective Performance Measure FY19 FY20 FY21Increase evidence disposals by 30% by end of FY 2021
Items of evidence disposed annually
2,059 2,368 2,723
Increase available contact hours between sworn staff and evidence/property section
Available hours for evidence personnel
40 50 50
Achieve 40-hour coverage of reception position in front lobby
Volunteer hours 20 30 40
Increase volunteer hours by 30%
Functions performed by volunteers
4604 5985 7781
Earning and maintaining ACE Accreditation for Police through IAECD for San Marcos 911
In order to reach ACE Accreditation standards in all disciplines, we must maintain 93% compliancy of all graded calls
87% 93% 94%
Earning and maintaining ACE Accreditation for Fire through IAECD for San Marcos 911
In order to reach ACE Accreditation standards in all disciplines, we must maintain 93% compliancy of all graded calls
88% 93% 94%
Earning and maintaining ACE Accreditation for EMS through IAECD for San Marcos 911
In order to reach ACE Accreditation standards in all disciplines, we must maintain 93% compliancy of all graded calls
90% 93% 94%
The Police Department is committed to improving the quality of l ife in San Marcos for all of our citizens and to ensuring that the city remains a safe place to l ive and to visit. We provide 24/7 emergency dispatch for police, fire and EMS within the city. Our operations include patrol, criminal investigations, narcotics, traffic enforcement, downtown foot patrol, mall foot/bike unit, canine, mental health, and school resource officers. These functions are supported by our evidence unit, records, community services, parking unit, and volunteers.
Maximize the service delivery potential of sworn personnel through the optimal deployment of volunteer and non-sworn support staff.
Increase standard of care for citizens and first responders by earning ACE Accreditation through IAECD for San Marcos 911.

City of San Marcos | FY20 Adopted Budget
City of San Marcos | Finance
154
Goals Objective Performance Measure FY19 FY20 FY21Consider implementation of swing shift to optimize staffing levels during peak times
Add a swing shift with 2 seargeants and 4 officers
0 0 6
Review response practices of large number of officers responding to certain calls to identify efficiencies
Increase number of cases successfully closed by either patrol investigative practices or criminal investigations investigative practices by 10%
180 198 217
Optimize patrol coverage during peak hours identified during FY19 patrol staffing study to better address higher priority calls.
City of San Marcos | FY20 Adopted Budget
City of San Marcos | Finance
155
Municipal Court
Expenditures by Category
Positions Full Time EquivalentActual Adopted Actual Adopted Actual Adopted Actual Adopted
Municipal Court 2017-18 2018-19 2018-19 2019-20 2017-18 2018-19 2018-19 2019-20Municipal Court Judge 1 0 1 1 0.48 0.00 0.75 0.75Alternate Municipal Court Judge 1 1 1 1 0.01 0.01 0.25 0.25Municipal Court Administrator 1 1 1 1 1.00 1.00 1.00 1.00Chief Deputy Court Clerk 1 1 1 1 1.00 1.00 1.00 1.00Deputy Marshal 3 3 3 3 1.43 1.43 1.43 1.43Deputy Court Clerk 6 6 6 6 6.00 6.00 6.00 6.00Juvenile Case Coordinator 1 1 1 1 1.00 1.00 1.00 1.00
Total 14 13 14 14 10.91 10.43 11.43 11.43
Actual Approved Estimated Adopted2017/2018 2018/2019 2018/2019 2019/2020
Municipal CourtPersonnel Services 573,768 646,534 646,534 829,100 Contracted Services 111,214 163,803 76,203 72,603 Materials and Supplies 10,650 18,860 18,860 18,860 Other Charges 9,156 17,100 17,100 17,140
Total 704,788 846,297 758,697 937,703

City of San Marcos | FY20 Adopted Budget
City of San Marcos | Finance
156
DEPARTMENT SUMMARY | MUNICIPAL COURTStrategic Initiative
Mission Statement
Goals Objective Performance Measure FY19 FY20 FY21
Assist TSU with procuring ticket writer software
interlocal FY 19 implemetation FY 19 review\expand FY 20
10 units
add 5 units
Assist park rangers with ticket writer software
implemetation FY 19 review\expand FY 20 10
unitsadd 4 units
Assist code enforcement, animal control anf fire marshal with ticket writer software
implemetation FY 19 review\expand FY 20
8 unitsadd 3 units
Schedule programs at primary schools
2 programs annually 2 units 2units 2unitsSchedule programs at High school
3 programs annually2 units 3 units 3 units
Schedule programs with youth organizations
1 program annually
1 unit 1 unitImplement computer programing to identify all eligible cases
program court software by January 2020
update softwareReview and close eligible cases per requirments
process case closures by year closing 3-4 years annually until current close 2
yearsclose 3 years
close 3 years
Pursuant to 103.0081 of the texas Code of Criminal Procedure the court will address cases older than 10 years in the court files, reducing volume of uncollectable cases.
The mission of the San Marcos Municipal Court of Record is to serve the community through the promotion of justice by providing an impartial forum for the resolution of all cases brought before the court in a manner such that legal rights of individuals are safegarded and the public interest is protected.
Assist with procurement of ticket writer software for all groups filing with the San Marcos Municipal Court. Faster processing of the ctation will allow for a more timely resolution for defendants.
Engage in juvenile justice community outreach programs to educate juveniles and community at large regarding juvenile justice.

City of San Marcos | FY20 Adopted Budget
City of San Marcos | Finance
157
Office of Emergency Management
Expenditures by Category
Positions Full Time EquivalentPublic Safety Actual Adopted Actual Adopted Actual Adopted Actual AdoptedOffice of Emergency Management 2017-18 2018-19 2018-19 2019-20 2017-18 2018-19 2018-19 2019-20Emergency Management Coordinator 0 1 1 1 0.00 1.00 1.00 1.00
Assistant Emergency Mgmt Coordinator 0 1 1 1 0.00 1.00 1.00 1.00Emergency Mgmt Specialist 0 1 1 1 0.00 1.00 1.00 1.00
Total 0 3 3 3 0.00 3.00 3.00 3.00
Actual Approved Estimated Adopted2017/2018 2018/2019 2018/2019 2019/2020
Office of Emergency ManagementPersonnel Services - 287,691 287,691 270,679 Contracted Services - 32,704 32,704 51,204 Materials and Supplies - 5,500 5,500 7,300 Other Charges - 11,570 11,570 13,870
Total - 337,465 337,465 343,053

City of San Marcos | FY20 Adopted Budget
City of San Marcos | Finance
158
DEPARTMENT SUMMARY | OFFICE OF EMERGENCY MANAGEMENTStrategic Initiative
Mission Statement
Goals Objective Performance Measure FY19 FY20 FY21
Education and outreach
Create new outreach opportunities to prepare the community 20% 25% 30%
Emergency notification systems
Increase capabilities for emergency notification systems of staff and citizens 2 3 4
Train and exercise the 'whole community' for emergency response
Events for staff, community partners, and suppliers 2 3 3
Our mission is to build, sustain and improve the capability of the citizens to prepare for, protect against, respond to, recover from and mitigate natural and man-made disasters.
Prepare citizens and staff for emergencies to reduce risk of loss to life and property caused by disasters

NEIGHBORHOOD ENHANCEMENT

City of San Marcos | FY20 Adopted Budget
City of San Marcos | Finance
160
Neighborhood Services
Expenditures by Category
Community Enhancement
Expenditures by Category
Positions Full Time EquivalentNeighborhood Enhancement Actual Adopted Actual Adopted Actual Adopted Actual AdoptedNeighborhood Services 2017-18 2018-19 2018-19 2019-20 2017-18 2018-19 2018-19 2019-20
Director of Neighborhood Enhancement 1 1 1 1 0.75 0.75 0.75 0.75Assistant Director, WIC 0 0 0 1 0.25 0.25 0.50 0.50Emergency Operations Coordinator 1 0 0 0 1.00 0.00 0.00 0.00Assistant Emergency Operations Coordinator 1 0 0 0 1.00 0.00 0.00 0.00Community Liaison 1 1 1 1 0.48 0.48 0.48 0.48Emergency Operations Specialist 1 0 0 0 1.00 0.00 0.00 0.00Community Coordinator 1 1 1 1 1.00 1.00 1.00 1.00Administrative Coordinator 1 1 1 1 1.00 1.00 1.00 1.00
Total 7 4 4 5 6.48 3.48 3.73 3.73
Actual Approved Estimated Adopted2017/2018 2018/2019 2018/2019 2019/2020
Neighborhood ServicesPersonnel Services 713,522 318,442 298,442 473,839 Contracted Services 83,427 66,384 66,384 40,050 Materials and Supplies 72,033 31,436 31,436 43,858 Other Charges 25,234 12,160 12,160 24,860
Total 894,217 428,421 408,421 582,607
Positions Full Time EquivalentNeighborhood Enhancement Actual Adopted Actual Adopted Actual Adopted Actual AdoptedCommunity Enhancement 2017-18 2018-19 2018-19 2019-20 2017-18 2018-19 2018-19 2019-20Community Enhancement Technician 0 2 2 2 0.00 1.25 1.25 1.25Code Compliance Officer 0 2 2 2 0.00 2.00 2.00 2.00
Total 0 4 4 4 0.00 3.25 3.25 3.25

City of San Marcos | FY20 Adopted Budget
City of San Marcos | Finance
161
Actual Approved Estimated Adopted2017/2018 2018/2019 2018/2019 2019/2020
Community EnhancementPersonnel Services - 95,979 95,979 156,574 Contracted Services - - - - Materials and Supplies - 24,385 24,385 24,835 Other Charges 498,172 450,720 250,720 420,720
Total 498,172 571,084 371,084 602,129
DEPARTMENT SUMMARY | COMMUNITY ENHANCEMENTStrategic Initiative
Mission Statement
Goals Objective Performance Measure FY19 FY20 FY21Pilot Temporary Horticulturalist
Hire Temporary Horticulturalist 0 1 0Evaluate garden beds 0 75% 0%Maintain garden beds 0% 75% 0%
Permanent Horticulturalist
Switch From temporary to permanent position 0 0 1
Evaluate garden beds 0 0 100%
Maintain garden beds 0% 0% 100%Randomly select 3 neighborhoods 50% 100% 0%Fund projects scored and approved by Neighborhood Commission 100% 0%
Vet applications received 50% 100%Fund projects scored and approved by Neighborhood Commission 50% 100%
Strengthen the appearance of San Marcos through increased litter pickup and beautification projects. This will include recurring and one-time projects focusing on IH-35 and major corridors, downtown, neighborhoods and parks.
Fund three (3) Neighborhood Vitality Grants in public right of way to improve neighborhoods
Fund, document and promote projects
completed through this pilot program
Develop and launch application and
website for neighborhoods to
apply for funds
garden beds for plant and soil health utilizing a temporary HorticulturalistMaintain all public garden beds for plant and soil health utilizing a permanent staff Horticulturalist

City of San Marcos | FY20 Adopted Budget
City of San Marcos | Finance
162
Code Compliance
Expenditures by Category
Positions Full Time EquivalentNeighborhood Enhancement Actual Adopted Actual Adopted Actual Adopted Actual AdoptedCode Compliance 2017-18 2018-19 2018-19 2019-20 2017-18 2018-19 2018-19 2019-20Code Compliance Manager 1 1 1 1 1.00 1.00 1.00 1.00Chief Sanitarian 1 1 1 1 1.00 1.00 1.00 1.00Sanitarian 2 2 2 2 2.00 2.00 2.00 2.00Code Compliance Officer 3 3 3 3 3.00 3.00 3.00 3.00FOG Enforcement Officer 0 1 1 1 0.00 1.00 1.00 1.00
Total 7 8 8 8 7.00 8.00 8.00 8.00
Actual Approved Estimated Adopted2017/2018 2018/2019 2018/2019 2019/2020
Code Compliance/Environmental HealthPersonnel Services 585,468 737,704 637,704 689,519 Contracted Services 22,251 39,570 39,570 43,810 Materials and Supplies 15,717 56,112 56,112 43,615 Other Charges 2,214 5,265 5,265 19,280
Total 625,649 838,651 738,651 796,224

City of San Marcos | FY20 Adopted Budget
City of San Marcos | Finance
163
DEPARTMENT SUMMARY - CODE COMPLIANCEStrategic Initiative
Mission Statement
Goals Objective Performance Measure FY19 FY20 FY21Rewrite and revise the nuisance ordinance
Streamline and clarify ordinances to meet the health and safety needs of the City
Complete the ordinance rewrite and monitor outcomes
60% 100% 100%Rewrite the unsafe structures program
Rewrite policies/procedures and transition the unsafe structure program from PADS to Code Compliance
Complete unsafe structure policies/procedures and monitor outcomes 25% 100% 100%
DEPARTMENT SUMMARY - ENVIRONMENTAL HEALTHStrategic Initiative
Mission Statement
Goals Objective Performance Measure FY19 FY20 FY21Ensure that all food safety requirements have been met and that inspections are up-to-date.
Number of routine inspections conducted.
395 402 410
Assign foodborne illness risk factors to all fixed food establishments and adjust inspection frequencies to maximize food safety in the interest of public health.
Assign risk level to all and focus education and inspections accordingly.
395 402 410
Increase the level of voluntary compliance
To provide our citizens with the highest quality of service and to uphold and ensure compliance of codes and standards established to protect the pubic health, safety, and welfare of all residents, business owners, and visitors. Courtesy and professionalism will serve as guiding principles which will permeate the character of Code Compliance thereby ensuring that our priority is to help solve community problems through creative and effective compliance.
Identify specific needs of our citizens and provide them with guidance and resources to gain compliance
Increase Compliance Rate
90% 95% 97%
Environmental Health provides education, enforcement, and develops resources in response to a wide range of issues which affect the environment, health, safety, and general well-being of our community.
Ensure unified health code compliance.
Provide education and outreach to mobile food units.
Conduct education and adequate monitoring of food establishments to verify compliance with food safety requirements.
Notify all mobile food units on the new food ordinance requirements.
50 56 61

City of San Marcos | FY20 Adopted Budget
City of San Marcos | Finance
164
Animal Services
DEPARTMENT SUMMARY | ANIMAL SERVICESStrategic Initiative
Mission Statement
Goals Objective Performance Measure FY19 FY20 FY21Complete procurement process
RFP, evalution, selection, Council approval, contract 10% 90% 100%
Train staff and implement the system
Begin training and implementation by April 2020 0% 90% 100%
Apply for Service Enterprise through Points of Light Foundation
Accepted into the program and completed the assessment
100% 100% 100%Participate in all training and complete assignments
Keep pace with the program's requirements
10% 70% 100%Obtain final Service Enterprise certificaiton
Certificate obtained0% 0% 100%
Develop policies and procedures
Policies and procedures developed and implemented 20% 100% 100%
Train and engage volunteer fosters
Increase in number of active fosters each year 20% 75% 100%
Adequate vet services Availability of vet services in alignment with fosters 20% 75% 100%
Expand the foster program to be an integral piece of the lifesaving equation
To care for, protect, and find quality homes for abandoned and neflected animals, aid in the reduction of pet overpopulation, and provide community education for the mutual benefit of animals and people.
Obtain Service Enterprise designation by integrating volunteers into all levels of operations and ensuring the sustainability and success of our volunteer program
Procure and implement a software system to automate shelter management & animal care, providing valuable data for strategy

City of San Marcos | FY20 Adopted Budget
City of San Marcos | Finance
165
Animal Services-Animal Control
Expenditures by Category
Positions Full Time EquivalentNeighborhood Enhancement Actual Adopted Actual Adopted Actual Adopted Actual AdoptedAnimal Control 2017-18 2018-19 2018-19 2019-20 2017-18 2018-19 2018-19 2019-20Animal Control Officer 4 4 4 4 4.00 4.00 4.00 4.00Animal Control Supervisor 1 1 1 1 1.00 1.00 1.00 1.00
Total 5 5 5 5 5.00 5.00 5.00 5.00
Actual Approved Estimated Adopted2017/2018 2018/2019 2018/2019 2019/2020
Animal Services-ControlPersonnel Services 353,688 358,630 358,630 368,801 Contracted Services 29,744 37,550 37,550 37,085 Materials and Supplies 35,803 25,974 25,974 25,277 Other Charges 4,606 8,375 8,375 9,800
Total 423,840 430,529 430,529 440,963

City of San Marcos | FY20 Adopted Budget
City of San Marcos | Finance
166
Animal Services-Animal Shelter
Expenditures by Category
Positions Full Time EquivalentNeighborhood Enhancement Actual Adopted Actual Adopted Actual Adopted Actual AdoptedAnimal Shelter 2017-18 2018-19 2018-19 2019-20 2017-18 2018-19 2018-19 2019-20Animal Services Manager 1 1 1 1 1.00 1.00 1.00 1.00Animal Shelter Supervisor 1 1 1 1 1.00 1.00 1.00 1.00Administrative Assistant 1 1 1 1 1.00 1.00 1.00 1.00Adoption Counselor 0 0 0 1 0.00 0.00 0.00 1.00Volunteer/Events Coordinator 0 1 1 1 0.00 1.00 1.00 1.00Animal Services Clerk/Dispatch 2 2 2 2 2.00 2.00 2.00 2.00Veterinary Technician 1 2 2 2 1.00 2.00 2.00 2.00Animal Shelter Technician, Lead 3 3 4 4 3.00 3.00 4.00 4.00Animal Shelter Technician 5 5 4 5 2.00 2.55 2.55 3.00
Total 14 16 16 18 11.00 13.55 14.55 16.00
Actual Approved Estimated Adopted2017/2018 2018/2019 2018/2019 2019/2020
Animal Services- ShelterPersonnel Services 676,259 749,276 749,276 942,697 Contracted Services 91,521 167,603 167,603 204,003 Materials and Supplies 115,082 90,732 90,732 153,012 Other Charges 7,072 10,765 10,765 10,725
Total 889,933 1,018,376 1,018,376 1,310,437

GENERAL SERVICES

City of San Marcos | FY20 Adopted Budget
City of San Marcos | Finance
168
General Services Administration
Expenditures by Category
Fleet Services
Expenditures by Category
Positions Full Time EquivalentGeneral Services Actual Adopted Actual Adopted Actual Adopted Actual AdoptedAdministration 2017-18 2018-19 2018-19 2019-20 2017-18 2018-19 2018-19 2019-20
Executive Director of Community Services 1 1 1 0 1.00 1.00 1.00 0.00Director of General Services 0 0 0 1 0.00 0.00 0.00 0.67Asst Director - Fleet, Transit, Resource Recovery 1 1 1 0 0.67 0.67 0.67 0.00Assistant Director 1 1 1 0 1.00 1.00 1.00 0.00Community Services Operations Manager 1 1 1 1 1.00 1.00 1.00 1.00Administrive Coordinator 0 0 0 1 0.00 0.00 0.00 1.00Administrative Assistant 1 1 1 1 1.00 1.00 1.00 1.00
Total 5.00 5.00 5.00 4.00 4.67 4.67 4.67 3.67
Actual Approved Estimated Adopted2017/2018 2018/2019 2018/2019 2019/2020
General Services AdminPersonnel Services 627,156 873,811 773,811 254,687 Contracted Services 341 - - - Materials and Supplies 3,794 16,700 16,700 6,200 Other Charges 4,149 3,325 3,325 3,325
Total 635,440 893,836 793,836 264,212
Positions Full Time EquivalentGeneral Services Actual Adopted Actual Adopted Actual Adopted Actual AdoptedFleet Services 2017-18 2018-19 2018-19 2019-20 2017-18 2018-19 2018-19 2019-20Fleet Services Supervisor 1 1 1 1 1.00 1.00 1.00 1.00Master Fleet Service Technician, Lead 2 2 2 2 2.00 2.00 2.00 2.00Master Fleet Service Technician 3 3 3 3 3.00 3.00 3.00 3.00Emergency Vehicle Technician 0 1 1 1 0.00 1.00 1.00 1.00Fleet Inventory Technician 1 1 1 1 1.00 1.00 1.00 1.00Fleet Services Specialist 1 1 1 1 1.00 1.00 1.00 1.00
Total 8 9 9 9 8.00 9.00 9.00 9.00
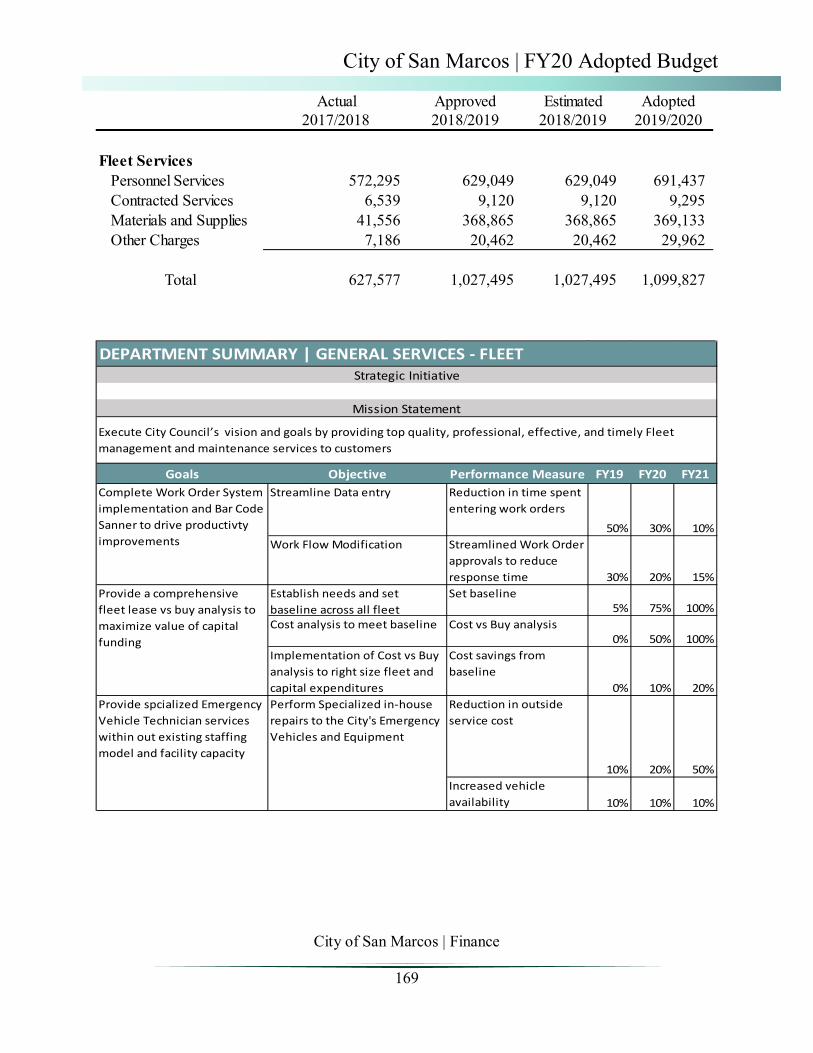
City of San Marcos | FY20 Adopted Budget
City of San Marcos | Finance
169
Actual Approved Estimated Adopted2017/2018 2018/2019 2018/2019 2019/2020
Fleet ServicesPersonnel Services 572,295 629,049 629,049 691,437 Contracted Services 6,539 9,120 9,120 9,295 Materials and Supplies 41,556 368,865 368,865 369,133 Other Charges 7,186 20,462 20,462 29,962
Total 627,577 1,027,495 1,027,495 1,099,827
DEPARTMENT SUMMARY | GENERAL SERVICES - FLEETStrategic Initiative
Mission Statement
Goals Objective Performance Measure FY19 FY20 FY21Streamline Data entry Reduction in time spent
entering work orders
50% 30% 10%Work Flow Modification Streamlined Work Order
approvals to reduce response time 30% 20% 15%
Establish needs and set baseline across all fleet
Set baseline5% 75% 100%
Cost analysis to meet baseline Cost vs Buy analysis0% 50% 100%
Implementation of Cost vs Buy analysis to right size fleet and capital expenditures
Cost savings from baseline
0% 10% 20%Reduction in outside service cost
10% 20% 50%Increased vehicle availability 10% 10% 10%
Execute City Council’s vision and goals by providing top quality, professional, effective, and timely Fleet management and maintenance services to customers
Complete Work Order System implementation and Bar Code Sanner to drive productivty improvements
Provide a comprehensive fleet lease vs buy analysis to maximize value of capital funding
Perform Specialized in-house repairs to the City's Emergency Vehicles and Equipment
Provide spcialized Emergency Vehicle Technician services within out existing staffing model and facility capacity

City of San Marcos | FY20 Adopted Budget
City of San Marcos | Finance
170
Facilities and Grounds
Expenditures by Category
Positions Full Time EquivalentGeneral Services Actual Adopted Actual Adopted Actual Adopted Actual AdoptedFacilities and Grounds 2017-18 2018-19 2018-19 2019-20 2017-18 2018-19 2018-19 2019-20Construction Manager 1 1 1 1 1.00 1.00 1.00 1.00Construction Technician 1 2 1 3 1.00 2.00 1.00 3.00
Total 2 3 2 4 2.00 3.00 2.00 4.00
Actual Approved Estimated Adopted2017/2018 2018/2019 2018/2019 2019/2020
Facilities & GroundsPersonnel Services - - - 286,991 Contracted Services 826,073 846,503 846,503 1,353,860 Materials and Supplies 93,671 67,566 67,566 51,085 Other Charges - - - -
Total 919,744 914,069 914,069 1,691,936

City of San Marcos | FY20 Adopted Budget
City of San Marcos | Finance
171
DEPARTMENT SUMMARY | GENERAL SERVICES - FACILITIESStrategic Initiative
Mission Statement
Goals Objective Performance Measure FY19 FY20 FY21Provide interim facility space for new staff members while managing under significant fiscal constraints
Reduce the need and time city staff members utilize transitional office space
Reduction of time staff utilizes temporary/transitional office space
10% 10% 10%Determine needs and cost for preventative maintenance of all existing facilities
Establish baseline
10% 85% 100%Establish cost estimates for evolving needs for all existing facilities
Measure actual spend to baseline
0% 15% 75%Provide cost projections for the construction of new projects
Re-evaluate unmet needs and cost estimates to determine funding requirements
15% 15% 85%
Establish funding requirements for facilities core services
Our mission is to provide top quality, professional, effective and timely preventative and general maintenance services to City Facilities

PARKS AND RECREATION
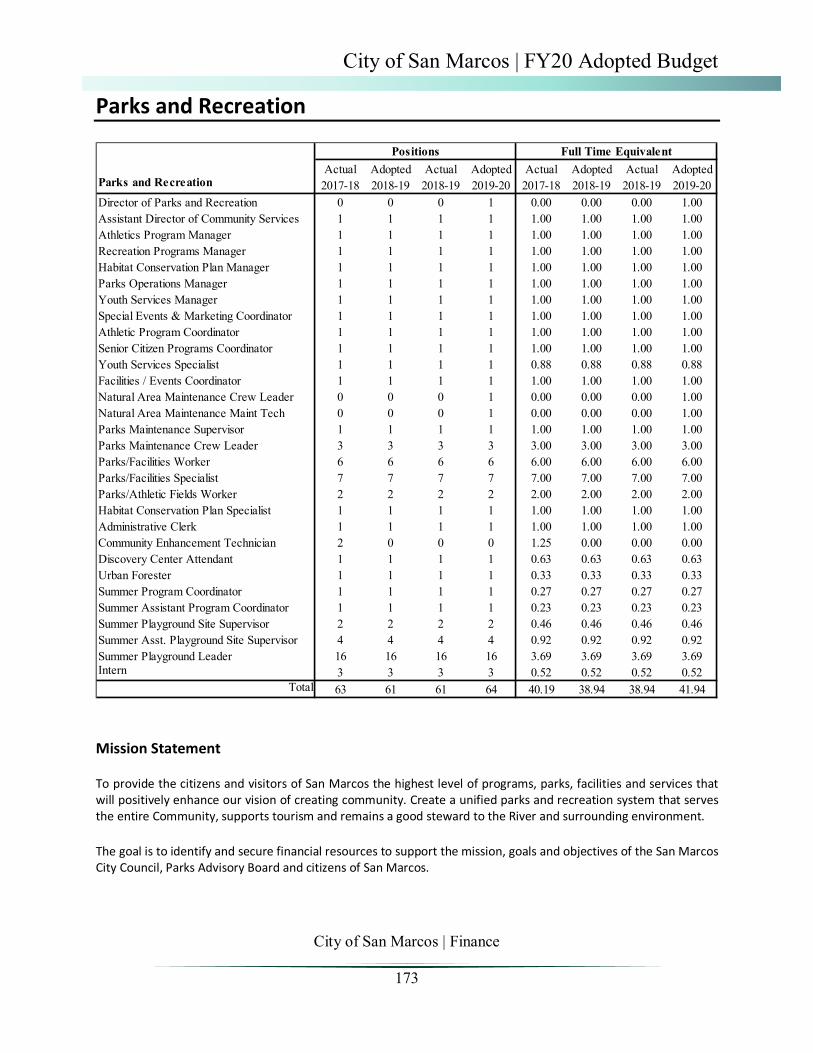
City of San Marcos | FY20 Adopted Budget
City of San Marcos | Finance
173
Parks and Recreation
Mission Statement To provide the citizens and visitors of San Marcos the highest level of programs, parks, facilities and services that will positively enhance our vision of creating community. Create a unified parks and recreation system that serves the entire Community, supports tourism and remains a good steward to the River and surrounding environment. The goal is to identify and secure financial resources to support the mission, goals and objectives of the San Marcos City Council, Parks Advisory Board and citizens of San Marcos.
Positions Full Time EquivalentActual Adopted Actual Adopted Actual Adopted Actual Adopted
Parks and Recreation 2017-18 2018-19 2018-19 2019-20 2017-18 2018-19 2018-19 2019-20Director of Parks and Recreation 0 0 0 1 0.00 0.00 0.00 1.00Assistant Director of Community Services 1 1 1 1 1.00 1.00 1.00 1.00Athletics Program Manager 1 1 1 1 1.00 1.00 1.00 1.00Recreation Programs Manager 1 1 1 1 1.00 1.00 1.00 1.00Habitat Conservation Plan Manager 1 1 1 1 1.00 1.00 1.00 1.00Parks Operations Manager 1 1 1 1 1.00 1.00 1.00 1.00Youth Services Manager 1 1 1 1 1.00 1.00 1.00 1.00Special Events & Marketing Coordinator 1 1 1 1 1.00 1.00 1.00 1.00Athletic Program Coordinator 1 1 1 1 1.00 1.00 1.00 1.00Senior Citizen Programs Coordinator 1 1 1 1 1.00 1.00 1.00 1.00Youth Services Specialist 1 1 1 1 0.88 0.88 0.88 0.88Facilities / Events Coordinator 1 1 1 1 1.00 1.00 1.00 1.00Natural Area Maintenance Crew Leader 0 0 0 1 0.00 0.00 0.00 1.00Natural Area Maintenance Maint Tech 0 0 0 1 0.00 0.00 0.00 1.00Parks Maintenance Supervisor 1 1 1 1 1.00 1.00 1.00 1.00Parks Maintenance Crew Leader 3 3 3 3 3.00 3.00 3.00 3.00Parks/Facilities Worker 6 6 6 6 6.00 6.00 6.00 6.00Parks/Facilities Specialist 7 7 7 7 7.00 7.00 7.00 7.00Parks/Athletic Fields Worker 2 2 2 2 2.00 2.00 2.00 2.00Habitat Conservation Plan Specialist 1 1 1 1 1.00 1.00 1.00 1.00Administrative Clerk 1 1 1 1 1.00 1.00 1.00 1.00Community Enhancement Technician 2 0 0 0 1.25 0.00 0.00 0.00Discovery Center Attendant 1 1 1 1 0.63 0.63 0.63 0.63Urban Forester 1 1 1 1 0.33 0.33 0.33 0.33Summer Program Coordinator 1 1 1 1 0.27 0.27 0.27 0.27Summer Assistant Program Coordinator 1 1 1 1 0.23 0.23 0.23 0.23Summer Playground Site Supervisor 2 2 2 2 0.46 0.46 0.46 0.46Summer Asst. Playground Site Supervisor 4 4 4 4 0.92 0.92 0.92 0.92Summer Playground Leader 16 16 16 16 3.69 3.69 3.69 3.69Intern 3 3 3 3 0.52 0.52 0.52 0.52
Total 63 61 61 64 40.19 38.94 38.94 41.94

City of San Marcos | FY20 Adopted Budget
City of San Marcos | Finance
174
Expenditures by Category
Actual Approved Estimated Adopted2017/2018 2018/2019 2018/2019 2019/2020
Parks & RecreationPersonnel Services 2,544,521 2,612,643 2,412,643 3,173,761 Contracted Services 451,157 617,243 617,243 628,567 Materials and Supplies 405,313 256,487 256,487 344,894 Other Charges 18,953 28,735 28,735 58,864
Total 3,419,945 3,515,108 3,315,108 4,206,087

City of San Marcos | FY20 Adopted Budget
City of San Marcos | Finance
175
Activity Center
Expenditures by Category
Positions Full Time EquivalentParks and Recreation Actual Adopted Actual Adopted Actual Adopted Actual AdoptedActivity Center 2017-18 2018-19 2018-19 2019-20 2017-18 2018-19 2018-19 2019-20Aquatics Program Supervisor 1 1 1 1 1.00 1.00 1.00 1.00Aquatics Fitness Program Coordinator 1 1 1 1 1.00 1.00 1.00 1.00Athletic Program Specialist 2 2 2 2 2.00 2.00 2.00 2.00Activity Center Attendant 6 6 6 6 5.25 5.25 5.25 5.25Lifeguard / Water Safety Instructor 1 1 1 1 0.75 0.75 0.75 0.75Facilities/Maintenance Worker 2 2 2 2 1.75 1.75 1.75 1.75Lifeguard 6 6 6 6 3.00 3.00 3.00 3.00
Total 19 19 19 19 14.75 14.75 14.75 14.75
Actual Approved Estimated Adopted2017/2018 2018/2019 2018/2019 2019/2020
Activity CenterPersonnel Services 698,446 805,423 755,423 842,964 Contracted Services 95,978 133,200 133,200 108,200 Materials and Supplies 35,605 60,540 60,540 60,540 Other Charges - 3,500 3,500 3,500
Total 830,029 1,002,663 952,663 1,015,204

City of San Marcos | FY20 Adopted Budget
City of San Marcos | Finance
176
Outdoor Pool
Expenditures by Category
Park Rangers
Expenditures by Category
Positions Full Time EquivalentParks and Recreation Actual Adopted Actual Adopted Actual Adopted Actual AdoptedOutdoor Pool 2017-18 2018-19 2018-19 2019-20 2017-18 2018-19 2018-19 2019-20Pool Manager 1 1 1 1 0.35 0.35 0.35 0.35Water Safety Instructor 4 4 4 4 0.98 0.98 0.98 0.98Head Lifeguard 4 4 4 4 1.08 1.08 1.08 1.08Lifeguard 7 7 7 7 1.72 1.72 1.72 1.72Cashier / Pool Attendant 2 2 2 2 0.33 0.33 0.33 0.33
Total 18 18 18 18 4.45 4.45 4.45 4.45
Actual Approved Estimated Adopted2017/2018 2018/2019 2018/2019 2019/2020
Outdoor PoolPersonnel Services 63,276 104,387 104,387 106,776 Contracted Services 10,400 - - - Materials and Supplies 31,826 39,000 39,000 39,000
Total 105,503 143,387 143,387 145,776
Positions Full Time EquivalentParks and Recreation Actual Adopted Actual Adopted Actual Adopted Actual AdoptedParks Ranger 2017-18 2018-19 2018-19 2019-20 2017-18 2018-19 2018-19 2019-20Park Ranger Program Manager 1 1 1 1 1.00 1.00 1.00 1.00Park Ranger IV 1 1 1 1 1.00 1.00 1.00 1.00Park Ranger III 4 4 4 4 0.77 0.77 0.77 0.77Park Ranger II 7 7 7 7 1.01 1.01 1.01 1.01Park Ranger I 10 10 10 10 1.24 1.24 1.24 1.24
Total 23 23 23 23 5.02 5.02 5.02 5.02

City of San Marcos | FY20 Adopted Budget
City of San Marcos | Finance
177
Actual Approved Estimated Adopted2017/2018 2018/2019 2018/2019 2019/2020
Park RangersPersonnel Services 366,046 404,055 404,055 424,971 Contracted Services 8,144 7,833 7,833 10,459 Materials and Supplies 46,825 40,017 40,017 47,647 Other Charges 7,901 15,920 15,920 15,920
Total 428,916 467,825 467,825 498,998

PUBLIC SERVICES
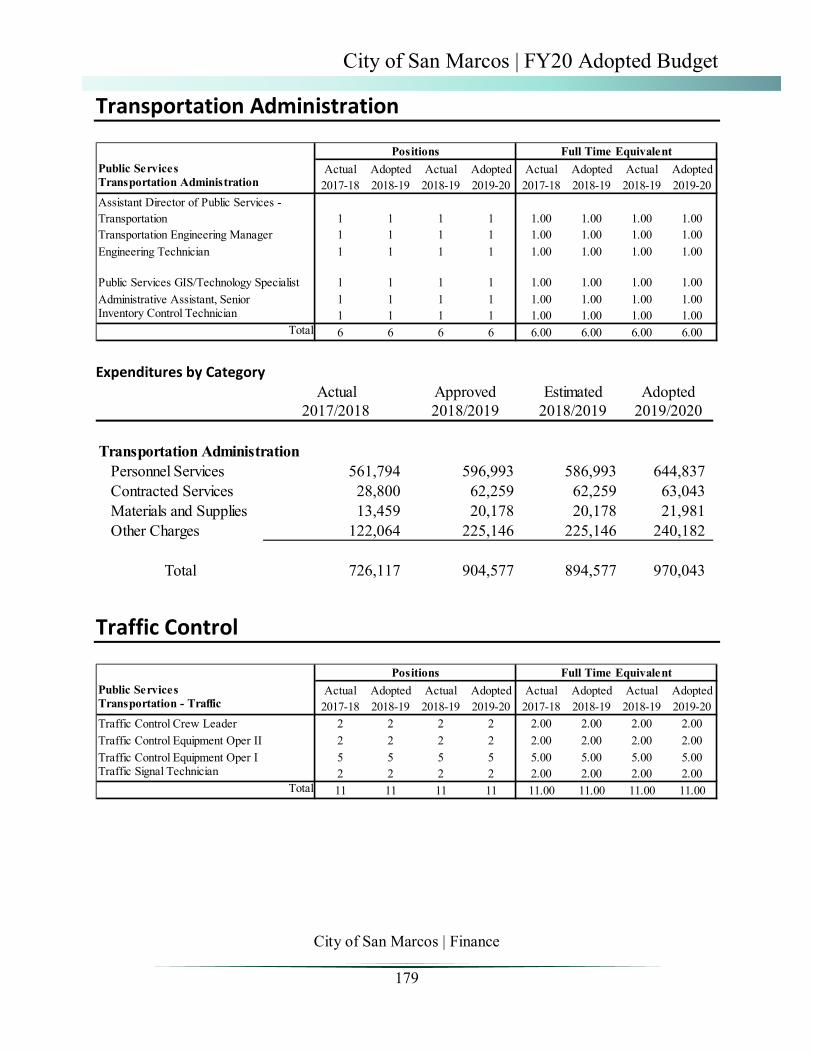
City of San Marcos | FY20 Adopted Budget
City of San Marcos | Finance
179
Transportation Administration
Expenditures by Category
Traffic Control
Positions Full Time EquivalentPublic Services Actual Adopted Actual Adopted Actual Adopted Actual AdoptedTransportation Administration 2017-18 2018-19 2018-19 2019-20 2017-18 2018-19 2018-19 2019-20Assistant Director of Public Services - Transportation 1 1 1 1 1.00 1.00 1.00 1.00Transportation Engineering Manager 1 1 1 1 1.00 1.00 1.00 1.00Engineering Technician 1 1 1 1 1.00 1.00 1.00 1.00
Public Services GIS/Technology Specialist 1 1 1 1 1.00 1.00 1.00 1.00Administrative Assistant, Senior 1 1 1 1 1.00 1.00 1.00 1.00Inventory Control Technician 1 1 1 1 1.00 1.00 1.00 1.00
Total 6 6 6 6 6.00 6.00 6.00 6.00
Actual Approved Estimated Adopted2017/2018 2018/2019 2018/2019 2019/2020
Transportation AdministrationPersonnel Services 561,794 596,993 586,993 644,837 Contracted Services 28,800 62,259 62,259 63,043 Materials and Supplies 13,459 20,178 20,178 21,981 Other Charges 122,064 225,146 225,146 240,182
Total 726,117 904,577 894,577 970,043
Positions Full Time EquivalentPublic Services Actual Adopted Actual Adopted Actual Adopted Actual AdoptedTransportation - Traffic 2017-18 2018-19 2018-19 2019-20 2017-18 2018-19 2018-19 2019-20Traffic Control Crew Leader 2 2 2 2 2.00 2.00 2.00 2.00Traffic Control Equipment Oper II 2 2 2 2 2.00 2.00 2.00 2.00Traffic Control Equipment Oper I 5 5 5 5 5.00 5.00 5.00 5.00Traffic Signal Technician 2 2 2 2 2.00 2.00 2.00 2.00
Total 11 11 11 11 11.00 11.00 11.00 11.00

City of San Marcos | FY20 Adopted Budget
City of San Marcos | Finance
180
Expenditures by Category
Streets
Expenditures by Category
Actual Approved Estimated Adopted2017/2018 2018/2019 2018/2019 2019/2020
Traffic ControlPersonnel Services 772,218 755,651 755,651 768,712 Contracted Services 138,115 148,436 98,436 148,436 Materials and Supplies 247,059 199,106 199,106 249,941 Other Charges 9,147 15,734 15,734 15,734
Total 1,166,539 1,118,926 1,068,926 1,182,823
Positions Full Time EquivalentPublic Services Actual Adopted Actual Adopted Actual Adopted Actual AdoptedTransportation - Streets 2017-18 2018-19 2018-19 2019-20 2017-18 2018-19 2018-19 2019-20
Streets Maintenance Manager 1 1 1 1 1.00 1.00 1.00 1.00
Streets Control Maintenance Crew Leader 4 4 4 4 4.00 4.00 4.00 4.00Street Equipment Operator II 6 6 6 6 6.00 6.00 6.00 6.00Street Equipment Operator I 9 9 9 9 9.00 9.00 9.00 9.00
Total 20 20 20 20 20.00 20.00 20.00 20.00
Actual Approved Estimated Adopted2017/2018 2018/2019 2018/2019 2019/2020
StreetsPersonnel Services 1,329,337 1,416,295 1,316,295 1,414,698 Contracted Services 249,041 202,716 202,716 200,216 Materials and Supplies 1,963,135 1,803,482 1,803,482 1,825,465 Other Charges 8,047 8,525 8,525 11,025
Total 3,549,560 3,431,018 3,331,018 3,451,405

City of San Marcos | FY20 Adopted Budget
City of San Marcos | Finance
181
DEPARTMENT SUMMARY | TRANSPORTATIONStrategic Initiative
Mission Statement
Goals Objective Performance Measure FY19 FY20 FY21 Eliminate sidewalk gaps and sidewalks in poor condition
Install new sidewalk to connect gaps and replace sidewalks in poor condition
9,000 LF 10,000 LF 10,000 LFRemove ADA mobility barriers
Install new ADA ramps or replace existing ADA ramps in poor condition 15 EA 30 EA 30 EA
Conduct and/or update assessment of of existing infrastructure
Conduct or update assessment of of existing infrastructure Annually Annually Annually
Increase and ehnhance bike facilities in existing roadways
Install new or restripe existing bike lanes
5 miles 10 miles 10 milesMaintain street pavement in good condiiton
Prioritize and resurface streets to maximize pavement condition with existing funding level.
12 Lane-Miles
12 Lane-Miles
12 Lane-Miles
Increase and enhance pedestrian safety at street crossings and school zones
Install new or improve existing to ADA-compliant accessible pedestrian crossings 40 EA 40 EA 40 EA
Keep roadways and bike lanes clear of debris
Regularly maintain street sweeping of each city streets 2 sweeps
per street
3 sweeps
per street
3 sweeps
per street
Keep roadways and bike lanes free of drainage ponding or flooding
Regularly clean storm sewers and drainage channels
10,000 LF 10,000 LF 10,000 LF
Improve transportation system safety
The Public Services-Transportation Division is committed to providing high quality, well planned, environmentally responsible, cost effective street, drainage, and traffic infrastructure and services to promote public health, safety, multi-modal transportation, economic growth and community vitality.
Improve pedestrian connectivity and accessibility
Implement Complete Street policy and principles

GOVERNMENT SERVICES

City of San Marcos | FY20 Adopted Budget
City of San Marcos | Finance
183
Social Services Department Organization The Social Services Division is used to account for social service program expenditures. Expenditures by Category
Actual Approved Estimated Adopted2017/2018 2018/2019 2018/2019 2019/2020
Social ServicesSocial Services 450,000 500,000 500,000 500,000
Total 450,000 500,000 500,000 500,000

City of San Marcos | FY20 Adopted Budget
City of San Marcos | Finance
184
Special Services Department Organization The Special Services Division is used to account for a variety of non-direct expenditures. Examples of expenditures include utilities, insurance, bank charges and operating transfers. Expenditures by Category
Actual Approved Estimated Adopted2017/2018 2018/2019 2018/2019 2019/2020
Special ServicesPersonnel Services 1,083 723,125 723,125 365,568 Contracted Services 3,331,696 3,173,133 2,973,133 3,013,048 Materials and Supplies 9,390 5,100 5,100 5,100 Other Charges 2,366,763 2,173,069 2,173,069 2,455,517
Operating Transfers 1,418,405 2,924,172 2,819,172 4,360,093 Eco Development/TIZ Incentives 6,117,307 7,232,883 7,232,883 7,727,220 Other Incentives 207,020 200,000 200,000 200,000 Capital Outlay & Maintenance 2,734,871 2,783,359 2,783,359 3,142,234
Total 16,186,535 19,214,841 18,909,841 21,268,780

City of San Marcos | FY20 Adopted Budget
City of San Marcos | Finance
185
DEBT SERVICE FUND
Actual Approved Revised Adopted2017/2018 2018/2019 2018/2019 2019/2020
Beginning Unreserved Fund Balance 9,152,034 9,528,758 9,528,758 8,768,597
Operating Revenues
Current Ad Valorem 11,604,815 11,221,997 11,221,997 11,445,123 Delinquent Ad Valorem 43,679 148,863 148,863 151,823 Penalties and Interest 58,517 80,157 52,850 81,751 Interest Income 228,458 90,000 80,000 90,000 Hammonds Transfer 547,924 505,053 462,500 547,924 BAB Subsidy 94,522 102,608 99,498 102,608 Pass Thru Toll Revenue 3,266,265 3,030,000 3,400,000 2,759,450 TIRZ Transfer 214,550 1,839,572 1,221,324 1,839,572 Venue Tax Transfer 1,654,631 1,510,828 1,450,110 1,464,611
Total Operating Revenues 17,713,361 18,529,078 18,137,142 18,482,862
Operating ExpendituresPrincipal Payments 9,985,000 10,235,000 10,235,000 9,010,000 Interest Payments 5,040,938 7,429,528 7,429,528 6,115,339 Fiscal Agent Fees 3,932 11,450 11,450 6,900 TIZ Payments 2,306,768 1,839,572 1,221,324 1,839,572
Total Operating Expenditures 17,336,637 19,515,550 18,897,302 16,971,811
Ending Fund Balance 9,528,758 8,542,286 8,768,597 10,279,648
Fund Balance as a Percentage of Total Expenditures 54.96% 43.77% 46.40% 60.57%
Total Outstanding Tax Supported Debt 71,430,000 76,700,000 76,700,000 109,815,000
Outstanding Tax Supported Debt Outstanding Principal
Series 2008A Combination Tax and Revenue Certificates of Obligation 4,385,000 Series 2009 GO Refunding Bonds 295,000 Series 2009 GO Refunding Bonds 310,000 Series 2009 General Obligation Bonds 770,000 Series 2010 Taxable Build America Bonds 4,765,000 Series 2010 General Obligation Refunding Bonds 2,930,000 Series 2012 General Obligation Refunding Bonds 3,345,000 Series 2013 General Obligation Refunding Bonds 670,000 Series 2013 Combination Tax & Revenue Bonds 2,765,000 Series 2014 Combination Tax & Revenue Bonds 5,010,000 Series 2014 General Obligation Refunding Bonds 4,925,000 Series 2014A General Obligation Refunding Bonds 5,875,000 Series 2015 Combination Tax & Revenue Bonds 4,255,000 Series 2016 GO Refunding Bonds 4,385,000 Series 2016 Combination Tax & Revenue Bonds 9,090,000 Series 2017 Combination Tax & Revenue Bonds 6,610,000 Series 2018 Combination Tax & Revenue Bonds 8,805,000 Series 2018 General Obligation Bonds 23,060,000 Series 2018 Combination Tax & Revenue Bonds 9,105,000 Series 2019 Combination Tax & Revenue Bonds 8,460,000
Total 109,815,000
Fund Balance as a Percentage of Total Original Principal Amount for Outstanding Tax Supported Debt 9.36%
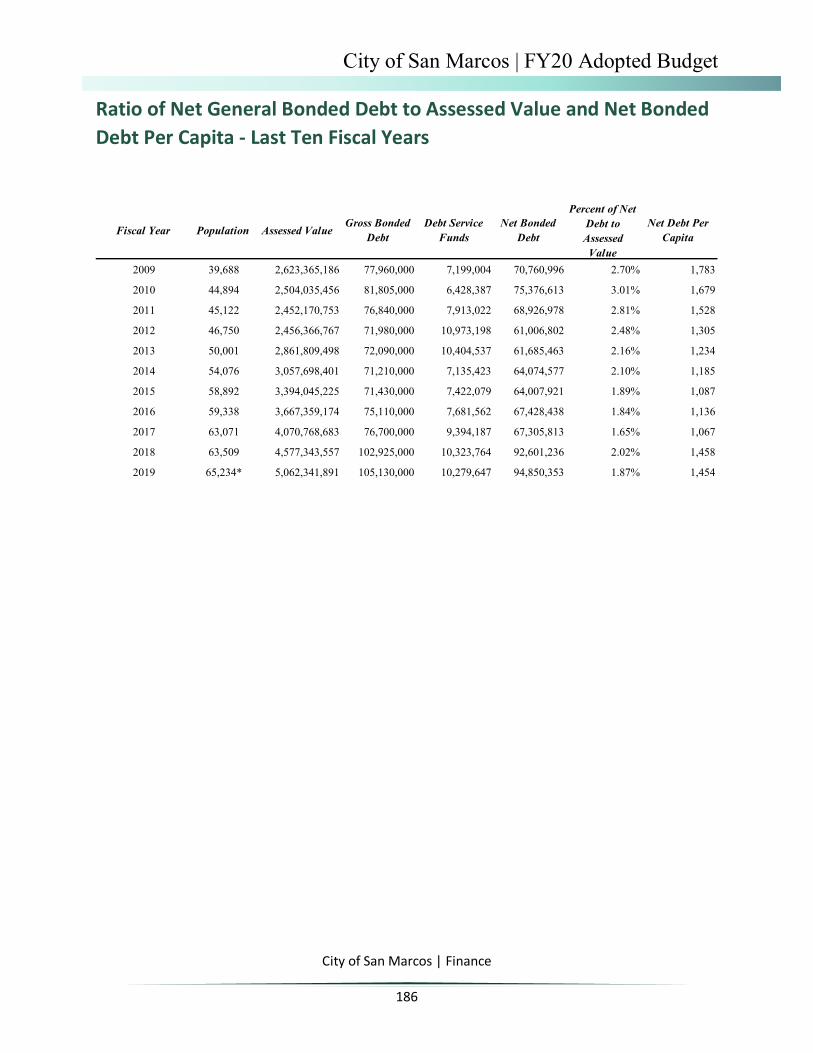
City of San Marcos | FY20 Adopted Budget
City of San Marcos | Finance
186
Ratio of Net General Bonded Debt to Assessed Value and Net Bonded Debt Per Capita - Last Ten Fiscal Years
Fiscal Year Population Assessed ValueGross Bonded
DebtDebt Service
FundsNet Bonded
Debt
Percent of Net Debt to Assessed
Value
Net Debt Per Capita
2009 39,688 2,623,365,186 77,960,000 7,199,004 70,760,996 2.70% 1,783
2010 44,894 2,504,035,456 81,805,000 6,428,387 75,376,613 3.01% 1,679
2011 45,122 2,452,170,753 76,840,000 7,913,022 68,926,978 2.81% 1,528
2012 46,750 2,456,366,767 71,980,000 10,973,198 61,006,802 2.48% 1,305
2013 50,001 2,861,809,498 72,090,000 10,404,537 61,685,463 2.16% 1,234
2014 54,076 3,057,698,401 71,210,000 7,135,423 64,074,577 2.10% 1,185
2015 58,892 3,394,045,225 71,430,000 7,422,079 64,007,921 1.89% 1,087
2016 59,338 3,667,359,174 75,110,000 7,681,562 67,428,438 1.84% 1,136
2017 63,071 4,070,768,683 76,700,000 9,394,187 67,305,813 1.65% 1,067
2018 63,509 4,577,343,557 102,925,000 10,323,764 92,601,236 2.02% 1,458
2019 65,234* 5,062,341,891 105,130,000 10,279,647 94,850,353 1.87% 1,454
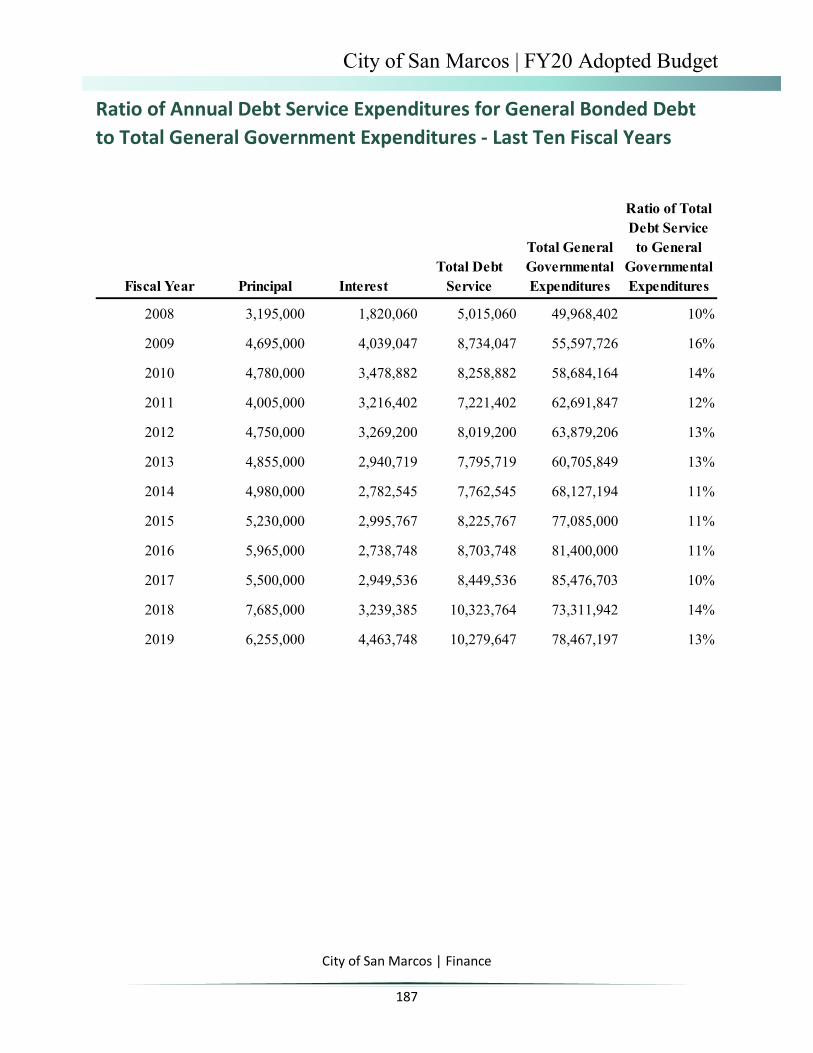
City of San Marcos | FY20 Adopted Budget
City of San Marcos | Finance
187
Ratio of Annual Debt Service Expenditures for General Bonded Debt to Total General Government Expenditures - Last Ten Fiscal Years
Fiscal Year Principal InterestTotal Debt
Service
Total General Governmental Expenditures
Ratio of Total Debt Service to General
Governmental Expenditures
2008 3,195,000 1,820,060 5,015,060 49,968,402 10%
2009 4,695,000 4,039,047 8,734,047 55,597,726 16%
2010 4,780,000 3,478,882 8,258,882 58,684,164 14%
2011 4,005,000 3,216,402 7,221,402 62,691,847 12%
2012 4,750,000 3,269,200 8,019,200 63,879,206 13%
2013 4,855,000 2,940,719 7,795,719 60,705,849 13%
2014 4,980,000 2,782,545 7,762,545 68,127,194 11%
2015 5,230,000 2,995,767 8,225,767 77,085,000 11%
2016 5,965,000 2,738,748 8,703,748 81,400,000 11%
2017 5,500,000 2,949,536 8,449,536 85,476,703 10%
2018 7,685,000 3,239,385 10,323,764 73,311,942 14%
2019 6,255,000 4,463,748 10,279,647 78,467,197 13%

City of San Marcos | FY20 Adopted Budget
City of San Marcos | Finance
188
Computation of Legal Debt Margin - September 30, 2019
State Law Limit - 10% of Taxable Assessed Value
Actual taxable assessed value at September 30, 2019 $5,644,609,342
Debt Limit - 10% of taxable assessed value 564,460,934
Total general obligation debt outstanding $109,815,000
Less: Debt Service Fund Balance 10,279,648
Debt applicable to debt limit 99,535,352
Legal debt margin $464,925,582
City of San Marcos Financial Policy Limit - 5% of Taxaable Assessed Value
Actual taxable assessed value at September 30, 2019 $5,644,609,342
Debt Limit - 5% of taxable assessed value 282,230,467
Total general obligation debt outstanding $109,815,000
Less: Debt Service Fund Balance 10,279,648
Debt applicable to debt limit 99,535,352
Debt margin - Financial Policy $182,695,115

City of San Marcos | FY20 Adopted Budget
City of San Marcos | Finance
189
General Obligation Outstanding Debt Service Requirements
Fiscal Year Principal Interest Total2019 6,255,000 4,463,748 10,718,7482020 6,550,000 4,552,057 11,102,0572021 6,655,000 4,229,744 10,884,7442022 6,930,000 3,948,676 10,878,6762023 7,215,000 3,659,171 10,874,1712024 6,955,000 3,330,192 10,285,1922025 7,215,000 2,991,491 10,206,4912026 7,010,000 2,653,292 9,663,2922027 6,585,000 2,343,432 8,928,4322028 6,020,000 2,047,113 8,067,1132029 5,530,000 1,781,826 7,311,8262030 4,910,000 1,545,028 6,455,0282031 4,500,000 1,328,713 5,828,7132032 4,390,000 1,138,363 5,528,3632033 4,580,000 954,150 5,534,1502034 4,520,000 764,575 5,284,5752035 4,260,000 590,925 4,850,9252036 4,035,000 425,425 4,460,4252037 3,495,000 272,825 3,767,8252038 3,120,000 144,900 3,264,9002039 655,000 19,650 674,650
Total $111,385,000 $43,185,293 $154,570,293

City of San Marcos | FY20 Adopted Budget
City of San Marcos | Finance
190
Summary of Outstanding Debt - As of September 30, 2019
Issue Purpose Interest Rate Amount Issued
Issue Date Maturity Date Amount Outstanding
McCarty Lane Project 4.61% 7,600,000 09/16/2008 08/15/2028 4,385,0002009 CT&R Bonds Constructing, reconstructing and impro 4.60% 23,455,000 06/15/2009 09/30/2029 295,0002009 GO-R Bonds Constructing, reconstructing and impro 4.46% 4,495,000 06/15/2009 09/30/2029 770,0002009 CO Constructing, reconstructing and impro 3.38% 9,745,000 06/15/2009 09/30/2029 310,0002010 CT&R Build America Bonds 3.49% 8,625,000 03/01/2010 08/15/2030 4,765,0002010 GO-R Bonds Refunding Bonds 2.69% 17,245,000 11/01/2010 08/15/2023 2,930,0002012 GO-R Bonds General Obligation Refunding Bonds 2.76% 5,520,000 02/29/2012 08/15/2025 3,345,0002013 GO-R Bonds General Obligation Refunding Bonds 3.64% 670,000 04/12/2013 08/15/2031 670,0002013 CT&R Bonds Constructing, reconstructing and impro 3.12% 3,505,000 04/12/2013 08/15/2033 2,765,0002014 CT&R Bonds Constructing, reconstructing and impro 3.07% 5,940,000 05/20/2014 08/15/2034 5,010,00020014 GO-R Bonds General Obligation Refunding Bonds 2.85% 6,720,000 06/15/2014 08/15/2026 4,925,0002014A GO-R Bonds General Obligation Refunding Bonds 2.78% 8,390,000 12/18/2014 09/30/2029 8,390,0002015 CT&R Bonds Constructing, reconstructing and impro 3.43% 5,665,000 09/18/2015 09/30/2035 5,875,0002016 GO-R Bonds General Obligation Refunding Bonds 2.19% 8,510,000 03/16/2016 09/30/2029 4,385,0002016 CT&R Bonds Constructing, reconstructing and impro 3.14% 9,825,000 06/08/2016 09/30/2036 9,090,0002017 CT&R Bonds Constructing, reconstructing and impro 2.84% 7,200,000 09/19/2017 08/15/2037 6,610,0002018 CT&R Bonds Constructing, reconstructing and impro 4.82% 9,025,000 06/14/2018 08/15/2038 8,805,0002018 CT&R Bonds Constructing, reconstructing and impro 4.49% 24,885,000 06/14/2018 08/15/2038 23,060,0002019 CT&R Bonds Constructing, reconstructing and impro 2.74% 8,460,000 06/12/2018 08/15/2039 8,460,000
SUBTOTAL TAX SUPPORTED DEBT $175,480,000 $104,845,000
2014 GO-R Bonds Hammon Hotel and Conference Cente 2.85% 8,500,000 06/15/2014 08/15/2032 8,500,0002014B GO-R Hammon Hotel and Conference Cente 2.78% 6,210,000 12/18/2014 02/15/2032 5,785,0002013 GO-R Bonds Wonder World Pass Through Portion 3.64% 4,570,000 04/12/2013 08/15/2031 4,570,0002014 GO-R Bonds Wonder World Pass Through Portion 2.85% 5,350,000 06/15/2014 08/15/2024 5,350,0002014A GO-R Bonds Wonder World Pass Through Portion 2.78% 17,420,000 12/18/2014 08/15/2029 17,420,0002016 GO-R Bonds Wonder World Pass Through Portion 2.19% 1,585,000 03/16/2016 09/30/2018 1,565,000
TOTAL OUTSTANDING DEBT $219,115,000 $148,035,000
General Obligation: GO | General Obligation Refunding: GO-R | Combination Tax & Revenue: CT&R | Certification of Obligation: CO
2008A CO

DESTINATION SERVICES

City of San Marcos | FY20 Adopted Budget
City of San Marcos | Finance
192
Hotel Occupancy Tax Fund Summary
Actual Approved Revised Adopted2017/2018 2018/2019 2018/2019 2019/2020
Beginning Fund Balance - Reserved and Unreserved 752,518 208,212 208,212 252,287
Operating RevenuesHotel Occupancy Tax 2,216,893 2,088,185 2,363,275 2,386,908 Penalties 6,501 1,000 31,000 1,000 Embassy Tax Revenue 870,651 914,206 774,890 782,639 Venue Tax-2% 633,398 596,622 675,220 681,972 Interest Income - 1,000 1,000 1,000 Other Revenue - - - - Operating Transfer from General Fund 143,481 143,481 143,481 142,188
Total Operating Revenues 3,870,924 3,744,494 3,988,866 3,995,707
Operating ExpendituresConvention & Visitor Bureau (Contribution from City) - - - - Tanger Marketing Program 150,000 126,750 150,000 50,000 Downtown Mrktng Coop 26,052 25,350 30,000 30,000 Eco Tourism 20,310 33,800 40,000 40,000 Sports Tourism 8,567 50,700 60,000 60,000 Tourist Account - - - - Transportation 1,008 - - - Mural Funding 29,916 29,575 35,000 35,000 Arts Project Funding 107,753 105,625 125,000 137,500 Permanent Art 44,528 105,625 125,000 137,500 Repairs-Building Materials - 10,000 10,000 20,000 Main Street Program 352,857 354,026 328,251 388,089 Convention & Visitor Bureau (City Department) 1,462,809 1,441,772 1,591,429 1,695,236
Total Operating Expenditures 2,203,800 2,283,222 2,494,681 2,593,325
Operating Transfers and AdjustmentsTransfer of Venue Tax 1,504,631 1,510,828 1,450,110 1,464,611
Total Transfers and Adjustments 1,504,631 1,510,828 1,450,110 1,464,611
Reserved for Unspent Allocations - Arts Funding 278,287 Reserved for Unspent Allocations - Mural Funding 46,995 Reserved for Unspent Allocations - Conference Ctr Repairs 119,000 Reserve for Unspent Allocation-Eco/Sports Tourism 180,688 - - - Reserve for Unspent Allocation-Branding 23,825 Reserved for Unspent Allocations - Wayfinding 33,005 - - - Reserved for Unspent Allocations - Airport Improvements - - - - Reserved for Unspent Allocations - Master Plan 25,000 - - -
Total Reserves for Unspent Allocations 706,800 - - -
Ending Unreserved Fund Balance 208,212 158,655 252,287 190,058
Fund Balance as a Percentage of Total Expenditures 9.45% 6.95% 10.11% 7.33%

City of San Marcos | FY20 Adopted Budget
City of San Marcos | Finance
193
DEPARTMENT SUMMARY |DESTINATION SERVICESStrategic Initiative
Mission Statement
Goals Objective Performance Measure FY19 FY20 FY21Increase social media following
Increase from FY 18
6% 12% 18%US travel writers Media Visits scheduled
4 4 4Increase hotel occupancy rate
Annual ccupancy average from FY 18 5% 8% 11%
Increase the number of tourism blogs posted to the website
Increase from FY 18
5 5 5Increase in marketing programs within Mexico
Programs added
3 2 1Increase in media visits to San Marcos (quality)
Media Visits scheduled6 4 4
Complete beautification projects
# of projects
3 4 5Complete placemaking projects
# of projects0 2 3
Improve look and feel of downtown so that visitors and locals feel safe and welcome
We are committed to developing and marketing San Marcos as a premier year-round destination for leisure, group, and business travelers that will have a positive economic impact on the community. To support and contribute to the artistic vitality, diverse cultural heritage and economic prosperity of our city in an effort to distinguish it from other communities while promoting tourism to San Marcos. To maintain the unique, historic nature of downtown recognizing its history and planning for its future, while striving to provide economic stability to the heart of our City.
Increase visitor activity and engagement
Mexico as the top International Market

City of San Marcos | FY20 Adopted Budget
City of San Marcos | Finance
194
Main Street
Goals Objective Performance Measure FY19 FY20 FY21Notify businesses of upcoming city projects
% of total City projects downtowners were notified of 50% 65% 80%
Provide resources to business and property owners
# of 1-on-1 consultations
data not collected 25 40
Provide incentive grant funding for signage
# of signs funded through Main Street grant
1 3 4Encourage non-Main Street organizers to host events downtown.
# of events
1 3 5Nominate downtown, its businesses, people and properties for awards and nominations
# of successful nominations
2 3 4
Promote Downtown San Marcos as a destination via social media, special events and media attention
Improve business and property owner communication, provide resources and outreach
Positions Full Time Equivalent
Actual Adopted Actual Adopted Actual Adopted Actual AdoptedMain Street 2017-18 2018-19 2018-19 2019-20 2017-18 2018-19 2018-19 2019-20Main Street Program Manager 1 1 0 0 1.00 1.00 0.00 0.00Main Street Program Coordinator 1 1 1 1 1.00 1.00 1.00 1.00Administrative Assistant 0 0 0 1 0.00 0.00 0.00 1.00Downtown Grounds 1 1 1 1 1.00 1.00 1.00 1.00
Total 3 3 2 3 3.00 3.00 2.00 3.00
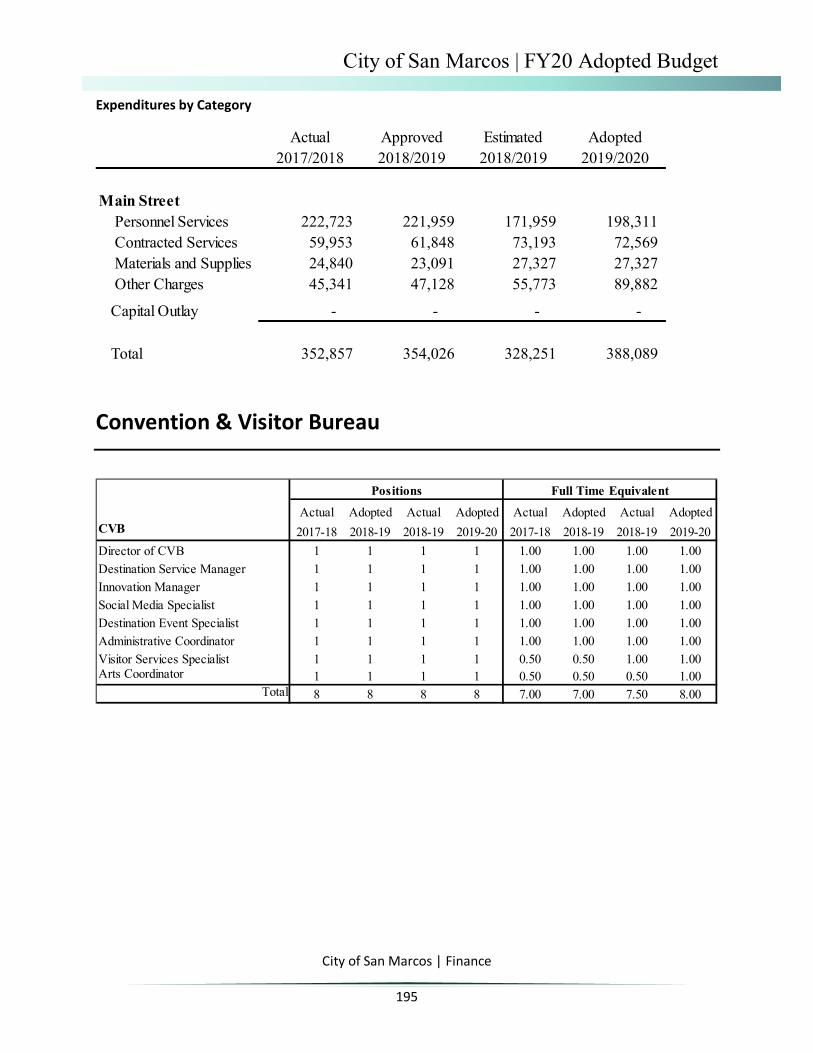
City of San Marcos | FY20 Adopted Budget
City of San Marcos | Finance
195
Expenditures by Category
Convention & Visitor Bureau
Actual Approved Estimated Adopted2017/2018 2018/2019 2018/2019 2019/2020
Main Street Personnel Services 222,723 221,959 171,959 198,311 Contracted Services 59,953 61,848 73,193 72,569 Materials and Supplies 24,840 23,091 27,327 27,327 Other Charges 45,341 47,128 55,773 89,882
Capital Outlay - - - -
Total 352,857 354,026 328,251 388,089
Positions Full Time Equivalent
Actual Adopted Actual Adopted Actual Adopted Actual AdoptedCVB 2017-18 2018-19 2018-19 2019-20 2017-18 2018-19 2018-19 2019-20Director of CVB 1 1 1 1 1.00 1.00 1.00 1.00Destination Service Manager 1 1 1 1 1.00 1.00 1.00 1.00Innovation Manager 1 1 1 1 1.00 1.00 1.00 1.00Social Media Specialist 1 1 1 1 1.00 1.00 1.00 1.00Destination Event Specialist 1 1 1 1 1.00 1.00 1.00 1.00Administrative Coordinator 1 1 1 1 1.00 1.00 1.00 1.00Visitor Services Specialist 1 1 1 1 0.50 0.50 1.00 1.00Arts Coordinator 1 1 1 1 0.50 0.50 0.50 1.00
Total 8 8 8 8 7.00 7.00 7.50 8.00

City of San Marcos | FY20 Adopted Budget
City of San Marcos | Finance
196
Expenditures by Category
Actual Approved Estimated Adopted2017/2018 2018/2019 2018/2019 2019/2020
Convention & Visitor Bureau Personnel Services 551,385 618,203 618,203 741,383 Contracted Services 252,817 260,820 307,184 286,044 Materials and Supplies 619,644 511,136 604,895 605,654 Other Charges 38,963 51,613 61,148 62,155
Capital Outlay - - - -
Total 1,462,809 1,441,772 1,591,429 1,695,236

City of San Marcos | FY20 Adopted Budget
City of San Marcos | Finance
197
Municipal Court Technology Fund
Actual Approved Revised Adopted2017/2018 2018/2019 2018/2019 2019/2020
Beginning Unreserved Fund Balance 152,936 178,585 178,585 198,585
Operating RevenuesTechnology Fee 25,754 25,000 25,000 25,000 Interest Income -
Total Operating Revenues 25,754 25,000 25,000 25,000
Operating Expenditures
Materials and Supplies - 5,000 5,000 5,000
Total Operating Expenditures - 5,000 5,000 5,000
One-Time Expenditures
Capital Outlay 105 - - -
Total One-Time Expenditures 105 - - -
Ending Unreserved Fund Balance 178,585 198,585 198,585 218,585
Fund Balance as a Percentage of Total Expenditures 100.00% 3971.70% 3971.70% 4371.70%

City of San Marcos | FY20 Adopted Budget
City of San Marcos | Finance
198
Municipal Court Security Fee Fund
Actual Approved Revised Adopted2017/2018 2018/2019 2018/2019 2019/2020
Beginning Unreserved Fund Balance 145,305 134,511 134,511 115,938
Operating Revenues
Security Fee 18,607 18,500 18,500 18,500 Interest Income - - -
Total Operating Revenues 18,607 18,500 18,500 18,500
Operating Expenditures
Personnel 29,401 32,073 32,073 32,073 Contracted Services - 50,000 50,000 Materials & Supplies - 5,000 5,000 5,000
Total Operating Expenditures 29,401 87,073 37,073 87,073
Ending Unreserved Fund Balance 134,511 65,938 115,938 47,365
Fund Balance as a Percentage of Total Expenditures 457.51% 75.73% 312.73% 54.40%

City of San Marcos | FY20 Adopted Budget
City of San Marcos | Finance
199
Municipal Court Juvenile Fee Fund
Actual Approved Revised Adopted2017/2018 2018/2019 2018/2019 2019/2020
Beginning Unreserved Fund Balance 42,879 51,372 51,372 58,009
Operating Revenues
Juvenile Fee 30,404 30,500 30,500 30,500 Truancy Fee 5,468 5,500 5,500 5,500 Interest Income - - - -
Total Operating Revenues 35,872 36,000 36,000 36,000
Operating Expenditures
Personnel Services 27,379 29,363 29,363 28,464
Total Operating Expenditures 27,379 29,363 29,363 28,464
Ending Unreserved Fund Balance 51,372 58,009 58,009 65,545
Fund Balance as a Percentage of Total Expenditures 187.64% 197.56% 197.56% 230.27%

City of San Marcos | FY20 Adopted Budget
City of San Marcos | Finance
200
Municipal Court Efficiency Fund
Actual Approved Revised Adopted2017/2018 2018/2019 2018/2019 2019/2020
Beginning Unreserved Fund Balance 36,642 40,989 40,989 20,989
Operating RevenuesEfficiency Fee 4,347 4,000 4,000 4,000 Other Revenue - - - -
Total Operating Revenues 4,347 4,000 4,000 4,000
Operating Expenditures
Contracted Services - 20,000 24,000 20,000
Total Operating Expenditures - 20,000 24,000 20,000
Ending Unreserved Fund Balance 40,989 24,989 20,989 4,989
Fund Balance as a Percentage of Total Expenditures 100.00% 124.95% 87.45% 24.95%

City of San Marcos | FY20 Adopted Budget
City of San Marcos | Finance
201
Seized Assets Fund
Actual Approved Revised Adopted2017/2018 2018/2019 2018/2019 2019/2020
Beginning Unreserved Fund Balance 154,821 194,253 194,253 126,073
Operating Revenues
Seized Assets 48,432 5,000 5,000 5,000 Interest Income - - - -
Total Operating Revenues 48,432 5,000 5,000 5,000
Operating Expenditures
Contracted Services 9,000 5,000 5,000 5,000 Capital Outlay - 68,180 68,180 -
Total Operating Expenditures 9,000 73,180 73,180 5,000
Ending Unreserved Fund Balance 194,253 126,073 126,073 126,073
Fund Balance as a Percentage of Total Expenditures 2158.37% 172.28% 172.28% 2521.46%

City of San Marcos | FY20 Adopted Budget
City of San Marcos | Finance
202
Community Development Block Grant Program Fund
Actual Approved Revised Adopted2017/2018 2018/2019 2018/2019 2019/2020
Beginning Unreserved Fund Balance - - - -
Operating Revenues
Grant Revenue 941,575 649,948 649,948 680,998
Total Operating Revenues 941,575 649,948 649,948 680,998
Operating ExpendituresPersonnel Services 101,664 129,990 129,990 129,990 Contracted Services 839,911 519,958 519,958 551,008
Total Operating Expenditures 941,575 649,948 649,948 680,998
Ending Unreserved Fund Balance - - - -
Fund Balance as a Percentage of Total Expenditures 0.00% 0.00% 0.00% 0.00%

WOMEN INFANT AND CHILDREN

City of San Marcos | FY20 Adopted Budget
City of San Marcos | Finance
204
WIC Program – Administration
Expenditures by Category
Positions Full Time EquivalentActual Adopted Actual Adopted Actual Adopted Actual Adopted
WIC Administration 2017-18 2018-19 2018-19 2019-20 2017-18 2018-19 2018-19 2019-20Assistant Director 1 1 0 0 0.75 0.75 0.50 0.50Administrative Assistant, Senior 1 1 1 1 1.00 1.00 1.00 1.00Health & Nutrition Specialist 5 5 5 5 5.00 5.00 5.00 5.00WIC Clerk 8 8 8 8 8.00 8.00 8.00 8.00
Total 15 15 14 14 14.75 14.75 14.50 14.50
Actual Approved Estimated Adopted2017/2018 2018/2019 2018/2019 2019/2020
WIC Administration Personnel Services 685,848 899,604 899,604 870,636 Contracted Services 145,790 257,747 257,747 235,251 Materials and Supplies 90,413 88,441 88,441 104,483 Other Charges 129,053 19,563 19,563 27,563
Capital Outlay - - - -
Total 1,051,105 1,265,355 1,265,355 1,237,934

City of San Marcos | FY20 Adopted Budget
City of San Marcos | Finance
205
DEPARTMENT SUMMARY | WOMEN, INFANT, & CHILDREN PROGRAMStrategic Initiative
Mission Statement
Goal Objective Performance Measure FY19 FY20 FY21Provide nutrition education to an average of 95% of families that receive food benefits each month
95% 95% 95%
Ensure that an average of 20% of pregnant women enrolled are enrolled during their first trimester
20% 20% 20%
Provide WIC services and food benefits to an average of 80% of enrolled participants
80% 80% 80%
Provide health care referrals to 100% of WIC participants who have no source of health care
100% 100% 100%
Each clinic shall conduct outreach at least once per month (5 clinics x 12 months)
60 60 60
Bring special attention to WIC during National Nutrition Month
1 1 1
Bring special attention to WIC during National Breastfeeding Week
1 1 1
Increase awareness of WIC to encourage more families to utilize our services
WIC strives to educate, encourage, and empower; WIC helps amazing families grow, one individual at a time.
Maintain frequent contact with the general public
Provide quality WIC services to help grow healthy families
Meet or exceed the performance measures required in the State contract
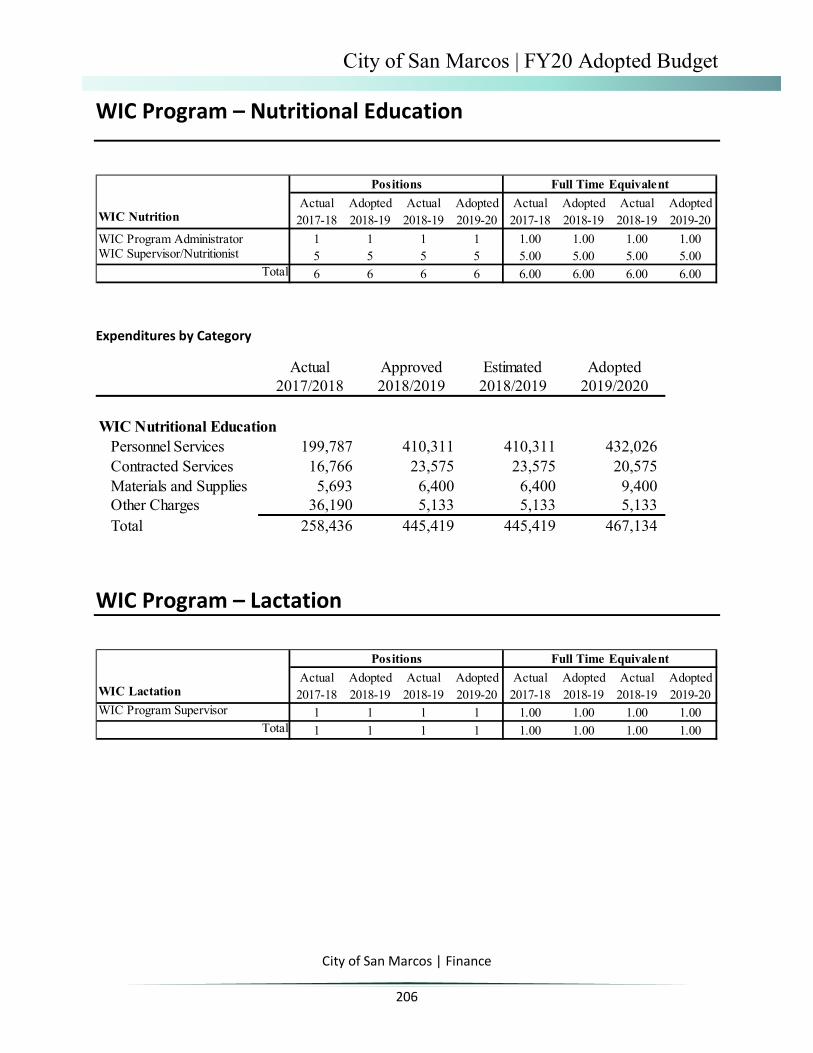
City of San Marcos | FY20 Adopted Budget
City of San Marcos | Finance
206
WIC Program – Nutritional Education
Expenditures by Category
WIC Program – Lactation
Positions Full Time EquivalentActual Adopted Actual Adopted Actual Adopted Actual Adopted
WIC Nutrition 2017-18 2018-19 2018-19 2019-20 2017-18 2018-19 2018-19 2019-20WIC Program Administrator 1 1 1 1 1.00 1.00 1.00 1.00WIC Supervisor/Nutritionist 5 5 5 5 5.00 5.00 5.00 5.00
Total 6 6 6 6 6.00 6.00 6.00 6.00
Actual Approved Estimated Adopted2017/2018 2018/2019 2018/2019 2019/2020
WIC Nutritional EducationPersonnel Services 199,787 410,311 410,311 432,026 Contracted Services 16,766 23,575 23,575 20,575 Materials and Supplies 5,693 6,400 6,400 9,400 Other Charges 36,190 5,133 5,133 5,133 Total 258,436 445,419 445,419 467,134
Positions Full Time EquivalentActual Adopted Actual Adopted Actual Adopted Actual Adopted
WIC Lactation 2017-18 2018-19 2018-19 2019-20 2017-18 2018-19 2018-19 2019-20WIC Program Supervisor 1 1 1 1 1.00 1.00 1.00 1.00
Total 1 1 1 1 1.00 1.00 1.00 1.00

City of San Marcos | FY20 Adopted Budget
City of San Marcos | Finance
207
Expenditures by Category
WIC Program – Peer Counselor
Expenditures by Category
Actual Approved Estimated Adopted2017/2018 2018/2019 2018/2019 2019/2020
WIC LactationPersonnel Services 82,496 63,949 63,949 64,415 Contracted Services 11,385 23,217 23,217 15,217 Materials and Supplies 8,259 4,700 4,700 12,700 Other Charges 15,259 6,683 6,683 6,683 Total 117,400 98,549 98,549 99,015
Positions Full Time EquivalentActual Adopted Actual Adopted Actual Adopted Actual Adopted
WIC Peer Counselor 2017-18 2018-19 2018-19 2019-20 2017-18 2018-19 2018-19 2019-20WIC Clerk/Breastfeeding Peer Counselor 4 4 4 4 4.00 4.00 4.00 4.00
Total 4 4 4 4 4.00 4.00 4.00 4.00
Actual Approved Estimated Adopted2017/2018 2018/2019 2018/2019 2019/2020
WIC Peer CouncelorPersonnel Services 129,051 202,669 202,669 210,537 Contracted Services 2,105 17,150 17,150 17,150 Materials and Supplies - 2,800 2,800 2,800 Other Charges 23,634 1,268 1,268 1,268 Total 154,790 223,887 223,887 231,755
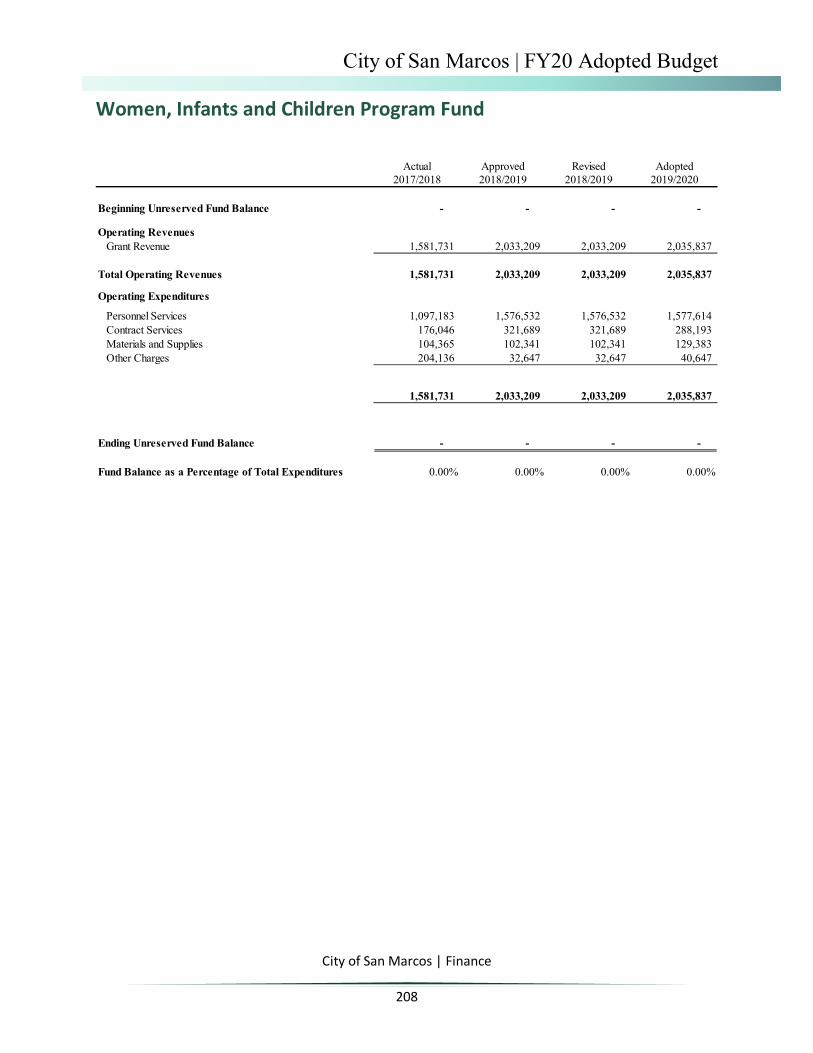
City of San Marcos | FY20 Adopted Budget
City of San Marcos | Finance
208
Women, Infants and Children Program Fund
Actual Approved Revised Adopted2017/2018 2018/2019 2018/2019 2019/2020
Beginning Unreserved Fund Balance - - - -
Operating RevenuesGrant Revenue 1,581,731 2,033,209 2,033,209 2,035,837
Total Operating Revenues 1,581,731 2,033,209 2,033,209 2,035,837
Operating Expenditures
Personnel Services 1,097,183 1,576,532 1,576,532 1,577,614 Contract Services 176,046 321,689 321,689 288,193 Materials and Supplies 104,365 102,341 102,341 129,383 Other Charges 204,136 32,647 32,647 40,647
1,581,731 2,033,209 2,033,209 2,035,837
Ending Unreserved Fund Balance - - - -
Fund Balance as a Percentage of Total Expenditures 0.00% 0.00% 0.00% 0.00%

City of San Marcos | FY20 Adopted Budget
City of San Marcos | Finance
209
Women, Infants and Children Program Fund
Actual Approved Revised Adopted2017/2018 2018/2019 2018/2019 2019/2020
WIC AdministrationPersonnel Services 685,848 899,604 899,604 870,636 Contracted Services 145,790 257,747 257,747 235,251 Materials and Supplies 90,413 88,441 88,441 104,483 Other Charges 129,053 19,563 19,563 27,563 Capital Outlay - - - -
Total 1,051,105 1,265,355 1,265,355 1,237,934
WIC Nutritional EducationPersonnel Services 199,787 410,311 410,311 432,026 Contracted Services 16,766 23,575 23,575 20,575 Materials and Supplies 5,693 6,400 6,400 9,400 Other Charges 36,190 5,133 5,133 5,133
Total 258,436 445,419 445,419 467,134
WIC LactationPersonnel Services 82,496 63,949 63,949 64,415 Contracted Services 11,385 23,217 23,217 15,217 Materials and Supplies 8,259 4,700 4,700 12,700 Other Charges 15,259 6,683 6,683 6,683
Total 117,400 98,549 98,549 99,015
WIC Peer CounselingPersonnel Services 129,051 202,669 202,669 210,537 Contracted Services 2,105 17,150 17,150 17,150 Materials and Supplies - 2,800 2,800 2,800 Other Charges 23,634 1,268 1,268 1,268
Total 154,790 223,887 223,887 231,755
Total WIC Expenditures 1,581,731 2,033,209 2,033,209 2,035,837
Recap of WIC Expenditures
WIC Administration 1,051,105 1,265,355 1,265,355 1,237,934 WIC Nutritional Education 258,436 445,419 445,419 467,134 WIC Lactation 117,400 98,549 98,549 99,015 WIC Peer Counseling 154,790 223,887 223,887 231,755
Total WIC Expenditures 1,581,731 2,033,209 2,033,209 2,035,837

City of San Marcos | FY20 Adopted Budget
City of San Marcos | Finance
210
Cemetery Operations Fund
Actual Approved Revised Adopted2017/2018 2018/2019 2018/2019 2019/2020
Beginning Unreserved Fund Balance 19,387 39,430 39,430 6,220
Operating Revenues
Burial Permits - - - Monument Permits - - - Other Revenue - - Interest Income - - Sale of Cemetery Lots 87,481 55,500 100,170 80,000 Sale of Memorial Plaques - - - -
Total Operating Revenues 87,481 55,500 100,170 80,000
One-Time Operating Revenues
Operating Transfer - General Fund 90,000 180,000 75,000 170,000 Operating Transfer - Cemetery Perpetual Care Fund - - - -
Total One-Time Operating Revenues 90,000 180,000 75,000 170,000
Operating Expenditures
Contracted Services 155,822 237,224 203,380 247,546 Materials and Supplies 1,617 2,000 5,000 5,000
Total Operating Expenditures 157,439 239,224 208,380 252,546
Ending Unreserved Fund Balance 39,430 35,706 6,220 3,674
Fund Balance as a Percentage of Total Expenditures 25.04% 14.93% 2.98% 1.45%

City of San Marcos | FY20 Adopted Budget
City of San Marcos | Finance
211
Tax Increment Financing Summary
Tax Increment Reinvestment Zone #2 - Blanco Vista Development
Actual Approved Revised Adopted2017/2018 2018/2019 2018/2019 2019/2020
Beginning Unreserved Fund Balance 910,579 1,604,315 1,604,315 2,366,861
Operating RevenuesInterest Income - - - - TIRZ Revenue City 2,306,768 3,438,759 2,982,920 4,543,767 TIRZ Revenue County 440,695 516,650 448,220 595,000
Total Operating Revenues 2,747,463 3,955,409 3,431,140 5,138,767
Operating ExpendituresDistribution 1,839,177 4,972,665 2,468,937 3,930,767 Debt Service Transfer 214,550 224,422 199,657 198,000
Total Operating Expenditures 2,053,727 5,197,087 2,668,594 4,128,767
Ending Unreserved Fund Balance 1,604,315 362,637 2,366,861 3,376,861
Actual Approved Revised Adopted2017/2018 2018/2019 2018/2019 2019/2020
Beginning Unreserved Fund Balance - - - -
Operating RevenuesTIRZ Revenue City 998,420 1,307,833 1,211,421 1,539,767 TIRZ Revenue County 99,960 - - -
Total Operating Revenues 1,098,380 1,307,833 1,211,421 1,539,767
Operating Expenditures
Distributions 1,098,380 1,107,833 1,211,421 1,539,767
Total Operating Expenditures 1,098,380 1,107,833 1,211,421 1,539,767
Ending Unreserved Fund Balance - 200,000 - -

City of San Marcos | FY20 Adopted Budget
City of San Marcos | Finance
212
Tax Increment Reinvestment Zone #3 - Conference Center
Tax Increment Reinvestment Zone #4 - Kissing Tree
Actual Approved Revised Adopted2017/2018 2018/2019 2018/2019 2019/2020
Beginning Unreserved Fund Balance - - - -
Operating RevenuesTIRZ Revenue City 147,908 150,984 139,410 138,000 TIRZ Revenue County 66,642 73,438 60,247 60,000
Total Operating Revenues 214,550 224,422 199,657 198,000
Operating Expenditures
Operating Transfers To Debt Service Fund 214,550 224,422 199,657 198,000
Total Operating Expenditures 214,550 224,422 199,657 198,000
Ending Unreserved Fund Balance - - - -
Actual Approved Revised Adopted2017/2018 2018/2019 2018/2019 2019/2020
Beginning Unreserved Fund Balance 84,045 84,045 -
Operating Revenues
Interest Income - TIRZ Revenue City 50,925 92,094 81,911 206,000 TIRZ Revenue County 33,120 15,609 53,370 135,000
Total Operating Revenues 84,045 107,703 135,281 341,000
Operating Expenditures
Distributions - 107,703 219,326 341,000
Total Operating Expenditures - 107,703 219,326 341,000
Ending Unreserved Fund Balance 84,045 84,045 - -
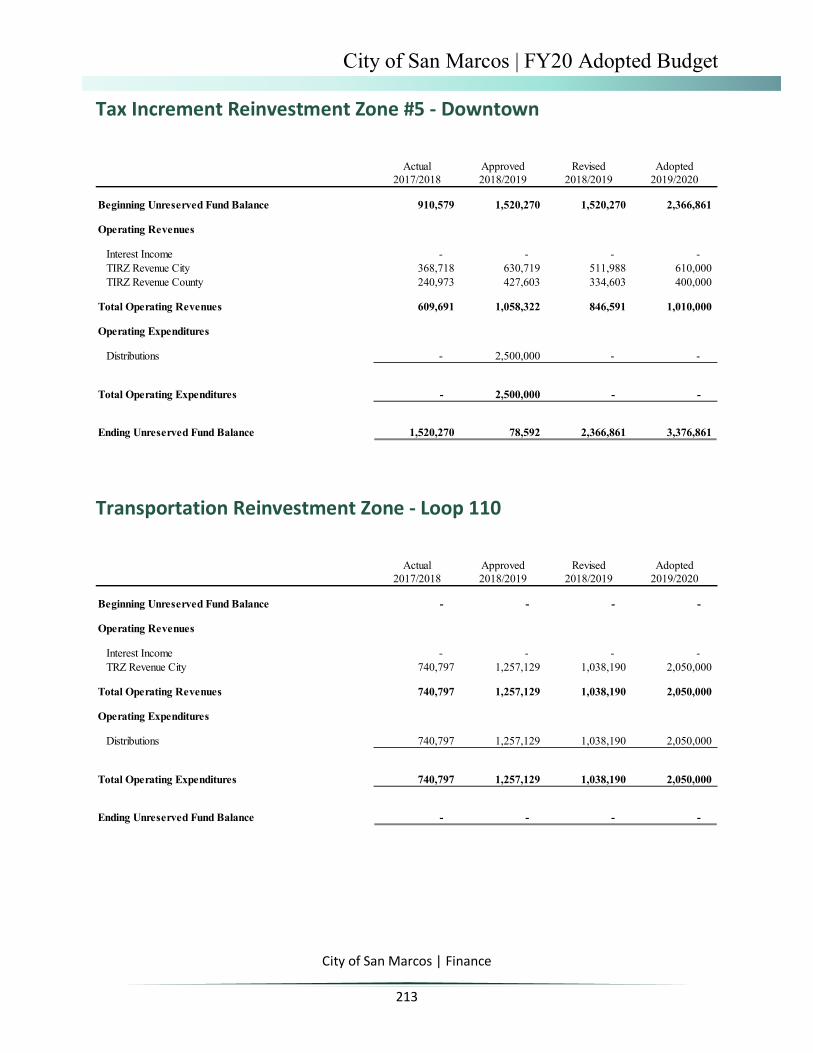
City of San Marcos | FY20 Adopted Budget
City of San Marcos | Finance
213
Tax Increment Reinvestment Zone #5 - Downtown
Transportation Reinvestment Zone - Loop 110
Actual Approved Revised Adopted2017/2018 2018/2019 2018/2019 2019/2020
Beginning Unreserved Fund Balance 910,579 1,520,270 1,520,270 2,366,861
Operating Revenues
Interest Income - - - - TIRZ Revenue City 368,718 630,719 511,988 610,000 TIRZ Revenue County 240,973 427,603 334,603 400,000
Total Operating Revenues 609,691 1,058,322 846,591 1,010,000
Operating Expenditures
Distributions - 2,500,000 - -
Total Operating Expenditures - 2,500,000 - -
Ending Unreserved Fund Balance 1,520,270 78,592 2,366,861 3,376,861
Actual Approved Revised Adopted2017/2018 2018/2019 2018/2019 2019/2020
Beginning Unreserved Fund Balance - - - -
Operating Revenues
Interest Income - - - - TRZ Revenue City 740,797 1,257,129 1,038,190 2,050,000
Total Operating Revenues 740,797 1,257,129 1,038,190 2,050,000
Operating Expenditures
Distributions 740,797 1,257,129 1,038,190 2,050,000
Total Operating Expenditures 740,797 1,257,129 1,038,190 2,050,000
Ending Unreserved Fund Balance - - - -

City of San Marcos | FY20 Adopted Budget
City of San Marcos | Finance
214
Public Education Governmental Fund (PEG)
Actual Approved Revised Adopted2017/2018 2018/2019 2018/2019 2019/2020
Beginning Unreserved Fund Balance 517,665 545,249 545,249 571,949
Operating RevenuesPublic Education Governmental Fee 99,518 97,000 96,700 97,000
Total Operating Revenues 99,518 97,000 96,700 97,000
Capital OutlayEquipment 71,934 100,000 70,000 100,000
Total One-Time Expenditures 71,934 100,000 70,000 100,000
Ending Unreserved Fund Balance 545,249 542,249 571,949 568,949

City of San Marcos | FY20 Adopted Budget
City of San Marcos | Finance
215
Electric Utility Fund Summary
Actual Approved Revised Adopted2017/2018 2018/2019 2018/2019 2019/2020
Beginning Unreserved Fund Balance 10,659,587 10,866,772 10,866,772 10,595,560
Operating Revenues
Interest Income 156,283 244,420 164,816 281,959 Sales Tax Discount 8,971 7,500 8,802 8,916 Electric Service Revenue 56,128,647 58,043,981 53,990,594 57,203,312 Connections - Electric 586,148 600,000 553,232 575,050 Reconnection Charges 127,260 120,000 120,645 122,935 Penalties 539,630 550,000 623,152 568,428 Pole Attachment Contracts 0 454,500 457,186 357,000 Sale of Transformers 5,142 1,515 10,916 3,329 Ferguson Revenue 876,565 406,348 144,549 12,210 Service Charges 20,000 25,402 7,459 22,701 Other Revenue 90,964 169,349 414,919 167,371 Reimbursement from Other Funds 1,910,907 2,198,743 2,252,585 2,675,413
BAB Subsidy 22,055 21,977 21,615 19,720
Total Operating Revenues 60,472,572 62,843,735 58,770,470 62,018,343
Operating Expenses
Personnel Services 5,100,930 6,295,606 5,722,309 6,914,021 Purchase of Power 35,939,424 37,780,820 33,057,003 36,502,187 Contracted Services 2,035,662 3,086,218 2,836,218 4,162,511 Materials and Supplies 711,086 1,382,591 1,232,591 1,455,030 Other Charges 3,171,655 3,788,934 3,797,267 3,962,125 Franchise Fee 4,490,286 4,643,519 4,490,292 4,643,519 Debt Service 3,821,150 4,250,198 4,250,200 4,522,302
Total Operating Expenses 55,270,192 61,227,885 55,385,880 62,161,695
One-Time ExpensesOne-Time Operating Transfers - 40,000 40,000 42,000 Capital Outlay 211,299 615,803 615,803 426,284 Transfer to Capital Reserves 4,000,000 1,000,000 3,000,000 300,000
Total One-Time Expenses 4,211,299 1,655,803 3,655,803 768,284
Total Expenses 59,481,491 62,883,688 59,041,682 62,929,979
Ending Fund Balance 11,650,668 10,826,819 10,595,560 9,683,924
Fund Balance Reserve-Revenue Stabilization 783,896 - - -
Enbcumbrance Reserve 1,649,645 - - -
Ending Unreserved Fund Balance 9,217,127 10,826,819 10,595,560 9,683,924
Fund Balance in Days of Opertation 65.34 68.88 74.95 60.61

City of San Marcos | FY20 Adopted Budget
City of San Marcos | Finance
216
Electric Utility Fund – Financial Forecast
FY 2019 FY 2020 FY 2021 FY 2022 FY 2023
Operating RevenuesInterest Income 164,816 281,959 284,779 287,626 290,503 Electric Service Revenue 553,232 575,050 603,802 633,992 665,692 Charges from Other Services 54,743,193 57,903,591 59,187,656 60,347,728 62,386,331 Other Revenue 1,056,644 582,330 1,381,291 1,498,827 1,529,694 Reimbursements from Other Funds 2,252,585 2,675,413 2,782,430 2,893,727 3,009,476
Total Operating Revenues 58,770,470 62,018,343 64,239,957 65,661,901 67,881,695 Operating Expenses
Personnel Services 5,722,309 6,914,021 7,121,442 7,335,085 7,555,138 Contracted Services 2,836,218 4,162,511 4,245,761 4,330,676 4,417,289 Purchase of Power 33,057,003 36,502,187 41,255,864 42,110,197 42,984,476 Materials and Supplies 1,232,591 1,455,030 1,484,131 1,513,813 1,544,090 Other Charges 3,797,267 3,962,125 4,041,368 4,122,195 4,204,639 Franchise Fee 4,490,292 4,643,519 4,185,402 4,268,720 4,413,642 Reimbursement to Other Funds - - - - - Debt Service 4,250,200 4,522,302 4,660,276 5,669,727 5,817,674
Total Operating Expenses 55,385,880 62,161,695 66,994,243 69,350,414 70,936,947
Operating Income / (Loss) 3,384,591 (143,352) (2,754,286) (3,688,513) (3,055,252)
One-Time ExpensesOne-Time Operating Transfers 40,000 42,000 - - - Capital Outlay 615,803 426,284 426,284 426,284 426,284 Transfer to Capital Reserves 3,000,000 300,000 - - - Rate Stabilization - - - - -
Net Change in Fund Balance (231,212) (869,636) (3,180,570) (4,114,797) (3,481,536) Beginning Unreserved Fund Balance 10,866,772 10,635,560 9,765,924 6,585,354 2,470,557
Ending Unreserved Fund Balance 10,635,560 9,765,924 6,585,354 2,470,557 (1,010,979)
Percentage of Operating Expenses 19.2% 15.7% 9.8% 3.6% -1.4%
Days of Operation 70 57 36 13 (5)

City of San Marcos | FY20 Adopted Budget
City of San Marcos | Finance
217
Electric Utility Fund Summary
Actual Approved Revised Adopted2017/2018 2018/2019 2018/2019 2019/2020
ConservationPersonnel Services 88,726 91,059 91,059 99,103 Contracted Services 79,000 138,762 88,762 138,762 Materials and Supplies 10,334 23,335 23,335 23,335 Other Charges - 500 500 500 Capital Outlay - - - -
Total 178,059 253,656 203,656 261,700
Meter OperationsPersonnel Services 894,220 1,056,023 896,023 1,108,423 Contracted Services 145,579 86,505 86,505 641,505 Materials and Supplies 137,585 364,886 264,886 376,361 Other Charges 33,349 42,465 42,465 53,065 Capital Outlay - - - 256,828
Total 1,210,733 1,549,879 1,289,879 2,436,182
AdministrationPersonnel Services 698,845 1,071,658 931,658 1,205,761 Contracted Services 249,600 364,148 264,148 315,948 Materials and Supplies 25,876 23,001 23,001 52,045 Other Charges 62,140 72,915 72,915 86,265 Capital Outlay 886 - - 23,456
Total 1,037,347 1,531,722 1,291,722 1,683,475
MaintenancePersonnel Services 1,909,784 2,259,181 2,059,181 2,687,525 Contracted Services 456,553 629,389 629,389 1,184,389 Materials and Supplies 504,358 874,289 824,289 902,210 Other Charges 39,985 70,890 70,890 77,090 Capital Outlay 160,413 240,000 240,000 96,000
Total 3,071,093 4,073,749 3,823,749 4,947,213
Utility Business OfficePersonnel Services 1,067,441 1,085,459 1,085,459 1,169,607 Contracted Services 306,716 523,430 423,430 523,430 Materials and Supplies 27,219 52,680 52,680 52,680 Other Charges 11,084 22,005 22,005 25,705 Capital Outlay - - - -
Total 1,412,460 1,683,574 1,583,574 1,771,422

City of San Marcos | FY20 Adopted Budget
City of San Marcos | Finance
218
Electric Utility Fund Summary
Actual Approved Revised Adopted2017/2018 2018/2019 2018/2019 2019/2020
Public Services AdministrationPersonnel Services 440,829 593,417 543,417 638,604 Contracted Services 198,253 265,164 265,164 192,664 Materials and Supplies 2,523 9,200 9,200 13,200 Other Charges 9,351 24,550 24,550 39,410 Capital Outlay 975 325,803 325,803 -
Total 651,931 1,218,134 1,168,134 883,878
Special ServicesPersonnel Services 1,084 138,808 115,512 5,000 Purchase Power 35,939,424 37,780,820 33,057,003 36,502,187 Contracted Services 599,961 1,078,820 1,078,820 1,165,813 Materials and Supplies 3,192 35,200 35,200 35,200 Other Charges 3,015,746 3,555,609 3,563,942 3,680,090 Franchise Fee 4,490,286 4,643,519 4,490,292 4,643,519 Operating Transfers - 40,000 40,000 42,000 Capital Outlay 50,000 50,000 50,000 50,000 Transfer to Capital Reserves 4,000,000 1,000,000 3,000,000 300,000 Rate Stablization - - - -
Total 48,099,693 48,322,776 45,430,768 46,423,809
Debt ServicePrincipal Payments 1,915,000 2,170,000 2,170,000 2,310,000 Interest Payments 1,903,759 2,074,698 2,074,700 2,207,752 Fiscal Agent Fees 2,391 5,500 5,500 4,550
Total 3,821,150 4,250,198 4,250,200 4,522,302
Total Electric Utility Fund Expenses 59,482,466 62,883,688 59,041,682 62,929,979
Summary of Expenses by Department
Conservation 178,059 253,656 203,656 261,700 Meter Operations 1,210,733 1,549,879 1,289,879 2,436,182 Administration 1,037,347 1,531,722 1,291,722 1,683,475 Maintenance 3,071,093 4,073,749 3,823,749 4,947,213 Utility Business Office 1,412,460 1,683,574 1,583,574 1,771,422 Public Services Administration 651,931 1,218,134 1,168,134 883,878 Special Services 48,099,693 48,322,776 45,430,768 46,423,809 Debt Service 3,821,150 4,250,198 4,250,200 4,522,302
Total Electric Utility Fund Expenses 59,482,466 62,883,688 59,041,682 62,929,979

City of San Marcos | FY20 Adopted Budget
City of San Marcos | Finance
219
Electric Fund – Outstanding Debt Service Requirements
Fiscal Year Principal Interest Total2019 2,170,000 2,074,698 4,244,6982020 2,320,000 2,196,202 4,516,2022021 2,435,000 2,076,999 4,511,9992022 2,530,000 1,982,549 4,512,5492023 2,640,000 1,870,634 4,510,6342024 2,755,000 1,753,892 4,508,8922025 2,955,000 1,631,688 4,586,6882026 3,085,000 1,503,925 4,588,9252027 3,210,000 1,372,968 4,582,9682028 3,335,000 1,245,946 4,580,9462029 3,475,000 1,106,735 4,581,7352030 3,615,000 963,206 4,578,2062031 3,775,000 804,750 4,579,7502032 3,585,000 636,288 4,221,2882033 3,750,000 476,475 4,226,4752034 3,690,000 310,800 4,000,8002035 1,680,000 196,575 1,876,5752036 1,460,000 133,025 1,593,0252037 1,155,000 81,100 1,236,1002038 760,000 42,750 802,7502039 445,000 13,350 458,350
Total $54,825,000 $22,474,554 $77,299,554

City of San Marcos | FY20 Adopted Budget
City of San Marcos | Finance
220
Electric Utility Fund - Personnel Roster
Positions Full Time EquivalentActual Adopted Actual Adopted Actual Adopted Actual Adopted
Electric Utility Fund 2017-18 2018-19 2018-19 2019-20 2017-18 2018-19 2018-19 2019-20Public Services Administration 5 5 5 6 4.00 5.00 4.00 6.00Conservation 1 1 1 1 1.00 1.00 1.00 1.00Electric Administration 10 11 10 11 10.33 11.33 10.33 11.33Meter Operations 12 13 13 13 12.00 13.00 13.00 13.00Maintenance 23 23 23 26 23.00 23.00 23.00 26.00Utility Billing and Collections 15 15 15 15 15.00 15.00 15.00 15.00
Total 66 68 67 72 65.33 68.33 66.33 72.33

ELECTRIC UTILITY

City of San Marcos | FY20 Adopted Budget
City of San Marcos | Finance
222
DEPARTMENT SUMMARY | ELECTRIC UTILITYStrategic Initiative
Mission Statement
Goals Objective Performance Measure FY19 FY20 FY21Replace all electric metering with new
% Installation Complete and Fully Functional 10% 70% 20%
Replace 65% water meters as part of 10-year replacement program
% Installation Complete and Fully Functional
10% 70% 20%
Upgrade mesh network and communications systems
% System Meters accurately reporting through the new systems
15% 75% 10%
Update software systems and integration into Utility Billing software systems
Completion of communicatoins upgrade for effectively collecting real-time metering data and transferring to Utility Billing's Harris software system
100% 0% 0%
The Electric Administration Division oversees the operation, planning, and design of the electrical distribution system for the City of San Marcos, and is the first line of contact with the public, industry and others requesting information on policies and procedures. Its mission is to provide a safe and reliable, low cost, electrical distribution system for the City.
The Meter Operations group is committed to providing accurate, real-time water and electric distribution systems usage information for use by the City accounting and outage management systems using an advanced metering infrastructure. This team also serves as electric utility dispatchers during system interruptions or city emergencies.
The Electric Maintenance team is charged with the safe and reliable delivery of clean electricity throughout the City of San Marcos. It accomplishes its mission through the continual reconstruction and updating of the electrical distribution system, service interruption response, and ongoing system maintenance programs.
Replace aged infrastructure with advanced technologies to provide more accurate metering and implement 'smart grid' usages including outage management systems

City of San Marcos | FY20 Adopted Budget
City of San Marcos | Finance
223
Goals Objective Performance Measure FY19 FY20 FY21Complete 5-year vegetation management plan
Annual completion of targetted areas 20% 20% 20%
Complete of Predictive, Preventative, Maintenance program
Completion of PPM's in a given period
100% 100% 100%
Complete 5-year Electrical Master Plan and Develop CIP
Completion of Master Plan in FY21 50% 50% 0%
Design and Construction of Rattler Substation
Maintain Design and Construction Schedule 10% 70% 20%
Design and Construction of Capital Projects
Completion of three CIP annually 3 3 3
Enhance City Facilities Oversight of design and construction of the COSM Public Service Center
Completion of COSM PSC construction
10% 45% 45%
Provide up to date system modelling and development of 5- and 10-year CIP plans through improved system engineering and master planning
Replace aged infrastructure with advanced technologies to provide more accurate metering and implement 'smart grid' usages including outage management systems

City of San Marcos | FY20 Adopted Budget
City of San Marcos | Finance
224
Administration
Expenses by Category
Positions Full Time EquivalentElectric Actual Adopted Actual Adopted Actual Adopted Actual AdoptedAdministration 2017-18 2018-19 2018-19 2019-20 2017-18 2018-19 2018-19 2019-20Assistant Director of Public Services 1 1 1 1 1.00 1.00 1.00 1.00Electric Engineering Service Manager 1 1 1 1 1.00 1.00 1.00 1.00Graduate Engineer 1 1 1 1 1.00 1.00 1.00 1.00Electrical Engineering Technician 4 4 4 3 4.00 4.00 4.00 3.00Electrical Engineering Technician Sr. 0 0 0 1 0.00 0.00 0.00 1.00Administrative Clerk 1 1 1 1 1.00 1.00 1.00 1.00Administrative Assistant 1 1 1 0 1.00 1.00 1.00 0.00Adminstrative Assistant Sr. 0 0 0 1 0.00 0.00 0.00 1.00Arborist 0 0 0 0 0.33 0.33 0.33 0.33Power System Technician 0 1 0 1 0.00 1.00 0.00 1.00Public Services GIS/Tech Specialist 1 1 1 1 1.00 1.00 1.00 1.00
Total 10 11 10 11 10.33 11.33 10.33 11.33
Actual Approved Estimated Adopted2017/2018 2018/2019 2018/2019 2019/2020
AdministrationPersonnel Services 698,845 1,071,658 931,658 1,205,761 Contracted Services 249,600 364,148 264,148 315,948 Materials and Supplies 25,876 23,001 23,001 52,045 Other Charges 62,140 72,915 72,915 86,265
Capital Outlay 886 - - 23,456
Total 1,037,347 1,531,722 1,291,722 1,683,475

City of San Marcos | FY20 Adopted Budget
City of San Marcos | Finance
225
Conservation
Expenses by Category
Positions Full Time EquivalentElectric Actual Adopted Actual Adopted Actual Adopted Actual AdoptedConservation 2017-18 2018-19 2018-19 2019-20 2017-18 2018-19 2018-19 2019-20
Public Services Conservation Coordinator 0.5 0.5 0.5 0.5 0.50 0.50 0.50 0.50
Public Services Conservation Technician 0.5 0.5 0.5 0.5 0.50 0.50 0.50 0.50Total 1 1 1 1 1.00 1.00 1.00 1.00
Actual Approved Estimated Adopted2017/2018 2018/2019 2018/2019 2019/2020
ConservationPersonnel Services 88,726 91,059 91,059 99,103 Contracted Services 79,000 138,762 88,762 138,762 Materials and Supplies 10,334 23,335 23,335 23,335 Other Charges - 500 500 500
Capital Outlay - - - -
Total 178,059 253,656 203,656 261,700

City of San Marcos | FY20 Adopted Budget
City of San Marcos | Finance
226
Meter Operations
Expenses by Category
Positions Full Time EquivalentElectric Actual Adopted Actual Adopted Actual Adopted Actual AdoptedMeter Operations 2017-18 2018-19 2018-19 2019-20 2017-18 2018-19 2018-19 2019-20Utilities Metering Manager 1 1 1 1 1.00 1.00 1.00 1.00Metering Supervisor 1 1 1 1 1.00 1.00 1.00 1.00Complex Meter Technician 2 2 2 2 2.00 2.00 2.00 2.00Meter Service Technician 6 6 6 6 6.00 6.00 6.00 6.00Public Services Meter Data Specialist 1 1 1 1 1.00 1.00 1.00 1.00Public Services Support Specialist 1 1 1 1 1.00 1.00 1.00 1.00Administrative Assistant Sr. 0 1 1 1 0.00 1.00 1.00 1.00
Total 12 13 13 13 12.00 13.00 13.00 13.00
Actual Approved Estimated Adopted2017/2018 2018/2019 2018/2019 2019/2020
Meter OperationsPersonnel Services 894,220 1,056,023 896,023 1,108,423 Contracted Services 145,579 86,505 86,505 641,505 Materials and Supplies 137,585 364,886 264,886 376,361 Other Charges 33,349 42,465 42,465 53,065
Capital Outlay - - - 256,828
Total 1,210,733 1,549,879 1,289,879 2,436,182

City of San Marcos | FY20 Adopted Budget
City of San Marcos | Finance
227
Maintenance
Expenses by Category
Positions Full Time EquivalentElectric Actual Adopted Actual Adopted Actual Adopted Actual AdoptedMaintenance 2017-18 2018-19 2018-19 2019-20 2017-18 2018-19 2018-19 2019-20Electric Distribution Manager 1 1 1 1 1.00 1.00 1.00 1.00Electric Crew Leader 4 4 4 4 4.00 4.00 4.00 4.00Line Worker 11 10 10 4 11.00 10.00 10.00 4.00Sr Line Worker 0 0 0 4 0.00 0.00 0.00 4.00Line Person Apprentice I/II 2 4 4 4 2.00 4.00 4.00 4.00Line Person Apprentice III/IV 0 0 0 4 0.00 0.00 0.00 4.00Line Person Helper 4 3 3 2 4.00 3.00 3.00 2.00Service Technician 0 0 0 2 0.00 0.00 0.00 2.00Inventory Control Technician 1 1 1 1 1.00 1.00 1.00 1.00
Total 23 23 23 26 23.00 23.00 23.00 26.00
Actual Approved Estimated Adopted2017/2018 2018/2019 2018/2019 2019/2020
MaintenancePersonnel Services 1,909,784 2,259,181 2,059,181 2,687,525 Contracted Services 456,553 629,389 629,389 1,184,389 Materials and Supplies 504,358 874,289 824,289 902,210 Other Charges 39,985 70,890 70,890 77,090
Capital Outlay 160,413 240,000 240,000 96,000
Total 3,071,093 4,073,749 3,823,749 4,947,213

City of San Marcos | FY20 Adopted Budget
City of San Marcos | Finance
228
Utility Business Office
Mission Statement
The Utility Billing and Collection Division is responsible for the billing and collection of all electric, water, wastewater, garbage, cemetery and other accounts. These tasks include billing, collection, customer relations, utility service connections and disconnections, computer data entry, and computer output product initiation, as well as reporting utility data to management.
Expenses by Category
Positions Full Time EquivalentActual Adopted Actual Adopted Actual Adopted Actual Adopted
Utility Billing and Collections 2017-18 2018-19 2018-19 2019-20 2017-18 2018-19 2018-19 2019-20Utility Billing Manager 1 1 1 1 1.00 1.00 1.00 1.00Utility Applications Administrator 1 1 1 1 1.00 1.00 1.00 1.00Billing Quality Assurance Specialist 1 1 1 1 1.00 1.00 1.00 1.00
Utilities Customer Service Supervisor 2 2 2 2 2.00 2.00 2.00 2.00Accounting Specialist 4 4 5 5 4.00 4.00 5.00 5.00Lead Cashier 2 2 2 2 2.00 2.00 2.00 2.00Utilities Customer Service Clerk 4 4 3 3 4.00 4.00 3.00 3.00
Total 15 15 15 15 15.00 15.00 15.00 15.00
Actual Approved Estimated Adopted2017/2018 2018/2019 2018/2019 2019/2020
Utility Business OfficePersonnel Services 1,067,441 1,085,459 1,085,459 1,169,607 Contracted Services 306,716 523,430 423,430 523,430 Materials and Supplies 27,219 52,680 52,680 52,680 Other Charges 11,084 22,005 22,005 25,705
Capital Outlay - - - -
Total 1,412,460 1,683,574 1,583,574 1,771,422

City of San Marcos | FY20 Adopted Budget
City of San Marcos | Finance
229
Public Services Administration
Mission Statement
The Public Services Administration Division takes care of the operation, planning, and design of the electrical distribution system for the City of San Marcos, and is the first line of contact with the public, industry and others requesting information on policies and procedures.
Expenses by Category
Positions Full Time EquivalentPublic Services Actual Adopted Actual Adopted Actual Adopted Actual AdoptedAdministration 2017-18 2018-19 2018-19 2019-20 2017-18 2018-19 2018-19 2019-20Director of Public Services 1 1 1 1 1.00 1.00 1.00 1.00
Public Services GIS/Technology Manager 1 1 1 1 1.00 1.00 1.00 1.00Utility Systems Analyst 1 1 1 1 1.00 1.00 1.00 1.00Inventory Control Supervisor 1 1 1 1 1.00 1.00 1.00 1.00Inventory Technician 1 1 1 1 0.00 1.00 0.00 1.00GIS Technician 0 0 0 1 0.00 0.00 0.00 1.00
Total 5 5 5 6 4.00 5.00 4.00 6.00
Actual Approved Estimated Adopted2017/2018 2018/2019 2018/2019 2019/2020
Public Services AdministrationPersonnel Services 440,829 593,417 543,417 638,604 Contracted Services 198,253 265,164 265,164 192,664 Materials and Supplies 2,523 9,200 9,200 13,200 Other Charges 9,351 24,550 24,550 39,410
Capital Outlay 975 325,803 325,803 -
Total 651,931 1,218,134 1,168,134 883,878

City of San Marcos | FY20 Adopted Budget
City of San Marcos | Finance
230
Special Services
Department Organization
The Special Services Division is used to account for a variety of non-direct expenses. Examples of expenses include utilities, insurance, bank charges and operating transfers.
Expenses by Category
Actual Approved Estimated Adopted2017/2018 2018/2019 2018/2019 2019/2020
Special ServicesPersonnel Services 1,084 138,808 115,512 5,000 Purchase Power 35,939,424 37,780,820 33,057,003 36,502,187 Contracted Services 599,961 1,078,820 1,078,820 1,165,813 Materials and Supplies 3,192 35,200 35,200 35,200
Other Charges 3,015,746 3,555,609 3,563,942 3,680,090 Franchise Fee 4,490,286 4,643,519 4,490,292 4,643,519
Operating Transfers - 40,000 40,000 42,000 Capital Outlay 50,000 50,000 50,000 50,000 Transfer to Capital Reserves 4,000,000 1,000,000 3,000,000 300,000 Rate Stablization - - - -
Total 48,099,693 48,322,776 45,430,768 46,423,809

City of San Marcos | FY20 Adopted Budget
City of San Marcos | Finance
231
Water/Wastewater Utility Fund – Financial Forecast
FY 2019 FY 2020 FY 2021 FY 2022 FY 2023
Operating RevenuesInterest Income 286,570 285,482 285,482 285,482 288,337 Water Service Revenue 21,020,451 24,079,879 25,527,005 26,805,579 28,413,914 Wastewater Service Revenue 16,894,256 18,493,283 21,486,600 22,570,718 23,247,840 Charges from Other Services 3,010,638 2,678,131 2,558,130 2,600,571 2,649,004 Other Revenue 860,685 787,440 777,873 782,675 1,005,888
Total Operating Revenues 42,072,600 46,324,215 50,635,090 53,045,025 55,604,982 Operating Expenses
Personnel Services 4,915,431 5,354,194 5,568,362 5,791,097 6,022,740 Contracted Services 10,798,524 11,469,409 13,348,033 13,653,876 13,951,876 Materials and Supplies 1,444,818 1,520,388 1,535,592 1,566,304 1,597,630 Other Charges 6,409,188 7,075,372 7,146,125 7,217,586 7,289,762 Franchise Fee 3,251,541 3,251,541 3,290,952 3,456,341 3,616,323 Reimbursement to Other Funds - - - - - Debt Service 13,361,334 14,397,947 13,935,682 14,441,074 16,581,250
Total Operating Expenses 40,180,836 43,068,851 44,824,746 46,126,277 49,059,581
Operating Income / (Loss) 1,891,764 3,255,364 5,810,344 6,918,748 6,545,401
One-Time ExpensesCapital Outlay 343,000 240,000 242,400 244,824 247,272 System Improvements - - - - - Rate Stabilization - - - - - One-Time Operating Transfers 137,607 161,514 - - - Transfer to Capital Reserves 1,400,000 2,193,928 300,000 1,000,000 1,500,000
Net Change in Fund Balance 11,157 659,922 5,267,944 5,673,924 4,798,128 Beginning Unreserved Fund Balance 8,933,337 8,944,495 9,604,417 14,872,361 20,546,285
Ending Unreserved Fund Balance 8,944,495 9,604,417 14,872,361 20,546,285 25,344,413
Percentage of Operating Expenses 22.3% 22.3% 33.2% 44.5% 51.7%
Days of Operation 81 81 121 163 189

City of San Marcos | FY20 Adopted Budget
City of San Marcos | Finance
232
Water/Wastewater Utility Fund Summary
Actual Approved Revised Adopted2017/2018 2018/2019 2018/2019 2019/2020
Beginning Unreserved Fund Balance 12,388,666 10,086,852 10,086,852 10,098,010 Operating Revenues
Interest Income 163,069 238,000 286,570 285,482 Water Service Revenue 20,262,595 20,788,214 21,020,451 24,079,879 Wastewater Service Revenue 16,844,961 18,671,906 16,894,256 18,493,283 Pretreatment Program 683,101 712,280 790,917 806,735 Connections-Water 233,300 294,920 230,955 233,265 Connections-Sewer 948 12,716 2,400 2,400 Effluent Revenue 477,778 426,009 511,385 590,500 Wholesale Water Sales 886,253 522,823 877,301 525,000 Penalties 357,746 357,650 418,752 341,303 Other Revenue 136,285 296,717 259,539 262,060 Service Charges 186,280 202,130 174,774 83,591 Debt Service Reimbursement (Series 2006 and 2006A) 450,661 500,000 450,903 450,903 Build America Bond Subsidy 157,537 169,172 154,397 169,814
Total Operating Revenues 40,840,513 43,192,537 42,072,600 46,324,215
Operating Expenses
Personnel Services 4,616,326 5,006,311 4,915,431 5,354,194 Contracted Services 8,997,094 10,998,524 10,798,524 11,469,409 Materials and Supplies 1,068,704 1,444,818 1,444,818 1,520,388 Other Charges 7,214,972 6,509,188 6,409,188 7,075,372 Franchise Fee 3,033,673 3,251,541 3,251,541 3,251,541 Debt Service 12,219,133 13,364,310 13,361,334 14,397,947
Total Operating Expenses 37,149,902 40,574,692 40,180,836 43,068,851
Non-Recurring Expenses
Operating/Administrative Transfers 69,856 137,607 137,607 161,514 Capital Outlay 454,061 343,000 343,000 240,000 Transfer to Capital Reserves 2,600,000 1,800,000 1,400,000 2,193,928
Total One-Time Expenses 3,123,917 2,280,607 1,880,607 2,595,442
Total Expenses 40,273,819 42,855,299 42,061,443 45,664,293
Ending Fund Balance 12,955,360 10,424,091 10,098,010 10,757,932
Fund Balance Reserve-Revenue Stabilization 2,868,508 - - -
Enbcumbrance Reserve 1,153,515
Ending Unreserved Fund Balance 8,933,337 10,424,091 10,098,010 10,757,932
Fund Balance as a Percentage of Total Expenses 24.0% 25.7% 25.1% 25.0%
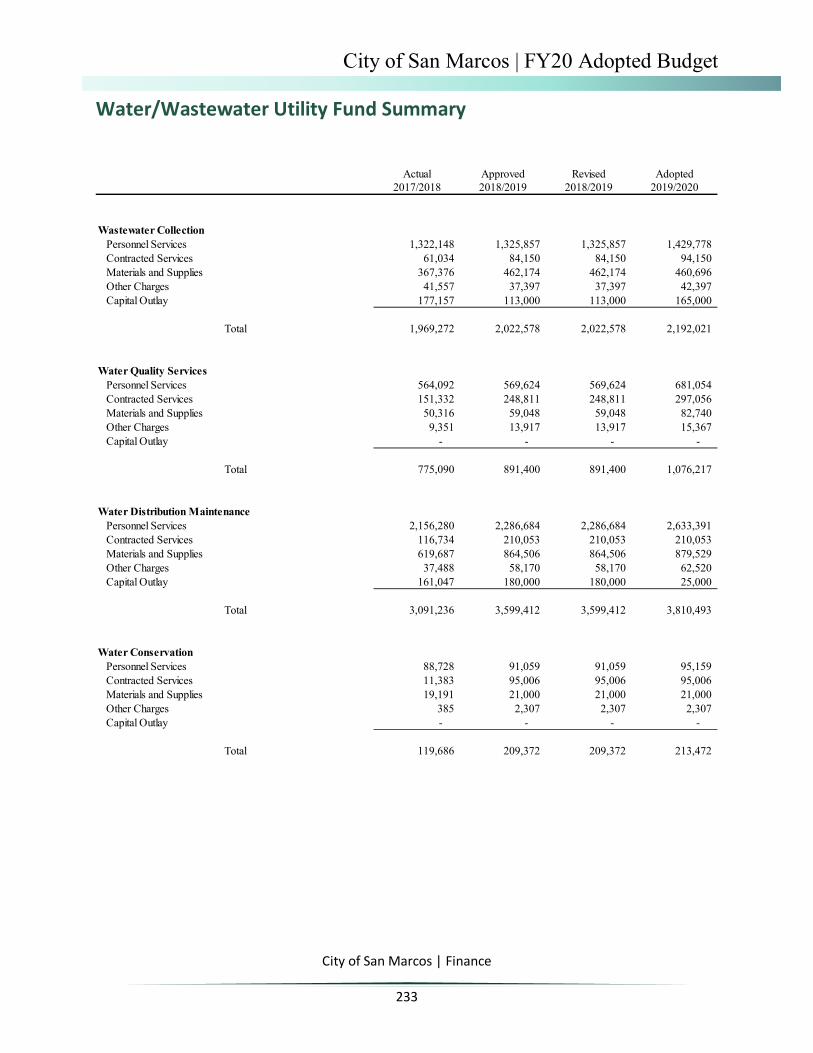
City of San Marcos | FY20 Adopted Budget
City of San Marcos | Finance
233
Water/Wastewater Utility Fund Summary
Actual Approved Revised Adopted2017/2018 2018/2019 2018/2019 2019/2020
Wastewater CollectionPersonnel Services 1,322,148 1,325,857 1,325,857 1,429,778 Contracted Services 61,034 84,150 84,150 94,150 Materials and Supplies 367,376 462,174 462,174 460,696 Other Charges 41,557 37,397 37,397 42,397 Capital Outlay 177,157 113,000 113,000 165,000
Total 1,969,272 2,022,578 2,022,578 2,192,021
Water Quality ServicesPersonnel Services 564,092 569,624 569,624 681,054 Contracted Services 151,332 248,811 248,811 297,056 Materials and Supplies 50,316 59,048 59,048 82,740 Other Charges 9,351 13,917 13,917 15,367 Capital Outlay - - - -
Total 775,090 891,400 891,400 1,076,217
Water Distribution MaintenancePersonnel Services 2,156,280 2,286,684 2,286,684 2,633,391 Contracted Services 116,734 210,053 210,053 210,053 Materials and Supplies 619,687 864,506 864,506 879,529 Other Charges 37,488 58,170 58,170 62,520 Capital Outlay 161,047 180,000 180,000 25,000
Total 3,091,236 3,599,412 3,599,412 3,810,493
Water ConservationPersonnel Services 88,728 91,059 91,059 95,159 Contracted Services 11,383 95,006 95,006 95,006 Materials and Supplies 19,191 21,000 21,000 21,000 Other Charges 385 2,307 2,307 2,307 Capital Outlay - - - -
Total 119,686 209,372 209,372 213,472

City of San Marcos | FY20 Adopted Budget
City of San Marcos | Finance
234
Water/Wastewater Utility Fund Summary
Actual Approved Revised Adopted2017/2018 2018/2019 2018/2019 2019/2020
Water/Wastewater AdministrationPersonnel Services 480,982 614,250 614,250 504,811 Contracted Services 117,209 242,851 242,851 225,701 Materials and Supplies 11,926 27,090 27,090 65,423 Other Charges 23,339 20,405 20,405 20,405 Capital Outlay 65,857 - - -
Total 699,312 904,597 904,597 816,340
Special ServicesPersonnel Services 4,096 118,836 27,956 10,000 Contracted Services 8,539,401 10,117,653 9,917,653 10,547,443 Materials and Supplies 209 11,000 11,000 11,000 Other Charges 7,102,853 6,376,992 6,276,992 6,932,376 Franchise Fee 3,033,673 3,251,541 3,251,541 3,251,541 Operating / Administrative Transfers 69,856 137,607 137,607 161,514 Capital Outlay 50,000 50,000 50,000 50,000 Transfer to Capital Reserves 2,600,000 1,800,000 1,400,000 2,193,928 Rate Stablization Fund 0 0 0 0
Total 21,400,088 21,863,629 21,072,749 23,157,802
Debt ServicePrincipal Payments 8,205,000 8,925,000 8,970,000 9,230,000 Interest Payments 4,006,660 4,424,660 4,376,684 5,156,997 Fiscal Agent Fees 7,474 14,650 14,650 10,950 New Debt Issued
Total 12,219,133 13,364,310 13,361,334 14,397,947
Total Water/Wastewater Utility Fund Expenses 40,273,819 42,855,299 42,061,443 45,664,293
Summary of Expenses by Department
Wastewater Collection 1,969,272 2,022,578 2,022,578 2,192,021 Water Quality Services 775,090 891,400 891,400 1,076,217 Water Distribution Maintenance 3,091,236 3,599,412 3,599,412 3,810,493 Water Conservation 119,686 209,372 209,372 213,472 Water/ Wastewater Administration 699,312 904,597 904,597 816,340 Special Services 21,400,088 21,863,629 21,072,749 23,157,802 Debt Service 12,219,133 13,364,310 13,361,334 14,397,947
Total Water/Wastewater Utility Fund Expenses 40,273,819 42,855,299 42,061,443 45,664,293
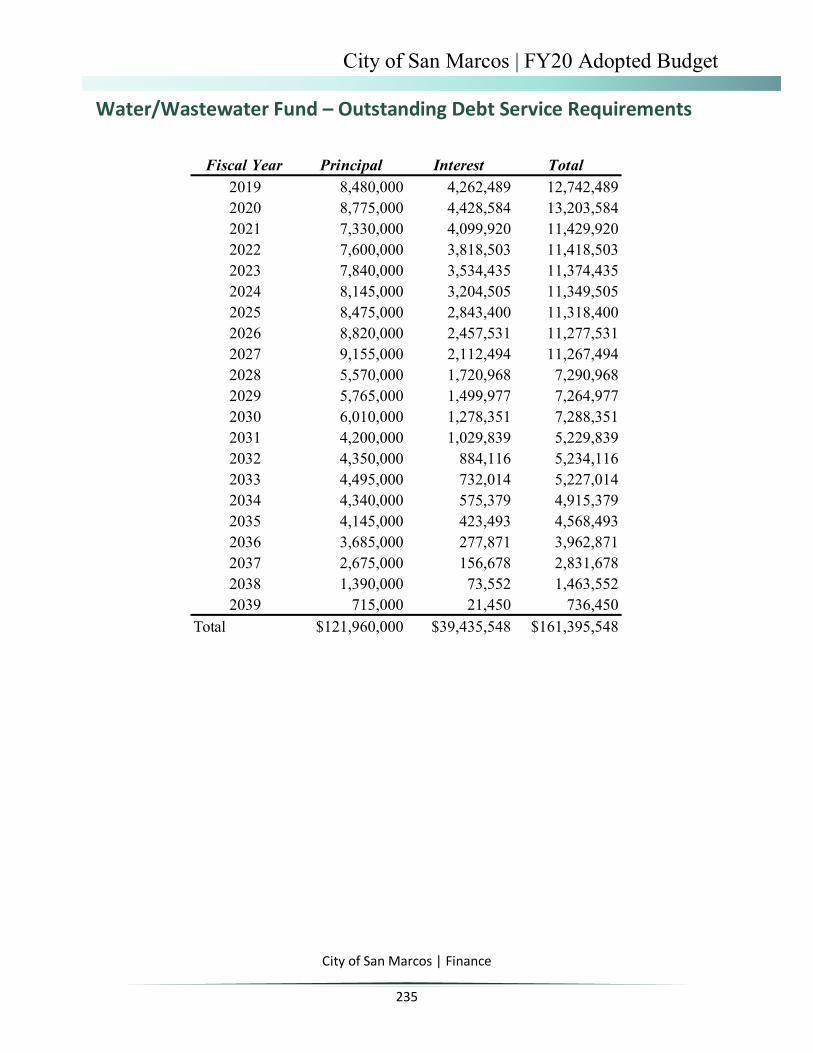
City of San Marcos | FY20 Adopted Budget
City of San Marcos | Finance
235
Water/Wastewater Fund – Outstanding Debt Service Requirements
Fiscal Year Principal Interest Total2019 8,480,000 4,262,489 12,742,4892020 8,775,000 4,428,584 13,203,5842021 7,330,000 4,099,920 11,429,9202022 7,600,000 3,818,503 11,418,5032023 7,840,000 3,534,435 11,374,4352024 8,145,000 3,204,505 11,349,5052025 8,475,000 2,843,400 11,318,4002026 8,820,000 2,457,531 11,277,5312027 9,155,000 2,112,494 11,267,4942028 5,570,000 1,720,968 7,290,9682029 5,765,000 1,499,977 7,264,9772030 6,010,000 1,278,351 7,288,3512031 4,200,000 1,029,839 5,229,8392032 4,350,000 884,116 5,234,1162033 4,495,000 732,014 5,227,0142034 4,340,000 575,379 4,915,3792035 4,145,000 423,493 4,568,4932036 3,685,000 277,871 3,962,8712037 2,675,000 156,678 2,831,6782038 1,390,000 73,552 1,463,5522039 715,000 21,450 736,450
Total $121,960,000 $39,435,548 $161,395,548

City of San Marcos | FY20 Adopted Budget
City of San Marcos | Finance
236
Water/Wastewater Utility Fund – Personnel Roster
Positions Full Time EquivalentActual Adopted Actual Adopted Actual Adopted Actual Adopted
Water/Wastewater Utility Fund 2017-18 2018-19 2018-19 2019-20 2017-18 2018-19 2018-19 2019-20Wastewater Collection 19 19 19 19 19.00 19.00 19.00 19.00Water Quality 8 8 8 9 8.00 8.00 8.00 9.00Water Distribution 30 32 32 36 30.00 32.00 32.00 36.00Water/Wastewater Conservation 1 1 1 1 1.00 1.00 1.00 1.00Water/Wastewater Administration 5 5 5 5 5.21 5.21 5.21 5.21
Total 63 65 65 70 63.21 65.21 65.21 70.21

WATER & WASTEWATER

City of San Marcos | FY20 Adopted Budget
City of San Marcos | Finance
238
DEPARTMENT SUMMARY | Water/WastewaterStrategic Initiative
Mission Statement
Goals Objective Performance Measure FY19 FY20 FY21System inspection & cleaning
Linear feet inspected
120,890 150,000 150000Reduce sewer chokes Completed work orders 41 35 30Lift station repair & maintenance
Completed work orders884 750 750
Perform leak detection on 1/4 of system annually
Leak detection report
100% 100% 100%Maintain & replace fire hydrants
Completed work orders375 350 350
Maintain & repair valves Completed work orders 139 150 150Compliance monitoring for industrial and commercial customers
Inspections conducted & reports filed
389 400 400Water distribution system monitoring for regulatory compliance
Samples taken & analyzed
6400 6500 6500
Administer and maintain compliance with all federal, state, and local regulations in regards to water and wastewater.
The Public Services Water/Wastewater Division's mission is to provide reliable water and wastewater services for our residents and visitors. These services are vital to the health and safety of our citizens and the economic strength of our community. The people of the Water/Wastewater Division are committed to the operation and maintenance of the City's infrastructure to deliver these services in the most efficient and cost-effective means possible.
Operate and maintain an effective and efficient wastewater collection system.
Provide safe, reliable drinking water through effective operation and maintenance of the water distribution system.

City of San Marcos | FY20 Adopted Budget
City of San Marcos | Finance
239
Wastewater Collection
Expenses by Category
Water Quality Services
Expenses by Category
Positions Full Time EquivalentWater/Wastewater Actual Adopted Actual Adopted Actual Adopted Actual AdoptedCollection 2017-18 2018-19 2018-19 2019-20 2017-18 2018-19 2018-19 2019-20WWW Collection Manager 1 1 1 1 1.00 1.00 1.00 1.00WWW Maintenance Crew Leader 3 3 3 3 3.00 3.00 3.00 3.00WWW Equipment Operator II 4 4 4 7 4.00 4.00 4.00 7.00WWW Equipment Operator I 11 11 11 8 11.00 11.00 11.00 8.00
Total 19 19 19 19 19.00 19.00 19.00 19.00
Actual Approved Estimated Adopted2017/2018 2018/2019 2018/2019 2019/2020
Wastewater CollectionPersonnel Services 1,322,148 1,325,857 1,325,857 1,429,778 Contracted Services 61,034 84,150 84,150 94,150 Materials and Supplies 367,376 462,174 462,174 460,696 Other Charges 41,557 37,397 37,397 42,397 Capital Outlay 177,157 113,000 113,000 165,000
Total 1,969,272 2,022,578 2,022,578 2,192,021
Positions Full Time EquivalentWater/Wastewater Actual Adopted Actual Adopted Actual Adopted Actual AdoptedQuality 2017-18 2018-19 2018-19 2019-20 2017-18 2018-19 2018-19 2019-20Water Quality Services Manager 1 1 1 1 1.00 1.00 1.00 1.00Water Quality Crew Leader 1 1 1 1 1.00 1.00 1.00 1.00Water Quality Technician 5 5 5 6 5.00 5.00 5.00 6.00Administrative Clerk 1 1 1 1 1.00 1.00 1.00 1.00
Total 8 8 8 9 8.00 8.00 8.00 9.00
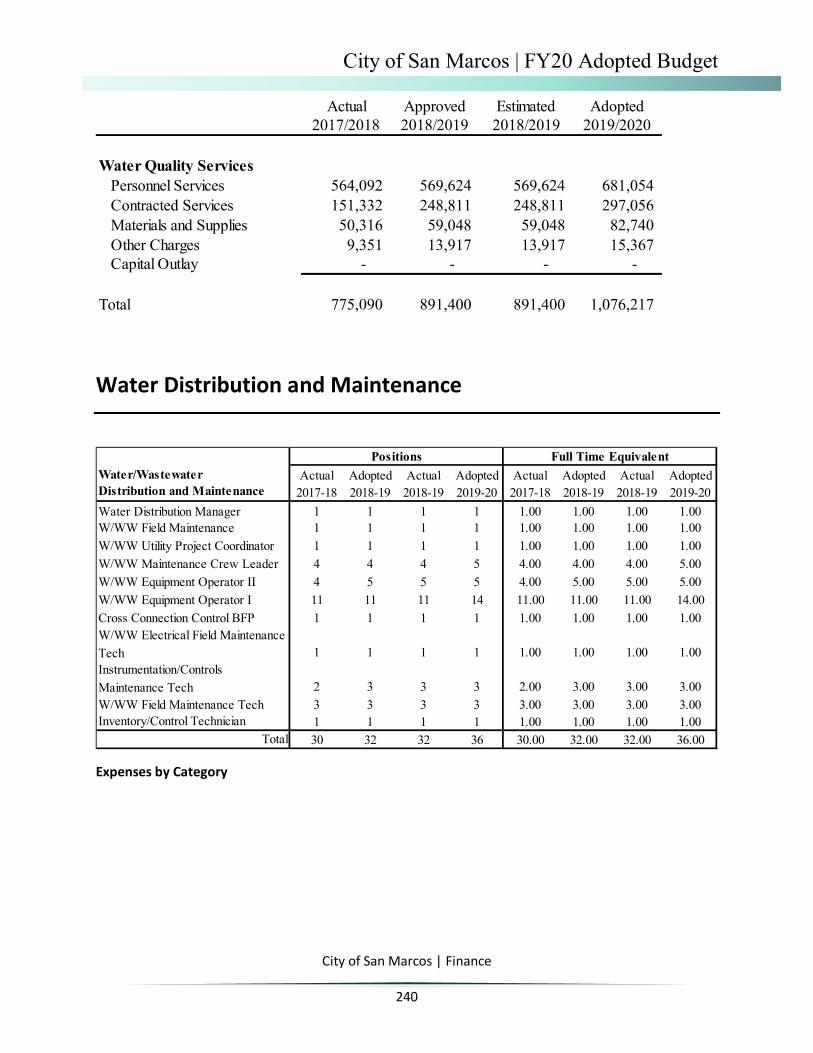
City of San Marcos | FY20 Adopted Budget
City of San Marcos | Finance
240
Water Distribution and Maintenance
Expenses by Category
Actual Approved Estimated Adopted2017/2018 2018/2019 2018/2019 2019/2020
Water Quality ServicesPersonnel Services 564,092 569,624 569,624 681,054 Contracted Services 151,332 248,811 248,811 297,056 Materials and Supplies 50,316 59,048 59,048 82,740 Other Charges 9,351 13,917 13,917 15,367 Capital Outlay - - - -
Total 775,090 891,400 891,400 1,076,217
Positions Full Time EquivalentWater/Wastewater Actual Adopted Actual Adopted Actual Adopted Actual AdoptedDistribution and Maintenance 2017-18 2018-19 2018-19 2019-20 2017-18 2018-19 2018-19 2019-20Water Distribution Manager 1 1 1 1 1.00 1.00 1.00 1.00W/WW Field Maintenance 1 1 1 1 1.00 1.00 1.00 1.00W/WW Utility Project Coordinator 1 1 1 1 1.00 1.00 1.00 1.00W/WW Maintenance Crew Leader 4 4 4 5 4.00 4.00 4.00 5.00W/WW Equipment Operator II 4 5 5 5 4.00 5.00 5.00 5.00W/WW Equipment Operator I 11 11 11 14 11.00 11.00 11.00 14.00Cross Connection Control BFP 1 1 1 1 1.00 1.00 1.00 1.00W/WW Electrical Field Maintenance Tech 1 1 1 1 1.00 1.00 1.00 1.00Instrumentation/Controls Maintenance Tech 2 3 3 3 2.00 3.00 3.00 3.00W/WW Field Maintenance Tech 3 3 3 3 3.00 3.00 3.00 3.00Inventory/Control Technician 1 1 1 1 1.00 1.00 1.00 1.00
Total 30 32 32 36 30.00 32.00 32.00 36.00

City of San Marcos | FY20 Adopted Budget
City of San Marcos | Finance
241
Water Conservation
Expenses by Category
Administration
Actual Approved Estimated Adopted2017/2018 2018/2019 2018/2019 2019/2020
Water Distribution MaintenancePersonnel Services 2,156,280 2,286,684 2,286,684 2,633,391 Contracted Services 116,734 210,053 210,053 210,053 Materials and Supplies 619,687 864,506 864,506 879,529 Other Charges 37,488 58,170 58,170 62,520 Capital Outlay 161,047 180,000 180,000 25,000
Total 3,091,236 3,599,412 3,599,412 3,810,493
Positions Full Time EquivalentWater/Wastewater Actual Adopted Actual Adopted Actual Adopted Actual AdoptedConservation 2017-18 2018-19 2018-19 2019-20 2017-18 2018-19 2018-19 2019-20
Conservation Coordinator 0.5 0.5 0.5 0.5 0.50 0.50 0.50 0.50Public Services Conservation 0.5 0.5 0.5 0.5 0.50 0.50 0.50 0.50
Total 1 1 1 1 1.00 1.00 1.00 1.00
Actual Approved Estimated Adopted2017/2018 2018/2019 2018/2019 2019/2020
Water ConservationPersonnel Services 88,728 91,059 91,059 95,159 Contracted Services 11,383 95,006 95,006 95,006 Materials and Supplies 19,191 21,000 21,000 21,000 Other Charges 385 2,307 2,307 2,307 Capital Outlay - - - -
Total 119,686 209,372 209,372 213,472

City of San Marcos | FY20 Adopted Budget
City of San Marcos | Finance
242
Expenses by Category
Special Services
Department Organization
The Special Services Division is used to account for a variety of non-direct expenses. Examples of expenses include utilities, insurance, bank charges and operating transfers.
Expenses by Category
Positions Full Time EquivalentWater/Wastewater Actual Adopted Actual Adopted Actual Adopted Actual AdoptedAdministration 2017-18 2018-19 2018-19 2019-20 2017-18 2018-19 2018-19 2019-20
Assistant Director of Public Services 1 1 1 1 1.00 1.00 1.00 1.00Technology Specialist / GIS 1 1 1 1 1.00 1.00 1.00 1.00Public Services Support Specialist 1 1 1 1 1.00 1.00 1.00 1.00Arborist 0 0 0 0 0.33 0.33 0.33 0.33Administrative Coordinator 1 1 1 1 1.00 1.00 1.00 1.00Administrative Clerk 1 1 1 1 0.88 0.88 0.88 0.88
Total 5 5 5 5 5.21 5.21 5.21 5.21
Actual Approved Estimated Adopted2017/2018 2018/2019 2018/2019 2019/2020
Water/Wastewater AdministrationPersonnel Services 480,982 614,250 614,250 504,811 Contracted Services 117,209 242,851 242,851 225,701 Materials and Supplies 11,926 27,090 27,090 65,423 Other Charges 23,339 20,405 20,405 20,405 Capital Outlay 65,857 - - -
Total 699,312 904,597 904,597 816,340

City of San Marcos | FY20 Adopted Budget
City of San Marcos | Finance
243
Actual Approved Estimated Adopted2017/2018 2018/2019 2018/2019 2019/2020
Special ServicesPersonnel Services 4,096 118,836 27,956 10,000 Contracted Services 8,539,401 10,117,653 9,917,653 10,547,443 Materials and Supplies 209 11,000 11,000 11,000 Other Charges 7,102,853 6,376,992 6,276,992 6,932,376 Franchise Fee 3,033,673 3,251,541 3,251,541 3,251,541
Operating / Administrative Transfer 69,856 137,607 137,607 161,514 Capital Outlay 50,000 50,000 50,000 50,000 Transfer to Capital Reserves 2,600,000 1,800,000 1,400,000 2,193,928 Rate Stablization Fund - - - -
Total 21,400,088 21,863,629 21,072,749 23,157,802

City of San Marcos | FY20 Adopted Budget
City of San Marcos | Finance
244
Stormwater Utility Fund – Financial Forecast
FY 2019 FY 2020 FY 2021 FY 2022 FY 2023
Operating RevenuesInterest Income 15,628 16,000 16,000 16,000 16,000 Drainage Service Revenue 4,876,080 5,746,009 6,837,751 8,136,923 9,682,939 Charges from Other Services 78,487 87,762 89,842 89,784 89,637 Other Revenue 35,723 1,000 - - -
Total Operating Revenues 5,005,918 5,850,771 6,943,593 8,242,708 9,788,576 Operating Expenses
Personnel Services 649,945 744,087 1,265,039 1,328,291 1,394,705 Contracted Services 760,324 1,092,749 1,196,517 1,256,343 1,319,160 Materials and Supplies 104,497 142,525 181,805 190,895 200,440 Other Charges 280,275 327,594 353,527 371,203 389,764 Debt Service 2,447,829 3,125,650 3,469,118 3,244,206 4,990,624
Total Operating Expenses 4,242,870 5,432,604 6,466,005 6,390,938 8,294,693
Operating Income / (Loss) 763,049 418,167 477,588 1,851,769 1,493,883
One-Time ExpensesCapital Outlay 41,947 - 330,000 150,000 150,000 One-Time Operating Transfers 600,000 - 10,822 11,038 11,259 Prior Period Adjustment - - - - -
Net Change in Fund Balance 121,102 418,167 136,766 1,690,731 1,332,624 Beginning Unreserved Fund Balance 943,439 1,064,541 1,482,708 1,619,473 3,310,204
Ending Unreserved Fund Balance 1,064,541 1,482,708 1,619,473 3,310,204 4,642,828
Percentage of Operating Expenses 25.1% 27.3% 25.0% 51.8% 56.0%
Days of Operation 92 100 91 189 204

City of San Marcos | FY20 Adopted Budget
City of San Marcos | Finance
245
Stormwater Utility Fund Summary
g
Actual Approved Revised Adopted2017/2018 2018/2019 2018/2019 2019/2020
Beginning Unreserved Fund Balance 943,439 1,064,541 1,064,541 1,482,708
Operating Revenues
Interest Income 15,628 5,000 16,000 16,000 Drainage Utility Fee 4,876,080 5,750,325 5,746,009 6,837,751 Penalties 37,527 41,321 47,619 49,048 Other Revenue 35,723 - 1,000 - Build America Subsidy 40,960 42,274 40,143 40,795
Total Operating Revenues 5,005,918 5,838,920 5,850,771 6,943,593
Total Funds Available 5,949,357 6,903,461 6,915,312 8,426,301
Operating Expenses
Personnel Services 649,945 794,087 744,087 1,265,039 Contracted Services 760,324 1,162,749 1,092,749 1,196,517 Materials and Supplies 104,497 142,525 142,525 181,805 Other Charges 280,275 327,594 327,594 353,527 Debt Service 2,447,829 3,125,650 3,125,650 3,469,118
Total Operating Expenses 4,242,870 5,552,604 5,432,604 6,466,005
One-Time ExpensesCapital Outlay 41,947 - - 330,000 Operating Transfer 600,000 - - 10,822
Total One-Time Expenses 641,947 - - 340,822
Reserved Fund Balance -
Ending Unreserved Fund Balance 1,064,541 1,350,857 1,482,708 1,619,473
Fund Balance as a Percentage of Total Expenses 25.09% 24.33% 27.29% 25.05%
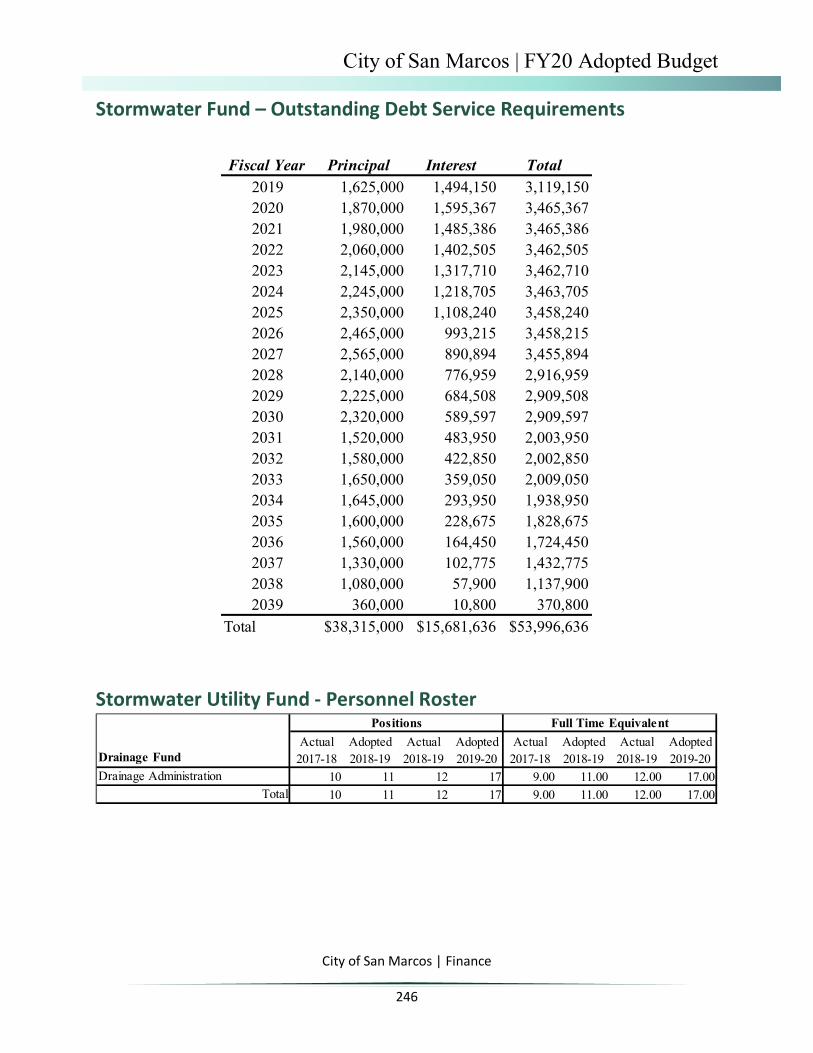
City of San Marcos | FY20 Adopted Budget
City of San Marcos | Finance
246
Stormwater Fund – Outstanding Debt Service Requirements
Stormwater Utility Fund - Personnel Roster
Fiscal Year Principal Interest Total2019 1,625,000 1,494,150 3,119,1502020 1,870,000 1,595,367 3,465,3672021 1,980,000 1,485,386 3,465,3862022 2,060,000 1,402,505 3,462,5052023 2,145,000 1,317,710 3,462,7102024 2,245,000 1,218,705 3,463,7052025 2,350,000 1,108,240 3,458,2402026 2,465,000 993,215 3,458,2152027 2,565,000 890,894 3,455,8942028 2,140,000 776,959 2,916,9592029 2,225,000 684,508 2,909,5082030 2,320,000 589,597 2,909,5972031 1,520,000 483,950 2,003,9502032 1,580,000 422,850 2,002,8502033 1,650,000 359,050 2,009,0502034 1,645,000 293,950 1,938,9502035 1,600,000 228,675 1,828,6752036 1,560,000 164,450 1,724,4502037 1,330,000 102,775 1,432,7752038 1,080,000 57,900 1,137,9002039 360,000 10,800 370,800
Total $38,315,000 $15,681,636 $53,996,636
Positions Full Time EquivalentActual Adopted Actual Adopted Actual Adopted Actual Adopted
Drainage Fund 2017-18 2018-19 2018-19 2019-20 2017-18 2018-19 2018-19 2019-20Drainage Administration 10 11 12 17 9.00 11.00 12.00 17.00
Total 10 11 12 17 9.00 11.00 12.00 17.00

City of San Marcos | FY20 Adopted Budget
City of San Marcos | Finance
247
Stormwater
Expenses by Category
Positions Full Time Equivalent
Actual Adopted Actual Adopted Actual Adopted Actual AdoptedStormwater Management 2017-18 2018-19 2018-19 2019-20 2017-18 2018-19 2018-19 2019-20Stormwater Systems Manager 1 1 1 1 1.00 1.00 1.00 1.00Drainage Maint. Crew Leader 1 1 2 3 1.00 1.00 2.00 3.00Stormwater Coordinator 1 1 1 1 1.00 1.00 1.00 1.00Project Engineer 1 1 1 1 0.00 1.00 1.00 1.00Drainage Maint. Equipment Operator I 4 4 4 6 4.00 4.00 4.00 6.00Drainage Maint. Equipment Operator II 2 3 3 4 2.00 3.00 3.00 4.00Stormwater Technician 0 0 0 1 0.00 0.00 0.00 1.00
Total 10 11 12 17 9.00 11.00 12.00 17.00
Actual Approved Estimated Adopted2017/2018 2018/2019 2018/2019 2019/2020
Drainage Operations Personnel Services 652,783 794,087 744,087 1,265,039 Contracted Services 47,123 214,996 214,996 214,996 Materials and Supplies 104,436 142,525 142,525 181,805 Other Charges 8,461 14,500 14,500 22,770 Capital Outlay 41,947 - - 330,000
Total 854,751 1,166,107 1,116,107 2,014,610

City of San Marcos | FY20 Adopted Budget
City of San Marcos | Finance
248
Special Services
Expenses by Category
DEPARTMENT SUMMARY | STORMWATERStrategic Initiative
Mission Statement
Goals Objective Performance Measure FY19 FY20 FY21Increase and enhance pedestrian safety at street crossings and school zones
Install new or improve existing to ADA-compliant accessible pedestrian crossings 40 EA 40 EA 40 EA
Keep roadways and bike lanes clear of debris
Regularly maintain street sweeping of each city streets 2 sweeps
per street
3 sweeps
per street
3 sweeps
per street
Keep roadways and bike lanes free of drainage ponding or flooding
Regularly clean storm sewers and drainage channels
10,000 LF 10,000 LF 10,000 LF
Improve transportation system safety
Execute City Council’s vision and goals by providing top quality, professional, effective, and timely drainage and right-of-way operation and maintenance services to residents, businesses and internal customers.
Actual Approved Estimated Adopted2017/2018 2018/2019 2018/2019 2019/2020
Drainage Special Services Personnel Services (2,839) - - - Contracted Services 713,201 947,753 877,753 981,521 Materials and Supplies 61 - - - Other Charges 271,813 313,094 313,094 330,757 Operation Transfers 600,000 - - 10,822
Total 1,582,237 1,260,847 1,190,847 1,323,100
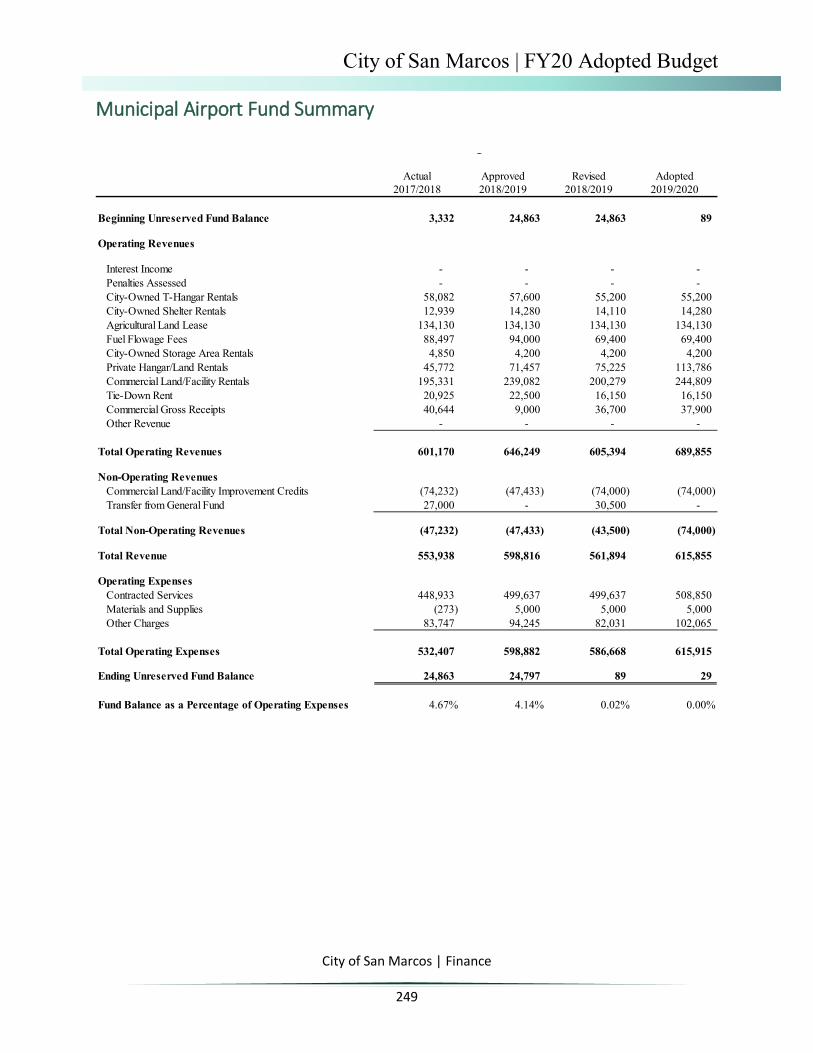
City of San Marcos | FY20 Adopted Budget
City of San Marcos | Finance
249
Municipal Airport Fund Summary
g
Actual Approved Revised Adopted2017/2018 2018/2019 2018/2019 2019/2020
Beginning Unreserved Fund Balance 3,332 24,863 24,863 89
Operating Revenues
Interest Income - - - - Penalties Assessed - - - - City-Owned T-Hangar Rentals 58,082 57,600 55,200 55,200 City-Owned Shelter Rentals 12,939 14,280 14,110 14,280 Agricultural Land Lease 134,130 134,130 134,130 134,130 Fuel Flowage Fees 88,497 94,000 69,400 69,400 City-Owned Storage Area Rentals 4,850 4,200 4,200 4,200 Private Hangar/Land Rentals 45,772 71,457 75,225 113,786 Commercial Land/Facility Rentals 195,331 239,082 200,279 244,809 Tie-Down Rent 20,925 22,500 16,150 16,150 Commercial Gross Receipts 40,644 9,000 36,700 37,900 Other Revenue - - - -
Total Operating Revenues 601,170 646,249 605,394 689,855
Non-Operating RevenuesCommercial Land/Facility Improvement Credits (74,232) (47,433) (74,000) (74,000) Transfer from General Fund 27,000 - 30,500 -
Total Non-Operating Revenues (47,232) (47,433) (43,500) (74,000)
Total Revenue 553,938 598,816 561,894 615,855
Operating ExpensesContracted Services 448,933 499,637 499,637 508,850 Materials and Supplies (273) 5,000 5,000 5,000 Other Charges 83,747 94,245 82,031 102,065
Total Operating Expenses 532,407 598,882 586,668 615,915
Ending Unreserved Fund Balance 24,863 24,797 89 29
Fund Balance as a Percentage of Operating Expenses 4.67% 4.14% 0.02% 0.00%

City of San Marcos | FY20 Adopted Budget
City of San Marcos | Finance
250
Airport
Mission Statement
The San Marcos Municipal Airport provides for the aviation needs of the citizens of San Marcos and the regional community. The Administration of the Airport includes maintaining and improving the physical facilities, ensuring compliance with applicable Federal standards and rules, establishing and enforcing good airport operating practices, marketing, lease negotiation, and planning for short and long range needs of the Airport.
Expenses by Category
Actual Approved Estimated Adopted2017/2018 2018/2019 2018/2019 2019/2020
AirportPersonnel ServicesContracted Services 448,933 499,637 499,637 508,850 Materials and Supplies (273) 5,000 5,000 5,000 Other Charges 83,747 94,245 82,031 102,065
Total Operating Expenses 532,407 598,882 586,668 615,915

City of San Marcos | FY20 Adopted Budget
City of San Marcos | Finance
251
Resource Recovery Utility Fund Summary
g
Actual Approved Revised Adopted2017/2018 2018/2019 2018/2019 2019/2020
Beginning Fund Balance - Reserved and Unreserved 1,265,562 1,527,239 1,527,239 1,482,806
Operating Revenues
Residential Garbage Collection Fee 2,748,199 2,969,223 2,982,902 3,307,944 Penalties 70,561 72,486 72,662 79,069 Recycling Collection Fee 1,381,051 1,316,024 1,291,303 1,366,416 Other Revenue 58,355 55,000 55,000 55,000
Total Operating Revenue 4,258,166 4,412,733 4,401,867 4,808,429
Operating Expenses
Personnel Services 291,021 363,566 363,566 403,946 Contracted Services 3,476,721 3,783,545 3,808,955 4,078,562 Materials and Supplies 21,548 27,000 27,000 27,000 Other Charges 207,200 264,778 236,778 284,089
Total Operating Expenses 3,996,489 4,438,889 4,436,299 4,793,597
Capital Improvemements - - 10,000 -
Total Expenses 3,996,489 4,438,889 4,446,299 4,793,597
Ending Unreserved Fund Balance 1,527,239 1,501,083 1,482,806 1,497,638

City of San Marcos | FY20 Adopted Budget
City of San Marcos | Finance
252
Resource Recovery
Expenses by Category
Positions Full Time EquivalentActual Adopted Actual Adopted Actual Adopted Actual Adopted
Resource Recovery 2017-18 2018-19 2018-19 2019-20 2017-18 2018-19 2018-19 2019-20Asst Director - Fleet, Transit, Resource Recovery 0 0 0 0 0.00 0.00 0.00 0.00Director Neighborhood Enhancement 0 0 0 0 0.25 0.25 0.25 0.25Community Enhancement Mngr 1 1 1 1 1.00 1.00 1.00 1.00Resource Recovery Coordinator 1 1 1 2 1.00 1.00 1.00 2.00Resource Recovery Specialist 1 1 1 0 1.00 1.00 1.00 0.00Community Enhancement Specialist 1 1 1 1 1.00 1.00 1.00 1.00Intern 0 3 3 3 0.00 0.96 0.96 0.96
Total 4 7 7 7 4.25 5.21 5.21 5.21

City of San Marcos | FY20 Adopted Budget
City of San Marcos | Finance
253
DEPARTMENT SUMMARY | RESOURCE RECOVERYStrategic Initiative
Mission Statement
Goals Objective Performance Measure FY19 FY20 FY21Relocate the Household Hazardous Waste (HHW) Drop Off Facility and add offices for the Resource Recovery division.
Design a facility in anticipation of the growth of the HHW program
Procure contract and complete design
0% 30% 100%
Standardize all trash and recycling containers in City facilities
Procure containers and deliver to City facilities 0% 100% 100%
Train all City staff on the proper use of the various containers
Provide orientation and training to staff in each City facility
0% 100% 100%
To manage the solid waste services in San Marcos by providing an integrated solid waste system that is responsive to the City's vision and growth by adding programs to help increase landfill diversion. It includes the Keep San Marcos Beautiful Program to educate and engage San Marcos citizens to take responsbility for improving our community environment through litter prevention, beautification, waste reduction and sustainability.
Provide resources and training for all City offices and employees to increase landfill diversion and minimize contamination in City facilities.
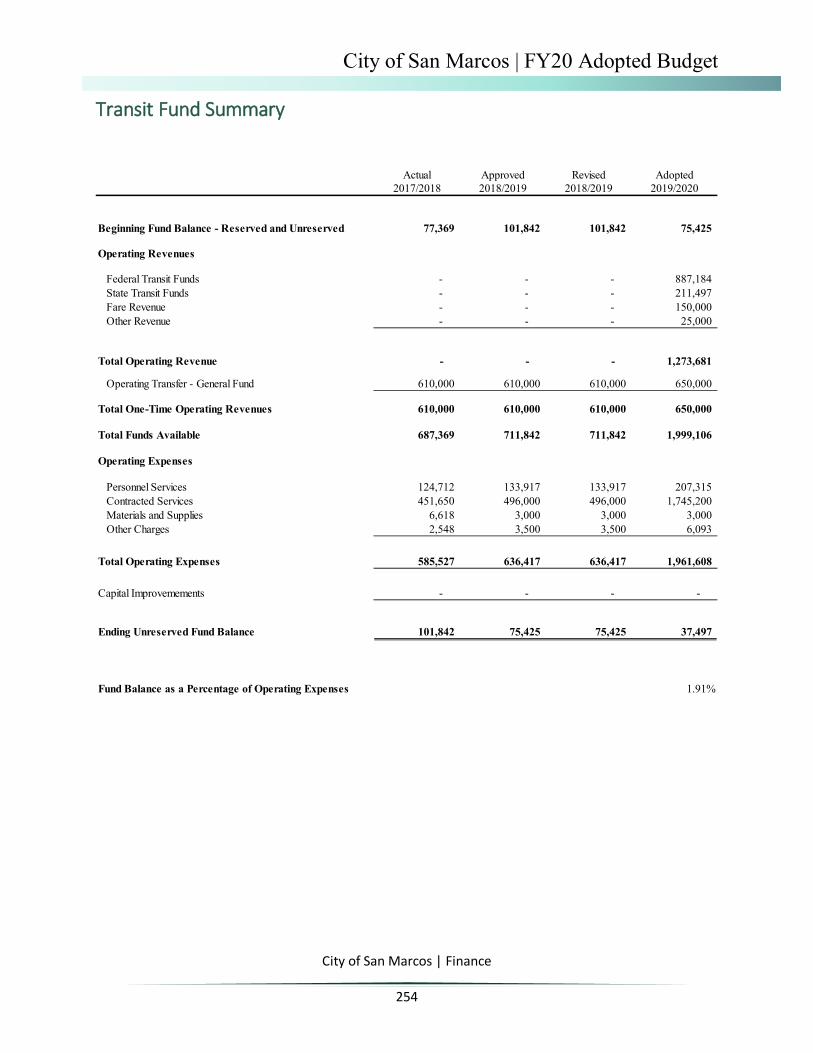
City of San Marcos | FY20 Adopted Budget
City of San Marcos | Finance
254
Transit Fund Summary
Actual Approved Revised Adopted2017/2018 2018/2019 2018/2019 2019/2020
Beginning Fund Balance - Reserved and Unreserved 77,369 101,842 101,842 75,425
Operating Revenues
Federal Transit Funds - - - 887,184 State Transit Funds - - - 211,497 Fare Revenue - - - 150,000 Other Revenue - - - 25,000
Total Operating Revenue - - - 1,273,681
Operating Transfer - General Fund 610,000 610,000 610,000 650,000
Total One-Time Operating Revenues 610,000 610,000 610,000 650,000
Total Funds Available 687,369 711,842 711,842 1,999,106
Operating Expenses
Personnel Services 124,712 133,917 133,917 207,315 Contracted Services 451,650 496,000 496,000 1,745,200 Materials and Supplies 6,618 3,000 3,000 3,000 Other Charges 2,548 3,500 3,500 6,093
Total Operating Expenses 585,527 636,417 636,417 1,961,608
Capital Improvemements - - - -
Ending Unreserved Fund Balance 101,842 75,425 75,425 37,497
Fund Balance as a Percentage of Operating Expenses 1.91%

City of San Marcos | FY20 Adopted Budget
City of San Marcos | Finance
255
Transit
Expenses by Category
Positions Full Time EquivalentActual Adopted Actual Adopted Actual Adopted Actual Adopted
Transit 2017-18 2018-19 2018-19 2019-20 2017-18 2018-19 2018-19 2019-20Asst Director - Fleet, Transit, Resource Recovery 0 0 0 0 0.33 0.33 0.33 0.33Transit Support Specialist 0 0 0 1 0.00 0.00 0.00 1.00Transit Manager 0 0 1 1 0.00 0.00 1.00 1.00GIS Transit Analyst 1 1 0 0 1.00 1.00 0.00 0.00
Total 1 1 1 2 1.33 1.33 1.33 2.33
Actual Approved Estimated Adopted2017/2018 2018/2019 2018/2019 2019/2020
TransitPersonnel Services 124,712 133,917 133,917 207,315 Contracted Services 451,650 496,000 496,000 1,745,200 Materials and Supplies 6,618 3,000 3,000 3,000 Other Charges 2,548 3,500 3,500 6,093 Capital Outlay - - - -
Total Operating Expenses 585,527 636,417 636,417 1,961,608
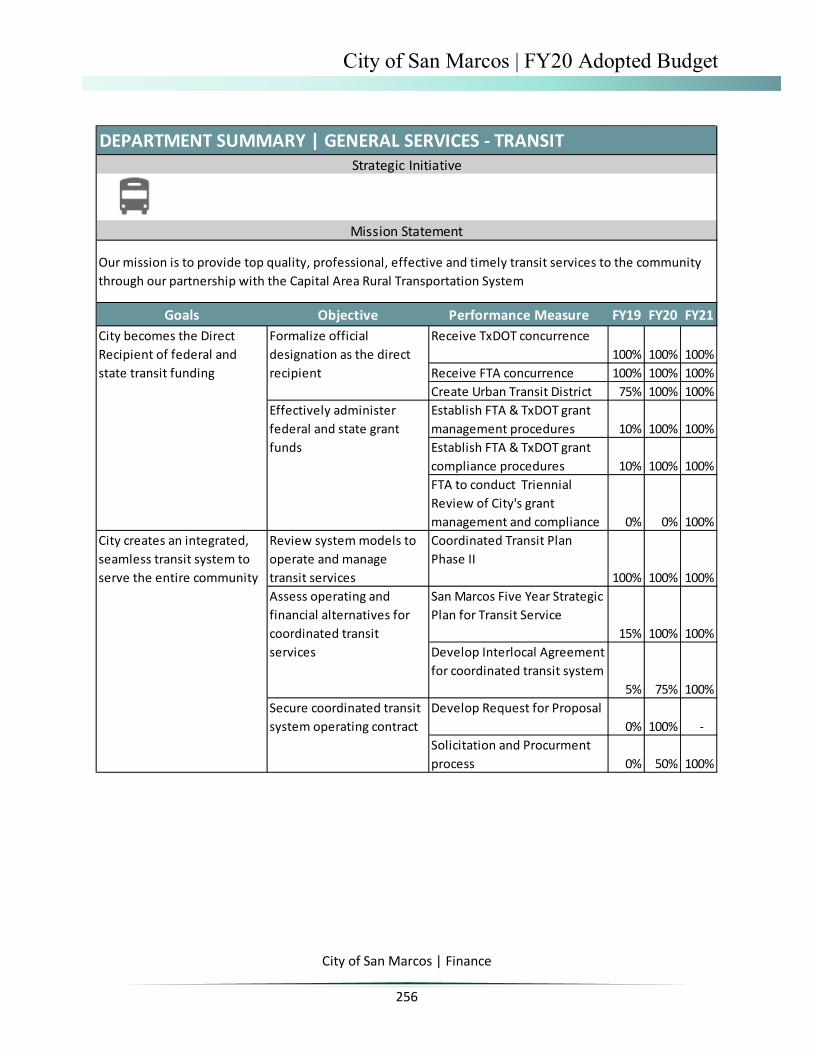
City of San Marcos | FY20 Adopted Budget
City of San Marcos | Finance
256
DEPARTMENT SUMMARY | GENERAL SERVICES - TRANSITStrategic Initiative
Mission Statement
Goals Objective Performance Measure FY19 FY20 FY21Receive TxDOT concurrence
100% 100% 100%Receive FTA concurrence 100% 100% 100%Create Urban Transit District 75% 100% 100%Establish FTA & TxDOT grant management procedures 10% 100% 100%Establish FTA & TxDOT grant compliance procedures 10% 100% 100%FTA to conduct Triennial Review of City's grant management and compliance 0% 0% 100%
Review system models to operate and manage transit services
Coordinated Transit Plan Phase II
100% 100% 100%San Marcos Five Year Strategic Plan for Transit Service
15% 100% 100%Develop Interlocal Agreement for coordinated transit system
5% 75% 100%Develop Request for Proposal
0% 100% - Solicitation and Procurment process 0% 50% 100%
Our mission is to provide top quality, professional, effective and timely transit services to the community through our partnership with the Capital Area Rural Transportation System
Formalize official designation as the direct recipient
City becomes the Direct Recipient of federal and state transit funding
Effectively administer federal and state grant funds
City creates an integrated, seamless transit system to serve the entire community
Assess operating and financial alternatives for coordinated transit services
Secure coordinated transit system operating contract
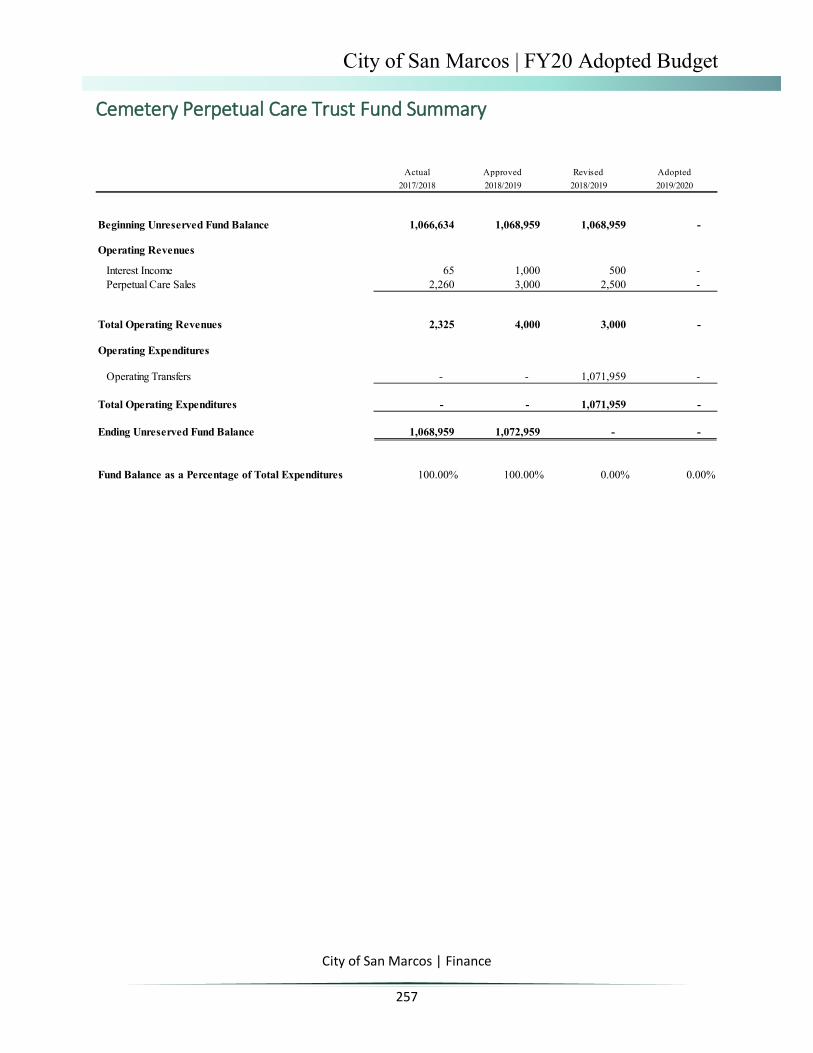
City of San Marcos | FY20 Adopted Budget
City of San Marcos | Finance
257
Cemetery Perpetual Care Trust Fund Summary
Actual Approved Revised Adopted2017/2018 2018/2019 2018/2019 2019/2020
Beginning Unreserved Fund Balance 1,066,634 1,068,959 1,068,959 -
Operating Revenues
Interest Income 65 1,000 500 - Perpetual Care Sales 2,260 3,000 2,500 -
Total Operating Revenues 2,325 4,000 3,000 -
Operating Expenditures
Operating Transfers - - 1,071,959 -
Total Operating Expenditures - - 1,071,959 -
Ending Unreserved Fund Balance 1,068,959 1,072,959 - -
Fund Balance as a Percentage of Total Expenditures 100.00% 100.00% 0.00% 0.00%

City of San Marcos | FY20 Adopted Budget
City of San Marcos | Finance
258
Capital Summary
Capital Improvements Program
Section 7.02 of the San Marcos City Charter requires the Planning and Zoning Commission to submit annually to the City Council, not less than 120 days prior to the beginning of the fiscal year, a list of recommended capital improvements found necessary or desirable. In accordance with the city’s commitment to best business practices, and pursuant to the charter requirement, the city has established an on-going ten-year Capital Improvements Program (CIP) to plan for capital expenditures and identify funding sources for these projects.
The CIP is a budgetary tool for community decision-makers and suggests a variety of possible project funding sources, ranging from operating budgets, state and federal grants, to future voter approved bond programs. The CIP also suggests the particular year in which projects might be authorized. Since the first year of each CIP cycle is predominately adopted as part of the upcoming fiscal year’s expenditures, it is important that the list of first year projects accurately reflects the goals and priorities of the City Council and the capacity of the city to provide the funding. The nine subsequent years in the document are utilized for planning purposes only.
A CIP project generally involves a capital expenditure of public funds, beyond maintenance and operating cost, for the acquisition, construction or improvement of a needed physical facility.
CIP Process
February - City Council Budget Workshop. The City Council adopts a budget policy statement that includes their priorities for the upcoming fiscal year.
February / March - Meeting is held with the Council of Neighborhood Associations to kick-off the Capital Improvements Plan process. The purpose of the meeting is to report on the status of the current CIP and to solicit ideas and suggestions for new projects. All suggestions are compiled and distributed to appropriate city personnel for evaluation and possible inclusion in the upcoming CIP.
March / April - Department Heads prepare their project submittals for inclusion in the CIP. Project Input Forms are compiled by the Planning and Development Services Department and the draft CIP is assembled.

City of San Marcos | FY20 Adopted Budget
City of San Marcos | Finance
259
April - The Administrative Review Committee reviews the draft CIP. This committee consists of the City Manager, Deputy City Manager, and the Directors of Finance and Planning and Development Services. The purpose of this review is to evaluate project proposals, coordinate the timing of projects, review funding proposals.
May - Planning and Zoning Commission review. Workshops are held to discuss project proposals and public hearings are held to solicit participation and comments.
June - City Council receives CIP recommendation and incorporates year one into the upcoming budget development process.
City Council Priorities
Each year the CIP reflects the priorities established by the City Council in their budget policy statement. Past CIP’s have indicated a strong City Council commitment to upgrading and building the city’s water and wastewater systems, and building new facilities to provide better services to the public. Projects such as the new surface water treatment plant reduced the city’s dependence on underground water from the Edwards Aquifer. The reconstruction and upgrading of the wastewater treatment plant increased the capacity of the facility and improved the quality of the discharge into the San Marcos River. These and other projects, such as the construction of a new library, fire station, and activity center, were all CIP projects that evolved from a conceptual stage to the fully funded and ready to be bid stage in the first year of the CIP.
The Capital Improvements Program for Fiscal Years 2018 to 2027 recognizes City Council priorities and demonstrates a commitment to address the growth-related challenges facing the community. Growth issues, the economy, and the quality of life of the citizens are all impacted by the effectiveness of the city’s thoroughfare system, and the CIP reflects a focus of future financial resources toward street and drainage projects.
Funding Sources
A variety of funding sources are identified in the CIP. Time constraints, previous commitments, voter approvals, revenues, and fund balances can determine which of the various sources is most appropriate for a particular project. The following definitions were utilized to determine the project funding recommendations contained in the CIP:

City of San Marcos | FY20 Adopted Budget
City of San Marcos | Finance
260
General Obligation Bonds (GO’s) – Bonds that finance a variety of public projects such as streets, buildings, and capital improvements. GO’s are backed by the full faith and credit of the government entity and are repaid through assessment of a property tax levy. GO’s are issued only after receiving voter approval.
Certificates of Obligation (CO’s) – Debt instruments used to finance capital improvement projects. CO’s are backed by the full faith and credit of the government entity and are fully payable from a property tax levy. CO’s differ from GO’s in that they are approved by the City Council and are not voter approved.
Revenue Bond – Bonds whose principal and interest are payable exclusively from user fees. Revenue bonds are backed by the full faith and credit of the government entity.
General Fund – The general operating fund of the City. It is used to account for all financial resources except those required to be accounted for in another fund. The General Fund is used as a funding source for projects related to streets, public buildings, parks, and other capital improvements for the general use of the citizenry.
Electric Utility Fund – The fund used to account for operations financed through the sale of electricity. The Electric Utility Fund is used as a funding source for projects related to the electric distribution system.
Water/Wastewater Utility Fund – The fund used to account for operations financed through the sale of water and wastewater treatment. The Water/Wastewater Utility Fund is used as a funding source for projects related to the water and wastewater system.
Grants – Contributions or gifts of cash or other assets from another governmental agency or foundation to be used for a specific purpose, activity or facility.
Operating Budget Impact
The Capital Improvements Program is primarily funded through the issuance of general obligation bonds, revenue bonds, certificates of obligation and grants from external agencies. Funding through annual budget appropriations is rare and used for smaller projects that can be completed within a fiscal year or shortly thereafter. The majority of projects within the CIP are for infrastructure construction, reconstruction and improvements. The operational impact of these projects is minimal other than incorporating those projects into ongoing maintenance and upkeep with other infrastructure assets. Those projects that will affect operation budgets are identified and quantified.

City of San Marcos | FY20 Adopted Budget
City of San Marcos | Finance
261
The first year of the CIP is funded through the issuance of debt. The corresponding principal and interest payments are budgeted within the respective fund. Other than debt service payments, there are no other budgeted amounts for operations unless specifically identified. It is rare that a CIP will cause a significant increase in operational expenses. Most operational budgets are increased because of other factors. Although conceptually a physical improvement should reduce operational expenses for repair, the likelihood is that the operational expense will remain budgeted for other needed repair expenses. The anticipated operational impacts are:
Project Estimated Annual Impact Library Expansion $400,000 Fire Station #8 $1,400,000
Operational impacts for CIP projects listed in years two through ten are estimates and will not impact the adopted budget. These future operational impacts are for planning purposes only and are used to evaluate whether a project receives appropriation.

City of San Marcos | FY20 Adopted Budget
City of San Marcos | Finance
262
Project Name FY 2020 FY 2021 FY 2022 FY 2023 FY 2024 FY 2025 - 2029 Total City 10 Year Cost
General Fund $ 16,915,000 $12,636,666 $ 9,359,000 $28,655,000 $26,226,000 $ 77,380,000 $ 171,171,666
Airport - City Facilities 100,000 100,000
Airport Hanger Project 70,000 70,000
Airport - Routine Maintenance Grant Match 50,000 50,000 100,000
Airport - Runway 17-35 Extension 100,000 1,000,000 1,100,000
Airport - WWII Tower and Electric Vault relocation 150,000 385,000 535,000
Activity Center Splash Pad/Playground 150,000 500,000 650,000
Blanco River Village City Park 200,000 200,000
Boy Scout Hut Rehab 100,000 100,000
Children's Park Parking Lot 150,000 850,000 1,000,000
City Facilities HVAC Replacement 250,000 250,000 250,000 250,000 250,000 1,250,000
City Facility Parking Lots 150,000 150,000 150,000 450,000
City Facility Renovations 450,000 300,000 300,000 300,000 300,000 1,500,000 3,150,000
City Park - ADA Playground 750,000 750,000
Dog Park 75,000 500,000 575,000
Dunbar Education Building Rehab 25,000 75,000 250,000 350,000Gary Softball Complex Renovation- Existing Fields Ph 1. 600,000 600,000
Gary Softball Complex Renovation Ph 2. 2,000,000 2,000,000
Library Expansion & Renovation 6,750,000 6,750,000
Nature Center 3,050,000 3,050,000
PARD Maintenance Facility 300,000 300,000
Parks - ADA Access to River 500,000 500,000
Park Development of Undeveloped Park Land 500,000 500,000 500,000 500,000 2,000,000
Purgatory Creek Preserve Park - Trail Head 1,500,000 1,500,000
Regional Tennis Center 400,000 4,000,000 4,400,000
River Parks ADA Restroom Imps 600,000 600,000 600,000 1,200,000 3,000,000
San Marcos Youth Baseball Complex 9,900,000 9,900,000
Senior Citizens Center 2,550,000 2,550,000
Sheltered Bus Stops 80,000 80,000 160,000
Spray Pads East side/West Side 100,000 400,000 400,000 900,000
Arts District to enhance performing and visual space 100,000 100,000

City of San Marcos | FY20 Adopted Budget
City of San Marcos | Finance
263
Project Name FY 2020 FY 2021 FY 2022 FY 2023 FY 2024 FY 2025 - 2029 Total City 10 Year Cost
General Fund - continued
Airport - FM 110 Connection Drive 1,000,000 1,000,000
Bugg Lane Alley 35,000 100,000 135,000
Cemetery Land Acquisition 700,000 225,000 400,000 1,325,000
Cheatham Street Sidewalks 20,000 200,000 220,000
Craddock/Bishop Intersection Imps 50,000 450,000 500,000
Ed JL Green Sidewalk 140,000 140,000
North, Hutchison and Mary St. Roundabout 450,000 450,000
SH 21 San Marcos River Bridge Prel Eng. Rpt 200,000 200,000
Transportation Master Plan 400,000 400,000 800,000
Transportation Oversize 100,000 100,000 100,000 100,000 100,000 400,000 900,000
UPRR Quiet Zone - Uhland Rd. Quad Gates 850,000 850,000Fire Department Replacement Brush Truck #2 (52-319) 250,000 250,000
Fire Department Replacement Engine (52-614) 785,000 785,000
Fire Department Replacement Ladder Truck (52-300) 250,000 250,000Fire Department New Station - Highpoint/Trace Station #6 4,500,000 4,500,000
Fire Department New Station - Hwy 80/SH 21 1,000,000 6,100,000 7,100,000
Fire Department New Engine - Hwy 80/SH 21 800,000 800,000
Fire Department New Station - Outlet Mall 7,500,000 7,500,000
Fire Department New Ladder Truck - Outlet Mall 1,500,000 1,500,000
Fire Department Training Airport Facility 2,000,000 2,000,000
Fire Station #2 Demolition 63,000 63,000
Fire Station #2 - New Road 300,000 300,000
Fire Station #5 Parking Lot Expansion 25,000 150,000 175,000
Fire Station #1 Remodel 200,000 900,000 900,000 2,000,000
Fire Station #3 Remodel 100,000 900,000 1,000,000
Airport - Taxiway System, Ramp Rehab Design 600,000 600,000 1,200,000
Belvin Street Improvements 600,000 600,000
Bishop Sidewalk Imps - Franklin to Prospect 225,000 980,000 1,205,000
Bishop Street Improvements 550,000 550,000
Chestnut Street Improvements 375,000 1,230,000 1,605,000
Comprehensive Plan 100,000 100,000
Critical Facility Security 50,000 50,000 50,000 50,000 200,000
Disaster Recovery Infrastructure 166,666 166,666

City of San Marcos | FY20 Adopted Budget
City of San Marcos | Finance
264
Project Name FY 2020 FY 2021 FY 2022 FY 2023 FY 2024 FY 2025 - 2029 Total City 10 Year Cost
General Fund - continued
E. Aquarena Springs Drive Reconstruction 25,000 500,000 525,000
Ed JL Green Dr Imps 220,000 580,000 800,000
Fiber Optic Infrastructure Expansions 80,000 80,000 80,000 80,000 80,000 34,000 434,000
Heritage Neighborhood Imps 400,000 2,000,000 2,400,000Hopkins Drainage and Wastewater Imps from Riverside to City Hall 200,000 700,000 900,000
Hwy 123 12" Water AC Line Replacement 300,000 300,000
Kingwood and Sherwood Imps 70,000 700,000 770,000
Linda Drive Improvements 1,000,000 1,000,000
Long Street Realignment 800,000 800,000
MLK Street Reconstruction 450,000 2,100,000 2,550,000
Mockingbird Hills Subdivision Imps 750,000 4,000,000 4,750,000Network Cabling Infrastructure for City Facilities - Bond 300,000 300,000
Old RR12/Moore Street Reconstruction 2,450,000 2,450,000Pat Garrison Improvements from Comanche to Guadalupe 75,000 750,000 825,000
Public Svs/Comm Svs Complex - Fleet and FF&E 1,100,000 1,100,000
Purgatory Creek Improvements Ph 2 1,800,000 1,710,000 660,000 4,170,000
Ramsay St. Reconstruction 150,000 700,000 850,000
River Ridge Extension to Post Road 9,500,000 9,500,000
Sessom/Academy Intersection Improvements 250,000 250,000
Sessom Shared Use Path from N LBJ to Comanche 230,000 2,200,000 2,430,000
Shady, Valley, Gravel Utility Improvements 300,000 300,000
Stagecoach Road Extension 1,860,000 1,860,000
Staples Rd 12" Water Line 100,000 100,000
Storage Area Network (SAN) replacement - IT 200,000 200,000
Strategic Land Acquisition 250,000 250,000
Sunset Acres Subdivision Study 1,500,000 1,500,000
Telephone System and Replacement 100,000 100,000Victory Gardens Neighborhood Improvements Ph. II - South Section 400,000 3,000,000 3,400,000
Wallace Addition Subdivision 6,750,000 6,750,000Hopkins Street Improvements Project from Moore to Guadalupe 350,000 200,000 3,500,000 4,050,000
Old Ranch Road 12 Bike & Ped & Widening Project 2,900,000 2,900,000
Purgatory Creek Improvements Ph 1 1,750,000 6,105,000 7,855,000
Downtown Alley Reconstruction 60,000 300,000 200,000 560,000

City of San Marcos | FY20 Adopted Budget
City of San Marcos | Finance
265
Project Name FY 2020 FY 2021 FY 2022 FY 2023 FY 2024 FY 2025 - 2029 Total City 10 Year Cost
General Fund - continuedDowntown Pedestrian Safety & Comfort Improvements 200,000 200,000 200,000 600,000Downtown Reconstruction Ph. II - LBJ: Grove St. to Hopkins 540,000 5,300,000 5,840,000
Animal Shelter - Long Term Imps 75,000 750,000 5,500,000 6,325,000
Animal Shelter - Short Term Imps 400,000 400,000
Household Hazardous Waste Renovations 50,000 700,000 750,000
Public Safety Mobile Video Technology 600,000 700,000 1,300,000Traffic Signal Synchronization and Improvement Project 125,000 226,000 106,000 111,000 568,000
Water Fund $ 8,930,000 $41,325,000 $16,255,000 $18,296,000 $ 8,755,000 $ 40,855,000 $ 134,416,000
Airport - Utilities & Stormwater Imps 140,000 1,400,000 1,540,000
AMI Generation 2 Upgrade 1,079,000 1,079,000
Asset Management System Development 25,000 25,000
Belvin Street Improvements 1,600,000 1,600,000
Bishop Street Improvements 1,000,000 1,000,000
Briarwood and River Ridge Imps 300,000 300,000
Chestnut Street Improvements 150,000 500,000 650,000
Comprehensive Plan 100,000 100,000 200,000
Critical Facility Security 50,000 50,000 50,000 50,000 200,000
Downtown Alley Reconstruction 30,000 240,000 120,000 390,000Downtown Reconstruction Ph. II - LBJ: Grove St. to Hopkins 100,000 1,000,000 1,100,000
Dunbar Utility Imps 500,000 2,200,000 2,700,000
Ed JL Green Dr Imps 25,000 60,000 85,000
Heritage Neighborhood Imps 280,000 1,400,000 1,680,000Hopkins Street Improvements Project from Moore to Guadalupe 130,000 1,300,000 1,430,000
Hwy 123 12" Water AC Line Replacement 2,500,000 2,500,000
IH-35 Utility Relocations 50,000 800,000 200,000 500,000 1,550,000
Kingwood and Sherwood Imps 20,000 200,000 220,000
Linda Drive Improvements 700,000 700,000
MLK Street Reconstruction 165,000 825,000 990,000
Mockingbird Hills Subdivision Imps 250,000 1,200,000 1,450,000Network Cabling Infrastructure for City Facilities - Bond 75,000 75,000
Old Ranch Road 12 Bike & Ped & Widening Project 1,100,000 1,100,000Pat Garrison Improvements from Comanche to Guadalupe 25,000 250,000 275,000
Public Svs/Comm Svs Complex - Fleet and FF&E 250,000 250,000

City of San Marcos | FY20 Adopted Budget
City of San Marcos | Finance
266
Project Name FY 2020 FY 2021 FY 2022 FY 2023 FY 2024 FY 2025 - 2029 Total City 10 Year Cost
Water Fund - continued
Purgatory Creek Improvements Ph 1 121,000 850,000 971,000
Purgatory Creek Improvements Ph 2 81,000 415,000 496,000
Ramsay St. Reconstruction 100,000 515,000 615,000
Ridgeway Hillcrest Drainage Improvements 50,000 50,000
Sessom/Academy Intersection Improvements 200,000 200,000
Sessom Creek Restoration - Phase 2 150,000 150,000
Shady, Valley, Gravel Utility Improvements 150,000 500,000 650,000
Stagecoach Road Extension 745,000 745,000
Storage Area Network (SAN) replacement - IT 200,000 200,000
Strategic Land Acquisition 250,000 250,000
Sunset Acres Subdivision Study 1,850,000 1,850,000
Surface Water Treatment Plant Access 560,000 560,000
Telephone System and Replacement 100,000 100,000Victory Gardens Neighborhood Improvements Ph. II - South Section 200,000 1,500,000 1,700,000
Wallace Addition Subdivision 1,310,000 1,310,000
ARWA Delivery Improvements 4,000,000 4,000,000
Centerpoint Rd 12" Water Main Extension 1,500,000 1,500,000
Cheatham Water Line Guadalupe to CM Allen 75,000 350,000 425,000
Clovis Barker Water Line 1,100,000 1,100,000
Comanche Tank 100,000 6,000,000 6,100,000
Comanche Pump Station Improvements 50,000 250,000 300,000Comanche Pump Station to Old Ranch Road 12 Water Line 1,000,000 1,000,000
Deerwood Water Improvements 650,000 2,500,000 3,150,000
Harris Hill Rd Water Line 150,000 1,150,000 1,300,000
Hopkins Water Line Replacement - LBJ to CM Allen 100,000 400,000 500,000Hunter Water Main Extension from Harmons Way to H&H Industrial Park 300,000 1,300,000 1,600,000
Hwy 21 Water 500,000 2,500,000 3,000,000
Hwy 80 Water Line 250,000 2,000,000 2,250,000
IH 35 Water McCarty-Centerpoint 1,800,000 1,800,000IH 35S Water Improvements - Clovis Barker south across creek 500,000 500,000IH 35S Water Wonder World to Clovis Barker and Civic 125,000 1,700,000 1,825,000
Lazy Lane Water Improvements 325,000 1,600,000 1,925,000
Long St. Waterline Crossing 700,000 700,000

City of San Marcos | FY20 Adopted Budget
City of San Marcos | Finance
267
Project Name FY 2020 FY 2021 FY 2022 FY 2023 FY 2024 FY 2025 - 2029 Total City 10 Year Cost
Water Fund - continued
Old Bastrop Hwy Posey to Francis Harris Water Line 825,000 825,000Old Bastrop Hwy Water Centerpoint to Horace Howard 200,000 850,000 1,050,000
Rattler Road Water Line Extension 100,000 800,000 900,000
Reclaimed Water System Expansion Ph. 2 7,100,000 7,100,000
Red Sky Water Improvements 1,100,000 1,100,000
Stagecoach to Bishop Water Line Extension 550,000 550,000
Stagecoach to Great Oaks Drive Water Line 2,100,000 2,100,000
Trails End Water Line Extension to Kissing Tree 40,000 400,000 440,000
Trunk Hill Pumps 2,500,000 2,500,000
Trunk Hill Tank 1,790,000 1,790,000
Trunk Hill to Lazy Lane Water Line 450,000 450,000
Undersized Water Main Replacements 150,000 1,000,000 1,150,000University Dr. Water replacement - CM Allen to Sessom 200,000 600,000 800,000
Water Improvements 150,000 150,000 150,000 150,000 150,000 750,000 1,500,000
Water Main Oversizing 150,000 150,000 150,000 450,000
Water Master Plan 500,000 500,000 1,000,000
Water Pump Station Improvements 150,000 150,000 150,000 150,000 150,000 750,000 1,500,000
Water Supply - ARWA 36,500,000 5,300,000 41,800,000
Water System Improvements 150,000 150,000 150,000 150,000 150,000 750,000 1,500,000
Wastewater Fund $ 13,531,000 $13,750,666 $ 9,810,000 $18,261,000 $ 7,205,000 $ 40,654,000 $ 103,211,666
Airport - Utilities & Stormwater Imps 140,000 1,400,000 1,540,000
Asset Management System Development 25,000 25,000
Belvin Street Improvements 750,000 750,000
Bishop Street Improvements 1,000,000 1,000,000
Chestnut Street Improvements 110,000 360,000 470,000
Disaster Recovery Infrastructure 166,666 166,666
Downtown Alley Reconstruction 30,000 240,000 120,000 390,000Downtown Reconstruction Ph. II - LBJ: Grove St. to Hopkins 100,000 1,000,000 1,100,000
Dunbar Utility Imps 500,000 2,200,000 2,700,000
Ed JL Green Dr Imps 85,000 415,000 500,000
Fiber Optic Infrastructure Expansions 80,000 80,000 80,000 80,000 80,000 34,000 434,000
Heritage Neighborhood Imps 240,000 1,200,000 1,440,000Hopkins Drainage and Wastewater Imps from Riverside to City Hall 20,000 100,000 120,000

City of San Marcos | FY20 Adopted Budget
City of San Marcos | Finance
268
Project Name FY 2020 FY 2021 FY 2022 FY 2023 FY 2024 FY 2025 - 2029 Total City 10 Year Cost
Wastewater Fund - continuedHopkins Street Improvements Project from Moore to Guadalupe 130,000 1,300,000 1,430,000
IH-35 Utility Relocations 250,000 100,000 250,000 600,000
Kingwood and Sherwood Imps 20,000 200,000 220,000
Linda Drive Improvements 1,500,000 1,500,000
Main Lift Station (LS #1) Replacement 750,000 5,000,000 5,750,000
MLK Street Reconstruction 165,000 825,000 990,000
Old Ranch Road 12 Bike & Ped & Widening Project 500,000 500,000Pat Garrison Improvements from Comanche to Guadalupe 10,000 100,000 110,000
Public Svs/Comm Svs Complex - Fleet and FF&E 250,000 250,000
Purgatory Creek Improvements Ph 1 121,000 850,000 971,000
Purgatory Creek Improvements Ph 2 81,000 415,000 496,000
Ramsay St. Reconstruction 25,000 115,000 140,000
Ridgeway Hillcrest Drainage Improvements 50,000 50,000Sessom Creek Bank Stabilization And Wastewater Replacement From N.LBJ to Canyon Road 300,000 300,000
Sessom Creek Restoration - Phase 2 300,000 1,400,000 1,700,000
Shady, Valley, Gravel Utility Improvements 350,000 1,800,000 2,150,000
Stagecoach Road Extension 745,000 745,000
Strategic Land Acquisition 250,000 250,000
Sunset Acres Subdivision Study 1,000,000 1,000,000
Telephone System and Replacement 100,000 100,000Victory Gardens Neighborhood Improvements Ph. II - South Section 200,000 1,500,000 1,700,000
Wallace Addition Subdivision 1,700,000 1,700,000
WWTP Electric Backup Feed 1,500,000 1,500,000
Airport 10-inch/12-inch Wastewater Main 500,000 2,000,000 2,500,000Blanco River Village Lift Station (LS #21) and City Softball Fields Lift Station (LS #47) Decommissioning 145,000 720,000 865,000
Browne Terrace Lift Station 20 Upsize 25,000 125,000 150,000
Browne Terrace Lift Station 20 Rehabilitation 50,000 50,000
Care Inn Wastewater Lift Station 5 100,000 100,000
East IH 35 WW Oversize 400,000 400,000
Gary Job Corp Lift Station (LS #46) Decommissioning 2,000,000 2,000,000
Gary Job Corp LS 46 Rehab 300,000 300,000Hemphill Creek 12-inch, 24-inch, 27-inch Wastewater Main 1,400,000 7,000,000 8,400,000
Highway 80/Davis Lane 18" Wastewater Rehab 2,000,000 2,000,000

City of San Marcos | FY20 Adopted Budget
City of San Marcos | Finance
269
Project Name FY 2020 FY 2021 FY 2022 FY 2023 FY 2024 FY 2025 - 2029 Total City 10 Year Cost
Wastewater Fund - continued
Highway 80 Lift Station Expansion 780,000 780,000
Highway 80 Lift Station and 12-Inch Force Main 5,000,000 5,000,000
IH 35 Ellis to Wonderworld WW Improvements 200,000 2,000,000 2,200,000
Midway Wastewater Imps 500,000 500,000
Posey Rd. Wastewater Extension 800,000 800,000Upper Blanco River 24-Inch Wastewater Transfer Interceptor 5,650,000 5,650,000
Wastewater Collection Improvements 150,000 150,000 150,000 150,000 150,000 750,000 1,500,000
Wastewater Improvements 150,000 150,000 150,000 150,000 150,000 750,000 1,500,000
Wastewater Lift Station Improvements 150,000 150,000 150,000 150,000 150,000 750,000 1,500,000
Wastewater Master Plan Update 400,000 400,000 800,000
Wastewater Oversizing 500,000 500,000West Purgatory Creek 18-inch Wastewater Interceptor 1,725,000 1,725,000
WWTP 4.0 MGD AADF Expansion 3,000,000 17,500,000 20,500,000
WWTP Misc. Improvements Ph 2 1,000,000 7,704,000 8,704,000
Stormwater Fund $ 3,775,000 $19,370,000 $16,010,000 $24,980,000 $14,086,000 $ 47,480,000 $ 125,701,000
Airport - Utilities & Stormwater Imps 140,000 1,400,000 1,540,000
Belvin Street Improvements 1,300,000 1,300,000
Bishop Sidewalk Imps - Franklin to Prospect 75,000 325,000 400,000
Bishop Street Improvements 3,900,000 3,900,000
Briarwood and River Ridge Imps 2,430,000 2,430,000
Chestnut Street Improvements 65,000 150,000 215,000
Downtown Alley Reconstruction 50,000 250,000 300,000Downtown Reconstruction Ph. II - LBJ: Grove St. to Hopkins 300,000 3,000,000 3,300,000
E. Aquarena Springs Drive Reconstruction 25,000 200,000 225,000
Ed JL Green Dr Imps 170,000 500,000 670,000
Heritage Neighborhood Imps 1,000,000 5,000,000 6,000,000Hopkins Drainage and Wastewater Imps from Riverside to City Hall 60,000 230,000 290,000Hopkins Street Improvements Project from Moore to Guadalupe 100,000 1,000,000 1,100,000
Hwy 123 12" Water AC Line Replacement 300,000 300,000
IH-35 Utility Relocations 2,500,000 2,500,000 200,000 500,000 5,700,000
Kingwood and Sherwood Imps 230,000 550,000 780,000
Linda Drive Improvements 1,400,000 1,400,000
Long Street Realignment 250,000 250,000

City of San Marcos | FY20 Adopted Budget
City of San Marcos | Finance
270
Project Name FY 2020 FY 2021 FY 2022 FY 2023 FY 2024 FY 2025 - 2029 Total City 10 Year Cost
Stormwater Fund - continued
MLK Street Reconstruction 30,000 50,000 80,000
Mockingbird Hills Subdivision Imps 70,000 350,000 420,000
Old Ranch Road 12 Bike & Ped & Widening Project 1,900,000 1,900,000
Old RR12/Moore Street Reconstruction 1,950,000 1,950,000Pat Garrison Improvements from Comanche to Guadalupe 70,000 700,000 770,000
Purgatory Creek Improvements Ph 1 1,275,000 900,000 12,300,000 14,475,000
Purgatory Creek Improvements Ph 2 3,100,000 1,710,000 11,950,000 16,760,000
Ramsay St. Reconstruction 50,000 400,000 450,000
Ridgeway Hillcrest Drainage Improvements 250,000 250,000
River Ridge Extension to Post Road 1,000,000 1,000,000
Sessom/Academy Intersection Improvements 100,000 100,000
Sessom Creek Restoration - Phase 2 200,000 200,000
Sessom Shared Use Path from N LBJ to Comanche 226,000 120,000 346,000
Shady, Valley, Gravel Utility Improvements 250,000 700,000 950,000
Stagecoach Road Extension 4,185,000 4,185,000
Sunset Acres Subdivision Study 4,000,000 4,000,000
Surface Water Treatment Plant Access 510,000 510,000
Telephone System and Replacement 100,000 100,000Victory Gardens Neighborhood Improvements Ph. II - South Section 300,000 2,000,000 2,300,000
Wallace Addition Subdivision 3,000,000 3,000,000
Castle Forest Channel 100,000 1,050,000 1,150,000
Cemetery/Franklin Stormwater Imps 250,000 900,000 1,150,000
Cottonwood Creek Detention Study 2,000,000 2,500,000 12,000,000 16,500,000Downtown SmartCode Water Quality Plan Implementation 100,000 100,000 100,000 100,000 400,000
Fairlawn Stormwater Imps 210,000 1,890,000 2,100,000
Girard/Earle Stormwater Improvements 50,000 200,000 250,000
Hills of Hays 3,000,000 3,000,000Land Acquisition for future detention/WQ/ Flood storage 500,000 500,000 1,000,000 2,000,000
Midtown Stormwater Ph. 2 100,000 1,250,000 1,350,000
McKie at Willow Springs Creek Bridge Replacement 900,000 900,000
Nance North Drainage Imps. 200,000 850,000 1,050,000
Rio Vista Stormwater Imps 70,000 610,000 680,000
Schulle Creek Culvert Imp 150,000 1,000,000 1,150,000

City of San Marcos | FY20 Adopted Budget
City of San Marcos | Finance
271
Project Name FY 2020 FY 2021 FY 2022 FY 2023 FY 2024 FY 2025 - 2029 Total City 10 Year Cost
Stormwater Fund - continued
Stormwater Master Plan Update 600,000 600,000 1,200,000
Stormwater System Improvements 120,000 120,000 120,000 120,000 120,000 600,000 1,200,000
UP Railroad Corridor 300,000 1,270,000 1,570,000
Various Stormwater Imps 230,000 250,000 200,000 680,000
Wallace Addition Offsite Drainage Imps 825,000 4,500,000 5,325,000
William Pettus Improvements 200,000 200,000
Electric Fund $ 15,761,247 $ 4,247,087 $ 3,422,702 $ 5,075,000 $ 5,860,000 $ 18,579,000 $ 52,945,036
AMI Generation 2 Upgrade 4,288,000 4,288,000
Belvin Street Improvements 100,000 100,000
Bishop Street Improvements 200,000 200,000
Chestnut Street Improvements 20,000 100,000 120,000
Comprehensive Plan 100,000 100,000 200,000
Critical Facility Security 50,000 50,000 50,000 50,000 200,000
Disaster Recovery Infrastructure 166,666 166,666
Downtown Alley Reconstruction 50,000 400,000 120,000 570,000Downtown Pedestrian Safety & Comfort Improvements 235,000 235,000 235,000 705,000Downtown Reconstruction Ph. II - LBJ: Grove St. to Hopkins 500,000 4,000,000 4,500,000
Ed JL Green Dr Imps 10,000 70,000 80,000
Fiber Optic Infrastructure Expansions 80,000 80,000 80,000 80,000 80,000 34,000 434,000
Heritage Neighborhood Imps 100,000 500,000 600,000Hopkins Drainage and Wastewater Imps from Riverside to City Hall 100,000 200,000 300,000
Hopkins Sidewalk Widening CM Allen to Thorpe 200,000 200,000Hopkins Street Improvements Project from Moore to Guadalupe 200,000 2,000,000 2,200,000
Hwy 123 12" Water AC Line Replacement 75,000 75,000
IH-35 Utility Relocations 100,000 250,000 100,000 250,000 700,000
Linda Drive Improvements 40,000 40,000
Long Street Realignment 100,000 100,000
Main Lift Station (LS #1) Replacement 25,000 25,000
Mockingbird Hills Subdivision Imps 300,000 1,500,000 1,800,000Network Cabling Infrastructure for City Facilities - Bond 75,000 75,000
Old Ranch Road 12 Bike & Ped & Widening Project 350,000 350,000
Old RR12/Moore Street Reconstruction 2,200,000 2,200,000Pat Garrison Improvements from Comanche to Guadalupe 50,000 2,500,000 2,550,000

City of San Marcos | FY20 Adopted Budget
City of San Marcos | Finance
272
Project Name FY 2020 FY 2021 FY 2022 FY 2023 FY 2024 FY 2025 - 2029 Total City 10 Year Cost
Electric Fund - continued
Public Svs/Comm Svs Complex - Fleet and FF&E 700,000 700,000
Purgatory Creek Improvements Ph 1 100,000 900,000 1,000,000
Sessom Shared Use Path from N LBJ to Comanche 230,000 550,000 780,000
Storage Area Network (SAN) replacement - IT 200,000 200,000
Strategic Land Acquisition 250,000 250,000
Telephone System and Replacement 100,000 100,000Victory Gardens Neighborhood Improvements Ph. II - South Section 200,000 3,000,000 3,200,000
WWTP Electric Backup Feed 4,500,000 4,500,000
Carlson Circle Streetlight Repair and Replace 210,000 210,000
Customer Extensions - New Service 478,247 485,421 492,702 1,456,370
Pole Replacement - CIP Projects 200,000 200,000 200,000 200,000 200,000 1,000,000 2,000,000
Pole Replacement - Elect Power poles 150,000 150,000 150,000 150,000 150,000 750,000 1,500,000
Power Transformer Monitoring 45,000 455,000 500,000
Rattler Electric Substation 2,000,000 2,000,000
SMEU Substation Feeder Breaker Upgrade 400,000 400,000
SMEU System Power Factor Improvement 150,000 150,000
Underground Electric Conversion 1,000,000 1,000,000 1,000,000 1,000,000 1,000,000 5,000,000 10,000,000
URD Cable Replacement 100,000 100,000 200,000
Ramsay St. Reconstruction 300,000 115,000 605,000 1,020,000
General Fund Total 16,915,000 12,636,666 9,359,000 28,655,000 26,226,000 77,380,000 171,171,666
Water Fund Total 8,930,000 41,325,000 16,255,000 18,296,000 8,755,000 40,855,000 134,416,000
Wastewater Fund Total 13,531,000 13,750,666 9,810,000 18,261,000 7,205,000 40,654,000 103,211,666
Stormwater Fund Total 3,775,000 19,370,000 16,010,000 24,980,000 14,086,000 47,480,000 125,701,000
Electric Fund Total 15,761,247 4,247,087 3,422,702 5,075,000 5,860,000 18,579,000 52,945,036
Grand Total All Funds $ 58,912,247 $91,329,419 $54,856,702 $95,267,000 $62,132,000 $ 224,948,000 $ 587,445,368

City of San Marcos | FY20 Adopted Budget
City of San Marcos | Finance
273

City of San Marcos | FY20 Adopted Budget
City of San Marcos | Finance
274
Water Rate – Schedule UW-1 (Urban Customers)
Applicable:
To any customer served through a single meter for water usage within the corporate limits of the
City. Service will be furnished under this rate schedule subject to the established rules and
regulations of the City covering this type of service.
Rate:
UW-1A: 5/8-3/4 Inch Water Meter:
Minimum Charge - $23.16
0 gallons to 6,000 gallons - $3.88 per 1,000 gallons of fraction thereof.
6,001 gallons to 9,000 gallons - $6.79 per 1,000 gallons or fraction thereof.
9,001 gallons to 12,000 gallons - $7.77 per 1,000 gallons or fraction thereof.
12,001 gallons to 20,000 gallons - $8.74 per 1,000 gallons or fraction thereof.
20,001 gallons to 50,000 gallons - $9.70 per 1,000 gallons or fraction thereof
Over 50,000 gallons - $11.64 per 1,000 gallons or fraction thereof.
UW-1B:1-Inch Water Meter:
Minimum Charge - $57.90
0 gallons to 4,000 gallons -$2.50 per 1,000 gallons or fraction thereof.
4,001 gallons to 10,000 gallons - $3.01 per 1,000 gallons or fraction thereof.
10,001 gallons to 25,000 gallons - $7.51 per 1,000 gallons or fraction thereof.
Over 25,000 gallons - $8.51 per 1,000 gallons or fraction thereof.
UW-1C: 1-1/2 Inch Water Meter:
Minimum Charge - $115.81
0 gallons to 8,000 gallons - $2.50 per 1,000 gallons or fraction thereof.
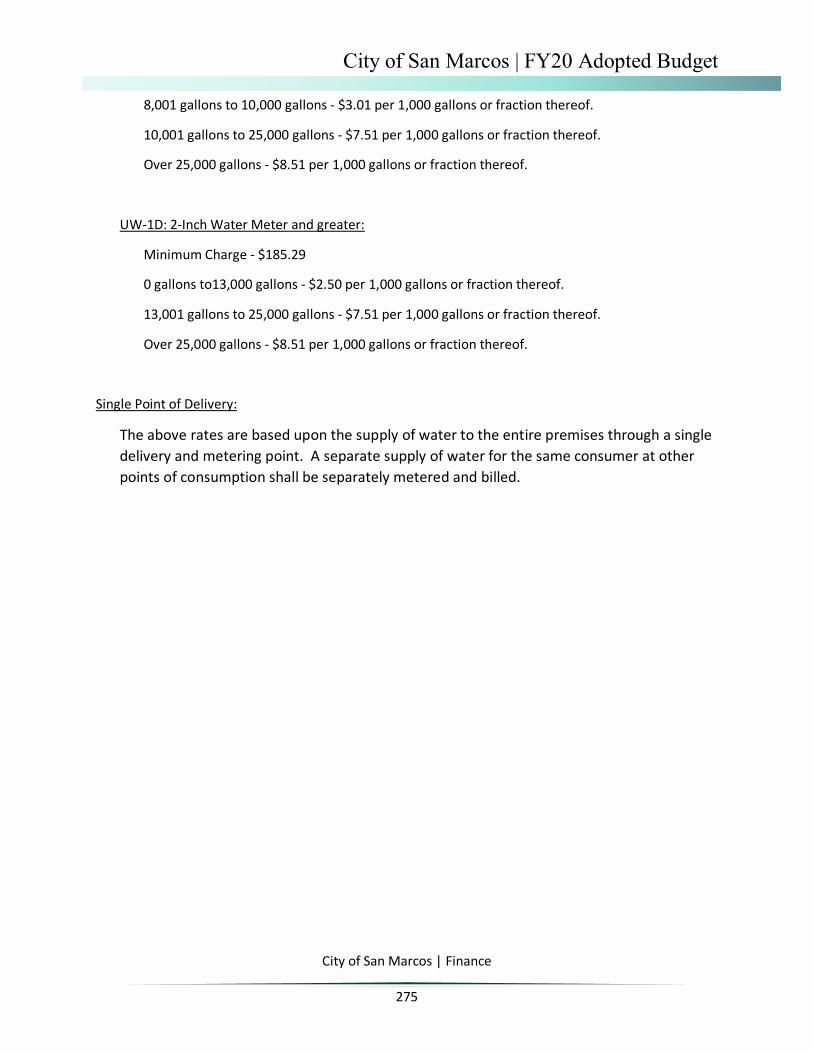
City of San Marcos | FY20 Adopted Budget
City of San Marcos | Finance
275
8,001 gallons to 10,000 gallons - $3.01 per 1,000 gallons or fraction thereof.
10,001 gallons to 25,000 gallons - $7.51 per 1,000 gallons or fraction thereof.
Over 25,000 gallons - $8.51 per 1,000 gallons or fraction thereof.
UW-1D: 2-Inch Water Meter and greater:
Minimum Charge - $185.29
0 gallons to13,000 gallons - $2.50 per 1,000 gallons or fraction thereof.
13,001 gallons to 25,000 gallons - $7.51 per 1,000 gallons or fraction thereof.
Over 25,000 gallons - $8.51 per 1,000 gallons or fraction thereof.
Single Point of Delivery:
The above rates are based upon the supply of water to the entire premises through a single delivery and metering point. A separate supply of water for the same consumer at other points of consumption shall be separately metered and billed.
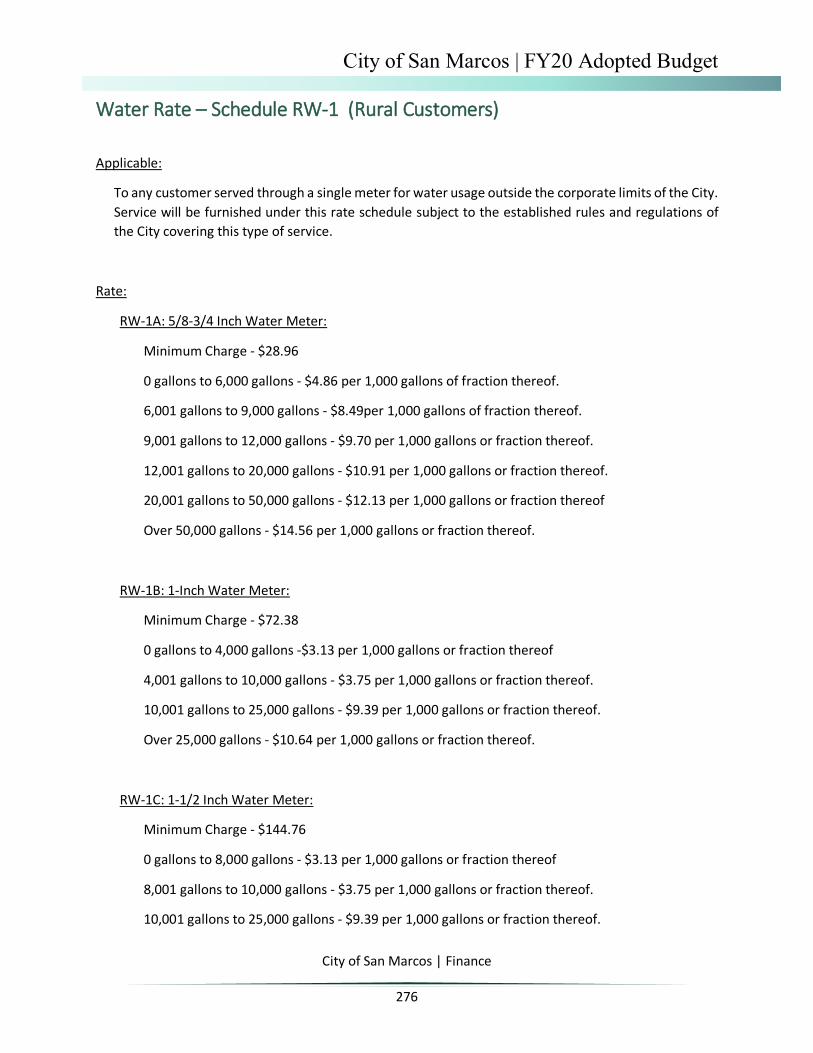
City of San Marcos | FY20 Adopted Budget
City of San Marcos | Finance
276
Water Rate – Schedule RW-1 (Rural Customers)
Applicable:
To any customer served through a single meter for water usage outside the corporate limits of the City. Service will be furnished under this rate schedule subject to the established rules and regulations of the City covering this type of service.
Rate:
RW-1A: 5/8-3/4 Inch Water Meter:
Minimum Charge - $28.96
0 gallons to 6,000 gallons - $4.86 per 1,000 gallons of fraction thereof.
6,001 gallons to 9,000 gallons - $8.49per 1,000 gallons of fraction thereof.
9,001 gallons to 12,000 gallons - $9.70 per 1,000 gallons or fraction thereof.
12,001 gallons to 20,000 gallons - $10.91 per 1,000 gallons or fraction thereof.
20,001 gallons to 50,000 gallons - $12.13 per 1,000 gallons or fraction thereof
Over 50,000 gallons - $14.56 per 1,000 gallons or fraction thereof.
RW-1B: 1-Inch Water Meter:
Minimum Charge - $72.38
0 gallons to 4,000 gallons -$3.13 per 1,000 gallons or fraction thereof
4,001 gallons to 10,000 gallons - $3.75 per 1,000 gallons or fraction thereof.
10,001 gallons to 25,000 gallons - $9.39 per 1,000 gallons or fraction thereof.
Over 25,000 gallons - $10.64 per 1,000 gallons or fraction thereof.
RW-1C: 1-1/2 Inch Water Meter:
Minimum Charge - $144.76
0 gallons to 8,000 gallons - $3.13 per 1,000 gallons or fraction thereof
8,001 gallons to 10,000 gallons - $3.75 per 1,000 gallons or fraction thereof.
10,001 gallons to 25,000 gallons - $9.39 per 1,000 gallons or fraction thereof.

City of San Marcos | FY20 Adopted Budget
City of San Marcos | Finance
277
Over 25,000 gallons - $10.64 per 1,000 gallons or fraction thereof.
RW-1D: 2-Inch Water Meter and greater:
Minimum Charge - $231.61
0 gallons to13,000 gallons - $3.13 per 1,000 gallons or fraction thereof
13,001 gallons to 25,000 gallons - $9.39 per 1,000 gallons or fraction thereof.
Over 25,000 gallons - $10.64 per 1,000 gallons or fraction thereof.
Single Point of Delivery:
The above rates are based upon the supply of water to the entire premises through a single delivery and metering point. A separate supply of water for the same consumer at other points of consumption shall be separately metered and billed.

City of San Marcos | FY20 Adopted Budget
City of San Marcos | Finance
278
Water Rate – Schedule LL-1 (Life Line Customers)
Applicable:
To any urban/rural customer who qualifies for financial assistance under the rules, regulations or guidelines promulgated by Community Action, Inc. of Hays, Caldwell and Blanco Counties.
LLW-1: 5/8 - 3/4 inch water meter (Urban)
First 6,000 gallons - Minimum Charge $23.16
6,001 gallons to 9,000 gallons - $6.79 per 1,000 gallons of fraction thereof.
9,001 gallons to 12,000 gallons - $7.77 per 1,000 gallons or fraction thereof.
12,001 gallons to 20,000 gallons - $8.74 per 1,000 gallons or fraction thereof.
20,001 gallons to 50,000 gallons - $9.70 per 1,000 gallons or fraction thereof
Over 50,000 gallons - $11.64 per 1,000 gallons or fraction thereof.
LLW-1: 5/8 - 3/4 inch water meter (Rural)
First 6,000 gallons - Minimum Charge $28.96
6,001 gallons to 9,000 gallons - $8.49 per 1,000 gallons of fraction thereof.
9,001 gallons to 12,000 gallons - $9.70 per 1,000 gallons or fraction thereof.
12,001 gallons to 20,000 gallons - $10.91 per 1,000 gallons or fraction thereof.
20,001 gallons to 50,000 gallons - $12.13 per 1,000 gallons or fraction thereof
Over 50,000 gallons - $14.56 per 1,000 gallons or fraction thereof.
All increments over 6,000 gallons to be billed at normal urban/rural customer rate.
Single Point of Delivery:
City of San Marcos | FY20 Adopted Budget
City of San Marcos | Finance
279
The above rates are based upon the supply of water to the entire premises through a single delivery and metering point. A separate supply of water for the same consumer at other points of consumption shall be separately metered and billed.

City of San Marcos | FY20 Adopted Budget
City of San Marcos | Finance
280
Wastewater Rate – Schedule US-1 (Urban Customers) Applicable:
To any customer using wastewater services and being served through a single water meter, unless wastewater is separately measured, and within the corporate limits of the City. Service will be furnished under this rate schedule subject to the established rules and regulations of the City covering this type of service.
Rate:
US-1A:5/8-3/4 Inch Water Meter:
First 2,000 gallons - $25.51 Minimum Bill.
Over 2,000 gallons - $7.36 per 1,000 gallons or fraction thereof.
US-1B: 1-Inch Water Meter:
First 4,000 gallons - $50.95 Minimum Bill.
Over 4,000 gallons - $7.36 per 1,000 gallons or fraction thereof.
US-1C: 1-1/2 Inch Water Meter:
First 8,000 gallons - $101.87 Minimum Bill.
Over 8,000 gallons - $7.36 per 1,000 gallons or fraction thereof.
US-1D: 2-Inch Water Meter and greater:
First 13,000 gallons - $163.02 Minimum Bill.
Over 13,000 gallons - $7.36 per 1,000 gallons or fraction thereof.
Maximum Bill:
No additional charge will be applied to a single-family Residential Customers for volumes in excess of 9,000 gallons for the US-1A, US-1B, US-1C rate categories.
Single Point of Delivery:
City of San Marcos | FY20 Adopted Budget
City of San Marcos | Finance
281
The above rates are based upon the supply of water to the entire premises through a single delivery and metering point. A separate supply of water for the same consumer at other points of consumption shall be separately metered and billed.
Optional Methodology for Measurement of Use by Industrial Users:
An industrial user that uses a 2-inch or larger meter may submit a written request for the use of a methodology to determine the amount of wastewater services used other than metering of water or wastewater use. The methodology must be designed to charge the user for actual wastewater service use, and is subject to approval by the Director of Water/ Wastewater Utility Operations. If approved, the methodology will be used for a period of three years, subject to renewal upon submission by the user of a renewal request accompanied by updated methodology information, and approval by the Director of Water/ Wastewater Utility Operations. For this purpose, “industrial user” is defined as a manufacturing or industrial operation.

City of San Marcos | FY20 Adopted Budget
City of San Marcos | Finance
282
Wastewater Rate – Schedule RS-1 (Rural Customers)
Applicable:
To any customer using wastewater services and being served through a single water meter, unless wastewater is separately measured, and within the corporate limits of the City. Service will be furnished under this rate schedule subject to the established rules and regulations of the City covering this type of service.
Rate:
RS-1A:5/8-3/4 Inch Water Meter:
First 2,000 gallons - $31.89 Minimum Bill.
Over 2,000 gallons - $9.18 per 1,000 gallons or fraction thereof.
RS-1B: 1-Inch Water Meter:
First 4,000 gallons - $63.67 Minimum Bill.
Over 4,000 gallons - $9.18 per 1,000 gallons or fraction thereof.
RS-1C: 1-1/2 Inch Water Meter:
First 8,000 gallons - $127.33 Minimum Bill.
Over 8,000 gallons - $9.18 per 1,000 gallons or fraction thereof.
RS-1D: 2-Inch Water Meter and greater:
First 13,000 gallons - $203.76 Minimum Bill.
Over 13,000 gallons - $9.18 per 1,000 gallons or fraction thereof.
Maximum Bill:
No additional charge will be applied to a single-family Residential Customers for volumes in excess of 9,000 gallons for the RS-1A, RS-1B, RS-1C rate categories.
Single Point of Delivery:

City of San Marcos | FY20 Adopted Budget
City of San Marcos | Finance
283
The above rates are based upon the supply of water to the entire premises through a single delivery and metering point. A separate supply of water for the same consumer at other points of consumption shall be separately metered and billed.
Optional Methodology for Measurement of Use by Industrial Users:
An industrial user that uses a 2-inch or larger meter may submit a written request for the use of a methodology to determine the amount of wastewater services used other than metering of water or wastewater use. The methodology must be designed to charge the user for actual wastewater service use, and is subject to approval by the Director of Water/ Wastewater Utility Operations. If approved, the methodology will be used for a period of three years, subject to renewal upon submission by the user of a renewal request accompanied by updated methodology information, and approval by the Director of Water/ Wastewater Utility Operations. For this purpose, “industrial user” is defined as a manufacturing or industrial operation.

City of San Marcos | FY20 Adopted Budget
City of San Marcos | Finance
284
Wastewater Rate – Schedule LL-1 (Life Line Customers)
Applicable:
To any urban/rural customer who qualifies for financial assistance under the rules, regulations or guidelines promulgated by Community Action, Incorporated of Hays, Caldwell and Blanco Counties.
Rate:
LLW-1: 5/8 - 3/4 inch water meter
Maximum bill - $25.51 (Urban)
Maximum bill - $31.89 (Rural)
Single Point of Delivery:
The above rates are based upon the supply of water to the entire premises through a single delivery and metering point. A separate supply of water for the same consumer at other points of consumption shall be separately metered and billed.

City of San Marcos | FY20 Adopted Budget
City of San Marcos | Finance
285
Sewer Surcharge Rate (Surcharge Participant List Customers)
Applicable:
To any non-domestic customer of the City of San Marcos sanitary sewer system that has higher levels of pollutants in their sewage waste than those contained in normal domestic waste and placed on the surcharge participant list. A customer on the surcharge participant list will have a sewer surcharge added to their monthly sewer bill.
Surcharge Rate:
COD Concentration (Milligram per Liter)
351 to 500 - $1.00 per pound.
501 to 600 - $0.165 per pound.
Over 600 - $0.335 per pound.
The rate is not incremental: The COD reading will determine the surcharge rate for a customer’s entire discharge.
Surcharge Computation:
S = V * 8.34 * (COD-350) * Surcharge Rate
Definitions:
S – Surcharge in dollars that will appear on the monthly billing to customer.
V – Volume of monthly water usage in millions of gallons based upon the most recent twelve months average, or a minimum of six months average for new customers.
8.34 – Weight in pounds of a gallon of water.

City of San Marcos | FY20 Adopted Budget
City of San Marcos | Finance
286
COD (Chemical Oxygen Demand) – A measure of wastewater quality in milligrams per liter.
350 – Threshold level of COD for sewer surcharge.

City of San Marcos | FY20 Adopted Budget
City of San Marcos | Finance
287
Stormwater Utility Rates
Adopted Commercial Rate:
$10.52 per equivalent residential unit (ERU) per month. One ERU for commercial land use is determined to be 2,250 square feet of impervious cover.
Adopted Residential Rate:
Category Lot Size Drainage Charge
Residential - Small lot 0 - 6,000 square feet $7.57 per month
Residential - Average lot 6,001 - 12,000 square feet $12.10 per month
Residential - Large lot Greater than 12,000 square feet $13.86 per month

City of San Marcos | FY20 Adopted Budget
City of San Marcos | Finance
288
Electric Utility Rates Residential Rates
Customer Charge: Single or Three Phase Service $9.29
Energy Charge: All Metered kWh, per kWh $0.02080
Small General Service Rates
Customer Charge: Single or Three Phase Service $10.92
Energy Charge: All Metered kWh, per kWh $0.02080
Medium General Service Rates
Customer Charge: Single or Three Phase Service $49.14
Demand Charge: All kW of billing demand, per kW $3.61
Energy Charge: All Metered kWh, per kWh $0.01020
Large General Service Rates
Primary Voltage: (Greater than 600 volts, but less than 69,000 volts)
Customer Charge: Single or Three Phase Service $764.80
Demand Charge: All kW of billing demand, per kW $3.17
Energy Charge: All Metered kWh, per kWh $0.00810
Secondary Voltage: (Less than 600 Volts)
Customer Charge: Single or Three Phase Service $218.40
Demand Charge: All kW of billing demand, per kW $3.44
Energy Charge: All Metered kWh, per kWh $0.01020
City of San Marcos | FY20 Adopted Budget
City of San Marcos | Finance
289
Standard Power Cost Recovery Factor (PCRF) and Choose to Renew PCRF rates apply to Residential, Small General Service and Medium General Service customers.
City of San Marcos | FY20 Adopted Budget
City of San Marcos | Finance
290
A Brief Description of Local Ordinance and State Law
Proceedings to File a Budget:
30 days prior to the time City Council sets the Tax Levy-the City Manager will file with the City Secretary a Adopted Budget (See Sec. 8.02)
At the meeting City Council receives the Budget-Council shall fix a place and time for a public hearing on the adopted budget and cause it to be published in a local general circulation newspaper. (See 8.07 and 102.006 of the State Law)
Public Hearings:
At the Public Hearing, all interested persons shall be given an opportunity to be heard. (See Sec 8.07 and 102.006 of the State Law)
At a separate hearing, Council holds a public hearing on the property tax rate.
Adoption of the Budget:
After 14 days have lapsed since the public hearing on the budget, the City Council may adopt the budget and tax levying ordinances. (See Sec 8.09)
(Note: The Budget must be 15 days prior to the expiration of the current fiscal year; otherwise, the existing budget and tax levying ordinances become the ensuing fiscal year’s budget and tax levying ordinances.) (See Sec 8.10)
Filing of the Budget:
The budget is to be filed with the County Clerk as prescribed by state law following adoption by City Council. (See Sec 8.11 and 102.011 of the State Law)

City of San Marcos | FY20 Adopted Budget
City of San Marcos | Finance
291
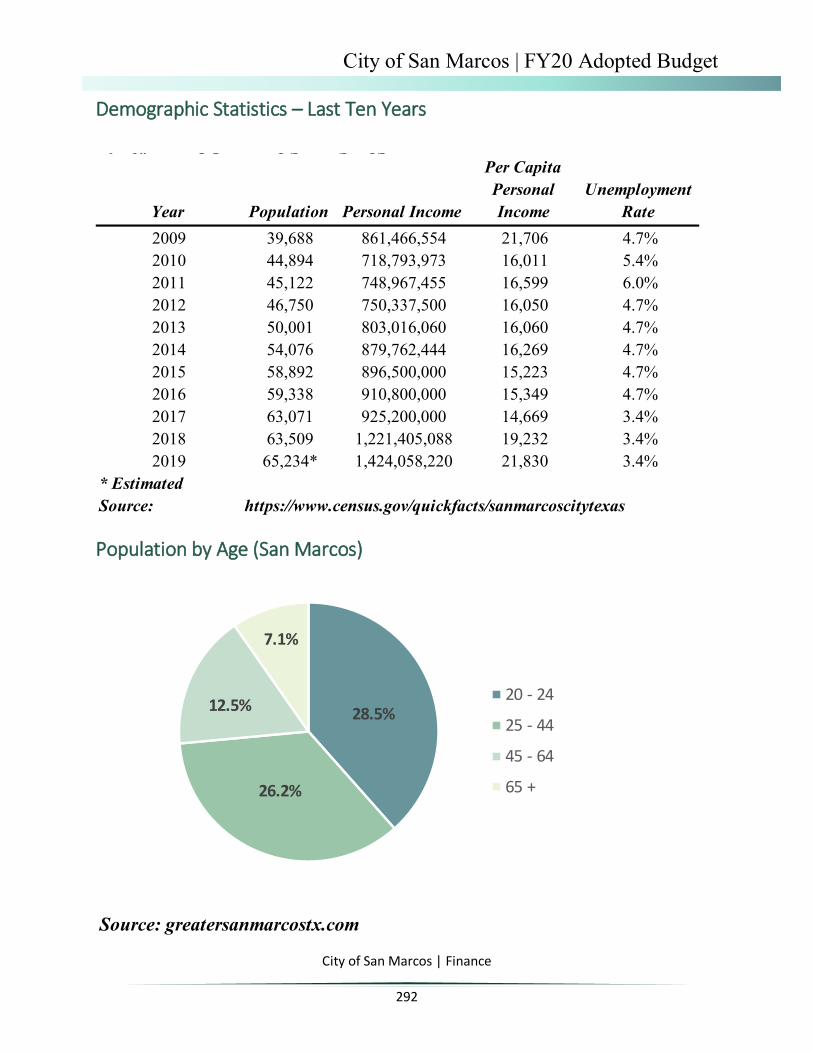
City of San Marcos | FY20 Adopted Budget
City of San Marcos | Finance
292
Demographic Statistics – Last Ten Years
Population by Age (San Marcos)
0 ea OG C S S CS
Year Population Personal Income
Per Capita Personal Income
Unemployment Rate
2009 39,688 861,466,554 21,706 4.7%2010 44,894 718,793,973 16,011 5.4%2011 45,122 748,967,455 16,599 6.0%2012 46,750 750,337,500 16,050 4.7%2013 50,001 803,016,060 16,060 4.7%2014 54,076 879,762,444 16,269 4.7%2015 58,892 896,500,000 15,223 4.7%2016 59,338 910,800,000 15,349 4.7%2017 63,071 925,200,000 14,669 3.4%2018 63,509 1,221,405,088 19,232 3.4%2019 65,234* 1,424,058,220 21,830 3.4%
* EstimatedSource: https://www.census.gov/quickfacts/sanmarcoscitytexas
Source: greatersanmarcostx.com
28.5%
26.2%
12.5%
7.1%
20 - 24
25 - 44
45 - 64
65 +

City of San Marcos | FY20 Adopted Budget
City of San Marcos | Finance
293
Ten Largest Taxpayers
g p yAssessed
ValuationPercent of
Total$227,774,309 4.0%$178,238,960 3.2%$162,713,736 2.9%
$92,423,722 1.6%$76,164,342 1.3%$56,278,428 1.0%$54,200,040 1.0%$52,306,798 0.9%$49,271,056 0.9%$45,971,702 0.8%
Source: [email protected]
Prime Outlets at San Marc RELP IND SAN MarcosACC OP (Retreat SM) LL
San Marcos Factory Store CFAN COCCSHP San Marcos LP
Hays Energy LPHEB Grocery Co LPTanger San Marcos LLC
Business NameAmazon.com, LLC

City of San Marcos | FY20 Adopted Budget
City of San Marcos | Finance
294
Ten Largest Employers
g p yNumber of Employees
Texas State University University 3,730Amazon Warehouse 2,200San Marcos Premium Outlets Retail Outlet 1,600Tanger Factory Outlets Retail Outlet 1,540SMCISD School 1,400Hays County County Government 885City of San Marcos City Government 817HEB Distribution Center Warehouse 750Central Texas Medical Center Hospital 675CFAN Retail 600One Support Retail 450
Source: greatersanmarcostx.com
Business Name Industry

City of San Marcos | FY20 Adopted Budget
City of San Marcos | Finance
295
Ten Largest Electric Utility Customers
Amount Billed Usage (kWh)
8,059,828 110,304,8081,772,747 21,945,1121,718,470 20,331,875
843,418 9,570,454742,919 8,849,048706,820 7,763,060628,467 7,862,400546,819 6,811,978509,826 6,218,368445,114 5,104,974
Source: City of San Marcos Utility Billing Dept.
Business Name
Texas State UniversityHEB Grocery CoAmazon.com, Inc.City of San MarcosCentral Texas Medical CenterSMCISDEl Milagro of Texas Inc.Hays County Government CenterThermon MainEmbassy Suits, San Marcos

City of San Marcos | FY20 Adopted Budget
City of San Marcos | Finance
296
Construction Permits – Last Ten Fiscal Years
New Single-Family New Commercial Construction * Residential Construction *
Fiscal YearNumber of
PermitsConstruction Dollar
ValueNumber of Units
Construction Dollar Value
2009 18 24,983,000 135 18,271,2172010 11 66,668,893 170 23,604,3792011 52 24,305,000 151 20,522,9332012 14 16,270,098 208 28,645,6822013 186 47,777,822 224 29,657,4702014 208 82,000,000 278 50,000,0002015 28 110,086,866 263 41,207,3322016 145 61,900,000 350 58,684,9152017 145 61,900,000 350 58,684,9152018 159 149,000,000 557 94,000,000
* Construction permits, units and values. Planning and Development Services Department, Building Inspection Division

City of San Marcos | FY20 Adopted Budget
City of San Marcos | Finance
297
Historical Housing Market Median Sale Price
Source: zillow.com* 2020 Estimated Home Price from Zillow.com
$120
$140
$160
$180
$200
$220
$240
$260
$280
2011 2012 2013 2014 2015 2016 2017 2018 2019 2020*
Thou
sand
s
San Marcos New Braunfels Kyle College Station

City of San Marcos | FY20 Adopted Budget
City of San Marcos | Finance
298
Public Safety Service Calls
80,898
76,384 75,57772,882 73,126
79,311 80,61484,584
78,192
72,442
0
10,000
20,000
30,000
40,000
50,000
60,000
70,000
2009 2010 2011 2012 2013 2014 2015 2016 2017 2018 65,000
70,000
75,000
80,000
85,000
90,000
Popu
latio
n
Police Population
2,726 2,930 3,416
3,876 3,722 4,237
4,851 5,163 5,469 5,701
0
10,000
20,000
30,000
40,000
50,000
60,000
70,000
2009 2010 2011 2012 2013 2014 2015 2016 2017 2018 -
1,000
2,000
3,000
4,000
5,000
6,000Po
pula
tion
Fire Population

City of San Marcos | FY20 Adopted Budget
City of San Marcos | Finance
299
Public Safety Major Incidents by Type
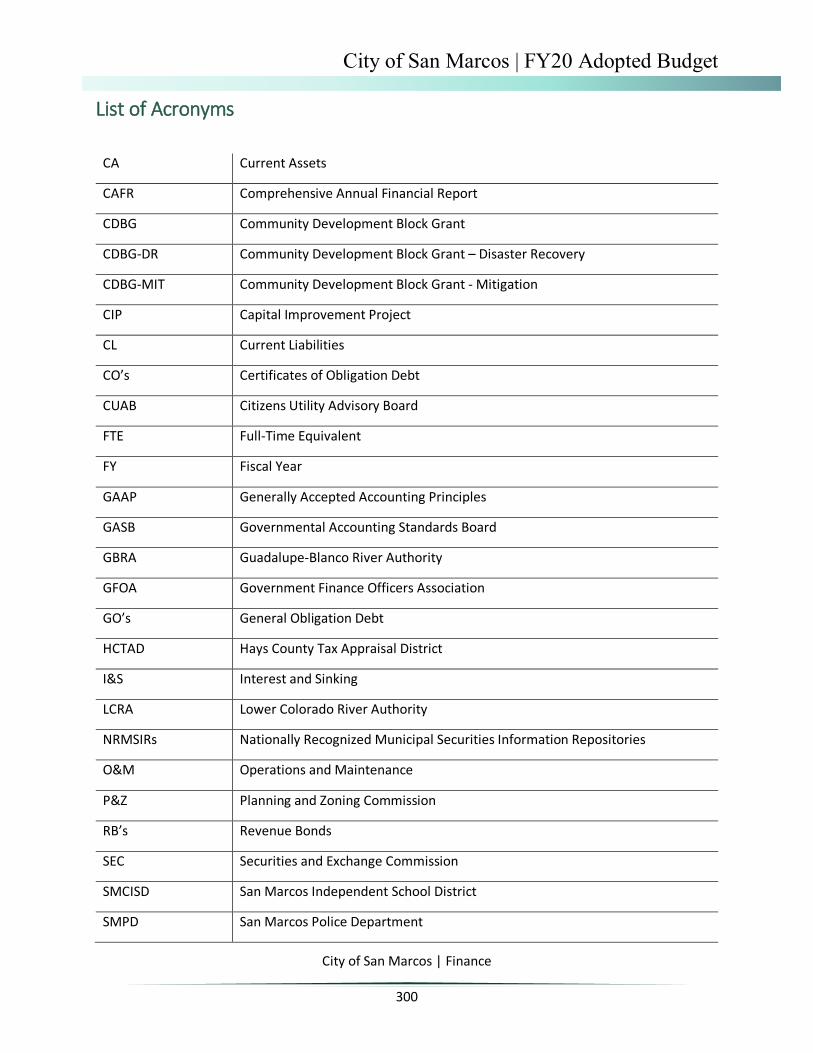
City of San Marcos | FY20 Adopted Budget
City of San Marcos | Finance
300
List of Acronyms
CA Current Assets
CAFR Comprehensive Annual Financial Report
CDBG Community Development Block Grant
CDBG-DR Community Development Block Grant – Disaster Recovery
CDBG-MIT Community Development Block Grant - Mitigation
CIP Capital Improvement Project
CL Current Liabilities
CO’s Certificates of Obligation Debt
CUAB Citizens Utility Advisory Board
FTE Full-Time Equivalent
FY Fiscal Year
GAAP Generally Accepted Accounting Principles
GASB Governmental Accounting Standards Board
GBRA Guadalupe-Blanco River Authority
GFOA Government Finance Officers Association
GO’s General Obligation Debt
HCTAD Hays County Tax Appraisal District
I&S Interest and Sinking
LCRA Lower Colorado River Authority
NRMSIRs Nationally Recognized Municipal Securities Information Repositories
O&M Operations and Maintenance
P&Z Planning and Zoning Commission
RB’s Revenue Bonds
SEC Securities and Exchange Commission
SMCISD San Marcos Independent School District
SMPD San Marcos Police Department

City of San Marcos | FY20 Adopted Budget
City of San Marcos | Finance
301
TML Texas Municipal League
TSUSM Texas State University – San Marcos
WIC Women, Infants and Children Program Fund
W/WW Water/ Wastewater Utility Fund

City of San Marcos | FY20 Adopted Budget
City of San Marcos | Finance
302
Glossary of Terms
ACCOUNT - A code made up of numbers used to classify how specific dollar amounts come into the City or how they are being spent.
ACCRUAL BASIS OF ACCOUNTING – A method of accounting that recognizes the financial effect of transactions, events, and interfund activities when they occur, regardless of the timing of related cash flows.
AD VALOREM TAX - A tax levied on the assessed value of real property (also known as "property taxes").
AMORTIZE - To provide for the gradual extinguishment of (as a mortgage) usually by contribution to a sinking fund at the time of each periodic payment.
APPROPRIATION - A specific amount of money authorized by City Council to make expenditures and incur obligations for specific purposes, frequently used interchangeable with "expenditures".
ASSESSED VALUATION - A value that is established for real and personal property for use as a basis for levying property taxes.
AUDIT - A comprehensive examination as to the manner in which the government’s resources were actually utilized, concluding in a written report. A financial audit is a review of the accounting system and financial information to determine how government funds were spent and whether expenditures were in compliance with the legislative body’s appropriations. A performance audit consists of a review of how well the government met its stated goals.
BALANCE SHEET - A financial statement that discloses the assets, liabilities, reserves and balances of a specific governmental fund as of a specific date.
BASIS DIFFERENCES – Differences that arise through the employment of a basis of accounting for budgetary purposes that differs from the basis of accounting prescribed by GAAP for a given fund type.

City of San Marcos | FY20 Adopted Budget
City of San Marcos | Finance
303
BASIS OF ACCOUNTING – The timing of recognition, that is, when the effects of transactions or events should be recognized for financial reporting purposes. For example, the effects of transactions or events can be recognized on an accrual basis (that is, when the transactions or events take place), or on a cash basis (that is, when cash is received or paid). Basis of accounting is an essential part of measurement focus because a particular timing of recognition is necessary to accomplish a particular measurement focus.
BOND - A written promise to pay a specific sum of money, called the face value or principal amount, at a specific date or dates in the future, called the maturity date, together with periodic interest at a specified rate.
BONDED DEBT - The portion of indebtedness represented by outstanding bonds.
BUDGET - A plan of financial operation specifying expenditures to be incurred for a given period to accomplish specific goals, and the means of financing them.
BUDGET CALENDAR - The schedule of key dates or milestones which the City departments follow in preparation, specific goals, and the means of financing them.
BUDGETARY BASIS OF ACCOUNTING – The method used to determine when revenues and expenses are recognized for budgetary purposes.
BUDGET DOCUMENT - The official plan showing how the City finances all of its services.
BUDGET YEAR - From October 1st through September 30th, which is the same as the fiscal year.
BUDGETARY CONTROL - The control or management of a governmental unit or enterprise in accordance with an approved budget for the purpose of keeping expenditures within the limitations of available appropriations and available revenues.
CAPITAL EXPENDITURE – An expense for a major asset or improvement as shown in the Capital Improvement Program. The amount usually exceeds $50,000.
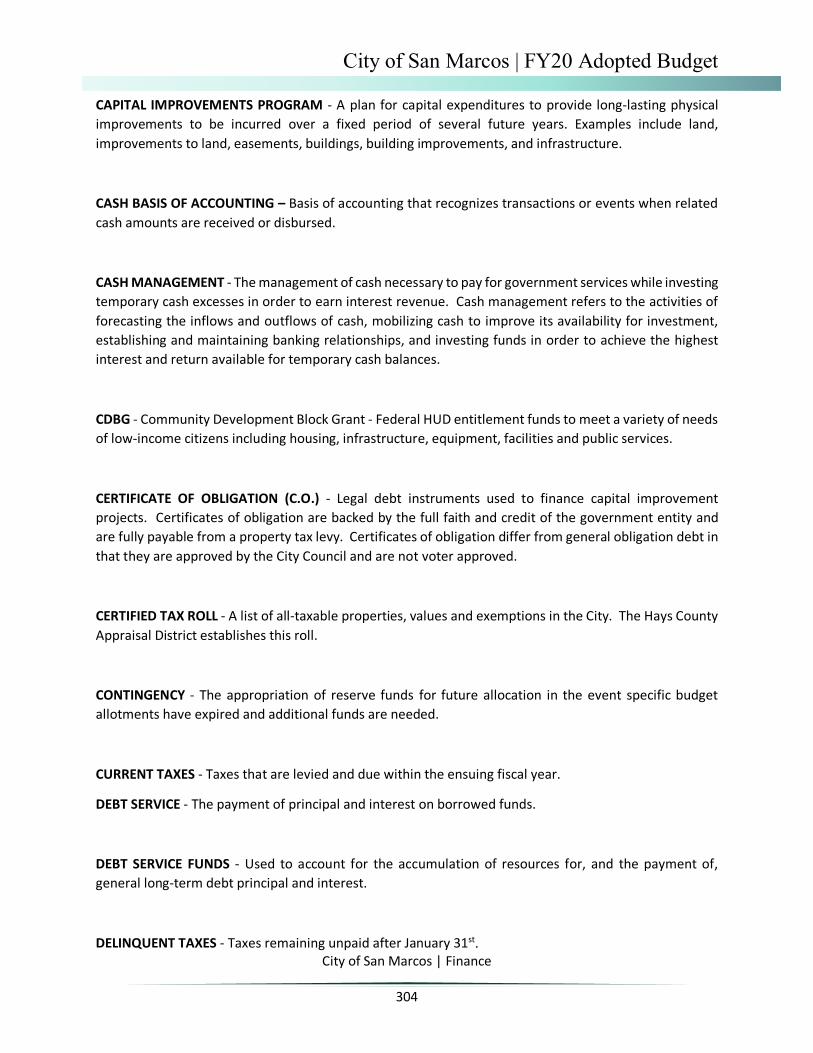
City of San Marcos | FY20 Adopted Budget
City of San Marcos | Finance
304
CAPITAL IMPROVEMENTS PROGRAM - A plan for capital expenditures to provide long-lasting physical improvements to be incurred over a fixed period of several future years. Examples include land, improvements to land, easements, buildings, building improvements, and infrastructure.
CASH BASIS OF ACCOUNTING – Basis of accounting that recognizes transactions or events when related cash amounts are received or disbursed.
CASH MANAGEMENT - The management of cash necessary to pay for government services while investing temporary cash excesses in order to earn interest revenue. Cash management refers to the activities of forecasting the inflows and outflows of cash, mobilizing cash to improve its availability for investment, establishing and maintaining banking relationships, and investing funds in order to achieve the highest interest and return available for temporary cash balances.
CDBG - Community Development Block Grant - Federal HUD entitlement funds to meet a variety of needs of low-income citizens including housing, infrastructure, equipment, facilities and public services.
CERTIFICATE OF OBLIGATION (C.O.) - Legal debt instruments used to finance capital improvement projects. Certificates of obligation are backed by the full faith and credit of the government entity and are fully payable from a property tax levy. Certificates of obligation differ from general obligation debt in that they are approved by the City Council and are not voter approved.
CERTIFIED TAX ROLL - A list of all-taxable properties, values and exemptions in the City. The Hays County Appraisal District establishes this roll.
CONTINGENCY - The appropriation of reserve funds for future allocation in the event specific budget allotments have expired and additional funds are needed.
CURRENT TAXES - Taxes that are levied and due within the ensuing fiscal year.
DEBT SERVICE - The payment of principal and interest on borrowed funds.
DEBT SERVICE FUNDS - Used to account for the accumulation of resources for, and the payment of, general long-term debt principal and interest.
DELINQUENT TAXES - Taxes remaining unpaid after January 31st.
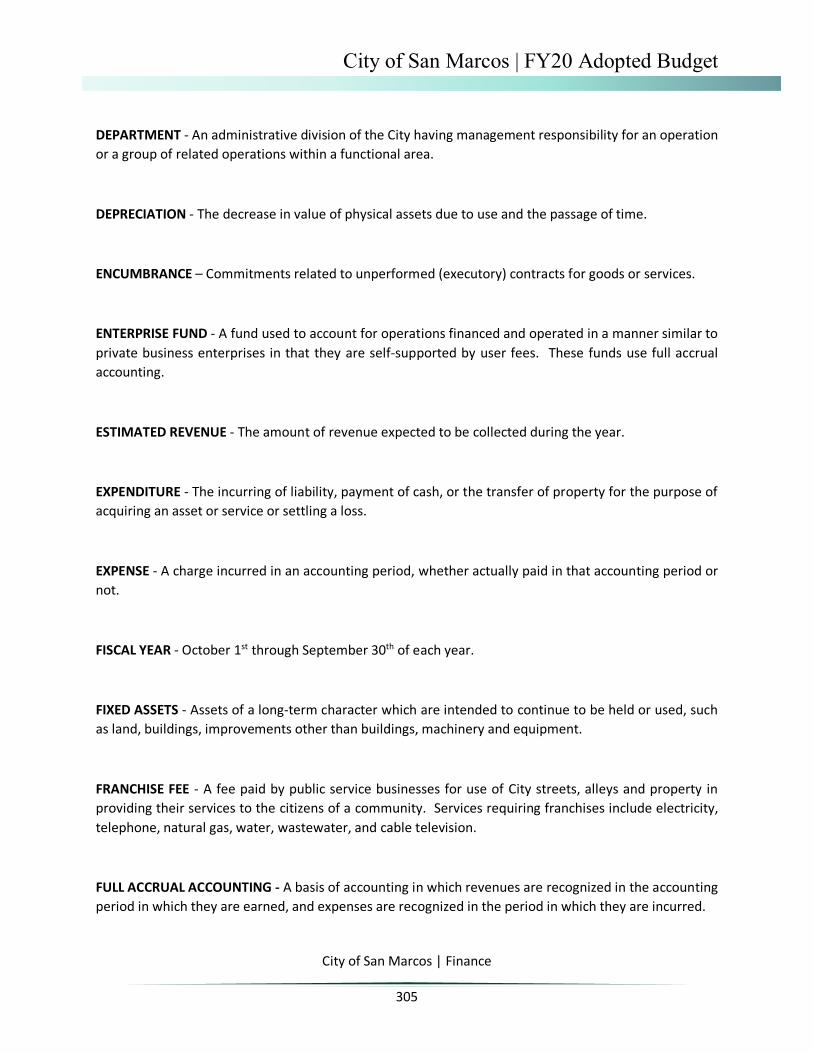
City of San Marcos | FY20 Adopted Budget
City of San Marcos | Finance
305
DEPARTMENT - An administrative division of the City having management responsibility for an operation or a group of related operations within a functional area.
DEPRECIATION - The decrease in value of physical assets due to use and the passage of time.
ENCUMBRANCE – Commitments related to unperformed (executory) contracts for goods or services.
ENTERPRISE FUND - A fund used to account for operations financed and operated in a manner similar to private business enterprises in that they are self-supported by user fees. These funds use full accrual accounting.
ESTIMATED REVENUE - The amount of revenue expected to be collected during the year.
EXPENDITURE - The incurring of liability, payment of cash, or the transfer of property for the purpose of acquiring an asset or service or settling a loss.
EXPENSE - A charge incurred in an accounting period, whether actually paid in that accounting period or not.
FISCAL YEAR - October 1st through September 30th of each year.
FIXED ASSETS - Assets of a long-term character which are intended to continue to be held or used, such as land, buildings, improvements other than buildings, machinery and equipment.
FRANCHISE FEE - A fee paid by public service businesses for use of City streets, alleys and property in providing their services to the citizens of a community. Services requiring franchises include electricity, telephone, natural gas, water, wastewater, and cable television.
FULL ACCRUAL ACCOUNTING - A basis of accounting in which revenues are recognized in the accounting period in which they are earned, and expenses are recognized in the period in which they are incurred.

City of San Marcos | FY20 Adopted Budget
City of San Marcos | Finance
306
FULL FAITH AND CREDIT - A pledge of the general taxing power of the City to repay debt obligations. This term is typically used in reference to general obligations bonds.
FULL TIME EQUIVALENT (F.T.E.) - A quantifiable unit of measure utilized to convert hours worked by part-time, seasonal or temporary employees into hours worked by full-time employees. Full-time employees work 2080 hours annually. A part-time employee working 1040 hours annually represents a .5 FTE.
FUND - A fiscal and accounting entity with a self-balancing set of accounts recording cash and other financial resources, together with all related liabilities and residual equities or balances, and changes therein. Funds are usually established to account for activities of a certain type.
FUND BALANCE - The excess of assets over liabilities for governmental funds.
GAAP - Generally Accepted Accounting Principles.
GENERAL FUND - The general operating fund of the City. It is used to account for all financial resources except those required to be accounted for in another fund.
GENERAL OBLIGATION BONDS - Bonds that finance a variety of public projects such as streets, buildings, and capital improvements. The repayment of these bonds is usually made from the General Fund. They are backed by the full faith and credit of the City.
GENERAL OBLIGATION DEBT - The supported bonded debt, which is backed by the full faith and credit of the City.
GOAL - A long-term, attainable target for an organization Vision of the future.
GOVERNMENTAL FUND - It refers to the General Fund, all Special Revenue Funds and the Debt Service Fund.
GRANT - Contributions or gifts of cash or other assets from another government to be used for a specific purpose, activity or facility.

City of San Marcos | FY20 Adopted Budget
City of San Marcos | Finance
307
INDIRECT COSTS – Those costs that are fully expensed within one fund or division that can be allocated to another fund or division. i.e., Human Resources is fully expensed to the General Fund but services relate to the Electric Utility Fund as well.
INFRASTRUCTURE - Substructure or underlying foundation of the City (e.g. streets, utility lines, water and wastewater facilities, etc.)
INTERGOVERNMENTAL REVENUES - Revenues received from another governmental entity, such as county, state or federal governments.
INVENTORY - A detailed listing of property currently held by the City.
LEVY - To impose taxes, special assessments, or service charges for the support of City activities.
LINE ITEM BUDGET - A budget that lists each expenditure category (salary, materials, telephone service, travel, etc.) Separately along with the dollar amount budgeted for each specified category.
LIMITED TAX NOTES – Short-term, interest-bearing note issued by a government in anticipation of tax revenues to be received at a later date. The note is retired from the tax revenues to which it is related.
LONG-TERM DEBT - Any unmatured debt that is not a fund liability with a maturity of more than one year.
MODIFIED ACCRUAL ACCOUNTING – Basis of accounting according to which (a) revenues are recognized in the accounting period in which they become available and measurable and (b) expenditures are recognized in the accounting period in which the fund liability is incurred, if measurable, except for unmatured interest on general long-term debt and certain similar accrued obligations, which should be recognized when due.
NON-OPERATING EXPENDITURES - The costs of government services which are not directly attributable to a specific City program or operation. An example includes debt service obligations.

City of San Marcos | FY20 Adopted Budget
City of San Marcos | Finance
308
NON-OPERATING REVENUES - The incomes received by the government which are not directly attributable to providing a service. An example would be interest on investments.
O & M - Operations and Maintenance
OBJECTIVES - A specific, measurable and observable result of an organization’s activity which advances the organization toward a goal.
OPERATING BUDGET - A financial plan that presents expenditures for the fiscal year and estimates of revenue to finance them.
OPERATING TRANSFERS - Legally authorized transfers from a fund receiving revenue to the fund through which the resources are to be expended.
POLICY - A plan, course of action or guiding principle, designed to set parameters for decisions and actions.
PROPERTY TAX - Taxes that are levied on both real and personal property according to the Property’s valuation and tax.
RESERVE - An account used to indicate that a portion of a fund’s balance is legally restricted for a specific purpose and is, therefore, not available for general appropriation.
RETAINED EARNINGS - The accumulated earnings of an Enterprise or Internal Service Fund which have been retained in the fund and which are not reserved for any specific purpose.
REVENUE - All money received by a government other than expense refunds, capital contributions, and residual equity transfers.
REVENUE BONDS - Bonds whose principle and interest are payable exclusively from user fees.

City of San Marcos | FY20 Adopted Budget
City of San Marcos | Finance
309
RISK MANAGEMENT - An organized effort to protect the City’s assets against loss, utilizing the most economical methods.
ROUTINE CAPITAL OUTLAY – Vehicles and other equipment with a value in excess of $5,000 and an expected life of more than three years.
SOURCES OF REVENUE - Revenues are classified according to their source or where they originate.
SPECIAL REVENUE FUNDS - Funds used to account for the proceeds of specific revenue sources (other than special assessments, expendable trusts, or major capital projects) that are legally restricted to expenditures for specific purposes.
TAX BASE - The total value of all real and personal property in the City as of January 1st of each year, as certified by the Appraisal Review Board.
TAX LEVY - The total amount of taxes imposed by the City on taxable property, as determined by the Hays County Tax Appraisal District.
TAX RATE - The tax rate is set by Council and is made up of two components; debt service and operations rates.
TIMING DIFFERENCES – Differences between the budgetary basis of accounting and GAAP that occur when the period used for budgeting differs from the period used for GAAP reporting (e.g., a special revenue fund that uses a grant-year budget rather than a fiscal-year budget).
TRUST AND AGENCY FUNDS - Funds used to account for assets held by the City in a trustee capacity or as an agent for individuals, private organizations, other governments, and/or other funds.
UNEARNED REVENUE – A type of deferred revenue account used in connection with resources that have not yet been earned.
UNENCUMBERED FUND BALANCE - For budget purposes, the unencumbered fund balance is the amount of undesignated fund balance of a fund, which is available for allocation.

City of San Marcos | FY20 Adopted Budget
City of San Marcos | Finance
310
UNREALIZED REVENUES – Term used in connection with budgeting. The difference between estimated revenues and actual revenues.
WORKING CAPITAL – Current assets less current liabilities.