Embed Size (px)
Citation preview

Glenn Hegar Texas Comptroller of Public Accounts
TEXAS HEALTH CARE SPENDING REPORTFISCAL 2015

i
Glenn Hegar Texas Comptroller of Public Accounts
Comptroller.Texas.Gov
P.O. Box 13528
Austin, Texas 78711-3528
512-463-4444
Toll Free: 1-800-531-5441 ext: 3-4444
Fax: 512-463-4902
January 31, 2017
The Honorable Greg Abbott, GovernorThe Honorable Dan Patrick, Lieutenant Governor The Honorable Joe Straus, Speaker of the House
Gentlemen:
We submit our new report, Texas Health Care Spending: Fiscal 2015, for your information in preparation for the biennial budget discussions.
As you know, health care spending represents a significant portion of our state budget. In fiscal 2015, Texas spent a total of $42.9 billion on health care, 42 percent of it from state general revenue and general revenue dedicated funds. State health care expenditures rose by 19.7 percent from fiscal 2011 to 2015, a rate faster than both the growth of inflation in the state as well as of the Texas population during that period.
This report examines health care expenditures reported by the 68 state agencies and institutions of higher education that expend state health care dollars. We took an in-depth look at the five agencies with the largest state health care spending, including the major factors driving their costs and their measures to contain them.
We hope you will find this information useful in understanding and exploring this pressing issue.
Sincerely,
Glenn Hegar

TEXAS HEALTH CARE SPENDING: FISCAL 2015
Glenn Hegar, Texas Comptroller of Public Accountsii
The data represented in this report is available in accessible data form (Excel).

TEXAS HEALTH CARE SPENDING: FISCAL 2015
Glenn Hegar, Texas Comptroller of Public Accountsiii
TABLE OF CONTENTSINTRODUCTION .............................................. 1
OVERVIEW OF FINDINGS ............................... 1
AGENCIES WITH THE HIGHEST REPORTED HEALTH CARE EXPENDITURES ....................... 3
Texas Health and Human Services Commission ......... 3
Texas Department of Aging and Disability Services ................................................... 6
Texas Department of State Health Services .............. 10
Employees Retirement System of Texas ................... 12
Teacher Retirement System of Texas ........................ 15
OTHER STATE AGENCIES REPORTING HEALTH CARE EXPENDITURES ......................18
Cancer Prevention and Research Institute of Texas ................................................. 18
State Office of Risk Management ............................. 19
Texas Department of Assistive and Rehabilitative Services .......................................... 20
Texas Department of Family Protective Services ...... 22
Texas School for the Deaf ......................................... 23
Texas School for the Blind and Visually Impaired ..... 23
The University of Texas System ................................. 24
Texas A&M University System ................................... 27
Health-Related Institutions of Higher Education ...... 28
Health-Related Research at Higher Education Institutions ............................... 30
Texas Department of Criminal Justice ...................... 31
Texas Juvenile Justice Department .......................... 33
Texas Department of Transportation ........................ 34
Texas Department of Agriculture .............................. 34
MAJOR COST DRIVERS ..................................36
New Medical Technology and Prescription Drugs .... 36
Uncompensated and Indigent Care ......................... 36
Chronic Disease ........................................................ 39
Aging Population ...................................................... 41
Increased Utilization and Provider Shortages ........... 41
COUNTY HEALTH CARE EXPENDITURES ......42
Angelina County ....................................................... 44
Bell County ............................................................... 46
Bexar County ............................................................ 48
Gray County .............................................................. 51
Starr County .............................................................. 52
Val Verde County ...................................................... 54
APPENDIX: DEFINITION OF HEALTH CARE .....................56
ACKNOWLEDGEMENTS ................................57

Glenn Hegar, Texas Comptroller of Public Accountsiv
TEXAS HEALTH CARE SPENDING: FISCAL 2015

TEXAS HEALTH CARE SPENDING: FISCAL 2015
Glenn Hegar, Texas Comptroller of Public Accounts1
TEXAS HEALTH CARE SPENDINGINTRODUCTIONHealth care continues to be a leading element of the Texas budget, presenting a significant challenge to lawmakers as they balance the financial burden of skyrocketing costs against the state’s obligations to provide health care services for certain indigent, disabled or incarcerated residents as well as medical coverage for state employees and retirees.
In the U.S., health care accounted for 17.5 percent of the gross national product (GNP) in 2014 and is expected to rise to 20.1 percent — a fifth of GNP — by 2025.1 U.S. health care costs are expected to increase by 6 percent annually over the next 10 years, reaching $16,000 for each man, woman and child by 2025.2
Within Texas, health care spending represents about 12 percent of our gross state product. Health care spending by Texas agencies and higher education institutions rose by 19.7 percent between fiscal 2011 and fiscal 2015 – a growth rate outpacing both inflation (5.4 percent) and population (7.1 percent) during this period (Exhibit 1).
OVERVIEW OF FINDINGSComptroller staff analyzed data provided by 68 state agencies and higher education institutions that reported health care-related expenditures during the five years from fiscal 2011 to 2015. (For a complete list of items included as health care expenditures, see Appendix 1: Definition of Health Care.)
EXHIBIT 1
GROWTH IN TEXAS HEALTH CARE EXPENDITURES, INFLATION AND TEXAS POPULATION, FISCAL 2011-2015
0%
5%
10%
15%
20%
25%
2011 2012 2013 2014 2015
Texas Health Care Expenditures Inflation Texas Population
Compound Inflation and Population Growth
Sources: U.S. Census Bureau, U.S. Bureau of Labor Statistics and Texas Comptroller of Public Accounts

TEXAS HEALTH CARE SPENDING: FISCAL 2015
Glenn Hegar, Texas Comptroller of Public Accounts2
Health care spending represents a significant portion of the Texas budget. In fiscal 2015, Texas spent $42.9 billion on health care, representing 43.1 percent of all fiscal 2015 appropriations from state, federal and other sources.
Forty-two percent of Texas’ health care spending came from state general revenue and dedicated funds within general revenue. Federal funds supported 43.6 percent, while the remainder came from grants, interagency contracts and other sources.
Texas funds or directly administers numerous health services, including Medicaid, the Children’s Health Insurance Program, mental health services, prisoner health care, medical insurance for both active and retired state government employees, medical research, workers’ compensation and other programs, through a variety of agencies representing nearly every article in the Texas General Appropriations Act (Exhibit 2).
EXHIBIT 2
TEXAS HEALTH CARE EXPENDITURES, ALL FUNDS AND GENERAL REVENUE, BY ARTICLE, FISCAL 2015(AMOUNTS IN MILLIONS)
GENERAL REVENUE/GR-DEDICATED
FEDERAL FUNDS OTHER ALL FUNDS
Article I - General Government Agencies
Cancer Prevention and Research Institute of Texas (CPRIT)* - - $33.9 $33.9
Employees Retirement System (ERS) $1,355.5 $292.5 $252.9 $1,900.9
State Office of Risk Management (SORM) $22.4 $5.0 $3.1 $30.5
Article II – Health and Human Services Agencies
Department of Aging and Disability Services (DADS) $1,883.7 $2,844.3 - $4,728.0
Department of Assistive and Rehabilitative Services (DARS) $52.1 $98.0 $1.1 $151.2
Department of Family Protective Services (DFPS) $6.7 $0.1 - $6.8
Department of State Health Services (DSHS) $1,363.6 $533.6 $225.0 $2,122.3
Health and Human Services Commission (HHSC) $10,435.3 $14,940.8 - $25,376.1
Article III – Education Agencies
Texas School for the Blind and Visually Impaired (TSBVI) $6.3 $0.7 - $7.0
Texas School for the Deaf (TSD) $5.2 - - $5.2
Teacher Retirement System of Texas (TRS) $1,310.2 - - $1,310.2
University of Texas System (UT System) $436.0 - $436.5 $872.4
Texas A&M University System (TAMUS) $136.6 $3.9 $70.3 $210.8
Health-Related Institutions of Higher Education** - - - $5,041.5
Health-Related Research at Higher Education Institutions*** $351.8 - $136.4 $488.2
Article V – Public Safety and Criminal Justice Agencies
Texas Department of Criminal Justice (TDCJ) $619.5 - $0.6 $620.1
Texas Juvenile Justice Department (TJJD) $37.9 - $0.6 $38.5
Article VI – Natural Resources
Texas Department of Agriculture (TDA) $2.6 $1.7 - $4.2
Article VII - Business and Economic Development Agencies
Texas Department of Transportation (TxDOT) $1.9 - - $2.7
Total Health Care Expenditures $18,027.3 $18,720.5 $1,156.4 $42,950.5
Sources: Texas Comptroller of Public Accounts and various state agencies and institutions
*CPRIT grants may contain some overlap with Health-Related Research at Higher Education Institutions.**Expenditures are presented as “All Funds” since the method of finance detail was not available.*** “All Funds” does not include all research expenditures. The category includes state general revenue and state grants only.
TEXAS HEALTH CARE SPENDING: FISCAL 2015
Glenn Hegar, Texas Comptroller of Public Accounts3
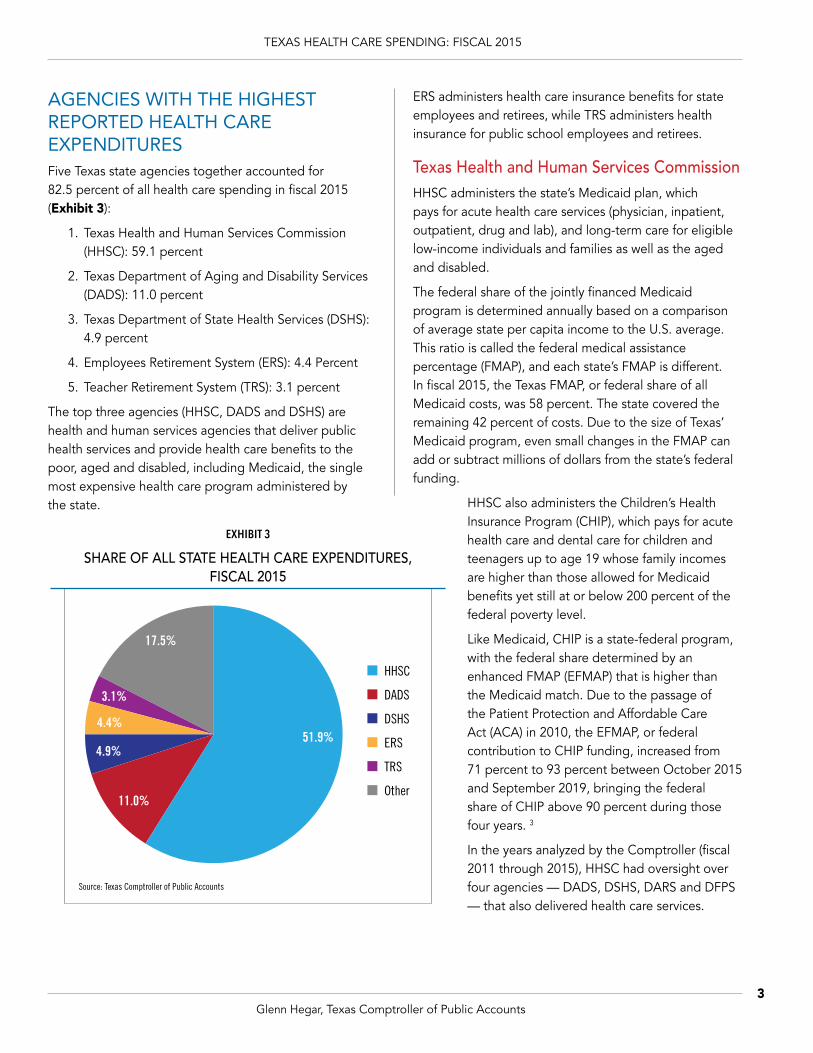
AGENCIES WITH THE HIGHEST REPORTED HEALTH CARE EXPENDITURESFive Texas state agencies together accounted for 82.5 percent of all health care spending in fiscal 2015 (Exhibit 3):
1. Texas Health and Human Services Commission (HHSC): 59.1 percent
2. Texas Department of Aging and Disability Services (DADS): 11.0 percent
3. Texas Department of State Health Services (DSHS): 4.9 percent
4. Employees Retirement System (ERS): 4.4 Percent
5. Teacher Retirement System (TRS): 3.1 percent
The top three agencies (HHSC, DADS and DSHS) are health and human services agencies that deliver public health services and provide health care benefits to the poor, aged and disabled, including Medicaid, the single most expensive health care program administered by the state.
HHSC
DADS
DSHS
ERS
TRS
Other
51.9%
11.0%
4.9%
4.4%
3.1%
17.5%
EXHIBIT 3
SHARE OF ALL STATE HEALTH CARE EXPENDITURES, FISCAL 2015
Source: Texas Comptroller of Public Accounts
ERS administers health care insurance benefits for state employees and retirees, while TRS administers health insurance for public school employees and retirees.
Texas Health and Human Services CommissionHHSC administers the state’s Medicaid plan, which pays for acute health care services (physician, inpatient, outpatient, drug and lab), and long-term care for eligible low-income individuals and families as well as the aged and disabled.
The federal share of the jointly financed Medicaid program is determined annually based on a comparison of average state per capita income to the U.S. average. This ratio is called the federal medical assistance percentage (FMAP), and each state’s FMAP is different. In fiscal 2015, the Texas FMAP, or federal share of all Medicaid costs, was 58 percent. The state covered the remaining 42 percent of costs. Due to the size of Texas’ Medicaid program, even small changes in the FMAP can add or subtract millions of dollars from the state’s federal funding.
HHSC also administers the Children’s Health Insurance Program (CHIP), which pays for acute health care and dental care for children and teenagers up to age 19 whose family incomes are higher than those allowed for Medicaid benefits yet still at or below 200 percent of the federal poverty level.
Like Medicaid, CHIP is a state-federal program, with the federal share determined by an enhanced FMAP (EFMAP) that is higher than the Medicaid match. Due to the passage of the Patient Protection and Affordable Care Act (ACA) in 2010, the EFMAP, or federal contribution to CHIP funding, increased from 71 percent to 93 percent between October 2015 and September 2019, bringing the federal share of CHIP above 90 percent during those four years. 3
In the years analyzed by the Comptroller (fiscal 2011 through 2015), HHSC had oversight over four agencies — DADS, DSHS, DARS and DFPS — that also delivered health care services.

TEXAS HEALTH CARE SPENDING: FISCAL 2015
Glenn Hegar, Texas Comptroller of Public Accounts4
2011 2012 2013 2014 2015$0
$5,000
$10,000
$15,000
$20,000
$25,000
$30,000
$13,308.9
$6,832.0
$12,343.4
$8,688.5
$12,934.6
$8,816.3
$13,203.7
$9,079.9
$14,940.8
$10,435.3
IN MILLIONS
State Federal
In 2015, the Texas Legislature’s S.B. 200 merged DADS and DARS into HHSC as of September 1, 2016. Some DADS facilities such as state-supported living centers, as well as selected programs from DSHS and DFPS, will join HHSC on September 1, 2017.4
HHSC’s health care spending totaled $25.4 billion in fiscal 2015, with $10.4 billion (41 percent) coming from state funds and $14.9 billion (59 percent) from the federal government. From fiscal 2011 to 2015, HHSC’s health care spending from all funds rose by 26 percent (Exhibits 4 and 5).
From fiscal 2011 to 2015, state funding for HHSC’s health care programs rose by 53 percent, due in part to a state match related to the American Reinvestment and Recovery Act (ARRA) funds remaining in 2011; without them, state-funded expenditures would have risen by only 33 percent. Federal funding rose by
EXHIBIT 4
TEXAS HEALTH AND HUMAN SERVICES COMMISSION FUNDING SOURCES FOR HEALTH CARE EXPENDITURES, FISCAL 2011-2015
Source: Texas Health and Human Services Commission
State
Federal41.1%58.9%
EXHIBIT 5
TEXAS HEALTH AND HUMAN SERVICES COMMISSION FUNDING SOURCES FOR HEALTH CARE EXPENDITURES
FISCAL 2015
Source: Texas Health and Human Services Commission
TEXAS HEALTH CARE SPENDING: FISCAL 2015
Glenn Hegar, Texas Comptroller of Public Accounts5
12 percent in the same five-year period; without ARRA funds, the growth would have been 21 percent. In all, HHSC’s health care spending rose by 26 percent from 2011 to 2015.5
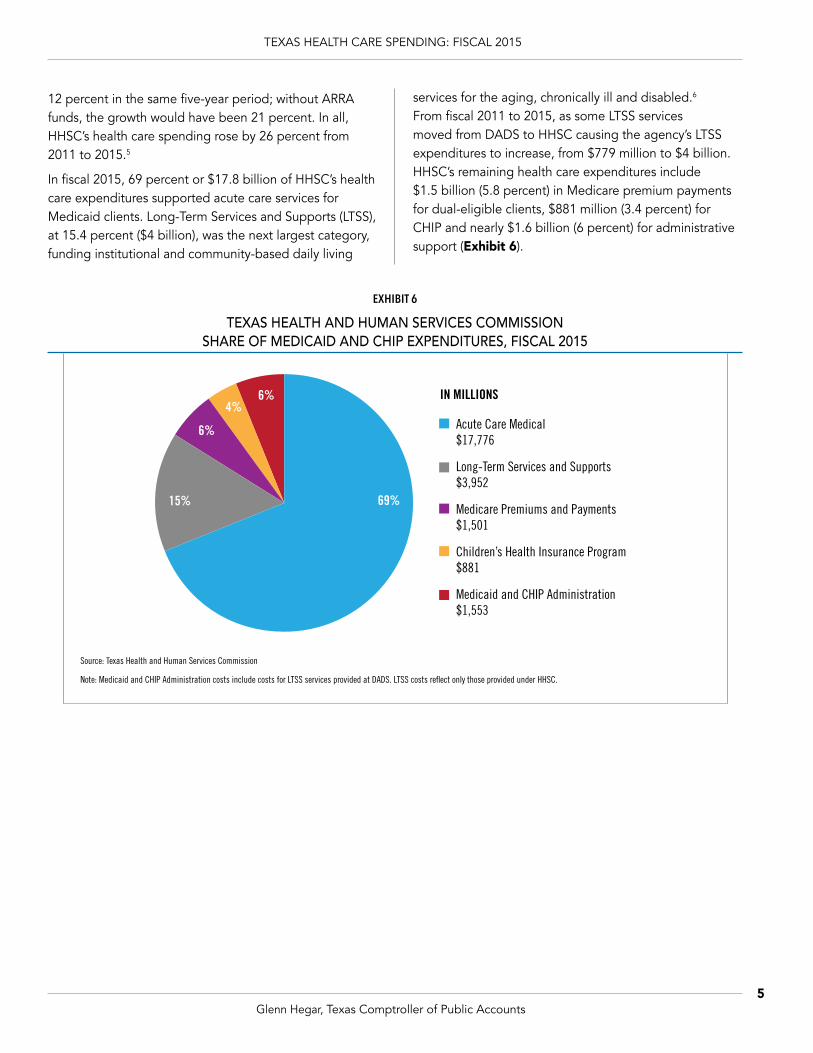
In fiscal 2015, 69 percent or $17.8 billion of HHSC’s health care expenditures supported acute care services for Medicaid clients. Long-Term Services and Supports (LTSS), at 15.4 percent ($4 billion), was the next largest category, funding institutional and community-based daily living
services for the aging, chronically ill and disabled.6 From fiscal 2011 to 2015, as some LTSS services moved from DADS to HHSC causing the agency’s LTSS expenditures to increase, from $779 million to $4 billion. HHSC’s remaining health care expenditures include $1.5 billion (5.8 percent) in Medicare premium payments for dual-eligible clients, $881 million (3.4 percent) for CHIP and nearly $1.6 billion (6 percent) for administrative support (Exhibit 6).
EXHIBIT 6
TEXAS HEALTH AND HUMAN SERVICES COMMISSION SHARE OF MEDICAID AND CHIP EXPENDITURES, FISCAL 2015
69%15%
6%
4%6%
Acute Care Medical$17,776
Long-Term Services and Supports$3,952
Medicare Premiums and Payments$1,501
Children’s Health Insurance Program$881
Medicaid and CHIP Administration$1,553
IN MILLIONS
Source: Texas Health and Human Services Commission
Note: Medicaid and CHIP Administration costs include costs for LTSS services provided at DADS. LTSS costs reflect only those provided under HHSC.

TEXAS HEALTH CARE SPENDING: FISCAL 2015
Glenn Hegar, Texas Comptroller of Public Accounts6
Texas Department of Aging and Disability ServicesAs noted, DADS was merged into HHSC as of September 1, 2016. In the period of our analysis, DADS administered Medicaid long-term care through community and institutional settings for the elderly and disabled, including residential services for persons with intellectual disabilities in state-supported learning centers (formerly called state schools).
These expenditures are supported by general revenue and federal funds. State funds are required as a match to draw down federal funds for Medicaid, which provides
the majority of funding for long-term care services and support for the elderly and disabled.
In fiscal 2015, DADS spent $4.7 billion on long-term care services, such as daily needs assistance, employment services, home improvements and hospice care. The state’s share of health expenditures for fiscal 2015 totaled almost $1.9 billion, or about 40 percent of total DADS funds. Federal funds totaled $2.8 billion (Exhibits 7 and 8).
DADS spending for LTSS declined by nearly 24 percent between fiscal 2011 and 2015 due to the shift of many of these services to STAR+Plus, a managed care program, at HHSC between fiscal 2011 and 2015. Total DADS and
2011 2012 2013 2014 2015
State Federal
$0
$1,000
$2,000
$3,000
$4,000
$5,000
$6,000
$7,000
$4,128
$2,069
$3,449
$2,357
$3,414
$2,181
$3,495
$2,287
$2,844
$1,884
IN MILLIONS
EXHIBIT 7
TEXAS DEPARTMENT OF AGING AND DISABILITY SERVICES FUNDING SOURCES FOR HEALTH CARE EXPENDITURES, FISCAL 2011-2015
Source: Texas Health and Human Services Commission

TEXAS HEALTH CARE SPENDING: FISCAL 2015
Glenn Hegar, Texas Comptroller of Public Accounts7
HHSC spending for LTSS rose by 18 percent from fiscal 2011 to 2015. During this period, Medicaid caseloads for clients eligible for LTSS grew by slightly more than 7 percent.7
Payments to nursing facilities represented 31 percent of DADS’ spending on long-term care, making it the agency’s largest single expenditure category in fiscal 2015. Home and community-based services represented 20 percent of long-term care spending in fiscal 2015. Services provided at state-supported living centers accounted for 15 percent, while community attendant services accounted for 13 percent. While DADS paid for nursing home, hospice care and state school services in institutional settings, its primary focus was on long-term care services in the home and community (Exhibit 9).8
State
Federal39.8%60.2%
32%
20%15%
13%
5%
Nursing Facility$1,457
Home and Community-Based Services$949
State Supported Living Centers$686
Community Attendant Services$610
IN MILLIONS5%
5%
6%Intermediate Care Facilities$270
Hospice$257
Community Living Assistance and Support Services$250
Others*$248
EXHIBIT 8
TEXAS DEPARTMENT OF AGING AND DISABILITY SERVICES FUNDING SOURCES FOR HEALTH
CARE EXPENDITURES, FISCAL 2015
Source: Texas Health and Human Services Commission
EXHIBIT 9
TEXAS DEPARTMENT OF AGING AND DISABILITY SERVICES SHARE OF MEDICAID LONG-TERM CARE EXPENDITURES, FROM ALL FUNDS, FISCAL 2015
Source: Texas Health and Human Services Commission
*Other includes Medically Dependent Childrens Program, Primary Home Care, Day Activity and Health Services, Texas Home Living, PACE, and Deaf-Blind Multiple Disability Program. All programs at DADS are fee-for-service and do not include the LTSS programs at HHSC.

TEXAS HEALTH CARE SPENDING: FISCAL 2015
Glenn Hegar, Texas Comptroller of Public Accounts8
TEXAS MEDICAID EXPENDITURES
Nearly all health care spending of the top two agencies, HHSC and DADS, was for Medicaid, a state-administered federal program that provides medical and long-term care to eligible low-income individuals, families, the elderly and persons with disabilities. As of September 1, 2016, all Medicaid programs and activities have been consolidated in the Medicaid and CHIP Services Department at HHSC.9 The Texas Medicaid program is state government’s second-largest function (after Education).10 In fiscal 2015, Texas spent more than $30.3 billion in state and federal funds for Medicaid and CHIP, with Medicaid representing 97 percent of that amount.
Texas general revenue and general revenue-dedicated Medicaid spending totaled $11.8 billion in fiscal 2015. The average per-member monthly cost for acute and long-term care was $529. Non-disabled children comprise most of the Medicaid population (about 69 percent), but represented only 32 percent of all Medicaid spending on direct health care services in fiscal 2015. The aged, blind and disabled accounted for 24 percent of Texas Medicaid clients, but 59 percent of the program’s expenditures (Exhibit 10).11
Note that fiscal 2015 Medicaid expenditures include acute care, vendor drug, and LTSS. Expenditures are for Medicaid clients only and do not include disproportionate share hospital (DSH) payments or uncompensated care
EXHIBIT 10
TEXAS MEDICAID BENEFICIARIES AND EXPENDITURES COMPARED TO CASELOAD FISCAL 2015
Source: Texas Health and Human Services Commission, June 2016
Note that fiscal 2015 Medicaid expenditures include acute care, vendor drug and long-term services and supports. Expenditures are for Medicaid
0-19. Disability-related children are included in aged and disability-related category.
clients only and do not include DSH payments or uncompensated care costs. Costs include all Medicaid beneficiaries, including emergency services for non-citizens, school health and related services, and Medicare payments for partial dual eligibles. Children include all poverty-level children aged
32%
9%
0
10
20
30
40
50
60
70
80
90
100
Caseload Expenditures
Aged & Disability Related Non-Disabled Adults Non-Disabled Children
28% Acute-CareServices includeMedicare PremiumPayments
31% Long-TermServices and Supports, including STAR+Plus
24%
7%
69%
59%
9%
32%
TEXAS HEALTH CARE SPENDING: FISCAL 2015
Glenn Hegar, Texas Comptroller of Public Accounts9
costs. Costs include all Medicaid beneficiaries, including emergency services for non-citizens, school health and related services, and Medicare payments for partial dual eligibles. Children include all poverty-level children aged 0-19. Disability-related children are included in the aged and disability-related category.
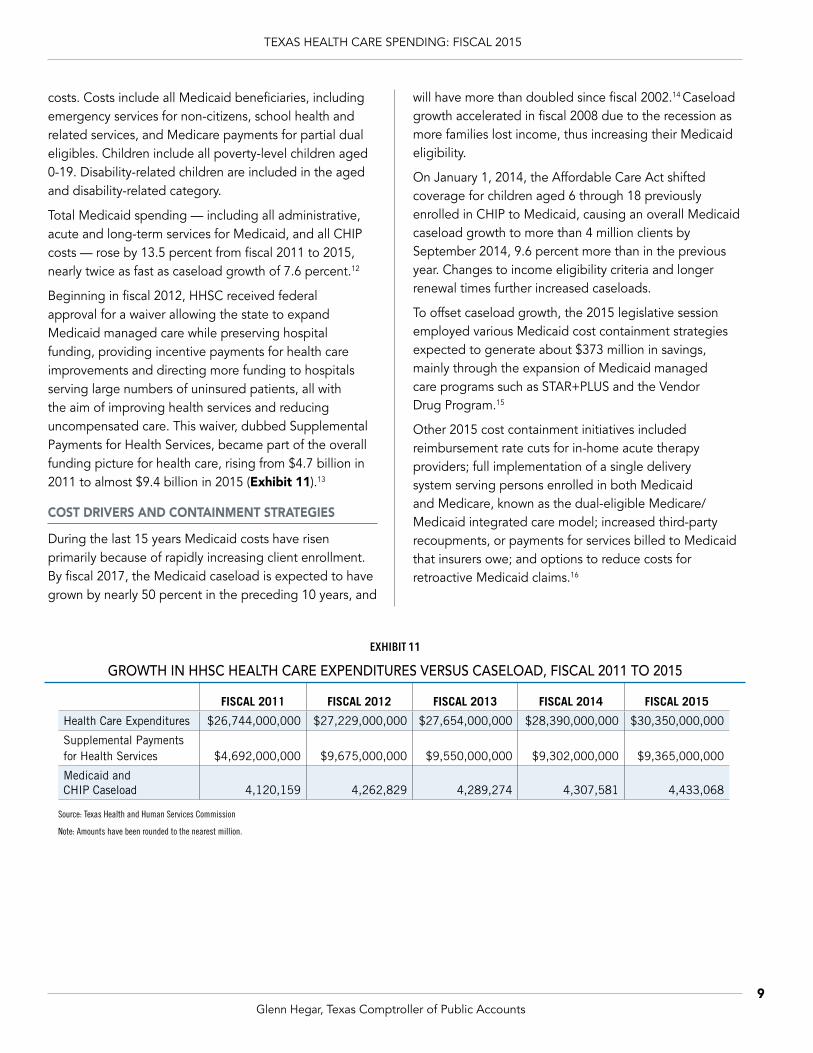
Total Medicaid spending — including all administrative, acute and long-term services for Medicaid, and all CHIP costs — rose by 13.5 percent from fiscal 2011 to 2015, nearly twice as fast as caseload growth of 7.6 percent.12
Beginning in fiscal 2012, HHSC received federal approval for a waiver allowing the state to expand Medicaid managed care while preserving hospital funding, providing incentive payments for health care improvements and directing more funding to hospitals serving large numbers of uninsured patients, all with the aim of improving health services and reducing uncompensated care. This waiver, dubbed Supplemental Payments for Health Services, became part of the overall funding picture for health care, rising from $4.7 billion in 2011 to almost $9.4 billion in 2015 (Exhibit 11).13
COST DRIVERS AND CONTAINMENT STRATEGIES
During the last 15 years Medicaid costs have risen primarily because of rapidly increasing client enrollment. By fiscal 2017, the Medicaid caseload is expected to have grown by nearly 50 percent in the preceding 10 years, and
will have more than doubled since fiscal 2002.14 Caseload growth accelerated in fiscal 2008 due to the recession as more families lost income, thus increasing their Medicaid eligibility.
On January 1, 2014, the Affordable Care Act shifted coverage for children aged 6 through 18 previously enrolled in CHIP to Medicaid, causing an overall Medicaid caseload growth to more than 4 million clients by September 2014, 9.6 percent more than in the previous year. Changes to income eligibility criteria and longer renewal times further increased caseloads.
To offset caseload growth, the 2015 legislative session employed various Medicaid cost containment strategies expected to generate about $373 million in savings, mainly through the expansion of Medicaid managed care programs such as STAR+PLUS and the Vendor Drug Program.15
Other 2015 cost containment initiatives included reimbursement rate cuts for in-home acute therapy providers; full implementation of a single delivery system serving persons enrolled in both Medicaid and Medicare, known as the dual-eligible Medicare/Medicaid integrated care model; increased third-party recoupments, or payments for services billed to Medicaid that insurers owe; and options to reduce costs for retroactive Medicaid claims.16
EXHIBIT 11
GROWTH IN HHSC HEALTH CARE EXPENDITURES VERSUS CASELOAD, FISCAL 2011 TO 2015
FISCAL 2011 FISCAL 2012 FISCAL 2013 FISCAL 2014 FISCAL 2015
Health Care Expenditures $26,744,000,000 $27,229,000,000 $27,654,000,000 $28,390,000,000 $30,350,000,000
Supplemental Payments for Health Services $4,692,000,000 $9,675,000,000 $9,550,000,000 $9,302,000,000 $9,365,000,000
Medicaid and CHIP Caseload 4,120,159 4,262,829 4,289,274 4,307,581 4,433,068
Source: Texas Health and Human Services Commission
Note: Amounts have been rounded to the nearest million.

TEXAS HEALTH CARE SPENDING: FISCAL 2015
Glenn Hegar, Texas Comptroller of Public Accounts10
2011 2012 2013 2014 2015
State Federal
$0
$500
$1,000
$1,500
$2,000
$2,500Other
$1,069.5
$579.1
$1,026.3
$522.9
$1,199.9
$544.8
$1,404.3
$456.7
$1,363.6$140.9
$168.9
$205.8$225.3 $225.0
$533.6
IN MILLIONS
Texas Department of State Health ServicesDSHS provides psychiatric services through the state’s mental health hospitals and administers public health programs including disease prevention, community health and substance abuse services.
DSHS supports more than 7,900 client services and administrative contracts. In 2014, 159,000 adults and children received community mental health services and 21,000 adults and youths were given substance abuse treatment through the agency.17
DSHS spent $2.1 billion on health care in fiscal 2015, up 19 percent from fiscal 2011. State expenditures, including general revenue and dedicated funds, rose by 27 percent from 2011 to 2015, from $1.1 billion to $1.4 billion, and comprised 64.3 percent of the agency’s total health care spending in 2015. In the same period, federal spending fell by 8 percent and made up 25.1 percent of DSHS health care expenditures in 2015 (Exhibits 12 and 13).
EXHIBIT 12
TEXAS DEPARTMENT OF STATE HEALTH SERVICES FUNDING SOURCES FOR HEALTH CARE EXPENDITURES, FISCAL 2011-2015
Source: Texas Health and Human Services Commission
EXHIBIT 13
TEXAS DEPARTMENT OF STATE HEALTH SERVICES FUNDING SOURCE FOR HEALTH CARE EXPENDITURES
FISCAL 2015
Source: Texas Health and Human Services Commission
State
Federal
Other
25.1%
64.3%
10.6%

TEXAS HEALTH CARE SPENDING: FISCAL 2015
Glenn Hegar, Texas Comptroller of Public Accounts11
DSHS provides community-based mental health services to adults and children through contracts with 39 community mental health centers and the managed care program NorthSTAR. It also operates the Texas Center for Infectious Disease and 10 state mental health hospitals that provide short- and long-term inpatient hospitalization for general psychiatric services.
The largest share of DSHS health care expenses in fiscal 2015 supported behavioral health services: 29.3 percent for community mental health services, 24.5 percent for state hospitals and 7.8 percent for substance abuse services. The remaining 38.4 percent of “other” expenditures represent spending on infectious disease, preparedness and regulatory strategies for healthcare professionals and facilities, emergency medical services, environmental health and food and drug safety activities (Exhibit 14).18
COST DRIVERS AND CONTAINMENT STRATEGIES
DSHS behavioral health costs are driven by several factors, including staff shortages, the high cost of treatment and expensive, long-term hospitalizations. Community-based and institutional mental health services require both expensive medications and enough clinical staffing to provide 24-hour psychiatric and medical care; these facilities often are at full capacity.
State hospital salaries are significantly below market rates, which makes recruiting and retaining clinical and direct care staff (66 percent of state hospital employees) difficult at best. Psychiatric staff shortages, moreover, can lead to costly incidents and injuries. Better screening, newer technologies and new, expensive pharmaceuticals also increase treatment costs, while extended hospital stays increase the cost per patient.
As of February 2016, 711 Texas patients had stayed in state mental health hospitals for more than one year, despite indications that at least some of them are capable of living with full independence. To mitigate the cost of expensive inpatient care, the state has outsourced a range of community-based outpatient mental health services. In fiscal 2015, 22,679 individuals received facility-based crisis services and 77,452 received other crisis-response services.
The newly created Statewide Behavioral Health Coordinating Council is developing a five-year behavioral health strategic plan and statewide expenditure proposal for fiscal 2017. The plan is intended to ensure that the 18 state agencies providing behavioral health services coordinate their programs and services to eliminate redundancy, identify and use best practices, ensure optimal service delivery and collect comparable results and effectiveness data.19
EXHIBIT 14
TEXAS DEPARTMENT OF STATE HEALTH SERVICES SHARE OF EXPENDITURES, FROM ALL FUNDS, FISCAL 2015
Source: Texas Health and Human Services Commission
38.4%
29.3%
7.8%
Other Services$815
Community Mental Health Services$622
State Hospitals$520
Substance Abuse Services$166
IN MILLIONS
24.5%

TEXAS HEALTH CARE SPENDING: FISCAL 2015
Glenn Hegar, Texas Comptroller of Public Accounts12
Employees Retirement System of Texas (ERS)ERS administers the Texas Employees Group Benefits Program (GBP) health insurance plans, which provided health, life and dental coverage to nearly 541,600 participants in fiscal 2015.20 ERS participants include enrolled employees and retirees of state agencies and state higher education institutions (except the University of Texas System and Texas A&M University System), the Texas County and District Retirement System, Texas Municipal Retirement System, Community Supervision and Corrections Department and Windham School District, as well as their dependents.21
Since 1992, ERS has offered participants the self-funded medical plan HealthSelect. Today, HealthSelect covers about 95 percent of active employees and 83 percent of all participants, including retirees and dependents. The remaining members are covered through HMOs administered by Community First Health, Scott & White Health or KelseyCare.22
Participants help fund the GBP through dependent premium contributions, copays, coinsurance, prescription deductibles and other payments. The state covers benefits for active and retired members, while dependent costs are shared between the state and members. In fiscal 2015, the HealthSelect state cost was about $484 per participant monthly.
In fiscal 2015, expenditures for state employee and retiree medical benefits were $1.9 billion, compared to nearly $1.6 billion in fiscal 2011, an increase of 19.7 percent in five years. The state’s share of GBP health expenditures for fiscal 2015 totaled about $1.4 billion, a 23.4 percent increase from $1.1 billion in fiscal 2011. Federal and other funding accounted for the remaining $545 million in fiscal 2015, 11.5 percent more than the $489 million spent in fiscal 2011 (Exhibit 15). Figures in the exhibits do not include participant contributions such as copays, deductibles or dependent contributions.
State dollars fund the majority of ERS group benefits. In fiscal 2015, state funds expended on GBP medical
EXHIBIT 15
EMPLOYEES RETIREMENT SYSTEM OF TEXAS FUNDING SOURCES FOR GROUP BENEFITS PROGRAM CONTRIBUTIONS, FISCAL 2011-2015
Source: Employees Retirement System of Texas
Note: Amounts represent agency contributions and do not include ERS contingency funds, local amounts, participant contributions or other funds.
2011 2012 2013 2014 2015
State Federal
$0
$200
$400
$600
$800
$1,000
$1,200
$1,400
$1,600
$1,800
$2,000Other
$252
$1,099
$237
$1,011
$255
$1,082
$271
$1,246
$292$237
$223$242
$231
$253
$1,355
IN MILLIONS

TEXAS HEALTH CARE SPENDING: FISCAL 2015
Glenn Hegar, Texas Comptroller of Public Accounts13
benefits accounted for 71.3 percent of the total, while federal funds accounted for another 15.4 percent and other funds for 13.3 percent (Exhibit 16).
COST DRIVERS AND CONTAINMENT STRATEGIES
Rising prescription drug costs and a growing retiree population are the most significant cost drivers for the ERS HealthSelect plan. The share of prescription costs paid by HealthSelect members has fallen by more than half in the last decade. Because participant copays for prescriptions and doctor visits have remained flat while total charges increase, plan costs have risen steadily (Exhibit 17).
The rapid increase in HealthSelect drug costs is due largely to “specialty” drugs, costly new drugs still under patent protection. The plan paid $248 million in fiscal 2015 for more than 57,000 specialty claims. Specialty drug spending in fiscal 2015 represented 31 percent of the total plan cost for drugs, compared with just 2.7 percent in fiscal 2001 (Exhibit 18).
While the number of active employees in the Texas Employees Group Benefits Program (GBP) is holding fairly steady, the retiree population has more than
State
Federal
Other71.3%
15.4%
13.3%
0%
20%
40%
60%
80%
100%
FY04 FY05 FY06 FY07 FY08 FY09 FY10 FY11 FY12 FY13 FY14 FY15
Member Cost Share Plan Cost Share
39%
61%
14%
86%
EXHIBIT 16
EMPLOYEES RETIREMENT SYSTEM OF TEXAS FUNDING SOURCES FOR GROUP BENEFITS PROGRAM
EXPENDITURES, FISCAL 2015
Source: Employees Retirement System of Texas
Note: Amounts represent agency contributions and do not include ERS contingency funds, local amounts, participant contributions or other funds.
EXHIBIT 17
EMPLOYEES RETIREMENT SYSTEM OF TEXAS PERCENT SHARE OF MEMBER AND PLAN HEALTHSELECT TOTAL DRUG COST, FISCAL 2004-2015
Source: Employees Retirement System of Texas

TEXAS HEALTH CARE SPENDING: FISCAL 2015
Glenn Hegar, Texas Comptroller of Public Accounts14
$0
$50
$100
$150
$200
$250
$300
2004 2005 20062001 2002 2003 2007 2008 2009 2010 2011 2012 2013 2014 2015
$17 $23$4 $6 $10
$41 $53$66
$101
$248
IN MILLIONS
$29 $35
$78
$129
$172
doubled since 1995. The 26 percent growth in GBP membership during the last two decades is due largely to the increasing number of retirees (Exhibit 19).
The HealthSelect benefit cost trend nevertheless is lower than those seen nationally, and administrative costs represent less than three cents of every health plan dollar. Even so, proactive cost management is an imperative in the face of growing utilization of health care, new and more expensive technologies and treatments, an aging plan membership and increasing rates of chronic disease.
When GBP retirees and their dependents become eligible for Medicare-primary coverage, they are automatically enrolled in HealthSelect Medicare Advantage (MA). Benefits offered to GBP retirees under HealthSelect MA are comparable to those of regular HealthSelect but the MA premiums are less expensive for the state and retirees due to Medicare subsidies.
EXHIBIT 18
EMPLOYEES RETIREMENT SYSTEM OF TEXAS HEALTHSELECT ANNUAL SPECIALTY DRUG PLAN COST, FISCAL 2011-2015
1995 2015
Retirees
Employees
0
50,000
100,000
150,000
200,000
250,000
300,000
350,000
41,556
209,026
101,472
213,405
Source: Employees Retirement System of Texas
EXHIBIT 19
EMPLOYEES RETIREMENT SYSTEM OF TEXAS GROUP BENEFITS PROGRAM MEMBER ENROLLMENT
(NOT INCLUDING DEPENDENTS)
Source: Employees Retirement System of Texas

TEXAS HEALTH CARE SPENDING: FISCAL 2015
Glenn Hegar, Texas Comptroller of Public Accounts15
On January 1, 2013, prescription drug coverage for most Medicare-primary participants was moved to a self-funded Employer Group Waiver Program called Medicare Rx, administered by SilverScript. Between fiscal 2013 and 2015, Medicare Part D federal subsidies reduced plan costs by $169 million.
Teacher Retirement System of TexasThe Teacher Retirement System of Texas administers two health benefit programs: one for current public school employees and their dependents, the Texas Active School Employees Uniform Group Health Coverage Program (TRS-ActiveCare); and one for retirees and their dependents, the Texas Public School Retired Employees Group Benefits Program (TRS-Care).
TRS-ACTIVECARE
TRS-ActiveCare was established in 2001 through legislation that became Chapter 1579 of the Texas Insurance Code.23 TRS-ActiveCare is a self-funded program supported by state, district and employee contributions.
The state is statutorily required to contribute $900 each fiscal year for each employee of participating school districts, charter schools, regional education service centers and educational districts. For school districts and charter schools, the state’s contribution is delivered through school funding formulas.
As of August 31, 2015, TRS-ActiveCare covered 290,354 employee participants employed by about 1,100 participating entities. Aetna administers the preferred provider organization (PPO) health plans offered under TRS-ActiveCare, while Caremark administers the pharmacy benefit. Employees can choose from three PPO plans and, in certain areas, also have the option of enrolling in a health maintenance organization.
In fiscal 2015, estimated state expenditures for employees participating in TRS-Active Care totaled approximately $261 million. From fiscal 2011 through 2015, state expenditures for TRS-ActiveCare rose by 13.4 percent (Exhibit 20).
EXHIBIT 20
TEACHER RETIREMENT SYSTEM OF TEXAS: TRS-ACTIVECARE ESTIMATED ANNUAL STATE PROGRAM EXPENDITURES, FISCAL 2011-2015
Note:
Source: Teacher Retirement System of Texas
TRS estimates state contributions to TRS-ActiveCare to set annual premiums and illustrate revenue sources for lawmakers and other stakeholders. The figures above are approximations based on program enrollment data and do not reflect actual state contributions. For PPO plans, estimated state contributions are based on an allocation of actual total contributions received. For HMO plans, estimated state contributions are based on $75 per enrolled employee per month.
2011 2012 2013 2014 2015
PPO Plans HMO Plans
$190
$200
$210
$220
$230
$240
$250
$260
$270
$11
$219
$13
$232
$15
$232
$21
$230
$24
$237
IN MILLIONS

TEXAS HEALTH CARE SPENDING: FISCAL 2015
Glenn Hegar, Texas Comptroller of Public Accounts16
TRS-CARE
TRS-Care is a self-funded health benefit program for retired public education employees and their dependents. TRS-Care was established in 1985 through Chapter 1575 of the Texas Insurance Code.24 As of August 31, 2015, the TRS-Care program covered about 253,000 retirees, dependents and surviving spouses. Aetna administers the health plan and Express Scripts administers the pharmacy benefit.
TRS-Care receives state general revenue contributions equal to 1 percent of the salaries of all active public education employees. In addition to these contributions, TRS-Care is funded by retiree premiums as well as contributions from active public education employees and local school districts. The active public education employee contribution rate is 0.65 percent of payroll, while school districts contribute 0.55 percent of payroll.
The Texas Legislature made a one-time reduction to the state contribution rate in fiscal 2013, lowering it from 1 to 0.5 percent of the salaries of all active public education employees. To make up some of the funds lost through the rate reduction, the Legislature appropriated $102 million in supplemental funds in that year.
In fiscal 2013, 2014 and 2015, the Legislature made further supplemental appropriations to fund TRS-Care benefits above the legislatively mandated state contribution.
In fiscal 2015, the state provided more than $1 billion in general revenue to fund TRS-Care — $281.1 million in statutory formula contributions plus an additional $768.1 million in supplementary appropriations intended to maintain the system’s viability (Exhibit 21).
In fiscal 2015, supplemental appropriations outpaced regular formula appropriations to TRS-Care by a ratio of almost three to one (Exhibit 22).
Again, TRS-Care funding is linked to active public school and charter school employee payrolls. This funding, however, has not kept pace with rising health care costs, necessitating the supplemental appropriations of recent years. A Joint Committee on TRS Health Benefit Plans was assigned to study the sustainability of TRS-Care and the affordability of TRS-ActiveCare. The joint committee delivered their report to the 85th legislature in November 2016.
2011 2012 2013 2014 2015
Statutory Formula Supplemental Appropriations
$0
$200
$400
$600
$800
$1000
$1200
$257 $248 $102$127
$36
$267
$768
$281
IN MILLIONS
EXHIBIT 21
TEACHER RETIREMENT SYSTEM OF TEXAS TRS-CARE STATE GENERAL REVENUE CONTRIBUTIONS, FISCAL 2011-2015
Source: Teacher Retirement System of Texas

TEXAS HEALTH CARE SPENDING: FISCAL 2015
Glenn Hegar, Texas Comptroller of Public Accounts17
EXHIBIT 22
TEACHER RETIREMENT SYSTEM OF TEXAS TRS-CARE STATE GENERAL REVENUE CONTRIBUTIONS, FISCAL 2015
Source: Teacher Retirement System of Texas
Statutory Formula
Supplemental Appropriations
26.8%
73.2%
COST DRIVERS AND CONTAINMENT STRATEGIES
TRS secures competitive contracts with health plan administrators and pharmacy benefit managers that negotiate cost-effective agreements with providers and pharmacies. TRS closely monitors health care trends and works with its vendors to contain costs while delivering high-quality care.
One cost element TRS watches closely is the increased use and cost of prescription drugs. TRS-Care’s retirees and dependents represent an older population with greater health needs. Prescription drugs make up a large share of the program’s overall costs, accounting for 45 percent of claims net of rebates in fiscal 2015.
In fiscal 2015, specialty drug costs for TRS-Care plans increased about 30 percent and non-specialty drug costs increased 13 percent. Specialty drugs are expected to remain a key cost driver as more enter the pipeline to market and few are slated to lose patent status in the near future.
In fiscal 2014, TRS-ActiveCare pharmacy costs increased by 12 percent due in large part to the expansion of compound pharmacies — pharmacies that prepare medications tailored specifically to the individual patient. TRS-ActiveCare spent nearly $30 million on compound
medications in 2014, and has since tightened controls on their use, reducing its tab for compound medicines to less than $500,000 in fiscal 2015.
From fiscal 2011 to 2015, the number of emergency room visits by TRS-Care members rose by 13 percent, from 227 to 256 per 1,000 members. Members aged 70 and older have the highest rate of emergency room use. Since fiscal 2013, use of freestanding emergency rooms by TRS-ActiveCare members nearly doubled, from roughly 7 percent to almost 13 percent. A significant portion of the services members receive at emergency rooms, moreover, are for non-emergency care.
Individuals with claims greater than $150,000 were the primary cost driver for TRS-Care in fiscal 2015. Of these members, 71 percent had complications stemming from chronic conditions. High-cost claimants represented
5 percentage points of the 9 percent total cost growth for TRS-Care.
Since fiscal 2011, annual growth for the TRS-Care population has been between 3 and 6 percent. In the study period, the number of members under age 65 ineligible for Medicare rose by 11 percent, from 71,071 to 78,858. Participants under age 65 have the highest medical costs because TRS-Care is the primary payer for medical expenses until members become eligible for Medicare. In fiscal 2015, 88 percent or $65 million of the increase in medical claims for TRS-Care’s self-funded plan was generated by enrollees under age 65.
TRS made Medicare Part D prescription drug coverage available beginning in 2013. As of August 31, 2015, 123,000 TRS-Care members were enrolled in Medicare Part D prescription drug coverage. TRS receives federal subsidies for all Medicare beneficiaries, but those enrolled in Medicare Part D generate more subsidies to offset costs.
TRS has more flexibility to make cost savings plan changes to TRS-ActiveCare than to TRS-Care. Beginning in fiscal 2014, TRS restructured TRS-ActiveCare plan offerings and eliminated the highest tier plan with the richest benefit design. The remaining three plan options available through TRS-ActiveCare have higher out-of-pocket costs while offering more affordable premiums.

TEXAS HEALTH CARE SPENDING: FISCAL 2015
Glenn Hegar, Texas Comptroller of Public Accounts18
OTHER STATE AGENCIES REPORTING HEALTH CARE EXPENDITURESIn addition to the agencies mentioned previously, several other state agencies and institutions of higher education provided health care-related goods, services, programs, research and other activities in fiscal 2015.
Cancer Prevention and Research Institute of TexasThe Cancer Prevention and Research Institute of Texas (CPRIT) administers cancer research and prevention programs and services for the state. In 2007, voters approved a constitutional amendment that established CPRIT and authorized it to issue up to $3 billion in general obligation bonds to fund grants to public and private-sector projects to find cures for and prevent cancers.
CPRIT has a rigorous peer review process to evaluate grant applications. The Oversight Committee, CPRIT’s governing board, approves applications that make it through the peer review process for grant awards in a wide variety of cancer research areas and for the delivery
of evidence-based cancer prevention programs and services by entities located in Texas.
The first requests for applications were issued August 2009, and the initial award distributed in November 2009. To date more than half of the general obligation bonds authorized, or $1.5 billion, has been awarded to various organizations, including many state academic institutions.
CPRIT’s grant expenditures fluctuate from year to year depending on the frequency of applications as well as the volume and terms of current and previous awards. Most if not all funded grants are awarded for multiple years. For instance, in 2016 CPRIT was still reimbursing grants awarded in fiscal 2011 and 2012. The amount of grant expenditure changes quarterly after reimbursement requests are submitted, reviewed, approved and processed.
From fiscal 2011 to 2015, CPRIT’s total grant expenditures equaled $577.6 million, with about two-thirds of the funds ($388.1 million) spent on the multiyear grants awarded in fiscal 2010 and 2011. Expenditures from grants awarded since fiscal 2013 are much lower, with $33.9 million expended from fiscal 2015 grant awards (Exhibit 23).
2011 2012 2013 2014 2015
$0
$50
$100
$150
$200
$250
$182.0
$206.1
$64.0
$91.6
$33.9
IN MILLIONSState
EXHIBIT 23
CANCER PREVENTION AND RESEARCH INSTITUTE OF TEXAS HEALTH CARE GRANT EXPENDITURES, FISCAL 2011-2015
Source: Cancer Prevention and Research Institute of Texas, July 2016

TEXAS HEALTH CARE SPENDING: FISCAL 2015
Glenn Hegar, Texas Comptroller of Public Accounts19
The State Office of Risk ManagementThe State Office of Risk Management (SORM) manages workers’ compensation for most Texas state employees and provides risk management services to help them avoid injuries and illnesses on the job. (The University of Texas and Texas A&M University systems, as well as the Texas Department of Transportation, maintain their own workers’ compensation programs. ERS and TRS reimburse SORM directly for the costs of their members’ workers’ compensation claims, which the office administers on their behalf.)
SORM processes payments to cover medical treatment for on-the-job injuries and work-related illnesses. State
entities covered under the system are assessed an annual amount proportional to their payrolls, staffing and loss histories.
SORM spending, which includes the agency’s administrative costs for processing and paying medical and indemnity claims, fluctuates from year to year depending on the frequency and severity of state employee injuries. Injury rates have declined in the past 10 years.25
From fiscal 2011 through 2015, SORM’s total expenditures fell by 9.1 percent, while state-funded expenditures decreased by 8.7 percent (Exhibit 24). Federal funds rose by 1.1 percent during the same period. In fiscal 2015,
EXHIBIT 24
STATE OFFICE OF RISK MANAGEMENT FUNDING SOURCES FOR HEALTH CARE EXPENDITURES, FISCAL 2011-2015
Source: State Office of Risk Management
2011 2012 2013 2014 2015
State Federal
$0
$5
$10
$15
$20
$25
$30
$35
$40Other
$4.9
$24.6$4.8
$22.0
$4.4
$22.6
$4.3
$21.9
$5.0
$4.1
$3.6 $4.0$2.1
$3.1
$22.4
IN MILLIONS

TEXAS HEALTH CARE SPENDING: FISCAL 2015
Glenn Hegar, Texas Comptroller of Public Accounts20
State
Federal
Other
73.4%
16.4%
10.2%
state funds represented 73.4 percent of the agency’s expenditures (Exhibit 25).
EXHIBIT 25
STATE OFFICE OF RISK MANAGEMENT FUNDING SOURCES FOR HEALTH CARE EXPENDITURES,
FISCAL 2015
Source: State Office of Risk Management
Department of Assistive and Rehabilitative ServicesAs noted, 2015 legislation abolished the Texas Department of Assistive and Rehabilitative Services as of September 1, 2016. Its services were transferred to HHSC and the Texas Workforce Commission, and its independent living services outsourced through a contract with the Centers for Independent Living.
Until its abolition, DARS administered programs to promote development and independence in adults with disabilities and children with developmental delays. These programs fell into four categories:
• rehabilitation services, including therapy, job counseling, advocacy and technical support for the disabled (now assigned to the Texas Workforce Commission);
• services for the blind, including programs for independent living, training and employment (now assigned to HHSC);
• early childhood intervention, providing support to families with children from birth through age three with disabilities and developmental delays (now assigned to HHSC); and
• disability determination for the federal Social Security program (now assigned to HHSC).26
DARS expenditure of state dollars on health care rose by 17.1 percent from fiscal 2011 to 2015, while its spending of federal funds fell by 3.4 percent. DARS total health care spending fell by 1.9 percent from fiscal 2011 to 2015. Federal funds represented DARS largest source of health care spending, followed by state funds and other funding sources. One-time ARRA funding in 2011 is reflected in these figures (Exhibits 26 and 27).

TEXAS HEALTH CARE SPENDING: FISCAL 2015
Glenn Hegar, Texas Comptroller of Public Accounts21
2011 2012 2013 2014 2015
State Federal
$0
$20
$40
$60
$80
$100
$120
$140
$160
$180Other
$101.4
$44.5
$95.6
$54.8
$96.2
$51.0
$92.5
$57.0
$98.0$0.2
$52.1
IN MILLIONS
$8.2 $5.9$1.1$0.9
State
Federal
Other
34.5%
64.8%
0.7%
EXHIBIT 26
DEPARTMENT OF ASSISTIVE AND REHABILITATIVE SERVICES FUNDING SOURCES FOR HEALTH CARE EXPENDITURES, FISCAL 2011-2015
Source: Texas Health and Human Services Commission
EXHIBIT 27
DEPARTMENT OF ASSISTIVE AND REHABILITATIVE SERVICES FUNDING SOURCES FOR HEALTH CARE EXPENDITURES,
FISCAL 2015
Source: Texas Health and Human Services Commission

TEXAS HEALTH CARE SPENDING: FISCAL 2015
Glenn Hegar, Texas Comptroller of Public Accounts22
2011 2012 2013 2014 2015
State Federal
$0
$1
$2
$3
$4
$5
$6
$7
$8
$3.7$0.08
$3.4
$0.08
$4.1
$0.09
$5.2
$6.7
IN MILLIONS
$0.08
$0.09
Texas Department of Family Protective ServicesDFPS is responsible for protecting children, elderly adults and individuals with disabilities from abuse and neglect. DFPS clients receive medical, psychological and substance-abuse treatment and prevention counseling services.
DFPS medical and psychological counseling services are funded almost entirely through Medicaid, and therefore these expenditures are included in HHSC costs. DFPS participates in the administration of health services to clients, however, and employs a medical director and staff to oversee their care and provide substance abuse treatment and prevention counseling.
DFPS state-funded expenditures for health care rose by 82.8 percent from fiscal 2011 to 2015. Expenditures of federal funds increased by just 8.8 percent during the same period. In all, DFPS health care expenditures rose by 81.2 percent during this period (Exhibits 28 and 29).27
State
Federal
98.7%
1.3%
EXHIBIT 28
TEXAS DEPARTMENT OF FAMILY AND PROTECTIVE SERVICES FUNDING SOURCES FOR HEALTH CARE EXPENDITURES, FISCAL 2011-2015
Source: Texas Department of Family and Protective Services
EXHIBIT 29
TEXAS DEPARTMENT OF FAMILY AND PROTECTIVE SERVICES FUNDING SOURCES FOR HEALTH CARE
EXPENDITURES, FISCAL 2015
Source: Texas Department of Family and Protective Services

TEXAS HEALTH CARE SPENDING: FISCAL 2015
Glenn Hegar, Texas Comptroller of Public Accounts23
Texas School for the DeafThe Texas School for the Deaf (TSD) was established in 1856 to provide direct educational services to students who are deaf or hard of hearing and may have other disabilities. TSD also serves as an educational resource center on deafness, providing a variety of educational services and programs throughout the state. TSD provides health care services to its students, many of whom live on its campus in Austin.
TSD’s health care expenditures are covered entirely by state funding. From fiscal 2011 to 2015, this spending rose from $4.0 million to $5.2 million, a 27.5 percent increase (Exhibit 30).
The Texas School for the Blind and Visually ImpairedThe Texas School for the Blind and Visually Impaired (TSBVI) was originally established in 1856 as a public school for students who are blind, deaf and blind or visually impaired, including those with additional disabilities. Like TSD, TSBVI also serves as a statewide informational resource for parents and professionals. Its total health care expenditures rose by 30.3 percent, from $5.3 million to $7.0 million, between fiscal 2011 and 2015 (Exhibit 31).
2011 2012 2013 2014 2015
$0
$1
$2
$3
$4
$5
$6
$4.0
IN MILLIONS
$4.2$4.5 $4.7
$5.2
State
EXHIBIT 30
TEXAS SCHOOL FOR THE DEAF TOTAL STATE HEALTH CARE EXPENDITURES, FISCAL 2011-2015
Source: Texas School for the Deaf

TEXAS HEALTH CARE SPENDING: FISCAL 2015
Glenn Hegar, Texas Comptroller of Public Accounts24
EXHIBIT 31
TEXAS SCHOOL FOR THE BLIND AND VISUALLY IMPAIRED FUNDING SOURCES FOR HEALTH CARE EXPENDITURES, FISCAL 2011-2015
Source: Texas School for the Blind and Visually Impaired
2011 2012 2013 2014 2015
State Federal
$0
$1
$2
$3
$4
$5
$6
$7
$8
$0.7
$4.7
$0.6
$4.9
$0.6
$5.8
$0.6
$5.9
$0.7
$6.3
IN MILLIONS
During those five years, state expenditures rose from $4.7 million to $6.3 million, a 35 percent jump, while federal funding fell by 2.0 percent. Federal funds accounted for 9.3 percent of TSBVI’s health care expenditures in fiscal 2015. State sources accounted for 90.7 percent, up slightly from 87.5 percent in fiscal 2011 (Exhibit 32).
State
Federal
90.7%
9.3%
EXHIBIT 32
TEXAS SCHOOL FOR THE BLIND AND VISUALLY IMPAIRED FUNDING SOURCES FOR HEALTH CARE EXPENDITURES,
FISCAL 2015
Source: Texas School for the Blind and Visually Impaired
The University of Texas SystemBlueCross/BlueShield of Texas administers the University of Texas (UT) System’s employee health insurance coverage. Prescription drug benefits are a part of the UT SELECT Medical Plan and administered by Express Script. UT System employees receive a basic insurance package including health and life insurance and accidental death and dismemberment insurance. The UT System covers 100 percent of premiums for full-time employees and 50 percent for part-timers. It provided employee health insurance for about 196,070 participants in fiscal 2015.28

TEXAS HEALTH CARE SPENDING: FISCAL 2015
Glenn Hegar, Texas Comptroller of Public Accounts25
2011 2012 2013 2014 2015
State Other
$0
$100
$200
$300
$400
$500
$600
$700
$800
$900
$1,000
$304.6
$351.8
$335.7
$360.9
$359.4
$387.5
$396.0
$392.4
$431.8
$433.0
IN MILLIONS
The UT System’s state health insurance premium expenditures rose by 23.1 percent between fiscal 2011 and 2015, while spending from “other” funding sources rose by 41.8 percent. “Other” funding sources include premium sharing paid by system institutions from non-appropriated sources such as designated funds, restricted grants and endowments, physician practice plans and some patient income. In all, total spending for UT System employee health benefits rose by 31.8 percent between fiscal 2011 and 2015, from $656.4 million to $864.9 million (Exhibits 33 and 34).
In fiscal 2011, state spending for employee premiums accounted for 53.6 percent of the system’s employee health insurance total. During the next four fiscal years, from 2012 to 2015, the split between state and other funds moderated to about 50 percent.
The UT System covers its employees with a separate workers’ compensation program. The program is funded by a monthly payment made by each institution in the
State
Other50.1%49.9%
EXHIBIT 33
UNIVERSITY OF TEXAS SYSTEM EMPLOYEE HEALTH BENEFITS PREMIUMS FUNDING SOURCES FOR EXPENDITURES, FISCAL 2011-2015
Source: The University of Texas System
EXHIBIT 34
UNIVERSITY OF TEXAS SYSTEM EMPLOYEE HEALTH BENEFIT PREMIUMS
FUNDING SOURCES FOR EXPENDITURES, FISCAL 2015
Source: The University of Texas System
TEXAS HEALTH CARE SPENDING: FISCAL 2015
Glenn Hegar, Texas Comptroller of Public Accounts26
2011 2012 2013 2014 2015
State Other
$0
$1
$2
$3
$4
$5
$6
$7
$8
$4.2
$2.6
$3.8
$2.7
$3.2
$3.3
$4.5
$2.6
$4.7
$2.9
IN MILLIONS
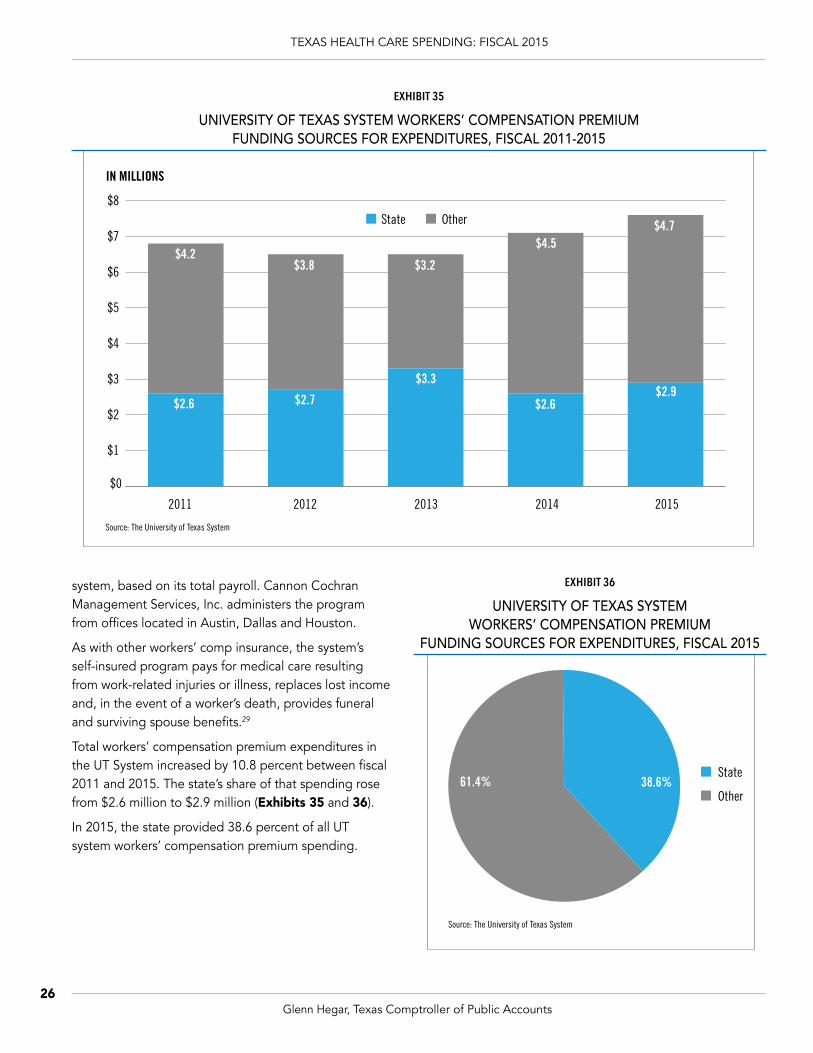
system, based on its total payroll. Cannon Cochran Management Services, Inc. administers the program from offices located in Austin, Dallas and Houston.
As with other workers’ comp insurance, the system’s self-insured program pays for medical care resulting from work-related injuries or illness, replaces lost income and, in the event of a worker’s death, provides funeral and surviving spouse benefits.29
Total workers’ compensation premium expenditures in the UT System increased by 10.8 percent between fiscal 2011 and 2015. The state’s share of that spending rose from $2.6 million to $2.9 million (Exhibits 35 and 36).
In 2015, the state provided 38.6 percent of all UT system workers’ compensation premium spending.
EXHIBIT 35
UNIVERSITY OF TEXAS SYSTEM WORKERS’ COMPENSATION PREMIUM FUNDING SOURCES FOR EXPENDITURES, FISCAL 2011-2015
State
Other38.6%61.4%
Source: The University of Texas System
EXHIBIT 36
UNIVERSITY OF TEXAS SYSTEM WORKERS’ COMPENSATION PREMIUM
FUNDING SOURCES FOR EXPENDITURES, FISCAL 2015
Source: The University of Texas System

TEXAS HEALTH CARE SPENDING: FISCAL 2015
Glenn Hegar, Texas Comptroller of Public Accounts27
2011 2012 2013 2014 2015
State Federal
$0
$50
$100
$150
$200
$250
Other
$105.2 $98.9 $97.2
$118.5
$58.9$53.9 $49.1
$60.7
$69.0
$134.8
IN MILLIONS
$4.5 $3.7 $3.6
$3.8$3.9
Texas A&M University SystemBlueCross/BlueShield also administers the Texas A&M University System’s employee health insurance, with Express Scripts providing prescription drug coverage.30 Employee health insurance for Texas A&M University System employees, retirees and survivors covered 54,618 participants in fiscal 2015.
Between fiscal 2011 and 2015, state spending on the system’s employee health insurance rose by 28.2 percent, from $105.2 million to $134.8 million. Federal funds fell by 14.9 percent in the same years. Total system health care expenditures rose by 23.1 percent, from $168.6 million in fiscal 2011 to $207.6 million in fiscal 2015 (Exhibits 37 and 38).
The Texas A&M University System maintains its own self-insured workers’ compensation program. Each member institution of the system pays an annual assessment against its payroll into a fund used to cover the costs of workers’ compensation insurance.31
State
Federal
Other
64.9%
2%
33%
EXHIBIT 37
FUNDING SOURCES FOR TEXAS A&M UNIVERSITY SYSTEM HEALTH BENEFITS EXPENDITURES, FISCAL 2011-2015
Source: Texas A&M University System
EXHIBIT 38
FUNDING SOURCES FOR TEXAS A&M UNIVERSITY SYSTEM HEALTH BENEFITS EXPENDITURES, FISCAL 2015
Source: Texas A&M University System

TEXAS HEALTH CARE SPENDING: FISCAL 2015
Glenn Hegar, Texas Comptroller of Public Accounts28
2011 2012 2013 2014 2015
State Other
$0.0
$0.5
$1.0
$1.5
$2.0
$2.5
$3.0
$3.5
Federal
$0.8
$1.1
$0.8
$1.1
$0.8
$1.1
$0.9
$1.3
$1.3
$1.8
IN MILLIONS
$0.1
$0.1
The system’s total workers’ compensation program expenditures rose by 65.1percent from 2011 to 2015. State expenditures, comprising the majority of this spending, rose by 62.8 percent, from about $1.1 million to $1.8 million (Exhibits 39 and 40).
In 2015, the state provided almost 56.6 percent of all TAMU system workers’ compensation spending.
EXHIBIT 39
FUNDING SOURCES FOR TEXAS A&M UNIVERSITY SYSTEM WORKERS’ COMPENSATION EXPENDITURES, FISCAL 2011-2015
Source: Texas A&M University System
Note: Increase in 2015 due to lower reserves in previous fiscal years.
EXHIBIT 40
FUNDING SOURCES FOR TEXAS A&M UNIVERSITY SYSTEM WORKERS’ COMPENSATION EXPENDITURES,
FISCAL 2015
Source: Texas A&M University System
Health-Related Institutions of Higher EducationTexas has 10 public health-related institutions of higher education, the newest of which is Texas Tech University Health Sciences Center at El Paso, as well as one private medical university, Baylor College of Medicine. All but Baylor are part of a major state university system, including six within the UT System. These institutions provide medical care through hospitals, patient care centers, dental clinics, specialty clinics and laboratories. They play an essential role in graduate medical education and residency training programs. In addition to medical schools, they also
State
Federal
Other
56.6%
2.3%
41.1%

TEXAS HEALTH CARE SPENDING: FISCAL 2015
Glenn Hegar, Texas Comptroller of Public Accounts29
provide education in biomedical sciences, nursing, public health, research training, pharmacy and other health professions.
Exhibit 41 shows health care expenditures from all sources of funds at the 10 public institutions for fiscal 2011 through 2015.
This spending rose from $3.4 billion in 2011 to more than $5.0 billion in 2015, an increase of 47.2 percent. The University of Texas System accounted for 98.5 percent of the total in fiscal 2015, largely due to M.D. Anderson Cancer Center, which represents 48.6 percent of the system’s health-related expenses (Exhibit 42).
EXHIBIT 41
TEXAS HEALTH-RELATED INSTITUTIONS OF HIGHER EDUCATION EXPENDITURES FROM ALL FUNDS, FISCAL 2011-2015
Source: Texas Higher Education Coordinating Board
Note: Since the Texas Higher Education Coordinating Board was unable to isolate state funds from patient income and other funding sources for this analysis, spending is reported as “All Funds.”
2011 2012 2013 2014 2015
$0
$1
$2
$3
$4
$5
$6
$3.4
IN BILLIONS
$3.8$4.2 $4.4
$5.0
EXHIBIT 42
HEALTH-RELATED INSTITUTIONS OF HIGHER EDUCATION HEALTH CARE EXPENDITURES BY INSTITUTION, ALL FUNDS, FISCAL 2015
The University of Texas Southwestern Medical Center $926,005,675
The University of Texas M.D. Anderson Cancer Center $2,410,984,270
The University of Texas Medical Branch at Galveston $1,065,114,122
The University of Texas Health Science Center at Houston $344,031,971
The University of Texas Health Science Center at Tyler $117,353,629
The University of Texas Health Science Center at San Antonio $102,346,419
Texas Tech University Health Sciences Center $75,701,191
Texas A&M University System Health Science Center* –
University of North Texas Health Science Center* –
Total Health Care Expenditures at Health-Related Institutions $5,041,537,277
Source: Texas Higher Education Coordinating Board
*Notes: Health care expenditures are those expenses associated with hospital and clinic operations, as reported on institutions’ financial statement Schedule of Revenues, Expenses, and Changes in Net Position, plus an allocated portion of Capital Expenditures from Current Fund Sources. They represent state, local, federal and institutional funding. Texas A&M University Health Science Center revised its reporting methodology in 2015 to be more consistent with those of institutions without a hospital.
Expenditures for Texas Tech University Health Sciences Center and Texas Tech University Health Sciences Center-El Paso are combined. University of North Texas Health Science Center works with hospital affiliates.

TEXAS HEALTH CARE SPENDING: FISCAL 2015
Glenn Hegar, Texas Comptroller of Public Accounts30
M.D. Anderson, with expenses of $2.4 billion in fiscal 2015, is one of three comprehensive cancer centers in the U.S. established by the National Cancer Act of 1971, and a leader in cancer care and research. The University of Texas Medical Branch at Galveston, Texas’ oldest academic medical center, had the second-highest expenditures in 2015, at $1.1 billion.
Health-Related Research at Higher Education InstitutionsIn fiscal 2015, Texas universities and associated agencies spent $488.2 million in general revenue, grants and contracts on health research activities related to medical sciences and biological and other life sciences.
State-funded health research spending rose by 24.1 percent from fiscal 2011 to 2015 (Exhibit 43). General revenue accounted for about three-quarters of total research spending in this period, with state grants and contracts representing the remaining quarter.
Unsurprisingly, health-related institutions received the most funding for health research in fiscal 2015, at 88.9 percent or $434.1 million. General academic institutions and agencies received the remainder (Exhibit 44).
State law requires each Texas university or agency to report research spending to the Texas Higher Education Coordinating Board; these reports represent state funding and exclude other funding sent directly to the institutions. Although the general trajectory showed a marked increase, some universities and agencies saw considerable variation in their annual research expenditures, a typical pattern because funds for health research are granted per project rather than annually.
Research expenditures rose by 26.9 percent from fiscal 2011 to 2015. The UT System accounted for 80 percent of the health-related institutions’ research expenditures in fiscal 2015, with M.D. Anderson Cancer Center alone responsible for more than half. Texas Tech University Health Science Center at El Paso was funded beginning
2011 2012 2013 2014 2015
State Grants/Contracts State General Revenue
$0
$100
$200
$300
$400
$500
$600
$86
$307
$97
$295
$115
$308
$116
$355
$136
$352
IN MILLIONS
EXHIBIT 43
HIGHER EDUCATION INSTITUTIONS FUNDING SOURCES FOR HEALTH-RELATED RESEARCH EXPENDITURES, FISCAL 2011-2015
Source: Texas Higher Education Coordinating Board
Note: Health Research includes Medical Sciences as well as Biological and Other Life Sciences defined as follows:
2) Biological sciences are those life sciences (apart from medical sciences and agricultural sciences) that deal with the origin, development, structure, function, and interaction of living things.
All expenditures of funds appropriated by the State of Texas not included in institutionally controlled funds. Included in this category are state appropriated “Special Items” and state contracts and grants such as NHARP and ATP funds, interagency contracts, contracts with Texas local governments, etc.
1) Medical sciences are concerned with the causes, effects, prevention, or control of abnormal conditions in man or his environment as they relate to health, including clinical medical sciences.
Note: Funding includes State Appropriations and State Grants/Contracts defined as follows:

TEXAS HEALTH CARE SPENDING: FISCAL 2015
Glenn Hegar, Texas Comptroller of Public Accounts31
EXHIBIT 44
HIGHER EDUCATION INSTITUTIONS HEALTH-RELATED RESEARCH EXPENDITURES BY INSTITUTION TYPE, FISCAL 2015
Source: Texas Higher Education Coordinating Board
Health-Related Institutions
General Academic Institutions and Agencies
88.9%
11.1%
in 2013; two new health-related institutions will also draw state-supported research funds, the UT Rio Grande Valley School of Medicine and Dell Medical School at UT-Austin.
Thirty-seven state-supported general academic institutions also report research expenditures to the Texas Higher Education Coordinating Board, across a variety of disciplines of which health topics represent only a small portion. Of 23 institutions reporting research expenditures in each year of the review period, six reported no health research expenditures at all. In all, health care research spending by Texas’ general academic institutions rose by just 2.8 percent from 2011 to 2015.
Unsurprisingly, Texas’ two largest university systems accounted for more than two-thirds of health research spending at general academic institutions and agencies in fiscal 2015. Eight of the UT System’s nine campuses reported health research expenditures totaling $19.7 million, as did nine of the Texas A&M System’s 12 campuses ($7.2 million) and three of its seven agencies ($17.1 million).
While most of the institutions reporting health research also award degrees, Texas A&M AgriLife Research, Texas A&M AgriLife Extension Service, Texas A&M Engineering Experiment Station and the Texas A&M System (excluding the universities) provide educational programs, outreach
and community services as well as research, some of it focused on medical, biological and life sciences. These entities reported an 11.8 percent increase in health research expenditures between fiscal 2011 and 2015.
Texas Department of Criminal JusticeThe Texas Department of Criminal Justice (TDCJ) provides medical care, psychiatric services and substance abuse treatment for incarcerated individuals, covering 148,581 offenders at the end of fiscal 2015. TDCJ contracts with the UT Medical Branch and Texas Tech University Health Sciences Center to provide unit medical services, hospital and clinical services, pharmaceutical services and mental health services.
The state’s nine-member Correctional Managed Health Care Committee develops policy and coordinates the delivery of offender health care services.
In fiscal 2015, TDCJ’s health care-related expenditures totaled $620.1 million, 5.1 percent more than in fiscal 2011 (Exhibit 45). During this same time period, inflation rose by 5.4 percent, while the prison population fell by 5.1 percent.32 Hospital and clinical services (33.5 percent) and unit medical services (33.4 percent) made up the bulk of TDCJ’s health care expenses in fiscal 2015 followed by substance abuse (14.2 percent) (Exhibit 46).

TEXAS HEALTH CARE SPENDING: FISCAL 2015
Glenn Hegar, Texas Comptroller of Public Accounts32
2011 2012 2013 2014 2015
State Federal
$480
$500
$520
$540
$560
$580
$600
$620
$640Other
$1.8$585.1
$530.0
$549.2
$594.0
$1.4
$0.6
$619.5
IN MILLIONS
$3.3
$1.3
$3.0
$1.5
33.4%
33.5%
8.9%
Unit Medical Services$207
Hospital and Clinical Services$208
Pharmacy Services$55
Mental Health Services$43
Indirect Expenses$19
Substance Abuse$88
IN MILLIONS
14.2%
3.0%
6.9%
EXHIBIT 45
TEXAS DEPARTMENT OF CRIMINAL JUSTICE FUNDING SOURCES FOR HEALTH CARE EXPENDITURES, FISCAL 2011-2015
Source: Texas Department of Criminal Justice
EXHIBIT 46
TEXAS DEPARTMENT OF CRIMINAL JUSTICE SHARE OF TOTAL HEALTH CARE AND SUBSTANCE ABUSE EXPENDITURES, FISCAL 2015
Source: Texas Department of Criminal Justice

TEXAS HEALTH CARE SPENDING: FISCAL 2015
Glenn Hegar, Texas Comptroller of Public Accounts33
TDCJ Cost DriversThe number of offenders with mental illness, chronic conditions and infectious diseases continues to grow, and treatment standards for these conditions have become more sophisticated and expensive.
In fiscal 2015, more than 14,000 TDCJ offenders were diagnosed with a serious mental illness. The share of the prison population with mental illness has risen by 53 percent since 2009. Serious mental illnesses include major depressive disorder, bipolar disorder, schizophrenia and other psychotic disorders. In fiscal 2015, TDCJ spent $3.9 million on psychotropic drugs.
According to the Correctional Managed Health Care Committee, TDCJ offenders are more likely than the general population to engage in risky behaviors, such as drug and alcohol abuse, smoking and unprotected sex. These behaviors lead to an increased rate of chronic and infectious disease.
Texas’ prison population is aging, increasing the incidence of chronic conditions such as cardiovascular diseases, kidney failure and diabetes. Older offenders over the age of 55 make up 10.8 percent of the TDCJ population but account for 40.7 percent of its hospital and specialty service costs.
In fiscal 2015, about 1.4 percent of the TDCJ population was HIV-positive. Antiretroviral drugs for these offenders cost the state $17.5 million in fiscal 2015, representing 39.3 percent of TDCJ’s pharmaceutical purchases.
TDCJ estimates that about 18,000 TDCJ offenders have the Hepatitis C virus (HCV), the leading cause of end-stage liver disease, which requires frequent hospitalizations and emergency room services. In fiscal 2015, an average of 211 HCV-positive offenders received antiviral treatment each month at an annual cost of $2 million, or 4.6 percent of all pharmaceutical expenditures.33
Texas Juvenile Justice DepartmentIn 2011, the newly created Texas Juvenile Justice Department (TJJD) assumed the operations of the former Texas Juvenile Probation Commission and Texas Youth Commission. TJJD oversees the state’s youth correctional facilities and provides services and resources to local youth probation agencies.
In fiscal 2015, 3,355 youths participated in TJJD-funded prevention and intervention programs, and an average daily population of 1,974 resided in state-funded secure facilities.
Juveniles entering a residential setting may receive specialized services while in the facility. In 2015, 6 percent of these offenders received mental health treatment while another 26 percent received substance abuse treatment.
TJJD’s Special Needs Diversionary Program (SNDP) provides services for juvenile offenders with mental health needs other than substance abuse, mental retardation, autism or pervasive development disorder. In fiscal 2015, SNDP served 1,309 juveniles with such needs.
A Mental Health Services Grant provides funding for mental health screenings, assessments and evaluations of juveniles referred to and under the supervision of county juvenile probation departments. These funds also are used to provide services, programs and placements to juvenile offenders with mental health needs. These grants totaled $12.7 million in fiscal 2015.
TJJD contracts with The University of Texas Medical Branch at Galveston and private medical and mental health care providers for juveniles in its custody.
General revenue funds 98.3 percent of TJJD’s health care expenditures, while the remainder comes from interagency contracts. From fiscal 2011 to 2015, TJJD’s total health care expenditures rose by 10.0 percent, from $35.0 million to $38.5 million (Exhibit 47).

TEXAS HEALTH CARE SPENDING: FISCAL 2015
Glenn Hegar, Texas Comptroller of Public Accounts34
EXHIBIT 47
TEXAS JUVENILE JUSTICE DEPARTMENT FUNDING SOURCES FOR HEALTH CARE EXPENDITURES, FISCAL 2011-2015
Source: Texas Juvenile Justice Department
2011 2012 2013 2014 2015
State Other
$0
$5
$10
$15
$20
$25
$30
$35
$40
$45
$0.7
$34.3 $0.7
$30.3$27.9
$38.6 $37.9
IN MILLI
$0.7
$0.6 $0.6
ONS
Texas Department of TransportationThe Texas Department of Transportation (TxDOT) maintains Texas’ highway network, including more than 180,000 paved lane miles, rail crossings, rights of way, traffic cameras and bridges.34
TxDOT administers a workers’ compensation program for its more than 12,000 employees based in 25 different geographical districts across the state.35 Its total workers’ compensation expenditures fell by almost 13 percent between fiscal 2011 and 2015. This funding is provided entirely by the state (Exhibit 48).36
Texas Department of Agriculture – State Office of Rural HealthThe State Office of Rural Health (SORH) works to ensure access to high-quality health care services in rural Texas. SORH manages the state’s Medicare rural hospital flexibility program, which provides rural residents with preventive and emergency health care services. Its Rural Health Facility Capital Improvement Loan Fund, Small Rural Hospital Improvement Program and Rural Communities Health Care Investment Program provide funds to rural hospitals and other health care facilities for construction, equipment and technology-based enhancements.37
Funding for SORH health care programs totaled $4.2 million in fiscal 2015, 13.1 percent less than in 2011 (Exhibit 49).38 General revenue provided $2.6 million or 60.5 percent of this total.
.

TEXAS HEALTH CARE SPENDING: FISCAL 2015
Glenn Hegar, Texas Comptroller of Public Accounts35
.
2011 2012 2013 2014 2015
$0.0
$0.5
$1.0
$1.5
$2.0
$2.5
$3.0
$3.5
$3.1
$2.5
$3.0
$2.4$2.7
IN MILLIONS State
2011 2012 2013 2014 2015
State Federal
$0
$1
$2
$3
$4
$5
$6
$2.1
$2.8
$1.3
$2.0
$1.5
$3.4
$1.3
$2.8
$1.7
$2.6
IN MILLIONS
EXHIBIT 48
TEXAS DEPARTMENT OF TRANSPORTATION TOTAL WORKERS’ COMPENSATION STATE EXPENDITURES, FISCAL 2011-2015
Source: Texas Department of Transportation
Note: Includes medical and administrative expenses; excludes indemnities such as compensation for lost wages.
EXHIBIT 49
TEXAS DEPARTMENT OF AGRICULTURE FUNDING SOURCES FOR HEALTH CARE EXPENDITURES, FISCAL 2011-2015
Source: Texas Department of Agriculture

TEXAS HEALTH CARE SPENDING: FISCAL 2015
Glenn Hegar, Texas Comptroller of Public Accounts36
MAJOR COST DRIVERSHealth care spending is a product of both the price and usage of services. Many overlapping factors have contributed to the rapid rise in health care expenditures, including new drugs and medical technologies, chronic disease, an aging population, uncompensated care, increased usage and provider shortages.
New Medical Technology and Prescription DrugsRecent decades have seen unprecedented progress in the medical sciences, including groundbreaking drugs, advanced imaging equipment, improvements in acute disease treatment, the development of non-invasive procedures and a variety of new medical devices. And while such advances have saved many lives, they also drive up the cost of health care significantly.
The Hastings Center, a bioethics research institute, reports that up to half of medical cost increases can be attributed to the introduction of new technologies or increased use of older ones.39 It may seem counterintuitive, given that technological innovation often drives down costs, but understandably both doctors and patients tend to demand the latest and greatest treatments regardless of price.
According to the U.S. Centers for Disease Control and Prevention, prescription drugs represented 9.8 percent of total U.S. health care spending in 2014.40 In employer health insurance plans, drug spending accounted for 19 percent of expenditures, slightly less than the 23 percent they spend on inpatient hospital care.41
Spending on prescriptions began to increase dramatically in the 1990s, rising more than threefold from 1990 to 2001 and increasing by an average of about 10 percent annually between 1995 and 2005.42 These expenditures moderated from the mid-2000s to 2013, partly due to patent expirations, greater use of generics and falling generic drug prices. This trend reversed in 2014, however, when prescription drug spending rose by 13.1 percent, the largest annual growth seen since 2003. A major factor behind this increase was a 30.9 percent rise in spending on specialty medications.43
Prescription drug spending then rose by 12.2 percent in 2015, again due in part to higher spending on specialty medications used to treat Hepatitis C, rheumatoid arthritis and cancer.44 In 2014, less than 1 percent of all prescriptions were written for specialty drugs, yet they accounted approximately 32 percent of total drug expenditures.45
Other reasons for the price spike include fewer drugs losing patent protection, limited generic competition, higher drug prices and the Affordable Care Act (ACA), which boosted the number of people with health insurance and prescription drug coverage.46
Spending for prescription drugs has accelerated for Texas state and local government entities since 2013, particularly spending on specialty drugs. The development of new specialty drugs to treat cancer and other chronic diseases is likely to continue putting upward pressure on government budgets in the coming years.
Advances in technology other than drugs also contribute to rising costs. The Congressional Budget Office has noted that new medical technologies and services are a crucial factor underlying the increase in per-capita health care spending in recent decades.47 As new technologies replace or supplement older, less-expensive services, and the number of patients using new services rises, so do health care costs. Over the years, the U.S. health care system has been quick to adopt emerging medical technologies, which are estimated to account for between 38 percent and 65 percent of the total increase in health care spending.48
Uncompensated and Indigent CareEach year, American hospitals, community providers and physician’s offices provide billions of dollars’ worth of uncompensated care — services provided, generally to indigent persons, without payment. A January 2016 report by the American Hospital Association indicates that hospitals’ total costs for uncompensated care exceeded $502 billion between 2000 and 2014, with 2015’s tab alone approaching $43 billion.49 A 2015 study published by the National Bureau of Economic Research found that each uninsured individual in the U.S. costs hospitals about $900 per year.50

TEXAS HEALTH CARE SPENDING: FISCAL 2015
Glenn Hegar, Texas Comptroller of Public Accounts37
While health care providers receive payments from private insurance, government programs and patients, these sources don’t always fully cover the medical costs incurred. The cost of this uncompensated care thus is shifted to health care providers. Across the nation, about 60 percent of uncompensated care is provided by hospitals, 26 percent by community-based clinics and 14 percent by physicians.51 In 2014, Texas hospitals assumed costs of $5.5 billion in uncompensated care.52
Much of Texas’ uncompensated care costs are incurred by individuals without health insurance. The uninsured are more likely to delay medical care until they are very sick, and often seek basic care in emergency rooms, where treatment is more expensive.
Texas has the highest uninsured rate in the nation, although its share of uninsured residents began to fall significantly in 2010 when the ACA was signed. Since then, the uninsured share of the Texas population has fallen from 23.7 percent to 16.9 percent. The national uninsured rate fell from 15.5 percent to 10.1 percent (Exhibit 50).53
In a recent survey conducted by Rice University’s Baker Institute, 57 percent of respondents who remain uninsured said their main reason for not purchasing insurance on the ACA marketplace was cost.54
As a group, uninsured Texans are disproportionately poor. In 2014, the average family income for uninsured Texans was $31,199, compared to a state average of $52,515. Forty-six percent of uninsured Texans live at or below 150 percent of the federal poverty level, versus 29 percent of all Texans. More than 60 percent of Texas’ uninsured residents are employed, however.
Most uninsured Texans are working-aged adults with a limited access to Medicaid benefits. In 2014, 83 percent of the state’s uninsured were between 18 and 64 years old, compared to 62 percent of the entire state population (Exhibit 51).
Federal, state and local governments as well as the private sector help hospitals defray many of the costs associated with uncompensated care. According to the Kaiser Family Foundation, the federal government contributes
0%
5%
10%
15%
20%
25%
2005 2006 2007 2008 2009 2010 2011 2012 2013 2014 2015
Texas United States
EXHIBIT 50
TEXAS AND U.S. DECLINE OF UNINSURED NONELDERLY ADULTS, 2005-2015
Sources: U.S. Census Bureau and Urban Institute Health Reform Monitoring Survey

TEXAS HEALTH CARE SPENDING: FISCAL 2015
Glenn Hegar, Texas Comptroller of Public Accounts38
EXHIBIT 51
UNINSURED TEXANS BY AGE GROUP, 2014
Source: U.S. Census Bureau
Under 18 Years
18 to 64 Years
65 Years and Older
16%
83%
1%
62 percent of all funding for uncompensated care, while state and local governments provide 37 percent. (Private funding, including charity care, accounted for the final 1 percent.)55
Much of this federal and state funding is delivered through the County Indigent Health Care Program, Medicaid Waiver 1115 and the Disproportionate Share Hospital Program.
COUNTY INDIGENT HEALTH CARE PROGRAM
In 1985, the Texas Legislature passed the Indigent Health Care and Treatment Act, intended to ensure that low-income Texas residents who do not qualify for other state or federal programs receive health care services through the County Indigent Health Care Program (CIHCP). As of 2016, 142 hospital districts, 18 public hospitals and 143 counties are delivering indigent care services under the CIHCP in Texas.56
CIHCP serves Texas residents with incomes at or below 21 percent of the federal poverty level (FPL) who aren’t eligible for Medicaid. Counties may extend eligibility up to 50 percent of the FPL and still qualify for state assistance after spending 8 percent of their general revenue tax levies on indigent care. Most counties set eligibility at between 21 to 25 percent of the FPL.
Funding sources for CIHCP vary depending on which entity — hospital district, public hospital or county government — provides the services.
Public hospitals are funded by local sales taxes and many also receive county funding. Counties not served by a hospital district or public hospitals that spend more than 8 percent of their property and sales tax revenue on indigent care can qualify for funding through the CIHCP State Assistance Fund.57 The Legislature appropriated nearly $4.4 million to this fund for fiscal 2016 and 2017.58
MEDICAID 1115 WAIVER
Section 1115 of the federal Social Security Act gives the U.S. Secretary of Health and Human Services authority to waive certain
Medicaid requirements, allowing states to use federal Medicaid funds in ways not otherwise allowed under federal rules.
This provision, commonly called the “1115 waiver,” funds health care providers through two statewide pools in Texas: an uncompensated care pool to reimburse providers for costs associated with indigent or Medicaid patients; and the Delivery System Reform Incentive Payment (DSRIP) pool, which provides incentive payments to establish more efficient community-based health care projects. As of 2016, there were 1,451 active DSRIP-funded projects across all 20 of the regional healthcare partnerships in the state.59
The Texas 1115 waiver, which was approved for a five-year period from 2011 to 2016, has received a 15-month extension, preserving its current funding until December 2017. During the 2011-2016 period, the waiver provided Texas with about $12 billion in state funding and $17 billion in matching federal funds.60 The Texas Hospital Association estimates that from 2011 to 2016, the 1115 waiver generated more than $8.7 billion in savings for the state.61

TEXAS HEALTH CARE SPENDING: FISCAL 2015
Glenn Hegar, Texas Comptroller of Public Accounts39
DISPROPORTIONATE SHARE HOSPITAL PROGRAM
Texas hospital districts also can receive financing from the federal Disproportionate Share Hospital Program (DSH), which is available to hospitals serving a “disproportionate” percentage of Medicaid or low-income patients. Texas maximizes the amount it raises for federal DSH matching funds with money from state-owned hospitals and intergovernmental transfers from the state’s nine largest public hospitals in the state.62 In 2015, Texas’ federal DSH allotment totaled $1 billion (Exhibit 52).63
Chronic DiseaseChronic diseases and conditions such as arthritis, asthma, cancer, diabetes, heart disease and stroke represent a significant burden to Texans and their health care institutions. Nearly two-thirds of all Texas deaths are due to chronic disease, as were more than half of the state’s leading causes of death in 2014 (Exhibit 53).64
The self-reported data in Exhibit 54, taken from the U.S. Centers for Disease Control and Prevention’s (CDC’s) Behavioral Risk Factor Surveillance System, represent
EXHIBIT 52
SUPPLEMENTAL FUNDS ALLOCATED, FISCAL 2012-2016 (IN BILLIONS)
2012 2013 2014 2015 2016 TOTAL
DSH $1.68 $1.69 $1.74 $1.78 $1.83 $8.72
Non Federal DSH $0.70 $0.69 $0.72 $0.75 $0.78 $3.64
Federal DSH $0.98 $1.00 $1.02 $1.03 $1.04 $5.08
UC $3.70 $3.90 $3.53 $3.35 $3.10 $17.58
Non Federal UC $1.55 $1.59 $1.46 $1.40 $1.33 $7.33
Federal UC $2.15 $2.31 $2.07 $1.94 $1.77 $10.26
DSRIP $0.50 $2.30 $2.67 $2.85 $3.10 $11.42
Non Federal DSRIP $0.21 $0.94 $1.10 $1.20 $1.33 $4.77
Federal DSRIP $0.29 $1.36 $1.57 $1.66 $1.77 $6.65
TOTAL $5.88 $7.89 $7.94 $7.98 $8.03 $37.72
Source: Texas Health and Human Services Commission
EXHIBIT 53
LEADING CAUSES OF DEATH IN TEXAS, 2014 (ITALICIZED ENTRIES ARE CHRONIC CONDITIONS)
RANK CAUSE NUMBER RATE PERCENT
1 Diseases of the Heart 41,293 153.2 23%
2 Malignant Neoplasms 38,727 143.7 21%
3 Cerebrovascular Diseases 9,852 36.5 5%
4 Chronic Lower Respiratory Diseases 9,642 35.8 5%
5 Accidents 9,598 35.6 5%
6 Alzheimer’s Disease 6,755 25.1 4%
7 Diabetes Mellitus 5,327 19.8 3%
8 Septicemia 4,102 15.2 2%
9 Nephritis, Nephrotic Syndrome and Nephrosis 3,997 14.8 2%
10 Chronic Liver Disease and Cirrhosis 3,663 13.6 2%
Source: Texas Department of State Health Services

TEXAS HEALTH CARE SPENDING: FISCAL 2015
Glenn Hegar, Texas Comptroller of Public Accounts40
the share of survey respondents experiencing a chronic disease or a risk factor for chronic disease. Four risk factors in particular are associated with a higher likelihood of chronic disease: tobacco use, physical inactivity, poor diet and heavy alcohol use.65
The direct medical costs of chronic disease continue to rise (Exhibit 55). Eighty-three cents of every Medicaid
EXHIBIT 54
PREVALENCE OF CHRONIC DISEASE AND RISK FACTORS, TEXAS AND U.S., 2014
CHRONIC HEALTH INDICATOR TEXAS U.S.
Arthritis 20% 26%
Asthma 11% 14%
Stroke 3% 3%
Heart Attack 4% 4%
Congestive Heart Failure/Angina 4% 4%
Chronic Obstructive Pulmonary Disease 5% 6.5%
Depression 15% 19%
Diabetes 11% 10%
Kidney Disease 3% 3%
Cancer 5.3% 7%
Skin Cancer 5% 6%
Current Smoker 15% 18%
Heavy Alcohol Use 66 6% 6%
Lack of Physical Activity 28% 23%
Overweight or Obese 68% 65%
Source: U.S. Centers for Disease Control and Prevention Behavioral Risk Factor Surveillance System
EXHIBIT 55
DIRECT TEXAS MEDICAL COSTS TO TREAT CHRONIC DISEASE BY PAYER, 2010 (IN MILLIONS)
CHRONIC DISEASE MEDICAID MEDICARE PRIVATE INSURERS ALL PAYERS
Arthritis $610 $2,198 $2,811 $8,173
Asthma $630 $360 $632 $2,032
Cancer $507 $3,017 $3,657 $9,440
Congestive Heart Failure $310 $452 $180 $1,345
Coronary Heart Disease $397 $2,189 $2,399 $6,828
Hypertension $1,075 $1,719 $2,458 $8,132
Stroke $1,065 $1,236 $557 $4,352
Other Heart Disease $649 $1,431 $827 $3,865
Depression $397 $936 $1,600 $4,589
Diabetes $1,133 $2,478 $2,467 $9,163
Source: U.S. Centers for Disease Control and Prevention Chronic Disease Calculator
dollar spent goes to treat chronic disease.67 The costs include expenditures for office visits, inpatient hospital stays, emergency room visits, nursing home care, prescription drugs and medical equipment as well as dental care, vision aids and home health care.
In addition to these direct medical costs, indirect costs related to absenteeism and lost productivity add to the burden.
Lifestyle choices have a significant impact on health and thus on the amounts spent on health care. According to the CDC, 70 percent of all deaths in the U.S. and 86 percent of all health care spending can be attributed to chronic and often preventable diseases. Lifestyle choices such as poor diet, limited physical activity, smoking and alcohol consumption are the leading causes of death in the U.S., and are strongly linked to some of the most costly medical conditions including heart diseases, cancer, kidney failure and pulmonary conditions.68
Rising obesity is a particularly significant factor in the growth of health care spending. According to a 2012 Cornell study, obesity accounts for about 21 percent of U.S. health care costs.69 Poor diet and physical inactivity contribute to weight gain, a risk factor associated for a number of chronic diseases and premature death. Individuals with even moderately excessive weight may be at greater risk for heart disease, diabetes, stroke, cancer and arthritis.70

TEXAS HEALTH CARE SPENDING: FISCAL 2015
Glenn Hegar, Texas Comptroller of Public Accounts41
Strategies to combat the growing cost of chronic disease include identifying concentrations of spending among particular patient populations and working to improve the coordination of care within these environments. For example, Texas Medicaid/CHIP spending on emergency department visits for childhood asthma totaled more than $23 million in 2010.71 Controlling these costs might involve educational efforts with affected family members and school personnel to better manage the disease at home and in lower-cost care environments.
Other solutions include interventions to change behaviors associated with risk factors, including workplace and community-based health promotion programs as well as peer-led programs, particularly for populations affected by depression.
Aging PopulationAnother factor driving health care costs is the overall age of the population. People generally require more medical care as they age, and the aging of the baby-boom generation is causing a substantial increase in the population’s average age, both nationally and in Texas.
The U.S. Department of Health and Human Services’ Administration on Aging has estimated that by 2030, 19.3 percent of Americans will be 65 or older, up from 12.4 percent in 2000.72 In Texas, the pattern is similar, with those 65 and older reaching 19.4 percent by 2030, up from 9.9 percent in 2000. The numbers of Texans in this age group will more than double between 2000 and 2030, from 2.1 million to 5.9 million.
In 2010, U.S. per capita health care spending was highest for those aged 65 and older age, with a cost of $18,424 per person. The second most costly group was working-aged adults (19 to 64), with per-person spending of $6,125. By contrast, children (0 to 18) had per capita expenditures of just $3,628 in 2010.73
Interestingly, through 2050 the share of Texans aged 85 and older is expected to grow even faster than those aged 65 to 84. Growth in the 85-and-older cohort will have far-reaching healthcare implications, including an increased need for disability services and home care.74
Many Texas state and local government entities have noted that the aging population, with its generally higher incidence of chronic conditions, is contributing to the rise in health care spending. In fiscal 2015, older Texas
prisoners made up 10.8 percent of the Texas Department of Criminal Justice population, but accounted for 40.7 percent of the agency’s hospital and specialty service costs. The state employee group benefits plans share of the elderly population has grown as well. In fiscal 2015, 36 percent of HealthSelect members were age 60 or older, up from 21 percent in fiscal 2000.75
Increased Utilization and Provider ShortagesVisits to physician offices and both hospital outpatient and emergency departments are increasing in the U.S. According to data from the Centers for Disease Control, physician office and emergency department visits per 100 persons have increased by 18 and 21 percent, respectively, between 1995 and 2011. In the same time period, hospital outpatient department visits per 100 persons have increased by 58 percent (Exhibit 56).
As we’ve seen, increased demand for medical services is being driven by the growth and the aging of the state population, along with a greater incidence of chronic diseases. The Affordable Care Act, too, has contributed to greater demand.
Yet while the demand for health care is rising, some areas of the state are experiencing a shortage of medical providers.
Because market forces play a large role in determining the location of health care providers, primary care physicians are unevenly distributed across the state. Shortages are especially apparent in rural and border areas. The U.S. Department of Health and Human Services has designated 235 of Texas’ 254 counties as “medically underserved” areas; 65 counties have no hospital.76
Factors contributing to this shortage include the aging of existing health care providers; the high cost of (and inadequate access to) medical education; declining interest among medical students in less-remunerative primary care; and the difficulties involved in recruiting and retaining medical professionals in rural areas.
Federally qualified health centers (FQHCs) provide health care to underserved communities, and rural health clinics (RHCs), as the name implies, provide health care in rural areas.77 As of August 2016, Texas had 294 RHCs and 406 FQHCs, both of which receive funding from Medicaid, Medicare and other sources.78

Glenn Hegar, Texas Comptroller of Public Accounts42
TEXAS HEALTH CARE SPENDING: FISCAL 2015
EXHIBIT 56
VISITS TO U.S. MEDICAL PROVIDERS PER 100 PERSONS SELECTED YEARS 1995-2011
Source: U.S. Centers for Disease Control and Prevention
1995 2000 2010 2011
Physician Offices Hospital Outpatient Departments
0
50
100
150
200
250
300
350
Hospital Emergency Departments
266
26
300
37
332
3930
322
41 444333
COUNTY HEALTH CARE EXPENDITURESCounties play an important role in health care delivery, providing health services for their own employees, low-income and uninsured residents and persons incarcerated in county jails. Texas counties vary in their approach to the delivery and finance of health care services, based on factors such as population, existing health care infrastructure and demography, including race and ethnicity, income, educational attainment and insurance status. Disease burdens, behaviors, health risk factors and other drivers of utilization specific to individual counties also play a substantial role but are beyond the scope of this report.
This report examines health care expenditures for Angelina, Bexar, Bell, Gray, Starr and Val Verde counties, a group chosen to highlight differences in geography and the urban/rural divide.
The Texas Indigent Health Care Act of 1985 requires Texas counties to provide health care services for eligible low-income residents, either by creating a hospital district or by operating a public hospital or a county indigent health care program. Some counties create a hospital district or run their own public hospitals, while others contract with public or private providers. Counties also bear responsibility for indigent residents not admissible to state mental health hospitals, and many meet this responsibility through partnerships with local mental health authorities.79 In addition, Texas counties are required to provide inmates housed in their jails with medical, dental and behavioral health care.

TEXAS HEALTH CARE SPENDING: FISCAL 2015
Glenn Hegar, Texas Comptroller of Public Accounts43
Under state law, counties can but are not required to provide a variety of other health care-related services, such as mental health courts and alcohol education and treatment programs. Many Texas counties choose to offer other health care services including emergency medical services (EMS) and employee health care benefits.
Escalating health care costs are straining county budgets as well as the state’s. A 2014 Texas Association of Counties survey found significant concern about rising health care costs and counties’ limited ability to control them.80 Texas counties, for example, cannot control the number of inmates entering their jails, yet still must provide all of them with health care services.
METHODOLOGY
The six counties included in this report represent a diverse selection of Texas counties in terms of geography, population and the urban/rural spectrum. Data were obtained through conversations with county staff via telephone interviews and email exchanges. Comptroller analysts requested health care spending data as defined in Appendix 1 of this report.
Demographic information in the profiles below are 2014 estimates from the U.S. Census Bureau and U.S. Bureau of Economic Analysis and incorporate data derived using EMSI (Economic Modeling Specialists, International) software. A few data points include 10-year trend analyses (2004 to 2014) from these sources as well. The demographic data provide a context for the spending data, though it is beyond the scope of this report to offer analysis on the relationship between county demographic and social conditions and health care expenditures, or to compare individual counties or their expenditures in any way.
Complementing the demographic data are ratios of county populations to medical and behavioral health professionals and county rankings based on these ratios. The data used to develop these ratios came from the Texas Medical Board and were assembled by the Texas Department of State Health Services Center for Health Statistics. The ratios are standard public health metrics, counting each health professional per 100,000 county residents. The rank indicates each county’s position in reference to the rest of the state’s 254 counties; therefore, a rank close to 254 is less favorable in terms of health care access than a lower number.
COUNTY EXPENDITURE TYPES
Texas county health care expenditures examined in this report include those made for:
• employee health care, including dental, medical and behavioral health care.
• county jail inmate medical, dental and behavioral health care, provided directly or via contract. If inmate care is funded through collaboration, only the county contribution is included.
• behavioral health, such as mental health, substance abuse or intellectual or developmental disability services provided to county residents, including services provided by a local mental health authority or other care provider in the community.
• emergency medical services, including any out-of-hospital acute medical care and transportation to medical care. These services are sometimes provided by volunteers in smaller counties and can be provided by health or hospital districts or through contracts in larger counties.
• county health care for the indigent, defined as those at 21 percent or less of the federal poverty level. The Indigent Health Care and Treatment Act of 1985 requires counties not completely covered by a hospital district or public hospital to provide basic health care services to indigent residents. These services include inpatient and outpatient hospital and physician services, family planning, lab and x-ray services, prescriptions, screenings, annual physicals, immunizations and skilled nursing facility care. The state reimburses counties for at least 90 percent of these costs after they have expended at least 8 percent of their general revenue tax levy on them. Counties can fund care for those at up to 50 percent of the FPL and remain eligible for state reimbursement. This analysis includes all county indigent care program spending, whether made directly by counties or as a county contribution to services provided through a hospital district. Note that indigent care programs do not function as health insurance and do not include an insurance component.

TEXAS HEALTH CARE SPENDING: FISCAL 2015
Glenn Hegar, Texas Comptroller of Public Accounts44
• county veterans services programs that provide health services such as medical transportation, clinic services and access to health insurance for individuals who served in the armed forces.
• public health services such as disease prevention, immunization programs and epidemiological surveillance, funded directly or through collaboration with other entities.
Angelina CountyAngelina County in East Texas is largely rural, with a population of 88,255 in 2015. Lufkin, the county seat, is also the county’s largest city, with a population of about 36,000.81 Some of the county’s demographic characteristics are illustrated in Exhibit 57.
In 2015, Angelina County had more health care professionals per 100,000 residents than the state as a whole (Exhibit 58).
Angelina County Health Care ExpendituresAngelina County’s largest health care expenditures are those for employee health, indigent health care and inmate medical, dental and mental health (Exhibit 59). Employee health costs were the largest category, accounting for 66 percent of all county health care expenditures in 2015. The next largest category, indigent health care, accounted for almost 15 percent, while inmate health care expenses accounted for 9.9 percent.
Angelina County pays flat fees for EMS services, the Angelina County and Cities Health District (ACCHD) and its contribution to the local mental health authority (LMHA). The county contracts with the city of Lufkin for EMS services, paying a yearly fee of $200,000. Angelina County pays the ACCHD, which also receives funding from the city of Lufkin, other localities and federal grants, $35,444 per year.
EXHIBIT 57
ANGELINA COUNTY DEMOGRAPHICS, 2010-2014
INDICATOR ANGELINA COUNTY TEXAS
2004-2014 Population Growth 7% 20%
Median Age 37 34
Proportion of Population under 18 26% 26%
Proportion of Population Adults 18-64 59% 62%
Proportion of Population 65+ 15% 12%
Proportion of Population – White Alone 81% 80%
Proportion of Population – Black or African American Alone 16% 13%
Proportion of Population – Hispanic 21% 39%
Proportion of Population Aged 25 and Older with at least a high school education 79% 82%
Proportion of Population Age 25 and Older with a Bachelor’s Degree or higher 15% 27%
Growth in Employment 2004-2014 1.7% 22%
Average Annual Wage $37,862 $52,537
Proportion of Individuals of All Ages in Poverty 20% 18%
Proportion of Children under 18 in Poverty 30% 25%
Proportion of Population Uninsured 20% 22%
Sources: U.S. Census Bureau, U.S. Bureau of Economic Analysis and Economic Modeling Specialists, Intl.

TEXAS HEALTH CARE SPENDING: FISCAL 2015
Glenn Hegar, Texas Comptroller of Public Accounts45
From calendar 2011 to 2015, the county’s health care expenditures fluctuated by as much as 50 percent from one year to the next. From calendar 2014 to 2015, for instance, employee health care costs fell by 27.8 percent. The county attributes much of this decline to its hiring of ELAP Services, LLC, to audit medical claims. The county’s wellness program also contributed to lower employee health costs.
In the same year, indigent health care costs declined by almost 30 percent, a situation due primarily to a new policy requiring all patients to show valid Texas personal identification.
Inmate medical spending, by contrast, was the fastest-growing category, rising by more than 64 percent from calendar 2014 to 2015. Angelina County personnel attributed most of this increase to mental health treatment; the county jail has new forms that ask inmates about both their physical and mental health histories.83
EXHIBIT 58
ANGELINA COUNTY HEALTH CARE PROFESSIONAL RATIOS PER 100,000 POPULATION, 2015
METRIC
ANGELINA TEXAS
RATIO RANK RATIO
Ratio of Registered Nurses to 100,000 Population 1,054.1 18 777.8
Ratio of Primary Care Physicians to 100,000 Population 82.8 32 71.9
Ratio of Behavioral Health Professionals to 100,000 Population82 211.9 27 189.9
Source: Texas Medical Board and Center for Health Statistics, State Department of Health Services
EXHIBIT 59
ANGELINA COUNTY HEALTH CARE EXPENDITURES, 2011-2015
EXPENDITURE CATEGORY 2011 2012 2013 2014 2015
Behavioral Health Care84 $102,654 $97,582 $106,607 $92,801 $95,048
County Indigent Health Care Program $654,922 $811,478 $1,216,315 $781,504 $548,110
County Support to the Angelina County and Cities Health District85 $35,444 $35,444 $35,444 $35,444 $35,444
Emergency Medical Services (EMS) $225,000 $225,000 $225,000 $200,000 $200,000
Employee Health Care $4,101,034 $6,058,577 $2,199,650 $3,407,924 $2,458,424
Inmate Medical, Dental and Mental Health Care
$329,194 $258,041 $288,937 $224,071 $368,796
TOTAL $5,448,248 $7,486,122 $4,071,953 $4,741,744 $3,705,822
Source: Angelina County

TEXAS HEALTH CARE SPENDING: FISCAL 2015
Glenn Hegar, Texas Comptroller of Public Accounts46
Bell CountyBell County, located between the cities of Georgetown and Waco in Central Texas, is home to more than 334,000 residents (Exhibit 60). Belton, the county seat, had 20,547 residents in 2015. Killeen, site of Fort Hood, had a population of 140,806, while Temple, as a major medical center, had more than 72,000 residents.86
In 2015, Bell County had more health care professionals per 100,000 residents than the state as a whole (Exhibit 61).
Bell County Health Care ExpendituresIn all, Bell County’s health care expenditures fluctuated slightly over the study period, with total spending averaging $12.5 million annually (Exhibit 62). Employee health care, the largest spending category, accounted for about a third of total health care spending. The county’s employee health care costs rose at an average annual rate of 3.9 percent between 2011 and 2015.
The next-largest spending category represented spending for the County Indigent Health Care Program (CIHCP). These costs fluctuated considerably, from a high of $5.3 million in 2014 to a low of $2.1 million in 2015. Changes in CIHCP spending from 2011 to 2015 reflected new partnerships with local private hospitals to implement the Medicaid 1115 Waiver, which offers an improved federal match for services and programming. The formation of a nonprofit hospital collaborative charged with managing CIHCP claims reduced county costs in 2012. Higher expenditures in 2013 and 2014 are attributable to the lapse period between spending and receipt of the federal match.
The county’s third-largest spending category was inmate health care, which fluctuated slightly during the study period but averaged $2.9 million annually. EMS costs held steady from 2013 to 2015, while Bell County’s support to the local mental health authority was fixed at $265,000 annually.
EXHIBIT 60
BELL COUNTY DEMOGRAPHICS, 2010-2014
INDICATOR BELL COUNTY TEXAS
2004-2014 Population Growth 28% 20%
Median Age 30.5 34
Proportion of Population under 18 28% 26%
Proportion of Population Adults 18-64 62% 62%
Proportion of Population 65+ 10% 12%
Proportion of Population – White Alone 68% 80%
Proportion of Population – Black or African American Alone 23% 13%
Proportion of Population – Hispanic 24% 39%
Proportion of Population Age 25 and Older with At Least a High School Education 90% 82%
Proportion of Population Age 25 and Older with a Bachelor’s Degree or Higher 22% 27%
Growth in Employment 2004-2014 15% 22%
Average Annual Wage $47,171 $52,537
Proportion of Individuals of All Ages in Poverty 15% 18%
Proportion of Children under 18 in Poverty 21% 25%
Proportion of Population Uninsured 15% 22%
Sources: U.S. Census Bureau, U.S. Bureau of Economic Analysis and Economic Modeling Specialists, Intl.

TEXAS HEALTH CARE SPENDING: FISCAL 2015
Glenn Hegar, Texas Comptroller of Public Accounts47
EXHIBIT 61
BELL COUNTY HEALTH CARE PROFESSIONAL RATIOS PER 100,000 POPULATION, 2015
METRIC
BELL TEXAS
RATIO RANK RATIO
Ratio of Registered Nurses to 100,000 Population 1003.9 20 777.8
Ratio of Primary Care Physicians to 100,000 Population 83.5 31 71.9
Ratio of Behavioral Health Professionals to 100,000 Population 242.8 18 189.9
Source: Texas Medical Board and Center for Health Statistics, State Department of Health Services
EXHIBIT 62
BELL COUNTY HEALTH CARE EXPENDITURES, 2011-2015
TYPE OF EXPENDITURE 2011 2012 2013 2014 2015
Behavioral Health (support to the LMHA) $265,000 $265,000 $265,000 $265,000 $265,000
County Indigent Health Care Program $4,405,723 $2,959,626 $3,936,155 $5,368,685 $2,100,477
Emergency Medical Services (EMS) $605,214 $878,785 $766,009 $771,251 $716,726
Employee Health Care $4,199,540 $4,699,180 $4,751,183 $4,758,586 $4,858,952
Inmate Medical, Dental and Mental Health Care Costs $3,148,444 $2,657,952 $3,264,340 $2,694,414 $2,964,583
Public Health Services $161,684 $141,854 $141,657 $150,107 $213,665
Veteran’s Services -- -- -- -- $39,165
TOTAL $12,785,605 $11,602,396 $13,124,344 $14,008,042 $11,158,568
Other Health Care Spending87
Drug Court $32,233 $74,360 $80,238 $61,615 $82,583
Source: Bell County

TEXAS HEALTH CARE SPENDING: FISCAL 2015
Glenn Hegar, Texas Comptroller of Public Accounts48
Bexar County, TexasBexar County is an urban county in south-central Texas (Exhibit 63). Its county seat is San Antonio, the state’s second-largest city. In 2015, nearly 1.9 million people lived in Bexar County.88
As one of the state’s largest urban areas, Bexar County has had little difficulty in attracting and retaining members of the medical professions. In 2015, the county had considerably more health care professionals per 100,000 residents than the state as a whole (Exhibit 64).
Bexar County Health Care Spending and Financing
Bexar County health care services are supported by a variety of governmental entities including the San Antonio Metropolitan Health District (called Metro Health), the county health district, the county’s hospital district (University Health System) and Bexar County. Most of Bexar County’s EMS costs are paid by the San Antonio Fire/EMS Department, which provides services within the San Antonio city limits. Other municipalities and
EXHIBIT 63
BEXAR COUNTY DEMOGRAPHICS, 2010-2014INDICATOR BEXAR COUNTY TEXAS
2004-2014 Population Growth 24% 20%
Median Age 33 34
Proportion of Population under 18 26% 26%
Proportion of Population Adults 18-64 63% 62%
Proportion of Population 65+ 11% 12%
Proportion of Population – White Alone 85% 80%
Proportion of Population – Black or African American Alone 8% 13%
Proportion of Population – Hispanic 59% 39%
Proportion of Population Age 25 and Older with At Least a High School Education 83% 82%
Proportion of Population Age 25 and Older with a Bachelor’s Degree or Higher 27% 27%
Growth in Employment 2004-2014 20% 22%
Average Annual Wage $45,962 $52,537
Proportion of Individuals of All Ages in Poverty 18% 18%
Proportion of Children under 18 in Poverty 25% 25%
Proportion of Population Uninsured 19% 22%
Sources: U.S. Census Bureau, U.S. Bureau of Economic Analysis and Economic Modeling Specialists, Intl.
EXHIBIT 64
HEALTH CARE PROFESSIONAL RATIOS PER 100,000 POPULATION FOR BEXAR COUNTY, 2015
METRIC
BEXAR TEXAS
RATIO RANK RATIO
Ratio of Registered Nurses to 100,000 Population 976.8 21 777.8
Ratio of Primary Care Physicians to 100,000 Population 81.2 35 71.9
Ratio of Behavioral Health Professionals to 100,000 Population 245.9 17 189.9
Source: Texas Medical Board and Center for Health Statistics, State Department of Health Services

TEXAS HEALTH CARE SPENDING: FISCAL 2015
Glenn Hegar, Texas Comptroller of Public Accounts49
outlying areas are served by various providers listed in Exhibit 68. University Health System also provides EMS within its hospital district.
Metro Health is a city/county organization, administered by the city of San Antonio, which provides essential public health functions such as clinical services, immunizations and food inspections. In fiscal 2015, Metro Health spent $11.6 million on employee health care and public health services. Spending on these two categories dipped in 2013 to a five-year low of $10.7 million, with 2015 spending levels nearly the same as those of 2011 (approximately $11.6 million). Metro Health saw a 19 percent reduction in staffing between 2011 and 2015 (Exhibit 65).
Bexar County Hospital District, doing business as University Health System (UHS), has served Bexar County since 1955. It operates a 700-bed teaching, trauma and transplant hospital as well as 27 clinics that provide health care to county residents, including a large number of uninsured patients.
As previously noted, UHS provides EMS within its system boundaries. The system’s EMS costs nearly doubled over the study period, rising by 77 percent from $950,000 to almost $1.7 million, while employee health care costs more than doubled in the same period, increasing by 109 percent (Exhibit 66). Inmate health care costs, by contrast, remained relatively stable, increasing by just 6 percent from $14.5 million to $15.3 million.
EXHIBIT 65
SAN ANTONIO METROPOLITAN HEALTH DISTRICT HEALTH CARE EXPENDITURES, 2011-2015TYPE OF EXPENDITURE 2011 2012 2013 2014 2015
Employee Health Care $1,146,083 $976,098 $887,476 $871,128 $818,400
Public Health Services $10,431,038 $10,672,553 $9,883,981 $10,058,005 $10,740,860
TOTAL $11,577,121 $11,648,651 $10,771,457 $10,929,133 $11,559,260
Source: San Antonio Metropolitan Health District
EXHIBIT 66
UNIVERSITY HEALTH SYSTEM HEALTH CARE EXPENDITURES, 2011-2015
TYPE OF EXPENDITURE 2011 2012 2013 2014 2015
Emergency Medical Services (EMS)89 $949,728 $900,078 $1,059,900 $1,365,659 $1,685,975
Employee Health Care $15,476,074 $19,905,771 $23,138,044 $22,548,572 $32,294,953
Indigent Care: Uncompensated Care/Charity Care90 $207,622,864 $199,242,522 $194,909,504 $196,382,833 $221,813,141
Inmate Medical, Dental and Mental Health Care Costs $14,504,540 $14,029,730 $15,098,030 $15,334,623 $15,319,664
TOTAL $238,553,206 $234,078,101 $234,205,478 $235,631,687 $271,113,733
Other Health Care Spending91
Other Operating92 $294,309,439 $312,623,084 $362,051,273 $443,381,335 $506,441,301
University of Texas Medical School/ Physician Services93 $84,748,321 $94,934,213 $119,251,590 $136,383,163 $138,058,199
Source: University Health System

TEXAS HEALTH CARE SPENDING: FISCAL 2015
Glenn Hegar, Texas Comptroller of Public Accounts50
Bexar County administers a number of county programs and services that invest local public dollars in health care. In all, costs rose by 13 percent during the five-year study period. Employee health care costs were the largest spending category by far, comprising 95 percent of county health care expenditures from 2011 through 2015.
Behavioral health expenditures were the next-largest spending category, reflecting support provided to the local mental health authority, the Center for Health Care Services and the Bexar County Mental Health Department. (Bexar County is the only Texas county with a dedicated mental health department.)
While UHS bears the bulk of inmate health care costs, the amount listed under inmate care in Exhibit 67 represents a contract between the county and UHS for health care services provided at Bexar County’s Central Magistrate’s Office.
As noted above, the city provides the majority of EMS within Bexar County. Other municipalities and unincorporated areas are served by entities listed in Exhibit 68.
EXHIBIT 67
BEXAR COUNTY HEALTH CARE EXPENDITURES, 2011-2015
TYPE OF EXPENDITURE 2011 2012 2013 2014 2015
Behavioral Health94 $1,194,331 $1,219,507 $1,130,968 $1,365,182 $1,567,053
Employee Health Care $40,666,594 $42,703,665 $41,850,079 $43,958,331 $45,714,912
Inmate Medical, Dental and Mental Health Care Costs95 $598,029 $598,029 $620,884 $571,048 $638,697
Public Health Services $133,000 $149,451 $187,314 $184,913 $145,000
TOTAL $42,591,954 $44,670,652 $43,789,245 $46,079,474 $48,065,662
Source: Bexar County
EXHIBIT 68
BEXAR COUNTY EMS EXPENDITURES, 2011-2015
EMS PROVIDER FY 2011 FY 2012 FY 2013 FY 2014 FY 2015
Alamo Heights Fire/EMS $678,856 $649,889 $649,732 $638,089 $660,699
City of Converse Fire and EMS $379,523 $450,659 $476,331 $694,630 $724,312
City of Helotes Fire Department $281,390 $440,165 $455,302 $447,289 $454,205
City of Kirby Fire/EMS* $702,118 $676,658 $727,368 $895,513 $864,149
District 7 Fire and Rescue $738,000 $778,000 $954,000 $1,292,600 $1,270,139
Leon Valley Fire Department $2,005,283 $2,138,627 $2,210,409 $2,409,881 $2,339,605
City of San Antonio Fire Department EMS $57,043,116 $58,381,273 $63,769,385 $67,364,405 $66,447,457
City of Shavano Park Fire Department/EMS $374,232 $374,232 $374,232 $512,852 $547,566
Universal City $225,225 $233,107 $240,149 $247,376 $255,600
TOTAL $61,748,887 $63,472,721 $69,207,176 $73,828,546 $72,903,033
Sources: City of Converse Fire and EMS, District 7 Fire/EMS; City of Helotes Fire Department; City of Kirby Fire and EMS, Leon Valley Fire Department, City of San Antonio Fire/EMS, City of Shavano Park Fire Department/EMS and Universal City.
Note: Not all Bexar County EMS providers provided data.
*City of Kirby Fire/EMS Includes fire department and EMS expenditures.

TEXAS HEALTH CARE SPENDING: FISCAL 2015
Glenn Hegar, Texas Comptroller of Public Accounts51
Gray CountyGray County is in the northeastern portion of the Texas Panhandle (Exhibit 69). Pampa, the county seat, was home to more than 18,000 residents in 2015.96
Gray County’s number of health care professionals per 100,000 residents is substantially lower than state averages (Exhibit 70).
EXHIBIT 69
GRAY COUNTY DEMOGRAPHICS, 2010-2014INDICATOR GRAY COUNTY TEXAS
2004-2014 Population Growth 7% 20%
Median Age 37 34
Proportion of Population under 18 26% 26%
Proportion of Population Adults 18-64 59% 62%
Proportion of Population 65+ 15% 12%
Proportion of Population – White Alone 91% 80%
Proportion of Population – Black or African American Alone 5% 13%
Proportion of Population – Hispanic 27% 39%
Proportion of Population Age 25 and Older with At Least a High School Education 81% 82%
Proportion of Population Age 25 and Older with a Bachelor’s Degree or Higher 15% 27%
Growth in Employment 2004-2014 22% 22%
Average Annual Wage $47,147 $52,537
Proportion of Individuals of All Ages in Poverty 14% 18%
Proportion of Children under 18 in Poverty 18% 25%
Proportion of Population Uninsured 21% 22%
Sources: U.S. Census Bureau, U.S. Bureau of Economic Analysis and Economic Modeling Specialists, Intl.
EXHIBIT 70
HEALTH CARE PROFESSIONAL RATIOS PER 100,000 POPULATION FOR GRAY COUNTY, 2015
METRIC
GRAY TEXAS
RATIO RANK RATIO
Ratio of Registered Nurses to 100,000 Population 567.5 61 777.8
Ratio of Primary Care Physicians to 100,000 Population 55.1 89 71.9
Ratio of Behavioral Health Professionals to 100,000 Population 88.9 126 189.9
Source: Texas Medical Board and Center for Health Statistics, State Department of Health Services, 2015
Gray County Health Care ExpendituresEmployee health costs represent Gray County’s largest category of health care spending (Exhibit 71). These costs fluctuated only slightly from 2011 to 2015. The next-largest health care spending categories are county inmate health care, EMS and indigent health care; costs for all three categories fluctuated more significantly from 2011 to 2015.

TEXAS HEALTH CARE SPENDING: FISCAL 2015
Glenn Hegar, Texas Comptroller of Public Accounts52
EXHIBIT 71
GRAY COUNTY HEALTH CARE EXPENDITURES, 2011-2015
TYPE OF EXPENDITURE 2011 2012 2013 2014 2015
Behavioral Health (support to the LMHA) $5,435 $7,150 $15,902 $2,914 $6,634
County Indigent Health Care Program $27,723 $162,237 $58,210 $80,745 $115,356
Employee Health Care $1,317,470 $1,443,275 $1,390,739 $1,296,072 $1,334,680
Emergency Medical Services (EMS) $87,567 $87,981 $100,200 $167,504 $140,968
Inmate Medical, Dental and Mental Health Care Costs $93,023 $137,433 $94,955 $125,040 $146,835
TOTAL $1,531,218 $1,838,076 $1,659,196 $1,672,275 $1,744,473
Source: Gray County
Starr CountyStarr County is a border county in South Texas with nearly 64,000 residents (Exhibit 72). Rio Grande City, the county seat, had 14,404 residents in 2015.97 Starr County has a hospital district doing business as Starr County Memorial Hospital.
Starr County’s ratios of health care professionals are well below the state as a whole (Exhibit 73).
Starr County Health Care ExpendituresDuring the study period, Starr County’s largest category of health care spending was employee health costs. These costs fluctuated slightly but rose by an average of 4.6 percent annually from 2011 to 2015. County inmate health care costs were only available for 2015 (Exhibit 74).
Starr County’s hospital district provides both indigent health care and EMS. EMS was the district’s largest health care expenditure category during the study period, followed closely by employee health care (Exhibit 75). Indigent health care costs totaled $316,245 in 2015, less than half the 2014 total.
EXHIBIT 72
STARR COUNTY DEMOGRAPHICS, 2010-2014
INDICATOR STARR COUNTY TEXAS
2004-2014 Population Growth 9% 20%
Median Age 29 34
Proportion of Population under 18 33% 26%
Proportion of Population Adults 18-64 56% 62%
Proportion of Population 65+ 11% 12%
Proportion of Population – White Alone 99% 80%
Proportion of Population – Black or African American Alone 0.4% 13%
Proportion of Population – Hispanic 96% 39%
Proportion of Population Age 25 and Older with At Least a High School Education 47% 82%
Proportion of Population Age 25 and Older with a Bachelor’s Degree or Higher 10% 27%
Growth in Employment 2004-2014 25% 22%
Average Annual Wage $28,033 $52,537
Proportion of Individuals of All Ages in Poverty 39% 18%
Proportion of Children under 18 in Poverty 50% 25%
Proportion of Population Uninsured 39% 22%
Sources: U.S. Census Bureau, U.S. Bureau of Economic Analysis and Economic Modeling Specialists, Intl.

TEXAS HEALTH CARE SPENDING: FISCAL 2015
Glenn Hegar, Texas Comptroller of Public Accounts53
EXHIBIT 73
HEALTH CARE PROFESSIONAL RATIOS PER 100,000 POPULATION FOR STARR COUNTY, 2015
METRIC
STARR TEXAS
RATIO RANK RATIO
Ratio of Registered Nurses to 100,000 Population 205.8 218 777.8
Ratio of Primary Care Physicians to 100,000 Population 21.5 195 71.9
Ratio of Behavioral Health Professionals to 100,000 Population 52.2 182 189.9
Source: Texas Medical Board and Center for Health Statistics, State Department of Health Services
EXHIBIT 74
STARR COUNTY HEALTH CARE EXPENDITURES, 2011-2015TYPE OF EXPENDITURE 2011 2012 2013 2014 2015
Employee Health Care $1,693,443 $1,866,355 $1,396,309 $1,959,607 $2,008,249
Inmate Medical, Dental and Mental
Health Care Costs98 -- -- -- -- $97,600
TOTAL $1,693,443 $1,866,355 $1,396,309 $1,959,607 2,105,849
Source: Starr County
EXHIBIT 75
STARR COUNTY HOSPITAL DISTRICT HEALTH CARE EXPENDITURES, 2011-201595
TYPE OF EXPENDITURE 2011 2012 2013 2014 2015
Employee Health Care $1,187,642 $1,606,732 $1,309,207 $1,458,194 $1,505,634
Emergency Medical Services (EMS) $1,775,668 $1,856,796 $1,853,768 $1,998,391 $1,986,102
Indigent Care Provided at Starr County Memorial Hospital $605,665 $675,969 $686,505 $824,706 $316,245
TOTAL $3,568,975 $4,139,497 $3,849,480 $4,281,291 $3,807,981
Source: Starr County Hospital District

TEXAS HEALTH CARE SPENDING: FISCAL 2015
Glenn Hegar, Texas Comptroller of Public Accounts54
Val Verde CountyVal Verde County is a border county in the southern Edwards Plateau (Exhibit 76), with 49,000 residents in 2015. Del Rio, the county seat, is home to more than 36,000.96 The county is also home to Laughlin Air Force Base.
In 2015, Val Verde County had much lower ratios of health care professionals per 100,000 residents than the state as a whole (Exhibit 77).
Val Verde County Health Care ExpendituresVal Verde County provided the Comptroller’s office only with county employee health care expenditures. Between 2011 and 2015, these costs rose by an average of 8.5 percent annually.
The county contracts with GEO Group, Inc., a private company that owns and operates private detention facilities providing health and mental health services to inmates. The county pays GEO Group a per diem per inmate that includes health care but GEO Group was not able to provide the Comptroller with expenditure data (Exhibit 78).
EXHIBIT 76
VAL VERDE COUNTY DEMOGRAPHICS, 2010-2014
INDICATOR VAL VERDE COUNTY TEXAS
2004-2014 Population Growth 4.3% 20%
Median Age 31.9 34
Proportion of Population under 18 29% 26%
Proportion of Population Adults 18-64 57% 62%
Proportion of Population 65+ 14% 12%
Proportion of Population – White Alone 95% 80%
Proportion of Population – Black or African American Alone 2% 13%
Proportion of Population – Hispanic 80% 39%
Proportion of Population age 25 and Older with At Least a High School Education 66% 82%
Proportion of Population age 25 and Older with a Bachelor’s Degree or Higher 16% 27%
Growth in Employment 2004-2014 11% 22%
Average Annual Wage $38,181 $52,537
Proportion of Individuals of All Ages in Poverty 22% 18%
Proportion of Children under 18 in Poverty 31% 25%
Proportion of Population Uninsured 26% 22%
Sources: U.S. Census Bureau, U.S. Bureau of Economic Analysis and Economic Modeling Specialists, Intl.
EXHIBIT 77
HEALTH CARE PROFESSIONAL RATIOS PER 100,000 POPULATION FOR VAL VERDE COUNTY, 2015
METRIC
VAL VERDE TEXAS
RATIO RANK RATIO
Ratio of Registered Nurses to 100,000 Population 421.7 116 777.8
Ratio of Primary Care Physicians to 100,000 Population 48.8 110 71.9
Ratio of Behavioral Health Professionals to 100,000 Population 50.8 70 189.9
Source: Texas Medical Board and Center for Health Statistics, State Department of Health Services

TEXAS HEALTH CARE SPENDING: FISCAL 2015
Glenn Hegar, Texas Comptroller of Public Accounts55
EXHIBIT 78
VAL VERDE HEALTH CARE EXPENDITURES, 2011-2015
TYPE OF EXPENDITURE 2011 2012 2013 2014 2015
Employee Health Care $1,227,297 $1,273,384 $1,572,135 $1,560,377 $1,643,758
TOTAL $1,227,297 $1,273,384 $1,572,135 $1,560,377 $1,643,758
Source: Val Verde County
Study LimitationsThe delivery of health care services within Texas counties is a responsibility shared among various governmental entities. Many county governments included in our study work with cities, hospital districts and public hospitals to provide EMS and indigent health care. This fragmentation made data collection challenging and time-consuming.
In Bexar County, for instance, city and county governments, a public hospital district and a health district all provide health care services to county residents, including the indigent and uninsured. While the city pays for a majority of the county’s EMS, the hospital district and at least 11 other municipalities and unincorporated areas within the county also deliver emergency services.
Bexar County isn’t an isolated case; mid-sized and smaller counties often share the responsibility for indigent health care. Compiling the information in this report required Comptroller analysts to contact and work with numerous entities.
This constellation of entities also uses different accounting systems. Comptroller analysts found significant variations in the way in which they define and record health care expenditures, making aggregating and standardizing expenditure data difficult. Hospital districts, for example, draw upon multiple state, federal and private funding streams to provide services.
Smaller counties, moreover, are short on staff and were slow to respond to our inquiries. The smallest did not or could not provide all the information we requested.
All of these issues affected our ability to analyze expenditure data effectively.

TEXAS HEALTH CARE SPENDING: FISCAL 2015
Glenn Hegar, Texas Comptroller of Public Accounts56
APPENDIX: DEFINITION OF HEALTH CAREThe Comptroller’s definition of “health care” closely follows that used by the U.S. Department of Health and Human Services to produce official estimates of total health care spending in the U.S.97
For the purposes of this report, Texas health care costs include medical goods and services, health insurance, workers’ compensation, vocational rehabilitation, substance abuse services and medical research. Goods and services included in the definition of health care include:
MEDICAL SERVICES
•
•
•
•
•
Hospital Care
Physician and Clinical, Dental and Other Professional Services
Other Health, Residential and Personal Care
Home Health Care
Nursing Care Facilities and Continuing Care Retirement Communities
MEDICAL GOODS
•
•
•
•
•
Retail Outlet Sales of Medical Products
Prescription Drugs
Other Non-Durable Medical Products
Durable Medical Equipment
Personal Health Care, Payers and Programs
HEALTH INSURANCE
•
•
•
•
Private Health Insurance
Medicare
Medicaid
Children’s Health Insurance Program
OTHER THIRD-PARTY PAYERS AND PROGRAMS
•
•
•
•
•
•
Workers’ Compensation
General Assistance
Maternal and Child Health
Vocational Rehabilitation
Substance Abuse and Mental Health Services
School Health
PUBLIC HEALTH ACTIVITY
•
•
•
Non-Commercial Research
Structures
Equipment
ACKNOWLEDGEMENTSCancer Research and Prevention Institute of Texas, Heidi McConnell
Employees Retirement System of Texas, Dana Jepson
Higher Education Coordinating Board, Ed Buchanan
State Office of Risk Management, Brad Cargile
Teacher Retirement System of Texas, Meaghan Bludau
Teacher Retirement System of Texas, Katrina Daniel
Texas A&M University System, Kevin McGinnis
Texas Department of Agriculture, Anita Martinez
Texas Department of Criminal Justice, Ron Steffa
Texas Department of Family Protective Services, Rand Harris
Texas Department of Transportation, Deryl Creekmur
Texas Health and Human Services Commission, Lisa Carruth
Texas Health Institute, Camille Miller
Texas Juvenile Justice Department, Emily Anderson
Texas School for the Blind and Visually Impaired, Pamela Darden
Texas School for the Deaf, Liane Saunders
The University of Texas System, Patrick Francis

TEXAS HEALTH CARE SPENDING: FISCAL 2015
Glenn Hegar, Texas Comptroller of Public Accounts57
ENDNOTES(Endnotes)
1 U.S. Centers for Medicare and Medicaid Services, “National Health Expenditure Projections 2015-2025, Forecast Summary,” https://www.cms.gov/Research-Statistics-Data-and-Systems/Statistics-Trends-and-Reports/NationalHealthExpendData/Downloads/Proj2015.pdf.
2 Caitlin Owens, “Health Care Expenditures Heading Toward 20 Percent of Economy,” Morning Consult (July 13, 2016), https://morningconsult.com/2016/07/13/health-care-expenditures-heading-toward-20-percent-economy/.
3 Henry J. Kaiser Family Foundation, “State Health Facts, Medicaid and CHIP,” http://kff.org/state-category/medicaid-chip/, accessed November 8, 2016.
4 Texas Health and Human Services Commission, “HHSC Announces New Senior Staff Appointments,” July 15, 2016, https://hhs.texas.gov/about-hhs/communications-events/news-releases/2016/07/hhsc-announces-new-senior-staff-appointments
5 Email communication from Lisa Carruth, August 1, 2016.
6 These services include but are not limited to nursing, adult day care, home health care, transportation, and personal care services.
7 Email communication with Excel attachments from Lisa Carruth, chief financial officer, Texas Health and Human Services Commission, June 18, 2016.
8 Email communication with Excel attachments from Lisa Carruth, chief financial officer, Texas Health and Human Services Commission, August 11, 2016.
9 Texas Health and Human Services Commission, “Report to the Transition Legislative Oversight Committee: Health and Human Services System Transition Plan,” August 2016, https://hhs.texas.gov/sites/hhs/files/documents/about-hhs/transformation/final-transformation-plan.pdf.
10 Texas Comptroller of Public Accounts, “Texas Net Expenditures by Function, Fiscal 2015 (All Funds, Excluding Trust),” https://www.comptroller.texas.gov/transparency/reports/expenditures/function.
11 Email communication from Lisa Carruth, June 18, 2016.
12 Email communication from Lisa Carruth, chief financial officer, Texas Health and Human Services Commission, August 6, 2016.
13 Email communication from Lisa Carruth, June 18, 2016.
14 Legislative Budget Board, “Medicaid Overview: Presentation to the House Committee on Appropriations Subcommittee on Article II,” April 6, 2016, http://www.lbb.state.tx.us/Documents/Publications/Presentation/3230_LBB_Medicaid_Presentation.pdf, accessed October 21, 2016.
15 Texas Legislative Budget Board, HB1 Conference Committee Report (Austin, Texas, June 2015), Pp. II-96-97, http://www.lbb.state.tx.us/Documents/Budget/Session_Code_84/HB1-Conference_Committee_Report_84.pdf.
16 Lone Star Health Financial Management Administration, “A Texas Checkup: Healthcare Policy Update,” by Michelle Apodaca, Haynes and Boone, LLP, April 22, 2016, http://www.lonestarhfma.org/wp-content/uploads/2015/06/160402-Michelle-Apodaca.pdf.
17 Texas Department of State Health Services, “Overview: Presentation to Senate Committee on Health and Human Services,” February 4, 2015, pp. 3, 11, http://dshs.texas.gov/WorkArea/linkit.aspx?LinkIdentifier=id&ItemID=8589995512.
18 Department of State Health Services, “Presentation to the Senate Committee on Health and Human Services,” February 4, 2015, https://www.dshs.texas.gov/WorkArea/linkit.aspx?LinkIdentifier=id&ItemID=8589995512, last accessed October 20, 2016.
19 Texas Health and Human Services Commission/Texas Department of State Health Services, “What’s Driving Mental Health Care Costs?” provided by Lisa Carruth, chief financial officer, Texas Health and Human Services Commission, August 7, 2016, with file attachment.
20 Texas Employee Retirement System, “Who We Serve,” http://www.ers.state.tx.us/About_ERS/Organization/.
21 Email communication from Dana Jepson, senior coordinator for Research and Policy, Governmental Affairs, Employee Retirement System of Texas, July 25, 2016.
22 Texas Employee Retirement System, “HMO,” https://www.ers.state.tx.us/Employees/Health/HMO/.
23 Tex. Ins. Code, Title 8, Subtitle H, Chapter 1579.
24 Tex. Ins. Code, Title 8, Subtitle H, Chapter 1575, §1575.202.
25 State Office of Risk Management, Biennial Report to the 84th Texas Legislature, December 31, 2014, p. 11, https://www.sorm.state.tx.us/sorm-cms/uploads/2015/01/Biennial%20Final%202014-1.pdf.
26 Texas Department of Assistive and Rehabilitative Services, “DARS Programs and Services Have Transferred to New Agencies,” http://www.dars.state.tx.us/.
27 Email communication with Excel attachments from Lisa Carruth, chief financial officer, Texas Health and Human Services Commission, August 18, 2016.
28 University of Texas System, “Benefits for Employees,” https://www.utsystem.edu/offices/employee-benefits/insurance.
29 University of Texas System, “Workers’ Compensation Insurance,” https://www.utsystem.edu/offices/risk-management/workers-compensation-insurance.
30 Texas A&M University, “Insurance,” http://employees.tamu.edu/benefits/insurance/.
31 Texas A&M University, “Workers’ Compensation Information,” http://employees.tamu.edu/benefits/leave/workers-comp/.

TEXAS HEALTH CARE SPENDING: FISCAL 2015
Glenn Hegar, Texas Comptroller of Public Accounts58
32 Legislative Budget Board, “Adult and Juvenile Correction Population Projections: Fiscal Years 2011-2016,” p. 10, http://www.lbb.state.tx.us/Documents/Publications/Policy_Report/Adult%20and%20Juvenile%20Correctional%20Populations%20Projections2011-2016.pdf; and Legislative Budget Board, “Monthly Tracking of Adult Correctional Population Indicators (August 2016),” p. 1, http://www.lbb.state.tx.us/Documents/Publications/Info_Graphic/812_Monthly_Report_Aug_2016.pdf.
33 Email communication from Ron Steffa, Texas Department of Criminal Justice, April 19, 2016, with attachment, “Texas Department of Criminal Justice: Information Requested from Comptroller’s Office.”
34 Texas Comptroller of Public Accounts, “Texas Road Finance Part I,” by Ginger Lowry and TJ Costello, Fiscal Notes (May 2016), http://www.comptroller.texas.gov/fiscalnotes/may2016/road-finance.php.
35 Texas Department of Transportation, “Inside TxDOT: Districts,” https://www.txdot.gov/inside-txdot/district.html; and Email communication from Deryl Creekmur, Texas Department of Transportation, September 12, 2016.
36 Email communication from Deryl Creekmur, program specialist, Texas Department of Transportation, May 10, 2016.
37 Texas Department of Agriculture, “Texas State Office of Rural Health (SORH),” https://texasagriculture.gov/GrantsServices/RuralEconomicDevelopment/StateOfficeofRuralHealth.aspx.
38 Email communication from Anita Martinez, financial analyst, Texas Department of Agriculture, May 31, 2016.
39 The Hastings Center, Bioethics Briefing Book, “Chapter 17: Health Care Costs and Medical Technology,” by Daniel Callahan, 2008, http://www.thehastingscenter.org/briefingbook/chapter-17-health-care-costs-and-medical-technology/.
40 U.S. Centers for Disease Control and Prevention, National Center for Health Statistics, “Health Expenditures,” http://www.cdc.gov/nchs/fastats/health-expenditures.htm.
41 Drew Altman, “Prescription Drugs’ Sizable Share of Health Spending,” Wall Street Journal (December 13, 2015), http://blogs.wsj.com/washwire/2015/12/13/prescription-drugs-sizable-share-of-health-spending/.
42 U.S. Congressional Budget Office, Technological Change and the Growth of Health Care Spending, (Washington, D.C., January 2008), p. 4, https://www.cbo.gov/sites/default/files/110th-congress-2007-2008/reports/01-31-techhealth.pdf; and Henry J. Kaiser Family Foundation, Impact of Direct-to-ConsumerAdvertising on Prescription Drug Spending, June 2003, p. 2,http://www.kff.org/rxdrugs/loader.cfm?url=/commonspot/security/getfile.cfm&PageID=14378.
43 Jonathan Hensley and Paul Lambert, “The Coming Storm — Five Market Trends Driving Healthcare Costs Higher,” State of Reform (August 17, 2015), http://stateofreform.com/commentary/opinion/2015/08/the-coming-storm-five-market-trends-driving-healthcare-costs-higher/
44 See for instance Thomas Sullivan, “U.S. Spent $374 Billion on Prescription Drugs Last Year, Up 13%; Increase Largely Due to HepC Cures and Limited Generic Competition,” Policy and Medicine (April 2015), http://www.policymed.com/2015/04/us-spent-3739-billion-on-prescription-drugs-last-year-up-131-percent-increase-largely-due-to-hep-c-c.html; and Peter Loftus, “U.S. Drug Spending Climbs: Growth Rate Slows but Remains at High Level, Fueled by Pricey New Medications,” Wall Street Journal (April 14, 2016), http://www.wsj.com/articles/u-s-drug-spending-climbs-1460606462.
45 Pew Charitable Trusts, Fact Sheet: “Specialty Drugs and Health Care Costs”, November 2015, http://www.pewtrusts.org/~/media/assets/2015/11/specialty-drugs-and-health-care-costs_artfinal.pdf, accessed January 1, 2017.
46 Thomas Sullivan, “U.S. Spent $374 Billion on Prescription Drugs Last Year, Up 13%; Increase Largely Due to HepC Cures and Limited Generic Competition.”
47 U.S. Congressional Budget Office, The 2015 Long-Term Budget Outlook (Washington D.C., June 2015), p. 35, http://www.cbo.gov/sites/default/files/114th-congress-2015-2016/reports/50250-LongTermBudgetOutlook-3.pdf.
48 Robert Wood Johnson Foundation, “What are the Biggest Drivers of Cost in U.S. Health Care?,” Issue Brief (July 2011), p. 1, http://www.rwjf.org/content/dam/farm/reports/issue_briefs/2011/rwjf71331.
49 American Hospital Association, “Uncompensated Heath Care Cost Fact Sheet,” January 2016, http://www.aha.org/content/16/uncompensatedcarefactsheet.pdf.
50 The National Bureau of Economic Research, “Hospitals as Insurers of Last Resort,” by Craig Garthwaite, Tal Gross and Matthew Notowidigdo (Cambridge, Massachusetts, June 2015), p. 2, http://www.columbia.edu/~tg2370/garthwaite-gross-notowidigdo-hospitals.pdf.
51 Henry J. Kaiser Foundation, Kaiser Commission on Medicaid and the Uninsured, Uncompensated Care for Uninsured in 2013: A Detailed Examination, by Teresa Coughlin et al, The Urban Institute, May 2014, p. 11, https://kaiserfamilyfoundation.files.wordpress.com/2014/05/8596-uncompensated-care-for-the-uninsured-in-2013.pdf
52 Wade Goodwyn, “Texas Loses Billions To Treat the Poor by Not Expanding Medicaid, Advocates Say,” NPR (May 29, 2015), http://www.npr.org/2015/05/29/410470081/texas-didn-t-expand-medicaid-advocates-say-money-is-being-left-on-the-table?utm_medium=RSS&utm_campaign=health care; and U.S. Department of Health and Human Services, Office of the Assistant Secretary for Planning and Evaluation, “Impact of Insurance Expansion on Hospital Uncompensated Care Costs in 2014,” September 1, 2014, https://aspe.hhs.gov/pdf-report/impact-insurance-expansion-hospital-uncompensated-care-costs-2014.
53 Baker Institute, “Issue Brief #21: Changes in Rates and Characteristics of the Uninsured among Texans Ages 18-64 from 2013 to 2016,” May 2016, http://www.episcopalhealth.org/files/4714/6472/4381/Issue_Brief_21_FINAL_a.pdf; and Gallup, “U.S. Uninsured Rate at 11.0%, Lowest in Eight-Year Trend,” April 7, 2016, http://www.gallup.com/poll/190484/uninsured-rate-lowest-eight-year-trend.aspx.

TEXAS HEALTH CARE SPENDING: FISCAL 2015
Glenn Hegar, Texas Comptroller of Public Accounts59
54 Rice University, Baker Institute, “Issue Brief #21: Changes in Rates and Characteristics of the Uninsured among Texans Ages 18-64 from 2013 to 2016,” by Elena Marks et al, May 2016, http://www.episcopalhealth.org/files/4714/6472/4381/Issue_Brief_21_FINAL_a.pdf.
55 Henry J. Kaiser Foundation, Kaiser Commission on Medicaid and the Uninsured, Uncompensated Care for Uninsured in 2013: A Detailed Examination, p. 5.
56 Texas Association of Counties, “Health and Human Services Issues,” January 14, 2015, http://lbj.utexas.edu/sites/default/files/file/profdev/candt/2014_2015/Judges_Comm_Jan/KELLEY_IndigentCare_web.pdf.
57 Texas Department of State Health Services, County Indigent Health Care Complete Program Handbook, 2015, p. 26, https://www.dshs.texas.gov/cihcp/County-Indigent-Health-Care-Program-Handbook/.
58 84th Tex. Leg. H.B. 1 (2015).
59 Texas Health and Human Services Commission. “Big Win for Texas, HHSC Receives Extension for 1115 Waiver,” by Chris Traylor, May 2, 2016, https://hhs.texas.gov/about-hhs/communications-events/news-releases/2016/05/big-win-texas-hhsc-receives-extension-1115-waiver.
60 Texas Health and Human Services Commission, “Presentation to the House Appropriations Committee: Overview of Texas Medicaid Hospital Finance,” May 7, 2015, https://hhs.texas.gov/sites/hhs/files//050715-hospital-finance.pdf.
61 Texas Hospital Association, “Takeaways – Waiver Extension: What Does It Mean for Texas Hospitals and Patients?” May 4, 2016, available at http://www.tha.org/waiver.
62 Texas Legislative Council, “Disproportionate Share Hospital (DSH) Program: Your Questions Answered,” by Carey Eskridge, March 2003, http://www.tlc.state.tx.us/docs/policy/dshprogram.pdf.
63 Kaiser Family Foundation, “Federal Medicaid DSH Allotments, Timeframe: FY 2015,” http://kff.org/medicaid/state-indicator/federal-dsh-allotments/.
64 Texas Health and Human Services Commission, Health and Human Services System Strategic Plan (2013-2017), July 6, 2012, p. 21, https://www.hhsc.state.tx.us/about_hhsc/strategic-plan/2013-2017/Volume-I.pdf.
65 U.S. Centers for Disease Control and Prevention, “Chronic Disease Overview,” http://www.cdc.gov/chronicdisease/overview/. State BRFSS data from 2014 do not include metrics for diet comparable with national figures so obesity/overweight is included in this table.
66 Partnership to Fight Chronic Disease, “Medicaid in a New Era: Proven Solutions to Enhance Quality and Reduce Costs,” http://www.fightchronicdisease.org/sites/default/files/docs/Medicaid%20in%20a%20New%20Era%20-%20White%20paper.pdf.
67 U.S. Centers for Disease Control and Prevention, “Chronic Disease Overview.”
68 Susan Kelley, “Obesity Accounts for 21 Percent of U.S. Health Care Costs,” Cornell Chronicle (April 4, 2012), http://news.cornell.edu/print/553.
69 U.S. Office of the Surgeon General, “Overweight and Obesity: Health Consequences,” http://www.surgeongeneral.gov/topics/obesity/calltoaction/fact_consequences.html. (Last visited June 8, 2010.)
70 William S. Pearson et al, “State-Based Medicaid Costs for Pediatric Asthma Emergency Department Visits,” Preventing Chronic Disease (Volume 11, June 26, 2014), http://dx.doi.org/10.5888/pcd11.140139.
71 U.S. Department of Health and Human Services, “Projected Future Growth of the Older Population, By State: 2005-2030,” tables for number of persons 65 and over and percent of persons 65 and over, available in Microsoft Excel format at http://www.aoa.acl.gov/Aging_Statistics/future_growth/future_growth.aspx#state.
72 U.S. Centers for Medicare and Medicaid Services, “NHE Fact Sheet, Historical NHE, 2014,” August 10, 2016, https://www.cms.gov/research-statistics-data-and-systems/statistics-trends-and-reports/nationalhealthexpenddata/nhe-fact-sheet.html.
73 Texas Demographic Center, “Aging in Texas: Introduction,” July 7, 2016, http://demographics.texas.gov/Resources/publications/2016/2016_06_07_Aging.pdf.
74 Employees Retirement System of Texas, “Presentation to the House Public Health Committee, April 5, 2016,” https://www.ers.state.tx.us/.../04052016/, last accessed October 21, 2016.
75 U.S. Department of Health and Human Services, Health Resources and Services Administration Data Warehouse, “Medically Underserved Areas/Populations,” https://datawarehouse.hrsa.gov/tools/analyzers/MuaSearchResults.aspx; and Texas Department of Agriculture, State Office of Rural Health, “State of Health Care in Rural Texas,” http://www.texasagriculture.gov/Portals/0/forms/ER/RuralHealth/SORH%20Infographic.pdf. Medically underserved areas or populations have been designated by the U.S. Health Resources and Services Administration as having too few primary care providers, high infant mortality, high poverty or a high elderly population. Health professional shortage areas have shortages of primary medical care, dental or mental health providers and may be tied to geography (a county or service area), population (e.g. low-income or Medicaid-eligible persons) or facilities (e.g. a federally qualified health center or state or federal prisons). Medically underserved populations may include groups of persons who face economic, cultural or linguistic barriers to health care.Texas Department of Agriculture, State Office of Rural Health, “State of Health Care in Rural Texas,” http://www.texasagriculture.gov/Portals/0/forms/ER/RuralHealth/SORH%20Infographic.pdf.
76 U.S. Centers for Medicare and Medicaid Services, “Federally Qualified Health Center,” https://www.cms.gov/Outreach-and-Education/Medicare-Learning-Network-MLN/MLNProducts/downloads/fqhcfactsheet.pdf; and “Rural Health Clinic,” https://www.cms.gov/Outreach-and-Education/Medicare-Learning-Network-MLN/MLNProducts/downloads/RuralHlthClinfctsht.pdf.

TEXAS HEALTH CARE SPENDING: FISCAL 2015
Glenn Hegar, Texas Comptroller of Public Accounts60
77 Taken from U.S. Department of Health and Human Services, Health Resources and Services Administration Data Warehouse, “Health Care Facilities (CMS),” https://datawarehouse.hrsa.gov/tools/DataPortalResults.aspx. Does not include federally qualified health center “look-alikes” that do not receive federal health center grants and do not report to the Bureau of Primary Health Care.
78 Tex. Health & Safety Code Ann. Chapter 61.
79 Texas Association of Counties, “2014 County Expenditures Survey,” August 2015, p. 1, https://www.county.org/about-texas-counties/county-data/Documents/Expenditures-2014-Final.pdf.
80 See U.S. Census Bureau, Population and Housing Unit Estimates, https://www.census.gov/popest/.
81 Email communication from Deidra Turner, case manager, Indigent Health Care Department, Angelina County, May 11, 2016.
82 See U.S. Census Bureau, Population and Housing Unit Estimates.
83 This expenditure category was provided by Bell County officials and was not represented in the template of expenditure types used for this report.
84 See U.S. Census Bureau, Population and Housing Unit Estimates.
85 These EMS expenditures do not reflect total EMS expenditures for Bexar County, but only a small subset specific to the hospital district. EMS expenditures in Bexar County include city of San Antonio Fire/EMS and contractual arrangements with private providers serving unincorporated areas of the county. San Antonio Fire/EMS did not respond to repeated requests for expenditure data.
86 Uncompensated care/charity care is the expenditure related to treating individuals below 200 percent of the federal poverty guidelines. Roughly 80 percent of this represents unfunded patient expense and the remainder is related to the uncompensated cost of care for Medicaid patients.
87 These expenditure categories were provided by UHS and are not represented in the template of expenditure types used for this report.
88 This expenditure category comprises salaries, supplies and purchased services and reflects the aggregate cost of operating the health system apart from the categories listed above.
89 This expenditure category represents payments to the University of Texas Health Science Center San Antonio for UHS physician services.
90 This expenditure category represents spending by the Center for Health Care Services and Bexar County Mental Health Department.
91 This expenditure category represents only a part of inmate care, specifically a contract between the Center for Health Care Services (the Bexar County local mental health care authority) and the hospital district, University Health Services, for health care services at Bexar County Central Magistrate. Total Bexar County expenditures for inmate care are within the purview of UHS and are represented in Exhibit 7.
92 See U.S. Census Bureau, Population and Housing Unit Estimates.
93 See U.S. Census Bureau, Population and Housing Unit Estimates.
94 Starr County provided only one year of inmate care expenditure data.
95 The district does business as Starr County Memorial Hospital.
96 See U.S. Census Bureau, Population and Housing Unit Estimates.
97 U.S. Center for Medicare and Medicaid Services, “National Health Expenditure Accounts: Methodology Paper, 2013; Definitions, Sources and Methods,” pp. 9-28, https://www.cms.gov/research-statistics-data-and-systems/statistics-trends-and-reports/nationalhealthexpenddata/downloads/dsm-13.pdf.

Texas Comptroller of Public AccountsPublication #96-1796
January 2017
Texas Comptroller of Public Accounts111 E. 17th Street
Austin, Texas 78774-0100