Embed Size (px)
Citation preview

ANL-ART-153
Fiscal Year 2018 Sodium-CO2 Interaction Test
Nuclear Science and Engineering Division

About Argonne National Laboratory
Argonne is a U.S. Department of Energy laboratory managed by UChicago
Argonne, LLC under contract DE-AC02-06CH11357. The Laboratory’s main facility
is outside Chicago, at 9700 South Cass Avenue, Argonne, Illinois 60439. For
information about Argonne and its pioneering science and technology programs,
see www.anl.gov.
DOCUMENT AVAILABILITY
Online Access: U.S. Department of Energy (DOE) reports produced after 1991
and a growing number of pre-1991 documents are available free at OSTI.GOV
(http://www.osti.gov/), a service of the US Dept. of Energy’s Office of Scientific
and Technical Information.
Reports not in digital format may be purchased by the public
from the National Technical Information Service (NTIS):
U.S. Department of Commerce
National Technical Information
Service 5301 Shawnee Rd
Alexandria, VA 22312
www.ntis.gov
Phone: (800) 553-NTIS (6847) or (703) 605-6000
Fax: (703) 605-6900
Email: [email protected]
Reports not in digital format are available to DOE and DOE contractors
from the Office of Scientific and Technical Information (OSTI):
U.S. Department of Energy
Office of Scientific and Technical Information
P.O. Box 62
Oak Ridge, TN 37831-0062
www.osti.gov
Phone: (865) 576-8401
Fax: (865) 576-5728
Email: [email protected]
Disclaimer
This report was prepared as an account of work sponsored by an agency of the United States Government. Neither the United
States Government nor any agency thereof, nor UChicago Argonne, LLC, nor any of their employees or officers, makes any
warranty, express or implied, or assumes any legal liability or responsibility for the accuracy, completeness, or usefulness of any
information, apparatus, product, or process disclosed, or represents that its use would not infringe privately owned rights.
Reference herein to any specific commercial product, process, or service by trade name, trademark, manufacturer, or
otherwise, does not necessarily constitute or imply its endorsement, recommendation, or favoring by the United States
Government or any agency thereof. The views and opinions of document authors expressed herein do not necessarily state or
reflect those of the United States Government or any agency thereof, Argonne National Laboratory, or UChicago Argonne, LLC.

ANL-ART-153
Fiscal Year 2018 Sodium-CO2 Interaction Test
Prepared by
Nathan Bremer, Darius Lisowski, Craig Gerardi,* James J. Sienicki, and Christopher Grandy
Nuclear Science and Engineering Division
*Present address Kairos Power, Oakland, California
Argonne National Laboratory
September 14, 2018

This page intentionally left blank

1 ANL-ART-153
ABSTRACT
An experiment campaign was continued in Fiscal Year 2018 in the Argonne National
Laboratory (Argonne) SNAKE facility that investigated the interactions between supercritical
carbon dioxide (sCO2) and sodium through injection of sCO2 into an open surface sodium pool.
Two of fifteen previous SNAKE tests revealed that self-plugging of the leakage path/nozzle
occurs at higher initial sodium temperatures of about 500 ºC due to chemical reactions involving
CO2, sodium, and sodium-CO2 reaction products. At lower sodium temperatures, the
interaction phenomena involve consumption of injected CO2 and formation of an agglomerated
mass of reaction products without self-plugging. The FY 2018 test investigated interactions at
an intermediate initial sodium temperature of about 411 ºC, representative of the interior of a
sodium-to-CO2 heat exchanger in a Sodium-Cooled Fast Reactor (SFR) sCO2 Brayton Cycle
energy conversion system. The experiment was successfully conducted and did not show self-
plugging as evidenced by a sustained chemical reaction between the injected CO2 and sodium
and consumption of CO2.

Fiscal Year 2018 Sodium-CO2 Interaction Test
September 14, 2018
2 ANL-ART-153
This page intentionally left blank

Fiscal Year 2018 Sodium-CO2 Interaction Test
September 14, 2018
3 ANL-ART-153
Table of Contents
ABSTRACT ............................................................................................................................... 1
EXECUTIVE SUMMARY ........................................................................................................ 4
1 Introduction ........................................................................................................................... 6
2 Experimental .......................................................................................................................... 7
2.1 Current Test Matrix ........................................................................................................ 7
3 Exp2018_16 sCO2 Sodium Test ............................................................................................ 9
3.1 Exp2018_16 Test Summary ........................................................................................... 9
3.2 New Fiber Installation and Position ............................................................................... 9
3.2.1 Design ................................................................................................................ 10
3.2.2 Fabricated Injector Hub ..................................................................................... 11
3.3 Experiment details ........................................................................................................ 12
3.3.1 Distributed temperature sensing ........................................................................ 16
3.3.2 Additional instruments ...................................................................................... 17
3.4 Test Procedures ............................................................................................................ 19
3.4.1 Pre-test operations ............................................................................................. 19
3.4.2 Test operations ................................................................................................... 21
3.4.3 Post-test operations ............................................................................................ 22
3.5 Experiment Results of Exp2016_16............................................................................. 22
3.5.1 Test overview .................................................................................................... 22
3.5.2 Discussion and Summary .................................................................................. 26
4 Summary .............................................................................................................................. 27
Acknowledgements .................................................................................................................. 27
References ................................................................................................................................ 28

Fiscal Year 2018 Sodium-CO2 Interaction Test
September 14, 2018
4 ANL-ART-153
EXECUTIVE SUMMARY
The following provides a summary of the work performed at the Argonne National Laboratory
(ANL) sodium – supercritical carbon dioxide (sCO2) interaction facility, SNAKE, during Fiscal
Year 2018.
Development of the sCO2 Brayton cycle as an advanced power converter for use with Sodium-
Cooled Fast Reactors (SFRs) as well as other Advanced Reactors has been underway at
Argonne National Laboratory since 2002 under the Nuclear Technology Research and
Development (NTRD) and predecessor U.S. DOE Programs and Initiatives. The main benefits
of sCO2 power conversion for SFRs are improved economics (reduction of the Nuclear Power
Plant overnight capital cost per unit output electrical power, $/kWe, or, alternately, the
Levelized Cost of Electricity, LCOE) and the elimination of the need to accommodate potential
sodium-water reactions. However, sodium and carbon dioxide (CO2) interact chemically such
that there is a need to understand and accommodate potential sodium-CO2 interactions.
The expectation is that sodium-CO2 interactions under prototypical reactor conditions will be
relatively benign compared with sodium-water reactions. If sodium and sCO2 come into contact
and interact, it will be inside of a sodium-to-CO2 heat exchanger. Due to the heat transfer
properties of CO2, there is an incentive to utilize compact diffusion-bonded sodium-to-sCO2
heat exchangers to reduce the heat exchanger size and cost relative to traditional shell-and-tube
technology. Thus, compact diffusion-bonded sodium-to-sCO2 heat exchanger designs define
the prototypical conditions of interest to the study of sodium-sCO2 interactions. Two postulated
failure locations are inside the monolithic structure of the diffusion-bonded core, and at the
headers welded to the diffusion-bonded core. In the event of a postulated crack inside the core,
sCO2 could be released into a single sodium channel. The CO2 could displace sodium from the
channel and discharge into the larger open plenum volumes of the sodium headers welded to
the diffusion-bonded core. In the event of a postulated crack at the header weld, CO2 would be
released directly into the open header plenum volume. Data on sodium-sCO2 interactions under
prototypical conditions in such configurations did not exist prior to SNAKE experiments. The
Argonne sodium-sCO2 interaction experiments in the SNAKE facility have been designed to
simulate prototypical interaction conditions in these two configurations.
Because a postulated structural failure of a compact diffusion-bonded heat exchanger core is
expected to correspond to a micro-crack, the sCO2 release rate into sodium is expected to be
limited which corresponds to a low exothermic energy release rate. However, sodium-CO2
interactions can result in the formation of solid reaction products such as sodium carbonate that
do not readily undergo dissolution in sodium. Reaction products could accumulate in the
intermediate sodium heat transport system, significantly affecting performance and requiring
cleanup. A highly interesting phenomenon is that a micro-crack could, under the right
circumstances, plug itself due to the reactions of sodium, CO2, and sodium-CO2 reaction
products at the micro-crack itself. This plug would seal the crack opening and stop the release
of CO2. If this occurs, the extent of sodium-CO2 interaction would be limited to only a minor
amount by this self-plugging phenomenon. These are some of the phenomena under
investigation in the Argonne sodium-sCO2 interaction experiments in the SNAKE facility.
Fiscal Year 2018 Sodium-CO2 Interaction Test
September 14, 2018
5 ANL-ART-153
The top-level goal of SNAKE is to gain a fundamental understanding of sodium-sCO2
interactions, with a focus on the specific scenarios of the failure of a compact diffusion-bonded
sodium-CO2 heat exchanger (DBHE).
The SNAKE experiment program was initiated in Fiscal Year 2010 and began with a study of
prototypic conditions during failure, identification of primary scaling parameters, and the
design basis for the test facility. Several previous reports described the facility scaling rationale
and design. Assembly of SNAKE began in Fiscal Year 2011 and was completed in July 2012.
The maximum sodium inventory in this facility is 33 lbs (15 kg; ~15.5 L/4.1 gal).
The first sodium-sCO2 interaction shakedown experiment was carried out at SNAKE in
September 2012 and a series of sodium-sCO2 interaction experiments were carried out in Fiscal
Year 2013. These tests successfully injected supercritical carbon dioxide into a pool of sodium
through a 64 µm diameter nozzle. A reaction between the CO2 and sodium was detected. The
chemical reaction was unexpected since the initial sodium temperature was 145 ˚C, a
temperature range in which previous studies detected little or no chemical reaction. The
important difference between the SNAKE experiments and previous research was that the
SNAKE geometry accurately reflects actual DBHE designs and was able to capture conditions
that promote high-interfacial area and mixing between the CO2 and sodium. These features
were likely important in promoting accelerated chemical reactions and will continue to be
studied as the SNAKE test matrix is carried out. Since the original test vessel and dump tank
configuration had a complex geometry that made cleaning of reaction products challenging,
simplified vessels were designed and procured in Fiscal Year 2014. The new SNAKE apparatus
design philosophy was simplicity and interchangeability. Progressively higher temperature
testing (330 °C) was carried out in Fiscal Year 2014 and confirmed that the sodium-sCO2
interaction consumed CO2, was exothermic and produced carbon monoxide. Even higher
temperature testing, up to 500 °C, was performed in Fiscal Year 2016 to capture the range of
prototypic temperatures which was expected to be a key parameter controlling the extent of the
sodium-sCO2 reaction. In Fiscal Year 2017, a single experiment was performed in which CO2
was injected into a mockup of a single semicircular sodium channel.
In Fiscal Year 2018, a single experiment was performed. Exp2018-16 was completed on
September 7th 2018. The sodium temperature was 411°C, the CO2 temperature was
approximately 400°C, and the initial CO2 injection pressure was 20 MPa. The CO2 was injected
through a 74 µm nozzle into an open pool of sodium approximately 0.85 m deep. The injection
lasted 20 minutes.
Data from Exp2018_16 is reported and initial interpretations are discussed in this report.

Fiscal Year 2018 Sodium-CO2 Interaction Test
September 14, 2018
6 ANL-ART-153
1 Introduction
The Department of Energy’s Office of Nuclear Energy (DOE/NE) Nuclear Technology
Research and Development (NTRD) program is focused on the development of clean, safe, and
affordable nuclear power. This program contains a spectrum of experiment facilities to support
R&D on advanced reactor concepts including the SNAKE (S-CO2 Na Kinetics Experiment)
apparatus at Argonne National Laboratory (Argonne).
The supercritical carbon dioxide (sCO2) Brayton cycle, coupled with a Sodium-Cooled Fast
Reactor (SFR), has been identified as a new and innovative energy conversion technology that
could contribute to meeting NTRD objectives especially in terms of improved economics and
safety. One appealing feature of the sCO2 Brayton energy conversion system is the smaller
footprint that the hardware requires relative to the traditional superheated steam cycle, which is
in part due to the small size of the turbomachinery as well as the use of compact diffusion-
bonded heat exchangers (DBHE) as the heat source heat exchanger (sodium-to-CO2) as well as
the recuperator and cooler modules.
DBHEs have a high degree of structural integrity; however, the potential for leaks to develop
between the sodium and CO2 coolant channels in the secondary heat exchanger cannot be ruled
out. This type of failure would lead to discharge of high pressure CO2 into the secondary
coolant circuit. Due to the robustness of the DBHE design, catastrophic failure leading to CO2
jet blowdown into the intermediate sodium loop is not deemed likely. Rather, small cracks (or
micro-leaks) may develop in which CO2 will bleed into the secondary system at a relatively low
rate and chemically react with the sodium.
In recognition of the anticipated failure mode for a DBHE sodium-to-CO2 heat exchanger, an
Argonne experiment program, SNAKE, was initiated in Fiscal Year 2010 (see Farmer et al.,
2010; Gerardi et al. 2011, 2012a, 2012b, 2013a&b, 2014, 2015a&b, 2016, and 2017a&b). The
purpose of the SNAKE program was to investigate the reaction characteristics between sodium
and CO2 under micro-leak conditions. Specifically, the objective of the SNAKE facility was to
determine the fundamental nature and extent of the chemical reactions that occur when high-
pressure CO2 was injected into liquid sodium from a micro-leak across a stainless steel pressure
boundary as a function of the sodium pool temperature and inlet CO2 flowrate. SNAKE was
also designed to examine the potential for the micro-leak to seal itself as a result of blockage
formation from the chemical reaction byproducts of the sodium-CO2 reaction, or as a result of
oxide layer buildup on the crack faces. An additional objective added in FY 2016 was to
develop and test an acoustic technique that could be used to detect gas (CO2 or other high
pressure gas) leaks into sodium.
An initial test matrix for fundamental sodium (Na)-carbon dioxide (CO2) interactions was
formulated to provide the data needed to understand sodium-CO2 interactions and their
consequences for SFRs incorporating supercritical CO2 Brayton cycle power converters with
compact diffusion-bonded sodium-to-CO2 heat exchangers (Gerardi et al., 2013). This report
provides an update on the single experiment performed in Fiscal Year 2018.

Fiscal Year 2018 Sodium-CO2 Interaction Test
September 14, 2018
7 ANL-ART-153
2 Experimental
The SNAKE test program follows the Argonne Quality Level C (QL-C) procedure (LMS-
PROC-125) for programmatic, training, documents and records, procurement, and design.
Each test is carried out according to a formal procedure that identifies the test objectives, and
step-by-step operator actions. At the conclusion of each test, it is classified according to the
following metrics:
Accepted data – test was performed fully within scope and defined procedures; all
critical instruments operated within specifications and returned data.
Scoping data – some aspects of the test fell outside of the intended scope or procedures
and/or some instruments did not operate within specifications or return data. Data could
still be available for specific uses.
Reject data – test was unsuccessful and outside of scope. Equipment, or instruments
did not work as intended and some or all data is suspect.
2.1 Current Test Matrix
The general test matrix for SNAKE described in Gerardi et al. (2013) included a near-term test
matrix to guide shakedown experiments. The Fiscal Year 2015 through 2017 experiments
yielded excellent data on the extent of the sodium – sCO2 reaction for prototypical conditions
for a SFR coupled with a sCO2 Brayton energy conversion cycle. These experiments were used
to update the near-term test matrix to obtain high-quality data for modeling purposes with the
smallest number of experiments.
A summary of the completed experiments and the target conditions of the next several
experiments are listed in Table 1. All of these tests would be direct injection of CO2 into a
static sodium pool. Several tests were performed and may continue to be performed using inert
N2 to study non-reactive jets for comparison with the reactive jet test data. Low pressure (sub-
critical) CO2 tests may also be carried out to add to the simulation verification database. Most
tests would last approximately 5-30 minutes.
The first experiment was completed in September 2012 and summarized in Gerardi et al.
(2012b). The next seven tests were carried out in Fiscal Year 2013-2015 and detailed in Gerardi
et al. (2013b, 2014, 2015b). Two series of inert gas jet tests in sodium were performed in Fiscal
Year 2016 along with one sCO2-sodium experiment (Gerardi et al., 2016).
A sCO2-sodium test using a DBHE mock-up channel, Exp2016_15, was completed in FY 2017.
Note that the original SNAKE test matrix included experiments investigating the interaction of
carbon monoxide with sodium. Those tests are no longer planned due to the extreme
complexity of handling carbon monoxide. Some planning for these tests was completed in FY
2017 with the realization that substantial funding and resources would need to be dedicated to
support the safety infrastructure and monitoring programs required to inject carbon monoxide
into sodium.

Fiscal Year 2018 Sodium-CO2 Interaction Test
September 14, 2018
8 ANL-ART-153
Table 1. Updated SNAKE test matrix – first 15 experiments in green were completed in 2013-2017. Experiment 16 is the primary
topic of this report

Fiscal Year 2018 Sodium-CO2 Interaction Test
September 14, 2018
9 ANL-ART-153
3 Exp2018_16 sCO2 Sodium Test
The objective of Exp2018_16 was to study the interaction of a sCO2 leak into an open pool of
sodium at an intermediate sodium temperature of about 420 ºC to determine if self-plugging
occurs at this temperature. Upon completion of the test and review of the data, the experiment
objectives were met.
3.1 Exp2018_16 Test Summary
This test injected supercritical CO2 into an open pool of sodium for 20 min. This experiment
simulated conditions prototypical of a SFR coupled with a sCO2 Brayton energy conversion
cycle with a leak inside the interior of the heat exchanger away from the ends. Exp2018_16
was designated as a “accept data” level test. The initial sCO2 injection pressure and temperature
were 20 MPa and 383.4 °C, respectively. The initial sodium temperature and height above the
nozzle were 410.9 °C and 85.3 cm, respectively. The sCO2 was injected through a well-
characterized nozzle, which had a diameter of 74.0 µm ± 2 µm. The total CO2 mass injected
was approximately 58.0 g. The bulk sodium temperature rose approximately 21.0±2 ˚C during
the test indicating an exothermic reaction.
A significant amount of data was generated during this test including fiber optic distributed
temperature data, flow meter, pressure, and thermocouple measurements, etc.
Highlights of Exp2018_16 include:
Initial sodium level was 85.3 cm above the injection point for a total sodium loading of
5.98 kg.
The injection nozzle was 74 micron in diameter.
Initial sodium temperature was 410.9 °C. The initial CO2 reservoir tank pressure was
~20 MPa.
Both CO2 and CO were detected at the exhaust outlet but significant gas consumption
did occur with solid reaction product production.
The sodium temperature went up to approximately 432.8 °C. Periodically, higher
temperature values were recorded, above 500 °C.
This test was another example of sCO2 injection into sodium that did not plug the injection
nozzle and an exothermic reaction was sustained that produced solid reaction products and
some CO.
3.2 New Fiber Installation and Position
A new method of installing and capturing the DTS fiber sensor was attempted in this test versus
previous SNAKE experiments. Previous installations revolved around one sensor installed from
the top of the vessel hanging loosely to the near bottom. This fiber was used during sodium fill
and was assumed to be forced to the outside wall during injection. This would limit its ability
to accurately record the experiment as the temperatures of the inner wall and heaters would

Fiscal Year 2018 Sodium-CO2 Interaction Test
September 14, 2018
10 ANL-ART-153
become the dominant temperature reading. A second DTS fiber would then be installed through
the bottom hub. Complicated geometry and multiple layers of insulation often prevented a
reliable signal from being obtained and many fibers were broken. The new method involved
two fibers being installed from the top of the test vessel and inserted through guide tubes welded
to the side of the injection nozzle. This method should capture the fiber in the reaction stream
without adding strain and protecting it from breakage, as shown in Figure 1.
Figure 1. Mock-up showing new DTS fiber installation.
3.2.1 Design
The design of the injector assembly strove to maintain most of the design features and
dimensions of previous SNAKE injectors. The injector needed to fit inside of a standard
SNAKE test vessel and interface externally with existing sodium fill and drain lines, and the
sCO2 injection line, as shown in Figure 2.

Fiscal Year 2018 Sodium-CO2 Interaction Test
September 14, 2018
11 ANL-ART-153
(a) (b)
Figure 2. Drawing of Exp2018_16 test vessel and injection assembly. (a) full drawing and
(b) section drawing of injector.
3.2.2 Fabricated Injector Hub
The fabricated injector hub is shown in Figure 3.

Fiscal Year 2018 Sodium-CO2 Interaction Test
September 14, 2018
12 ANL-ART-153
Figure 3. Picture of as-fabricated injector hub for Exp208_16.
3.3 Experiment details
The test vessel used was made by Argonne Central Shops to ASME Process Piping B31.3
specifications with 100 % radiography of welds and hydro tested to 450 psig (3.1 MPa)
maximum at 1000 ºF (538 ºC) and manufactured in 2015 with a serial #CS2014_03.

Fiscal Year 2018 Sodium-CO2 Interaction Test
September 14, 2018
13 ANL-ART-153
A picture of the SNAKE setup for Exp2018_16 is shown in Figure 4 after insulation installation.
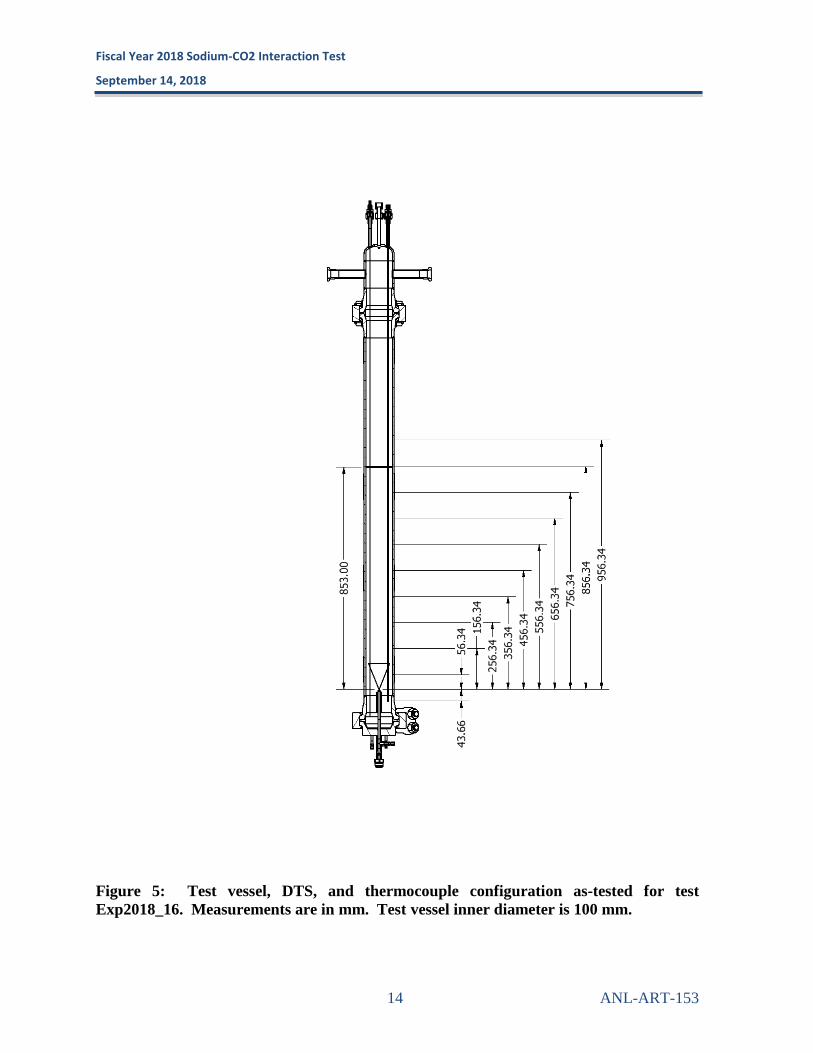
A drawing of the as-tested test vessel and instruments is shown in Figure 5 and an updated
piping and instrumentation diagram (P&ID) for Exp2018_16 in Figure 6.
Figure 4. Test vessel and SNAKE equipment for test Exp2018_16.
Fiscal Year 2018 Sodium-CO2 Interaction Test
September 14, 2018
14 ANL-ART-153
Figure 5: Test vessel, DTS, and thermocouple configuration as-tested for test
Exp2018_16. Measurements are in mm. Test vessel inner diameter is 100 mm.

Fiscal Year 2018 Sodium-CO2 Interaction Test
September 14, 2018
15 ANL-ART-153
Figure 6. Process and Instrumentation Diagram for SNAKE sCO2-sodium experiments.
The certified concentrations of the gases used in this experiment are documented in Table 2.
Research Grade CO2 was used for the nozzle injection with purities greater than 99.999%.
Built-in-purifier (BIP® Air Products) argon was used for both the cover gas and pre-experiment
nozzle injection.
The sodium fill tank was provided by Creative Engineers, Inc. This tank was filled with 15 kg
of filtered (15 micron) R grade sodium with certifications (Figure 7).
Table 2. Certified concentrations of gases used for sodium sCO2 interaction experiment,
Exp2018_16

Fiscal Year 2018 Sodium-CO2 Interaction Test
September 14, 2018
16 ANL-ART-153
Gas Injected Specified Impurity levels
Oxygen Water Hydrocarbons Nitrogen Ar+O2+CO
CO2 injected:
Research Grade
n/a < 3 ppm < 1 ppm < 5 ppm < 1 ppm
Ar injected:
Built-in-
Purifier
< 10 ppb < 20 ppb < 100 ppb < 5 ppm n/a
Ar cover gas:
Built-in-
Purifier
< 10 ppb < 20 ppb < 100 ppb < 5 ppm n/a
Figure 7. Sodium certification for Exp2018_16.
Instruments used during sCO2 injection into sodium
3.3.1 Distributed temperature sensing
The optical fiber sensing system (Gerardi et al., 2017) used for this study was an ODiSI (Optical
Distributed Sensor Interrogator) Model B from Luna Innovations, Inc. (Roanoke, VA),
configured to handle sensors up to 20 m in length with a 5.1 mm spatial resolution at data rates
up to 50 Hz and a temperature span of -268 to 900 ˚C, though the sensor itself is likely to be
restricted to a maximum temperature of approximately 600 ˚C due to the transformation from
α-quartz to β-quartz. Vibration from jet noise and other experiment conditions may reduce the
accuracy or data rate capabilities of this system.

Fiscal Year 2018 Sodium-CO2 Interaction Test
September 14, 2018
17 ANL-ART-153
The DTSs were also manufactured and assembled by Luna Innovations. Fiber optic cables
were stripped of all coatings using a sulfuric acid bath to obtain bare glass fibers with 125 µm
diameter. A cobalt high-temperature end termination was installed to enable sensing. Without
a coating, the bare fibers are extremely fragile so they were installed into Ø 360 µm OD, Ø 160
µm OD silica capillaries and sealed.
At Argonne, the silica capillaries with internal DTS were placed into Ø 1.59 mm OD, Ø 0.056
mm ID stainless steel tubing as shown in Figure 8.
One DTS was used in Exp2018_16. It was used as a level sensor and temperature rake and
extended from the vessel head downward to the bottom of the test vessel.
Figure 8. DTS entering stainless capillary which extends downward into SNAKE test
vessel.
3.3.2 Additional instruments
A single thermocouple (Type-K) was installed in the bottom hub assembly and placed 67 mm
above the injection nozzle.
Pressure measurements of the sCO2 were made in the gas reservoir and at a location just prior
to injection using a Rosemount absolute pressure transmitter with range of 0-275 bar and
accuracy of ±0.1 %. The same pressure transmitter type was also used to measure pressure in
the test vessel at the location of cover gas introduction into the vessel.

Fiscal Year 2018 Sodium-CO2 Interaction Test
September 14, 2018
18 ANL-ART-153
Supercritical CO2 flow measurements were made by two Brooks Coriolis mass flow meters, a
QMBM3 and a QMBM4. Measurement ranges and uncertainties of these flow meters are
presented in Figure 9. Cover gas and exhaust flow measurements are made by Teledyne HFM-
D-300 gas flow meters. A complete overview of the instruments used, their measurement
ranges, and uncertainties are listed in Table 3.
Figure 9. Comparison of measurement range and uncertainty of the two CO2 Coriolis flow
meters that are installed in series on the injection line of SNAKE.

Fiscal Year 2018 Sodium-CO2 Interaction Test
September 14, 2018
19 ANL-ART-153
Table 3. Major instrumentation details and uncertainty
Measured property Location Instrument Measurement
range Accuracy
CO2 injection
flowrate
CO2
injection line Coriolis mass flow meter QMBM3
0.06-0.63 kg/hr.
±0.5 %
CO2 injection
flowrate
CO2
injection line Coriolis flow meter QMBM4 1-10 kg/hr. ±0.5 %
CO2 injection
pressure
CO2
injection line Absolute pressure transmitter 0-275 bar ±0.1 %
CO2 reservoir
pressure
CO2
reservoir Absolute pressure transmitter 0-275 bar ±0.1 %
CO2 injection
temperature
In-fluid at
nozzle Type-K emersion thermocouple
-200 ˚C to 1250
˚C ±0.75 %
Ar cover gas flowrate Ar cover gas
line Gas mass flow controller 0-25 SLM/Argon ±1 %
Ar low-pressure
nozzle flowrate
Ar injection
line Gas mass flow controller 0-2 SLM/Argon ±1 %
Test vessel pressure Top of test
vessel Absolute pressure transmitter 0-275 bar ±0.1 %
Test vessel Na level –
non-intrusive
Exterior of test vessel
Gamma level meter 0-1.0 m ±0.05 m
Test vessel Na level -
intrusive
Thermowell in test vessel
Distributed Temperature Sensor 0-1.5 m ±0.025 m
Test vessel Na
temperature
Thermowell
in test vessel x12 Type-K emersion thermocouple
-200 ˚C to 1250
˚C ±0.75 %
Exhaust flowrate Gas exhaust
line Teledyne gas mass flow meter 0-30 SLM/Argon ±1 %
Exhaust gas
composition
Gas exhaust
line Mass spectrometer > 5x10-11 torr ±5 %
3.4 Test Procedures
3.4.1 Pre-test operations
Assembly of the SNAKE apparatus began with installation of the test vessel into the SNAKE
enclosure. The test vessel consisted of a pipe section with two Grayloc butt-weld flanges. A

Fiscal Year 2018 Sodium-CO2 Interaction Test
September 14, 2018
20 ANL-ART-153
test vessel head was installed on the top flange. The test vessel head was connected to an
exhaust system, a cover gas system, and the thermocouple rake and DTS thermowell were
installed. The bottom test vessel hub was then installed on the bottom of the test vessel. This
bottom hub consisted of the high-pressure injection nozzle, one thermocouple measuring
sodium temperature, and the bottom DTS guide tube. The bottom hub was connected to the
sodium fill line, the high-pressure gas injection line, and the emergency dump line which
connected to the dump tank.
Once the facility was fully assembled, pneumatic pressure testing was carried out on each
subsystem to verify that the system was leak tight. This was an iterative process. Impurity
removal consists of baking out the system under vacuum as high as feasible, at least 150 °C.
Any fittings that may have come loose during thermal cycling were retightened. Once at room
temperature, the apparatus was evacuated and back-filled with argon at least three times in order
to achieve an inert argon atmosphere.
Sodium filling was carried out by heating the full system to 300 °C with an inert cover gas flow
over the test vessel. A slight argon purge (10-200 psi) was maintained through the nozzle to
prevent backflow of sodium. Sodium from a dedicated fill tank was introduced through the
bottom of the test vessel and the level meters were monitored (gamma absorption meter, DTS
level meter, and continuity meter) to achieve the desired sodium level. The DTS level meter
data during the fill operation is shown in Figure 10. Filling began at approximately 0.14 hr and
was complete at 0.18 hr at a sodium level of 85.3 cm above the injection nozzle. The sodium
in the test vessel was then heated to approximately 400 °C and held there overnight
(approximately 18 hours).

Fiscal Year 2018 Sodium-CO2 Interaction Test
September 14, 2018
21 ANL-ART-153
Figure 10. Distributed temperature sensor fill data showing sodium fill rate and initial
sodium level.
3.4.2 Test operations
Prior to initiating the high-pressure gas injection, a fixed argon gas flow rate was established
through the cover gas flow system to approximately 5-15 slpm. The high-pressure gas reservoir
was pressurized to the target injection pressure.
The instruments including the acoustics, DTS, mass spectrometer, and DAS were activated
prior to injection to get baseline or background data readings according to the individual
instrument requirements.
The high-pressure gas line valve was then opened to initiate injection into the sodium vessel
while the gas booster pump was operated in order to re-pressurize the system to the desired
pressure. The line between this valve and the nozzle then quickly reached the desired injection
pressure. The gas booster operation was then discontinued to allow the pressure to slowly drop
as equilibrium in the injection line was reached and gas flowed into the test vessel. The
instruments were monitored during the injection transient and when steady state values were
reached.

Fiscal Year 2018 Sodium-CO2 Interaction Test
September 14, 2018
22 ANL-ART-153
3.4.3 Post-test operations
Following the experiment, the facility was cooled to room temperature with the sodium frozen
in place in the test vessel.
3.5 Experiment Results of Exp2018_16
The experiment results section is broken down into several subsections. First, a description of
the main thermal hydraulic measurements recorded during the test is presented and then a
detailed analysis of several important measurements and observations are discussed.
3.5.1 Test overview
The initiation of sCO2 injection began at time zero and stopped at time 0.34 hr (1230 s).
Approximately 10 min (600 s) worth of data prior to sCO2 injection is shown in most plots in
order to clarify initial conditions and data is plotted until 1.0 hr after venting in order to show
the thermal behavior after the experiment.
The measured flowrates of the sCO2, argon cover gas inlet, and exhaust outlet are shown in
Figure 11. Argon cover gas regulator pressure was fixed at 172 kPa and the inlet flowrate was
controlled by using the cover gas mass flow controller to obtain a constant initial flow rate of 5
lpm.
The sCO2 nozzle pressure and flowrate are shown in Figure 12. The gas booster was active for
the first 3 min (240 s) in order to increase the sCO2 pressure up to the desired starting pressure.
The pressure goal of 20 MPa was not achieved due to an unexpected malfunction in the booster
pressure regulator. Instead, a pressure of 15.1 MPa was achieved. The gas booster was then
turned off. The sCO2 upstream pressure slowly decreased for the remainder of the experiment
as it vented into the sodium test vessel. The flowrates prior to 3 min may not reflect actual
injection rates into the sodium vessel due to flow instabilities created by the boosting process.
In total, approximately 58.0 g of CO2 was injected.

Fiscal Year 2018 Sodium-CO2 Interaction Test
September 14, 2018
23 ANL-ART-153
Figure 11. Flowrates and pressure of sCO2.
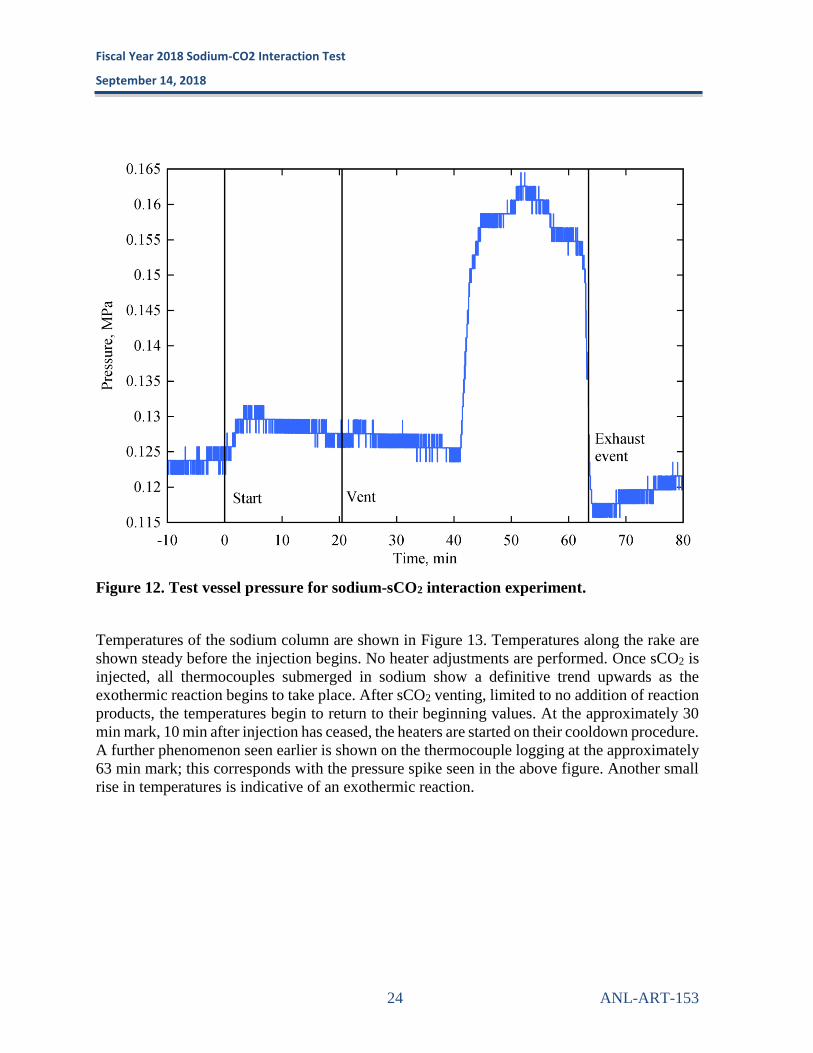
The test vessel pressure, shown in Figure 12 remains between 0.115 MPa and 0.165 MPa
through the test. A backpressure regulator was used to maintain a set backpressure on the test
vessel. There was a small relationship between exhaust flow rate and backpressure, however.
The spikes observed in the vessel pressure during the sCO2 from injection through 20 min are
small but likely real due to the sensitivity of the pressure transmitter. The large spike in pressure
is due to a currently undefined phenomenon. A couple of possibilities exist, a foam block of
reaction products trapped a pocket of unreacted gas or perhaps the nozzle partially blocked
resulting in a delayed burst of gas when it broke free. During this entire graphed period the
sodium was well above the melting temperature; therefore the only solids obstructing flow
would be reaction products in some form.
Fiscal Year 2018 Sodium-CO2 Interaction Test
September 14, 2018
24 ANL-ART-153
Figure 12. Test vessel pressure for sodium-sCO2 interaction experiment.
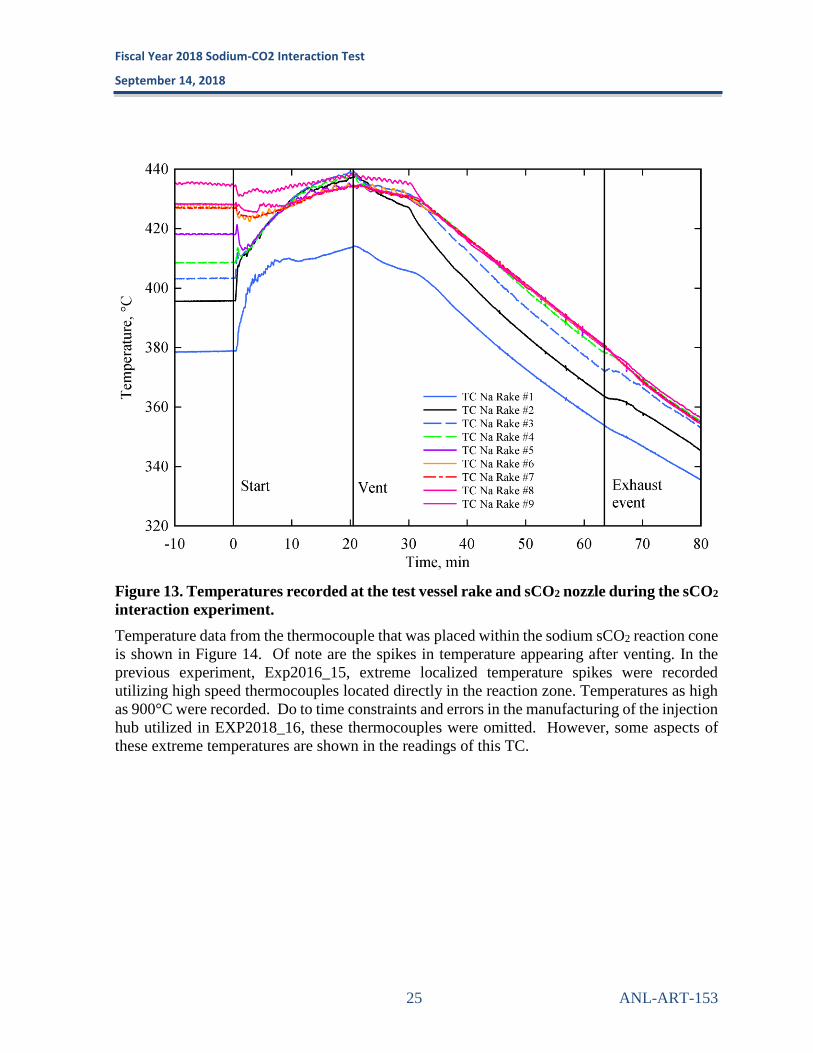
Temperatures of the sodium column are shown in Figure 13. Temperatures along the rake are
shown steady before the injection begins. No heater adjustments are performed. Once sCO2 is
injected, all thermocouples submerged in sodium show a definitive trend upwards as the
exothermic reaction begins to take place. After sCO2 venting, limited to no addition of reaction
products, the temperatures begin to return to their beginning values. At the approximately 30
min mark, 10 min after injection has ceased, the heaters are started on their cooldown procedure.
A further phenomenon seen earlier is shown on the thermocouple logging at the approximately
63 min mark; this corresponds with the pressure spike seen in the above figure. Another small
rise in temperatures is indicative of an exothermic reaction.
Fiscal Year 2018 Sodium-CO2 Interaction Test
September 14, 2018
25 ANL-ART-153
Figure 13. Temperatures recorded at the test vessel rake and sCO2 nozzle during the sCO2
interaction experiment.
Temperature data from the thermocouple that was placed within the sodium sCO2 reaction cone
is shown in Figure 14. Of note are the spikes in temperature appearing after venting. In the
previous experiment, Exp2016_15, extreme localized temperature spikes were recorded
utilizing high speed thermocouples located directly in the reaction zone. Temperatures as high
as 900°C were recorded. Do to time constraints and errors in the manufacturing of the injection
hub utilized in EXP2018_16, these thermocouples were omitted. However, some aspects of
these extreme temperatures are shown in the readings of this TC.

Fiscal Year 2018 Sodium-CO2 Interaction Test
September 14, 2018
26 ANL-ART-153
Figure 14. Thermocouple data for thermocouples placed within reaction cone.
3.5.2 Discussion and Summary
A simulated leak of sCO2 into a sodium pool was performed using the SNAKE experiment
apparatus. sCO2 was injected into an open pool 85.3 cm deep through a Ø74 µm hole. A
sustained chemical reaction between the injected CO2 and sodium was observed. Indications
of the chemical reaction included exothermic heat up, production of carbon monoxide, and
consumption of CO2.
This experiment did not result in complete blockage of the nozzle. This contrasts with two
SNAKE tests performed at temperatures above 370 °C at about 500 ºC that quickly plugged the
injection nozzle due to rapid production of solid reaction products. Previous studies (e.g.,
Gicquel et al., 2010) found that the reaction rate of sodium and sCO2 increases dramatically
with temperature. These studies also mention the possibility of a threshold temperature in the
range of 450 °C – 500 °C where the reaction rate was nearly instantaneous. This could be
because this experiment is below the lower threshold for this to occur. Other possibilities could
be a reduced initial injection gas temperature due to the CO2 preheater not functioning.

Fiscal Year 2018 Sodium-CO2 Interaction Test
September 14, 2018
27 ANL-ART-153
4 Summary
An experiment campaign was continued in Fiscal Year 2018 in the Argonne SNAKE facility
that investigated the interaction between supercritical carbon dioxide (sCO2) and sodium
through injection of sCO2 into an open surface sodium pool. Two of fifteen previous SNAKE
tests revealed that self-plugging of the leakage path/nozzle occurs at higher initial sodium
temperatures of about 500 ºC due to chemical reactions involving CO2, sodium, and sodium-
CO2 reaction products. At lower sodium temperatures, the interaction phenomena involve
consumption of injected CO2 and formation of an agglomerated mass of reaction products
without self-plugging. The FY 2018 test investigated interactions at an intermediate initial
sodium temperature of about 411 ºC, representative of the interior of a sodium-to-CO2 heat
exchanger in a Sodium-Cooled Fast Reactor (SFR) sCO2 Brayton Cycle energy conversion
system. The experiment was successfully conducted and did not show self-plugging as
evidenced by a sustained chemical reaction between the injected CO2 and sodium and
consumption of CO2.
Acknowledgements
Argonne National Laboratory’s work was supported by the U. S. Department of Energy
Advanced Reactor Technologies (ART) Program under Prime Contract No. DE-AC02-
06CH11357 between the U.S. Department of Energy and UChicago Argonne, LLC.
The authors are grateful to Gary Rochau (SNL), the Technical Area Lead, Bob Hill
(ANL/NSE), the National Technical Director, as well as Brian Robinson (DOE/NE), the
Headquarters Program Manager. Also, they are extremely grateful for the design and assembly
support of Mitch Farmer, Robert Aeschlimann, and Dennis Kilsdonk at Argonne National
Laboratory.

Fiscal Year 2018 Sodium-CO2 Interaction Test
September 14, 2018
28 ANL-ART-153
References
1. M.T. Farmer, D.J. Kilsdonk, J.J. Sienicki, and C. Grandy, “Design of a Test Facility to
Investigate Fundamental Na-CO2 Interactions in Compact Heat Exchangers,” ANL-
GENIV-164, (2010).
2. C. Gerardi, M.T. Farmer, D.J. Kilsdonk, J.J. Sienicki, and C. Grandy, “Fundamental
Na-CO2 Interactions in Compact Heat Exchangers Experiment (SNAKE): Fiscal Year
2011 Status Update,” ANL-ARC-199, (2011).
3. C. Gerardi, M.T. Farmer, D.J. Kilsdonk, J.J. Sienicki, and C. Grandy, “Na-CO2
Interactions Experiment (SNAKE): Fiscal Year 2012 Update on Facility Assembly and
Sodium Loading,” ANL-ARC-230, (2012a).
4. C. Gerardi, M.T. Farmer, D.J. Kilsdonk, R. Aeschlimann, J.J. Sienicki, and C. Grandy,
“Report on the Initial Fundamental Sodium-CO2 Interaction Experiment,” ANL-ARC-
251, (2012b).
5. C. Gerardi, J.J. Sienicki, A. Moisseytsev, M.T. Farmer, and C. Grandy, “Test Matrix
for the Fundamental Sodium-CO2 Interaction Experiment (SNAKE),” ANL-SMR-2,
(2013a).
6. C. Gerardi, Bremer N., Aeschlimann R., Sienicki J.J., and Grandy C., “Description of
the First Observed Sodium-CO2 Reactions in the Sodium-CO2 Interaction Experiment
(SNAKE),” ANL-SMR-7, September (2013b).
7. C. Gerardi, N. Bremer, S. Lomperski, J.J. Sienicki, and C. Grandy, “FY 2014 Sodium-
Supercritical CO2 Interactions in the SNAKE Experiment Facility,” ANL-SMR-18,
Argonne National Laboratory, September (2014).
8. C. Gerardi, N. Bremer, S. Lomperski, J.J. Sienicki, and C. Grandy, “Chemical
Interaction Experiments between Supercritical Carbon Dioxide and Liquid Sodium,”
Proceedings of ICAPP 2015, 15334, May 03-06, Nice, France (2015a).
9. C. Gerardi, N. Bremer, D. Lisowski, T. Wachs, S. Lomperski, J.J. Sienicki, and C.
Grandy, Argonne National Laboratory, Unpublished Information, September (2015b).
10. C. Gerardi, N. Bremer, D. Lisowski, T. Wachs, J.J. Sienicki, and C. Grandy, “Fiscal
Year 2016 Sodium-Supercritical CO2 Interactions in the SNAKE Experiment Facility,”
ANL-ART-72, Argonne National Laboratory, September (2016).
11. C. Gerardi, N. Bremer, J. J. Sienicki, and C. Grandy, “Fiscal Year 2017 Sodium-CO2
Interaction Tests,” ANL-ART-100, Argonne National Laboratory, September
(2017a).MM9QLWCQEESE7
12. C. Gerardi, N. Bremer, D. Lisowski, and S. Lomperski, “Distributed Temperature
Sensor Testing in Liquid Sodium,” J. Nuclear Engineering and Design, 312, pp 59-65,
(2017b).
13. L. Gicquel, C. Latgé, and N. Simon, “Supercritical CO2 Brayton Cycle Coupled with a
Sodium Fast Reactor: Na/CO2 Interaction Experiments and Modeling,” Paper 10215,
2010 International Congress on Advances in Nuclear Power Plants (ICAPP ’10), San
Diego, CA, USA, June 13-17, (2010).
Nuclear Engineering Division
Argonne National Laboratory
9700 South Cass Avenue
Argonne, IL 60439
www.anl.gov
Argonne National Laboratory is a U.S. Department of Energy
laboratory managed by UChicago Argonne, LLC