Embed Size (px)
Citation preview

Fiscal Equalization and the Local Tax Structure
Federic Holm-Hadulla
(European Central Bank and Ifo Institute for Economic Research)1
Preliminary Version, March 1, 2009
Abstract: This paper studies the effect of redistributive “fiscal equalization” transfers on
recipient governments’ choices between distortive and non-distortive taxation. We develop a
majority voting model in which an elected local government may levy separate tax rates on
mobile capital and a fixed factor, land. Fiscal equalization grants are inversely related to the
tax base so that adverse tax base effects from increased tax effort are partly compensated.
Hence, a higher degree of fiscal equalization lowers the marginal cost of funds related to
capital taxation while the marginal cost of funds from the lump-sum tax on land is unaffected.
As a consequence the mix between land and capital taxation is distorted towards the latter.
This prediction is tested against data from German municipalities. In order to identify the
incentive effect the analysis exploits a quasi-experiment resulting from a Supreme Court
ruling for the largest German state. The empirical results support the hypothesis that a
higher degree of fiscal equalization raises capital relative to land taxation.
Keywords: Fiscal Equalization; Tax Competition; Tax Structure; Quasi-Experiment
I am indebted to Thiess Buttner for useful guidance while conducting this research. David Wildasinand Georg Wamser provided helpful comments on an earlier version of the paper. The author issolely responsible for all errors. The views expressed in this paper do not necessarily reflect thoseof the author’s employer.
1Address: European Central BankKaiserstr. 29D-60311 Frankfurt am MainGermany
Phone:E-mail:
+49 69 1344 [email protected]

preliminary version
1 Introduction
Incentive effects of inter-governmental transfers on local tax policy have been studied ex-
tensively in recent literature. In particular, it has been argued both theoretically (Dahlby,
2002) and empirically (Buttner, 2006 and Egger et al., 2007) that if grants are inversely
related to the tax base, revenue sharing may induce recipient governments to raise distortive
taxation. While these studies rely on the assumption that local governments are restricted
to a source-based tax on a mobile factor, in many federal countries subnational governments
may use several tax instruments.2 However, if the incentive effects of transfers differ across
these instruments revenue sharing might not only change the overall tax effort but also the
tax structure in the economy. Hence, accounting for the choice between different revenue
sources may strongly enhance our understanding of tax incentives faced by sub-national
governments. This paper analyzes the impact of a particular transfer scheme, referred to
as fiscal equalization, on local governments’ choices between capital and land taxation. We
find that an increase in the marginal contribution rate, i.e. the rate at which a decrease in
the tax base afflicts in higher grants, raises capital relative to land tax effort.
While our analysis applies to a broad set of problems relating the composition of local revenue
to inter-governmental transfers we choose to narrow our focus to this specific setup for three
reasons. First, fiscal equalization is a widely used form of revenue sharing with similar insti-
tutional characteristics across countries.3 Hence, studying this particular transfer scheme is
of immediate interest for public policy. Second, comparing capital and land taxation allows
us to expose the theoretical argument most clearly: fiscal equalization changes tax incentives
because it lowers the marginal excess burden of taxation perceived by governments. Thus,
the higher the excess burden of a particular tax instrument, the stronger is the incentive
effect. Changes in the tax structure then occur if the marginal excess burden differs between
2For information on selected countries see CESifo DICE report, Spring 2008 Vol. 6 No. 1. and Bird,2002.
3For an overview see Boadway, 2004.
1

preliminary version
taxes. Of course, differences are most pronounced when the tax instrument set consists of a
tax on a freely mobile factor and a tax on a fixed factor, as assumed in the present analysis.
A third reason for choosing this setup is that it allows us to learn from an interesting case
study: municipal finance in Germany, at first sight, seems to expose a puzzling gap between
theoretical predictions concerning tax policy and actual behavior by governments. The Ger-
man constitution entitles municipal governments to use a local business tax (Gewerbesteuer)
and a tax on land (Grundsteuer). While the former displays a strong tax elasticity (see
Buttner, 2003) the latter should be rather inelastic since the tax base is essentially a con-
stant fraction of the total land area of a municipality. Theory suggests it to be optimal
from a local perspective to finance public consumption with non-distortive taxes and to only
tax mobile factors so as to internalize potential crowding externalities (see Wildasin, 1986).
However, in Germany the lion’s share of municipal tax revenue is generated through the
local business tax whereas local land tax revenues play a lesser role for municipal budgets.
For example, in North-Rhine Westphalia, Germany’s most populous state, revenue from the
local business tax was on average 3.1 times higher than revenue from the local land tax in
2005.4 Leaving aside the interpretation that this composition of municipal revenue simply
reflects an extremely high level of crowding effects, it clearly seems to contradict theoretical
predictions. We argue that it is a consequence of an exceptionally high marginal contribu-
tion rate leading to a redistribution of more than 85 cents of an additional Euro of own tax
revenue by the fiscal equalization scheme.5
The analysis proceeds in two steps. Section 2 combines the traditional tax competition
framework (e.g. Wilson, 1986; Zodrow and Mieszkowski, 1986) with a political economy
model by Persson and Tabellini (2000) to study tax structure. Elected local governments
may use a distortive tax on perfectly mobile capital and a non-distortive tax on land to
finance a local public good. The burden of capital taxation is borne by labor since the
4Source: own calculations and Statistical Office of North Rhine-Westphalia. For further informationconcerning the composition of municipal funds see table 1 in subsection 3.1.
5Source: own calculations. See table 2 in subsection 3.1.
2

preliminary version
adverse tax base effect depresses wages. By contrast, land taxation simply lowers the net-
return to land. Households differ with respect to labor and land endowments.6 Thus, the loss
of private consumption associated with an increase in the respective tax rate differs across
households, as well. In optimum, governments choose a tax structure that distributes the tax
burden so as to maximize the decisive voter’s utility. Moreover, the optimal tax structure
equates the marginal cost of funds from the two tax instruments. As is well-established in
the literature (Wildasin, 1989; Smart, 1998; Buttner, 2006) fiscal equalization may lower the
marginal cost of funds from capital taxation thus raising capital relative to land tax effort.
Section 3 tests this prediction using a panel dataset of North-Rhine Westphalian munic-
ipalities over a period of 18 years. In order to identify the incentive effect we exploit a
quasi-experiment resulting from a Supreme Court ruling for the state of North-Rhine West-
phalia. Due to a special provision in the North-Rhine Westphalian fiscal constitution, until
the mid-1990’s, municipalities with a population of 150,000 or below faced a lower marginal
contribution rate than municipalities with a population above 150,000. In 1993 the State
Constitutional Court ruled that this provision be abolished, unless an independent panel of
experts finds it to be justified for “economic reasons”.7 The expert report was published in
1995 concluding that both groups should face the marginal contribution rate hitherto applied
to the group of large municipalities.8 Hence, only small municipalities were affected by the
subsequent adjustment allowing us to split the sample into treatment and control group.
The empirical results support the hypothesis that an increase in the marginal contribution
rate raises capital relative to land taxation. Section 4 concludes.
6For a similar setup see Fuest and Huber, 2001 and Borck, 2003.7Verfassungsgerichtshof fur das Land Nordrhein-Westfalen, 1993, Urteil vom 6. Juli – VerfGH 9/92,
22/92.8See Parsche et al.
3

preliminary version
2 Theoretical Analysis
Consider an economy with an exogenously given number of regions, i = 1, 2, ..., N . The
budget constraint of a local government is given by
zi = τ ki ki + τ b
i bi + gi (1)
where zi denotes local public spending per capita, ki is the capital stock per capita, and
bi is the per capita land endowment in jurisdiction i; τ ki and τ b
i denote local tax rates on
capital and land, respectively. Consistent with institutional practice, regions receive fiscal
equalization transfers, gi, which negatively depend on local fiscal capacity. To be specific,
we work with a stylized account of a typical fiscal equalization scheme in which transfers are
determined according to
gi = yi − ϑki ki − ϑb
ibi (2)
where yi defines the level of transfers that a jurisdiction would receive if its tax base where
zero; ϑki and ϑb
i may be referred to as the marginal contribution rate, i.e. the rate at which
an increase in the capital and land tax base leads to lower grants.9
In each jurisdiction firms produce a homogenous private good combining land, labor, and
capital according to a constant returns to scale technology. Production per unit of labor
is given by xi = fi(ki, bi). The production function is twice continuously differentiable and
strictly concave in both its arguments, i.e. fik > 0 > fikk and fib > 0 > fibb. Capital is
paid its marginal product, the rate of return on land is exogenously fixed by its opportunity
cost (ρ),10 and labor receives residual output after the other factors have been remunerated.
9Nomenclature and notation are borrowed from Buttner (2006) as well as Baretti, Huber and Lichtblau(2002).
10We implicitly assume that there is an alternative use to land such as agricultural production and thattransformation of land between industrial and agricultural use is costless.
4

preliminary version
Capital is perfectly mobile so that net rates of return are equated across regions at a common
rate, r. Equilibrium in the capital market thus requires that r = fik − τ ki , which implies a
negative tax base elasticity.
In order to simplify notation we assume absentee capital ownership. Labor and land em-
ployed by firms in jurisdiction i are owned by residents where (1− eji ) and (1 + ej
i )bi specify
household j’s respective endowments.11 Initial endowments are exogenously given and differ
across households. We characterize the distribution of eji by mean zero and median em
i .
Households fully spend their disposable income, i.e. the sum of wage income and land in-
come net of land taxes, on a consumption good xi. We may thus write household j’s budget
constraint as
xji = (1− ej
i )[fi(ki, bi)− (r + τ ki )ki − ρbi] + (1 + ej
i )bi(ρ− τ bi ). (3)
Households derive utility from private and public consumption according to a quasi-linear
utility function uji = vi(zi) + xj
i . Aggregation of preferences takes place via simple majority
voting. These two assumptions ensure that a unique median voter equilibrium for fiscal policy
exists although the decision problem has two dimensions, i.e. the level and the composition
of public funds.12 Solving the local government’s budget constraint for τ gi and substituting
into the private budget constraint we obtain the decision problem of a representative local
government
umi = vi (zi) + (1− em
i )[fi(ki, bi)− (r + τ ki )ki − ρbi]
+ (1 + emi )
[bi(ρ− ϑb
i)− (zi − yi − (τ ki − ϑk
i )ki)]. (4)
11This specification closely follows the setup by Persson and Tabellini (2000), p. 318. While a perfectlynegative correlation of different endowments bears little empirical appeal, it serves to expose the impact ofdistributional concerns on the choice of tax structure most clearly. Allowing for independent distributions oflabor and land endowments would not alter the analysis fundamentally but require additional assumptionsconcerning exogenous parameters.
12The combination of quasi-linear preferences and unidimensional heterogeneity of endowments is a suf-ficient condition for the existence of a Condorcet winner. For a proof see Persson and Tabellini (2000), p.27.
5

preliminary version
Optimization with respect to public consumption and capital taxation yields the following
first-order conditions:
viz = 1 + emi (5)
1 + emi =
(1− emi )ki
ki + (τ ki − ϑk
i )dki
dτki
. (6)
According to equation (5), in optimum, the marginal benefit of an increase in public con-
sumption equals the marginal cost of a corresponding decrease in private consumption from
the median voter’s perspective. Furthermore, as indicated by equation 6, optimum requires
the marginal cost of funds to be equated across tax instruments.
Based on these first-order conditions we may study comparative static effects of changes in
exogenous parameters on the optimal choice of tax structure. First, consider the composition
of endowments: an increase in emi raises the left-hand side (LHS ) and lowers the right-hand
side (RHS ) of equation (6). Intuitively, an increase in emi at given tax rates implies a larger
capital tax burden and a lower land tax burden from the median voter’s perspective. In
order to restore optimality, the local government thus raises τ ki . At the same time, according
to equation (5) the median voter’s preferred level of spending falls, thus reducing the land
tax rate. Second, consider an increase in the marginal contribution rate: a rise in ϑki lowers
the RHS of equation (6) while the LHS remains unchanged. Optimality hence requires an
increase in capital taxation such that∂τk
i
∂ϑki
= 1. Therefore the decrease in gi associated with
an increase in ϑki (see equation 2) is fully offset by the induced increase in capital taxation
whereas land taxation is unaffected by changes in ϑki .
To summarize, the theoretical analysis yields the following testable implications:
1. An increase in ϑki raises τ k
i relative to τ bi
6

preliminary version
2. An increase in emi raises τ k
i relative to τ bi
3 Empirical Analysis
This section studies whether our theoretical predictions are consistent with actual tax policy,
using data on North-Rhine Westphalian municipalities. To this end, we wish to estimate the
relationship
tsit = ts(yit, ϑkit, e
mit ) + uit (7)
where tsit denotes jurisdiction i’s capital relative to land tax rate at time t (i.e.τkit
τbit), and
uit is a random error term. Note that using a quasi-linear utility function allows us to study
the pure substitution effect of changes in ϑki on local tax structure. In the data however, a
change of ϑki should be expected to go along with both a substitution and an income effect
which we have to control for in our estimation. Following Buttner 2005, we will do so by
interpreting yi as the intercept of the local government’s budget constraint. In order to relate
the variables from the model to its empirical counterparts the following subsection provides
some institutional background concerning municipal finance in Germany. In subsection 3.2
we will use this background to highlight sources of identification as well as potential problems
with endogeneity arising from the specific institutional design of fiscal equalization in North-
Rhine Westphalia.
3.1 Institutional Background and Data
Besides user fees, income from private sector activity, and debt, municipal governments
in Germany obtain funds from three sources: first, federal revenue from the income tax
and the value added tax is shifted to the municipal level. These funds are distributed
7

preliminary version
among all German municipalities based on specific criteria, such as the share of overall
revenue from these taxes generated in the respective location. Second, local municipalities
raise own revenue from a local business tax and from a land tax. The tax base of the
business tax are revenues generated by local firms. Each municipality is confined to choosing
one unique local business tax rate. By contrast, with respect to the local land tax rate,
jurisdictions may discriminate between different types of land. In particular, one tax rate
may be determined by the municipal government for land devoted to agricultural use and a
separate tax rate on other land. The tax bases, both of the local business tax and the land
tax, are defined uniformly across the country. A third source of municipal funds are grants
from state governments. Most notably, all German states (except for the three city states
Berlin, Bremen, and Hamburg) engage in a system of fiscal transfers from the state to the
municipal level. While a part of these vertical transfers are paid as matching grants, the
lion’s share of grants is unconditional, in that recipients may freely decide upon their use.
Table 1 displays summary statistics on the composition of revenue for the universe of North-
Rhine Westphalian municipalities in 2005. The first two lines highlight the relative impor-
tance of business and land taxation: the fraction of overall revenue generated by the local
business tax is 2.8 times higher than the share of the local land tax. Moreover, the compo-
sition of revenue strongly varies between municipalities. For example, the maximum share
of revenue from business taxation exceeds three fourth of overall revenue whereas for some
municipalities local business taxation is almost negligible. Another striking finding is that
on average more than half of municipal revenue is composed of federal and state transfers.
Note also that the share of overall revenue generated by fiscal equalization transfers displays
strong inter-jurisdictional variation ranging between zero and more than one half.
While the last subsection already worked with a stylized account of a typical fiscal equaliza-
tion scheme, for the sake of econometric implementation, we have to be more specific about
the institutional details of fiscal equalization in North-Rhine Westphalia: grants to each
jurisdiction are determined by indicators of fiscal need (fni) and fiscal capacity (fci). The
8

preliminary version
Table 1: Composition of main sources of municipal funds in North Rhine-Westphalia, 2005
in % Observations Mean Minimum Maximum
Local Business Tax 396 34.7 3.3 78.0
Local Land Tax 396 12.3 0.05 27.0
Fiscal Equalization Transfers 396 22.4 0 55.4
Other Federal Transfers 396 30.6 17.2 50.9
Source: Own calculations and Statistical Office of North Rhine-Westphalia.
former is basically the conceded budget per-capita; the latter is a measure of tax revenue
at standardized tax rates. If a jurisdiction displays a fiscal capacity above fiscal need it
will not receive equalization grants; if its capacity falls short of fiscal need the jurisdiction
obtains grants which partly compensate for the gap between fiscal need and fiscal capacity.
Formally, grants gi are determined according to
gi = αi
fni −(τ kBk
i + τ bBbi + Rother
i
)︸ ︷︷ ︸fci
(8)
where αi denotes the equalization rate, Bki and Bb
i are tax bases for local business and local
land tax, and τ k and τ b are the respective standardized tax rates. Rotheri is revenue from
sources other than taxes and fiscal equalization transfers.
This institutional framework has a number of convenient features for our analysis. First,
since local tax autonomy is restricted to the choice of tax rates they provide a direct mea-
sure of local tax policy. Second, the marginal contribution rate may be computed from the
parameters specified in the North-Rhine Westphalian fiscal constitution by simply multi-
plying the equalization rate with the standardized tax rate:13 as equation (8) indicates an
13See Gemeindefinanzierungsgesetz (GFG) Nordrhein-Westfalen.
9

preliminary version
increase in the local business tax base (land tax base) of one unit is associated with a reduc-
tion in fiscal equalization grants of ϑki = αiτ
k (ϑbi = αiτ
b) units.14 Third, we may derive yi
as the level of grants a jurisdiction receives independent of its tax base which allows us to
control for income effects as described in section 2.15
The empirical counterpart for the median voter’s composition of endowments (emi ) is more
difficult to obtain. In order to compute the the distribution of ei we need data on the com-
position of endowments at the household level which is unavailable. In the model however,
the distribution of endowments serves to capture the broader concept of relative political
influence of landowners and workers in a municipality rather than specific household-level
heterogeneity. Hence, we use the fraction of overall housing in the jurisdiction that is owned
by the local electorate as a proxy for ei. Data on these ownership shares are available at
the municipal level for the year 1987 and at the county level for the years 1993, 1998, 2003
and 2006.16 Using that information we impute ownership shares at the municipal level for
all years except for 1987.17
The basic dataset consists of all 396 municipalities in North-Rhine Westphalia for the period
from 1986 to 2002. As we will discuss in more detail in the next subsection, our identi-
fication approach relies on exogenous variation in the marginal contribution rate faced by
jurisdictions with a population of 150,000 or below.18 Since tax incentives of municipalities
which are ineligible for fiscal equalization transfers are unaffected by changes in the marginal
contribution rate they are not considered in the analysis. Moreover, we drop one municipal-
ity from the panel which switches groups in the time period studied. The sample size thus
14Note that fiscal equalization in North-Rhine Westphalia comprises additional features such as contri-butions to counties and local authorities. However, since these institutional details are irrelevant for theensuing analysis they are not explicitly included in equation (8).
15For a more detailed account of how we computed yi see the Appendix.16Source: empirica-Regionaldatenbank and Statistical Office of North Rhine-Westphalia.17A detailed description of the imputation of ownership shares may be found in the Appendix.18This group will be henceforth referred to as “small municipalities” whereas municipalities with a popu-
lation above 150,000 will be referred to as “large municipalities”.
10
preliminary version
consists of 7,066 observations, 6,690 of which belong to the group of small municipalities and
376 to the group of large municipalities.
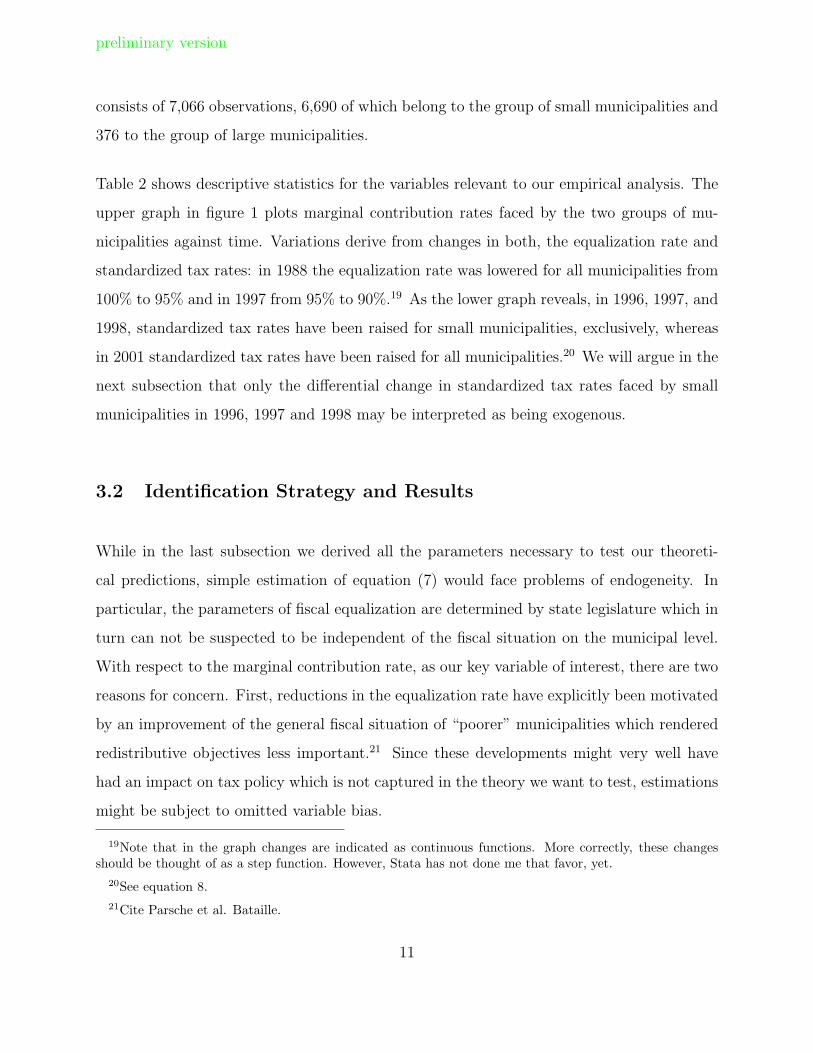
Table 2 shows descriptive statistics for the variables relevant to our empirical analysis. The
upper graph in figure 1 plots marginal contribution rates faced by the two groups of mu-
nicipalities against time. Variations derive from changes in both, the equalization rate and
standardized tax rates: in 1988 the equalization rate was lowered for all municipalities from
100% to 95% and in 1997 from 95% to 90%.19 As the lower graph reveals, in 1996, 1997, and
1998, standardized tax rates have been raised for small municipalities, exclusively, whereas
in 2001 standardized tax rates have been raised for all municipalities.20 We will argue in the
next subsection that only the differential change in standardized tax rates faced by small
municipalities in 1996, 1997 and 1998 may be interpreted as being exogenous.
3.2 Identification Strategy and Results
While in the last subsection we derived all the parameters necessary to test our theoreti-
cal predictions, simple estimation of equation (7) would face problems of endogeneity. In
particular, the parameters of fiscal equalization are determined by state legislature which in
turn can not be suspected to be independent of the fiscal situation on the municipal level.
With respect to the marginal contribution rate, as our key variable of interest, there are two
reasons for concern. First, reductions in the equalization rate have explicitly been motivated
by an improvement of the general fiscal situation of “poorer” municipalities which rendered
redistributive objectives less important.21 Since these developments might very well have
had an impact on tax policy which is not captured in the theory we want to test, estimations
might be subject to omitted variable bias.
19Note that in the graph changes are indicated as continuous functions. More correctly, these changesshould be thought of as a step function. However, Stata has not done me that favor, yet.
20See equation 8.21Cite Parsche et al. Bataille.
11

preliminary version
Table 2: Summary statistics 1986 – 2004
in % Observations Mean Minimum MaximumTax Structure
all municipalities 7,066 1.24 .83 1.75large municipalities 376 1.06 .83 1.38small municipalities 6,690 1.25 .88 1.75
Implicit MCRall municipalities 7,066 .92 .71 1.41large municipalities 376 .82 .73 1.15small municipalities 6,690 .93 .71 1.41
Lump-Sum Revenue (per capita in 1,000 e)all municipalities 7,066 .41 .17 1.19large municipalities 376 .70 .35 .92small municipalities 6,690 .39 .17 1.19
log Populationall municipalities 7,066 4.37 3.58 5.99large municipalities 376 5.47 5.19 5.99small municipalities 6,690 4.31 3.58 5.15
Source: Own calculations and Statistical Office of North Rhine-Westphalia. The group “small municipalities”consists of all municipalities with a population of 150,000 or below. All other municipalities belong to thegroup of “large municipalities”. Municipalities which are ineligible for fiscal equalization transfers are notconsidered in the empirical analysis.
12

preliminary version
Figure 1: Marginal Contribution Rates and Standardized Tax Rates by Group
Sample includes all North Rhine-Westphalian municipalities eligible for fiscal equalization grants in each ofthe years from 1986 to 2004. Source: own calculations.
13

preliminary version
A second problem relates to the change of the standardized tax rate in 2001 because it was
an explicit reaction to actual taxing behavior: according to legislative intent standardized
tax rates should give an “appropriate account of actual taxing capacity”.22 Thus, every 5
to 10 years the legislative is obliged to examine whether average tax rates strongly differ
from standardized tax rates and, as case may be, to adjust the latter accordingly. This
examination was first performed in 2000 and standardized tax rates were adjusted upwards
in the subsequent year to level average tax rates. Hence, while we aim at testing the impact
of standardized tax rates (as a component of the marginal contribution rate) on actual tax
rates, the causality in this case runs the opposite direction.
We solve these problems by exploiting a quasi-experiment resulting from a Supreme Court
ruling for the state of North-Rhine Westphalia to identify the incentive effect of fiscal equal-
ization. Due to a special provision in the North-Rhine Westphalian fiscal constitution, until
the mid-1990’s, municipalities with a population of 150,000 or below faced a lower marginal
contribution rate than municipalities with a population above 150,000. In 1993 the State
Constitutional Court ruled that this provision be abolished, unless an independent panel of
experts finds it to be justified for “economic reasons”.23 The expert report was published in
1995 concluding that both groups should face the marginal contribution rate hitherto applied
to the group of large municipalities.24 Hence, only small municipalities were affected by the
subsequent adjustment allowing us to split the sample into treatment and control group.
We use difference-in-difference to estimate the treatment effect. Our basic estimation is given
by
tsit = β0 + β1LSRit + β2OWNit + β3POPit
22Bataille23Verfassungsgerichtshof fur das Land Nordrhein-Westfalen, 1993, Urteil vom 6. Juli – VerfGH 9/92,
22/92.24See Parsche et al.
14

preliminary version
+ β4TREATi + γtPOSTt + δt(TREATi · POSTt) + uit
where
• LSRit captures lump-sum revenues (i.e. the empirical counterpart to yi
• OWNit captures the local land ownership shares (i.e. the empirical counterpart to emi )
• TREATi is a dummy variable which equals 1 if population ≤ 150, 000, 0 otherwise
• POSTt = 1 is a dummy variable which equals 1 in the post-treatment period, 0
otherwise
• (TREATi · POSTt) is an interaction terms which equal 1 for the treatment group in
the post-treatment period, 0 otherwise.
As regards the timing of events, we face a certain degree of ambiguity: to ensure a smooth
implementation if the reform the legislative adjusted the standardized tax rate for small
municipalities in three steps, i.e. from 350 in 1995 to 360 in 1996, to 370 in 1997, and to
380 in 1998. We do not have a theoretical prior to whether municipalities would react to
this (pre-announced) adjustment path immediately, i.e. in 1996, or adapt gradually over the
three years. Of course, the most parsimonious solution would be to drop the two intermediate
reform periods 1996 and 1997 from the estimations and to only discriminate between pre-
1996 and post-1997 periods. However, for robustness checks we also include specifications in
which 1996 and 1997 are considered as post-treatment periods.
Table 3 displays results for the difference in difference estimation. Columns (1)-(3) refer to
regressions which include all variables included in equation 9. In order to capture additional
heterogeneity between municipalities belonging to treatment and control group we repeat
the estimation and include municipality-fixed effects. The corresponding results are shown
in columns (4)-(6) in table 3.
15

preliminary version
Table 3: Regression Results (Dependent Variable: business tax rate relative to land tax rate)
Specifications (1) (2) (3) (4) (5) (6)
Virtual Grants -10.40*** -6.29*** -4.66*** -9.92*** -4.49*** -2.46(-7.30) (-4.27) (-2.95) (-6.82) (-3.04) (-1.57)
Ownership Shares 18.99*** 19.98*** 21.32*** 28.05 36.87*** 46.95***(16.34) (16.88) (17.19) (1.43) (6.48) (7.93)
Population (in ten thousands) -0.16*** -0.17*** -0.17*** -3.08*** -2.63*** -2.71***(-6.27) (-6.22) (-6.14) (-4.94) (-4.27) (-4.32)
Treatment Group 3.63*** 4.51*** 4.44*** -4.44 -4.49 -4.66(3.37) (4.17) (3.97) (-0.64) (-0.67) (-0.70)
Dummy 1996 -16.94*** -17.32***(-15.36) (-20.68)
Treat. Group × Dummy 1996 6.12*** 6.98***(5.41) (8.02)
Dummy 1997 -17.91*** -19.19***(-15.46) (-21.92)
Treat. Group × Dummy 1997 5.54*** 6.97***(4.66) (7.65)
Dummy 1998 -18.23*** -20.13***(-14.17) (-20.77)
Treat. Group × Dummy 1998 5.17*** 7.00***(3.92) (6.96)
Observations 5148 4752 4356 5148 4752 4356R2 0.42 0.45 0.44 0.39 0.45 0.45Column (1), (2), and (3) refer to basic regression results; columns (4), (5), and (6) refer to regressionsincluding municipality-specific fixed effects. Robust standard errors in parentheses. Two stars indicate
significance at the 5% level; three stars indicate significance at the 10% level.
16

preliminary version
Our main interest lies in the interaction terms. These are highly significant and show the
expected positive sign, indicating that an increase in the marginal contribution rate for the
local business tax leads to an increase of capital relative to land tax rates. The results
show very little variation across specifications. Likewise, ownership shares are significant at
the 1% level except for specification (4) where they are not significant. The coefficients all
show the expected positive sign. The quantitative variation is substantially larger across
specifications. However, we do not pursue the path further since ownership shares are not
the policy parameter we intend to study.
4 Concluding Remarks
This paper investigated the impact of intergovernmental transfers on governments’ choices
between distortive and non-distortive taxation. A simple political economy model predicts a
positive relationship between the degree to which adverse tax base effects are compensated
by the grant scheme and the use of distortive relative to non-distortive taxation. For a panel
of German municipalities we confirm this theoretical prediction using a quasi-experiment
obtained form a Supreme Court ruling for identification.
Our analysis bears an important normative implication: recent literature has emphasized the
positive efficiency properties of fiscal capacity dependent grant schemes. In particular, it has
been argued that they may serve to counteract incentives for sub-national governments to
engage in inefficient tax competition. However, as the above analysis suggests, this positive
effect does not come without cost: if the grant scheme skews the local tax structure towards
distortive taxation and the overall supply of the mobile factor to the economy is elastic,
policy-makers face a trade-off. A higher marginal contribution rate mitigates tax competition
thus raising the efficiency of interregional allocation of mobile factors within the federation.
At the same time, it induces a more distortive tax structure thus decreasing the overall
supply of mobile tax bases to the economy.
17

preliminary version
References
R. Bird. Rethinking subnational taxes: a new look at tax assignment. IMF Working Paper,
99/165, 2002.
R. Boadway. The theory and practice of equalization. CESifo Economic Studies, 50:211–254,
2004.
R. Borck. Tax competition and the choice of tax structure in a majority voting model.
Journal of Urban Economics, 54:173–180, 2003.
T. Buttner. Tax base effects and fiscal externalities of local capital taxation: evidence from
a panel of German jurisdictions. Journal of Urban Economics, 54:110–128, 2003.
T. Buttner. The incentive effect of fiscal equalization transfers on tax policy. Journal of
Public Economics, 90:477–497, 2006.
B. Dahlby. The incentive effects of fiscal equalization. Atlantic Institute for Market Studies,
Halifax, 2002.
P. Egger, M. Koethenbuerger, and M. Smart. Do fiscal transfers alleviate business tax
competition? evidence from Germany. CESifo Working Paper, 1955, 2007.
C. Fuest and B. Huber. Tax competition and tax coordination in a median voter model.
Public Choice, 107:97–113, 2001.
R. Parsche et al.
M. Smart. Taxation and deadweight loss in a system of intergovernmental transfers. Cana-
dian Journal of Economics, 31:189–206, 1998.
D. E. Wildasin. Urban Public Finance. Chur: Harwood, 1986.
D. E. Wildasin. Interjurisdictional capital mobility: fiscal externality and a corrective sub-
sidy. Journal of Urban Economics, 25:193–212, 1989.
18

preliminary version
J. D. Wilson. A theory of interregional tax competition. Journal of Urban Economics, 19:
296–315, 1986.
G. R. Zodrow and P. Mieszkowski. Pigou, Tiebout, property taxation, and the underprovision
of local public goods. Journal of Urban Economics, 19:356–370, 1986.
19

Appendix
Imputation of ownership shares
We first compute for each municipality a relation of its ownership share to the overall county
ownership share in 1987. In a second step we multiply the county level data for 1993, 1998,
2003 and 2006 with this municipality-level variable. Finally, we impute ownership shares for
the years in which no data are available as the relative distance between the years in which
no data are available. Formally, let osti denote the ownership share of municipality i and ost
j
denote the ownership share of municipality i’s county j in year t. The municipal ownership
share in 1990 for example would thus be imputed as
os90i = os87
i + (os93j × os87
i
os87j
− os87i )× (1990− 1987)
(1993− 1987). (9)
In order for this imputation to yield an adequate measure of actual ownership shares each
municipality’s ownership relative to its county’s ownership share has to be constant over
time and changes in county ownership shares have to be a linear function of time between
the years in which data are available.
Definition of Lump-Sum Grants
We compute yi as gi + ϑki ki where ki denotes the tax base of the local business tax. In
addition we could include Other Federal Transfers in yi. While this would generate additional
variation between municipalities it might also be a source of endogeneity since the allocation
of these transfers based on local revenue from the income tax is likely to be correlated with
the local business tax base.
20