Embed Size (px)
Citation preview
Court-Ordered School Finance Equalization
91
Court-Ordered School FinanceEqualization: Judicial Activism and
Democratic OppositionDouglas S. Reed
Georgetown UniversityWashington, DC
About the AuthorDr. Douglas S. Reed is an Assistant Professor in
the Government Department at Georgetown Univer-sity. He teaches both American politics and Constitu-tional Law and his research interests broadly focuson courts and social movements with an emphasis onthe political and constitutional meanings of equality.His recent work has centered on educational equalityand legal institutions, with a focus on state supremecourt interventions in public school finance.
A former Research Fellow at the BrookingsInstitution in Washington, DC, Dr. Reed earned hisPh.D. in Political Science from Yale University in1995. His dissertation, titled, Democracy v. Equal-ity: Political and Legal Struggles over School
Finance Equalization, examined the impact of statesupreme court decisions on school finance in Con-necticut, Kentucky, New Jersey, and Texas. Hismost recent article, "The People v. The Court:School Finance Reform and the New Jersey Su-preme Court," appeared in the Cornell Journal ofLaw and Public Policy.
During the 1996–97 school year, Dr. Reedreceived a Spencer Post-Doctoral Fellowship fromthe National Academy of Education and is writing abook on courts and educational reform.


Court-Ordered School Finance Equalization
93
Recent United States Supreme Court decisionshave brought nearly to an end the era of judicially-supervised school desegregation and integration.Over a series of decisions, the Supreme Court hassought recently to disengage the federal judiciaryfrom close oversight of local school districts, espe-cially in the realm of racial segregation.¹ But thejudiciary’s involvement in educational matters is farfrom negligible. Undaunted by the federal judiciary’s
Court-Ordered School FinanceEqualization: Judicial Activism
and Democratic OppositionDouglas S. Reed
Georgetown University
experience with school desegregation—and perhapseven inspired by it—state courts have over the pasttwenty years embarked on their own efforts to effectdramatic changes in public education. These effortshave focused not on racial segregation but on thefinancing disparities among school districts.2 Sincethe U.S. Supreme Court ruled in San AntonioIndependent School District v. Rodriguez (1973)that school financing inequities do not violate theequal protection clause of the Fourteenth Amend-ment, state supreme courts in 27 states have ruled onschool financing suits under provisions of stateconstitutions. Twelve have ruled in favor of greaterequity and fifteen have ruled against it (see table 1).Part of a larger trend of using state courts for theprotection of civil rights under state constitutions,3
these school finance decisions have the potentialdramatically to alter the fiscal policies of numerousstate governments—with enormous consequences forboth the amount of resources allocated to publiceducation and the equity of that distribution. Legal
1 See Missouri v. Jenkins, Freeman v. Pitts, and Board of Education ofOklahoma City v. Dowell.
2 The leading cases are Robinson v. Cahill (Robinson I), Serrano v.Priest (Serrano II), Horton v. Meskill (Horton I), Dupree v. AlmaSchool District, Edgewood Independent School District v. Kirby(Edgewood I), Helena Elementary School District No. One v. State ofMontana, Rose v. Council for Better Education, and Abbott v. Burke(Abbott II).
3 For background on this trend, see Brennan (1977); Howard (1976);Pollock (1985); Williams (1985); Williams (1992). This trend towardsincreasing use of state constitutions has not gone uncriticized, however.See, for example, Gardner (1992).

Developments in School Finance, 1996
94
Table 1.—State Supreme Court decisions on school finance
State Supreme Courts ruling in favorof greater equity and/or adequacy Court cases supporting this ruling
California Serrano v. Priest (Serrano I)¹Serrano v. Priest (Serrano II)2
New Jersey Robinson v. Cahill (Robinson I)Abbott v. Burke (Abbott II)
Montana State ex. rel. Woodahl v. Straub3
Helena Elementary School District No. One v. State of Montana4
Connecticut Horton v. Meskill (Horton I)Horton v. Meskill (Horton III)5
Washington Northshore School District No. 417 v. KinnearSeattle School District No. One v. State of Washington6
West Virginia Pauley v. Kelly
Wyoming Washakie County School District No. One v. Herschler
Arkansas Dupree v. Alma School District No. 30 of Crawford County
Kentucky Rose v. Council for Better Education
Texas Edgewood Independent School District v. Kirby (Edgewood I)
Tennessee Tennessee Small School Systems v. McWherter
Massachusetts McDuffy v. Secretary of the Executive Office of Education
New Hampshire7 Claremont School District v. Governor
Kansas8 Unified School District No. 229 v. State
Arizona9 Roosevelt Elementary School District No. 66 v. Bishop
Vermont Brigham v. State
Ohio DeRolph v. State

Court-Ordered School Finance Equalization
95
State Supreme Courts ruling againstgreater equity and /or adequacy Court cases supporting this ruling
Illinois Blase v. State
Arizona Shofstall v. Hollins
Michigan Milliken v. Green
Idaho Thompson v. Engelking
Oregon Olsen v. State ex. rel. JohnsonCoalition for Equitable School Funding v. State
Wisconsin Buse v. Smith10
Kukor v. Grover11
Pennsylvania Danson v. Casey
Ohio Board of Education v. Walter
Georgia MacDaniel v. Thomas
New York Board of Education Levittown Union Free School District v. Nyquist
Colorado Lujan v. Colorado State Board of Education
Maryland Hornbeck v. Somerset County Board of Education
Oklahoma Fair School Finance Council of Oklahoma, Inc. v. State
North Carolina Britt v. North Carolina State Board of Education
South Carolina Richland County v. Campbell
Minnesota Skeen v. State
Nebraska Gould v. Orr
North Dakota12 Bismark Public School District #1 v. State
Table 1.—State Supreme Court decisions on school finance, continued
Developments in School Finance, 1996
96
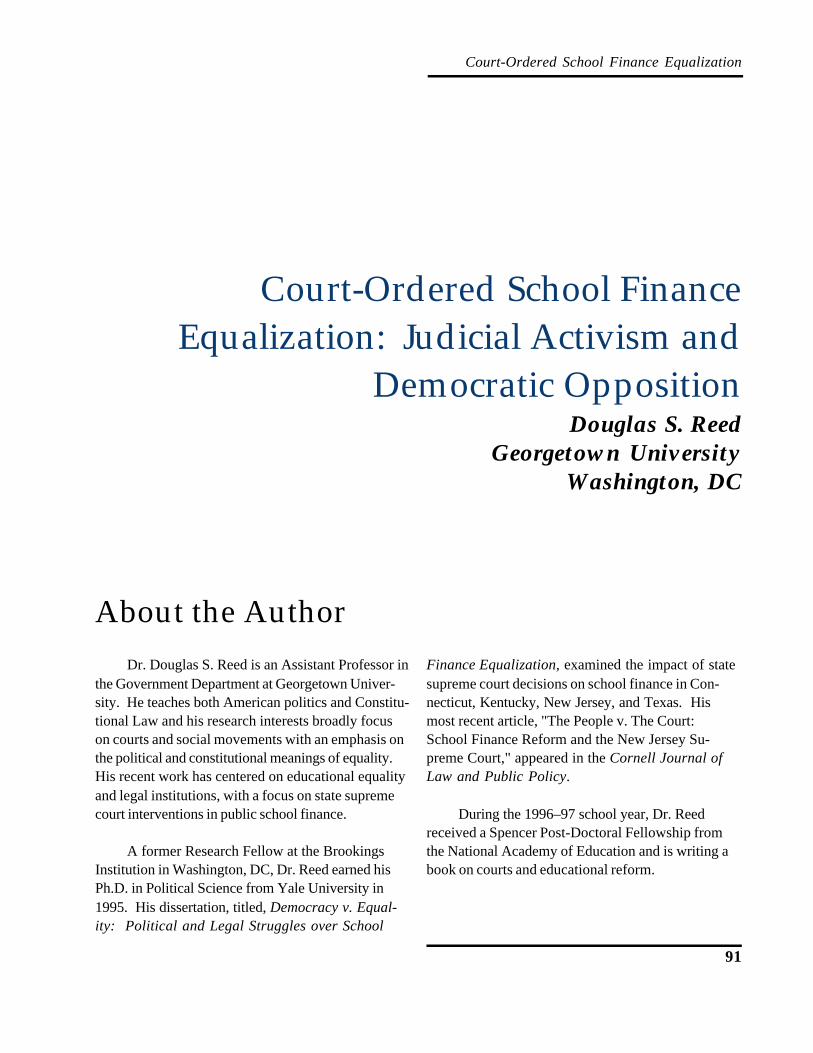
Table 1.—State Supreme Court decisions on school finance, continued
Maine School Admnistrative District No. 1 v. Commissioner,Department of Education
Rhode Island City of Pawtucket v. Sundlun
Florida Coalition for Adequacy and Fairness in School Funding v. Chiles
Illinois Committee for Educational Rights v. Edgar
1 Serrano I was based on federal grounds held to be invalid under Rodriguez.2 Serrano II was based on state constitutional provisions.3 State ex. rel. Woodahl v. Straub found that a modest equalization scheme was constitutional.4 Helena Elementary School District No. One v. State of Montana found the existing scheme unconstitutional.5 School finance plaintiffs won in Horton I, but Horton III imposed a more demanding burden of proof for plaintiffs' claim concerningthe adequacy of reform.6 Northshore School District No. 417 v. Kinnear did not rule in favor of greater equity, Seattle School District No. One v. State of
Washington overturned much of Northshore.7 The New Hampshire Supreme Court has not yet ruled on the merits, but it has declared both an adequate education and adequatefunding a constitutional right in New Hampshire.8 Unified School District No. 229 v. State ruled that a redistributive scheme established by the state legislature was constitutional.The suit was brought by districts that lost revenue under the plan.9 The Bishop decision concerned only the funding of school facilities.10 Buse v. Smith declared unconstitutional a highly progressive funding mechanism that re-distributed tax revenues across districts.The suit was brought by districts that had to pay the tax.11 Kukor v. Grover held constitutional a moderately egalitarian funding mechanism that plaintiffs felt did not provide sufficientrevenues for inner-city districts.12 By a 3-2 vote, North Dakota's Supreme Court ruled against the existing financing system, but under North Dakota's Constitution,four justices are required to declare a law unconstitutional.
NOTE: The table here and Hickrod et al. differ somewhat due to different definitions.SOURCE: Reed, unpublished tabulations; Hickrod, G. A. et al. 1997. "Status of School Finance Constitutional Litigation—TheBoxscore." Illinois State University, College of Education.
scholars have given these state supreme court deci-sions fairly wide notice,4 but little attention has beenpaid to the impacts of these decisions. The politicalscience and policy communities have also given scantattention to the impact of these decisions. Oneexception is Michael Mintrom's report in 1993.Another policy study, Hickrod et al. (1992), directlyassesses the effects of state supreme court decisions
across a number of states. Unfortunately, this study ismarred by some significant methodological problems.First, the school finance figures are not adjusted forinflation; only constant figures are used. Also, as thearticle compares data over a fairly long time span,1970–1990, inflation could account for much of theincrease in educational expenditures by state and localgovernment. Second, measures of school financingequity are used that precede state supreme courtdecisions in Kentucky, Montana, Texas, and NewJersey. These data, then, cannot be used to evaluate4 See Banks (1992); Johnson (1979); Thro (1989); Thro (1990).

Court-Ordered School Finance Equalization
97
...this paperassesses thesuccess of effortsby four statesupreme courts(Connecticut, NewJersey, Texas, andKentucky) toincrease the equityof school financewithin their states.
5 Campbell and Fischel (1996) contend that economic rationality drovevoter opposition to a gubernatorial candidate who sought to comply witha state supreme court decision with an income tax-funded equalizationplan—even though most taxpayers would financially benefit fromequalization.
whether the courts changed the distribution, and hencethe equity, of funds.
This paper attempts to rectify this imbalance inboth the political science and policy literature onschool finance. I do so by examining two ways thesedecisions affect the policies and politics of stategovernments. First, I want to examine the effects ofthese state supreme court decisions on the actualdistributions of school funds within four states. Inshort, this paper assesses the success of efforts byfour state supreme courts (Connecticut, New Jersey,Texas, and Kentucky) to increase the equity of schoolfinance within their states. Second, I also want toexplore the dimensions of public reaction to thesedecisions, by analyzing polling results and votingreturns. This examination of public reactions to thecourt decisions and the legislative remedies designedto comply with judicial mandateswill, I hope, highlight the opportuni-ties, limitations, and constraints thatoperate on state supreme courts asthey strive to effect significantchanges in the ways public schoolsare financed.
My argument is twofold:First, I argue that there has beenimportant variation in the changeswrought by state supreme courts inthe four states I study. Some statesupreme courts have achieved agreat deal of equalization, whileothers have been less successful.Second, I argue that public opposition to equalizationefforts is often keen, but its determinants are notstraightforward. Economists would contend, andhave,5 that the opposition to equalization stems fromeconomic self-interest to avoid costs. But my analysis
below of polling data from New Jersey and electionreturns in Texas shows that a significant portion ofthe opposition in both those states is racial or ideo-logical rather than simply driven by perceived eco-nomic self-interest.
This conclusion, I contend, has profoundconsequences for how both judges and legislatorsapproach the issue of school finance equalization. Inshort, devising a school finance system that distributeseconomic costs widely and fairly may not be enough;judges and policymakers will still have to overcomeracial and ideological cleavages. The former resultsfrom the perception that racial minorities are thebeneficiaries of equalization. The latter emerges fromthose who value localist rather than state-centeredapproaches to school financing—even if the localistapproach generates persistent and significant inequal-
ity of resources.
Rather than simply confrontinginterest groups that articulate eco-nomic, class-based arguments againstequalization, legislatures (and, inturn, state courts) must battle againsta mass public opposition to equaliza-tion that is, in significant ways,racially based. This paper examinesthe quantitative effects of court-ordered school finance equalizationin four states, and then turns to ananalysis of public opinion concerningschool finance equalization in twostates where supreme courts have
been particularly active: Texas and New Jersey. TheNew Jersey Supreme Court has achieved significantand important reforms in school finance for that state,but at a fairly high political cost. In Texas, mean-while, the results have been less favorable for theadvocates of increased equity, and opposition hasbeen extremely strong. In both cases, I examine thepublic opinion surrounding the legislature’s policyresponse to the school finance decisions.

Developments in School Finance, 1996
98
. . ."horizontalequality," [is] thenotion ofproviding allsimilarly situatedstudents withequal amounts ofeducationalresources, . . .
This paper is organized into three sections. Thefirst section presents a quantitative assessment of theeffects state supreme courts in Connecticut, NewJersey, Texas, and Kentucky have had on equality ofschool finance expenditures. The second sectionshifts the focus to New Jersey and Texas and exam-ines the determinants of public opposition to thelegislative responses to the Supreme Court decisions.Finally, the third section concludes with some obser-vations about the limitations of both judges andlegislators as they strive to address the problem ofschool finance inequities.
How Have State Supreme CourtsAffected Educational FinancingEquity?
In this section, I provide an overview of thetrends in school finance equity in thewake of state supreme court decisionsthat declared existing methods offinancing schools unconstitutional.
At this juncture, it is necessaryto provide a quick word about schoolfinance data and the notion of express-ing “equality” through quantitativedata. There are a number of ways tomeasure the equity within a schoolfinance system and they all embodycertain value choices about what isworthy of measurement. Put simply,different measures reflect different
normative commitments. One cannot provide an"objective" notion of equality because there aredifferent types of equality.6 For the sake of simplicity,I have chosen to provide here only one basic measure:the coefficient of variation, which is the standarddeviation of a population divided by the mean of thepopulation. This calculation measures the dispersionof expenditures across districts within a state. It is aquantitative representation of what Berne and Stiefel(1984) call “horizontal equality,” the notion ofproviding all similarly situated students with equalamounts of educational resources, measured here bydollars.
Quantitative Analysis
I obtained school financing data for each schooldistrict within each state, and calculated the per pupil
expenditures in a number ofcategories. These data generallycame from the state departments ofeducation, although Connecticutdata was obtained from the Con-necticut Public ExpenditureCouncil, a well-regarded fiscalwatchdog group. Also, becausethe New Jersey decision wasrestricted to only particular socio-economic classes of school dis-tricts, I have applied my analysisonly to those districts that are thefocus of the court's ruling: the 30so-called "special needs" districts,largely inner-city districts, and the
roughly 110 affluent districts that fall into the NewJersey Department of Education's "I" and "J" catego-ries of district wealth (the two most affluent catego-ries). I weighted each district for the number ofstudents within that district in order to obtain a perpupil rather than a per district analysis. After adjust-ing the figure for inflation, I then calculated thecoefficient of variation (dividing the standard devia-tion by the mean).7
6 For a discussion of the types of equality see Rae et al. (1981). For adiscussion of how measuring the different types of equality necessarilyrequires the exercise of value judgements see Berne and Stiefel (1984).
7 Because states use different accounting methods and expendituredefinitions, it is not possible to compare directly expenditure andrevenue categories across states. Consequently, I have had to usedifferent categories of expenditures, or revenues, in each state.Therefore, one cannot compare equities across states—for example, thatKentucky's funds are distributed more equitably than Texas'. Thesefigures are useful for determining trends in equity within a state overtime. This way we can determine whether a particular state supremecourt has been more effective than another in its efforts to promoteschool finance equity.

Court-Ordered School Finance Equalization
99
..S t a t e
e d u c a g o v n
s p e n d i n g .
...school financedecisions in somestates ultimatelyproduce muchgreater equity thanthey do in otherstates.
8 The decisions were delivered in the following years: Connecticut, 1977;Texas, 1989; New Jersey, 1989; Kentucky, 1990. The New JerseySupreme Court handed down a decision in 1973 that triggered an earlierround of school financing changes in that state. For an overview of thepolitics and results of those changes, see Goertz (1983); Goertz (1979);and Lehne (1978).
9 The New Jersey Supreme Court confined the scope of its decision to twospecified types of school districts within the state: approximately 30"special needs" districts which are largely urban districts and roughly110 affluent, suburban districts. In my analysis, I have only includedthose districts that were included within the court's decision. The equitytrends shown here only demonstrate the degree to which these districtshave become more equitable. It does not address the equity of alldistricts within the state.
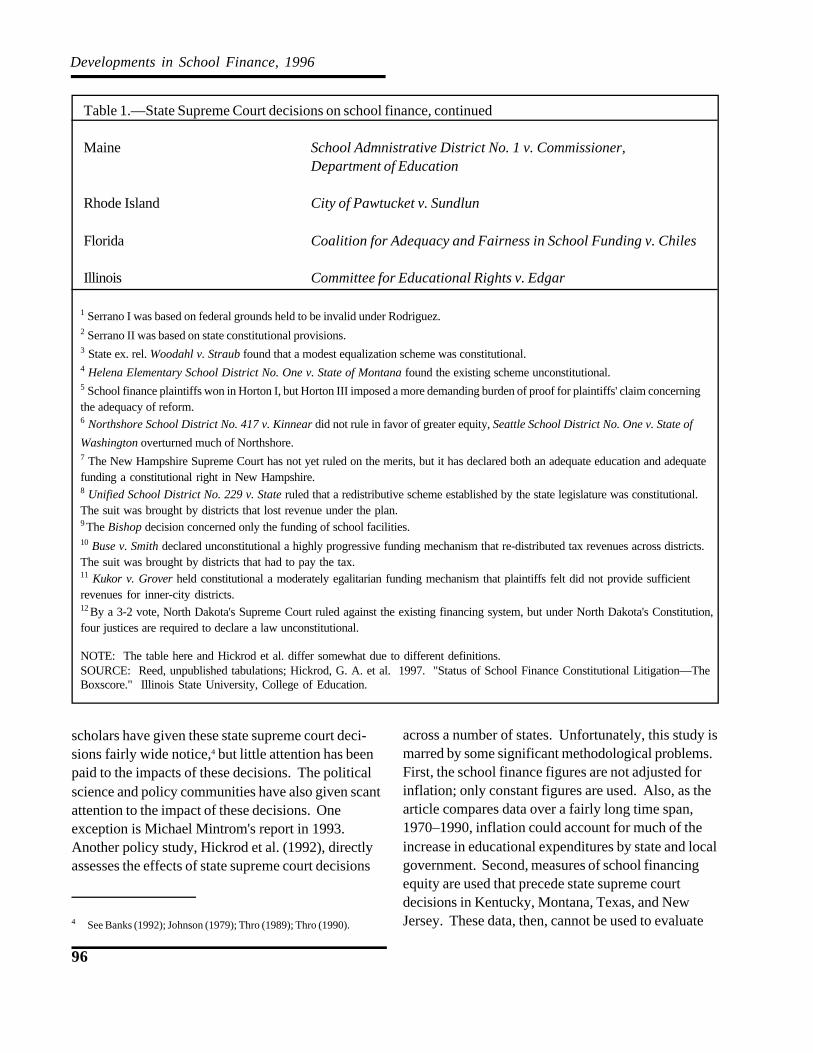
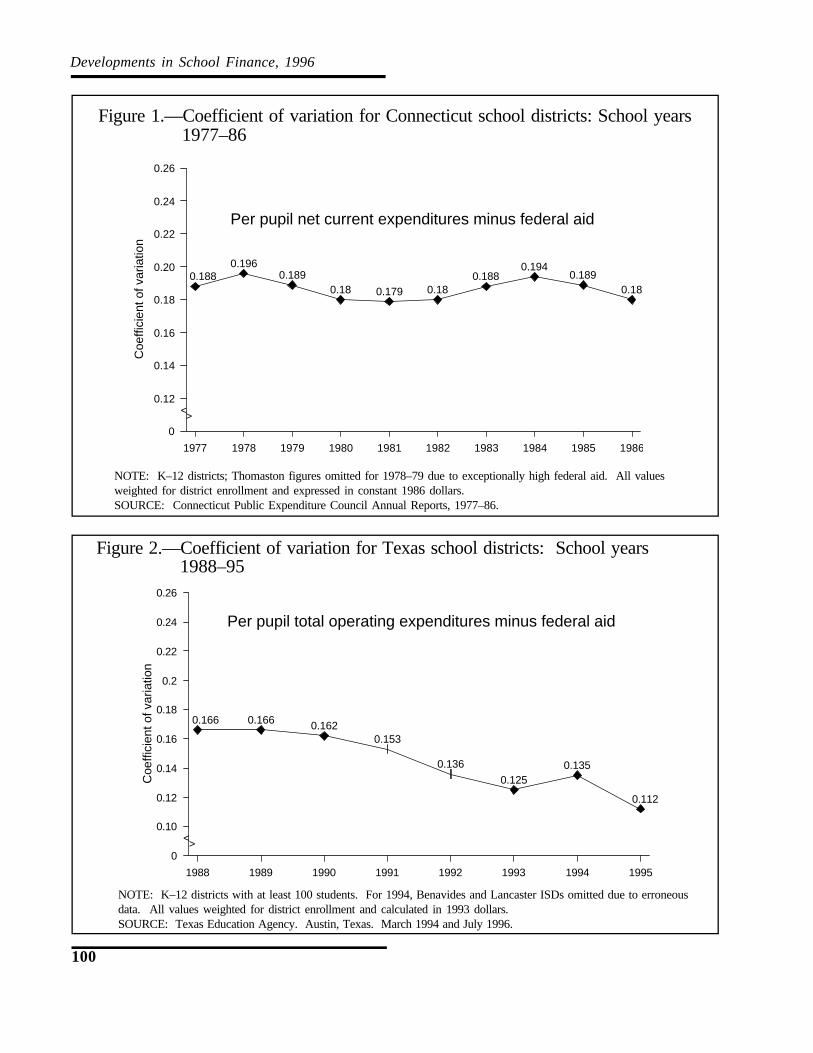
Figures 1-4 present the results of the equaliza-tion efforts in four states: Connecticut, New Jersey,Texas, and Kentucky. In each figure, we see thetrends of school finance equity over time, as measuredby the coefficient of variation. The line in each chartshows the equity change in the expenditures orrevenues of districts in each state. In order to deter-mine whether the state supreme court decisions had aneffect on the equity of these expenditures, we need todetermine whether the line slopes downward. In allfour states, the lines slope downward after the statesupreme court decision.8 But the size of the changesand the permanence of the equalizing trend varysignificantly from state to state. In figure 1, Con-necticut only saw a slight dip in its overall inequitiesand then a gradual worsening of the inequalities.Within six years, inequities wereactually worse than they were at thetime of the court’s decision. Simi-larly, in figure 2, Texas saw only agradual and modest decline in thelevel of school financing inequities—despite the Texas Supreme Court’sdeep and repeated involvement in thematter. In contrast, in figure 3, NewJersey saw the equity of fundsavailable to “special needs” andaffluent, suburban districts increaserather dramatically since the 1990decision.9 Finally, we see in figure 4that Kentucky saw its inequities cutalmost in half over a four year
period. Kentucky’s improvement in equities areclearly the most substantial of the four states exam-ined here.
Implications of Quantitative Findings
We see, then, that school finance decisions insome states ultimately produce much greater equitythan they do in other states. What accounts for thisdifference? What contexts render some decisionsmore effective than others? Or, to put it in a languagethat is more fashionable in political science: What arethe limitations on state supreme courts’ judicialcapacities—at least within the policy arena of schoolfinance?
In order to respond to thesequestions, we need to understandthe pressures operating on statesupreme courts and the institutionalcontexts within which they mustact. In their work State SupremeCourts in State and Nation, Tarrand Porter present a broad analyti-cal framework for the study of statesupreme courts, a framework whichsketches the institutional andjurisprudential opportunities andlimitations of state supreme courts.In table 2 I have adapted theirframework to the concrete legal andpolicy setting of school finance
litigation. Although Tarr and Porter do not presenttheir conception of judicial federalism in a tabularform, their analytical understanding of the vertical,horizontal, and intra-state linkages of state supremecourts, combined with the legal and extra-legalcontexts of state courts within the American policy,lends itself to the following two by three matrix.Within each cell, I provide only one example ofnumerous possible relationships or activities thataffect a state supreme courts’ foray into schoolfinance reform. Table 2 is not designed to be acomprehensive listing of all possible state supremecourt relations and contexts, but rather an analytical
Developments in School Finance, 1996
100
1977 1978 1979 1980 1981 1982 1983 1984 1985 1986
0
0.12
0.14
0.16
0.18
0.20
0.22
0.24
0.26
0.1880.196
0.1890.18 0.179 0.18
0.1880.194
0.1890.18
Coe
ffici
ent o
f var
iatio
n
Per pupil net current expenditures minus federal aid
<>
1988 1989 1990 1991 1992 1993 1994 1995
0
0.10
0.12
0.14
0.16
0.18
0.2
0.22
0.24
0.26
0.166 0.166 0.1620.153
0.136
0.1250.135
0.112
Coe
ffici
ent o
f var
iatio
n
Per pupil total operating expenditures minus federal aid
<>
Figure 1.—Coefficient of variation for Connecticut school districts: School years1977–86
Figure 2.—Coefficient of variation for Texas school districts: School years1988–95
NOTE: K–12 districts; Thomaston figures omitted for 1978–79 due to exceptionally high federal aid. All valuesweighted for district enrollment and expressed in constant 1986 dollars.SOURCE: Connecticut Public Expenditure Council Annual Reports, 1977–86.
NOTE: K–12 districts with at least 100 students. For 1994, Benavides and Lancaster ISDs omitted due to erroneousdata. All values weighted for district enrollment and calculated in 1993 dollars.SOURCE: Texas Education Agency. Austin, Texas. March 1994 and July 1996.

Court-Ordered School Finance Equalization
101
1988 1989 1990 1991 1992 1993
0
0.12
0.14
0.16
0.18
0.20
0.22
0.24
0.26
0.1840.189
0.181 0.184
0.161
0.122
Coe
ffici
ent o
f var
iatio
n
Per pupil net budget revenues
Per pupil net budget revenues (state + local revenues)
<>
Figure 3.—Coefficient of variation for New Jersey's special needs and I & Jdistricts: School years 1988–93
NOTE: K–12 and hypothetical K–12 districts constructed from regional high schools, K–8, and K–6 districts. Allvalues weighted for district enrollment and calculated using 1993 dollars.SOURCE: New Jersey Department of Education, January 1994. 1993 figures are preliminary.
Figure 4.—Coefficient of variation for Kentucky school districts: School years1988–93
NOTE: All values weighted for district enrollment and calculated using constant 1993 dollars.SOURCE: Kentucky Department of Education. March 1994.
1988 1989 1990 1991 1992 19930
0.12
0.14
0.16
0.18
0.2
0.22
0.24
0.26
0.2170.225
0.22
0.1450.141
0.12
Coe
ffici
ent o
f var
iatio
n
Per Pupil Total Current Expenditures Minus Federal Aid
<>

Developments in School Finance, 1996
102
Table 2.—State supreme courts' activities and institutional relations in school finance litigation
Column A Column BLegal contexts Extra-legal contexts
Vertical relations San Antonio v. Rodriguez U.S. Department of Education
Horizontal relations Decisions of sibling states National Governors' Conference
Intra-state relations School finance ruling itself Legislative and political pressuresre-taxation and school reform
SOURCE: Adapted from Tarr and Porter, (1988).
schema to help us identify various roles and contextsin which a state supreme court might operate withinthe policy realm of public school finance.
In column A, we can trace the setting andinfluence of U.S. Supreme Court and other statesupreme court decisions on an individual state su-preme court’s decision. In Column B, we see theeffects of extra-legal relations and contexts on schoolfinance reform. Not all cells are of equal importance,but a full account of the Connecticut, Texas, NewJersey, and Kentucky case studies would closelyexamine the interaction between the last two cells inColumns A and B. A full account would, that is,demonstrate the effects that both legal and extra-legalcontexts have on school finance reform within eachstate. It is here that we can begin to identify thesources of relative judicial capacity or incapacity inthe realm of public school finance. And it is here thatperhaps we can find some answers to the question ofwhy some state supreme court decisions yield dra-matic results and others meager results.
Unfortunately, a full reckoning of these casestudies is beyond the scope of this paper. Instead, Iturn next to merely one of the extra-legal factors thatarguably has an influence on state supreme courts’capacity to restructure public school finance: masspublic attitudes. My account here focuses on Texasand New Jersey. This examination can provide some
insight on how courts can and cannot thwart majoritywill—especially in a climate where legislatures areparticularly attuned to the attitudes of their constitu-ents.
Determinants of Mass PublicOpposition to School FinanceReform in Texas and New Jersey
In this section, I examine public attitudestowards school finance reform expressed in NewJersey and Texas at the time of major reforms in theirpublic school finance systems. In New Jersey, Ianalyze data from a public opinion poll conducted bythe Eagleton Institute of Politics in July of 1990, afew weeks after the legislature passed the QualityEducation Act (QEA) of 1990, a reform packageenacted in response to the New Jersey SupremeCourt’s decision in Abbott II. In Texas, I analyzevoting returns and demographic data from statelegislative districts to discern the demographiccharacteristics most strongly associated with opposi-tion to Proposition One, a 1993 statewide constitu-tional referendum on school finance reform. Thisballot measure was the consequence of three statesupreme court decisions striking down the existingschool finance arrangements in Texas. Both analysesshow that race—in limited contexts—is salient to theissue of court-ordered school finance reform.

Court-Ordered School Finance Equalization
103
The first, andprobably the mostcommonlyacceptedunderstanding ofopposition toschool financereform is simplyone of economicself-interest.
Theories of Opposition to School Finance Reforms
This analysis of public opinion posits threepossible explanations for public opposition to schoolfinance reform: economic self-interest, an anti-taxideology, and racial geography. The three are expli-cated below.
1. Economic Self-Interest: The first, andprobably the most commonly accepted understandingof opposition to school finance reform is simply oneof economic self-interest.10 Under this theory, opposi-tion to reforms would emerge from the potential coststhat court-ordered school finance equalization mightbring: increased taxes and/or lower state aid to adistrict. Typically, individuals who live in affluentsuburbs receive the shorter end of two sticks in schoolfinance reform: their school districts receive less stateaid and they have to pay more instate taxes, and possibly increasedlocal taxes as well. Because of thezero-sum nature of school financeequalization, economic self-interestwould dictate that the financial losersin school finance reform wouldoppose the reform effort.
2. Anti-Tax and/or Anti-Government Ideology: A secondmodel that might explain oppositionto the court-ordered reforms is anideological one. Similar to, butdistinct from an economic self-interest model, an anti-tax sentiment model couldaccount for much of the opposition—independent of
whether one’s own district gains or loses aid orindependent of whether one’s own tax bill goes up ordown. This could be particularly true if the sentimentis conjoint with an overall conservative ideologicalbent.
3. Racial Geography: A third model I test is aracial geography model: the effects of race andgeographic location on one’s likelihood to support oroppose both the court-ordered school finance reform.The rationale of this model is that anti-urban senti-ment in the suburbs and rural areas combines with theperception that non-whites are the sole beneficiaries ofschool finance equalization to yield a white/non-whiteand urban/suburban-rural cleavage over the issue ofschool finance equalization. In some ways, this is atest of the racial politics of entitlements described byEdsall and Edsall (1992), but on a local rather than
national level.11
New Jersey Public Opinion andthe Quality Education Act of 1990
The citizens of New Jersey in1990 were of two minds concerningthe equity of school financing: theprinciple of greater equity waslargely endorsed by a majority ofrespondents, but the specific policiesdesigned to achieve that equity weresimultaneously opposed by respon-dents. The purpose of this section isto analyze in detail the dimensions
of New Jersey public opinion about the QEA. Inearly June 1990, The Star Ledger/Eagleton Pollqueried 800 residents of New Jersey about theirsupport for the school financing plan enacted by theNew Jersey legislature a few weeks earlier. The dataare in an SPSS portable file which was analyzedusing SPSS/PC+. It contains 800 observations and157 variables, encompassing not only the usual socio-economic demographics but also responses to ques-tions about the perceived impact of new taxes, theperceived effects of school finance reform on localdistricts, whether the respondent has school-age
10 See Bogart and Vandoren (1993) and Mintrom (1993).
11 I am not examining the racial affect of respondents, but their racialidentity, and then estimating the likelihood that they will oppose schoolfinance equalization. The difference is important because if one is toargue that racial prejudice drives this opposition then one needs a furthermeasure of racial affect—or other evidence of racial hostility. Evidenceof a racial cleavage on this issue is not tantamount to evidence of racialprejudice. The former is a form of racial politics; the latter is a form ofracism. The two—while both lamentable and, I contend, destructive—are different.
Developments in School Finance, 1996
104
children, etc. The Eagleton Poll weights all observa-tions to improve sample selection, ensuring that ageand education frequencies correspond to U.S. Censusdata for New Jersey, by using an iterative rakingalgorithm. I collapsed the response I use here as adependent variable: An approval/disapproval ques-tion concerning the QEA. I also collapsed a numberof independent dummy variables into dichotomousapproval/disapproval or polytomous responses. I thenperformed a logit analysis of dichotomous approval/disapproval responses to the QEA.
By testing three theories of opposition to theQEA and controlling for the influence that the pres-ence of school-age children have on respondents’answers, I conclude that whites and non-whites inNew Jersey perceive school financing differently ifthey have school age children. But among peoplewithout children, race does not shape one’s perceptionof school financing; instead, economiccosts are more salient to one’s support,or lack thereof, of school financereform.
On a descriptive level, it is clearthat in 1990 there was significantsupport for greater equity in schoolfinancing and an equally significantlack of support for the Quality Educa-tion Act (QEA I). The Star-Ledger/Eagleton Poll—taken between July 2and 10, 1990—showed that 54 percentof those who had heard of Abbott v.Burke agreed with the decision (eithermildly or strongly) and 38 percent of those awaredisagreed with the court. (again, either mildly orstrongly). The remaining 8 percent did not know theirposition. In contrast, only 35 percent of those sur-veyed approved of the recently passed QEA. Fifty-sixpercent disapproved, and 9 percent indicated theydidn’t know.12 But what accounts for this level ofsupport—or lack of it? By using a logistic regression
technique on the original Star-Ledger/Eagleton Polldata set, we can estimate the influence of a number ofindependent variables on the inclination of a respon-dent to favor the QEA.
Operationalizing the Models for New Jersey Data
1. Economic Self-Interest
The poll contains a number of questions directlyrelated to the perceived economic impact of both theschool finance reform package and the income andsales taxes levied in part to pay for it. Specifically,respondents were asked whether they thought the taxpackage would hurt, have no effect or help “peoplelike you” (EFFECT); whether they thought propertytaxes would go up, stay the same, or go down(PROPTAX), whether they thought their local schooldistrict would lose aid or get aid (GETAID) and their
income level, broken into fourcategories (INCOME2). I recodedEFFECT into a dichotomous (hurtvs. help/no difference) variable(EFFECT_R). Together, thesefour variables (EFFECT_R,PROPTAX, GETAID, INCOME2)comprise the economic rationalitymodel.
2. Anti-Tax & Ideology
The poll also contains dataon whether respondents accept anincrease and expansion of the sales
tax (SALESTAX), whether they accept an increaseand expansion of the state income tax (INCTAX), anda ideological self-identification score, using the termsconservative, moderate and liberal (IDEOLOG).These three variables comprise the anti-tax andideological model.
12 Star Ledger/Eagleton Poll (1990).
The EagletonPoll weights allobservations toimprove sampleselection.
Court-Ordered School Finance Equalization
105
[Table 3] showsthat economicrationality heavilyinfluencedattitudes towardsthe QEA.
3. Racial Geography
Using a racial self-identification variable, Icollapse all non-Caucasian values into a “non-white”value, yielding a dichotomous white/non-whitevariable (RACE). For the geographic residence of therespondent, I employ the Eagleton’s classification ofmunicipalities into four varieties: center city, city andold suburb, new suburb, and rural, yielding apolytomous variable (TYPE). These two variablescomprise the racial geography model.
Attitudes Towards the Quality Education Act of1990
1. Attitudes of All Respondents
Table 3 shows the results of a logistic regressionon the approval/disapproval re-sponses using the three modelsdescribed above, for all respon-dents.13 This table shows thateconomic rationality heavilyinfluenced attitudes towards theQEA. Only two independentvariables—perceived loss or gain ofaid to one’s district and the per-ceived effect of the QEA on one’slocal property tax rates—aresignificant above 0.05; anti-taxsentiment and ideology do notappear to be significant.
But what is the magnitude ofthese relationships? In order to discern this, we needto look at the right hand side of table 3. A logistic
regression requires a further interpretative stepbecause the parameter estimate B is not equivalent toa regression coefficient. It represents, instead, thechange in the log of the odds ratio of approving ordisapproving the QEA, given a per unit increase ofeach particular independent variable. From thismeasure, however, we can calculate the probabilitythat an individual will approve or disapprove of QEA,holding the values of the other independent variablesconstant at their means. This calculation for eachvariable is shown in the “Change in Probability”column of table 3.14
Upon examination, the change in probabilitycolumn of table 3 shows that the magnitude of theeffect of these two significant variables is rather large:a perception that one’s property taxes will rise resultsin a 25 point drop in support for the QEA.15 Simi-
larly, a perception that the localschool district will receive reducedstate aid lowers one’s approval ratingby 15 points. Thus, we can say withreasonable assurance that economicrationality appears to most heavilyinfluence the attitudes towards theQEA among all respondents.
2. Attitudes of Parents ofPublic School Children
It is important to be aware thatall sub-groups might not regard theQEA with the same attitudes as thesample as a whole. Parents of
school-age children, for example, might view thematter differently than non-parents or retired NewJerseyans. The section asks whether parents ofschool-age children make a calculation of economicself-interest when they evaluate the desirability of theQEA. The data shown in table 4 indicates that raceand the type of municipality the respondent lives inare far more reliable predictors of support or opposi-tion to the QEA than is economic rationality. Amongparents of children enrolled in public schools, the raceand the municipality of the respondent are the only
13 For a brief and useful discussion of logistic regression techniques seeAldrich and Nelson (1984).
14 This table and calculations follow the "first differences" formulasrecommended by King (1989), pp. 107-108.
15 The dependent variable was coded one for approval, two for disap-proval; a positive parameter estimate, then, means a greater propensityto disapprove of the QEA.

Developments in School Finance, 1996
106
Table 3.—Logistic regression of support for the Quality Education Act, all respondents, 1990
Parameter Change in X Change in prob.Variable est. (B) S.E. Estimates/S.E. (from, to) of sig. variables
Race 0.0869 0.2669 0.33Central city resident 0.5022 0.2982 1.68Perceived effect oftax package 0.3346 0.2609 1.28Perceived loss orgain of school aidin local district** 0.6586 0.2551 2.93 (1,2) -0.15Perceived effect ofQEA on local propertytax rates* 0.5128 0.2167 2.37 (1,3) -0.25Income 0.0535 0.1041 0.51Accept an increase andexpansion of sales tax 0.1440 0.2492 0.58Accept an increase andexpansion of income tax 0.3000 0.2431 1.23Ideology 0.1521 0.1115 1.36Constant*** -4.6942 0.8870 -5.29
N=439. Proportion predicted correctly = 68.54%. Distribution of dependent variable: Approve = 36.85%; Disapprove = 63.15%.
* Significant at >0.05.
** Significant at >0.005.
*** Significant at >0.0001.
NOTE: Change in probability of significant variables is the change in the probability that a respondent will approve of the
Quality Education Act given the change in the independent variable that is specified in the change in X column, holding all the
other independent variables constant at their means. See text for coding required to interpret change in X values.
SOURCE: Star Ledger/Eagleton Poll, July 1990 (Poll #: EP 79-4). Conducted by the Eagleton Institute, Rutgers University.

Court-Ordered School Finance Equalization
107
statistically significant variables—even when they arecontrolled for income, perceived loss or gain of stateaid, ideology, and the perceived effect on propertytaxes, among other factors. The result is that a whiteparent of a child enrolled in public schools is 31points less likely to approve of the QEA than a non-white, when all other independent values are heldconstant at their means. Ideology also has a signifi-cant influence on parental attitudes toward the QEA,but it is less pronounced than either race or geo-graphic location of the city. As one moves fromliberal, to moderate, to conservative (from 1 to 3), thelikelihood of supporting the QEA drops 19 percent-age points. Thus, although ideology meaningfully
influences parental attitudes toward the QEA, race isclearly a more influential factor. And, surprisingly,economic self-interest plays virtually no role at all.Among parents of school age children, economicconcerns do not divide them, but ideology and geogra-phy do.
It is of interest to note that the municipality ofrespondent runs counter to the hypothesized trend:The probability difference between a respondent wholives in the inner city and one who lives in the suburbsis 23 percentage points (again, all other values heldconstant at their means.) But the direction is positive.That is, from this analysis one could conclude that
Table 4.—Logistic regression of support for the Quality Education Act, parents of children enrolled in publicschools, 1990
Parameter Change in X Change in prob.Variable est. (B) S.E. Estimates/S.E. (from, to) of sig. variables
Race** 1.3503 0.5097 2.65 (1,2) -0.31Central city resident* -1.3254 0.6664 -1.99 (1,2) 0.23Perceived effect oftax package 0.0689 0.5611 0.12Perceived loss orgain of school aidin local district 0.4578 0.5063 0.90Perceived effect ofQEA on local propertytax rates -0.2480 0.4549 -0.55Income -0.0420 0.2259 -0.19Accept an increase andexpansion of sales tax 0.6571 0.5068 1.30Accept an increase andexpansion of income tax -0.2205 0.4960 -0.44Ideology* 0.4497 0.2267 1.98 (1,3) -0.19Constant -0.7730 1.7185 -0.45
N=116. Proportion predicted correctly = 70.99%. Distribution of dependent variable: Approve = 33.59%; Disapprove = 66.41%.
* Significant at <0.05. ** Significant at <0.01.
NOTE: Change in probability of significant variables is the change in the probability that a respondent will approve of the
Quality Education Act given the change in the independent variable that is specified in the change in X column, holding all the
other independent variables constant at their means. See text for coding required to interpret change in X values.
SOURCE: Star Ledger/Eagleton Poll, July 1990 (Poll #: EP 79-4). Conducted by the Eagleton Institute, Rutgers University.

Developments in School Finance, 1996
108
Table 5 is acrosstabulationof the approvaland disapprovalrates acrossmunicipalitytypes for whiteparents ofchildren enrolledin public schools.
suburbanites are more in favor of the program thaninner city residents. But we need to examine thesepatterns more carefully to fully understand therelationship. Table 5 is a crosstabulation of theapproval and disapproval rates across municipalitytypes for white parents of children enrolled in publicschools. Table 5 also shows the same for non-whiteparents.
Whites are almost uniformly opposed to theQEA—at weighted rates ranging from 94.8 percentopposed in the inner city to about 71 percent opposedin new suburbs. Non-whites, in contrast, show amore varied response. Non-whites in the inner cityfavor the QEA by weighted rates of about 65 percentto 35 percent. Non-whites in the older suburbs, incontrast, oppose the QEA by rates similar to whites,78 percent to 22 percent. But non-whites in the newersuburbs favor the law at rates of about68 percent to 32 percent. The consis-tency of white opposition and thevariability of black support acrossmunicipality types renders the relation-ship between municipality type andsupport for the QEA non-linear. Thisnon-linearity produces misleadingresults because logistic regressionassumes linear relationships. Thus, ifwe were to interpret the logisticregression equation alone, we wouldcome to a somewhat erroneous conclu-sion that living in the newer suburbswould lead to greater support for theQEA. Perhaps a better way to explainthe relationship is to say that whites in the newersuburbs are less opposed than whites in the inner city.
Two elements of this analysis merit furtherdiscussion: 1) intense white parents' opposition to theQEA in the inner city; and 2) non-white parents'opposition in the older suburbs. Whites whosechildren attend public schools and who live in theinner city oppose the QEA by a ratio of about nine toone. This finding is remarkable because the QEA wasdesigned to improve inner city education. At least
three possible explanations exist for this counter-intuitive finding. First, whites may feel disenfran-chised in cities with large minority populations andfeel that additional funds will aid minority childrenrather than white children. Second, whites may feelthat the money would be wasted in the inner cityschools, despite the fact that their children wouldreceive at least some benefit. Third, whites in theinner city may simply be racists, opposing a programthat will benefit them because it will also benefitminorities. Whatever the explanation, the pronouncedracial division within a group most likely to directlybenefit from the QEA—inner-city parents of childrenenrolled in public schools—combined with theeconomic irrationality of white inner-city oppositionleads me to conclude that race was an implicit factorin opposing the QEA for some important segments ofNew Jersey's population.
A second finding requiresfurther explanation: the oppositionof non-whites in older suburbs,among parents of children enrolledin public schools. Here, whitesand non-whites express similaropposition to the QEA. But non-whites in both newer suburbs andin central cities largely endorse theplan. Why do non-whites in oldersuburbs view the matter differ-ently? One possible explanationmay be that non-whites moved tothese older suburbs—most likelyfrom the central cities—because
the educational opportunities were greater for theirchildren there. They may feel, as a result, that theinner city schools are not worth the money, havinghad a direct experience with them.
Whatever the emphasis we place on the matter,this finding indicates that racial cleavages are notuniform—simply bifurcating suburb from inner city,rich from poor. Rather, race works multivalently inNew Jersey educational politics, at times salient, attimes not.

Court-Ordered School Finance Equalization
109
Table 5.—Quality Education Act approval rates among parents of children enrolled in public schools, by raceand municipality type, 1990
Race and Center City and Newattitude city old suburb suburb Rural Overall
White parents
Percent approve 5.2 28.2 29.2 25.3 26.6(N) (1) (7) (22) (5) (35)
Percent disapprove 94.8 71.8 70.8 74.7 73.4(N) (9) (18) (53) (15) (95)
Totals 100.0 100.0 100.0 100.0 100.0(N) (10) (25) (75) (20) (130)
Non-white parents
Percent approve 64.5 22.3 68.4 50.0 52.2(N) (13) (4) (11) (1) (29)
Percent disapprove 35.5 77.7 31.6 50.0 47.8(N) (7) (13) (5) (1) (26)
Totals 100.0 100.0 100.0 100.0 100.0(N) (20) (17) (16) (2) (55)
NOTE: Percentages are weighted slightly to adjust for sampling error.SOURCE: Star Ledger/Eagleton Poll, July 1990 (Poll#: EP 79-4). Conducted by the Eagleton Institute, Rutgers University.
Municipal classifications assigned by the Eagleton Institute.
This quantitative analysis of public opiniontowards the Quality Education Act of 1990 is illumi-nating for a number of reasons. First, we can say thatfor the population at large, race has little to do withsupport for the QEA. Instead, pocketbook consider-ations of how the program will affect individual taxesand how it will affect the aid to one’s local districtlargely determine attitudes of the population at large.In contrast, the attitudes of parents of childrenenrolled in public schools towards the QEA are lessinfluenced by economic self-interest concerns, butmore influenced by their race. Indeed, race is the
strongest determinant of their parents support for oropposition to the QEA. But that racial cleavage issomewhat fluid—intersecting with geography andclass in ways that sometimes align minorities andwhites but usually divide them.
Texas Public Opinion, School Finance, andProposition One
In Texas, the concerns of race and class areremarkably similar. After the Texas Supreme Courtruled the existing financing system unconstitutional in

Developments in School Finance, 1996
110
A poll conducted bythe University ofHouston Center forPublic Policy...showed that 37percent of surveyrespondents opposedProposition One, 29percent supported it,and a whopping 34percent wereundecided.
1989, the legislature adopted a modest reform. Thisprogram, too, was struck down by the SupremeCourt. The legislature then passed a constitutionalamendment that would allow the state to recapturelocal property taxes. This reform required, however,majority approval at the polls. Most observersthought securing a victory for the amendment (dubbedby opponents the “Robin Hood” plan) would be adifficult, but not impossible task. A poll conductedby the University of Houston Center for Public Policya month before the May 1, 1993 referendum showedthat 37 percent of survey respondents opposedProposition One, 29 percent supported it, and awhopping 34 percent were undecided.16 Another poll,conducted by Mason-Dixon Political-Media Research,Inc. for the El Paso Times showed that 53 percentfavored the amendment and only 27 percent wereunopposed. The remaining 20 percent were unde-cided.17
The polls, however, werewrong. Proposition One suffered ahuge defeat, losing 63 percent to 27percent. Proposition One detractorscontended before the election thatthe opposition was largely con-cerned with increasing taxes and afailing educational system. Indeed,Tom Pauken, leader of the majoropposition group Texans AgainstRobin Hood Taxes, explicitlyplayed on taxation fears: Proposi-tion One “is a back-door tax
increase, it has nothing to do with education,” Paukentold a Houston Chronicle reporter. As Pauken statedbefore the election, “If we make this a tax issue, thenwe win. If Ann Richards is able to make it an educa-tion issue, she wins.”18
Answering the question of what determined theoutcome of the Proposition One election is essential ifwe are to understand how courts can be effective inthe realm of school finance reform. As we try tolocate the sources of popular opposition to court-ordered school finance reform, it would be useful toexamine the reasons why large numbers of Texansvoted against Proposition One. Ideally, we wouldexamine statewide exit polls to determine explicit orimplicit reasons voters had for casting their ballots.Unfortunately, no such exit polls exist. As a result,we have no state-wide individual level voter surveysthat would enable us to precisely identify the sources
of opposition to Proposition One onMay 1, 1993.19
What we do have, however, aredemographic data and electionreturns from 150 state representativedistricts. In this section, I analyzethese data to determine some of thedemographic characteristics ofdistricts that opposed PropositionOne. To be sure, uncovering thedemographic characteristics of thoseregions that voted no on PropositionOne is not the same as determiningthe reasons why people who live inthose regions voted no. But in the
absence of statewide individual level exit polls, I haveno recourse but to rely on demographic data touncover patterns in the opposition to the schoolfinance equalization referendum. To the extent thatsuch patterns exist, they will serve, for my purposes,as explanations of opposition.
16 See Rugeley (1993). The poll surveyed 790 individuals and had amargin of error of plus or minus four points.
17 See Associated Press (1993). The Mason-Dixon poll surveyed 819likely voters and had a margin of error of plus or minus 3.5 points.
18 See Rugeley and Markley (1993).
19 Professor Kent Tedin of the University of Houston has conductedsurveys of Houston-area residents to determine their support for schoolfinance equalization. Although I cannot fully compare our analyseshere, I should note that we reach similar conclusions through differentroutes.

Court-Ordered School Finance Equalization
111
1. Operationalizing the Models in Texas
Demographic data on each of Texas’s 150House of Representative districts was obtained fromthe Texas Legislative Council, which is responsiblefor providing the state legislature with appropriateinformation for reapportionment. These breakdownswere, in turn, based on the United States CensusBureau data gathered in the 1990 census. Electionreturns for each of the precincts in Texas from theMay 1, 1993 constitutional amendment referendumand the June 1, 1993 U.S. Senate run-off electionbetween Kay Bailey Hutchison and Robert Kreugerwere also obtained from the Texas Legislative Counciland were aggregated into 150 district totals. Ideally,we would want to regress the election returns fromeach precinct in Texas against the demographic datafor that precinct. This fine-grained analysis wouldcome closer to an individual level survey, and wouldprovide several thousand more datapoints. Unfortunately, demographicdata is not available from the TexasLegislative Council at the precinctlevel. As a result, the election returnswere aggregated to state representa-tive districts.
The models used in the Texasanalysis are similar to those used inNew Jersey. Like the New Jerseyrespondents to the Eagleton Institute’spoll, Texas voters may have beeninfluenced by arguments of economicself-interest—perceptions that theywould have to pay for greater school equity. Demo-graphic data, alone, however, cannot tell us whetherindividuals perceive a tax increase as imminent in thewake of the reform. (In New Jersey, this data wasincluded in the polling results.) Instead, we must relyon measures of class—on the theory that higherincomes would be more likely to pay for equaliza-tion—and on measures of exposure to property taxes,i.e., rates of home ownership. These two variables—per capita income of the state representative district
and percent of housing units that are owner-occu-pied—constitute the economic self-interest model ofopposition to Proposition One. The theory here is thatthose most likely to pay for the costs of equaliza-tion—homeowners and those in higher incomebrackets—would be opposed. Thus, we would expectdistricts with high percentages of owner-occupiedhousing units and with high income levels to votemore heavily against Proposition One.
The second model is ideology and/or partyidentification. Here, we would expect liberals andDemocrats to more heavily favor school financeequalization. In the Texas voting data, however, wedo not have a measure of ideology for each district.There are, however, two sources for the party identifi-cation variable: 1) the percentage of votes won byRepublican Kay Bailey Hutchison over DemocratRobert Krueger in the run-off election a month after
the Proposition One election or 2)the party of the district representa-tive to the Texas State Assembly.Both are used in the analysisbelow.
The third model is one basedon racial politics. Here, blacks andHispanics see themselves (orconversely, whites see racial orethnic minorities) as the primarybeneficiaries of school financereform and, thus, are more likely tovote in favor of it. (Conversely,whites would be more likely to vote
against it.) Thus, we would expect districts with highpercentages of blacks and/or Hispanics to vote morein favor of Proposition One. Because Hispanics canbe of any race, I have subtracted from the totalnumber of blacks in each district those Hispanics whoidentified themselves as blacks. The result produces,in effect, the number of non-Hispanic blacks within adistrict.
...two variables—percapita income of thestate representativedistrict and percent ofhousing units that areowner-occcupied—constitute theeconomic self-interestmodel of opposition toProposition One.
Developments in School Finance, 1996
112
One further note: A variable to control for anurban-rural split (percentage of district residents thatreside in an urban area) is included here because ofthe geographic isolation of blacks in urban areas.Hispanics in Texas live in both rural and urban areas.
2. Texas Findings
The data was analyzed using SPSS for Windowsand an ordinary least squares regression technique.Because reapportionment requires districts to beroughly equal in size, the districts were not weightedfor population. The results of the OLS are presentedin table 6.
From table 6 we see that Per Capita Income,Percentage of Non-Hispanic Blacks, and Percentageof Hispanics all have a significant and fairly sizeablerelationship to the percentage of no votes on Proposi-tion One, with higher incomes relatedto a higher percentage of no votes andhigher percentages of blacks andHispanics related to lower percentagesof no votes. Of these three, the tworacial categories show the strongestcontributions to the percentage of novotes in a district. Surprisingly, theparty of the district representative (arough measure of the party leanings ofthe district) is not a significantpredictor of no votes, if we rely on theconventional 0.05 threshold. Also, thepercentage of home ownership in adistrict and the percentage of urbanresidents in the district do not show astatistically significant relationship to the dependentvariable. Overall, the model shows a healthy 0.63adjusted R, demonstrating a reasonably good fit.
There are some shortcomings to this analysis.First, the measure of party identification does notcapture the difference between those districts wherethe parties are competitive and those where partyidentification is more one-sided. In an effort toemploy a more nuanced sense of party strength, I also
ran the regression omitting the dummy party variableand replacing it with the percentage of votes receivedby U.S. Senate Candidate Republican Kay BaileyHutchison in the special run-off election againstDemocrat Robert Krueger, held a month after theProposition One election. A continuous variable, thismeasure enables me to capture the degree of partystrength in a way that is impossible with the dichoto-mous state representative party identification. Ofcourse, factors other than party strength—such ascandidate-specific factors, the economy, etc.—mayplay a significant role in the level of support thatHutchinson received. In this respect, this measuremay overstate Republican support within traditionallyDemocratic Texas. The results of this second regres-sion are shown in table 7.
Three significant changes emerge from thischange in the party identification variable. First,
degree of support for Kay BaileyHutchison is a much strongerpredictor of opposition to Proposi-tion One than the party identifica-tion of the state district representa-tive. Part of this is due, no doubt,to the fact that support forHutchison is registered continu-ously, and thus more reliably tracksopposition to Proposition One thanthe dichotomous Republican/Democrat distinction of the firstparty identification variable.Nonetheless, it is clear that supportfor Hutchison is a better predictorof opposition to school finance
equalization than the party affiliation of the districtrepresentative. (For one thing, the R of the entireregression equation improves substantially when wereplace the state representative’s party withHutchison’s vote percentage.) That fact begs thequestion, however, of why Hutchison supportersoppose school finance equalization. To answer this, itmay be more instructive to view the percentage ofvotes Hutchison received less as a strength of partyidentification and more as an indicator of the ideologi-
...Per Capita Income,Percentage of Non-Hispanic Blacks, andPercentage ofHispanics all have asignificant and fairlysizeable relationshipto the percentage ofno votes onProposition One,.. .

Court-Ordered School Finance Equalization
113
Table 6.—Municipal regression of percent of no votes on Proposition One in 150 Texas house districts, withdichotomous party variable
Independent variables B S.E. B Beta T-score
Per capita income* 6.033-6 2.433-6 0.202 2.479Party representative -0.039 0.023 -0.124 -1.700Percent of non-Hispanic blacks* -0.302 0.077 -0.286 -3.912Percent of Hispanics* -0.360 0.054 -0.590 -6.726Percent of housing owner-occ. -0.002 0.086 -0.001 -0.020Percent of urban residents -0.029 0.054 -0.044 -0.542Constant 0.699 0.094 7.547
* p<0.05.
NOTE: Multiple R = 0.805, R2 = 0.648, Adjusted R2 = 0.633, and standard error = 0.093. Numbers are multiplied by 10 to the
negative X, i.e., 6.033-6 = 6.033 X 10-6 = 000006.033.
SOURCE: Texas Legislative Council. 1994.
Table 7.—Municipal regression of percent of no votes on Proposition One in 150 Texas house districts, withcontinuous party variable
Independent variables B S.E. B Beta T-score
Per capita income 2.032-6 2.031-6 0.068 1.000Percent of vote for Hutchison* 0.725 0.085 0.692 8.572Percent of non-Hispanic blacks 0.059 0.075 0.056 0.790Percent of Hispanics* -0.167 0.049 -0.273 -3.424Percent of housing owner-occ. -0.139 0.072 -0.109 -1.924Percent of urban residents -0.009 0.041 -0.013 -0.210Constant 0.235 0.085 2.766
* p<0.05.
NOTE: Multiple R = 0.873, R2 = 0.763, Adjusted R2 = 0.753, and standard error = 0.076. Numbers are multiplied by 10 to the
negative X, i.e., 2.032-6 = 2.032 X 10-6 = 000002.032.
SOURCE: Texas Legislative Counsel. 1994.

Developments in School Finance, 1996
114
...analysis shows thatracial and sometimesclass or ideologicalcleavages divide thesupporters anddetractors of schoolfinance equalization.
cal leanings of the district. In this light, the meaningof Hutchison’s candidacy is that it registers a clusterof conservative ideological values. And from theregression it is clear that those values—whatever theirconstituent components—have a very high degree ofsalience to the school finance equalization debate.
Second, class, as measured by per capitaincome, no longer has a significant relationship to thequestion of school finance equalization, when weconsider the degree of support within the district forHutchison. Although there is some degree of col-linearity between income and support for Hutchison(the simple r between the two is 0.591), it is clear thatideological/party support for Hutchison is moreimportant than income in determining opposition toProposition One. It is not the affluent, per se, who areopposed, but conservatives/Republicans who vote forHutchison who are opposed toProposition One.
A third significant changeproduced by the shift from the staterepresentatives party affiliation tothe percentage of votes won byHutchison is a change in the relativeimportant of race and ethnicity. Thepercentage of non-Hispanic blackswithin a district is no longer asizeable or significant predictor ofopposition or support of PropositionOne. In addition, the percentage ofHispanics within the district slipsfrom being the largest to the secondlargest factor in predicting supportfor Proposition One. It is unclear why the importanceof the percentage of non-Hispanic blacks woulddiminish so dramatically with the substitution ofHutchison’s vote percentage for the party affiliation ofthe state representative. Perhaps the best explanationfor the reduced salience of race is that the Hutchisonvote percentage is such a good predictor of oppositionto Proposition One that there is little variance “leftover” for the remaining variables to absorb. Never-theless, the percentage of Hispanic residents within a
district is still a very strong and reliable predictor ofsupport for Proposition One. Thus, even though theclass and party variables are more fickle, the ethniccleavage of Hispanics versus non-Hispanics is anenduring one. With both regressions, racial or ethnicvariables are always better and more significantpredictors of opposition or support of Proposition Onethan is income.
3. Implications of Texas Findings
In short, this analysis shows that racial andsometimes class or ideological cleavages divide thesupporters and detractors of school finance equaliza-tion. The class and ideological divisions are to beexpected, but it somewhat surprising to find suchstrong racial divisions within the electorate over thisissue. Within the political and legislative debate over
school finance, race or ethnicity wasnot directly broached as the underly-ing conflict; from a reading of thenewspapers, one could not discern aracial conflict. Instead, the issuewas usually debated in terms ofburdensome taxes on the middleclass, or a wasteful, inefficienteducational establishment. Whilethose issues may be have been salientand persuasive to a number ofindividuals, in the aggregate, blacksand Hispanics in Texas view thisissue much differently than whites—even taking into account theirrespective economic and ideologicalpositions. In significant ways,
school finance equalization in Texas is not about taxesand economic issues, but about racial cleavages overeducational opportunities.
Conclusion: What Can Courts DoAbout School Finance?
State supreme courts can have substantiveeffects on the equity of school finance. Figures 1-4illustrate this. Their efforts to do so, however, will

Court-Ordered School Finance Equalization
115
engender equally substantive mass political opposi-tion—some of which will be racially based. Thispublic opposition is in many ways a constant toschool finance reform. As a result, the success orfailure of courts’ efforts to improve the equity ofschool funding in primary and secondary educationdepends ultimately on the capacity of the legislature towithstand this heated political opposition. Courts canact decisively in the face of legislative recalcitrance,by threatening to use injunctions to enforce compli-ance with the courts decrees—and court's have reliedon this threat to ensure passage of politically unpalat-able school finance reforms.20
But other than the negative sanction of a threat-ened school shutdown, there is little a court can do tocompel a legislature to act. Instead, it must rely onthe legislature’s capacity to forge political coalitions
20 The New Jersey Supreme Court allowed an injunction to lie against thedisbursement of state funds for education in July, 1976. The entireschool system shut down. Within nine days, the legislature passed anincome tax in order to remove the injunction. See Lehne (1978) fordetails. Since then, no legislature has endured an injunction althoughother state courts have come perilously close, particularly Texas andConnecticut.
to enact reform legislation. These coalitions ofinterest groups and key legislators are highly suscep-tible to public opinion. Thus, a full account of court’scapacity to alter significantly the equity of schoolfinancing would link public opinion on school financewith interest group pressure on legislators, who mustalso confront supreme court justices with injunctionson their minds. Although it is beyond the scope ofthis paper to provide such links, further examinationsinto the relative strengths and weaknesses of statesupreme courts to accomplish their school financereform goals must engage this interplay of masspublic opinion and interest group coalition building.Courts can achieve impressive results, and they cando so by altering the political calculus legislators andinterests groups must make as they decide to supportmeaningful equalization or oppose it.

Developments in School Finance, 1996
116
List of Cases
Abbott v. Burke, 119 N.J. 287, 575 A.2d 359. 1990. (Abbott II).
Bismark Public School District #1 v. State, 511 N.W. 2d 24. 1994.
Blase v. State, 55 Ill. 2d 94, 302 N.E. 2d 46. 1973.
Board of Education v. Walter, 58 Ohio St. 2d 368, 390 N.E. 2d 813. 1979.
Board of Education Levittown Union Free School District v. Nyquist, 57 N.Y. 2d 127, 439 N.E. 2d359. 1982.
Board of Education of Oklahoma City v. Dowell, 498 U.S. 237. 1991.
Brigham v. State, (Docket No. 96-502), 1997 VT LEXIS 13. 1997.
Britt v. North Carolina State Board of Education, 86 N.C. App 282, 357 S.E. 2d 432 aff'd mem. 320N.C. 790, 361 S.E. 2d 71. 1987.
Buse v. Smith, 74 Wis. 2d 550, 247 N.W. 2d 141. 1976.
City of Pawtucket v. Sundlun, 662 A.2d 40. 1995.
Claremont School District v. Governor, 138 N.H. 183, 635 A.2d 1375. 1993.
Coalition for Adequacy and Fairness in School Funding v. Chiles, 680 So. 2d 400. 1996.
Committee for Educational Rights v. Edgar, 174 Ill. 2d 1, 672 N.E. 2d 1178. 1996.
Danson v. Casey, 484 Pa. 415, 399 A.2d 360. 1979.
DeRolph v. State, (Docket No. 95-2066), Ohio LEXIS 687. 1997.
Dupree v. Alma School District No. 30 of Crawford County, 279 Ark. 340, 651 S.W. 2d 90. 1983.
Edgewood Independent School District v. Kirby, 777 S.W. 2d 391, 33 Tex. Sup. J. 12. 1989.(Edgewood I).
Fair School Finance Council of Oklahoma, Inc. v. State, 746 P.2d 1135. 1987.
Freeman v. Pitts, 503 U.S. 467. 1992.
Gould v. Orr, 244 Neb. 163, 506 N.W. 2d 349. 1993.

Court-Ordered School Finance Equalization
117
Helena Elementary School District No. One v. State of Montana, 236 Mont. 44, 769 P.2d 684. 1989.
Hornbeck v. Somerset County Board of Education, 295 Md. 597, 458 A.2d 758. 1983.
Horton v. Meskill, 172 Conn. 615, 376 A.2d 359. 1977. (Horton I).
Horton v. Meskill, 195 Conn. 24, 486 A.2d 1099. 1985. (Horton III).
Knowles v. State Board of Education, 219 Kan. 271, 547 P.2d 699. 1976.
Kukor v. Grover, 148 Wis. 2d 469, 436 N.W. 2d 568. 1989.
Lujan v. Colorado State Board of Education, 649 P.2d 1005. 1982.
McDaniel v. Thomas, 248 Ga. 632, 285 S.E. 2d 156. 1982.
McDuffy v. Secretary of the Executive Office of Education, 415 Mass 545, 615 N.E. 2d 516. 1993.
Milliken v. Green, 390 Mich. 389; 212 N.W. 2d 711. 1973.
Missouri v. Jenkins, 1995.
Northshore School District No. 417 v. Kinnear, 84 Wash. 2d 685, 530 P.2d 178. 1974.
Olsen v. State ex. rel. Johnson, 276 Ore. 9, 554 P.2d 139. 1976.
Pauley v. Kelly, 162 W.Va. 672, 255 S.E. 2d 859. 1979.
Richland County v. Campbell, 294 S.C. 346 S.E. 2d 470. 1988.
Robinson v. Cahill, 62 N.J. 473, 303 A.2d 273. 1973. (Robinson I).
Roosevelt Elementary School District No. 66 v. Bishop, 179 Ariz. 233, P. 2d 806. 1994.
Rose v. Council for Better Education, 790 S.W. 2d 186. 1989.
San Antonio Independent School District v. Rodriguez, 411 U.S. 1. 1973.
School Administrative District No. 1 v. Commissioner, Department of Education, 659 A.2d 854. 1995.
Seattle School District No. 1 v. State of Washington, 90 Wash. 2d 476, 585 P.2d 71. 1978.
Serrano v. Priest, 5 Cal. 3d 584, 487 P.2d 1241. 1971. (Serrano I).
Serrano v. Priest, 18 Cal. 3d 728, 557 P.2d 929. 1976. (Serrano II).

Developments in School Finance, 1996
118
Shofstall v. Hollins, 110 Ariz. 88, 515 P.2d 590. 1973.
Skeen v. State, 505 N.W. 2d 299. 1993.
State ex. rel. Woodahl v. Straub, 161 Mont. 141, 520 P.2d 776. 1974.
Tennessee Small School Systems v. McWherter, S.C. No. 01-S01-9209-CH-00101. 1993.
Thompson v. Engelking, 96 Idaho 793, 537 P.2d 635. 1975.
Unified School District No. 229 v. State, 256 Kan. 233. 1994.
Washakie County School District No. 1 v. Herschler, 606 P.2d 310. 1980.
References
Aldrich, J. H., and F. D. Nelson. 1984. Linear Probability, Logit and Probit Models. Sage UniversityPaper series on Quantitative Applications in the Social Sciences. No. 07-045. ed. Michael S. Lewis-Beck. Beverly Hills and London: Sage Publications.
Associated Press. April, 1993. "Backers of School Proposal Face a Tough Sale, Poll Finds." DallasMorning New. 26A.
Banks, J. 1992. "State Constitutional Analyses of Public School Finance Reform Cases: Myth or Meth-odology?" Vanderbilt Law Review. 45(1): 129-160.
Berne, R., and L. Stiefel. 1984. The Measurement of Equity in School Finance. Baltimore, MD: TheJohns Hopkins University Press.
Bogart, W. T., and P. M. Vandoren. 1993. "Do Legislatures Vote Their Constituents' Wallets? (And HowWould We Know If They Did?)." Southern Economic Journal. 60(2): 357-375.
Brennan, W. J., Jr. 1977. "State Constitutions and the Protection of Individual Rights." Harvard LawReview. 90(3): 489-504.
Campbell, C. D., and W. A. Fischel. 1996. "Preferences for School Finance Systems: Voters VersusJudges." National Tax Journal. 49(1): 1-15.
Edsall, T. B., and M. D. Edsall. 1992. Chain Reaction. New York: W.W. Norton & Co.
Gardner, J. A. 1992. "The Failed Discourse of State Constitutionalism." Michigan Law Review. 90(4):761-837.

Court-Ordered School Finance Equalization
119
Goertz, M. E. 1979. Money and Education: How Far Have We Come? Princeton, NJ: EducationPolicy Research Institute, Educational Testing Service.
Goertz, M. E. 1983. "School Finance in New Jersey: A Decade After Robinson v. Cahill." Journal ofEducation Finance. 8(4): 475-489.
Hickrod, G. A. et al. 1992. "The Effect of Constitutional Litigation on Education Finance: A PreliminaryAnalysis." Journal of Education Finance. 18(2): 180-210.
Howard, A. E. 1976. "State Courts and Constitutional Rights in the Day of the Burger Court." VirginiaLaw Review. 62(5): 873-944.
Johnson, A. B. 1979. "State Court Intervention in School Finance Reform." Cleveland State LawReview. 28(3): 325-372.
King, G. 1989. Unifying Political Methodology: The Likelihood Theory of Statistical Inference.Cambridge: Cambridge University Press. pp. 107-108.
Lehne, R. 1978. The Quest for Justice. New York: Longman. pp. 156-163.
Mintrom, M. 1993. "Why Efforts to Equalize School Funding Have Failed: Towards a Positive Theory."Political Research Quarterly. 46(4): 847-862.
Pollock, S. G. 1985. "Adequate and Independent State Grounds as a Means of Balancing the Relation-ship Between State and Federal Courts." Texas Law Review. 63(6,7): 977-993.
Rae, D., D. Yates, J. Hochschild, J. Morone, and C. Fessler. 1981. Equalities. Cambridge, MA:Harvard University Press.
Rugeley, C., and M. Markley. April, 1993. "School Finance Foes Wage Low-Budget War." HoustonChronicle. A1.
Rugeley, C. April, 1993. "Robin Hood Not Greeted Merrily." Houston Chronicle. A1.
Star Ledger/Eagleton Poll. 1990. New School Funding Plan Gets Low Grades. Eagleton Institute ofPolitics. Poll SL/EP 29-4 (EP 79-4).
Tarr, G. A. and M. C. Porter. 1988. State Supreme Courts in State and Nation. New Haven: YaleUniversity Press.
Thro, W. E. 1989. "Note: To Render Them Safe: The Analysis of State Constitutional Provisions inPublic School Finance Reform Litigation." Virginia Law Review. 75(8): 1639-1679.
Thro, W. E. 1990. "The Third Wave: The Impact of Montana, Kentucky, and Texas Decisions on theFuture of Public School Finance Reform Litigation." Journal of Law & Education. 19(2): 219-250.

Developments in School Finance, 1996
120
Williams, R. F. 1985. "Equality Guarantees in State Constitutional Law." Texas Law Review. 63(6,7):1195- 1224.
Williams, R. F. 1992. "Forward: The Importance of an Independent State Constitutional Equality Doctrinein School Finance Cases and Beyond." Connecticut Law Review. 24(3): 675-702.