Embed Size (px)
Citation preview

BA P P END I X
Market Study, Economic Impact Analysis, and Public Fiscal Assessment of the Proposed Hawaiian
Memorial Park Expansion Project – July 2018Prepared by: CBRE

MARKET STUDY, ECONOMIC IMPACT ANALYSIS, AND PUBLIC FISCAL ASSESSMENT OF THE PROPOSED HAWAIIAN MEMORIAL PARK EXPANSION PROJECT 45-425 Kamehameha Highway Kaneohe, Hawaii 96761 CBRE, Inc. File No. 17-251LA-3048-2
Scott Ezer HHF PLANNERS 733 Bishop St, Suite 2590 Honolulu, Hawaii 96813
www.cbre.com/valuation

VALUATION & ADVISORY SERVICES
1003 Bishop Street, Suite 1800 Honolulu, HI 96813
T 808-521-1200 F 808-541-5155
www.cbre.com
July 25, 2018 Scott Ezer, Principal-in-Charge Vice President HELBER, HASTERT & FEE, PLANNERS, Inc. Pacific Guardian Center, Makai Tower 733 Bishop Street, Suite 2590 Honolulu, Hawaii 96813 RE: Market and Econometric Studies of the
Proposed Hawaiian Memorial Park Expansion 45-425 Kamehameha Highway
Kaneohe, Hawaii 96744 CBRE, Inc. File No. 17-251LA-3620 Dear Mr. Ezer:
At your request, we have completed a series of market and econometric analyses associated with the proposed Hawaiian Memorial Park (HMP) expansion, a 53.45-acre project intended to supplement the existing 80-acre facility located makai of Kamehameha Highway at the southerly edge of the Kaneohe community, Oahu, Hawaii, approximately 10 miles east of Downtown Honolulu. The land uses and approximate acreages are summarized below.
HMP, opened in 1958 on a panoramic site overlooking Kaneohe Bay and the Koolau Pali, has some 79,200 total burial plots, of which more than 73,000 have been sold with more than 41,000 burials to date. The goal of the expansion is to provide continuing interment opportunities for the families of those in the original phases and other Oahu residents in a desirable, central and easily
Land UseApproximate
Acreage
Cemetery Expansion Area 28.20
Internal Roadways 3.00
Cultural Preserve 14.50
Open Space Areas 7.75
Total 53.45
PROPOSED HMP EXPANSION LAND USES AND ACREAGES
Source: Hawaiian Memorial Park Expansion Project Environmental Impact Statement, page 2-4

Scott Ezer, Principal-in-Charge July 25, 2018 Page 3
ii
accessible location within a well-maintained cemetery. The proposed project is expected to have space for an additional 28,000 to 30,000 burials.
The project area is part of a larger parcel comprising 164.42 acres and identified on State of Hawaii tax maps as First Division, 4-5-3, Parcel 1, and containing the existing “Ocean View Garden” section of the memorial park (7.9 acres) and 103.07-acres of open space. The petition area terrain is gently to moderately sloping, with small gulches, and range in elevation from some 200 feet to 420 feet above sea level.
The expansion project is located east of the existing HMP facility and will be connected by internal roadways. Infrastructure is forecast to be completed in 2020 with plot sales and interments commencing in 2021.
The petition area is currently within the “Conservation District” on State of Hawaii Land Use Maps and will require reclassification to the “Urban District. The petition area will ultimately be reclassified to “P-2- Preservation District” for City and County of Honolulu zoning purposes. It is outside the Special Management Area.
The purpose of this study is to determine if there is a need within the Oahu market for additional burial opportunities beyond the existing and proposed supply at other locations, and to quantify the economic and fiscal impacts to the island and State resulting from its development.
Our study is primarily comprised of three elements:
1. Market Study. To ascertain whether there will exist sufficient demand in the Oahu burial/interment “market” to successfully absorb the finished HMP inventory in a timely manner given its characteristics and those of competing in-place and proposed cemetery development.
2. Economic Impact Analysis. To estimate the general and specific effects on the local economy which will result from the expansion of HMP, including capital investment, construction and on-going maintenance employment, worker wages, and other regional monetary and employment effects.
3. Public Cost/Benefit Assessment. To quantify the impact on the public purse arising from the subject project in new tax/fee revenues received versus any new costs which will be borne by the State of Hawaii and Honolulu County due to the project's actualization.
Pertinent results are presented in the following report, which opens with an Executive Summary describing our salient conclusions. The remainder of the report is comprised of a series of brief discussion and introduction of addenda exhibits containing the tabular presentation of data, analysis, and modeling for each aspect of the assignment.
The purpose of study was to provide current market data, subject product absorption estimates, economic and fiscal modeling, and an analysis of probable impacts on the Kaneohe/Oahu community resulting from the build-out of the proposed HMP expansion for inclusion in submittals in the on-going entitlement process of the project.
As part of the investigation and analysis we have:
• Inspected the subject property and its environs;

Scott Ezer, Principal-in-Charge July 25, 2018 Page 3
iii
• Reviewed federal, state and county materials, statistics, policies and publications on the burial industry;
• Researched Oahu demographic trends regarding resident population totals, aging, mortality rates, and choice of interment alternatives;
• Completed a study on the Oahu cemetery/memorial park market sector focusing on historic and projected supply of burial spaces, costs, location and other competitive traits.
• Interviewed knowledgeable parties active in the Oahu cemetery/memorial park industry;
• Accessed on-line databases;
• Compiled materials from published and private sources, and our files;
• Assessed the competitiveness of the HMP expansion product within the Oahu market;
• Estimated the probable absorption of the HMP expansion inventory using various methods.
There were no extraordinary or hypothetical assumptions made for this analysis beyond the assumption the HMP Expansion are was entitled and developed as proposed.
All conclusions presented herein are subject to the identified limiting conditions, assumptions, and certification of CBRE, Inc/Hallstrom Team., in addition to any others specifically set forth in the text.
We appreciate the opportunity to be of service to HHF Planners and Hawaiian Memorial Life Plan LTD., regarding this prominent holding and needed project.
Please contact us if further discussion or detail is required. It has been a pleasure to assist you in this assignment. If you have any questions concerning the analysis, or if CBRE can be of further service, please contact us.
Respectfully submitted, CBRE - VALUATION & ADVISORY SERVICES Tom Holliday, CRE, FRICS Director Phone: (808) 541-5120 Fax: (808) 541-5155 Email: [email protected]

Table of Contents
iv
Table of Contents
Table of Contents .............................................................................................................. iv
EXECUTIVE SUMMARY ....................................................................................................... 1
The Subject Property and Proposed HMP Expansion Project ............................................... 13
Neighborhood Environs ................................................................................................... 18
Overview of National Death Services Industry .................................................................. 22
Market Study of the Oahu Cemetery Sector ...................................................................... 24
Appropriateness of the Subject Property for Proposed Use and Absorption Estimates .......... 38
Economic Impacts of the Proposed Development .............................................................. 43
Public Fiscal (Costs/Benefits) from the Proposed Development ........................................... 52
Assumptions and Limiting Conditions ............................................................................... 56
ADDENDA A MARKET STUDY AND ABSORPTION TABLES B ECONOMIC IMPACT ANALYSIS TABLES C PUBLIC FISCAL (COST BENEFIT) ASSESSMENT TABLES

Executive Summary
1
EXECUTIVE SUMMARY INTRODUCTION
Since 1958, Hawaiian Memorial Park (HMP), a privately-owned cemetery has served the resident population of Kaneohe and Oahu, expanding from its initial size of 6 acres to its present extent of 80 acres. It is currently the final resting place for over 41,000 persons, having a potential total of 79,200 burial spaces, with some 73,000 sold to date.
To service the coming generations of those interred at HMP, as well as meet the expanding need for additional burial opportunities on Oahu over the mid to long-term, ownership is pursuing an expansion plan on 53.45 acres (the “petition area”) within a larger 164.42 acre mostly open space larger parcel. As currently envisioned, site work/infrastructure emplacement would be completed in 2020, with sales and interments commencing in 2021.
Cemetery uses will only utilize about 28.2 acres of the Petition Area, with the remainder used for a cultural preserve, open spaces and internal/connector roadways.
In addition to servicing the aspirations of family members and friends to be near those dear to them on an everlasting basis, the HMP expansion site is highly desirable from a market perspective, with:
• Exceptional panoramas stretching for miles along the Koolau Pali, encompassing the hills of Mokapu Peninsula and the waters of Kaneohe Bay.
• Feelings of serenity enhanced by a surrounding buffer of dense rain forest flora and open spaces and insulation from future intruding land uses.
• Gently flowing terrain creating discrete memorial gardens within the larger park. • Excellent exposure and direct access from Kamehameha Highway, and immediately north
of the H-3 Freeway, 1.5 miles north and south, respectively of the Pali and Likelike Highways.
• Proximity to Kaneohe and Kailua, the two largest windward towns, and only ten miles from Downtown Honolulu. It is the closest cemetery to Honolulu with significant numbers of burial spaces available.
• Favorable windward climate which keeps lawns green, forest vibrant, and the air fresh and cool.
The Petition Area is an irregularly shaped “donut hole” in the middle of the larger parcel, northeasterly abutting the existing Ocean View Garden of the HMP. It has a gently to moderately sloping to hilly upslope terrain, with minor bisecting gulches at the base of the Kapaa Quarry hill.
Abutting land uses include the existing HMP to the west/southwest, Kapaa Quarry hill to the south, forested open space to the east/northeast, and the Pikoiloa, Kaumakua Place and Lelehua Place residential subdivisions to the north. Apart from the HMP Expansion project there are no other developments proposed (or likely) in the area.
The Hawaiian Memorial Park Petition Area is currently classified as:
• State Land Use (SLU) - "Conservation District";
• Ko’olau Poko Sustainable Communities Plan – "Cemetery”, included within the “Urban Areas” and “Community Growth” boundaries.

Executive Summary
2
• City & County of Honolulu zoning -"P-1 Restricted Preservation".
The HMP Expansion site has been in the master planning process for a decade. The current design calls for the addition of some 28,000 to 30,000 burial spaces, increasing the capacity of the Park by a maximum of 38 percent.
Assuming sufficient market demand, the HMP Expansion project will transform a vacant acreage holding having no meaningful economic highest and best use potentials and offering no tangible benefits to the community into an asset providing needed future interment opportunities for the expanding, aging Oahu resident population, spurring capital investment and economic activity, sustaining regional employment, and generating new tax dollars at nominal costs.
The CBRE/Hallstrom Team assignment was to analyze the proposed HMP Expansion project from a real estate market perspective and to identify and quantify probable market and economic impacts associated with the development considering competitive, regional, prevailing and forecast trends to answer four basic study questions:
1. Is there sufficient demand to absorb the up to 30,000 burial spaces of the subject project during a reasonable exposure period given competing product and projected Oahu demographic and market sector trends?
2. Will the subject project be an appropriate use of the underlying site relative to market needs, desirability, standard land planning objectives, accepted design characteristics, and the area environs?
3. What will be the general/specific and direct/indirect economic impacts on Oahu resulting from the undertaking of the subject development via capital investment, employment, wages, business operations, and other economic activity related to the real property asset?
4. What will be the net, new effect on the state and county "public purse" from the project in in the form of increased tax/fee receipts versus additional costs?
These issues were addressed through a comprehensive research and inquiry process utilizing data from market investigation, governmental agencies, various Hawaii-based media, industry spokespersons/sources, on-line databases, published public and private documents, and our files.
The pertinent results of our study are highlighted in the following summary report which contains minimal narrative, focusing on tabular data and other materials contributing to our conclusions. The presentation is divided into eight sections:
1. Primary Study Conclusions
2. The Subject Property and Proposed EMP Expansion Project
3. Regional Environs – Kaneohe
4. Overview of the Death Service Industry
5. Market Study of the Oahu Cemetery Sector
6. Appropriateness of the Subject Project for the Proposed Use and Absorption Estimates
7. Analysis of the Economic Impacts of the Proposed Development
8. Assessment of the Net, New Public Fiscal Benefits Associated with the Project
Executive Summary
3
The primary baseline information regarding the subject used in our study were:
• Maps, master plans, inventory counts, infrastructure cost estimates, and background materials provided by HHF Planners, HMP ownership, and other members of the planning team;
• “Hawaiian Memorial Park Expansion Environmental Impact Statement Preparation Notice” (November 2017);
• Oahu resident population, mortality rates, interment, and other pertinent trends from the State of Hawaii Department of Economic Development and Tourism, State Department of Health, United States Department of the Census and Veterans Affairs, and agencies of City and County of Honolulu;
• Oahu Cemetery locations, size, burial spaces, sales to date, expansion plans and other data from the State Department of Health, cemetery websites and spokespersons, Hawaii Information Service, published articles, and informed industry parties; and,
• Data from published and on-line sources and from our files.
The HMP site and environs have been viewed on several occasions and specifically for this assignment between January and March 2018.
The Market Study time-frame which serves as a basis for subject absorption projections extends approximately 23 years from early-2018 through 2040, as it is anticipated all the HMP Expansion inventory will be in-place and absorbed by then. The demand for burial plots on Oahu is quantified during this period, existing, planned competitive supply is identified, the appropriateness of the site for the proposed project is analyzed, and absorption is estimated using several market-based methods.
Our Economic Impact Analysis and Public Fiscal Assessment study forecast period extends over 21 years from ground-breaking in 2020, with product absorption (plot sales) through 2037, and continued burial activity through the end of the modeling period in 2040, with the remaining burials extending beyond 2040 captured in that “residual year” totals.
Focal Market and Economic/Fiscal conclusions are expressed in five cumulative periods. The first is three years (2018 through 2020), the remaining four are five year periods (2021-2025, 2026-2030, 2031-2035 and 2036-2040).
We have also tested our econometric model outcomes against the 2012 Hawaii Inter-County Input-Output Study (approved August 2016) multipliers and formulae.
It is noted, the model is not specifically time-sensitive as it is expressed in constant 2018 dollars and should the project timeline move several years in either direction from our estimate we would not anticipate major changes to our stated conclusions.
TERMS USED IN THE REPORT
There are numerous terms specific to the funeral/cemetery/memorial park (“death services”) industry which are used in this report.

Executive Summary
4
There are five standard classifications of “methods of disposition” for a body following death:
• Burial – The action or practice of interring a body in a grave. • Cremation – The disposal of a body by burning it to ashes. • Removal – Indicates that the body was shipped out of the State of Hawaii. • Medical Science – The body is donated for medical research purposes. • All Others – Includes entombment and alternative disposition methods.
Burial requires a casket, as typically does an entombment, while cremation remains are stored in urns.
Interment is the act of memorializing a person following death and placing their remains in a permanent “resting place”.
Interment can be via:
• Burial Plots which can contain one or more caskets and/or several urns. • Niches which are above-ground spaces for urns within a “columbarium” or other
specially-built structure. • Crypts a specially-built structure which are generally above ground in Hawaii with spaces
for bodies/caskets.
The term “burial spaces” is widely used in the report and on the tables to account for all interment alternatives. In many ways, it is interchangeable with the term “burial plot”.
The total number of potential individuals which can be interred in a cemetery/memorial park can vary widely in accordance with the wishes of the family, and the size, scope and rules of the facility.
The number of caskets and/or urns permitted in a plot differs between cemeteries, as does the number and size of columbarium or niche structures. In general, on Oahu it appears most cemeteries, and the existing HMP, create about 1,000 to 1,100 burial spaces per developed acre.
Perpetual Care Fund
Cemeteries and funeral homes are regulated by state and federal governments. They require funds be allocated from each burial unit sale and deposited in a Perpetual Care Trust account. The purpose of this account is to ensure that adequate funds are available for ongoing upkeep and maintenance of the cemetery. In addition, a percent of all preneed sales (merchandise and services, but not units) must be deposited in a Preneed Trust Account until the time of burial.
Generally, interest from these funds can be used for operations; however, the principal (corpus) amount cannot be touched. The following excerpt from the Cemetery and Funeral Trusts requirements for the State of Hawaii:
Executive Summary
5
Locational Terms – Within this report the terms Oahu, City and County of Honolulu and Honolulu County are used interchangeably.
PRIMARY STUDY CONCLUSIONS
Based on our analysis of the subject property, its environs, and envisioned development we have reached the following conclusions as of the First Quarter of 2018 regarding the probable market standing and economic impacts of the proposed Hawaiian Memorial Expansion Project.
All the larger tables which have been excerpted into the text are presented full-size in the addenda for easier reading.
Market Study
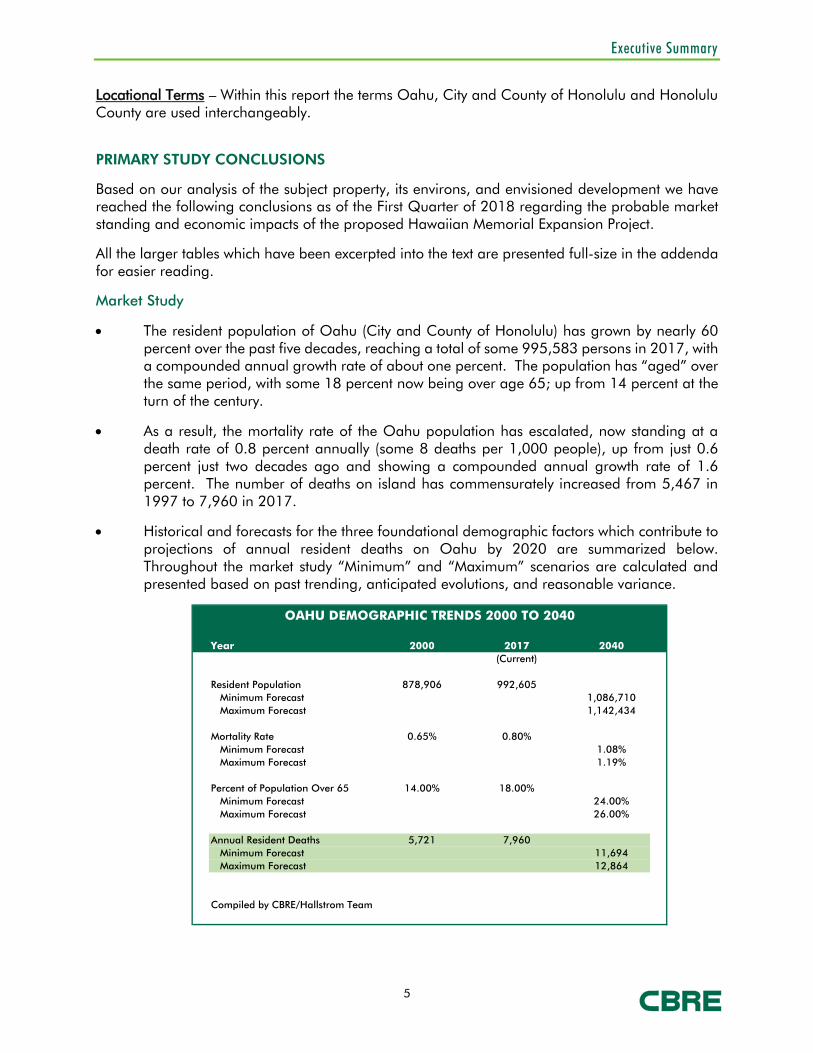
• The resident population of Oahu (City and County of Honolulu) has grown by nearly 60 percent over the past five decades, reaching a total of some 995,583 persons in 2017, with a compounded annual growth rate of about one percent. The population has “aged” over the same period, with some 18 percent now being over age 65; up from 14 percent at the turn of the century.
• As a result, the mortality rate of the Oahu population has escalated, now standing at a death rate of 0.8 percent annually (some 8 deaths per 1,000 people), up from just 0.6 percent just two decades ago and showing a compounded annual growth rate of 1.6 percent. The number of deaths on island has commensurately increased from 5,467 in 1997 to 7,960 in 2017.
• Historical and forecasts for the three foundational demographic factors which contribute to projections of annual resident deaths on Oahu by 2020 are summarized below. Throughout the market study “Minimum” and “Maximum” scenarios are calculated and presented based on past trending, anticipated evolutions, and reasonable variance.
Year 2000 2017 2040(Current)
Resident Population 878,906 992,605 Minimum Forecast 1,086,710 Maximum Forecast 1,142,434
Mortality Rate 0.65% 0.80% Minimum Forecast 1.08% Maximum Forecast 1.19%
Percent of Population Over 65 14.00% 18.00% Minimum Forecast 24.00% Maximum Forecast 26.00%
Annual Resident Deaths 5,721 7,960 Minimum Forecast 11,694 Maximum Forecast 12,864
Compiled by CBRE/Hallstrom Team
OAHU DEMOGRAPHIC TRENDS 2000 TO 2040

Executive Summary
6
The estimated total number of deaths on Oahu from 2018 to 2040 will be between 225,711 and 245,130 persons.
• In converting the number of projected deaths into net interment space/burial plot demand in non-military cemeteries on Oahu during the 2018-2040 modeling period, numerous factors had to be identified, analyzed and their going-forward trending forecast, including:
o Number of Burial Spaces on Oahu Previously Purchased but Currently Unused o Percentage of Deaths Disposed Via Cremations o Percentage of Cremations Interred versus Ashes Scattered or Other Disposal o Percentage of Deaths Disposed Via Burial o Percentage of Deaths Interred at Veterans Cemetery o Number of Oahu Persons Interred on Neighbor Islands o Number of Non-Oahu Residents Interred on Oahu
Based on these researched and forecast indicators we have estimated the net demand for additional burial spaces on Oahu through 2040 at between 145,025 and 165,795, broken down periodically as shown below.
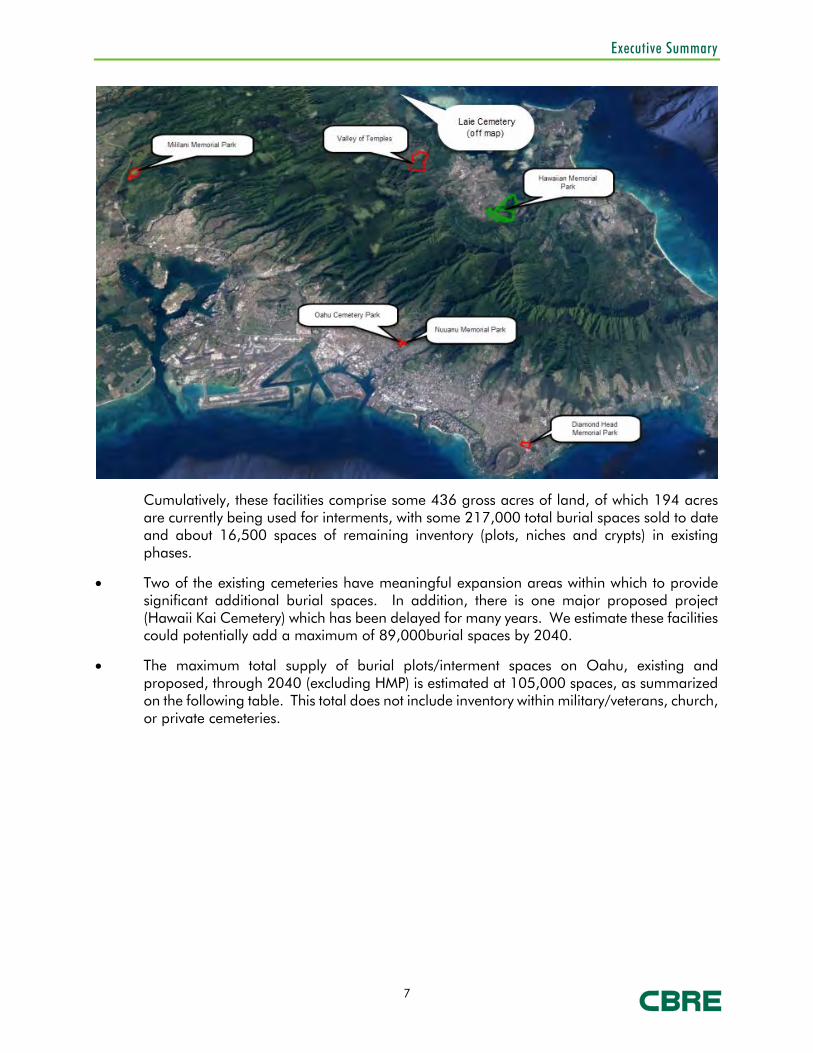
• Other than HMP, there are currently six major cemeteries/memorial parks on Oahu offering burial spaces to the general public; some have no to limited numbers of burial plots, all have niches available, and some have crypt spaces:
o Diamond Head Memorial Park o Oahu Cemetery o Nuuanu Memorial Park o Valley of the Temples Memorial Park o Mililani Memorial Park o Laie Cemetery
Period One: Minimum Two: Maximum
2018 to 2020 14,732 15,128
2021 to 2025 27,471 29,338
2026 to 2030 30,186 33,841
2030 to 2035 34,460 40,367
2036 to 2040 38,176 47,120
Total Burial Spaces 145,025 165,795
Compiled by CBRE/Hallstrom
ESTIMATED NET ADDITIONAL BURIAL SPACE DEMAND ON OAHU 2018 THROUGH 2040
Executive Summary
7
Cumulatively, these facilities comprise some 436 gross acres of land, of which 194 acres are currently being used for interments, with some 217,000 total burial spaces sold to date and about 16,500 spaces of remaining inventory (plots, niches and crypts) in existing phases.
• Two of the existing cemeteries have meaningful expansion areas within which to provide significant additional burial spaces. In addition, there is one major proposed project (Hawaii Kai Cemetery) which has been delayed for many years. We estimate these facilities could potentially add a maximum of 89,000burial spaces by 2040.
• The maximum total supply of burial plots/interment spaces on Oahu, existing and proposed, through 2040 (excluding HMP) is estimated at 105,000 spaces, as summarized on the following table. This total does not include inventory within military/veterans, church, or private cemeteries.

Executive Summary
8
• The expansion area of HMP is an appropriate location for cemetery development. In addition to being an extension of a long-successful facility established 60-years ago, which accounts for about one-quarter of the interments in the islands, and providing needed burial opportunities for families of those already interred at HMP and the Oahu public, the Petition Area also offers:
o Exceptional panoramas. o Open space/rain forest buffer. o Suitable terrain. o Excellent exposure and direct access o Proximity to windward towns and Honolulu. o Favorable climate.
• We have forecast the absorption of the HMP Expansion project burial space inventory using three methods assuming the new product would be available for sale and interment in 2021, and there would be approximately 30,000 plots in the expansion area in addition to the some 3,600 remaining in the existing facility (or 33,600 burial spaces total).
o Gross Demand/Supply Comparison – The rounded net total demand for additional burial spaces on Oahu from 2018 through 2040 will be between 145,000 and 165,800 spaces. The total number of existing and proposed supply apart from HMP is 105,000 burial plots. There will be a shortfall of supply relative to demand sufficient to absorb the subject inventory within the projection period.
o Residual Demand Analysis – When placed on a timeline, even if all the existing and proposed competitive burial space supply is absorbed in a timely manner before any demand flows to HMP, there will be ample excess residual demand in every projection period to absorb the subject inventory within 15 to 19 years.
CemeteryExisting
AvailableCurrently Proposed
Total Availalble and Proposed
Diamond Head Memorial Park 1,300 0 1,300
Nuuanau Memorial Park 700 0 700
Oahu Cemetery 700 0 700
Valley of the Temples Memorial Park 9,700 46,000 55,700
Mililani Memorial Park 3,800 19,000 22,800
Laie Cemeteries 300 0 300
Hawaii Kai Cemetery (Proposed) (1) 0 24,000 24,000
TOTALS 16,500 89,000 105,500
Complied by CBRE/Hallstrom Team
Combined Burial Plots, Crypts and Niche Spaces
MAXIMUM ESTIMATED TOTAL EXISTING AND PROPOSED SUPPLY OF MAJOR OAHU INTERMENT OPTIONS BY 2040
(1) Phase I will have 12,000 burial spaces of total build-out of 60,000. We have assumed two phases, or 24,000 spaces, will be made available in projection time-frame to 2040.

Executive Summary
9
o Market Shares Analysis – Based on the absorption history at HMP, the desirability of the Expansion project plots, and the characteristics of the competitive supply, we estimate HMP could readily capture a market share of from 30 percent to 33 percent of the total net Oahu burials space demand during the projection period, which result in full-absorption within 15 to 18 years.
We conclude the 33,600 burial spaces at HMP, including the estimated 3,600 remaining in the existing sections of the Park by 2021 and the 30,000 (maximum) in the expansion area, will achieve absorption within 17-years of initial offering (2021-2037).
Economic Impact Analysis
We have constructed a model depicting the economic impact of the HMP Expansion project on the Oahu and Statewide community during the course of its "lifespan" from anticipated ground-breaking in 2020, through its sell-out and use/absorption to 2035, and stabilized "operations" (management and maintenance) thereafter.
The model builds on the absorption estimates and data contained in our market study. All estimated amounts are in constant 2018 dollars. We note, that even if the timing of development or absorption moves substantially from our projections it does not change the resultant outcomes or indicators as the use of constant dollars removes time as a determinant variable. The purpose of the model is to illustrate how capital, jobs, wages, population and business activity will flow over time for planning and budgeting purposes apart from and present value considerations.
The HMP is a large, existing operation with 38 full-time-equivalent employees and millions of dollars in annual revenues and expenditures in the Oahu community.
The expansion project will not create significant new employment opportunities (beyond the extra workers needed to maintain the additional acreage) or new economic activity; it will allow the employment and activity to continue on at the currently high levels for another 16 plus years rather than winding-down as the remaining existing plots are sold and filled. It is this “extension period” we measure in our Economic Impact Analysis.
• The development of the HP Expansion project will bring in an estimated $29.3 million of new, direct capital investment with significant unquantified indirect expenditures into the island's real estate market and generate $141.7 million in total economic activity islandwide during its build-out and absorption over a sixteen-year period (forecast from circa 2020 to 2035. It will contribute some $5.9 million in annual economic activity on a stabilized basis thereafter.
• The construction of the HMP Expansion will directly create an estimated 73 "worker-years" of employment (the equivalent of 52 work weeks at 40 hours per week) in the trades and supply businesses during build-out, with an estimated $5.9 million in wages.
• The operation of the expansion area, through administration, sales/servicing, maintenance and landscaping will create 625 worker-years of employment from 2021 through 2035 and associated wages and benefits of $43.8 million. Once stabilized these project components will create demand for 45 FTE positions and annual wages of $3.2 million

Executive Summary
10
• Associated secondary/off-site employment during the overall development and absorption time-frame will total 233 worker-years with wages of $13.1 million and a stabilized FTE job-count of 15 with total wages of $842,000 per year.
• The on-going management and maintenance economic activity resulting from the HMP Expansion between 2021 and 2035 will total $115.9 million during the projection period and average $8.5 million per year on a stabilized basis. The base impact to Oahu from 2020 through 2035 will be $141 million and average $9.3 million annually thereafter.
• Application of the State DBEDT Inter-County Input-Output Model macro multipliers depicting direct, indirect and induced economic impacts arising from the HMP Expansion project results in significantly higher economic out-flow indicators than those from our direct, subject-specific micro model.
Secondary Impacts
HMP will have nominal to minor impacts on the socio-economic aspects of the surrounding community that relate to real estate issues.
• There are no neighboring uses on three sides of the HMP Expansion acreage property. The existing park is to the west, open lands to the east, and hills, open space and old quarry lands to the south. To the north are built-out single family residential subdivisions which will be buffered from the plot gardens in the expansion project.
• The site is appropriately called a Memorial Park, a vast greensward having several small central structures and highly limited activity; with just a handful of internment services daily, graveside visitations and maintenance activities. There will be no additional structures on the expansion acreage and similarly limited, subdued activities.
• The HMP Expansion will not meaningfully impact the property values or real estate taxes of the northerly-abutting homes. Property values throughout Windward Oahu are largely driven by external, cyclical economic factors within an existing (and expanding) cumulative mass, not by the expansion of a cemetery which has been in-place for decades.
• There is not expected to be any in-migration to Oahu as a direct result of the project.
Public Fiscal Benefits
Public fiscal (or cost/benefit) impacts are typically estimated on a per capita basis founded on a conservative assumption that each new person added to the Oahu community is "responsible for" a similar tax cost/obligation as every other person on the island.
As there will be no new residents resulting from the HMP Expansion there will be no new per capita costs. We have therefore, as discussed later in the report, focused on any additional costs the State and County will incur beyond current levels as a result of the expansion project.
Our analytical focus is on “new” or additional fiscal impacts (incoming tax dollars and outgoing government expenditures) to the State and County arising from the development of HOAH not those monies/costs which are merely flowing from elsewhere on the island.
• The City and County of Honolulu currently receives some $530 per year of real property taxes on the 164-acre subject site (split between “Preservation” and “Residential” use designations.). This total is not anticipated to meaningfully change, if at all, as a result of

Executive Summary
11
the HMP expansion. The County will receive an estimated $500,000 in one-time permit, license and other fees at the commencement of the project; otherwise there will be no enhancement in benefits from the project.
• The State of Hawaii will receive Gross Excise and Income taxes, secondary revenues, and impact fees of $8.7 million during the 2020-2035 modeling period, and $402,376 per year thereafter.
• There will be no “new” or additional per capita or actual costs beyond the nominal amounts already incurred to either the State or County resulting from the expansion of HMP, making their added revenues all marginal profits.
• The major economic impacts and public fiscal conclusions (above current levels) are summarized on the following table. The column on the left summarizes the cumulative impacts during the initial 16-year build-out and absorption period (2020-2035) covering infrastructure emplacement and plot sell-out, and the right hand column the annual impacts after full-absorption/stabilization.
Even after all of the plots are fully absorbed (sold) and eventually filled, the HMP expansion area will require continued maintenance and servicing in perpetuity with similar operating costs, though revenues/economic activity will lessen.

Executive Summary
12
Cumulative During Build-Out Stabilized Annually
Analysis Item Period Thereafter
Direct Capital Investment $29,304,000
Local Contractor's Profits $2,930,400
Local Supplier's Profits $1,172,160
Worker Years of Jobs 931 60
Employee Wages $62,854,492 $3,998,895
Total Oahu "Base" Economic Impact $141,024,067 $5,842,400
Honolulu County Gross Tax Receipts $500,000 $0
State of Hawaii Gross Tax Receipts $8,721,678 $402,376
Added Honolulu County Costs of Services $0 $0
Added State of Hawaii Costs of Services $0 $0
Honolulu County Net Benefits or (Loss) $500,000 $0
State of Hawaii Net Benefits or (Loss) $8,721,678 $402,376
Source: CBRE/Hallstrom Team
SUMMARY COMPARISON OF MAJOR ECONOMIC IMPACTS
AND PUBLIC FISCAL COSTS/BENEFITSAll Amounts Expressed in Constant, Uninflated 2018 Dollars
Accounting for "New" Impacts Only

Subject Property and Proposed HMP Expansion Master Plan
13
The Subject Property and Proposed HMP Expansion Project Excerpts and data contributing to this section were taken from the “Hawaiian Memorial Park Expansion Environmental Impact Statement Preparation Notice” (published November 2017).
Please refer to that document for further detail and descriptions on the existing HMP site and Expansion project.
LOCATION
HMP is located on the southerly windward side of the island of Oahu, on the southerly outskirts of Kaneohe Town, just north easterly of Kailua Town and across the Koolau Mountains from urban Honolulu and Waikiki, as shown on the following map.
It is within two-miles of all three trans-Koolau arterials, including the H-3 Freeway, Likelike Highway (#63) and the Pali Highway (#61), and fronts Kamehameha Highway (#83) which is the primary rural thoroughfare on the island, extending up the northerly windward coastline, around the North Shore and down through Central Oahu. HMP enjoys one of the most accessible locations outside of Honolulu.
Subject Property and Proposed HMP Expansion Master Plan
14
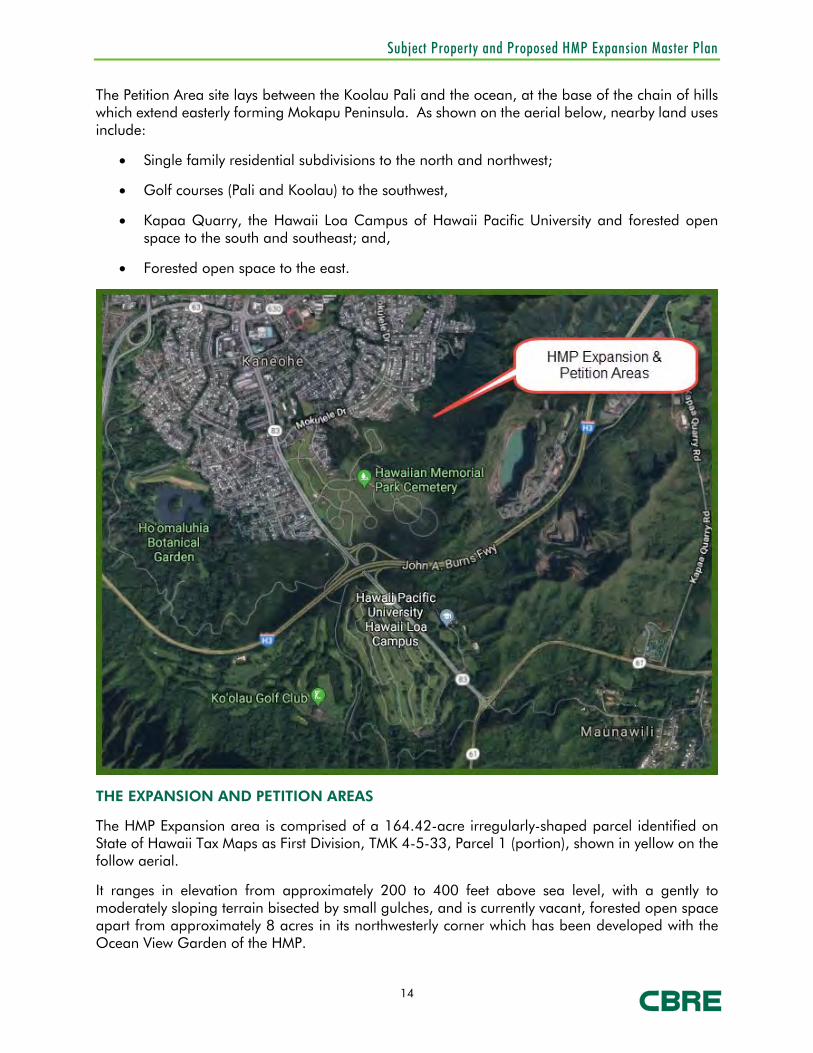
The Petition Area site lays between the Koolau Pali and the ocean, at the base of the chain of hills which extend easterly forming Mokapu Peninsula. As shown on the aerial below, nearby land uses include:
• Single family residential subdivisions to the north and northwest;
• Golf courses (Pali and Koolau) to the southwest,
• Kapaa Quarry, the Hawaii Loa Campus of Hawaii Pacific University and forested open space to the south and southeast; and,
• Forested open space to the east.
THE EXPANSION AND PETITION AREAS
The HMP Expansion area is comprised of a 164.42-acre irregularly-shaped parcel identified on State of Hawaii Tax Maps as First Division, TMK 4-5-33, Parcel 1 (portion), shown in yellow on the follow aerial.
It ranges in elevation from approximately 200 to 400 feet above sea level, with a gently to moderately sloping terrain bisected by small gulches, and is currently vacant, forested open space apart from approximately 8 acres in its northwesterly corner which has been developed with the Ocean View Garden of the HMP.

Subject Property and Proposed HMP Expansion Master Plan
15
The Petition Area is a 53.45-acre “donut hole” in the southwesterly portion of the larger parcel, adjacent to the existing HMP lands and the Hawaii State Veterans Cemetery, as shown on the following maps from the EIS document.
Only a portion of the Petition Area acreage will be for cemetery expansion, with the remainder put to other uses as shown in the following table.

Subject Property and Proposed HMP Expansion Master Plan
16
EXPANSION MASTER PLAN
The map below displays the cemetery expansion use parameters within the Petition Area, accessed via a single roadway leading from the existing Ocean View Garden of HMP. The dark green area above the cemetery expansion site is the 14.5-acre cultural preserve.
There will be open space/buffers between the cemetery areas and the homes in the abutting residential subdivisions.
The number of burial plots/spaces to be contained within the 28.20-acre cemetery expansion area cannot be definitively quantified at present as the final count will evolve in accordance with the disposition methods and their respective densities. It is typical for cemeteries to have some 1,000 spaces/plots per net acre of the memorial park put to burial use; as seen in the earlier phases of HMP (about 80 acres and 77,000 spaces) and the competitive projects.
Land UseApproximate
Acreage
Cemetery Expansion Area 28.20
Internal Roadways 3.00
Cultural Preserve 14.50
Open Space Areas 7.75
Total 53.45
PROPOSED HMP EXPANSION LAND USES AND ACREAGES
Source: Hawaiian Memorial Park Expansion Project Environmental Impact Statement, page 2-4

Subject Property and Proposed HMP Expansion Master Plan
17
It is estimated, the total count in the HMP cemetery expansion site of the Petition Area would be between 28,000 to 30,000 burial spaces; at or slightly above historic densities to reflect a greater percentage of disposals by cremation on a going-forward basis. For analytical purposes, the 30,000 maximum burial spaces count is used to ensure a more moderate/conservative absorption period outcome.

Neighborhood Environs
18
Neighborhood Environs KANEOHE
HMP is on the southerly edge of Kaneohe Town, an older, well-established community located between the Koolau Mountain range and Kaneohe Bay, covering about 8.5 square miles, and is the second largest town on the windward side of Oahu, just smaller than Kailua (39,000 residents).
Kaneohe has current population of some 36,000 full-time residents having a diverse racial make-up as shown in the graph below.

Neighborhood Environs
19
It is primarily a residential suburb, although it has some 1.1 million square feet of commercial/retail gross leasable area and more than 500,000 square feet of industrial space. It is the gateway and service/supply center for the upper-windward coastline of Oahu (Koolauloa) which is home to some 21,000 residents.
Kaneohe has a moderate climate, with average daily highs of 82.7 degrees and nightly lows of 71.2 degrees, rainfall averaging 53.8 inches per year, and an average off-shore water temperature of 74.8 degrees. The tradewinds blow at up to 25 miles per hour on 73 percent of the days. It is cooler, wetter and more-windy than in Honolulu, located on the leeward side of the Koolau Range, which strongly appeals to many long-term/kamaaina residents.
Kaneohe is accessed from the urbanized south and central areas of Oahu via three trans-Koolau routes, the Pali Highway Tunnel; Likelike Highway-Wilson Tunnel, and John A. Burns Freeway. Travel time from Downtown Honolulu is approximately 20 to 30-minute depending upon traffic congestion. It can also be accessed from the north along Kamehameha Highway.
Mokapu Peninsula defines the southerly boundary of Kaneohe Town and is the southerly headland of Kaneohe Bay; it is home to Marine Base Hawaii (formerly Kaneohe Bay Marine Corps Station). Kailua Town and Kailua Bay extend south from the peninsula.
Northerly along Kaneohe Bay lie a series of small residential villages, including Ahuimanu, Kahaluu, Waiohole and Waikane before coming to the northerly Kualoa headland of the bay.
Kaneohe is virtually “built-out” with few remaining vacant, zoned properties available for development. The County Planning and Permitting Department does not forecast meaningful population gains in Kaneohe over the mid to long-term.
Waiakalua Bayside was the most recent residential subdivision to be developed in Kaneohe, a 20-unit development along the Kaneohe Bay shoreline with 14 single-family homes and six duplex residences. While there are small pockets for periodic in-fill development, new product is primarily through gentrification (demolition and re-development).
Kaneohe has a wide variety of supportive recreational, health, educational, and public safety facilities.
• Recreational amenities include: Kaneohe District Park, Hoomaluhia Botanical Gardens, several neighborhood parks/playgrounds, three golf courses, and boating activities available at Heeia-Kea Boat Harbor and two private marinas (Makani Kai and Kaneohe Yacht Club).
• Health care services include Adventist Health Castle Medical Center (general), just south of Town, Hawaii State Hospital (psychiatric), Kaiser and Straub both have clinics, and there is numerous physician, dental and other health providers in the community. There is a police station and Aikahi Fire Department Station 19 is on Mokapu Peninsula.
• Educational institutions include Windward Community College (public), Hawaii Pacific University Hawaii Loa Campus (private) Castle High School, King Intermediate, and Benjamin Parker, Heeia, and Ahuimanu Elementary Schools.
Major commercial and shopping facilities include Kaneohe Bay Shopping Center, Kaneohe Shopping Center, Windward City Shopping Center, Koolau Shopping Center, and Windward Mall, (the fourth largest shopping complex in the state). Various retail/commercial services front Kamehameha Highway through Kaneohe town, including convenience stores/service stations, low-

Neighborhood Environs
20
rise commercial buildings, and several service-related businesses. Heeia Industrial, a light industrial and service/commercial area, is located along Kahuhipa Street mauka of Kamehameha Highway and makai of Kahekili Highway, abutting the Kaneohe business district.
Demographics
The US Census sex and age data for Kaneohe and Honolulu County through 2016 are summarized in the table below.
In this analysis, the key figure is the percent of the population which is over 65 years old, which is at 15.9 percent for all of Oahu and at 19.3 percent for Kaneohe.
The graph below summarizes the religious characteristics of Kaneohe. This is insightful to the study as practicing Christians are more prone to seek burial disposal, while the “None” group (which includes most Chinese, Vietnamese and Japanese-American, who have Buddhist or Shinto traditions) are more prone to seek cremation as a disposal alternative.

Neighborhood Environs
21
Kaneohe remains a popular bedroom community due to the relative short drive to major employment centers located in and around Urban Honolulu; adequate community support facilities for educational and medical needs; the availability of housing alternatives; and the scenic, lush, cool atmosphere of this suburban area.

Overview of the National Death Services Industry
22
Overview of National Death Services Industry The death services industry provides products and services to bereaved family members of the deceased, which includes:
• Sales of burial spaces, such as in-ground plots, niches in columbaria and memorials, crypts in mausoleums.
• Sales of funerary-related merchandise such as coffins, urns, grave markers, and ornamental goods.
• Provision of mortuary services such as embalming, cremation, body preparation and transportation, and memorial/funeral services.
In the US, the industry had gross revenues estimated at $14.7 billion in 2017, up 3.5 percent from the prior year. There are an estimated 115,000 cemeteries, 19,500 funeral homes, and 1,200 crematories nation-wide. In 2016, the National Center for Disease Control counted 2.74 million deaths in the US.
While the overall death rate has steadily, albeit marginally, declined over the past two decades the total population of the country has increased at a much faster rate, resulting in an increasing death count each year, as shown below. The number of deaths nationally has risen at a compounded annual growth rate of 0.9 percent since 1997.
With the average age of Americans nearing stabilization at over 37 years and the average life expectancy at over 78 years, there is a greater proportion of Americans reaching into the upper-age demographic (above 65 years). As a result, the demand for industry services will continue to grow unabated into the foreseeable future.
Year Total Deaths
Percent Annual Increase
Death Rate (Per 100,000)
Percent Annual Increase
Life Expectancy at Birth
Percent Annual Increase
1997 2,314,245 ---- 864.7 ---- 76.5 ----1998 2,337,256 1.0% 864.7 0.0% 76.7 0.3%1999 2,391,399 2.3% 881.9 2.0% 76.7 0.0%2000 2,403,351 0.5% 872.0 -1.1% 76.9 0.3%2001 2,416,425 0.5% 854.5 -2.0% 77.2 0.4%2002 2,447,864 1.3% 846.8 -0.9% 77.4 0.3%2003 2,448,288 0.0% 832.7 -1.7% 77.5 0.1%2004 2,398,343 -2.0% 801.0 -3.8% 77.9 0.5%2005 2,448,017 2.1% 798.8 -0.3% 77.8 -0.1%2006 2,426,264 -0.9% 776.5 -2.8% 77.7 -0.1%2007 2,423,712 -0.1% 760.2 -2.1% 77.9 0.3%2008 2,471,984 2.0% 758.3 -0.2% 78.1 0.3%2009 2,437,163 -1.4% 741.1 -2.3% 78.5 0.5%2010 2,468,435 1.3% 747.0 0.8% 78.7 0.3%2011 2,515,458 1.9% 741.3 -0.8% 78.7 0.0%2012 2,543,279 1.1% 732.8 -1.1% 78.8 0.1%2013 2,596,993 2.1% 731.9 -0.1% 78.8 0.0%2014 2,626,418 1.1% 742.6 1.5% 78.8 0.0%2015 2,712,630 3.3% 733.1 -1.3% 78.7 -0.1%2016 2,744,248 1.2% 728.8 -0.6% 78.6 -0.1%
0.9% -0.9% 0.1%
Source: CDC National Vital Statistics Reports
NATIONAL DEATH STATISTICS (1997-2014)

Overview of the National Death Services Industry
23
Increasing family wealth and seniors having more disposable income should further buttress sector spending; with long-term revenue growth at a compounded annual growth rate of 2.4 percent to 2.8 percent annually forecast.
However, as the cost of traditional in-ground burials rise, the proportion of the population that is Catholic and fundamental Protestant decreases, and the percentage who are of Asian-ancestry or of Buddhist/Shinto/Hinduism increases, the ratio of cremations to burials in the US has meaningfully escalated; particularly in the past decade, and is expected to continue trending upward over the coming decade, as shown below (National Funeral Directors Association data).
As discussed in the following section, Hawaii has a much higher rate of cremation due to its large numbers of Asian-descendant population and scarcity/price of land.
The maps below display the projected burial and cremation disposal ratios for each state in 2020. As would be anticipated, those having populations that are predominantly Catholic, Mormon and Fundamental Protestant have higher burial and lower cremation rates.
Funerary service operators have expanded their array of supporting merchandise items for families choosing cremation, in response to demand and to increase revenues flowing from that sector.
Existing cemetery space is filling up, especially in urban areas, increasing the cost of plots and often creating friction with neighbors when a cemetery operator tries to expand.
The trend towards cremation will decrease revenue gains for the industry as cremations are about one-third of the cost of traditional burial.

Market Study of the Oahu Cemetery Sector
24
Market Study of the Oahu Cemetery Sector ANALYSIS OVERVIEW
Although burial plots/spaces are a unique commodity as subject for a market study, the demand/supply dynamics remain the same as for any land use; to the extent forecast demand exceeds existing and proposed supply there is support for additional development. If there is insufficient demand relative to available supply the support for new inventory diminishes.
The largest analytical adaptation from a standard market study for standard uses (residential commercial, industrial or lodging) is a matter of perspective. Instead of focusing on trends within an expanding living trade area population it is on the component of the population which passes away and exits the trade area each year.
However, whether living or deceased, a person creates a demand for land use. The living requires housing, goods and services from many uses and locations that change over time. The deceased creates demand for a single use (burial space) in a permanent location (cemetery/memorial park or with ashes scattered).
It is not culturally acceptable for deceased members of the community to be “homeless” and un-serviced; sufficient allowances must be made to provide for acceptable disposition.
The analysis quantifies the net demand for additional burial spaces on Oahu on a going-forward basis from 2018 through 2040, the anticipated HMP Expansion project time-frame, by reviewing historical trends and forecasting seven variables on an annualized basis, all with minimum and maximum scenarios:
1. Resident Population, Deaths and Death Rates
2. Disposition of Deaths (primarily burials and cremation)
3. Projection of Interred Cremations
4. Projection of Burials
5. Number of Veterans Interred at Military/Veterans Cemeteries
6. Identification and Allowances for Other Factors
7. Construction and Application of Model for Net Demand for Burial Spaces
The available supply of burial spaces on Oahu, existing and proposed, for the 2018 through 2040 study period is forecast via a three-step process:
1. Identify Existing Major Cemeteries with Burial Spaces for Purchase
2. Quantify the Amount of Remaining Inventory in Existing Phases
3. Project the Number of Additional Inventory to be Provided in Expansion or New Projects
Each of these items is specifically addressed in a subsequent sub-section focusing on tabular presentation of the historic and projected indicators, with minimal narrative. Detail on sources, allowances and calculations are contained in the footnotes on the tables.
Market Study of the Oahu Cemetery Sector
25
QUANTIFICATION OF FUTURE DEMAND
Resident Population, Deaths and Death Rates
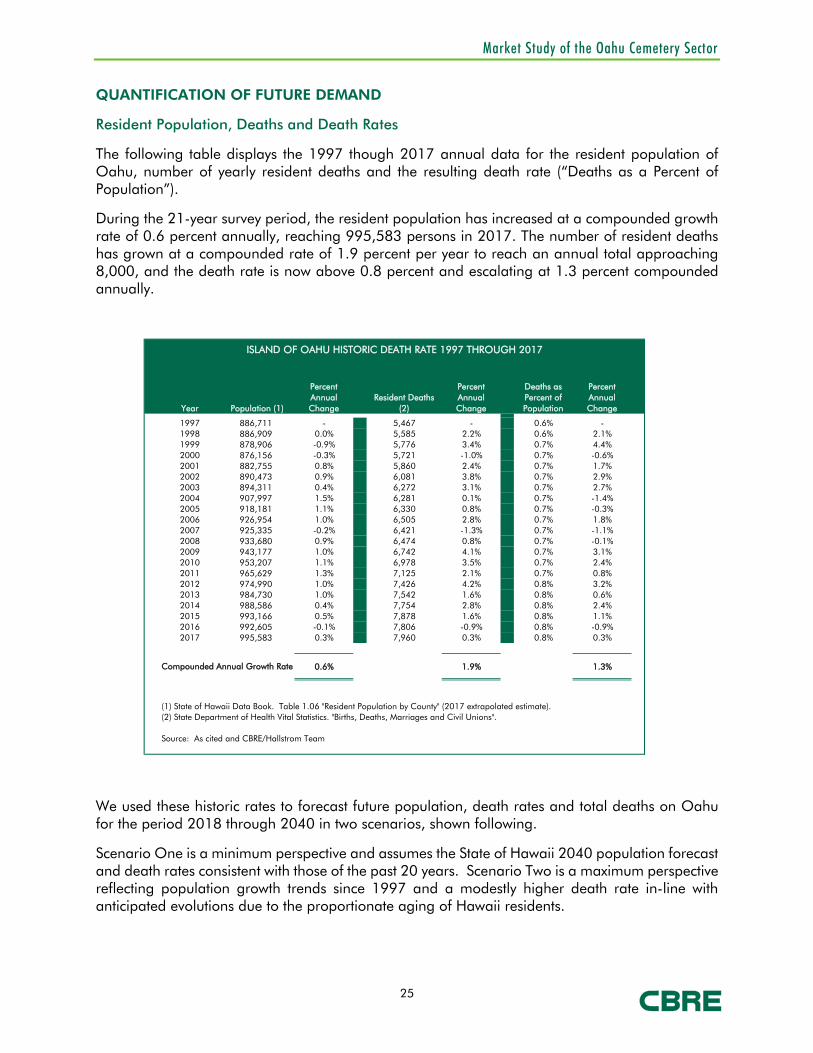
The following table displays the 1997 though 2017 annual data for the resident population of Oahu, number of yearly resident deaths and the resulting death rate (“Deaths as a Percent of Population”).
During the 21-year survey period, the resident population has increased at a compounded growth rate of 0.6 percent annually, reaching 995,583 persons in 2017. The number of resident deaths has grown at a compounded rate of 1.9 percent per year to reach an annual total approaching 8,000, and the death rate is now above 0.8 percent and escalating at 1.3 percent compounded annually.
We used these historic rates to forecast future population, death rates and total deaths on Oahu for the period 2018 through 2040 in two scenarios, shown following.
Scenario One is a minimum perspective and assumes the State of Hawaii 2040 population forecast and death rates consistent with those of the past 20 years. Scenario Two is a maximum perspective reflecting population growth trends since 1997 and a modestly higher death rate in-line with anticipated evolutions due to the proportionate aging of Hawaii residents.
Year Population (1)
Percent Annual Change
Resident Deaths (2)
Percent Annual Change
Deaths as Percent of Population
Percent Annual Change
1997 886,711 - 5,467 - 0.6% -1998 886,909 0.0% 5,585 2.2% 0.6% 2.1%1999 878,906 -0.9% 5,776 3.4% 0.7% 4.4%2000 876,156 -0.3% 5,721 -1.0% 0.7% -0.6%2001 882,755 0.8% 5,860 2.4% 0.7% 1.7%2002 890,473 0.9% 6,081 3.8% 0.7% 2.9%2003 894,311 0.4% 6,272 3.1% 0.7% 2.7%2004 907,997 1.5% 6,281 0.1% 0.7% -1.4%2005 918,181 1.1% 6,330 0.8% 0.7% -0.3%2006 926,954 1.0% 6,505 2.8% 0.7% 1.8%2007 925,335 -0.2% 6,421 -1.3% 0.7% -1.1%2008 933,680 0.9% 6,474 0.8% 0.7% -0.1%2009 943,177 1.0% 6,742 4.1% 0.7% 3.1%2010 953,207 1.1% 6,978 3.5% 0.7% 2.4%2011 965,629 1.3% 7,125 2.1% 0.7% 0.8%2012 974,990 1.0% 7,426 4.2% 0.8% 3.2%2013 984,730 1.0% 7,542 1.6% 0.8% 0.6%2014 988,586 0.4% 7,754 2.8% 0.8% 2.4%2015 993,166 0.5% 7,878 1.6% 0.8% 1.1%2016 992,605 -0.1% 7,806 -0.9% 0.8% -0.9%2017 995,583 0.3% 7,960 0.3% 0.8% 0.3%
0.6% 1.9% 1.3%
(1) State of Hawaii Data Book. Table 1.06 "Resident Population by County" (2017 extrapolated estimate).(2) State Department of Health Vital Statistics. "Births, Deaths, Marriages and Civil Unions".
Source: As cited and CBRE/Hallstrom Team
ISLAND OF OAHU HISTORIC DEATH RATE 1997 THROUGH 2017
Compounded Annual Growth Rate

Market Study of the Oahu Cemetery Sector
26
Scenario One forecasts there will be 225,7111 deaths on Oahu by 2040.
The Scenario Two model quantifies the projected deaths at 245,130 persons, an 8.6 percent increase over Scenario One.
Year
State of Hawaii 2040 Population
Forecast (1)
Percent Annual Change
Trending Deaths as a Percent of
Population
Percent Historic Annual Change
Forecast Resident Deaths
Percent Annual Change
2018 998,292 0.27% 0.81% 1.30% 8,085 1.6%2019 1,001,001 0.27% 0.82% 1.30% 8,212 1.6%2020 1,003,710 0.27% 0.83% 1.30% 8,342 1.6%2021 1,008,729 0.50% 0.84% 1.30% 8,492 1.8%2022 1,013,772 0.50% 0.85% 1.30% 8,646 1.8%2023 1,018,841 0.50% 0.86% 1.30% 8,802 1.8%2024 1,023,935 0.50% 0.88% 1.30% 8,961 1.8%2025 1,029,410 0.50% 0.89% 1.30% 9,126 1.8%2026 1,033,528 0.40% 0.90% 1.30% 9,282 1.7%2027 1,037,662 0.40% 0.91% 1.30% 9,440 1.7%2028 1,041,812 0.40% 0.92% 1.30% 9,601 1.7%2029 1,045,980 0.40% 0.93% 1.30% 9,765 1.7%2030 1,052,130 0.40% 0.95% 1.30% 9,950 1.9%2031 1,056,339 0.40% 0.96% 1.30% 10,119 1.7%2032 1,060,564 0.40% 0.97% 1.30% 10,292 1.7%2033 1,064,806 0.40% 0.98% 1.30% 10,467 1.7%2034 1,069,065 0.40% 1.00% 1.30% 10,646 1.7%2035 1,071,220 0.40% 1.01% 1.30% 10,806 1.5%2036 1,074,434 0.30% 1.02% 1.30% 10,979 1.6%2037 1,077,657 0.30% 1.04% 1.30% 11,155 1.6%2038 1,080,890 0.30% 1.05% 1.30% 11,334 1.6%2039 1,084,133 0.30% 1.06% 1.30% 11,516 1.6%2040 1,086,710 0.30% 1.08% 1.30% 11,694 1.5%
Total Oahu Deaths 2018 through 2040 225,711
Source: As cited, and CBRE/Hallstrom Team
SCENARIO ONE: MINIMUM - FORECAST OAHU DEATHS 2018 THROUGH 2040
(1) Using periodic five-year projection figures with state annual growth rates for interim years, except for 2018 & 2019 which uses mid-point growth rate from 2017 estimates.

Market Study of the Oahu Cemetery Sector
27
Disposition of Deaths (primarily burials and cremation)
The following table summarizes the disposition of deaths on Oahu for selected years from 1970 through 2017, with the options being:
o Burial
o Cremation
o Removal Out of State
o Medical Donation
o All Others (including entombment)
The total number of burials has increased over time, but has declined as a percentage of all disposals. Cremations have increased notably both in number, compounded growth rate and as a percentage of all dispositions.
The other alternatives are minor in comparison.
Year
Using Growth Trends of Last 20
Years
Percent Annual Change
Maximum Deaths as a Percent of
Population
Percent Maximum
Annual Change
Forecast Resident Deaths
Percent Annual Change
2018 1,001,556 0.6% 0.81% 1.75% 8,147 2.4%2019 1,007,566 0.6% 0.83% 1.75% 8,340 2.4%2020 1,013,611 0.6% 0.84% 1.75% 8,537 2.4%2021 1,019,693 0.6% 0.86% 1.75% 8,738 2.4%2022 1,025,811 0.6% 0.87% 1.75% 8,944 2.4%2023 1,031,966 0.6% 0.89% 1.75% 9,156 2.4%2024 1,038,158 0.6% 0.90% 1.75% 9,372 2.4%2025 1,044,386 0.6% 0.92% 1.75% 9,593 2.4%2026 1,050,653 0.6% 0.93% 1.75% 9,819 2.4%2027 1,056,957 0.6% 0.95% 1.75% 10,051 2.4%2028 1,063,298 0.6% 0.97% 1.75% 10,288 2.4%2029 1,069,678 0.6% 0.98% 1.75% 10,531 2.4%2030 1,076,096 0.6% 1.00% 1.75% 10,780 2.4%2031 1,082,553 0.6% 1.02% 1.75% 11,034 2.4%2032 1,089,048 0.6% 1.04% 1.75% 11,295 2.4%2033 1,095,582 0.6% 1.06% 1.75% 11,561 2.4%2034 1,102,156 0.6% 1.07% 1.75% 11,834 2.4%2035 1,108,769 0.6% 1.09% 1.75% 12,114 2.4%2036 1,115,422 0.6% 1.11% 1.75% 12,400 2.4%2037 1,122,114 0.6% 1.13% 1.75% 12,692 2.4%2038 1,128,847 0.6% 1.15% 1.75% 12,992 2.4%2039 1,135,620 0.6% 1.17% 1.75% 13,299 2.4%2040 1,142,434 0.6% 1.19% 1.75% 13,612 2.4%
Total Oahu Deaths 2018 through 2040 245,130
Source: CBRE/Hallstrom Team
SCENARIO TWO: MAXIMUM - FORECAST OAHU DEATHS 2018 THROUGH 2040

Market Study of the Oahu Cemetery Sector
28
The focal Burial and Cremation disposal alternatives are broken-out and shown separately in the table below. The number and trending percentages of all dispositions, combined with the Oahu death forecasts to 2040, form the basis for going-forward projections.
Year Number
Percent Annual Change
Percent of Total
Dispositions Number
Percent Annual Change
Percent of Total
Dispositions Number
Percent Annual Change
Percent of Total
Dispositions Number
Percent Annual Change
Percent of Total
Dispositions Number
Percent Annual Change
Percent of Total
Dispositions Number
Percent Annual Change
1970 2,197 --- 52.4% 1,509 --- 36.0% 470 --- 11.2% 18 --- 0.4% 4,194 ---1980 2,241 0.2% 43.1% 2,343 5.5% 45.0% 567 2.1% 10.9% 53 19.4% 1.0% 5,204 2.4%1990 3,564 5.9% 50.5% 2,798 1.9% 39.7% 656 1.6% 9.3% 37 -3.0% 0.5% 7,055 3.6%2000 2,767 -2.2% 32.5% 5,092 8.2% 59.8% 591 -1.0% 6.9% 40 --- 0.5% 21 -4.3% 0.2% 8,511 2.1%2001 2,689 -2.8% 31.2% 5,241 2.9% 60.9% 608 2.9% 7.1% 50 25.0% 0.6% 21 0.0% 0.2% 8,609 1.2%2002 2,770 3.0% 30.8% 5,505 5.0% 61.3% 641 5.4% 7.1% 46 -8.0% 0.5% 24 14.3% 0.3% 8,986 4.4%2003 2,800 1.1% 30.5% 5,778 5.0% 62.9% 540 -15.8% 5.9% 47 2.2% 0.5% 14 -41.7% 0.2% 9,179 2.1%2004 2,696 -3.7% 29.1% 5,900 2.1% 63.8% 599 10.9% 6.5% 49 4.3% 0.5% 8 -42.9% 0.1% 9,252 0.8%2005 2,667 -1.1% 28.6% 5,964 1.1% 63.9% 634 5.8% 6.8% 55 12.2% 0.6% 10 25.0% 0.1% 9,330 0.8%2006 2,648 -0.7% 27.5% 6,292 5.5% 65.4% 591 -6.8% 6.1% 68 23.6% 0.7% 23 130.0% 0.2% 9,622 3.1%2007 2,597 -1.9% 27.0% 6,372 1.3% 66.2% 580 -1.9% 6.0% 64 -5.9% 0.7% 14 -39.1% 0.1% 9,627 0.1%2008 2,455 -5.5% 25.6% 6,506 2.1% 68.0% 530 -8.6% 5.5% 63 -1.6% 0.7% 18 28.6% 0.2% 9,572 -0.6%2009 2,416 -1.6% 24.3% 6,862 5.5% 69.0% 551 4.0% 5.5% 94 49.2% 0.9% 24 33.3% 0.2% 9,947 3.9%2010 2,322 -3.9% 24.1% 6,661 -2.9% 69.0% 562 2.0% 5.8% 91 -3.2% 0.9% 18 -25.0% 0.2% 9,654 -2.9%2011 2,375 2.3% 23.8% 6,961 4.5% 69.9% 503 -10.5% 5.0% 102 12.1% 1.0% 20 11.1% 0.2% 9,961 3.2%2012 2,480 4.4% 23.9% 7,255 4.2% 70.0% 506 0.6% 4.9% 102 0.0% 1.0% 20 0.0% 0.2% 10,363 4.0%2013 2,302 -7.2% 21.8% 7,582 4.5% 71.7% 542 7.1% 5.1% 131 28.4% 1.2% 19 -5.0% 0.2% 10,576 2.1%2014 2,306 0.2% 21.2% 7,908 4.3% 72.6% 504 -7.0% 4.6% 146 11.5% 1.3% 22 15.8% 0.2% 10,886 2.9%2015 2,399 4.0% 21.4% 8,097 2.4% 72.2% 559 10.9% 5.0% 141 -3.4% 1.3% 19 -13.6% 0.2% 11,215 3.0%
0.2% -2.0% 3.8% 1.6% 0.4% -1.8% 8.2% 6.3% 0.1% -2.0% 2.2%
Note: 2015 data most recent year available
*Includes entombment.
Source: State of Hawaii Data Book, Table 2.20 "Deaths by Disposition", from Hawaii State Department of Health, Office of Health Status Monitoring, records and CBRE/Hallstrom Team
Compounded Annual Growth
Complete Data Unavailable
STATE OF HAWAII HISTORICAL DEATHS BY DISPOSITION 1970-2015
Burials Cremations Removal Out of State Medical Donation All Others Total All Methods
Year Number
Percent Annual Change
Percent of Total
Dispositions Number
Percent Annual Change
Percent of Total
Dispositions Number
Percent Annual Change
Percent of Total
Dispositions
1970 2,197 --- 52.4% 1,509 --- 36.0% 3,706 --- 88.4%1980 2,241 0.2% 43.1% 2,343 5.5% 45.0% 4,584 2.4% 88.1%1990 3,564 5.9% 50.5% 2,798 1.9% 39.7% 6,362 3.9% 90.2%2000 2,767 -2.2% 32.5% 5,092 8.2% 59.8% 7,859 2.4% 92.3%2001 2,689 -2.8% 31.2% 5,241 2.9% 60.9% 7,930 0.9% 92.1%2002 2,770 3.0% 30.8% 5,505 5.0% 61.3% 8,275 4.4% 92.1%2003 2,800 1.1% 30.5% 5,778 5.0% 62.9% 8,578 3.7% 93.5%2004 2,696 -3.7% 29.1% 5,900 2.1% 63.8% 8,596 0.2% 92.9%2005 2,667 -1.1% 28.6% 5,964 1.1% 63.9% 8,631 0.4% 92.5%2006 2,648 -0.7% 27.5% 6,292 5.5% 65.4% 8,940 3.6% 92.9%2007 2,597 -1.9% 27.0% 6,372 1.3% 66.2% 8,969 0.3% 93.2%2008 2,455 -5.5% 25.6% 6,506 2.1% 68.0% 8,961 -0.1% 93.6%2009 2,416 -1.6% 24.3% 6,862 5.5% 69.0% 9,278 3.5% 93.3%2010 2,322 -3.9% 24.1% 6,661 -2.9% 69.0% 8,983 -3.2% 93.0%2011 2,375 2.3% 23.8% 6,961 4.5% 69.9% 9,336 3.9% 93.7%2012 2,480 4.4% 23.9% 7,255 4.2% 70.0% 9,735 4.3% 93.9%2013 2,302 -7.2% 21.8% 7,582 4.5% 71.7% 9,884 1.5% 93.5%2014 2,306 0.2% 21.2% 7,908 4.3% 72.6% 10,214 3.3% 93.8%2015 2,399 4.0% 21.4% 8,097 2.4% 72.2% 10,496 2.8% 93.6%
0.2% -2.0% 3.8% 1.6% 2.3% 0.1%
Note: 2015 data most recent year available
Source: State of Hawaii Data Book (previously cited) and CBRE/Hallstrom Team
Compounded Annual Growth
STATE OF HAWAII HISTORICAL DISPOSITION BY BURIAL AND CREMATION 1970-2015
Burials Cremations Total Burial & Cremations

Market Study of the Oahu Cemetery Sector
29
Projection of Interred Cremations
Some cremations result in interment and therefore create demand for additional burial spaces. On a national level, according to the Cremation Association, about 39 percent of persons considering cremation request having their ashes scattered, with about 35 percent being actualized. About 10 percent request to have their urn kept in a family home, and its estimated perhaps 8 percent have their request realized.
Hawaii residents have a longer and greater experience with cremation and are more respectful of interment than the mainland population due to its large and strong Asian-based heritage. Discussion with Oahu mortuaries indicates that at most one-quarter of cremated decedents have their ashes scattered (some opined as few as 15 to 20 percent), and well less than 10 percent have their urns on the family mantle.
Scenario One, resulting in minimum burial space demand, estimated that 25 percent of Oahu cremations result in a scattering of ashes and four percent are otherwise disposed. As shown on the following table this results in an estimated 139,275 interred cremations on the island between 2018 and 2040.
Scenario Two, representing the maximum burial space demand alternative, assumes only 12 percent of Oahu cremations result in the ashes being scattered and 3 percent being otherwise
Year Total DeathsTotal Annual
Cremations (1)Ashes Are
Scattered (2)Other Forms
of Disposal (3)Total Interred Cremations
2018 8,085 5,821 (1,048) (323) 4,4502019 8,212 5,966 (1,074) (328) 4,5642020 8,342 6,115 (1,101) (334) 4,6802021 8,492 6,281 (1,131) (340) 4,8112022 8,646 6,452 (1,161) (346) 4,9452023 8,802 6,628 (1,193) (352) 5,0832024 8,961 6,808 (1,225) (358) 5,2242025 9,126 6,996 (1,259) (365) 5,3722026 9,282 7,179 (1,292) (371) 5,5162027 9,440 7,367 (1,326) (378) 5,6642028 9,601 7,561 (1,361) (384) 5,8162029 9,765 7,759 (1,397) (391) 5,9722030 9,950 7,977 (1,436) (398) 6,1432031 10,119 8,186 (1,473) (405) 6,3082032 10,292 8,400 (1,512) (412) 6,4772033 10,467 8,621 (1,552) (419) 6,6502034 10,646 8,846 (1,592) (426) 6,8282035 10,806 9,060 (1,631) (432) 6,9972036 10,979 9,289 (1,672) (439) 7,1772037 11,155 9,522 (1,714) (446) 7,3622038 11,334 9,762 (1,757) (453) 7,5522039 11,516 10,008 (1,801) (461) 7,7462040 11,694 10,254 (1,846) (468) 7,940
Totals 225,711 180,858 (32,555) (9,028) 139,275
Compiled by CBRE/Hallstrom Team
(3) Includes urns kept at home or other location. Estimated 10% of decedents nationally request this,with estimated 8% actualized. Again we estimate Hawaii at on-half the national average.
ESTIMATE OF TOTAL OAHU CREMATIONS INTERRED 2018 THROUGH 2040
Scenario One: Minimum Demand
(1) Projected to follow trends of last five years of 0.9% growth in percent total deaths ending in cremations on going-forward basis. Currently at 72 percent of total deaths.
(2) Estimated 39% of decedents cremated nationally request this but only about 35% estimated actualized. Hawaii, owing to its Asian cultural components, has higher percentage of cremations and interrs a much higher percentage. We estimate 18% of Hawaii cremations have ashes scattered, one-half national average.

Market Study of the Oahu Cemetery Sector
30
disposed than burial. In this scenario, the total number of interred cremations over the next 23 years is forecast to be 158,409 persons.
Number of Burials
The number of in-ground (casket) burials forecast for the period 2018 through 2040, is a residual estimated calculated by deducting the number of cremations projected in each scenario from their respective total burial estimates previously presented.
The following table displays estimates for burials over the projection period.
In Scenario One, minimum demand perspective, the ratio of deaths which are interred increases at a rate of 0.01 percent compounded annually, resulting in a total of 75,402 burials in the next 23 years.
In Scenario Two, maximum demand perspective, the ratio of deaths which are interred increases at a rate of 0.015 percent compounded annually, resulting in a total of 76,924 burials in the next 23 years
Year Total DeathsTotal Annual
Cremations (1)Ashes Are
Scattered (2)Other Forms
of Disposal (3)Total Interred Cremations
2018 8,147 5,866 (704) (176) 4,9862019 8,340 6,032 (724) (181) 5,1272020 8,537 6,202 (744) (186) 5,2722021 8,738 6,377 (765) (191) 5,4202022 8,944 6,557 (787) (197) 5,5732023 9,156 6,742 (809) (202) 5,7302024 9,372 6,932 (832) (208) 5,8922025 9,593 7,127 (855) (214) 6,0582026 9,819 7,328 (879) (220) 6,2292027 10,051 7,535 (904) (226) 6,4052028 10,288 7,748 (930) (232) 6,5862029 10,531 7,966 (956) (239) 6,7712030 10,780 8,191 (983) (246) 6,9622031 11,034 8,422 (1,011) (253) 7,1592032 11,295 8,660 (1,039) (260) 7,3612033 11,561 8,904 (1,068) (267) 7,5692034 11,834 9,155 (1,099) (275) 7,7822035 12,114 9,414 (1,130) (282) 8,0022036 12,400 9,679 (1,162) (290) 8,2272037 12,692 9,952 (1,194) (299) 8,4592038 12,992 10,233 (1,228) (307) 8,6982039 13,299 10,522 (1,263) (316) 8,9432040 13,612 10,819 (1,298) (325) 9,196
Totals 245,130 186,363 (22,364) (5,591) 158,409
Compiled by CBRE/Hallstrom Team
(2) Estimated at 12% of Hawaii cremations having ashes scattered, two-thirds of Scenario One: Minimum projection.
(3) Estimated at 3% of Hawaii cremations having ashes scattered, three-quarters of Scenario One: Minimum projection.
ESTIMATE OF TOTAL OAHU CREMATIONS INTERRED 2018 THROUGH 2040
Scenario Two: Maximum Demand
(1) Projected to follow trends at one-half growth rate for last five years or 0.45% growth in percent total deaths ending in cremations on going-forward basis. Currently at 72 percent of total deaths.

Market Study of the Oahu Cemetery Sector
31
Number of Veterans Interred at Military/Veterans Cemeteries
Military veterans represent just over 8 percent of the Oahu population, a figure which has been decreasing at .05 percent compounded annually over the past two decades. These individuals have alternative cemetery spaces available to them in Federal and/or State and Local memorial parks; such as the Hawaii State Veterans Cemetery adjacent to HMP.
A national study in 2001 (published 2003) concluded approximately 18 percent of Veterans desiring interment would be buried in military/veteran facilities.
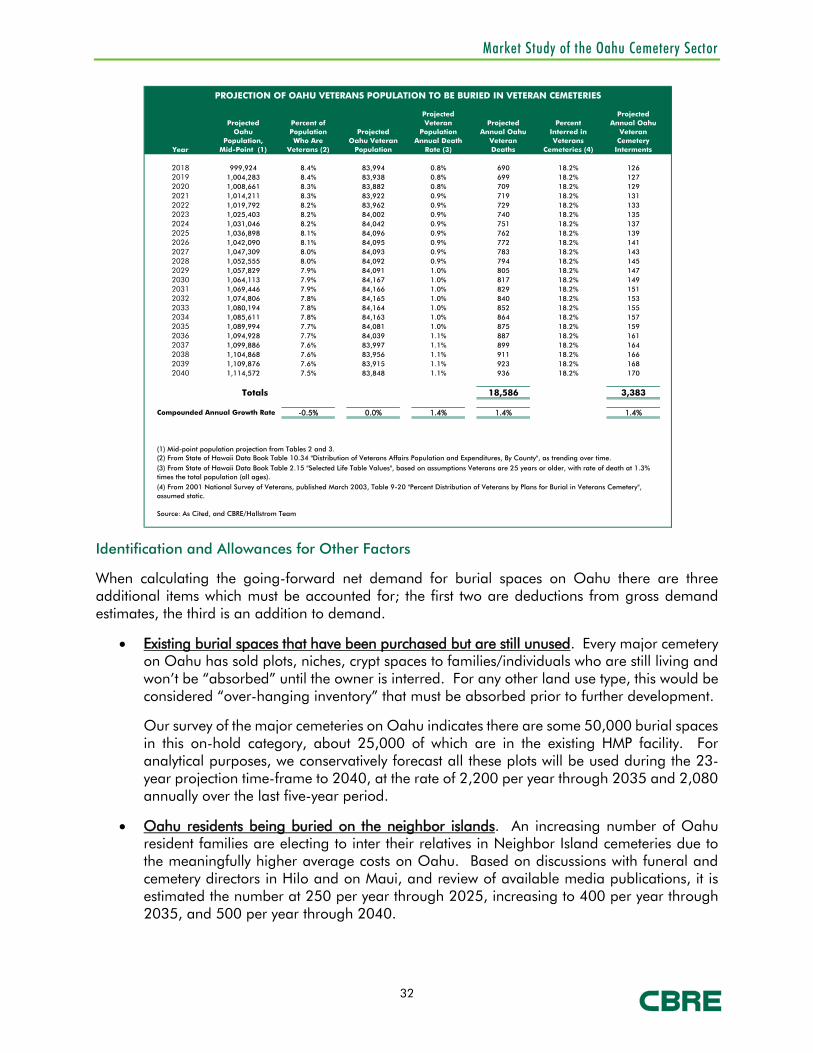
Application of this ratio to the projected Oahu veteran population, using a mid-point estimate, is shown following. The forecast number of veterans buried in veteran cemeteries is estimated at 3,383 persons by 2040.
The purpose of this application is to remove both veteran cemetery burials from demand and veteran cemetery plots from supply.
Year Total DeathsNumber of Burials (1) Total Deaths
Number of Burials (2)
2018 8,085 3,150 8,147 2,6722019 8,212 3,164 8,340 2,7262020 8,342 3,177 8,537 2,7812021 8,492 3,196 8,738 2,8372022 8,646 3,215 8,944 2,8942023 8,802 3,233 9,156 2,9512024 8,961 3,250 9,372 3,0102025 9,126 3,267 9,593 3,0702026 9,282 3,279 9,819 3,1312027 9,440 3,290 10,051 3,1932028 9,601 3,300 10,288 3,2562029 9,765 3,309 10,531 3,3202030 9,950 3,322 10,780 3,3852031 10,119 3,329 11,034 3,4522032 10,292 3,334 11,295 3,5192033 10,467 3,338 11,561 3,5882034 10,646 3,340 11,834 3,6582035 10,806 3,334 12,114 3,7292036 10,979 3,330 12,400 3,8012037 11,155 3,325 12,692 3,8742038 11,334 3,318 12,992 3,9492039 11,516 3,309 13,299 4,0252040 11,694 3,296 13,612 4,102
Totals 225,711 75,402 245,130 76,924
Compiled by CBRE/Hallstrom Team
Scenario One: Minium Demand Scenario Two: Maximum Demand
ESTIMATE OF TOTAL BURIALS ON OAHU 2018 THROUGH 2040
(1) Total Disposal by Burial and Cremation is currently at 94% (rounded), increasing at estimated rate of .01% annually, one-half higher than minimum scenario. Burial figure is residual of total Burial & Cremations less estimated Cremations.
(2) Total Disposal by Burial and Cremation is currently at 94% (rounded), increasing at rate of .015% annually over study period and last five years. Burial figure is residual of total Burial & Cremations less estimated Cremations.
Market Study of the Oahu Cemetery Sector
32
Identification and Allowances for Other Factors
When calculating the going-forward net demand for burial spaces on Oahu there are three additional items which must be accounted for; the first two are deductions from gross demand estimates, the third is an addition to demand.
• Existing burial spaces that have been purchased but are still unused. Every major cemetery on Oahu has sold plots, niches, crypt spaces to families/individuals who are still living and won’t be “absorbed” until the owner is interred. For any other land use type, this would be considered “over-hanging inventory” that must be absorbed prior to further development.
Our survey of the major cemeteries on Oahu indicates there are some 50,000 burial spaces in this on-hold category, about 25,000 of which are in the existing HMP facility. For analytical purposes, we conservatively forecast all these plots will be used during the 23-year projection time-frame to 2040, at the rate of 2,200 per year through 2035 and 2,080 annually over the last five-year period.
• Oahu residents being buried on the neighbor islands. An increasing number of Oahu resident families are electing to inter their relatives in Neighbor Island cemeteries due to the meaningfully higher average costs on Oahu. Based on discussions with funeral and cemetery directors in Hilo and on Maui, and review of available media publications, it is estimated the number at 250 per year through 2025, increasing to 400 per year through 2035, and 500 per year through 2040.
Year
Projected Oahu
Population, Mid-Point (1)
Percent of Population Who Are
Veterans (2)
Projected Oahu Veteran
Population
Projected Veteran
Population Annual Death
Rate (3)
Projected Annual Oahu
Veteran Deaths
Percent Interred in Veterans
Cemeteries (4)
Projected Annual Oahu
Veteran Cemetery
Interments
2018 999,924 8.4% 83,994 0.8% 690 18.2% 1262019 1,004,283 8.4% 83,938 0.8% 699 18.2% 1272020 1,008,661 8.3% 83,882 0.8% 709 18.2% 1292021 1,014,211 8.3% 83,922 0.9% 719 18.2% 1312022 1,019,792 8.2% 83,962 0.9% 729 18.2% 1332023 1,025,403 8.2% 84,002 0.9% 740 18.2% 1352024 1,031,046 8.2% 84,042 0.9% 751 18.2% 1372025 1,036,898 8.1% 84,096 0.9% 762 18.2% 1392026 1,042,090 8.1% 84,095 0.9% 772 18.2% 1412027 1,047,309 8.0% 84,093 0.9% 783 18.2% 1432028 1,052,555 8.0% 84,092 0.9% 794 18.2% 1452029 1,057,829 7.9% 84,091 1.0% 805 18.2% 1472030 1,064,113 7.9% 84,167 1.0% 817 18.2% 1492031 1,069,446 7.9% 84,166 1.0% 829 18.2% 1512032 1,074,806 7.8% 84,165 1.0% 840 18.2% 1532033 1,080,194 7.8% 84,164 1.0% 852 18.2% 1552034 1,085,611 7.8% 84,163 1.0% 864 18.2% 1572035 1,089,994 7.7% 84,081 1.0% 875 18.2% 1592036 1,094,928 7.7% 84,039 1.1% 887 18.2% 1612037 1,099,886 7.6% 83,997 1.1% 899 18.2% 1642038 1,104,868 7.6% 83,956 1.1% 911 18.2% 1662039 1,109,876 7.6% 83,915 1.1% 923 18.2% 1682040 1,114,572 7.5% 83,848 1.1% 936 18.2% 170
Totals 18,586 3,383
Compounded Annual Growth Rate -0.5% 0.0% 1.4% 1.4% 1.4%
(1) Mid-point population projection from Tables 2 and 3.(2) From State of Hawaii Data Book Table 10.34 "Distribution of Veterans Affairs Population and Expenditures, By County", as trending over time.
Source: As Cited, and CBRE/Hallstrom Team
(3) From State of Hawaii Data Book Table 2.15 "Selected Life Table Values", based on assumptions Veterans are 25 years or older, with rate of death at 1.3% times the total population (all ages).(4) From 2001 National Survey of Veterans, published March 2003, Table 9-20 "Percent Distribution of Veterans by Plans for Burial in Veterans Cemetery", assumed static.
PROJECTION OF OAHU VETERANS POPULATION TO BE BURIED IN VETERAN CEMETERIES

Market Study of the Oahu Cemetery Sector
33
• Allowance for off-shore persons being buried on Oahu. Acknowledged to be a generally rare occurrence, an allocation of 15 burials of this type of year contributing to net Oahu demand was made.
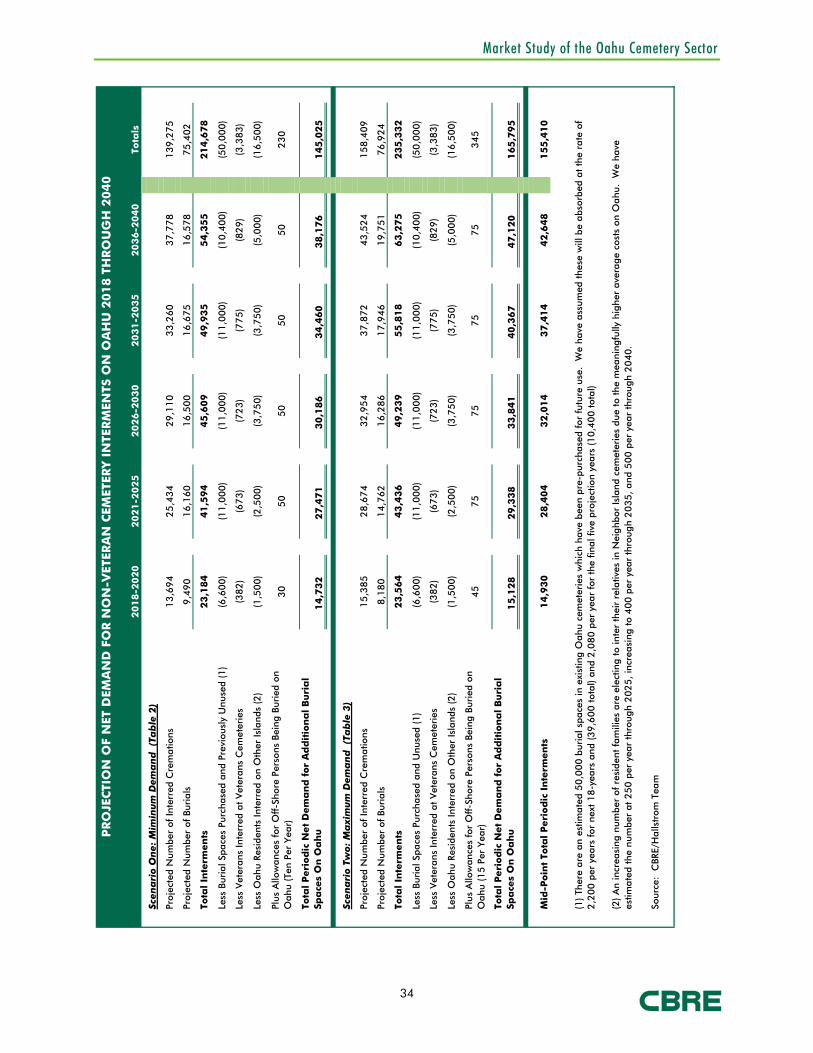
Construction and Application of Model for Net Demand for Burial Spaces
All the preceding variables, allocations and assumptions were used to construct a model forecasting the net demand for additional burial spaces on Oahu from 2018 through 2040 in five intervals, the first being 3 years (2018-20) the remainder being 5-years each (2021-25, 2026-30, 2031-35 and 2036-40).
The model is shown on the following page.
In Scenario One – Minimum Demand, the net additional Oahu burial demand is quantified at 145,025 burial spaces by 2040.
In Scenario Two – Maximum Demand, the net additional Oahu burial demand is quantified at 165,795 burial spaces by 2040.
The mid-point demand is 155,400 burial spaces (rounded).
Market Study of the Oahu Cemetery Sector
34
20
18
-20
20
20
21
-20
25
20
26
-20
30
20
31
-20
35
20
36
-20
40
Tota
ls
Scen
ari
o O
ne:
Mim
inum
Dem
an
d (T
ab
le 2
)
Proj
ecte
d N
umbe
r of
Inte
rred
Cre
mat
ions
13
,69
42
5,4
34
29
,11
03
3,2
60
37
,77
81
39
,27
5
Proj
ecte
d N
umbe
r of
Bur
ials
9,4
90
16
,16
01
6,5
00
16
,67
51
6,5
78
75
,40
2
Tota
l In
term
en
ts2
3,1
84
41
,59
44
5,6
09
49
,93
55
4,3
55
21
4,6
78
Less
Bur
ial S
pace
s Pu
rcha
sed
and
Prev
ious
ly U
nuse
d (1
)(6
,60
0)
(11
,00
0)
(11
,00
0)
(11
,00
0)
(10
,40
0)
(50
,00
0)
Less
Vet
eran
s In
terr
ed a
t V
eter
ans
Cem
eter
ies
(38
2)
(67
3)
(72
3)
(77
5)
(82
9)
(3,3
83
)
Less
Oah
u Re
side
nts
Inte
rred
on
Oth
er Is
land
s (2
)(1
,50
0)
(2,5
00
)(3
,75
0)
(3,7
50
)(5
,00
0)
(16
,50
0)
Plus
Allo
wan
ces
for
Off
-Sho
re P
erso
ns B
eing
Bur
ied
on
Oah
u (T
en P
er Y
ear)
30
50
50
50
50
23
0
Tota
l P
eri
od
ic N
et
Dem
an
d f
or
Ad
dit
ion
al
Bu
ria
l Sp
ace
s O
n O
ah
u1
4,7
32
27
,47
13
0,1
86
34
,46
03
8,1
76
14
5,0
25
Scen
ari
o T
wo:
Ma
xim
um
Dem
an
d (T
ab
le 3
)
Proj
ecte
d N
umbe
r of
Inte
rred
Cre
mat
ions
15
,38
52
8,6
74
32
,95
43
7,8
72
43
,52
41
58
,40
9
Proj
ecte
d N
umbe
r of
Bur
ials
8,1
80
14
,76
21
6,2
86
17
,94
61
9,7
51
76
,92
4
Tota
l In
term
en
ts2
3,5
64
43
,43
64
9,2
39
55
,81
86
3,2
75
23
5,3
32
Less
Bur
ial S
pace
s Pu
rcha
sed
and
Unu
sed
(1)
(6,6
00
)(1
1,0
00
)(1
1,0
00
)(1
1,0
00
)(1
0,4
00
)(5
0,0
00
)
Less
Vet
eran
s In
terr
ed a
t V
eter
ans
Cem
eter
ies
(38
2)
(67
3)
(72
3)
(77
5)
(82
9)
(3,3
83
)
Less
Oah
u Re
side
nts
Inte
rred
on
Oth
er Is
land
s (2
)(1
,50
0)
(2,5
00
)(3
,75
0)
(3,7
50
)(5
,00
0)
(16
,50
0)
Plus
Allo
wan
ces
for
Off
-Sho
re P
erso
ns B
eing
Bur
ied
on
Oah
u (1
5 P
er Y
ear)
45
75
75
75
75
34
5
Tota
l P
eri
od
ic N
et
Dem
an
d f
or
Ad
dit
ion
al
Bu
ria
l Sp
ace
s O
n O
ah
u1
5,1
28
29
,33
83
3,8
41
40
,36
74
7,1
20
16
5,7
95
Mid
-Poin
t To
tal
Peri
od
ic I
nte
rmen
ts1
4,9
30
28
,40
43
2,0
14
37
,41
44
2,6
48
15
5,4
10
Sour
ce:
CBR
E/H
alls
trom
Tea
m
PR
OJE
CTI
ON
OF
NET
DEM
AN
D F
OR
NO
N-V
ETER
AN
CEM
ETER
Y IN
TER
MEN
TS O
N O
AH
U 2
018 T
HR
OU
GH
2040
(1)
Ther
e ar
e an
est
imat
ed 5
0,0
00
bur
ial s
pace
s in
exi
stin
g O
ahu
cem
eter
ies
whi
ch h
ave
been
pre
-pur
chas
ed f
or f
utur
e us
e.
We
have
ass
umed
the
se w
ill b
e ab
sorb
ed a
t th
e ra
te o
f 2
,20
0 p
er y
ears
for
nex
t 1
8-y
ears
and
(3
9,6
00
tot
al)
and
2,0
80
per
yea
r fo
r th
e fin
al f
ive
proj
ectio
n ye
ars
(10
,40
0 t
otal
)
(2)
An
incr
easi
ng n
umbe
r of
res
iden
t fa
mili
es a
re e
lect
ing
to in
ter
thei
r re
lativ
es in
Nei
ghbo
r Is
land
cem
eter
ies
due
to t
he m
eani
ngfu
lly h
ighe
r av
erag
e co
sts
on O
ahu.
W
e ha
ve
estim
ated
the
num
ber
at 2
50
per
yea
r th
roug
h 2
02
5,
incr
easi
ng t
o 4
00
per
yea
r th
roug
h 2
03
5,
and
50
0 p
er y
ear
thro
ugh
20
40
.

Market Study of the Oahu Cemetery Sector
35
IDENTIFICATION OF EXISTING AND PROPOSED SUPPLY
Identify Existing Major Cemeteries with Burial Spaces for Purchase
The six major cemeteries on Oahu still offering burial plot inventory are summarized on the table below and identified on the subsequent map.
Prop
erty
Diam
ond
Head
Mem
oria
l Par
kN
uuan
u M
emor
ial P
ark
Oah
u Ce
met
ery
Valle
y of
the
Tem
ples
Mem
oria
l Par
kM
ilila
ni M
emor
ial P
ark
Laie
Cem
eter
ies
Inte
ior S
ite P
hoto
Aeria
l Pho
to
Addr
ess
529
18th
Ave
223
Nuua
nu A
venu
e21
62 N
uuan
u Av
e47
-200
Kah
ekili
Hwy
94-5
60 K
ameh
ameh
a Hw
y55
-710
Wah
inep
ee S
treet
Loca
tion
Hono
lulu
Hono
lulu
Hono
lulu
Kane
ohe
Milil
ani
Laie
Year
Ope
ned
1936
1949
1844
1963
1965
1922
Gros
s Acr
eage
25.0
3.5
15.5
244.
014
3.0
5.0
Buria
l Are
a Ac
reag
e22
.83
1585
635
Exist
ing
Buria
ls (In
cludi
ng
Plots,
Cry
pts,
Nich
es)
30,5
007,
800+
/-25
,000
88,0
0070
,000
4,20
0
Estim
ated
Sal
eabl
e Av
aila
ble
300+
/- P
lots,
1,0
00+
Nich
es0
plot
s, 20
0 cr
ypts,
500
+ n
iches
100
Plots,
600
+ N
iches
7,50
0 pl
ots/
cryp
ts, 2
,200
nich
es3,
800
300+
Po
tent
ial E
xpan
sion
Acre
sNo
neNo
neNo
ne44
35 P
oten
tial,
17 p
ropo
sed
Poss
ible
Pr
opos
ed P
lots/
Nich
es0
00
46,0
0019
,000
Unpl
aned
at P
rese
nt
Full
Size
Plot P
rice
$8,8
00 -
$9,3
00$6
,700
- $1
1,00
0 (C
rypt
s)$1
0,00
0 - $
15,0
000
$3,0
00 -
$81,
001
$6,1
00$2
,000
Urn
Plots
$4,2
50 -
$5,5
50$5
,670
- $5
,880
$3,5
00 -
$5,5
00$2
,100
sing
le, $
2,90
0 Do
uble
$700
Sin
gle,
$3,
400
Doub
le$2
,000
Sour
ce:
Cite
d Ce
met
erie
s, St
ate
DCCA
and
CBR
E/Ha
llstro
m Te
am
SUM
MAR
Y O
F AC
TIVE
OAH
U CE
MET
ERIE
S
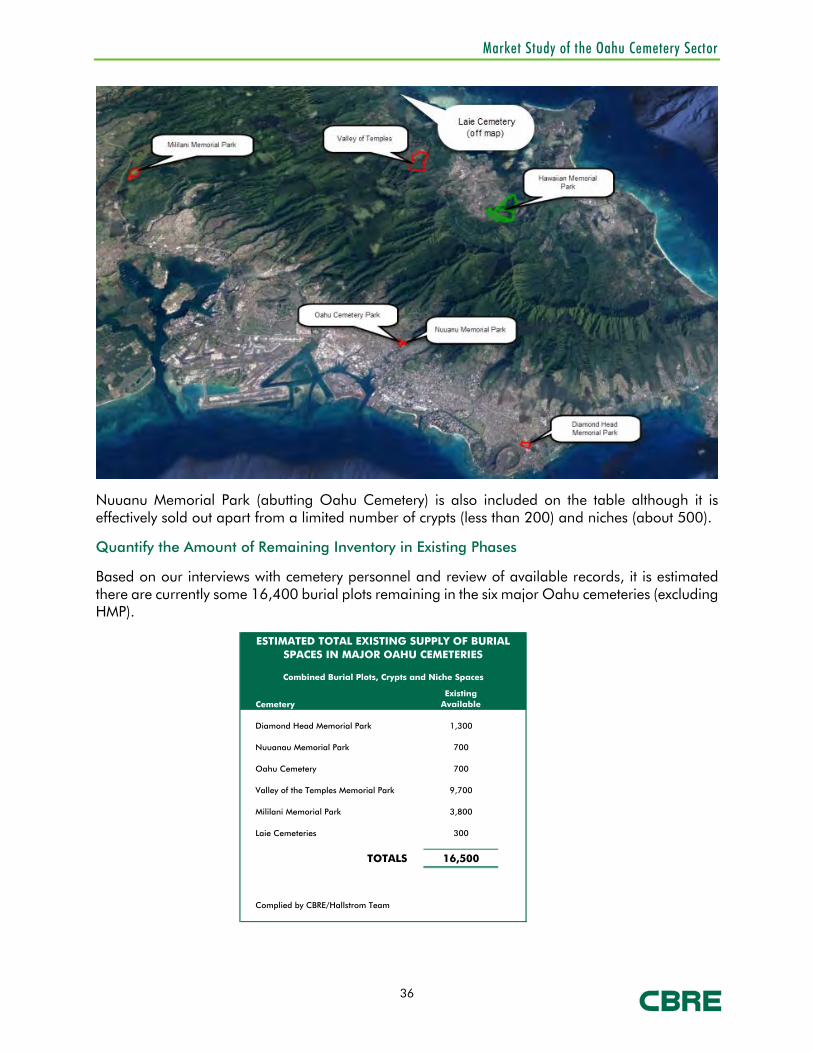
Market Study of the Oahu Cemetery Sector
36
Nuuanu Memorial Park (abutting Oahu Cemetery) is also included on the table although it is effectively sold out apart from a limited number of crypts (less than 200) and niches (about 500).
Quantify the Amount of Remaining Inventory in Existing Phases
Based on our interviews with cemetery personnel and review of available records, it is estimated there are currently some 16,400 burial plots remaining in the six major Oahu cemeteries (excluding HMP).
CemeteryExisting
Available
Diamond Head Memorial Park 1,300
Nuuanau Memorial Park 700
Oahu Cemetery 700
Valley of the Temples Memorial Park 9,700
Mililani Memorial Park 3,800
Laie Cemeteries 300
TOTALS 16,500
Complied by CBRE/Hallstrom Team
ESTIMATED TOTAL EXISTING SUPPLY OF BURIAL SPACES IN MAJOR OAHU CEMETERIES
Combined Burial Plots, Crypts and Niche Spaces

Market Study of the Oahu Cemetery Sector
37
Project the Number of Additional Inventory to be Provided in Expansion or New Projects
There is a high barrier to entry in the Oahu cemetery sector due to the scarcity of available sites, high land costs and infrastructure expenses, and community issues. There hasn’t been a new public cemetery opened on the island in circa 50 years despite evident rising demand and dwindling supply.
In mid-2007 plans surfaced for a new cemetery that would total approximately 60,000 plots on a 69.01-acre parcel in Kamilo Nui Valley in Hawaii Kai named Paradise Memorial Park, which was to have an address of 7488 Hawaii Kai Drive.
In 2010, entities involved with the development entered bankruptcy. Later that year the project was restructured and subsequently has been periodically announced to be moving forward; though no additional details or project schedules have proven determinative. The first phase is to contain 12,000 burial plots. For purposes of this analysis, we have assumed it will break-ground and complete and sell-out the first two phases of the facility within our 2018-2040 projection period.
We estimate the total number of existing and proposed burial space inventory available to service the Oahu disposal demand over the coming 23-years, apart from HMP, will total some 105,500 plots, as summarized below.
CemeteryExisting
AvailableCurrently Proposed
Total Availalble and Proposed
Diamond Head Memorial Park 1,300 0 1,300
Nuuanau Memorial Park 700 0 700
Oahu Cemetery 700 0 700
Valley of the Temples Memorial Park 9,700 46,000 55,700
Mililani Memorial Park 3,800 19,000 22,800
Laie Cemeteries 300 0 300
Hawaii Kai Cemetery (Proposed) (1) 0 24,000 24,000
TOTALS 16,500 89,000 105,500
Complied by CBRE/Hallstrom Team
Combined Burial Plots, Crypts and Niche Spaces
MAXIMUM ESTIMATED TOTAL EXISTING AND PROPOSED SUPPLY OF MAJOR OAHU INTERMENT OPTIONS BY 2040
(1) Phase I will have 12,000 burial spaces of total build-out of 60,000. We have assumed two phases, or 24,000 spaces, will be made available in projection time-frame to 2040.

Appropriateness of the Proposed Use and Absorption Estimates
38
Appropriateness of the Subject Property for Proposed Use and Absorption Estimates APPROPRIATENESS ANALYSIS
Considering the quantified market support for the proposed subject cemetery development, the next step in analysis is to assess whether the site and concept are appropriate from a market perspective, are in concert with macro demand trends, and forecast the probable standing of the HMP product therein. These insights determine the competitiveness and resulting probable market shares for the HMP Expansion project inventory.
The master plan for the subject project is consistent with modern cemetery planning objectives, including considerations for view, maximizing use of easily walkable terrain, creating individual/exclusive burial areas, and addressing feng shui issues (a critical concern in Hawaii). As previously presented, among the features considered most relevant relative to achieving full-market acceptance:
• Exceptional panoramas stretching for miles along the Koolau Pali, encompassing the hills of Mokapu Peninsula and the waters of Kaneohe Bay.
• Feelings of serenity enhanced by a surrounding buffer of dense rain forest flora and open spaces and insulation from future intruding land uses.
• Gently flowing terrain creating discrete memorial gardens within the larger park.
• Excellent exposure and direct access from Kamehameha Highway, and immediately north of the H-3 Freeway, 1.5 miles north and south, respectively of the Pali and Likelike Highways.
• Proximity to Kaneohe and Kailua, the two largest windward towns, and only ten miles from Downtown Honolulu. It is the closest cemetery to Honolulu with significant numbers of burial spaces available.
• Favorable windward climate which keeps lawns green and air fresh.
The HMP Expansion plan is an appropriate use of the subject property from an economic acceptance perspective based on a variety of criteria, including:
• It will convert a currently non-productive, sloping holding into a comprehensively-designed sustainable development which will help meet future burial needs in the region and islandwide.
• It will attract significant capital investment into the community and create jobs during its construction.
• It will provide for the continuation of dozens of cemetery sales, services, management and maintenance jobs that would otherwise be diminished once the existing HMP is fully occupied.
• It will enhance economic activity in the Oahu death services industry.

Appropriateness of the Proposed Use and Absorption Estimates
39
• It will provide a permanent buffer for southerly Kaneohe enabling the town to resist urban sprawl.
• It is consistent with regional Honolulu County community sustainable plans.
We conclude the proposed HMP Expansion project master plan represents a highest and best use of the underling site, will provide a positive return to the land, and will bring economic activity to a site currently hosting none. The use and the proposed project are appropriate for the property.
APPLICATION OF ABSORPTION ESTIMATING TECHNIQUES
Based on these attributes of the subject property, analysis of the Oahu cemetery sector, and the historic experience of HMP and competitive projects in the islandwide marketplace, the probable absorption velocity for the subject inventory was estimated using three methodologies:
• Gross Demand/Supply Comparison -- This technique assumes that if there is insufficient existing and planned supply to meet projected market gross demand levels during the projection period there is rational support for the subject units.
• The Residual Method -- In this technique, all the competitive inventory existing and proposed for development on Oahu during the 2018-2040 projection period is placed on a time-line depicting their combined anticipated rates of absorption or assuming a reasonable market share. To the extent this periodic supply of burial spaces falls short of the forecast periodic demand for product on Oahu an undersupply situation is present and there is "residual" demand remaining for the HMP Expansion inventory. This method is considered the most conservative as it allows the maximal competitive product to achieve their full absorption potential before any residual demand flows to absorb the subject.
• The Market Shares Method -- This approach accounts for the probable competitiveness of the subject inventory regardless of the total level of product being otherwise offered on the market. It is an estimate of how much of the total forecast net demand for additional burial spaces on Oahu the proposed project could expect to capture on an annual basis considering its history, location, product type, probable pricing, perceived competitiveness, and other characteristics.
On a islandwide basis, the Gross Demand method indicates there is strong- support for the HMP Expansion project. The net demand for non-military burial spaces on Oahu through 2040 is forecast to be between 145,000 and 164,800 total plots (rounded). The remaining unsold existing and proposed inventory (apart from HMP) total some 105,500 units or only 64 to 73 percent of the needed product.
Therefore, this method is highly supportive of sufficient market demand existing over the coming two-plus decades to successfully absorb all the subject product during a reasonable exposure period.
If it is optimistically assumed the (reasonably) proposed burial space inventory in existing and unbuilt projects will be built out by 2040 placing some 105,500 new plots on the Oahu market there will remain substantial unmet Residual Demand for product in every projection period from 2017-2020 through 2018-2020 through 2036-2040, as shown on the chart below.
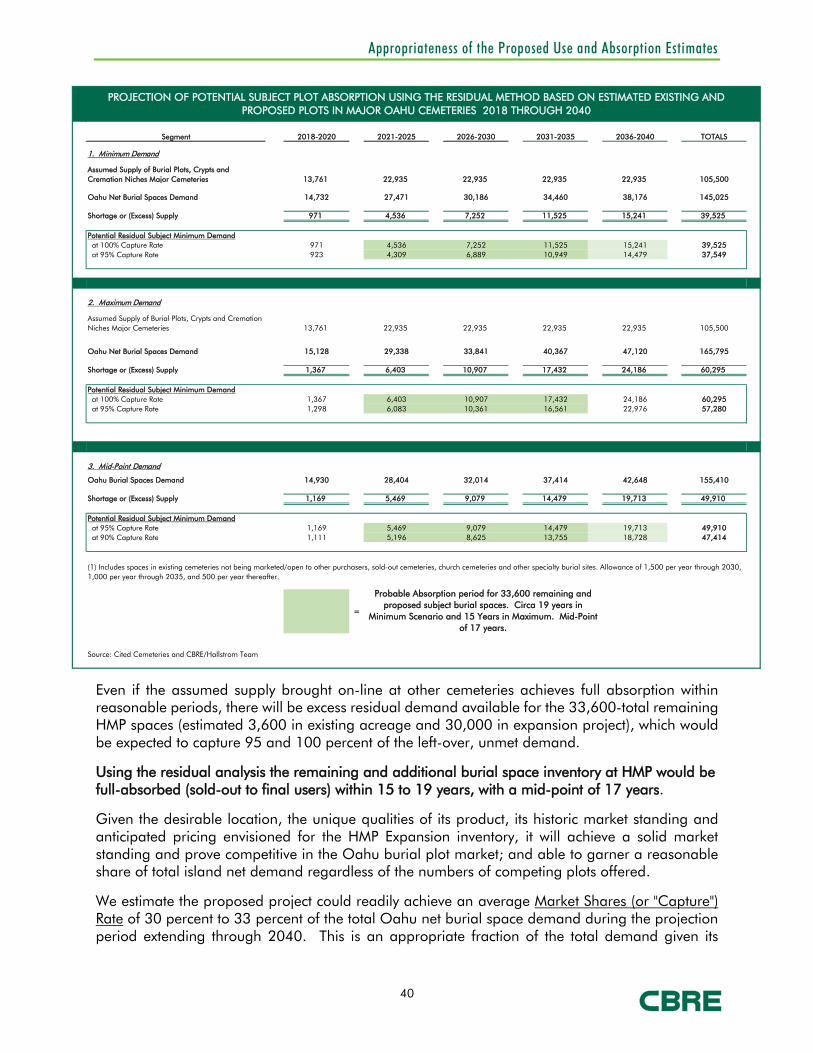
Appropriateness of the Proposed Use and Absorption Estimates
40
Even if the assumed supply brought on-line at other cemeteries achieves full absorption within reasonable periods, there will be excess residual demand available for the 33,600-total remaining HMP spaces (estimated 3,600 in existing acreage and 30,000 in expansion project), which would be expected to capture 95 and 100 percent of the left-over, unmet demand.
Using the residual analysis the remaining and additional burial space inventory at HMP would be full-absorbed (sold-out to final users) within 15 to 19 years, with a mid-point of 17 years.
Given the desirable location, the unique qualities of its product, its historic market standing and anticipated pricing envisioned for the HMP Expansion inventory, it will achieve a solid market standing and prove competitive in the Oahu burial plot market; and able to garner a reasonable share of total island net demand regardless of the numbers of competing plots offered.
We estimate the proposed project could readily achieve an average Market Shares (or "Capture") Rate of 30 percent to 33 percent of the total Oahu net burial space demand during the projection period extending through 2040. This is an appropriate fraction of the total demand given its
Segment 2018-2020 2021-2025 2026-2030 2031-2035 2036-2040 TOTALS
1. Minimum Demand
Assumed Supply of Burial Plots, Crypts and Cremation Niches Major Cemeteries 13,761 22,935 22,935 22,935 22,935 105,500
Oahu Net Burial Spaces Demand 14,732 27,471 30,186 34,460 38,176 145,025
Shortage or (Excess) Supply 971 4,536 7,252 11,525 15,241 39,525
Potential Residual Subject Minimum Demand at 100% Capture Rate 971 4,536 7,252 11,525 15,241 39,525 at 95% Capture Rate 923 4,309 6,889 10,949 14,479 37,549
2. Maximum Demand
Assumed Supply of Burial Plots, Crypts and Cremation Niches Major Cemeteries 13,761 22,935 22,935 22,935 22,935 105,500
Oahu Net Burial Spaces Demand 15,128 29,338 33,841 40,367 47,120 165,795
Shortage or (Excess) Supply 1,367 6,403 10,907 17,432 24,186 60,295
Potential Residual Subject Minimum Demand at 100% Capture Rate 1,367 6,403 10,907 17,432 24,186 60,295 at 95% Capture Rate 1,298 6,083 10,361 16,561 22,976 57,280
3. Mid-Point Demand
Oahu Burial Spaces Demand 14,930 28,404 32,014 37,414 42,648 155,410
Shortage or (Excess) Supply 1,169 5,469 9,079 14,479 19,713 49,910
Potential Residual Subject Minimum Demand at 95% Capture Rate 1,169 5,469 9,079 14,479 19,713 49,910 at 90% Capture Rate 1,111 5,196 8,625 13,755 18,728 47,414
=
Source: Cited Cemeteries and CBRE/Hallstrom Team
PROJECTION OF POTENTIAL SUBJECT PLOT ABSORPTION USING THE RESIDUAL METHOD BASED ON ESTIMATED EXISTING AND PROPOSED PLOTS IN MAJOR OAHU CEMETERIES 2018 THROUGH 2040
(1) Includes spaces in existing cemeteries not being marketed/open to other purchasers, sold-out cemeteries, church cemeteries and other specialty burial sites. Allowance of 1,500 per year through 2030, 1,000 per year through 2035, and 500 per year thereafter.
Probable Absorption period for 33,600 remaining and proposed subject burial spaces. Circa 19 years in
Minimum Scenario and 15 Years in Maximum. Mid-Point of 17 years.
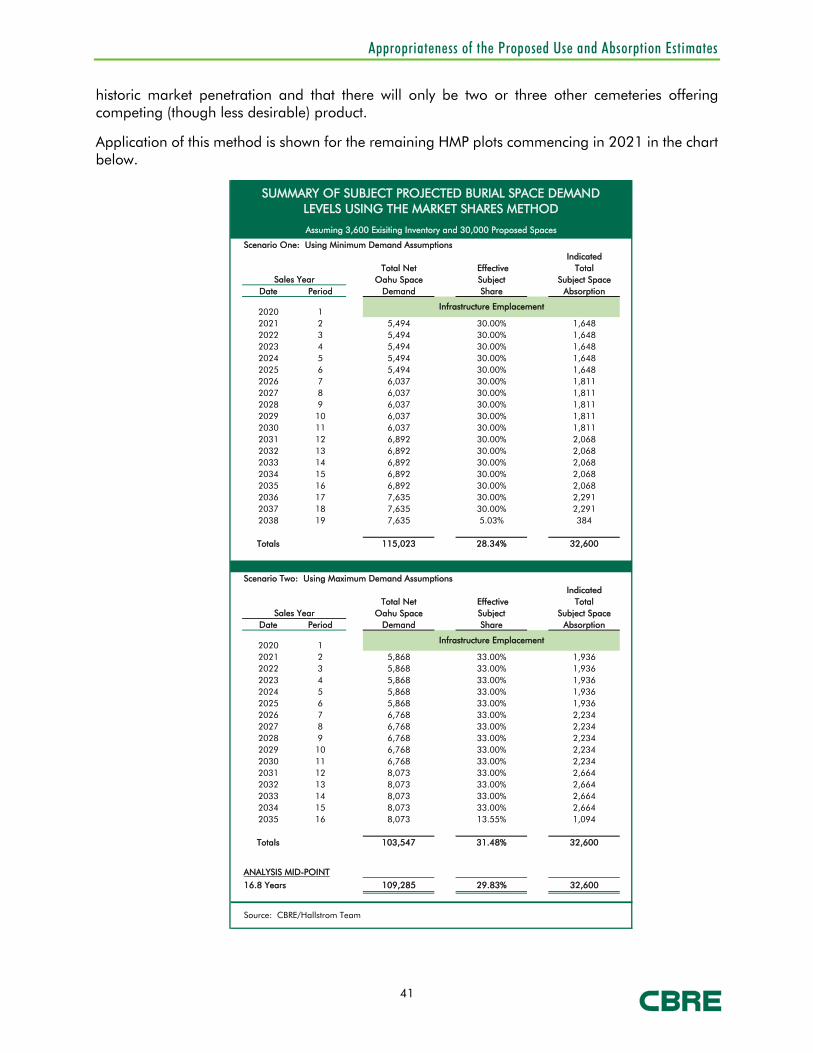
Appropriateness of the Proposed Use and Absorption Estimates
41
historic market penetration and that there will only be two or three other cemeteries offering competing (though less desirable) product.
Application of this method is shown for the remaining HMP plots commencing in 2021 in the chart below.
Scenario One: Using Minimum Demand AssumptionsIndicated
Total Net Effective TotalOahu Space Subject Subject Space
Date Period Demand Share Absorption
2020 1 2021 2 5,494 30.00% 1,648 2022 3 5,494 30.00% 1,648 2023 4 5,494 30.00% 1,6482024 5 5,494 30.00% 1,6482025 6 5,494 30.00% 1,6482026 7 6,037 30.00% 1,8112027 8 6,037 30.00% 1,8112028 9 6,037 30.00% 1,8112029 10 6,037 30.00% 1,8112030 11 6,037 30.00% 1,8112031 12 6,892 30.00% 2,0682032 13 6,892 30.00% 2,0682033 14 6,892 30.00% 2,0682034 15 6,892 30.00% 2,0682035 16 6,892 30.00% 2,0682036 17 7,635 30.00% 2,2912037 18 7,635 30.00% 2,2912038 19 7,635 5.03% 384
Totals 115,023 28.34% 32,600
Scenario Two: Using Maximum Demand AssumptionsIndicated
Total Net Effective TotalOahu Space Subject Subject Space
Date Period Demand Share Absorption
2020 1 2021 2 5,868 33.00% 1,936 2022 3 5,868 33.00% 1,936 2023 4 5,868 33.00% 1,9362024 5 5,868 33.00% 1,9362025 6 5,868 33.00% 1,9362026 7 6,768 33.00% 2,2342027 8 6,768 33.00% 2,2342028 9 6,768 33.00% 2,2342029 10 6,768 33.00% 2,2342030 11 6,768 33.00% 2,2342031 12 8,073 33.00% 2,6642032 13 8,073 33.00% 2,6642033 14 8,073 33.00% 2,6642034 15 8,073 33.00% 2,6642035 16 8,073 13.55% 1,094
Totals 103,547 31.48% 32,600
ANALYSIS MID-POINT16.8 Years 109,285 29.83% 32,600
Source: CBRE/Hallstrom Team
Infrastructure Emplacement
Sales Year
Sales Year
SUMMARY OF SUBJECT PROJECTED BURIAL SPACE DEMAND LEVELS USING THE MARKET SHARES METHOD
Assuming 3,600 Exisiting Inventory and 30,000 Proposed Spaces
Infrastructure Emplacement

Appropriateness of the Proposed Use and Absorption Estimates
42
A total absorption period for the subject burial spaces would be between 15.4-years and 18.2-years, with a mid-point at 16.8 years. This equates to an average market capture rate of 29.8 percent with an average annual absorption of 1,975 plots.
Correlation of the three absorption quantification techniques indicates the 33,600 burial spaces which will be remaining at HMP in the existing and expansion areas once the latter is opened for sale and interment in 2021-will achieve full sell-out/absorption within approximately 17 years of offering.

Economic Impacts of the Proposed Development
43
Economic Impacts of the Proposed Development The tables containing the data, analysis and modeling comprising this section of our study are contained in the addenda, including the full-size print-outs of those excerpted into the narrative section.
The expansion of HMP will result in significant expenditures that will favorably impact the Oahu economy on both a direct and indirect basis, increasing the level of capital investment and capital flow in the region, which will in turn contribute to and extend employment opportunities and the tax base.
From a direct perspective, the project will create numerous construction, equipment operator and specialty trade jobs on- and off-site, directly and indirectly, during the planning and emplacement of the infrastructure.
After completion of the common systems the existing employment at the HMP will be extended (and marginally enhanced) for several additional decades; including positions which would otherwise gradually fade away as the currently available plots are sold and utilized.
There are currently 38 staff positions at HMP, include 20 maintenance workers, 10 administrative, 5 in funeral services and 3 for community services. The expansion project will keep this core in demand until mid-century or beyond as the 32,600 plots (remaining in existing park area and in expansion area) are sold-out (by 2035) and interments continue thereafter.
We estimate the expansion area, adding 28 acres to the existing 80-acre park, will proportionately increase the need for maintenance workers by a similar percentage over time, up from the current 20 to 27 positions. In the long-term there may be some diminishment in the total number of administrative and service positions, but we consider such would be nominal as burials and resale of plots, and oversight of the HMP will continue long after they are sold-out.
We have estimated the wages and benefits for the construction and operating personnel during the absorption period (2020 through 2035) and on a generally stabilized basis following. In addition to the on-site workers there will be significant off-site worker-years created on Oahu servicing the construction effort and the HMP employees and operations.
Numerous local businesses will see significant profit opportunities arising for contracting companies emplacing the infrastructure, and for local businesses which would supply a substantial portion of the materials needed in the effort.
The general island economy also will benefit from the subject development, as its employees will spend their discretionary income in shops, restaurants, and service establishments throughout Oahu, and in purchasing goods and services.
Indirectly, as these wages, profits, and expenditures move through the regional economy, they will have a ripple, or "multiplier," effect which increases the amount of capital flowing to the entire community resulting from the development of the subject.
Construction, operational and other workers earning wages via HMP expansion and associated off-site/supporting efforts will spend the majority of their income on living and entertainment expenses while supporting and patronizing other island businesses. Much of this spending would be re-directed by these businesses to other island industries, and significant portions of these secondary profits would in turn be put back through the region's economic and tax structure.

Economic Impacts of the Proposed Development
44
These substantial direct and indirect economic impacts associated with the proposed subject project, as quantified following, are all the result of the capital investment and entrepreneurship necessary to convert undeveloped preservation lands into a cemetery. The Honolulu County economy will be meaningfully stimulated by the capital investments, worker spending and business operations of the development.
Our economic analysis was based on a 16-year build-out and sell-out/absorption modeling period (2020 through 2035). The full entitlement and construction could possibly take a shorter or longer period; however, whether full development and sales takes 16 or 20 years, the economic impact during the build-out period and stabilized "operation" of the cemetery will be the same following completion. As constant, uninflated 2018 dollars are used throughout the model, time is not a significant variable in the analysis.
For modeling purposes, the life-span of the project from final approvals through build-out and stabilization are assumed as shown in the following table.
It is anticipated that final approvals, surveys and planning will require approximately 18 months (through 2018 and 2019), the site work and infrastructure will be completed in 2020, plot sales and initial interments commence in 2021, with total sell-out/absorption completed by 2035. Interments and plot re-sales would continue thereafter.
ProjectYear Year Activity
2018-19 1 &2 Achieve full-entitlement, approvals and permits
2020 3 Site preparation and emplacement of infrastructure
2021 4 Expansion area sales and interments commence
2022-2035 5 through 16Sales of plots and interments continue, with full sell-
out/absorption by 2035
Post-2035 17 and BeyondInterments continue at lower-velocity along with re-sales of
plots over the long-term
PROJECTED HAWAII MEMORIAL PARK EXPANSION INFRASTRUCTURE, SALES/ABSORPTION AND INTERMENT TIMING

Economic Impacts of the Proposed Development
45
CAPITAL INVESTMENT AND CONSTRUCTION COSTS
The subject will bring an estimated $29.3 million in direct development capital into Oahu during one-year infrastructure emplacement period for the project, as shown below. All-in costs were estimated by Sam O. Hirota, Inc. in April 2018.
DIRECT BUSINESS PROFITS FROM CONSTRUCTION
While a significant percentage of the materials needed to build the subject infrastructure must be imported to Oahu, a portion of the construction costs spent in the development will directly flow to local businesses in the form of contractor profits and supplier profits.
Typically, within the industry net contractor profit margins are expected to be at 8 to 20 percent of total construction costs. We have used a conservative ten percent figure. Supplier profits were extrapolated at four percent of total costs
The cumulative Contractor's Profit generated by the HMP expansion for local building companies will total an estimated $2.9 million over the construction period. The total Supplier's Profit would be some $1.2 million in aggregate.
EMPLOYMENT OPPORTUNITIES CREATED
Based on indicators provided by the construction of comparable sized projects and Hawaii industry averages, we have estimated the demand for on- and off-site, direct and indirect, full-time
Totals During
Item Build-Out
2020 to 2025 2026 to 2030 2031-2035
Infrastructure Emplacement (1) $29,304,000 $0 $0 $29,304,000
TOTAL PERIODIC CONSTRUCTION COSTS $29,304,000 $0 $0 $29,304,000
Contractor Profits $2,930,400 $0 $0 $2,930,400
Supplier Profits $1,172,160 $0 $0 $1,172,160
Source: CBRE/Hallstrom Team
(1) "Hawaiian Memorail Park Expansion Cost Estimate" Sam O. Hirota, Inc., April 30, 2018. Includes site work, on and & off-site infrastructure, roadways and contingency; engineering & architecture, permits and study fees.
Development and Sales Period
PROPOSED DEVELOPMENT SCHEDULE AND ESTIMATED CONSTRUCTION COSTS
All Amounts Expressed in Constant 2018 Dollars

Economic Impacts of the Proposed Development
46
equivalent employment positions associated with laying of initial infrastructure systems and in providing continuing maintenance and operating services to the expanded park.
The construction, maintenance, and indirect/off-site employment opportunities created/sustained by the subject development will not all be "new" jobs and will not require new Oahu residents. They will be new opportunities for in-place resident construction trade workers and existing local supply businesses, and to maintain the existing HMP job count which would otherwise be diminished or falter as the current Park plots are filled and no new inventory is available.
It is assumed the off-site/indirect work created will be steered towards existing Oahu supply and equipment providers and in-place businesses.
The following table summarizes our worker-years, full-time equivalent (FTE) projections for the HMP expansion during construction and sell-out absorption and on a stabilized on-going annual basis thereafter.
A total of 73 worker-years of employment in the construction trades will be needed for site work and emplacing the infrastructure for the HMP expansion project.
The existing operating staff of 38 workers is assumed to continue at that job count with the exception of seven added maintenance workers over time to care for the additional 28 acres of grave sites. It is assumed this level of staffing will continue into the long-term after 2035, although we acknowledge there may be some slippage in the administrative, sales and servicing departments,
Off-Site/Indirect/Secondary employment created by the HMP expansion, estimated at one-third the on-site/direct job count will total 233 worker-years from 2020 through 2023 and 15 FTE positions per year as stabilized.
Totals During
Build-Out
Construction Employment (1) 2020 to 2025 2026 to 2030 2031-2035
Infrastructure Emplacement 73 73
Total Periodic Construction Jobs 73 0 0 73
On-Going Employment StabilizedAnnually
Maintenance, Administrative and Services 190 210 225 625
Total FTE Jobs in Place at End of Period 38 42 45 45
Off-Site Employment (3) 88 70 75 233
Total FTE Jobs in Place at End of Period 37 14 15 15
TOTAL PERIODIC WORKER YEARS 351 280 300 931
TOTAL END-OF-PERIOD PERMANENT JOBCOUNT 51 56 60 60
(1) Infrastructure construction employment estimated at 1 worker-year for every $400,000 in costs. Includes all direct employment associated with construction, on and off-site.
(3) Estimated at one cumulative off-site employment position for every three on site positions.
Source: CBRE/Hallstrom Team
ESTIMATED YEARLY FULL-TIME EQUIVALENT EMPLOYMENT POSITIONS CREATED BY DEVELOPMENT
Development and Sales Period
(2) Current staff of 38 employees, including 20 maintenance, 10 administrative, 5 funeral services and 3 community services. Expansion of existing park from 80 acres to 108 acres will create an additional 7 maintenance positions.

Economic Impacts of the Proposed Development
47
WAGE INCOME GENERATED
In accordance with data compiled by the state Department of Labor and Industry Relations, as tempered through our analysis, and the actual current operating payroll of HMP, we have estimated the personal income (in the form of wages) which will flow to Oahu workers as a result of HMP expansion construction and use. The results are shown on the table below.
Total construction wages paid during infrastructure emplacement will be $5.9 million.
Current payroll at the HMP is some $2.7 million annually for the 38-member staff. We have assumed this amount will continue on a going-forward basis apart from the addition of new maintenance staff to service the expansion area, paid proportionately to the existing workers. Total HMP employee wages during the modeling period will be $43.8 million and stabilize at $3.2 million thereafter.
Off-sits/indirect employee wages will total $13.1 million during build-out and be $842,400 annually on a stabilized basis.
OPERATING ECONOMIC ACTIVITY
We estimate the operating economic activity within the HMP expansion area will be comprised of three components:
• The $29.3 million in infrastructure expenditures.
Totals During
Build-Out
Construction Wages (1) 2020 to 2025 2026 to 2030 2031-2035
Infrastructure Emplacement $5,942,851 $5,942,851
Total Periodic Construction Wages $5,942,851 $0 $0 $5,942,851
Stabilized
Annually
Maintenance, Administrative and Services (2)
Annual Wages $2,665,485 $2,946,062 $3,156,495 $8,768,043 $3,156,495
Total Periodic Wages $13,327,425 $14,730,312 $15,782,477 $43,840,214
Off-Site Employment Wages (3)
Annual Average Wages $821,371 $786,240 $842,400 $2,178,571
Total Periodic Wages $4,928,227 $3,931,200 $4,212,000 $13,071,427 $842,400
TOTAL PERIODIC WAGES $24,198,503 $18,661,512 $19,994,477 $62,854,492 $3,998,895
(1) Average annual wage for full-time-equivalent construction worker (equipment operators and other infrastructure-related trades ) at $81,120 ($39/hour X 2,080 hours).
(2) Based on current payroll of HMP. Added workers due to expansion assumed to be at average proportional wage.
(3) Average annual wage for full-time-equivalent general worker at $56,160 ($27/hour), the average wage for all "All Occupations" in the state.
Wages taken from US Department of Labor "May 2017 Metropolitan and Non-Metropolitan Area Occupational Employment and Wage Estimates - Urban Honolulu, HI" escalated one year.
Source: CBRE/Hallstrom Team
Development and Sales Period
ESTIMATED YEARLY EMPLOYEE WAGES CREATED BY DEVELOPMENT
All Amounts Expressed in Constant 2018 Dollars
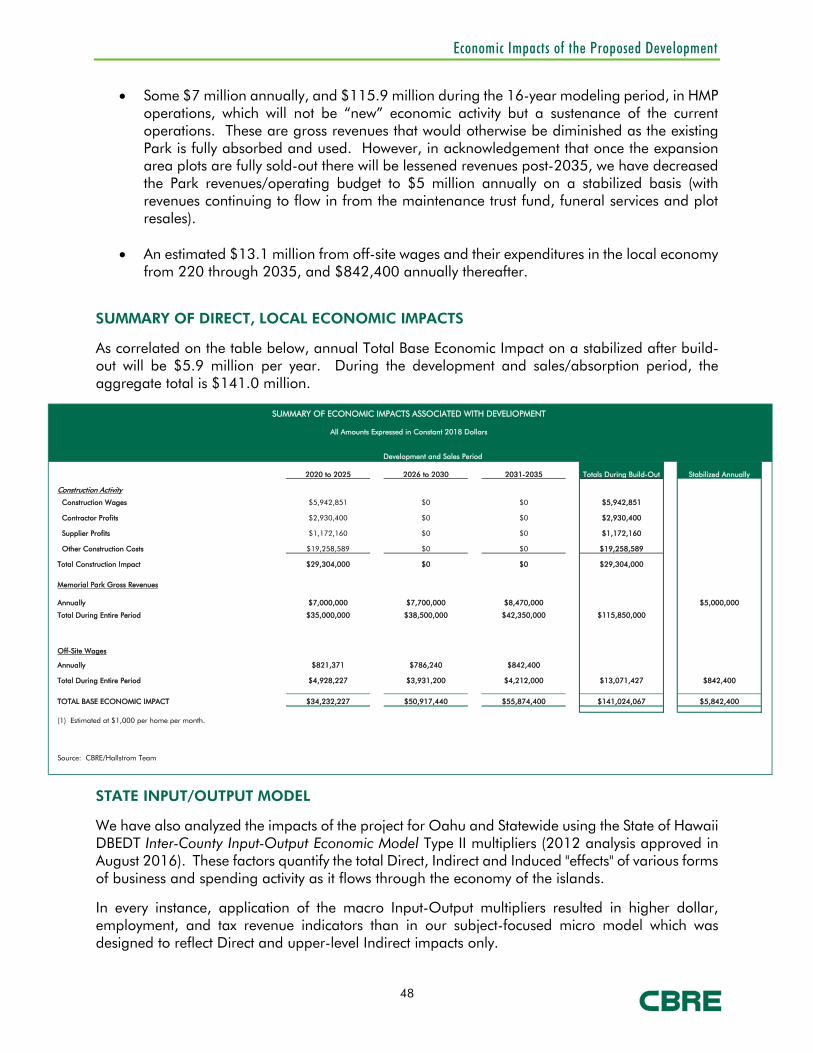
Economic Impacts of the Proposed Development
48
• Some $7 million annually, and $115.9 million during the 16-year modeling period, in HMP operations, which will not be “new” economic activity but a sustenance of the current operations. These are gross revenues that would otherwise be diminished as the existing Park is fully absorbed and used. However, in acknowledgement that once the expansion area plots are fully sold-out there will be lessened revenues post-2035, we have decreased the Park revenues/operating budget to $5 million annually on a stabilized basis (with revenues continuing to flow in from the maintenance trust fund, funeral services and plot resales).
• An estimated $13.1 million from off-site wages and their expenditures in the local economy from 220 through 2035, and $842,400 annually thereafter.
SUMMARY OF DIRECT, LOCAL ECONOMIC IMPACTS
As correlated on the table below, annual Total Base Economic Impact on a stabilized after build-out will be $5.9 million per year. During the development and sales/absorption period, the aggregate total is $141.0 million.
STATE INPUT/OUTPUT MODEL
We have also analyzed the impacts of the project for Oahu and Statewide using the State of Hawaii DBEDT Inter-County Input-Output Economic Model Type II multipliers (2012 analysis approved in August 2016). These factors quantify the total Direct, Indirect and Induced "effects" of various forms of business and spending activity as it flows through the economy of the islands.
In every instance, application of the macro Input-Output multipliers resulted in higher dollar, employment, and tax revenue indicators than in our subject-focused micro model which was designed to reflect Direct and upper-level Indirect impacts only.
2020 to 2025 2026 to 2030 2031-2035 Totals During Build-Out Stabilized Annually
Construction Activity
Construction Wages $5,942,851 $0 $0 $5,942,851
Contractor Profits $2,930,400 $0 $0 $2,930,400
Supplier Profits $1,172,160 $0 $0 $1,172,160
Other Construction Costs $19,258,589 $0 $0 $19,258,589
Total Construction Impact $29,304,000 $0 $0 $29,304,000
Memorial Park Gross Revenues
Annually $7,000,000 $7,700,000 $8,470,000 $5,000,000
Total During Entire Period $35,000,000 $38,500,000 $42,350,000 $115,850,000
Off-Site Wages
Annually $821,371 $786,240 $842,400
Total During Entire Period $4,928,227 $3,931,200 $4,212,000 $13,071,427 $842,400
TOTAL BASE ECONOMIC IMPACT $34,232,227 $50,917,440 $55,874,400 $141,024,067 $5,842,400
(1) Estimated at $1,000 per home per month.
Source: CBRE/Hallstrom Team
Development and Sales Period
SUMMARY OF ECONOMIC IMPACTS ASSOCIATED WITH DEVELIOPMENT
All Amounts Expressed in Constant 2018 Dollars

Economic Impacts of the Proposed Development
49
Among the construction-based outputs using the State method, shown on the table below:
• The $19.3 million in cumulative HMP expansion construction costs will generate a total State Economic Output of $57.4 million during build-out.
• Direct subject construction wage earnings of $5.9 million will yield $10.3 million in statewide wage earnings.
• Indirect and induced State taxes during will total $3.6 million during construction.
• Direct effect jobs created by construction employment will be 2.25 times the number of on-site workers, or a total of 164.8 worker years of employment.
Totals Stabilized
Year 2020 to 2025 2026 to 2030 2031-2035 Annually
Construction Costs $29,304,000 $0 $0 $29,304,000 $0
1. Economic Output Multiplier 1.96 1.96 1.96 1.96 1.96 Total State Economic Output $57,435,840 $0 $0 $57,435,840 $0
2. Earnings Multiplier 0.60 0.60 0.60 0.60 0.60 Total Increase in State Earnings $17,582,400 $0 $0 $17,582,400 $0
3. State Tax Multipliers 0.12 0.12 0.12 0.12 0.12 Total Increase in State Taxes $3,654,209 $0 $0 $3,654,209 $0
4. Total Job Multipliers 11.00 11.00 11.00 11.00 11.00 Total State Jobs Created 322.3 0.0 0.0 322.3 0.0
Construction Employment 73 0 0 73 27
5. Direct-Effect Job Multipliers 2.25 2.25 2.25 2.25 2.25 Total Direct Jobs Created 164.8 0.0 0.0 164.8 60.8
Construction Wages $5,942,851 $0 $0 $5,942,851 $0
6. Direct-Effect Earnings 1.74 1.74 1.74 1.74 1.74 Total Increase in Direct Earnings $10,340,561 $0 $0 $10,340,561 $0
Using Type II "Construction" Multipliers
Source: The 2012 Hawaii Inter-County Input-Output Model (approved August 2016), and CBRE/Hallstrom Team
Development and Sales Period
ESTIMATES OF TOTAL ECONOMIC IMPACT FROM SUBJECT CONSTRUCTION
USING INTER-COUNTY INPUT-OUTPUT MODEL "TYPE II" MULTIPLIERS FOR OAHUAll Amounts Expressed in Constant 2018 Dollars

Economic Impacts of the Proposed Development
50
Among the operations-based outputs using the State method, shown on the table below:
• The $128.9 million in cumulative HMP expansion operating economic activity will generate a total State Economic Output of $237.2 million during the 16-year modeling period with subsequent operating activity averaging $10.8 million annually on a stabilized basis.
• On-going earnings activity will generate $67 million during the modeling period and $3 million each stabilized year.
• Indirect and induced State taxes during operations will total $15 million during construction and $681,224 annually thereafter.
• Direct effect jobs created by operating employment will be 1.58 times the number of on-site workers, or a total of 263.1 worker years of employment from 2020 through 2035 and 94.8 annually thereafter.
Totals Stabilized
Year 2020 to 2025 2026 to 2030 2031-2035 Annually
TotalOn-Going Economic Activity $39,928,227 $42,431,200 $46,562,000 $128,921,427 $5,842,400
1. Economic Output Multiplier 1.84 1.84 1.84 1.84 1.84 Total State Economic Output $73,467,938 $78,073,408 $85,674,080 $237,215,426 $10,750,016
2. Earnings Multiplier 0.52 0.52 0.52 0.52 0.52 Total Increase in State Earnings $20,762,678 $22,064,224 $24,212,240 $67,039,142 $3,038,048
3. State Tax Multipliers 0.12 0.12 0.12 0.12 0.12 Total Increase in State Taxes $4,655,631 $4,947,478 $5,429,129 $15,032,238 $681,224
4. Total Job Multipliers 20.10 20.10 20.10 20.10 20.10 Total State Jobs Created 802.6 852.9 935.9 2,591.3 117.4
Operating Employment 50.5 56.0 60.0 166.5 60.0
5. Direct-Effect Job Multipliers 1.58 1.58 1.58 1.58 1.58 Total Direct Jobs Created 79.9 88.5 94.8 263.1 94.8
Operating Wages $16,659,281 $18,412,890 $19,728,096 $54,800,267 $3,998,895
6. Direct-Effect Earnings 1.70 1.70 1.70 1.70 1.70 Total Increase in Direct Earnings $28,320,778 $31,301,913 $33,537,764 $93,160,454 $6,798,122
Using Type II "Services" and "Other Services" Multipliers
Source: The 2012 Hawaii Inter-County Input-Output Model (approved August 2016), and CBRE/Hallstrom Team
Development Year
ESTIMATES OF TOTAL ECONOMIC IMPACT FROM SUBJECT OPERATIONS
USING INTER-COUNTY INPUT-OUTPUT MODEL "TYPE II" MULTIPLIERS FOR OAHUAll Amounts Expressed in Constant 2018 Dollars
Economic Impacts of the Proposed Development
51
ANCILLARY ECONOMIC (PHASE II) IMPACTS
HMP will have nominal to minor impacts on the socio-economic aspects of the surrounding community that relate to real estate issues.
• There are no neighboring uses on three sides of the HMP Expansion acreage property. The existing park is to the west, open lands to the east, and hills, open space and old quarry lands to the south. To the north are built-out single family residential subdivisions which will be buffered from the plot gardens in the expansion project.
• The site is appropriately called a Memorial Park, a vast greensward having several small central structures and highly limited activity; with just a handful of internment services daily, graveside visitations and maintenance activities. There will be no additional structures on the expansion acreage and similarly limited, subdued activities.
• The HMP Expansion will not meaningfully impact the property values or real estate taxes of the northerly-abutting homes. Property values throughout Windward Oahu are largely driven by external, cyclical economic factors within an existing (and expanding) cumulative mass, not by the expansion of a cemetery which has been in-place for decades.
• There is not expected to be any in-migration to Oahu as a direct result of the project.

Public Costs/Benefits from the Proposed Development
52
Public Fiscal (Costs/Benefits) from the Proposed Development The full-size tables depicting the modeling process summarized in this study section are contained in the addenda.
As previously noted, public fiscal (or cost/benefit) impacts are typically estimated on a per capita basis founded on a conservative assumption that each new person added to the Oahu community is "responsible for" a similar tax cost/obligation as every other person on the island.
As there will be no new residents resulting from the HMP Expansion there will be no new per capita costs. We have therefore focused on any additional costs the State and County will incur beyond current levels as a result of the expansion project.
Our analytical focus is on “new” or additional fiscal impacts (incoming tax dollars and outgoing government expenditures) to the State and County arising from the development of the HMP Expansion project not those monies/costs which are already in-place due to the existing HMP facility and operation.
NEW/SUSTAINED HONOLULU COUNTY REVENUES
The City and County of Honolulu currently receives some $530 per year of real property taxes on the 164-acre subject site (split between “Preservation” and “Residential” use designations.). This total is not anticipated to meaningfully change, if at all, as a result of the HMP expansion.
The County will receive an estimated $500,000 in one-time permit, license and other fees at the commencement of the project; otherwise there will be no enhancement in benefits from the project.
NEW/SUSTAINED STATE OF HAWAII REVENUES
The State of Hawaii will receive an estimated $5.0 million in primary receipts from State Income Taxes from on and off-site construction and operations worker wages, and profits from local businesses from the HMP expansion during its 16-year modeling period.
This is based on average statewide corporate and personal payments rates of 4.4 percent and 5.1 percent, respectively, applied against the economic model forecasts.
On an annualized basis after stabilization in 2035, the State will generate income taxes of $266,581.
Development Period 2020 to 2025 2026 to 2030 2031-2035Totals During Build-Out
PeriodStabilized Annually After
Build-out
PUBLIC BENEFITS (Revenues)
1. STATE INCOME TAXES
Taxable Personal Income $24,198,503 $18,661,512 $19,994,477 $62,854,492 $3,156,495
Taxable Corporate Profits $14,400,000 $13,200,000 $14,400,000 $42,000,000 $2,400,000
Personal Taxes Paid $1,234,124 $951,737 $1,019,718 $3,205,579 $160,981
Corporate Taxes Paid $633,600 $580,800 $633,600 $1,848,000 $105,600
TOTAL STATE INCOME TAXES $1,867,724 $1,532,537 $1,653,318 $5,053,579 $266,581
Development and Sales Period
QUANTIFICATION OF PUBLIC FISCAL COSTS AND BENEFITS FROM HAWAIIAN MEMORIAL PARK EXPANSION
All Amounts Expressed in Constant 2018 Dollars

Public Costs/Benefits from the Proposed Development
53
The State will collect Gross Excise Taxes (GET) of 4.712 percent on the gross amount of building contracts, construction supplies, spending by workers and residents, and from the on-going business activity of HMP as sustained by its expansion.
During the 16-year construction and sales/ absorption period these receipts will total $2.5 million and a stabilized amount of $83,311 annually.
TOTAL NEW/SUSTAINED PUBLIC GROSS REVENUES
The table below summarizes the new/sustained gross public revenue which will be flowing to the County and State from the expansion of the HMP.
Real Property Taxes (RPT) are forecast to generate about 50.17 percent of total Honolulu County General Fund revenues in the 2018 fiscal-year budget, with secondary taxes and fees the forming the remainder. It is logical to assume the HMP development and business activities will generate secondary taxes in proportion to RPT as does the overall Maui community.
The secondary Honolulu County receipts are equal to an additional 199 percent of the RPT total (58.8% divided by 41.2%).
This point is moot as there are no additional/new real property taxes projected to be paid as a result of the HMP expansion.
Development Period 2020 to 2025 2026 to 2030 2031-2035Totals During Build-Out
PeriodStabilized Annually After
Build-out
PUBLIC BENEFITS (Revenues)
2. STATE GROSS EXCISE TAX
Taxable Transactions
Construction Contracts $29,304,000 $0 $0 $29,304,000 $0
Worker Disposable Income Purchases $12,099,252 $9,330,756 $9,997,238 $31,427,246 $1,999,448
$41,403,252 $9,330,756 $9,997,238 $60,731,246 $1,999,448
TOTAL STATE EXCISE TAX $1,725,149 $388,785 $416,555 $2,530,489 $83,311
Development and Sales Period
QUANTIFICATION OF PUBLIC FISCAL COSTS AND BENEFITS FROM HAWAIIAN MEMORIAL PARK EXPANSION
All Amounts Expressed in Constant 2018 Dollars
Development Period 2020 to 2025 2026 to 2030 2031-2035Totals During Build-Out
PeriodStabilized Annually After
Build-out
TOTAL GROSS PUBLIC REVENUES
Real Property Taxes To City & County of Honolulu $0 $0 $0 $0 $0
Adjustment for Other Proportional Taxes (1) 1.99 1.99 1.99 1.99 1.99
Adjusted Honolulu County Revenues $0 $0 $0 $0 $0
Plus Impact Fees (2) $500,000 $0 $0 $500,000
Total Honolulu County Receipts $500,000 $0 $0 $500,000 $0
To State (Income Taxes and GET) $3,592,873 $1,921,322 $2,069,873 $7,584,068 $349,892
Adjustment for Other Proportional Taxes 1.15 1.15 1.15 1.15 1.15
Adjusted State Revenues $4,131,804 $2,209,520 $2,380,354 $8,721,678 $402,376
Plus Impact Fees $0 $0 $0 $0
Total State of Hawaii Receipts $4,131,804 $2,209,520 $2,380,354 $8,721,678 $402,376
AGGREGATE TAX REVENUES $4,131,804 $2,209,520 $2,380,354 $8,721,678 $402,376
INCLUDES "NEW" COUNTY AND STATE TAXES AND COSTS ONLY
Development and Sales Period
QUANTIFICATION OF PUBLIC FISCAL COSTS AND BENEFITS FROM HAWAIIAN MEMORIAL PARK EXPANSION
All Amounts Expressed in Constant 2018 Dollars

Public Costs/Benefits from the Proposed Development
54
However, we have included an estimated/allocated expense of $500,000 for any County impact, filing, permit or other fees which may be assessed. This is the only amount attributed to the County coffers.
In recent fiscal years, Income Tax and GET have generated about 87 percent of total State general fund revenues (excluding carry-over funds), and secondary taxes and fees the remainder. We anticipate HMP economic activity expressed in the primary tax sources will result in secondary taxes equivalent to statewide averages.
The secondary State receipts are equal to 1.15 times the Income Tax and GET totals (74% divided by 26%).
Application of this ratio to the HMP expansion income tax and GET sums results in a cumulative total estimated tax collection from the subject of $8.7 million during the initial forecasting period through 2035, and $402,376 annually on a stabilized basis.
NEW/ADDED PUBLIC COSTS
We, along with the HMP owners do not expect there will be any or “new” or additional per capita or actual costs beyond the nominal amounts already incurred by either the State or County resulting from the expansion of HMP.
The expansion area will merely sustain existing operational parameters. No additional emergency/policing services will be required, extension of public infrastructure or road systems, or school and other public facilities enhanced/developed.
This results in all added public revenues generated by the HMP expansion being “marginal profits”.
NET PUBLIC BENEFITS (PROFIT)
As shown in the following table the net public benefits (revenues less costs) flowing to the City & County of Honolulu from the proposed HMP Expansion project will total an estimated $500,000 in upfront licensing, permit and other fees, with no other benefits or costs during the modeling period or on a stabilized basis thereafter.
The State of Hawaii will receive net benefits (“profits”) of $8.7 million from 2020 through 2035 and an annual benefit of $402,376 on a stabilized basis.
Development Period 2020 to 2025 2026 to 2030 2031-2035Totals During Build-Out
PeriodStabilized Annually After
Build-out
ADDED PUBLIC COSTS (Expenses)
By City & County of Honolulu $0 $0 $0 $0 $0
By State of Hawaii $0 $0 $0 $0 $0
TOTAL PUBLIC COSTS $0 $0 $0 $0 $0
INCLUDES "NEW" COUNTY AND STATE TAXES AND COSTS ONLY
Development and Sales Period
QUANTIFICATION OF PUBLIC FISCAL COSTS AND BENEFITS FROM HAWAIIAN MEMORIAL PARK EXPANSION
All Amounts Expressed in Constant 2018 Dollars

Public Costs/Benefits from the Proposed Development
55
Development Period 2020 to 2025 2026 to 2030 2031-2035Totals During Build-Out
PeriodStabilized Annually After
Build-out
TOTAL NET PUBLIC BENEFITS
City & County of Honolulu $500,000 $0 $0 $500,000 $0
State of Hawaii $4,131,804 $2,209,520 $2,380,354 $8,721,678 $402,376
AGGREGATE NET BENEFITS $4,631,804 $2,209,520 $2,380,354 $9,221,678 $402,376
(1) Real property taxes comprise 50.17 percent of new General Funds in the Honolulu County FY 2018 budget. Economic activity generates other revenue items of 49.83 percent or additional 99.32 percent above real property taxes.
(2) For DOE estimated at $5,800 per home.
(3) In recent fiscal years, Gross Excise and Income Taxes have averaged some 87 percent of total State revenues; other revenue items 13 percent, or 15 percent above income and gross excise taxes.
Source: CBRE/Hallstrom Team
INCLUDES "NEW" COUNTY AND STATE TAXES AND COSTS ONLY
Development and Sales Period
QUANTIFICATION OF PUBLIC FISCAL COSTS AND BENEFITS FROM HAWAIIAN MEMORIAL PARK EXPANSION
All Amounts Expressed in Constant 2018 Dollars

Assumptions and Limiting Conditions
56
Assumptions and Limiting Conditions 1. CBRE, Inc. through its appraiser (collectively, "CBRE") has inspected through reasonable observation the subject
property. However, it is not possible or reasonably practicable to personally inspect conditions beneath the soil and the entire interior and exterior of the improvements on the subject property. Therefore, no representation is made as to such matters.
2. The report, including its conclusions and any portion of such report (the "Report"), is as of the date set forth in the letter of transmittal and based upon the information, market, economic, and property conditions and projected levels of operation existing as of such date. The dollar amount of any conclusion as to value in the Report is based upon the purchasing power of the U.S. Dollar on such date. The Report is subject to change as a result of fluctuations in any of the foregoing. CBRE has no obligation to revise the Report to reflect any such fluctuations or other events or conditions which occur subsequent to such date.
3. Unless otherwise expressly noted in the Report, CBRE has assumed that:
(i) Title to the subject property is clear and marketable and that there are no recorded or unrecorded matters or exceptions to title that would adversely affect marketability or value. CBRE has not examined title records (including without limitation liens, encumbrances, easements, deed restrictions, and other conditions that may affect the title or use of the subject property) and makes no representations regarding title or its limitations on the use of the subject property. Insurance against financial loss that may arise out of defects in title should be sought from a qualified title insurance company.
(ii) Existing improvements on the subject property conform to applicable local, state, and federal building codes and ordinances, are structurally sound and seismically safe, and have been built and repaired in a workmanlike manner according to standard practices; all building systems (mechanical/electrical, HVAC, elevator, plumbing, etc.) are in good working order with no major deferred maintenance or repair required; and the roof and exterior are in good condition and free from intrusion by the elements. CBRE has not retained independent structural, mechanical, electrical, or civil engineers in connection with this appraisal and, therefore, makes no representations relative to the condition of improvements. CBRE appraisers are not engineers and are not qualified to judge matters of an engineering nature, and furthermore structural problems or building system problems may not be visible. It is expressly assumed that any purchaser would, as a precondition to closing a sale, obtain a satisfactory engineering report relative to the structural integrity of the property and the integrity of building systems.
(iii) Any proposed improvements, on or off-site, as well as any alterations or repairs considered will be completed in a workmanlike manner according to standard practices.
(iv) Hazardous materials are not present on the subject property. CBRE is not qualified to detect such substances. The presence of substances such as asbestos, urea formaldehyde foam insulation, contaminated groundwater, mold, or other potentially hazardous materials may affect the value of the property.
(v) No mineral deposit or subsurface rights of value exist with respect to the subject property, whether gas, liquid, or solid, and no air or development rights of value may be transferred. CBRE has not considered any rights associated with extraction or exploration of any resources, unless otherwise expressly noted in the Report.
(vi) There are no contemplated public initiatives, governmental development controls, rent controls, or changes in the present zoning ordinances or regulations governing use, density, or shape that would significantly affect the value of the subject property.
(vii) All required licenses, certificates of occupancy, consents, or other legislative or administrative authority from any local, state, nor national government or private entity or organization have been or can be readily obtained or renewed for any use on which the Report is based.
(viii) The subject property is managed and operated in a prudent and competent manner, neither inefficiently or super-efficiently.
(ix) The subject property and its use, management, and operation are in full compliance with all applicable federal, state, and local regulations, laws, and restrictions, including without limitation environmental laws, seismic hazards, flight patterns, decibel levels/noise envelopes, fire hazards, hillside ordinances, density, allowable uses, building codes, permits, and licenses.

Assumptions and Limiting Conditions
57
(x) The subject property is in full compliance with the Americans with Disabilities Act (ADA). CBRE is not qualified to assess the subject property's compliance with the ADA, notwithstanding any discussion of possible readily achievable barrier removal construction items in the Report.
(xi) All information regarding the areas and dimensions of the subject property furnished to CBRE are correct, and no encroachments exist. CBRE has neither undertaken any survey of the boundaries of the subject property nor reviewed or confirmed the accuracy of any legal description of the subject property.
Unless otherwise expressly noted in the Report, no issues regarding the foregoing were brought to CBRE's attention, and CBRE has no knowledge of any such facts affecting the subject property. If any information inconsistent with any of the foregoing assumptions is discovered, such information could have a substantial negative impact on the Report. Accordingly, if any such information is subsequently made known to CBRE, CBRE reserves the right to amend the Report, which may include the conclusions of the Report. CBRE assumes no responsibility for any conditions regarding the foregoing, or for any expertise or knowledge required to discover them. Any user of the Report is urged to retain an expert in the applicable field(s) for information regarding such conditions.
4. CBRE has assumed that all documents, data and information furnished by or behalf of the client, property owner, or owner's representative are accurate and correct, unless otherwise expressly noted in the Report. Such data and information include, without limitation, numerical street addresses, lot and block numbers, Assessor's Parcel Numbers, land dimensions, square footage area of the land, dimensions of the improvements, gross building areas, net rentable areas, usable areas, unit count, room count, rent schedules, income data, historical operating expenses, budgets, and related data. Any error in any of the above could have a substantial impact on the Report. Accordingly, if any such errors are subsequently made known to CBRE, CBRE reserves the right to amend the Report, which may include the conclusions of the Report. The client and intended user should carefully review all assumptions, data, relevant calculations, and conclusions of the Report and should immediately notify CBRE of any questions or errors within 30 days after the date of delivery of the Report.
5. CBRE assumes no responsibility (including any obligation to procure the same) for any documents, data or information not provided to CBRE, including without limitation any termite inspection, survey or occupancy permit.
6. All furnishings, equipment and business operations have been disregarded with only real property being considered in the Report, except as otherwise expressly stated and typically considered part of real property.
7. Any cash flows included in the analysis are forecasts of estimated future operating characteristics based upon the information and assumptions contained within the Report. Any projections of income, expenses and economic conditions utilized in the Report, including such cash flows, should be considered as only estimates of the expectations of future income and expenses as of the date of the Report and not predictions of the future. Actual results are affected by a number of factors outside the control of CBRE, including without limitation fluctuating economic, market, and property conditions. Actual results may ultimately differ from these projections, and CBRE does not warrant any such projections.
8. The Report contains professional opinions and is expressly not intended to serve as any warranty, assurance or guarantee of any particular value of the subject property. Other appraisers may reach different conclusions as to the value of the subject property. Furthermore, market value is highly related to exposure time, promotion effort, terms, motivation, and conclusions surrounding the offering of the subject property. The Report is for the sole purpose of providing the intended user with CBRE's independent professional opinion of the value of the subject property as of the date of the Report. Accordingly, CBRE shall not be liable for any losses that arise from any investment or lending decisions based upon the Report that the client, intended user, or any buyer, seller, investor, or lending institution may undertake related to the subject property, and CBRE has not been compensated to assume any of these risks. Nothing contained in the Report shall be construed as any direct or indirect recommendation of CBRE to buy, sell, hold, or finance the subject property.
9. No opinion is expressed on matters which may require legal expertise or specialized investigation or knowledge beyond that customarily employed by real estate appraisers. Any user of the Report is advised to retain experts in areas that fall outside the scope of the real estate appraisal profession for such matters.
10. CBRE assumes no responsibility for any costs or consequences arising due to the need, or the lack of need, for flood hazard insurance. An agent for the Federal Flood Insurance Program should be contacted to determine the actual need for Flood Hazard Insurance.
Assumptions and Limiting Conditions
58
11. Acceptance or use of the Report constitutes full acceptance of these Assumptions and Limiting Conditions and any special assumptions set forth in the Report. It is the responsibility of the user of the Report to read in full, comprehend and thus become aware of all such assumptions and limiting conditions. CBRE assumes no responsibility for any situation arising out of the user's failure to become familiar with and understand the same.
12. The Report applies to the property as a whole only, and any pro ration or division of the title into fractional interests will invalidate such conclusions, unless the Report expressly assumes such pro ration or division of interests.
13. The allocations of the total value estimate in the Report between land and improvements apply only to the existing use of the subject property. The allocations of values for each of the land and improvements are not intended to be used with any other property or appraisal and are not valid for any such use.
14. The maps, plats, sketches, graphs, photographs, and exhibits included in this Report are for illustration purposes only and shall be utilized only to assist in visualizing matters discussed in the Report. No such items shall be removed, reproduced, or used apart from the Report.
15. The Report shall not be duplicated or provided to any unintended users in whole or in part without the written consent of CBRE, which consent CBRE may withhold in its sole discretion. Exempt from this restriction is duplication for the internal use of the intended user and its attorneys, accountants, or advisors for the sole benefit of the intended user. Also exempt from this restriction is transmission of the Report pursuant to any requirement of any court, governmental authority, or regulatory agency having jurisdiction over the intended user, provided that the Report and its contents shall not be published, in whole or in part, in any public document without the written consent of CBRE, which consent CBRE may withhold in its sole discretion. Finally, the Report shall not be made available to the public or otherwise used in any offering of the property or any security, as defined by applicable law. Any unintended user who may possess the Report is advised that it shall not rely upon the Report or its conclusions and that it should rely on its own appraisers, advisors and other consultants for any decision in connection with the subject property. CBRE shall have no liability or responsibility to any such unintended user.

Addenda
ADDENDA

Addenda
Addendum A
MARKET STUDY AND ABSORPTION TABLES

TABLE 1
Year 2000 2017 2040 Period One: Minimum Two: Maximum(Current)
2018 to 2020 14,732 15,128Resident Population 878,906 992,605 Minimum Forecast 1,086,710 2021 to 2025 27,471 29,338 Maximum Forecast 1,142,434
2026 to 2030 30,186 33,841Mortality Rate 0.65% 0.80% Minimum Forecast 1.08% 2030 to 2035 34,460 40,367 Maximum Forecast 1.19%
2036 to 2040 38,176 47,120Percent of Population Over 65 14.00% 18.00% Minimum Forecast 24.00% Total Burial Spaces 145,025 165,795
Maximum Forecast 26.00%Compiled by CBRE/Hallstrom
Annual Resident Deaths 5,721 7,960 Minimum Forecast 11,694 Maximum Forecast 12,864
Compiled by CBRE/Hallstrom Team
OAHU DEMOGRAPHIC TRENDS 2000 TO 2040ESTIMATED NET ADDITIONAL BURIAL SPACE DEMAND ON OAHU 2018 THROUGH 2040

TABLE 2
Year Total Deaths
Percent Annual Increase
Death Rate (Per 100,000)
Percent Annual Increase
Life Expectancy at Birth
Percent Annual Increase
1997 2,314,245 ---- 864.7 ---- 76.5 ----1998 2,337,256 1.0% 864.7 0.0% 76.7 0.3%1999 2,391,399 2.3% 881.9 2.0% 76.7 0.0%2000 2,403,351 0.5% 872.0 -1.1% 76.9 0.3%2001 2,416,425 0.5% 854.5 -2.0% 77.2 0.4%2002 2,447,864 1.3% 846.8 -0.9% 77.4 0.3%2003 2,448,288 0.0% 832.7 -1.7% 77.5 0.1%2004 2,398,343 -2.0% 801.0 -3.8% 77.9 0.5%2005 2,448,017 2.1% 798.8 -0.3% 77.8 -0.1%2006 2,426,264 -0.9% 776.5 -2.8% 77.7 -0.1%2007 2,423,712 -0.1% 760.2 -2.1% 77.9 0.3%2008 2,471,984 2.0% 758.3 -0.2% 78.1 0.3%2009 2,437,163 -1.4% 741.1 -2.3% 78.5 0.5%2010 2,468,435 1.3% 747.0 0.8% 78.7 0.3%2011 2,515,458 1.9% 741.3 -0.8% 78.7 0.0%2012 2,543,279 1.1% 732.8 -1.1% 78.8 0.1%2013 2,596,993 2.1% 731.9 -0.1% 78.8 0.0%2014 2,626,418 1.1% 742.6 1.5% 78.8 0.0%2015 2,712,630 3.3% 733.1 -1.3% 78.7 -0.1%2016 2,744,248 1.2% 728.8 -0.6% 78.6 -0.1%
0.9% -0.9% 0.1%
Source: CDC National Vital Statistics Reports
NATIONAL DEATH STATISTICS (1997-2014)

TABLE 3
Year Population (1)
Percent Annual Change
Resident Deaths (2)
Percent Annual Change
Deaths as Percent of Population
Percent Annual Change
1997 886,711 - 5,467 - 0.6% -1998 886,909 0.0% 5,585 2.2% 0.6% 2.1%1999 878,906 -0.9% 5,776 3.4% 0.7% 4.4%2000 876,156 -0.3% 5,721 -1.0% 0.7% -0.6%2001 882,755 0.8% 5,860 2.4% 0.7% 1.7%2002 890,473 0.9% 6,081 3.8% 0.7% 2.9%2003 894,311 0.4% 6,272 3.1% 0.7% 2.7%2004 907,997 1.5% 6,281 0.1% 0.7% -1.4%2005 918,181 1.1% 6,330 0.8% 0.7% -0.3%2006 926,954 1.0% 6,505 2.8% 0.7% 1.8%2007 925,335 -0.2% 6,421 -1.3% 0.7% -1.1%2008 933,680 0.9% 6,474 0.8% 0.7% -0.1%2009 943,177 1.0% 6,742 4.1% 0.7% 3.1%2010 953,207 1.1% 6,978 3.5% 0.7% 2.4%2011 965,629 1.3% 7,125 2.1% 0.7% 0.8%2012 974,990 1.0% 7,426 4.2% 0.8% 3.2%2013 984,730 1.0% 7,542 1.6% 0.8% 0.6%2014 988,586 0.4% 7,754 2.8% 0.8% 2.4%2015 993,166 0.5% 7,878 1.6% 0.8% 1.1%2016 992,605 -0.1% 7,806 -0.9% 0.8% -0.9%2017 995,583 0.3% 7,960 0.3% 0.8% 0.3%
0.6% 1.9% 1.3%
(1) State of Hawaii Data Book. Table 1.06 "Resident Population by County" (2017 extrapolated estimate).(2) State Department of Health Vital Statistics. "Births, Deaths, Marriages and Civil Unions".
Source: As cited and CBRE/Hallstrom Team
ISLAND OF OAHU HISTORIC DEATH RATE 1997 THROUGH 2017
Compounded Annual Growth Rate

TABLE 4
Year
State of Hawaii 2040 Population
Forecast (1)
Percent Annual Change
Trending Deaths as a Percent of
Population
Percent Historic Annual Change
Forecast Resident Deaths
Percent Annual Change
2018 998,292 0.27% 0.81% 1.30% 8,085 1.6%2019 1,001,001 0.27% 0.82% 1.30% 8,212 1.6%2020 1,003,710 0.27% 0.83% 1.30% 8,342 1.6%2021 1,008,729 0.50% 0.84% 1.30% 8,492 1.8%2022 1,013,772 0.50% 0.85% 1.30% 8,646 1.8%2023 1,018,841 0.50% 0.86% 1.30% 8,802 1.8%2024 1,023,935 0.50% 0.88% 1.30% 8,961 1.8%2025 1,029,410 0.50% 0.89% 1.30% 9,126 1.8%2026 1,033,528 0.40% 0.90% 1.30% 9,282 1.7%2027 1,037,662 0.40% 0.91% 1.30% 9,440 1.7%2028 1,041,812 0.40% 0.92% 1.30% 9,601 1.7%2029 1,045,980 0.40% 0.93% 1.30% 9,765 1.7%2030 1,052,130 0.40% 0.95% 1.30% 9,950 1.9%2031 1,056,339 0.40% 0.96% 1.30% 10,119 1.7%2032 1,060,564 0.40% 0.97% 1.30% 10,292 1.7%2033 1,064,806 0.40% 0.98% 1.30% 10,467 1.7%2034 1,069,065 0.40% 1.00% 1.30% 10,646 1.7%2035 1,071,220 0.40% 1.01% 1.30% 10,806 1.5%2036 1,074,434 0.30% 1.02% 1.30% 10,979 1.6%2037 1,077,657 0.30% 1.04% 1.30% 11,155 1.6%2038 1,080,890 0.30% 1.05% 1.30% 11,334 1.6%2039 1,084,133 0.30% 1.06% 1.30% 11,516 1.6%2040 1,086,710 0.30% 1.08% 1.30% 11,694 1.5%
Total Oahu Deaths 2018 through 2040 225,711
Source: As cited, and CBRE/Hallstrom Team
SCENARIO ONE: MINIMUM - FORECAST OAHU DEATHS 2018 THROUGH 2040
(1) Using periodic five-year projection figures with state annual growth rates for interim years, except for 2018 & 2019 which uses mid-point growth rate from 2017 estimates.
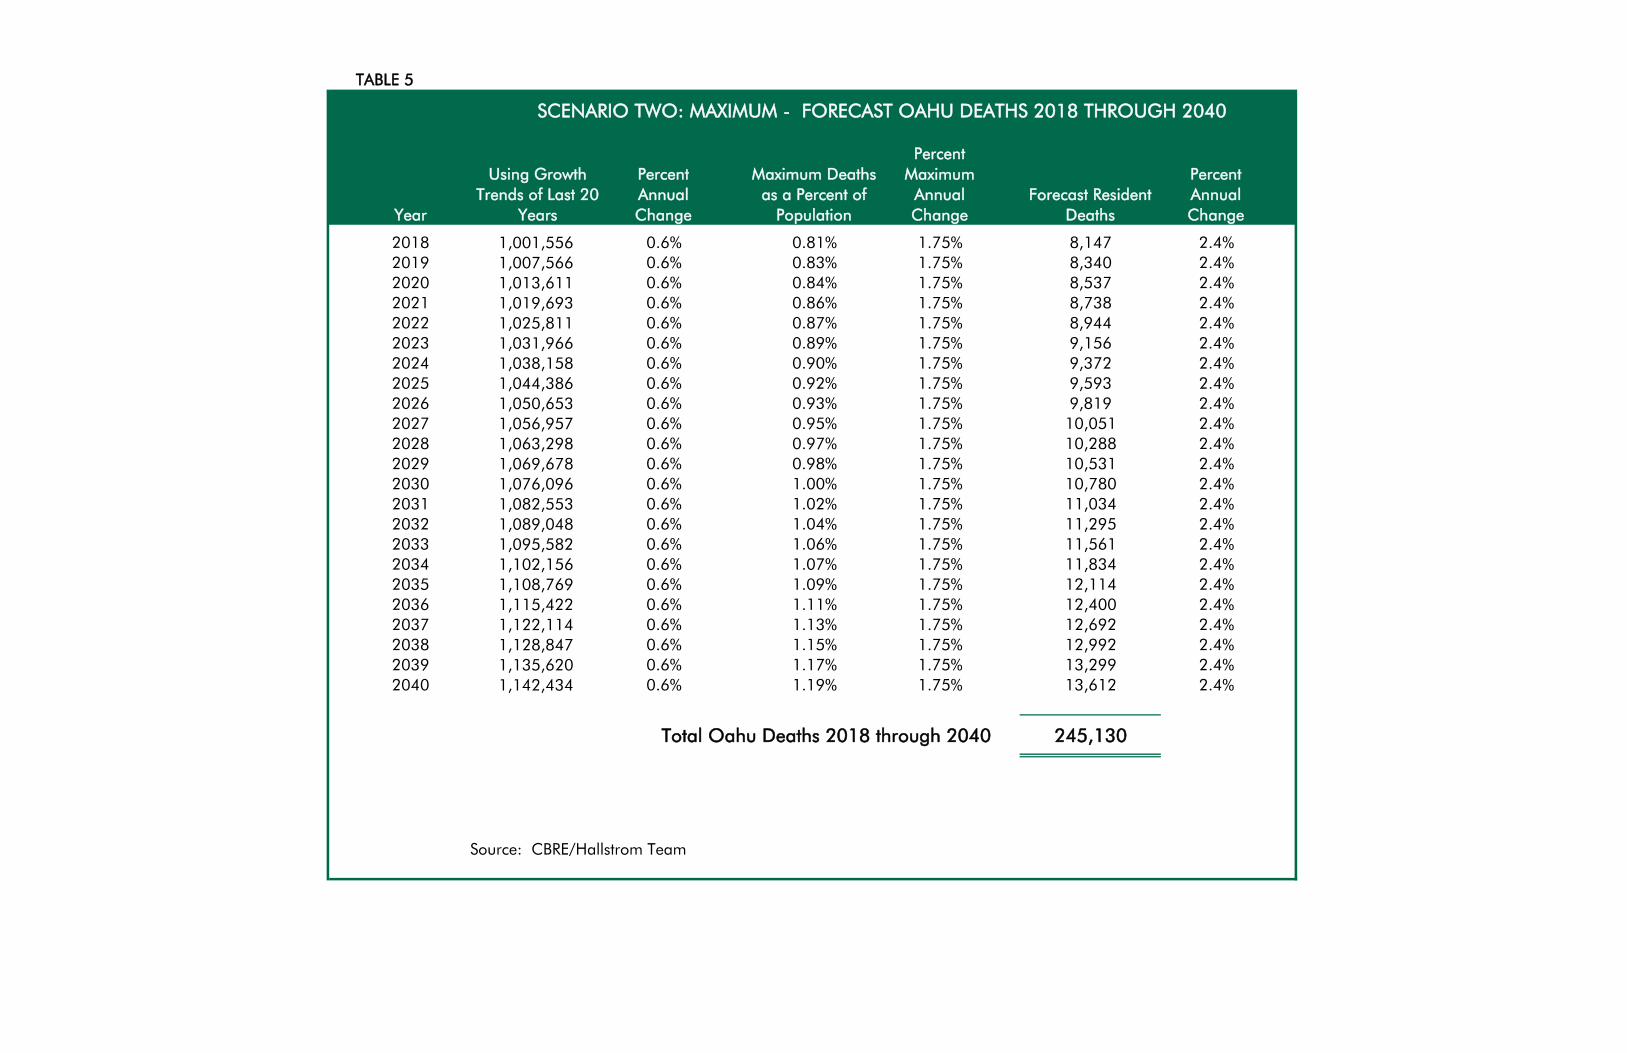
TABLE 5
Year
Using Growth Trends of Last 20
Years
Percent Annual Change
Maximum Deaths as a Percent of
Population
Percent Maximum
Annual Change
Forecast Resident Deaths
Percent Annual Change
2018 1,001,556 0.6% 0.81% 1.75% 8,147 2.4%2019 1,007,566 0.6% 0.83% 1.75% 8,340 2.4%2020 1,013,611 0.6% 0.84% 1.75% 8,537 2.4%2021 1,019,693 0.6% 0.86% 1.75% 8,738 2.4%2022 1,025,811 0.6% 0.87% 1.75% 8,944 2.4%2023 1,031,966 0.6% 0.89% 1.75% 9,156 2.4%2024 1,038,158 0.6% 0.90% 1.75% 9,372 2.4%2025 1,044,386 0.6% 0.92% 1.75% 9,593 2.4%2026 1,050,653 0.6% 0.93% 1.75% 9,819 2.4%2027 1,056,957 0.6% 0.95% 1.75% 10,051 2.4%2028 1,063,298 0.6% 0.97% 1.75% 10,288 2.4%2029 1,069,678 0.6% 0.98% 1.75% 10,531 2.4%2030 1,076,096 0.6% 1.00% 1.75% 10,780 2.4%2031 1,082,553 0.6% 1.02% 1.75% 11,034 2.4%2032 1,089,048 0.6% 1.04% 1.75% 11,295 2.4%2033 1,095,582 0.6% 1.06% 1.75% 11,561 2.4%2034 1,102,156 0.6% 1.07% 1.75% 11,834 2.4%2035 1,108,769 0.6% 1.09% 1.75% 12,114 2.4%2036 1,115,422 0.6% 1.11% 1.75% 12,400 2.4%2037 1,122,114 0.6% 1.13% 1.75% 12,692 2.4%2038 1,128,847 0.6% 1.15% 1.75% 12,992 2.4%2039 1,135,620 0.6% 1.17% 1.75% 13,299 2.4%2040 1,142,434 0.6% 1.19% 1.75% 13,612 2.4%
Total Oahu Deaths 2018 through 2040 245,130
Source: CBRE/Hallstrom Team
SCENARIO TWO: MAXIMUM - FORECAST OAHU DEATHS 2018 THROUGH 2040

TABLE 6
Year Number
Percent Annual Change
Percent of Total
Dispositions Number
Percent Annual Change
Percent of Total
Dispositions Number
Percent Annual Change
Percent of Total
Dispositions Number
Percent Annual Change
Percent of Total
Dispositions Number
Percent Annual Change
Percent of Total
Dispositions Number
Percent Annual Change
1970 2,197 --- 52.4% 1,509 --- 36.0% 470 --- 11.2% 18 --- 0.4% 4,194 ---1980 2,241 0.2% 43.1% 2,343 5.5% 45.0% 567 2.1% 10.9% 53 19.4% 1.0% 5,204 2.4%1990 3,564 5.9% 50.5% 2,798 1.9% 39.7% 656 1.6% 9.3% 37 -3.0% 0.5% 7,055 3.6%2000 2,767 -2.2% 32.5% 5,092 8.2% 59.8% 591 -1.0% 6.9% 40 --- 0.5% 21 -4.3% 0.2% 8,511 2.1%2001 2,689 -2.8% 31.2% 5,241 2.9% 60.9% 608 2.9% 7.1% 50 25.0% 0.6% 21 0.0% 0.2% 8,609 1.2%2002 2,770 3.0% 30.8% 5,505 5.0% 61.3% 641 5.4% 7.1% 46 -8.0% 0.5% 24 14.3% 0.3% 8,986 4.4%2003 2,800 1.1% 30.5% 5,778 5.0% 62.9% 540 -15.8% 5.9% 47 2.2% 0.5% 14 -41.7% 0.2% 9,179 2.1%2004 2,696 -3.7% 29.1% 5,900 2.1% 63.8% 599 10.9% 6.5% 49 4.3% 0.5% 8 -42.9% 0.1% 9,252 0.8%2005 2,667 -1.1% 28.6% 5,964 1.1% 63.9% 634 5.8% 6.8% 55 12.2% 0.6% 10 25.0% 0.1% 9,330 0.8%2006 2,648 -0.7% 27.5% 6,292 5.5% 65.4% 591 -6.8% 6.1% 68 23.6% 0.7% 23 130.0% 0.2% 9,622 3.1%2007 2,597 -1.9% 27.0% 6,372 1.3% 66.2% 580 -1.9% 6.0% 64 -5.9% 0.7% 14 -39.1% 0.1% 9,627 0.1%2008 2,455 -5.5% 25.6% 6,506 2.1% 68.0% 530 -8.6% 5.5% 63 -1.6% 0.7% 18 28.6% 0.2% 9,572 -0.6%2009 2,416 -1.6% 24.3% 6,862 5.5% 69.0% 551 4.0% 5.5% 94 49.2% 0.9% 24 33.3% 0.2% 9,947 3.9%2010 2,322 -3.9% 24.1% 6,661 -2.9% 69.0% 562 2.0% 5.8% 91 -3.2% 0.9% 18 -25.0% 0.2% 9,654 -2.9%2011 2,375 2.3% 23.8% 6,961 4.5% 69.9% 503 -10.5% 5.0% 102 12.1% 1.0% 20 11.1% 0.2% 9,961 3.2%2012 2,480 4.4% 23.9% 7,255 4.2% 70.0% 506 0.6% 4.9% 102 0.0% 1.0% 20 0.0% 0.2% 10,363 4.0%2013 2,302 -7.2% 21.8% 7,582 4.5% 71.7% 542 7.1% 5.1% 131 28.4% 1.2% 19 -5.0% 0.2% 10,576 2.1%2014 2,306 0.2% 21.2% 7,908 4.3% 72.6% 504 -7.0% 4.6% 146 11.5% 1.3% 22 15.8% 0.2% 10,886 2.9%2015 2,399 4.0% 21.4% 8,097 2.4% 72.2% 559 10.9% 5.0% 141 -3.4% 1.3% 19 -13.6% 0.2% 11,215 3.0%
0.2% -2.0% 3.8% 1.6% 0.4% -1.8% 8.2% 6.3% 0.1% -2.0% 2.2%
Note: 2015 data most recent year available
*Includes entombment.
Source: State of Hawaii Data Book, Table 2.20 "Deaths by Disposition", from Hawaii State Department of Health, Office of Health Status Monitoring, records and CBRE/Hallstrom Team
Compounded Annual Growth
Complete Data Unavailable
STATE OF HAWAII HISTORICAL DEATHS BY DISPOSITION 1970-2015
Burials Cremations Removal Out of State Medical Donation All Others Total All Methods

TABLE 7
Year Number
Percent Annual Change
Percent of Total
Dispositions Number
Percent Annual Change
Percent of Total
Dispositions Number
Percent Annual Change
Percent of Total
Dispositions
1970 2,197 --- 52.4% 1,509 --- 36.0% 3,706 --- 88.4%1980 2,241 0.2% 43.1% 2,343 5.5% 45.0% 4,584 2.4% 88.1%1990 3,564 5.9% 50.5% 2,798 1.9% 39.7% 6,362 3.9% 90.2%2000 2,767 -2.2% 32.5% 5,092 8.2% 59.8% 7,859 2.4% 92.3%2001 2,689 -2.8% 31.2% 5,241 2.9% 60.9% 7,930 0.9% 92.1%2002 2,770 3.0% 30.8% 5,505 5.0% 61.3% 8,275 4.4% 92.1%2003 2,800 1.1% 30.5% 5,778 5.0% 62.9% 8,578 3.7% 93.5%2004 2,696 -3.7% 29.1% 5,900 2.1% 63.8% 8,596 0.2% 92.9%2005 2,667 -1.1% 28.6% 5,964 1.1% 63.9% 8,631 0.4% 92.5%2006 2,648 -0.7% 27.5% 6,292 5.5% 65.4% 8,940 3.6% 92.9%2007 2,597 -1.9% 27.0% 6,372 1.3% 66.2% 8,969 0.3% 93.2%2008 2,455 -5.5% 25.6% 6,506 2.1% 68.0% 8,961 -0.1% 93.6%2009 2,416 -1.6% 24.3% 6,862 5.5% 69.0% 9,278 3.5% 93.3%2010 2,322 -3.9% 24.1% 6,661 -2.9% 69.0% 8,983 -3.2% 93.0%2011 2,375 2.3% 23.8% 6,961 4.5% 69.9% 9,336 3.9% 93.7%2012 2,480 4.4% 23.9% 7,255 4.2% 70.0% 9,735 4.3% 93.9%2013 2,302 -7.2% 21.8% 7,582 4.5% 71.7% 9,884 1.5% 93.5%2014 2,306 0.2% 21.2% 7,908 4.3% 72.6% 10,214 3.3% 93.8%2015 2,399 4.0% 21.4% 8,097 2.4% 72.2% 10,496 2.8% 93.6%
0.2% -2.0% 3.8% 1.6% 2.3% 0.1%
Note: 2015 data most recent year available
Source: State of Hawaii Data Book (previously cited) and CBRE/Hallstrom Team
Compounded Annual Growth
STATE OF HAWAII HISTORICAL DISPOSITION BY BURIAL AND CREMATION 1970-2015
Burials Cremations Total Burial & Cremations

TABLE 8
Year Total DeathsTotal Annual
Cremations (1)Ashes Are
Scattered (2)Other Forms
of Disposal (3)Total Interred Cremations
2018 8,085 5,821 (1,048) (323) 4,4502019 8,212 5,966 (1,074) (328) 4,5642020 8,342 6,115 (1,101) (334) 4,6802021 8,492 6,281 (1,131) (340) 4,8112022 8,646 6,452 (1,161) (346) 4,9452023 8,802 6,628 (1,193) (352) 5,0832024 8,961 6,808 (1,225) (358) 5,2242025 9,126 6,996 (1,259) (365) 5,3722026 9,282 7,179 (1,292) (371) 5,5162027 9,440 7,367 (1,326) (378) 5,6642028 9,601 7,561 (1,361) (384) 5,8162029 9,765 7,759 (1,397) (391) 5,9722030 9,950 7,977 (1,436) (398) 6,1432031 10,119 8,186 (1,473) (405) 6,3082032 10,292 8,400 (1,512) (412) 6,4772033 10,467 8,621 (1,552) (419) 6,6502034 10,646 8,846 (1,592) (426) 6,8282035 10,806 9,060 (1,631) (432) 6,9972036 10,979 9,289 (1,672) (439) 7,1772037 11,155 9,522 (1,714) (446) 7,3622038 11,334 9,762 (1,757) (453) 7,5522039 11,516 10,008 (1,801) (461) 7,7462040 11,694 10,254 (1,846) (468) 7,940
Totals 225,711 180,858 (32,555) (9,028) 139,275
Compiled by CBRE/Hallstrom Team
(3) Includes urns kept at home or other location. Estimated 10% of decedents nationally request this,with estimated 8% actualized. Again we estimate Hawaii at on-half the national average.
ESTIMATE OF TOTAL OAHU CREMATIONS INTERRED 2018 THROUGH 2040
Scenario One: Minimum Demand
(1) Projected to follow trends of last five years of 0.9% growth in percent total deaths ending in cremations on going-forward basis. Currently at 72 percent of total deaths.
(2) Estimated 39% of decedents cremated nationally request this but only about 35% estimated actualized. Hawaii, owing to its Asian cultural components, has higher percentage of cremations and interrs a much higher percentage. We estimate 18% of Hawaii cremations have ashes scattered, one-half national average.
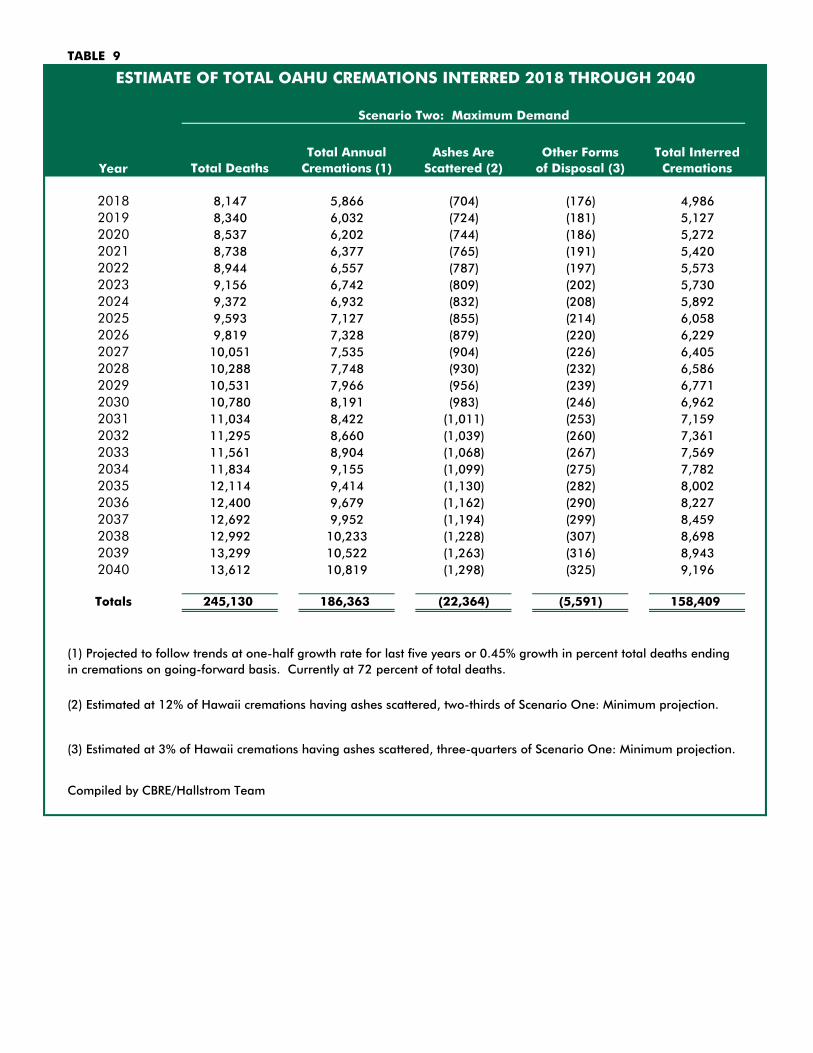
TABLE 9
Year Total DeathsTotal Annual
Cremations (1)Ashes Are
Scattered (2)Other Forms
of Disposal (3)Total Interred Cremations
2018 8,147 5,866 (704) (176) 4,9862019 8,340 6,032 (724) (181) 5,1272020 8,537 6,202 (744) (186) 5,2722021 8,738 6,377 (765) (191) 5,4202022 8,944 6,557 (787) (197) 5,5732023 9,156 6,742 (809) (202) 5,7302024 9,372 6,932 (832) (208) 5,8922025 9,593 7,127 (855) (214) 6,0582026 9,819 7,328 (879) (220) 6,2292027 10,051 7,535 (904) (226) 6,4052028 10,288 7,748 (930) (232) 6,5862029 10,531 7,966 (956) (239) 6,7712030 10,780 8,191 (983) (246) 6,9622031 11,034 8,422 (1,011) (253) 7,1592032 11,295 8,660 (1,039) (260) 7,3612033 11,561 8,904 (1,068) (267) 7,5692034 11,834 9,155 (1,099) (275) 7,7822035 12,114 9,414 (1,130) (282) 8,0022036 12,400 9,679 (1,162) (290) 8,2272037 12,692 9,952 (1,194) (299) 8,4592038 12,992 10,233 (1,228) (307) 8,6982039 13,299 10,522 (1,263) (316) 8,9432040 13,612 10,819 (1,298) (325) 9,196
Totals 245,130 186,363 (22,364) (5,591) 158,409
Compiled by CBRE/Hallstrom Team
(2) Estimated at 12% of Hawaii cremations having ashes scattered, two-thirds of Scenario One: Minimum projection.
(3) Estimated at 3% of Hawaii cremations having ashes scattered, three-quarters of Scenario One: Minimum projection.
ESTIMATE OF TOTAL OAHU CREMATIONS INTERRED 2018 THROUGH 2040
Scenario Two: Maximum Demand
(1) Projected to follow trends at one-half growth rate for last five years or 0.45% growth in percent total deaths ending in cremations on going-forward basis. Currently at 72 percent of total deaths.
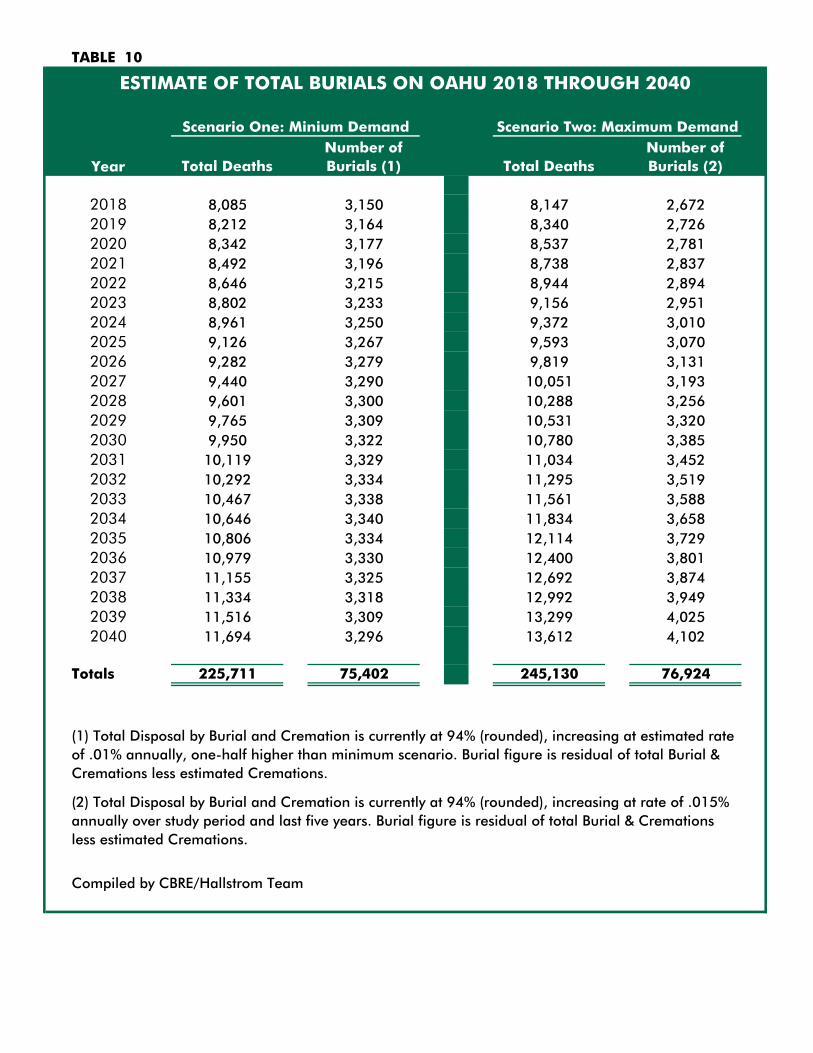
TABLE 10
Year Total DeathsNumber of Burials (1) Total Deaths
Number of Burials (2)
2018 8,085 3,150 8,147 2,6722019 8,212 3,164 8,340 2,7262020 8,342 3,177 8,537 2,7812021 8,492 3,196 8,738 2,8372022 8,646 3,215 8,944 2,8942023 8,802 3,233 9,156 2,9512024 8,961 3,250 9,372 3,0102025 9,126 3,267 9,593 3,0702026 9,282 3,279 9,819 3,1312027 9,440 3,290 10,051 3,1932028 9,601 3,300 10,288 3,2562029 9,765 3,309 10,531 3,3202030 9,950 3,322 10,780 3,3852031 10,119 3,329 11,034 3,4522032 10,292 3,334 11,295 3,5192033 10,467 3,338 11,561 3,5882034 10,646 3,340 11,834 3,6582035 10,806 3,334 12,114 3,7292036 10,979 3,330 12,400 3,8012037 11,155 3,325 12,692 3,8742038 11,334 3,318 12,992 3,9492039 11,516 3,309 13,299 4,0252040 11,694 3,296 13,612 4,102
Totals 225,711 75,402 245,130 76,924
Compiled by CBRE/Hallstrom Team
Scenario One: Minium Demand Scenario Two: Maximum Demand
ESTIMATE OF TOTAL BURIALS ON OAHU 2018 THROUGH 2040
(1) Total Disposal by Burial and Cremation is currently at 94% (rounded), increasing at estimated rate of .01% annually, one-half higher than minimum scenario. Burial figure is residual of total Burial & Cremations less estimated Cremations.
(2) Total Disposal by Burial and Cremation is currently at 94% (rounded), increasing at rate of .015% annually over study period and last five years. Burial figure is residual of total Burial & Cremations less estimated Cremations.
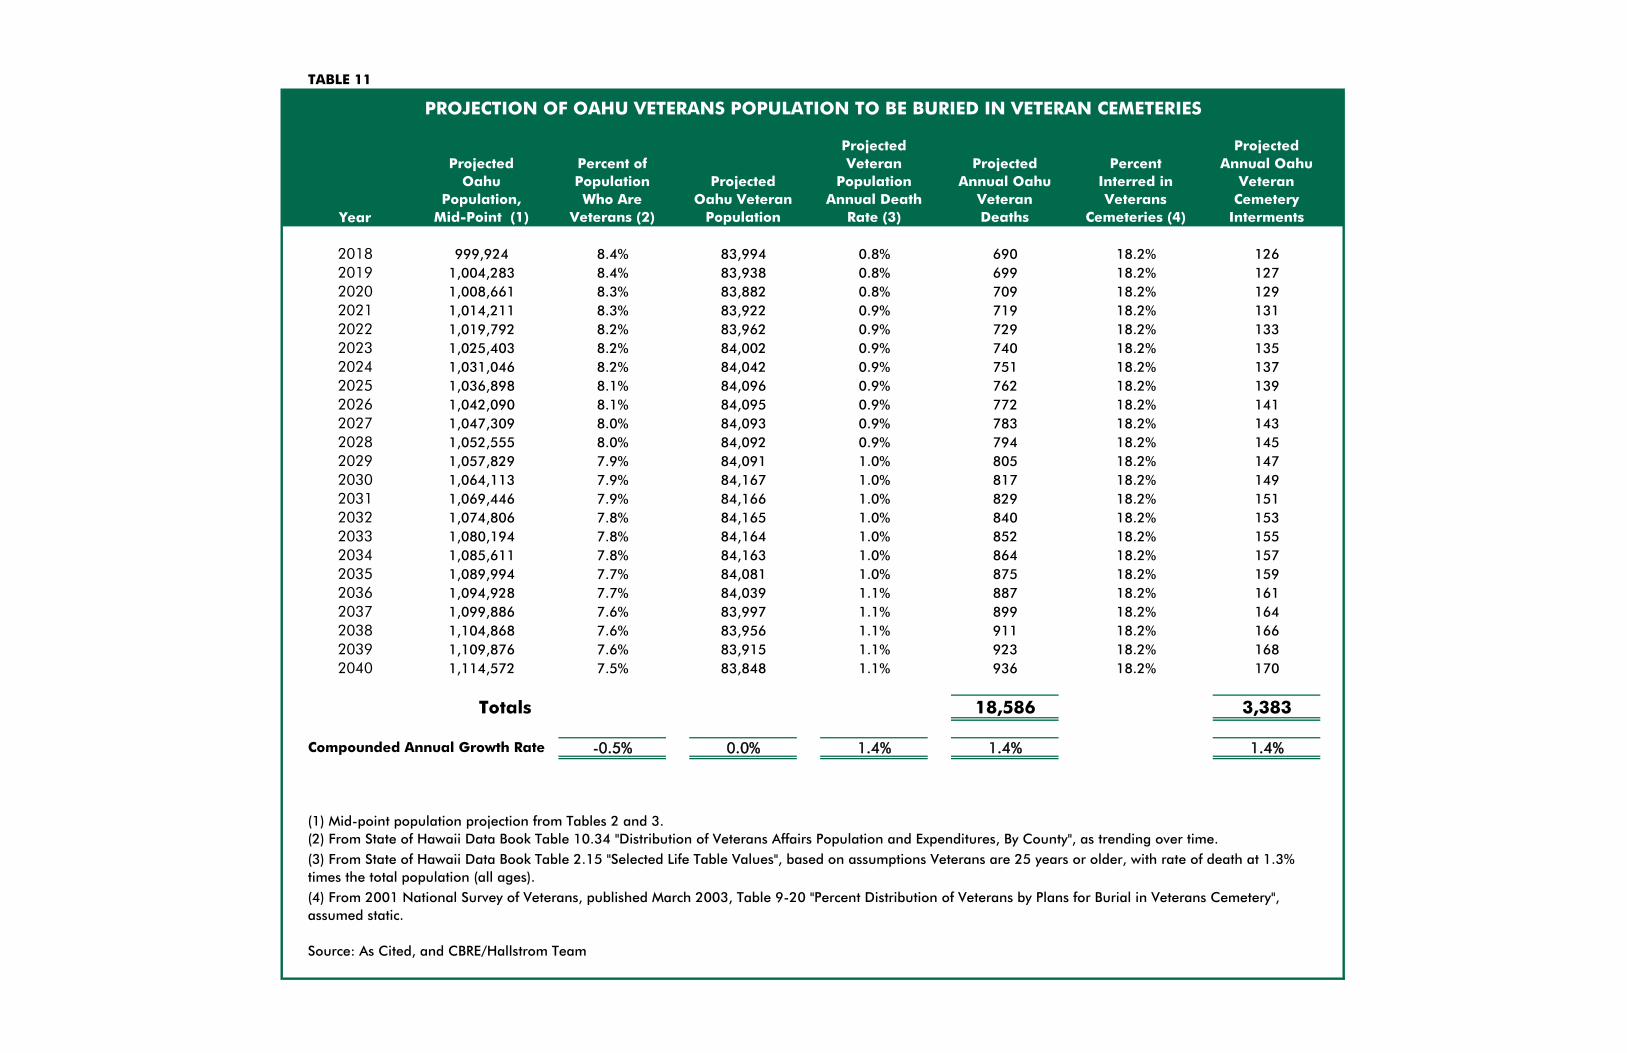
TABLE 11
Year
Projected Oahu
Population, Mid-Point (1)
Percent of Population Who Are
Veterans (2)
Projected Oahu Veteran
Population
Projected Veteran
Population Annual Death
Rate (3)
Projected Annual Oahu
Veteran Deaths
Percent Interred in Veterans
Cemeteries (4)
Projected Annual Oahu
Veteran Cemetery
Interments
2018 999,924 8.4% 83,994 0.8% 690 18.2% 1262019 1,004,283 8.4% 83,938 0.8% 699 18.2% 1272020 1,008,661 8.3% 83,882 0.8% 709 18.2% 1292021 1,014,211 8.3% 83,922 0.9% 719 18.2% 1312022 1,019,792 8.2% 83,962 0.9% 729 18.2% 1332023 1,025,403 8.2% 84,002 0.9% 740 18.2% 1352024 1,031,046 8.2% 84,042 0.9% 751 18.2% 1372025 1,036,898 8.1% 84,096 0.9% 762 18.2% 1392026 1,042,090 8.1% 84,095 0.9% 772 18.2% 1412027 1,047,309 8.0% 84,093 0.9% 783 18.2% 1432028 1,052,555 8.0% 84,092 0.9% 794 18.2% 1452029 1,057,829 7.9% 84,091 1.0% 805 18.2% 1472030 1,064,113 7.9% 84,167 1.0% 817 18.2% 1492031 1,069,446 7.9% 84,166 1.0% 829 18.2% 1512032 1,074,806 7.8% 84,165 1.0% 840 18.2% 1532033 1,080,194 7.8% 84,164 1.0% 852 18.2% 1552034 1,085,611 7.8% 84,163 1.0% 864 18.2% 1572035 1,089,994 7.7% 84,081 1.0% 875 18.2% 1592036 1,094,928 7.7% 84,039 1.1% 887 18.2% 1612037 1,099,886 7.6% 83,997 1.1% 899 18.2% 1642038 1,104,868 7.6% 83,956 1.1% 911 18.2% 1662039 1,109,876 7.6% 83,915 1.1% 923 18.2% 1682040 1,114,572 7.5% 83,848 1.1% 936 18.2% 170
Totals 18,586 3,383
Compounded Annual Growth Rate -0.5% 0.0% 1.4% 1.4% 1.4%
(1) Mid-point population projection from Tables 2 and 3.(2) From State of Hawaii Data Book Table 10.34 "Distribution of Veterans Affairs Population and Expenditures, By County", as trending over time.
Source: As Cited, and CBRE/Hallstrom Team
(3) From State of Hawaii Data Book Table 2.15 "Selected Life Table Values", based on assumptions Veterans are 25 years or older, with rate of death at 1.3% times the total population (all ages).(4) From 2001 National Survey of Veterans, published March 2003, Table 9-20 "Percent Distribution of Veterans by Plans for Burial in Veterans Cemetery", assumed static.
PROJECTION OF OAHU VETERANS POPULATION TO BE BURIED IN VETERAN CEMETERIES
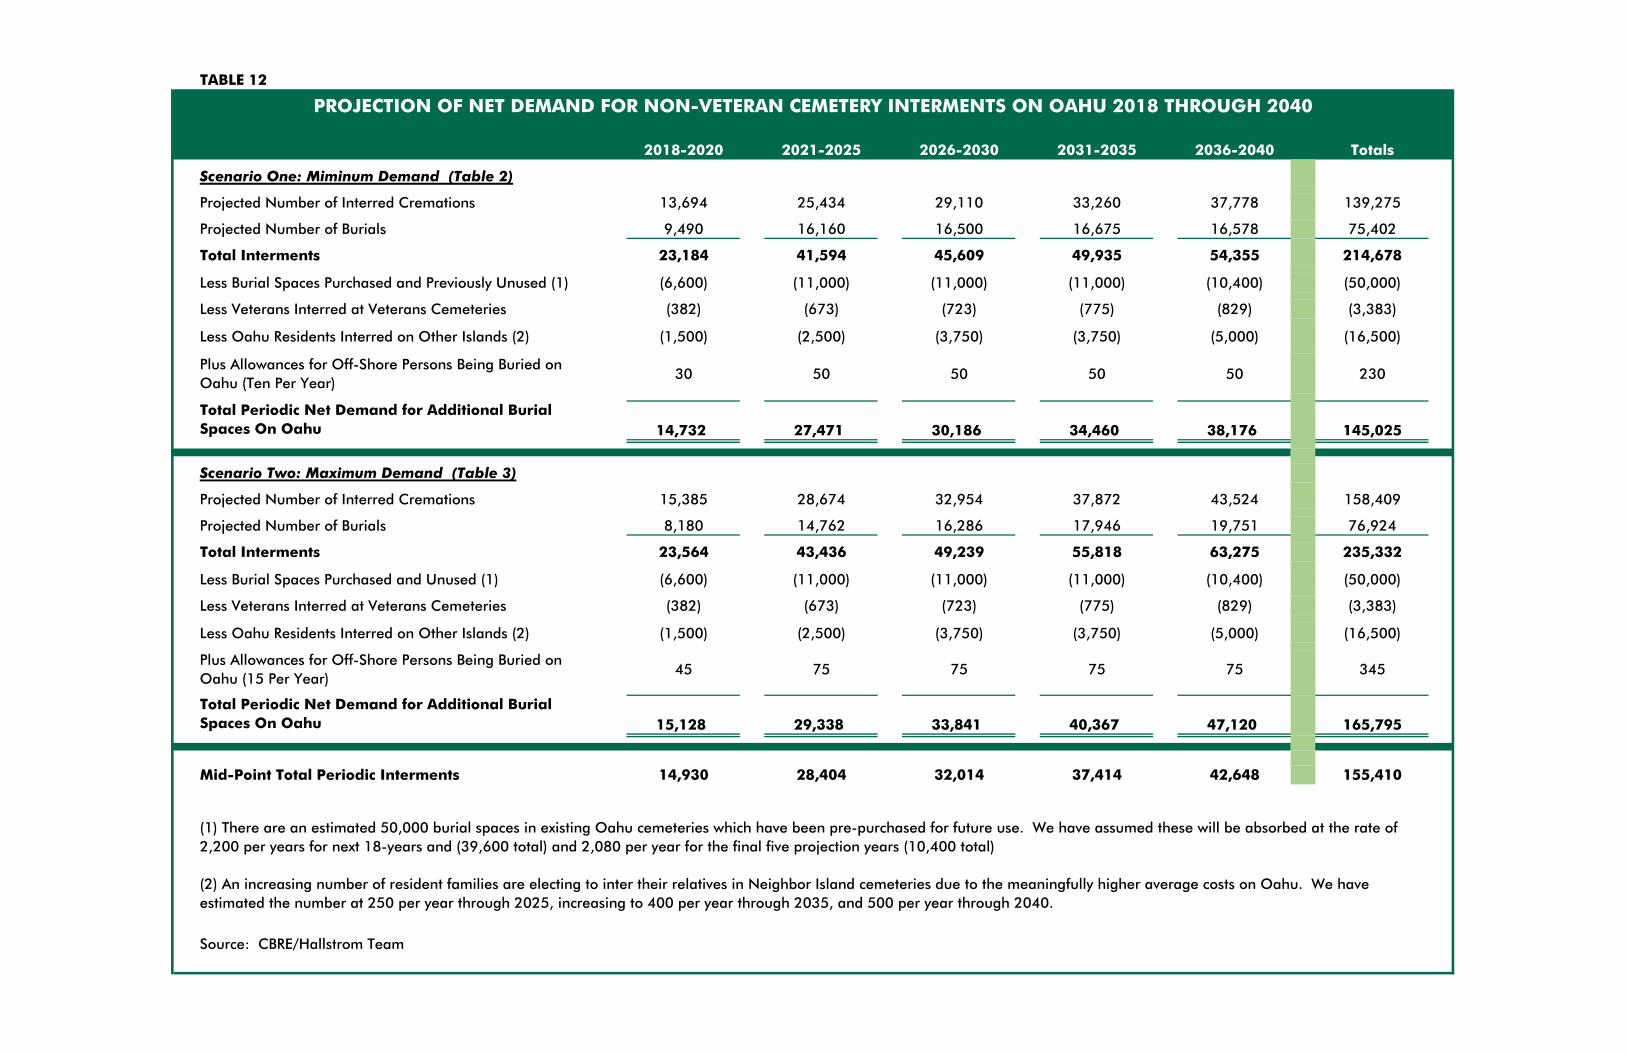
TABLE 12
2018-2020 2021-2025 2026-2030 2031-2035 2036-2040 Totals
Scenario One: Miminum Demand (Table 2)
Projected Number of Interred Cremations 13,694 25,434 29,110 33,260 37,778 139,275
Projected Number of Burials 9,490 16,160 16,500 16,675 16,578 75,402
Total Interments 23,184 41,594 45,609 49,935 54,355 214,678
Less Burial Spaces Purchased and Previously Unused (1) (6,600) (11,000) (11,000) (11,000) (10,400) (50,000)
Less Veterans Interred at Veterans Cemeteries (382) (673) (723) (775) (829) (3,383)
Less Oahu Residents Interred on Other Islands (2) (1,500) (2,500) (3,750) (3,750) (5,000) (16,500)
Plus Allowances for Off-Shore Persons Being Buried on Oahu (Ten Per Year)
30 50 50 50 50 230
Total Periodic Net Demand for Additional Burial Spaces On Oahu 14,732 27,471 30,186 34,460 38,176 145,025
Scenario Two: Maximum Demand (Table 3)
Projected Number of Interred Cremations 15,385 28,674 32,954 37,872 43,524 158,409
Projected Number of Burials 8,180 14,762 16,286 17,946 19,751 76,924
Total Interments 23,564 43,436 49,239 55,818 63,275 235,332
Less Burial Spaces Purchased and Unused (1) (6,600) (11,000) (11,000) (11,000) (10,400) (50,000)
Less Veterans Interred at Veterans Cemeteries (382) (673) (723) (775) (829) (3,383)
Less Oahu Residents Interred on Other Islands (2) (1,500) (2,500) (3,750) (3,750) (5,000) (16,500)
Plus Allowances for Off-Shore Persons Being Buried on Oahu (15 Per Year)
45 75 75 75 75 345
Total Periodic Net Demand for Additional Burial Spaces On Oahu 15,128 29,338 33,841 40,367 47,120 165,795
Mid-Point Total Periodic Interments 14,930 28,404 32,014 37,414 42,648 155,410
Source: CBRE/Hallstrom Team
PROJECTION OF NET DEMAND FOR NON-VETERAN CEMETERY INTERMENTS ON OAHU 2018 THROUGH 2040
(1) There are an estimated 50,000 burial spaces in existing Oahu cemeteries which have been pre-purchased for future use. We have assumed these will be absorbed at the rate of 2,200 per years for next 18-years and (39,600 total) and 2,080 per year for the final five projection years (10,400 total)
(2) An increasing number of resident families are electing to inter their relatives in Neighbor Island cemeteries due to the meaningfully higher average costs on Oahu. We have estimated the number at 250 per year through 2025, increasing to 400 per year through 2035, and 500 per year through 2040.
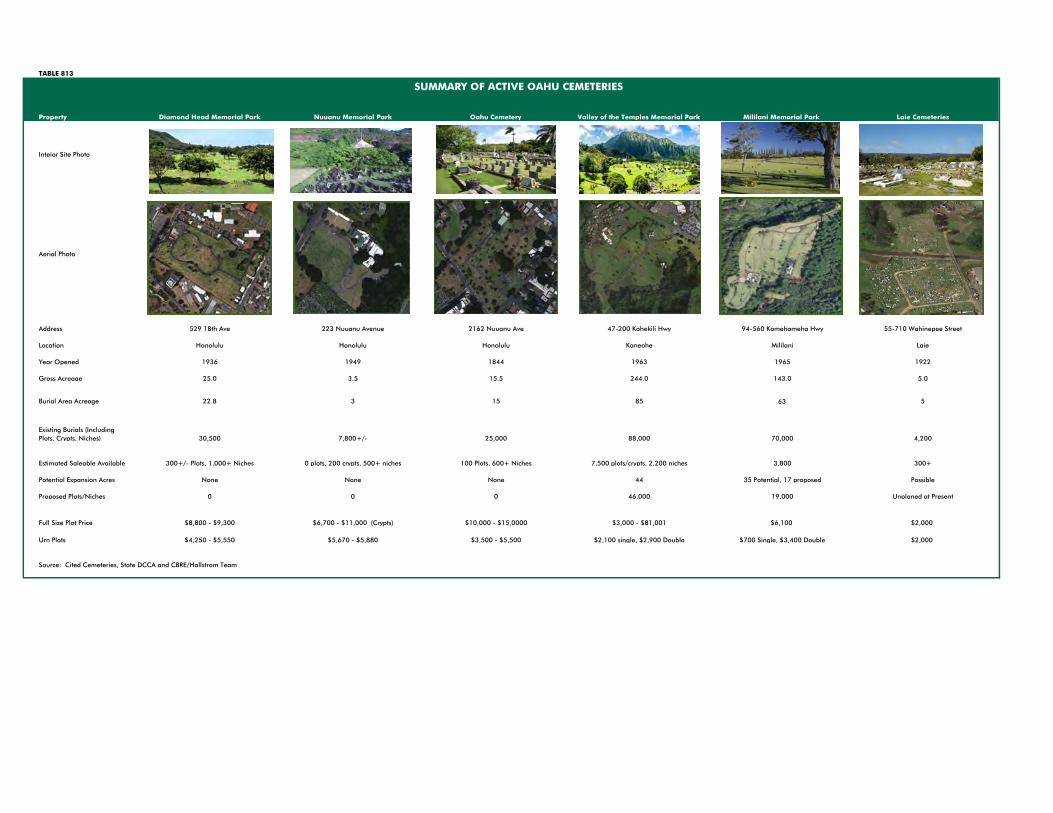
TABLE 813
Property Diamond Head Memorial Park Nuuanu Memorial Park Oahu Cemetery Valley of the Temples Memorial Park Mililani Memorial Park Laie Cemeteries
Inteior Site Photo
Aerial Photo
Address 529 18th Ave 223 Nuuanu Avenue 2162 Nuuanu Ave 47-200 Kahekili Hwy 94-560 Kamehameha Hwy 55-710 Wahinepee Street
Location Honolulu Honolulu Honolulu Kaneohe Mililani Laie
Year Opened 1936 1949 1844 1963 1965 1922
Gross Acreage 25.0 3.5 15.5 244.0 143.0 5.0
Burial Area Acreage 22.8 3 15 85 63 5
Existing Burials (Including Plots, Crypts, Niches) 30,500 7,800+/- 25,000 88,000 70,000 4,200
Estimated Saleable Available 300+/- Plots, 1,000+ Niches 0 plots, 200 crypts, 500+ niches 100 Plots, 600+ Niches 7,500 plots/crypts, 2,200 niches 3,800 300+
Potential Expansion Acres None None None 44 35 Potential, 17 proposed Possible
Proposed Plots/Niches 0 0 0 46,000 19,000 Unplaned at Present
Full Size Plot Price $8,800 - $9,300 $6,700 - $11,000 (Crypts) $10,000 - $15,0000 $3,000 - $81,001 $6,100 $2,000
Urn Plots $4,250 - $5,550 $5,670 - $5,880 $3,500 - $5,500 $2,100 single, $2,900 Double $700 Single, $3,400 Double $2,000
Source: Cited Cemeteries, State DCCA and CBRE/Hallstrom Team
SUMMARY OF ACTIVE OAHU CEMETERIES
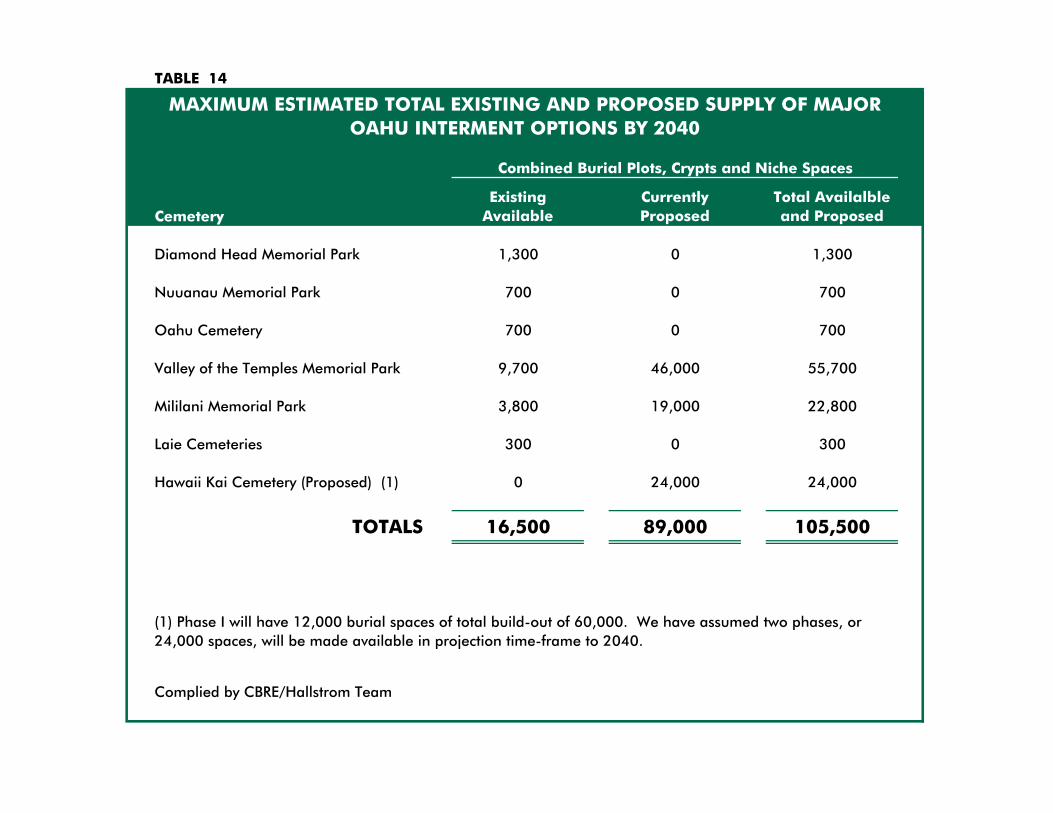
TABLE 14
CemeteryExisting
AvailableCurrently Proposed
Total Availalble and Proposed
Diamond Head Memorial Park 1,300 0 1,300
Nuuanau Memorial Park 700 0 700
Oahu Cemetery 700 0 700
Valley of the Temples Memorial Park 9,700 46,000 55,700
Mililani Memorial Park 3,800 19,000 22,800
Laie Cemeteries 300 0 300
Hawaii Kai Cemetery (Proposed) (1) 0 24,000 24,000
TOTALS 16,500 89,000 105,500
Complied by CBRE/Hallstrom Team
Combined Burial Plots, Crypts and Niche Spaces
MAXIMUM ESTIMATED TOTAL EXISTING AND PROPOSED SUPPLY OF MAJOR OAHU INTERMENT OPTIONS BY 2040
(1) Phase I will have 12,000 burial spaces of total build-out of 60,000. We have assumed two phases, or 24,000 spaces, will be made available in projection time-frame to 2040.

TABLE 15
Segment 2018-2020 2021-2025 2026-2030 2031-2035 2036-2040 TOTALS
1. Minimum Demand
Assumed Supply of Burial Plots, Crypts and Cremation Niches Major Cemeteries 13,761 22,935 22,935 22,935 22,935 105,500
Oahu Net Burial Spaces Demand 14,732 27,471 30,186 34,460 38,176 145,025
Shortage or (Excess) Supply 971 4,536 7,252 11,525 15,241 39,525
Potential Residual Subject Minimum Demand at 100% Capture Rate 971 4,536 7,252 11,525 15,241 39,525 at 95% Capture Rate 923 4,309 6,889 10,949 14,479 37,549
2. Maximum Demand
Assumed Supply of Burial Plots, Crypts and Cremation Niches Major Cemeteries 13,761 22,935 22,935 22,935 22,935 105,500
Oahu Net Burial Spaces Demand 15,128 29,338 33,841 40,367 47,120 165,795
Shortage or (Excess) Supply 1,367 6,403 10,907 17,432 24,186 60,295
Potential Residual Subject Minimum Demand at 100% Capture Rate 1,367 6,403 10,907 17,432 24,186 60,295 at 95% Capture Rate 1,298 6,083 10,361 16,561 22,976 57,280
3. Mid-Point Demand
Oahu Burial Spaces Demand 14,930 28,404 32,014 37,414 42,648 155,410
Shortage or (Excess) Supply 1,169 5,469 9,079 14,479 19,713 49,910
Potential Residual Subject Minimum Demand at 95% Capture Rate 1,169 5,469 9,079 14,479 19,713 49,910 at 90% Capture Rate 1,111 5,196 8,625 13,755 18,728 47,414
=
Source: Cited Cemeteries and CBRE/Hallstrom Team
PROJECTION OF POTENTIAL SUBJECT PLOT ABSORPTION USING THE RESIDUAL METHOD BASED ON ESTIMATED EXISTING AND PROPOSED PLOTS IN MAJOR OAHU CEMETERIES 2018 THROUGH 2040
(1) Includes spaces in existing cemeteries not being marketed/open to other purchasers, sold-out cemeteries, church cemeteries and other specialty burial sites. Allowance of 1,500 per year through 2030, 1,000 per year through 2035, and 500 per year thereafter.
Probable Absorption period for 33,600 remaining and proposed subject burial spaces. Circa 19 years in
Minimum Scenario and 15 Years in Maximum. Mid-Point of 17 years.

TABLE 16
Scenario One: Using Minimum Demand AssumptionsIndicated
Total Net Effective TotalOahu Space Subject Subject Space
Date Period Demand Share Absorption
2020 1 2021 2 5,494 30.00% 1,648 2022 3 5,494 30.00% 1,648 2023 4 5,494 30.00% 1,6482024 5 5,494 30.00% 1,6482025 6 5,494 30.00% 1,6482026 7 6,037 30.00% 1,8112027 8 6,037 30.00% 1,8112028 9 6,037 30.00% 1,8112029 10 6,037 30.00% 1,8112030 11 6,037 30.00% 1,8112031 12 6,892 30.00% 2,0682032 13 6,892 30.00% 2,0682033 14 6,892 30.00% 2,0682034 15 6,892 30.00% 2,0682035 16 6,892 30.00% 2,0682036 17 7,635 30.00% 2,2912037 18 7,635 30.00% 2,2912038 19 7,635 5.03% 384
Totals 115,023 28.34% 32,600
Scenario Two: Using Maximum Demand AssumptionsIndicated
Total Net Effective TotalOahu Space Subject Subject Space
Date Period Demand Share Absorption
2020 1 2021 2 5,868 33.00% 1,936 2022 3 5,868 33.00% 1,936 2023 4 5,868 33.00% 1,9362024 5 5,868 33.00% 1,9362025 6 5,868 33.00% 1,9362026 7 6,768 33.00% 2,2342027 8 6,768 33.00% 2,2342028 9 6,768 33.00% 2,2342029 10 6,768 33.00% 2,2342030 11 6,768 33.00% 2,2342031 12 8,073 33.00% 2,6642032 13 8,073 33.00% 2,6642033 14 8,073 33.00% 2,6642034 15 8,073 33.00% 2,6642035 16 8,073 13.55% 1,094
Totals 103,547 31.48% 32,600
ANALYSIS MID-POINT16.8 Years 109,285 29.83% 32,600
Source: CBRE/Hallstrom Team
Infrastructure Emplacement
Sales Year
Sales Year
SUMMARY OF SUBJECT PROJECTED BURIAL SPACE DEMAND LEVELS USING THE MARKET SHARES METHOD
Assuming 3,600 Exisiting Inventory and 30,000 Proposed Spaces
Infrastructure Emplacement

Addenda
Addendum B
ECONOMIC IMPACT ANALYSIS TABLES

TABLE 17
Cumulative During Build-Out Stabilized Annually
Analysis Item Period Thereafter
Direct Capital Investment $29,304,000
Local Contractor's Profits $2,930,400
Local Supplier's Profits $1,172,160
Worker Years of Jobs 931 60
Employee Wages $62,854,492 $3,998,895
Total Oahu "Base" Economic Impact $141,024,067 $5,842,400
Honolulu County Gross Tax Receipts $500,000 $0
State of Hawaii Gross Tax Receipts $8,721,678 $402,376
Added Honolulu County Costs of Services $0 $0
Added State of Hawaii Costs of Services $0 $0
Honolulu County Net Benefits or (Loss) $500,000 $0
State of Hawaii Net Benefits or (Loss) $8,721,678 $402,376
Source: CBRE/Hallstrom Team
SUMMARY COMPARISON OF MAJOR ECONOMIC IMPACTS
AND PUBLIC FISCAL COSTS/BENEFITSAll Amounts Expressed in Constant, Uninflated 2018 Dollars
Accounting for "New" Impacts Only

TABLE 18
ProjectYear Year Activity
2018-19 1 &2 Achieve full-entitlement, approvals and permits
2020 3 Site preparation and emplacement of infrastructure
2021 4 Expansion area sales and interments commence
2022-2035 5 through 16Sales of plots and interments continue, with full sell-
out/absorption by 2035
Post-2035 17 and BeyondInterments continue at lower-velocity along with re-sales of
plots over the long-term
PROJECTED HAWAII MEMORIAL PARK EXPANSION INFRASTRUCTURE, SALES/ABSORPTION AND INTERMENT TIMING

TABLE 19
Totals During
Item Build-Out
2020 to 2025 2026 to 2030 2031-2035
Infrastructure Emplacement (1) $29,304,000 $0 $0 $29,304,000
TOTAL PERIODIC CONSTRUCTION COSTS $29,304,000 $0 $0 $29,304,000
Contractor Profits $2,930,400 $0 $0 $2,930,400
Supplier Profits $1,172,160 $0 $0 $1,172,160
Source: CBRE/Hallstrom Team
(1) "Hawaiian Memorail Park Expansion Cost Estimate" Sam O. Hirota, Inc., April 30, 2018. Includes site work, on and & off-site infrastructure, roadways and contingency; engineering & architecture, permits and study fees.
Development and Sales Period
PROPOSED DEVELOPMENT SCHEDULE AND ESTIMATED CONSTRUCTION COSTS
All Amounts Expressed in Constant 2018 Dollars

TABLE 20
Totals During
Build-Out
Construction Employment (1) 2020 to 2025 2026 to 2030 2031-2035
Infrastructure Emplacement 73 73
Total Periodic Construction Jobs 73 0 0 73
On-Going Employment StabilizedAnnually
Maintenance, Administrative and Services 190 210 225 625
Total FTE Jobs in Place at End of Period 38 42 45 45
Off-Site Employment (3) 88 70 75 233
Total FTE Jobs in Place at End of Period 37 14 15 15
TOTAL PERIODIC WORKER YEARS 351 280 300 931
TOTAL END-OF-PERIOD PERMANENT JOBCOUNT 51 56 60 60
(1) Infrastructure construction employment estimated at 1 worker-year for every $400,000 in costs. Includes all direct employment associated with construction, on and off-site.
(3) Estimated at one cumulative off-site employment position for every three on site positions.
Source: CBRE/Hallstrom Team
ESTIMATED YEARLY FULL-TIME EQUIVALENT EMPLOYMENT POSITIONS CREATED BY DEVELOPMENT
Development and Sales Period
(2) Current staff of 38 employees, including 20 maintenance, 10 administrative, 5 funeral services and 3 community services. Expansion of existing park from 80 acres to 108 acres will create an additional 7 maintenance positions.

TABLE 21
Totals During
Build-Out
Construction Wages (1) 2020 to 2025 2026 to 2030 2031-2035
Infrastructure Emplacement $5,942,851 $5,942,851
Total Periodic Construction Wages $5,942,851 $0 $0 $5,942,851
Stabilized
Annually
Maintenance, Administrative and Services (2)
Annual Wages $2,665,485 $2,946,062 $3,156,495 $8,768,043 $3,156,495
Total Periodic Wages $13,327,425 $14,730,312 $15,782,477 $43,840,214
Off-Site Employment Wages (3)
Annual Average Wages $821,371 $786,240 $842,400 $2,178,571
Total Periodic Wages $4,928,227 $3,931,200 $4,212,000 $13,071,427 $842,400
TOTAL PERIODIC WAGES $24,198,503 $18,661,512 $19,994,477 $62,854,492 $3,998,895
(1) Average annual wage for full-time-equivalent construction worker (equipment operators and other infrastructure-related trades ) at $81,120 ($39/hour X 2,080 hours).
(2) Based on current payroll of HMP. Added workers due to expansion assumed to be at average proportional wage.
(3) Average annual wage for full-time-equivalent general worker at $56,160 ($27/hour), the average wage for all "All Occupations" in the state.
Wages taken from US Department of Labor "May 2017 Metropolitan and Non-Metropolitan Area Occupational Employment and Wage Estimates - Urban Honolulu, HI" escalated one year.
Source: CBRE/Hallstrom Team
Development and Sales Period
ESTIMATED YEARLY EMPLOYEE WAGES CREATED BY DEVELOPMENT
All Amounts Expressed in Constant 2018 Dollars
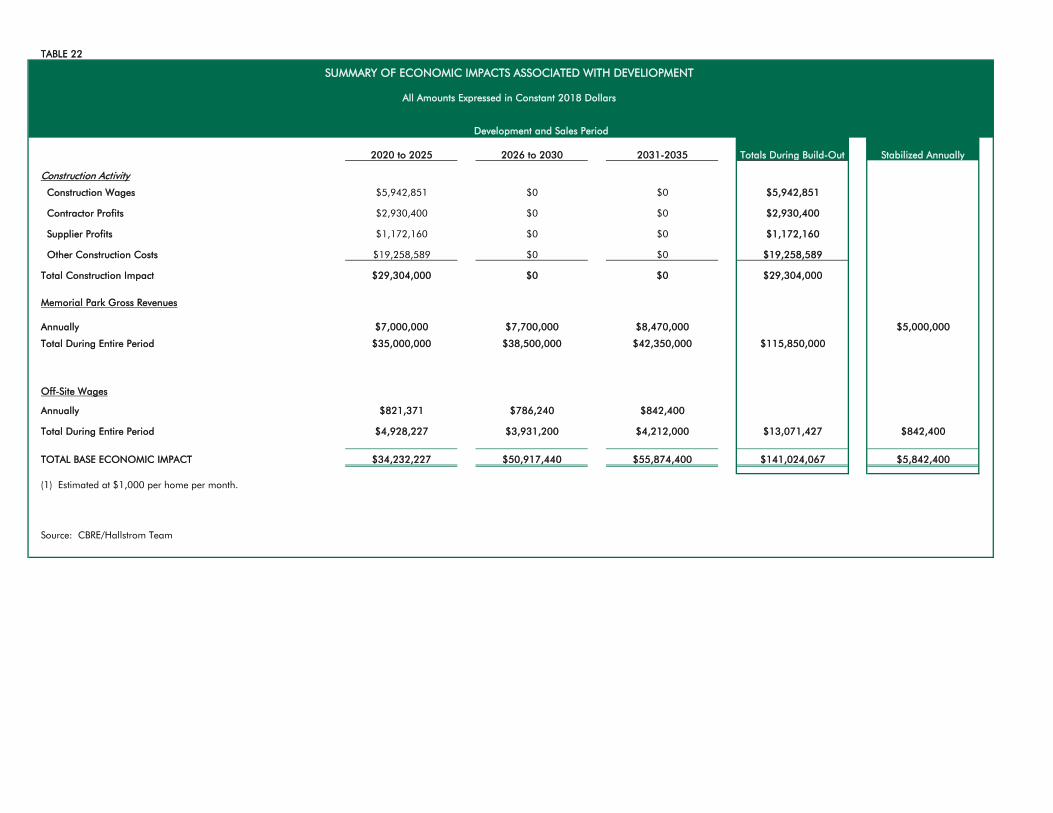
TABLE 22
2020 to 2025 2026 to 2030 2031-2035 Totals During Build-Out Stabilized Annually
Construction Activity
Construction Wages $5,942,851 $0 $0 $5,942,851
Contractor Profits $2,930,400 $0 $0 $2,930,400
Supplier Profits $1,172,160 $0 $0 $1,172,160
Other Construction Costs $19,258,589 $0 $0 $19,258,589
Total Construction Impact $29,304,000 $0 $0 $29,304,000
Memorial Park Gross Revenues
Annually $7,000,000 $7,700,000 $8,470,000 $5,000,000
Total During Entire Period $35,000,000 $38,500,000 $42,350,000 $115,850,000
Off-Site Wages
Annually $821,371 $786,240 $842,400
Total During Entire Period $4,928,227 $3,931,200 $4,212,000 $13,071,427 $842,400
TOTAL BASE ECONOMIC IMPACT $34,232,227 $50,917,440 $55,874,400 $141,024,067 $5,842,400
(1) Estimated at $1,000 per home per month.
Source: CBRE/Hallstrom Team
Development and Sales Period
SUMMARY OF ECONOMIC IMPACTS ASSOCIATED WITH DEVELIOPMENT
All Amounts Expressed in Constant 2018 Dollars
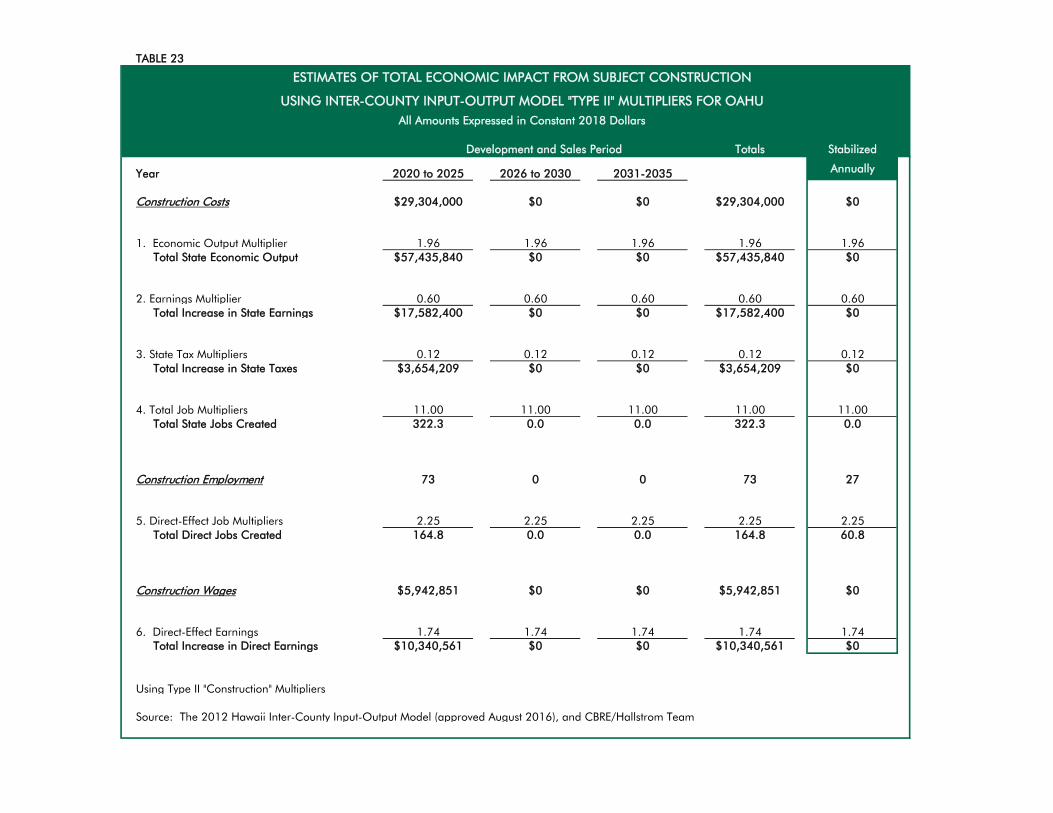
TABLE 23
Totals Stabilized
Year 2020 to 2025 2026 to 2030 2031-2035 Annually
Construction Costs $29,304,000 $0 $0 $29,304,000 $0
1. Economic Output Multiplier 1.96 1.96 1.96 1.96 1.96 Total State Economic Output $57,435,840 $0 $0 $57,435,840 $0
2. Earnings Multiplier 0.60 0.60 0.60 0.60 0.60 Total Increase in State Earnings $17,582,400 $0 $0 $17,582,400 $0
3. State Tax Multipliers 0.12 0.12 0.12 0.12 0.12 Total Increase in State Taxes $3,654,209 $0 $0 $3,654,209 $0
4. Total Job Multipliers 11.00 11.00 11.00 11.00 11.00 Total State Jobs Created 322.3 0.0 0.0 322.3 0.0
Construction Employment 73 0 0 73 27
5. Direct-Effect Job Multipliers 2.25 2.25 2.25 2.25 2.25 Total Direct Jobs Created 164.8 0.0 0.0 164.8 60.8
Construction Wages $5,942,851 $0 $0 $5,942,851 $0
6. Direct-Effect Earnings 1.74 1.74 1.74 1.74 1.74 Total Increase in Direct Earnings $10,340,561 $0 $0 $10,340,561 $0
Using Type II "Construction" Multipliers
Source: The 2012 Hawaii Inter-County Input-Output Model (approved August 2016), and CBRE/Hallstrom Team
Development and Sales Period
ESTIMATES OF TOTAL ECONOMIC IMPACT FROM SUBJECT CONSTRUCTION
USING INTER-COUNTY INPUT-OUTPUT MODEL "TYPE II" MULTIPLIERS FOR OAHUAll Amounts Expressed in Constant 2018 Dollars

TABLE 24
Totals Stabilized
Year 2020 to 2025 2026 to 2030 2031-2035 Annually
TotalOn-Going Economic Activity $39,928,227 $42,431,200 $46,562,000 $128,921,427 $5,842,400
1. Economic Output Multiplier 1.84 1.84 1.84 1.84 1.84 Total State Economic Output $73,467,938 $78,073,408 $85,674,080 $237,215,426 $10,750,016
2. Earnings Multiplier 0.52 0.52 0.52 0.52 0.52 Total Increase in State Earnings $20,762,678 $22,064,224 $24,212,240 $67,039,142 $3,038,048
3. State Tax Multipliers 0.12 0.12 0.12 0.12 0.12 Total Increase in State Taxes $4,655,631 $4,947,478 $5,429,129 $15,032,238 $681,224
4. Total Job Multipliers 20.10 20.10 20.10 20.10 20.10 Total State Jobs Created 802.6 852.9 935.9 2,591.3 117.4
Operating Employment 50.5 56.0 60.0 166.5 60.0
5. Direct-Effect Job Multipliers 1.58 1.58 1.58 1.58 1.58 Total Direct Jobs Created 79.9 88.5 94.8 263.1 94.8
Operating Wages $16,659,281 $18,412,890 $19,728,096 $54,800,267 $3,998,895
6. Direct-Effect Earnings 1.70 1.70 1.70 1.70 1.70 Total Increase in Direct Earnings $28,320,778 $31,301,913 $33,537,764 $93,160,454 $6,798,122
Using Type II "Services" and "Other Services" Multipliers
Source: The 2012 Hawaii Inter-County Input-Output Model (approved August 2016), and CBRE/Hallstrom Team
Development Year
ESTIMATES OF TOTAL ECONOMIC IMPACT FROM SUBJECT OPERATIONS
USING INTER-COUNTY INPUT-OUTPUT MODEL "TYPE II" MULTIPLIERS FOR OAHUAll Amounts Expressed in Constant 2018 Dollars

Addenda
Addendum C
PUBLIC FISCAL (COST BENEFIT) ASSESSMENT TABLES
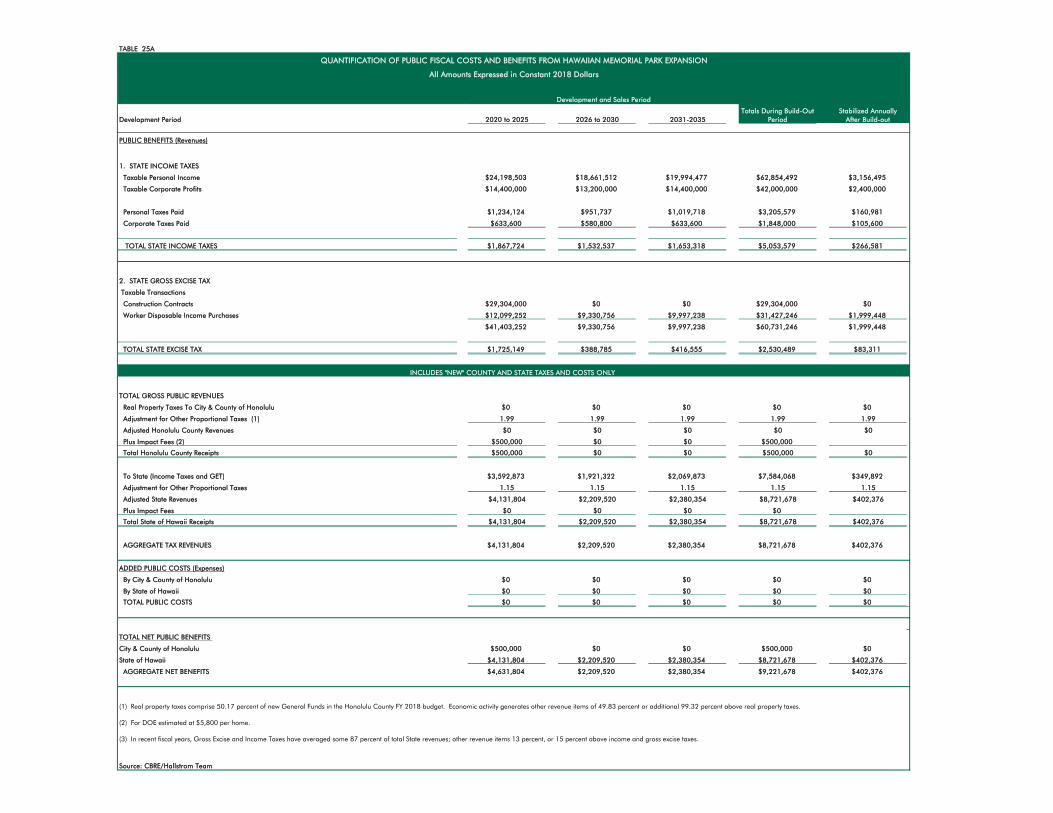
TABLE 25A
Development Period 2020 to 2025 2026 to 2030 2031-2035Totals During Build-Out
PeriodStabilized Annually
After Build-out
PUBLIC BENEFITS (Revenues)
1. STATE INCOME TAXES
Taxable Personal Income $24,198,503 $18,661,512 $19,994,477 $62,854,492 $3,156,495
Taxable Corporate Profits $14,400,000 $13,200,000 $14,400,000 $42,000,000 $2,400,000
Personal Taxes Paid $1,234,124 $951,737 $1,019,718 $3,205,579 $160,981
Corporate Taxes Paid $633,600 $580,800 $633,600 $1,848,000 $105,600
TOTAL STATE INCOME TAXES $1,867,724 $1,532,537 $1,653,318 $5,053,579 $266,581
2. STATE GROSS EXCISE TAX
Taxable Transactions
Construction Contracts $29,304,000 $0 $0 $29,304,000 $0
Worker Disposable Income Purchases $12,099,252 $9,330,756 $9,997,238 $31,427,246 $1,999,448
$41,403,252 $9,330,756 $9,997,238 $60,731,246 $1,999,448
TOTAL STATE EXCISE TAX $1,725,149 $388,785 $416,555 $2,530,489 $83,311
TOTAL GROSS PUBLIC REVENUES
Real Property Taxes To City & County of Honolulu $0 $0 $0 $0 $0
Adjustment for Other Proportional Taxes (1) 1.99 1.99 1.99 1.99 1.99
Adjusted Honolulu County Revenues $0 $0 $0 $0 $0
Plus Impact Fees (2) $500,000 $0 $0 $500,000
Total Honolulu County Receipts $500,000 $0 $0 $500,000 $0
To State (Income Taxes and GET) $3,592,873 $1,921,322 $2,069,873 $7,584,068 $349,892
Adjustment for Other Proportional Taxes 1.15 1.15 1.15 1.15 1.15
Adjusted State Revenues $4,131,804 $2,209,520 $2,380,354 $8,721,678 $402,376
Plus Impact Fees $0 $0 $0 $0
Total State of Hawaii Receipts $4,131,804 $2,209,520 $2,380,354 $8,721,678 $402,376
AGGREGATE TAX REVENUES $4,131,804 $2,209,520 $2,380,354 $8,721,678 $402,376
ADDED PUBLIC COSTS (Expenses)
By City & County of Honolulu $0 $0 $0 $0 $0
By State of Hawaii $0 $0 $0 $0 $0
TOTAL PUBLIC COSTS $0 $0 $0 $0 $0
TOTAL NET PUBLIC BENEFITS
City & County of Honolulu $500,000 $0 $0 $500,000 $0
State of Hawaii $4,131,804 $2,209,520 $2,380,354 $8,721,678 $402,376
AGGREGATE NET BENEFITS $4,631,804 $2,209,520 $2,380,354 $9,221,678 $402,376
(1) Real property taxes comprise 50.17 percent of new General Funds in the Honolulu County FY 2018 budget. Economic activity generates other revenue items of 49.83 percent or additional 99.32 percent above real property taxes.
(2) For DOE estimated at $5,800 per home.
(3) In recent fiscal years, Gross Excise and Income Taxes have averaged some 87 percent of total State revenues; other revenue items 13 percent, or 15 percent above income and gross excise taxes.
Source: CBRE/Hallstrom Team
INCLUDES "NEW" COUNTY AND STATE TAXES AND COSTS ONLY
Development and Sales Period
QUANTIFICATION OF PUBLIC FISCAL COSTS AND BENEFITS FROM HAWAIIAN MEMORIAL PARK EXPANSION
All Amounts Expressed in Constant 2018 Dollars

TABLE 25B
Development Period 2020 to 2025 2026 to 2030 2031-2035Totals During Build-Out
PeriodStabilized Annually After
Build-out
PUBLIC BENEFITS (Revenues)
1. STATE INCOME TAXES
Taxable Personal Income $24,198,503 $18,661,512 $19,994,477 $62,854,492 $3,156,495
Taxable Corporate Profits $14,400,000 $13,200,000 $14,400,000 $42,000,000 $2,400,000
Personal Taxes Paid $1,234,124 $951,737 $1,019,718 $3,205,579 $160,981
Corporate Taxes Paid $633,600 $580,800 $633,600 $1,848,000 $105,600
TOTAL STATE INCOME TAXES $1,867,724 $1,532,537 $1,653,318 $5,053,579 $266,581
2. STATE GROSS EXCISE TAX
Taxable Transactions
Construction Contracts $29,304,000 $0 $0 $29,304,000 $0
Worker Disposable Income Purchases $12,099,252 $9,330,756 $9,997,238 $31,427,246 $1,999,448
$41,403,252 $9,330,756 $9,997,238 $60,731,246 $1,999,448
TOTAL STATE EXCISE TAX $1,725,149 $388,785 $416,555 $2,530,489 $83,311
Source: CBRE/Hallstrom Team
QUANTIFICATION OF PUBLIC FISCAL COSTS AND BENEFITS FROM HAWAIIAN MEMORIAL PARK EXPANSION
All Amounts Expressed in Constant 2018 Dollars
Development and Sales Period

TABLE 25C
Development Period 2020 to 2025 2026 to 2030 2031-2035Totals During Build-Out
PeriodStabilized Annually After
Build-out
TOTAL GROSS PUBLIC REVENUES
Real Property Taxes To City & County of Honolulu $0 $0 $0 $0 $0
Adjustment for Other Proportional Taxes (1) 1.99 1.99 1.99 1.99 1.99
Adjusted Honolulu County Revenues $0 $0 $0 $0 $0
Plus Impact Fees (2) $500,000 $0 $0 $500,000
Total Honolulu County Receipts $500,000 $0 $0 $500,000 $0
To State (Income Taxes and GET) $3,592,873 $1,921,322 $2,069,873 $7,584,068 $349,892
Adjustment for Other Proportional Taxes 1.15 1.15 1.15 1.15 1.15
Adjusted State Revenues $4,131,804 $2,209,520 $2,380,354 $8,721,678 $402,376
Plus Impact Fees $0 $0 $0 $0
Total State of Hawaii Receipts $4,131,804 $2,209,520 $2,380,354 $8,721,678 $402,376
AGGREGATE TAX REVENUES $4,131,804 $2,209,520 $2,380,354 $8,721,678 $402,376
ADDED PUBLIC COSTS (Expenses)
By City & County of Honolulu $0 $0 $0 $0 $0
By State of Hawaii $0 $0 $0 $0 $0
TOTAL PUBLIC COSTS $0 $0 $0 $0 $0
TOTAL NET PUBLIC BENEFITS
City & County of Honolulu $500,000 $0 $0 $500,000 $0
State of Hawaii $4,131,804 $2,209,520 $2,380,354 $8,721,678 $402,376
AGGREGATE NET BENEFITS $4,631,804 $2,209,520 $2,380,354 $9,221,678 $402,376
(1) Real property taxes comprise 50.17 percent of new General Funds in the Honolulu County FY 2018 budget. Economic activity generates other revenue items of 49.83 percent or additional 99.32 percent above real property taxes.
(2) For DOE estimated at $5,800 per home.
(3) In recent fiscal years, Gross Excise and Income Taxes have averaged some 87 percent of total State revenues; other revenue items 13 percent, or 15 percent above income and gross excise taxes.
Source: CBRE/Hallstrom Team
INCLUDES "NEW" COUNTY AND STATE TAXES AND COSTS ONLY
QUANTIFICATION OF PUBLIC FISCAL COSTS AND BENEFITS FROM HAWAIIAN MEMORIAL PARK EXPANSION
All Amounts Expressed in Constant 2018 Dollars
Development and Sales Period

Addenda
Addendum D
QUALIFICATIONS
PROFESSIONAL QUALIFICATIONS OF THOMAS W. HOLLIDAY, CRE, FRICS
Business Affiliation Director The Hallstrom Team | CBRE, Inc. Valuation & Advisory Services Honolulu, Hawaii (2015 – Present) Senior Analyst/ The Hallstrom Group, Inc. Supervisor Honolulu, Hawaii (1980 – 2014) Former Staff Appraiser Davis-Baker Appraisal Co. Avalon, Santa Catalina Island, California
(1977 -1979) International Designation CRE Designation (2015) - The Counselors of Real Estate and Membership FRICS Designation (2016)–Fellow of the Royal Institution of Chartered Surveyors Education/Qualifications California State University, Fullerton (Communications/Journalism) More than 600 Hawaii Hotel/Hospitality Valuation and
Consulting Assignments More than 150 Market Studies, Economic Impact Analyses and
Public Fiscal Assessments for Proposed Projects and Entitlement Purposes
Qualified expert witness testimony before State of Hawaii Land Use Commission, County Planning Commissions, County Councils and various state and county boards and agencies since 1983.
Only certified real estate economist by County of Kauai for workforce housing assessments.
Numerous SREA, Appraisal Institute and RICS Courses Numerous professional seminars and clinics. Contributing author to Hawaii Real Estate Investor, Honolulu Star Bulletin, Pacific Business News, Other Publications On January 1, 1991, the American Institute of Real Estate Appraisers
(AIREA) and the Society of Real Estate Appraisers (SREA) consolidated, forming the Appraisal Institute (AI).
Recent Assignments Market Study, Economic Impact Analyses and Public Costs/ Benefits (Fiscal Impact) Assessments Oahu -- OHA Kakaako Makai (Mixed-Use Project) -- Howard Hughes/Ward Kewalo Basin (Retail Project) -- Marriott Waikiki Parking Lot (Hotel/Timeshare Project) -- Residence Inn Kapolei (Hotel) -- Turtle Bay Resort (Destination Resort Community) -- Waikapu Country Town (Mixed-Use Community) -- Oahu Community Correctional Center Relocation -- Oahu Tourism Spending/Tax Impact Analysis -- Waikapu Country Town (Mixed-Use Community)

Professional Qualifications of Thomas W. Holliday (continued) Maui County -- Waikapu Country Town (Mixed-Use Community) -- Lanai City Expansion (Mixed-Use/201H Community) -- Polanui Garden (201H Residential Community) -- Molokai Ranch Holdings (Mixed-Use) -- Makila Rural Subdivision (201H Residential Community) -- Makila Kai (201H Residential Community) -- Maui Research & Tech Park (Mixed-Use Community) -- Maui Lani (Mixed-Use Community) -- Honuaula (Mixed-Use Community) -- Makena Beach Resort -- Maui Business Park, Phase II (Industrial/Commercial) -- Kapalua Mauka (Master Planned Community) -- Hailiimaile (Mixed-Use Master Planned Community) -- Pulelehua (Master Planned Community) -- Westin Kaanapali Ocean Villas Expansion (Resort/Timeshare) Big Island -- Parker Ranch Waimea Town Center (Mixed-Use) -- West Hawaii/Gold Coast Tourism & Hotel Analysis -- Puako Farms/Kamakoa (Residential Subdivision) -- Kau Tea Farm (Agricultural/Mixed-Use Project) -- Kamakana Villages (Mixed-Use Residential Development) -- W.H. Shipman Ltd, Master Plan (Various Urban Uses) -- Nani Kahuku Aina (Mixed-Use Resort Community -- Kona Kai Ola (Mixed-Use Resort Community) -- Waikoloa Highlands (Residential) -- Waikoloa Heights (Mixed-Use Residential Development) Kauai -- Princeville Lodge (Hotel) -- Princeville Phase II (Destination Resort Community) -- Hanalei Plantation Workforce Housing (Resort) -- Lima Ola (Residential Community) -- Coco Palms (Hotel) -- Sheraton Kauai Workforce Housing (Resort) -- Coconut Coast Tourism and Hotel Analysis -- Hanalei Plantation Resort (Resort/Residential) -- Kukuiula (Resort/Residential) -- Waipono/Puhi (Mixed-Use Planned Development) -- Eleele Commercial Expansion (Commercial) -- Village at Poipu (Resort/Residential) -- Ocean Bay Plantation (Resort/Residential)
Professional Qualifications of Thomas W. Holliday (continued) Major Neighbor Island Valuation Assignments -- Mauna Lani Bay Hotel -- Courtyard Kahului Airport Hotel -- Maui Oceanfront Days Inn -- Holiday Inn Express – Kona Hotel (proposed) -- Keauhou Beach Hotel -- Courtyard King Kamehameha Kona Beach Hotel -- Aloha Beach Resort -- Coco Palms Resort -- Grand Hyatt Kauai -- Islander on the Beach -- Waimea Plantation Cottages -- Coconut Beach Resort -- Sheraton Maui Hotel -- Outrigger Wailea Resort Hotel -- Maui Lu Hotel -- Coconut Grove Condominiums -- Palauea Bay Holdings -- Wailea Ranch -- Maui Coast Hotel -- Westin Maui Hotel -- Maui Marriott Hotel -- Waihee Beach -- Kapalua Bay Hotel and The Shops at Kapalua Email Address [email protected]