Embed Size (px)
Citation preview

HAL Id: hal-00750411https://hal.archives-ouvertes.fr/hal-00750411
Submitted on 16 Mar 2016
HAL is a multi-disciplinary open accessarchive for the deposit and dissemination of sci-entific research documents, whether they are pub-lished or not. The documents may come fromteaching and research institutions in France orabroad, or from public or private research centers.
L’archive ouverte pluridisciplinaire HAL, estdestinée au dépôt et à la diffusion de documentsscientifiques de niveau recherche, publiés ou non,émanant des établissements d’enseignement et derecherche français ou étrangers, des laboratoirespublics ou privés.
First satellite identification of volcanic carbon monoxideS. Martínez-Alonso, M. N. Deeter, H. M. Worden, Cathy Clerbaux, D. Mao,
J. C. Gille
To cite this version:S. Martínez-Alonso, M. N. Deeter, H. M. Worden, Cathy Clerbaux, D. Mao, et al.. First satelliteidentification of volcanic carbon monoxide. Geophysical Research Letters, American GeophysicalUnion, 2012, 39 (21), pp.L21809. �10.1029/2012GL053275�. �hal-00750411�

First satellite identification of volcanic carbon monoxide
Sara Martínez-Alonso,1 Merritt N. Deeter,1 Helen M. Worden,1 Cathy Clerbaux,2
Debbie Mao,1 and John C. Gille1
Received 26 July 2012; revised 28 September 2012; accepted 2 October 2012; published 9 November 2012.
[1] Volcanic degassing produces abundant H2O andCO2, as well as SO2, HCl, H2S, S2, H2, HF, CO, andSiF4. Volcanic SO2, HCl, and H2S have been detected fromsatellites in the past; the remaining species are analyzedin situ or using airborne instruments, with all the conse-quent limitations in safety and sampling, and at elevatedcosts. We report identification of high CO concentrationsconsistent with a volcanic origin (the 2010 Eyjafjallajökulland 2011 Grímsvötn eruptions in Iceland) in data from theMeasurements of Pollution in the Troposphere instrument(MOPITT) onboard EOS/Terra. The high CO values coin-cide spatially and temporally with ash plumes emanatingfrom the eruptive centers, with elevated SO2 and aerosoloptical thickness, as well as with high CO values in datafrom the Infrared Atmospheric Sounding Interferometer(IASI), onboard MetOp-A. CO has a positive indirect radi-ative forcing; climate models currently do not account forvolcanic CO emissions. Given global volcanic CO2 emis-sions between 130 and 440 Tg/year and volcanic CO:CO2 ratios from the literature, we estimate that averageglobal volcanic CO emissions may be on the order of�5.5 Tg/year, equivalent to the CO emissions caused bycombined fossil fuel and biofuel combustion in Australia.Citation: Martínez-Alonso, S., M. N. Deeter, H. M. Worden,C. Clerbaux, D. Mao, and J. C. Gille (2012), First satellite iden-tification of volcanic carbon monoxide, Geophys. Res. Lett., 39,L21809, doi:10.1029/2012GL053275.
1. Introduction
[2] Volcanic gas emissions before, during, and after ter-restrial eruptions commonly include H2O, CO2, SO2, HCl,H2S, S2, H2, HF, CO, and SiF4 [Symonds et al., 1994]; thefirst two constitute the largest part of volcanic emissions.The relative composition and rate of release of these vola-tiles contain keys to understanding the eruptive style andpredicting volcanic events [Symonds et al., 1994; Thomasand Watson, 2010]. Some volcanic gases (H2O, CO2, CO)have a direct or indirect positive radiative forcing and thusimpact climate [Forster et al., 2007].[3] Volcanic gases were traditionally sampled in situ and,
subsequently, in airborne campaigns. The latter are costly;both are spatially and temporally constricted as well as
hazardous. Satellite detection of volcanic gases, whichwould be mostly free from these drawbacks, has beenachieved for only a few species. Detection of volcanic watervapor and CO2 is challenging due to high background levelsof these gases in the atmosphere [Symonds et al., 1994]. Incontrast, due to its relative high abundance in volcanicplumes and very low background levels, volcanic SO2 isroutinely analyzed from satellite data [Oppenheimer et al.,2011, and references therein]. Other volcanic species suchas HCl [Prata et al., 2007] and H2S [Clarisse et al., 2011]have also been successfully identified from satellites.[4] To test the feasibility of volcanic CO detection from
satellite we have focused our efforts on the analysis of sev-eral datasets acquired over the Iceland region (58�N, �28�Eto 68�N, �10�E) during the Eyjafjallajökull 2010 andGrímsvötn 2011 eruptions.
2. Observations
[5] In this study we use satellite observations acquired bythe MOPITT, MODIS, IASI, and OMI instruments.MOPITT is a nadir-looking, cross-track scanning infraredradiometer onboard EOS/Terra that uses gas correlationspectroscopy to detect CO in the troposphere. We usedversion 4, level 2 MOPITT CO retrievals obtained from itsthermal infrared (TIR) channels (7D, 5D, and 5A; D and Achannels are sensitive to target-gas and background infor-mation, respectively). These channels sense incoming radi-ation in the 4.56 to 4.67 mm spectral range, coinciding withthe R-branch of the CO rotational-vibrational fundamentalmode. MOPITT provides total CO column values as wellas some information on CO vertical distribution. GlobalMOPITT coverage is achieved in approximately 3 days; itsground instantaneous field of view (GIFOV) is 22 by 22 km2
at nadir. We used day-only, cloud-free, otherwise unfilteredMOPITT data. To maximize the number of MOPITTretrievals, cloud detection was based on MOPITT TIRradiances only; this did not distort the extent of the plumesor their retrieved CO values. MOPITT data were correctedfor a systematic geolocation error by shifting the reportedlongitude 0.35� to the east (web3.acd.ucar.edu/mopitt/GeolocationBiasReport.pdf).[6] To locate volcanic plumes and contrast them with
MOPITT CO values we inspected simultaneously acquiredEOS/Terra MODIS (Moderate Resolution Imaging Spec-troradiometer) true color images with an effective GIFOV of0.5 by 0.5 km2 at nadir. EOS/Terra MODIS aerosol opticalthickness (AOT) at 0.55 mm was also analyzed; level 2products with a 10 by 10 km2 GIFOV from version 051processed after 28 September 2010 (thus not affected by anerror involving incorrect clear sky radiances) were utilized.[7] IASI total CO column data (level 2, version v20100815)
for dates with anomalous MOPITT CO values and visible
1Atmospheric Chemistry Division, National Center for AtmosphericResearch, Boulder, Colorado, USA.
2LATMOS, IPSL, CNRS/INSU, UPMC Université Paris 06, UniversitéVersailles St.-Quentin, Paris, France.
Corresponding author: S. Martínez-Alonso, Atmospheric ChemistryDivision, National Center for Atmospheric Research, PO Box 3000,Boulder, CO 80307, USA. ([email protected])
©2012. American Geophysical Union. All Rights Reserved.0094-8276/12/2012GL053275
GEOPHYSICAL RESEARCH LETTERS, VOL. 39, L21809, doi:10.1029/2012GL053275, 2012
L21809 1 of 6

volcanic plumes were also analyzed. MOPITT and IASIapply different measurement techniques and retrieval algo-rithms to derive CO abundances, thereby offering twoindependent sets of evidence to investigate the detectabilityof volcanic CO from satellite. IASI is a nadir lookingFourier transform infrared spectrometer onboard MetOp-A.It covers the 3.6–15.5 mm spectral range sampling every0.25 cm�1, and thus can resolve individual absorption linesof CO and other atmospheric infrared active species. Globalcoverage is achieved twice daily with a 12 km diameterGIFOV at nadir. IASI retrievals are commonly filtered forclouds based on Eumetsat cloud information; additionally,we used coeval MetOp-A AVHRR/3 data to ensure thatonly cloud-free IASI pixels were utilized in this analysis.We also analyzed IASI brightness temperature (BT) spectrain the MOPITT TIR channel region to derive the depth ofdiagnostic CO lines, which is related to CO abundance, andto investigate the radiative effects of volcanic aerosols.[8] SO2 is a well established atmospheric volcanic marker.
We analyzed total SO2 column values (data set version 003,level 2) obtained from measurements by the Ozone Moni-toring Instrument (OMI) onboard EOS/Aura. OMI providesdaily global coverage with an GIFOV of 24 by 13 km2 atnadir. For each OMI scene lower troposphere (TRL) andmid troposphere (TRM) operational SO2 column densityvalues are provided; these values are obtained assuming acenter of mass altitude (CMA) for the volcanic plume at 2.5and 7.5 km, respectively. Column density values for CMAbetween these can be obtained by linear interpolation (http://so2.gsfc.nasa.gov/Documentation/OMSO2Readme_V111_0818.htm). We discarded pixels with radiative cloud frac-tion ≥0.2.[9] The altitude of the volcanic cloud during the 2010
eruption was constrained using measurements from theC-band weather radar located in Keflavík InternationalAirport [Arason et al., 2011]. A report describing the 22 May2011 eruption contains plume height estimates based onsimilar measurements [Jakobsdóttir et al., 2012].
3. Results
[10] We have identified clusters of anomalously highMOPITT CO values on 19 April 2010 and 7 May 2010(Eyjafjallajökull eruption), as well as on 22 May 2011(Grímsvötn eruption). We consider anomalous values thehighest retrievals (on a specific date, in the study area) whichcoincide spatially with a volcanic plume in simultaneouslyacquired MODIS visible data. Similarly, we consider back-ground values the retrievals outside that plume. Anomalousand background values represent two separate populations,according to their value and spatial distribution.[11] The anomalous MOPITT CO values on the three
dates are spatially continuous and have a plume-like distri-bution (Figure 1, left). The reported average height for thetop of the volcanic plume during satellite overpass was2.5 km (19 April) and 5.3 km (7 May) [Arason et al., 2011].On 22 May the lower boundary of the volcanic plume to thesouth of the vent was at about 5 km [Jakobsdóttir et al.,2012]. Compelling evidence of further anomalous valuesduring the remaining dates of volcanic activity in 2010 and2011 was not found due to either meteorological cloudsprecluding the CO retrievals or to lack of sufficient MOPITTcoverage. We calculate the difference between MOPITT
total CO column in the plume versus that in the back-ground to be between 4.48 and 4.05e + 017 mol/cm2 in theEyjafjallajökull eruption and 1.89e + 017 mol/cm2 in theGrímsvötn eruption (Table S1 in the auxiliary material).1
[12] IASI CO total column data on 7 May 2010 show aplume-like set of anomalously high values which coincidespatially with these shown by MOPITT. Their mean exceedsthe average CO background value by 6.38e + 017 mol/cm2
(Figure 2 and Table S1). IASI data on 19 April 2010 and22 May 2011 over the plumes were deemed cloudyaccording to the Eumetsat cloud information (i.e., cloudcoverage in the pixel ≥12%), and thus sufficient spatialcoverage for these two dates is not available.[13] On the three dates analyzed the anomalous MOPITT
CO values show good overlap with volcanic plumes apparentin the MODIS visible images and with high AOT values(Figure 1, middle). MODIS measured a wide range of AOTvalues over the MOPITT CO plumes: 0.2 to 2.96 (19 April2010), 0.09 to 1.54 (7 May 2010), and 0.001 to 2.7 (22 May2011).[14] OMI shows SO2 plumes emanating from the volcanic
centers on all three dates (Figure 1, right). We have derivedSO2 column values by linear interpolation between opera-tional OMI TRL and TRM retrievals, for a CMA equal to thereported height of the top (or bottom, depending on avail-ability) of the volcanic cloud during satellite overpass. Byusing the height of the cloud’s top rather than the center ofmass altitude the SO2 column values are slightly under-estimated (�8.5%, for a 2 km thick cloud). Using theclouds’ bottom results in a similar overestimation. We cal-culate an average SO2 total column value of 5.76e + 017(plume directly south of the vent on 19 April 2010),1.12e + 018 (7 May 2010), and 3.75e + 018 mol/cm2 (22May 2011), or 2.14, 4.17, and 13.96 DU (Dobson Units),respectively. These measurements are well above OMI’sdetection limit [OMI Team, 2012].
4. Discussion
4.1. Artifact or Volcanic CO?
[15] In order to determine if the anomalous MOPITT COvalues in the volcanic plumes is an artifact produced byother volcanic gases and/or volcanic aerosols we haveinvestigated other sources of absorption in the MOPITT TIRbandpass. Due to the nature of gas correlation radiometry,non-target gases have very little effect on the measuredradiances. Additionally, most relevant volcanic gases haveno strong absorption lines in the MOPITT TIR bandpass(e.g., CO2, SO2, HCl, H2S, S2, H2, HF, SiF4, SO, N2, CH4,Ar, O2, and NH3). The opposite is true for water vapor andcarbonyl sulfide (a minor volcanic gas); however, the latteris nearly two orders of magnitude less abundant than CO inaverage (from data in Symonds et al. [1994]) and thus wouldproduce a much weaker signal.[16] To model the sensitivity of MOPITT CO retrievals to
elevated water vapor we used MOPABS (the MOPITTabsorption model [Edwards et al., 1999]). We ran simula-tions with a standard atmosphere input and then modifiedthat input to include: 1) a CO profile increased by 10% at allpressure levels, 2) the average background NCEP/GDAS
1Auxiliary materials are available in the HTML. doi:10.1029/2012GL053275.
MARTÍNEZ-ALONSO ET AL.: SATELLITE IDENTIFICATIONS OF VOLCANIC CO L21809L21809
2 of 6
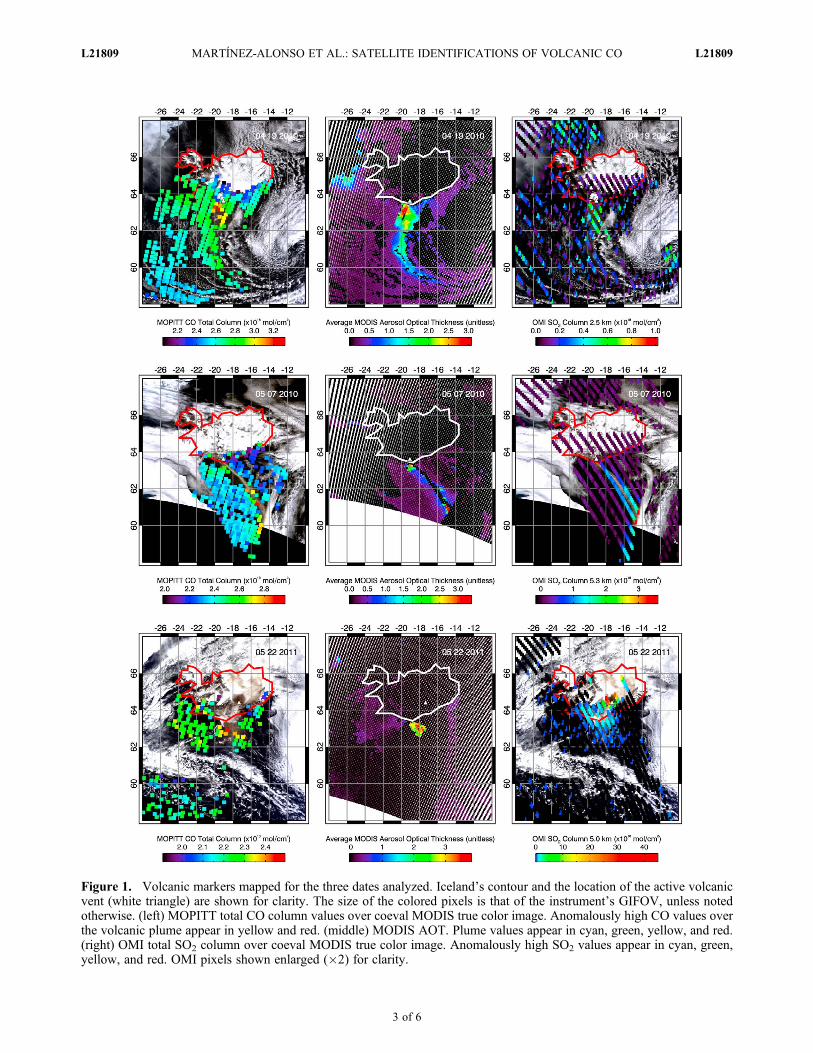
Figure 1. Volcanic markers mapped for the three dates analyzed. Iceland’s contour and the location of the active volcanicvent (white triangle) are shown for clarity. The size of the colored pixels is that of the instrument’s GIFOV, unless notedotherwise. (left) MOPITT total CO column values over coeval MODIS true color image. Anomalously high CO values overthe volcanic plume appear in yellow and red. (middle) MODIS AOT. Plume values appear in cyan, green, yellow, and red.(right) OMI total SO2 column over coeval MODIS true color image. Anomalously high SO2 values appear in cyan, green,yellow, and red. OMI pixels shown enlarged (�2) for clarity.
MARTÍNEZ-ALONSO ET AL.: SATELLITE IDENTIFICATIONS OF VOLCANIC CO L21809L21809
3 of 6

(National Centers for Environmental Prediction/Global DataAssimilation System) water vapor profile for 7 May 2010,and 3) the average NCEP water vapor profile for the plumelocus on that same date. (NCEP/GDAS water vapor profiles,which are utilized in operational MOPITT CO retrievals, arederived from multi-sensor measurements; climatological
data are utilized to complement lacking or insufficientmeasurements. We have corroborated that water vapor pro-files in the volcanic plume and its surroundings do notinclude climatological data.) Modeling results (Table 1)show that the change in MOPITT TIR D signal due toincreased water vapor in the plume is 1 to 2 orders of
Table 1. MOPABS Sensitivity Test Results: Effect on MOPITT TIR Radiances of a 10% CO Increase (the MOPITT Detection Limit)Versus That Produced by Differences in Water Vapor Between the Volcanic Plume and Its Surroundingsa
MOPABS Radiance (W m�2 sr�1)
MOPITT TIR Channel 7D MOPITT TIR Channel 5D MOPITT TIR Channel 5A
Standard atmosphere 2.11064E-4 1.31012E-2 4.55677E-210% CO enriched atmosphere 2.02425E-4 1.30718E-2 4.55336E-2Water vapor profile: background 2.11615E-4 1.31502E-2 4.57532E-2Water vapor profile: plume 2.11579E-4 1.31450E-2 4.57294E-2D/A change: standard vs CO enriched 4.09% 0.22% -D/A change: background vs plume 0.02% 0.04% -
aWater vapor profiles are NCEP averages for 7 May 2010.
Figure 2. (a) IASI total CO column values on 7 May 2010 over coeval AVHRR/3 image. Anomalously high CO values inthe volcanic plume appear in orange and red. IASI scanlines run west-northwest to east-southeast. (b) IASI BT spectraacquired in one scanline inside (red) and away from (blue) the volcanic plume. The spectral range shown is that of theMOPITT TIR channels; selected CO absorption lines (at 2165.5, 2169.2, and 2172.7 cm�1) are indicated with coloredsymbols. Slight BT differences between spectra continuum (less than 1 K in the example shown) are not systematic andcould be due to meteorological effects, among others. (c) Depth of CO lines in IASI BT spectra acquired in one scanlineversus IASI CO retrievals (symbols as in Figure 2b). (b) Depth of CO lines in IASI BT spectra acquired in one scanlineversus distance to the volcanic plume (symbols as in Figures 2b).
MARTÍNEZ-ALONSO ET AL.: SATELLITE IDENTIFICATIONS OF VOLCANIC CO L21809L21809
4 of 6

magnitude below that due to a 10% change in CO, which isthe MOPITT detection limit [Pan et al., 1995].[17] Volcanic aerosols are strong absorbers at longer
wavelengths (i.e., near 10 mm) [Clarisse et al., 2010]; theirbehavior in the MOPITT TIR bandpass is less well under-stood. To investigate this point we analyzed IASI BT spectraon 7 May 2010, focusing on sets of cloud-free, adjacentspectra acquired in the same scanline inside of and awayfrom the volcanic plume. Our analysis shows that in thespectral region of the MOPITT TIR bandpass, aerosol-freeand aerosol-rich spectra (from background and plume,respectively) are indistinguishable in terms of the shape oftheir continuum and individual absorption lines (Figure 2b).Three of the diagnostic CO absorption lines in this spectralrange (at 2165.5, 2169.2, and 2172.7 cm-1) were selectedfor further analysis, based on their intensity and lack ofoverlap with H2O lines. Their depth was quantified andcontrasted to IASI CO values and distance to the volcanicplume. As expected, line depth increases with CO abun-dance (Figure 2c). For distances less than 40 km, line depthand thus CO abundance are inversely proportional to dis-tance between the spectrum locus and the plume(Figure 2d). For distances greater than this threshold linedepth and distance show no correlation. This behaviour ofthe CO spectral features with respect to proximity of theplume is consistent with a volcanic origin for the anoma-lously high CO values in the plume.
4.2. Satellite Detection of Volcanic CO Versus AircraftObservations and Other Volcanic Markers
[18] The maximum MOPITT and IASI CO values in theplume differ in magnitude by less than 14% (2.97e + 018and 3.37e + 018 mol/cm2, respectively, on 7 May 2010).MOPITT mixing ratio profile values are also close in mag-nitude to airborne CO measurements during the 2010 erup-tion (CARIBIC project [Brenninkmeijer et al., 2007] andDLR-Falcon campaign [Schumann et al., 2011]). CARIBICflights on 20 April, 16 May, and 19 May 2010 intersectedthe volcanic plume at an approximate altitude of 4 km(600 hPa) over northern Germany, Northern Ireland and theNorwegian Sea, respectively. The average CO backgroundvalues were near 120 ppbv, while values in the plume foreach of the three dates reached 200, 205, and 179 ppbvrespectively [Rauthe-Schöch et al., 2012]. The flights inthe DLR-Falcon campaign sampled a fresh plume betweenIceland and northern Scotland on 2 May at 3.5 km altitude(661 hPa), with background and plume CO values of128.5 and 200.9 ppbv, respectively. Despite the spatial andtemporal differences, we find that in most cases airborne COmeasurements and MOPITT mixing ratio values derived forsimilar pressure levels (Table S1) agree within 10%.[19] As shown by OMI measurements, volcanic SO2
plumes are present on all three dates analyzed and coincidespatially with the MOPITT and IASI CO plumes, as well aswith high MODIS AOT values. On 19 April 2010 a secondcluster of anomalously high SO2 values was detected awayfrom the vent, near 59�N, �11�E; this would be consistentwith an older volcanic cloud transported SE by the prevalentwinds. We find that average SO2 total column in the plumeis roughly of the same magnitude (19 April 2010) or oneorder of magnitude above (7 May 2010 and 22 May 2011)the average MOPITT CO total column values. This is con-sistent with CO:SO2 ratios obtained from field and airborne
measurements in volcanic environments where tectonicplates diverge, such as Iceland [Symonds et al., 1994;Oppenheimer et al., 2011].
5. Summary and Conclusions
[20] We report satellite identification of volcanic CO forthe first time, achieved using data from two independentinstruments: MOPITT and IASI. Other volcanic markers(ash plume in MODIS visible images as well as elevatedMODIS AOT and OMI SO2) are spatially and temporallyco-located with the anomalous CO values and thus confirmtheir volcanic origin.[21] We have ruled out a spurious origin for the anoma-
lous CO values due to water vapor or aerosols in the vol-canic plume. By modeling the effect of water vapor inMOPITT radiances we have shown that differences betweenwater vapor observed in the plume versus the backgroundcould not account for the change in measured MOPITTradiance. Our analysis of IASI BT spectra indicates that theMOPITT TIR bandpass is not affected by aerosols in thevolcanic plume. We have also shown that the depth ofdiagnostic CO lines increases as the distance to the volcanicplume decreases. Since the depth of these CO absorptionlines should increase with increasing CO, we interpret this asdefinitive evidence that the high CO values retrieved in theplume are volcanic in origin.[22] CO emissions result in an increase of CO2, CH4, and
tropospheric O3, and thus have a positive indirect radiativeforcing of approximately 0.2 W/m2 (i.e., 12.5% of the totalnet anthropogenic forcing) [Forster et al., 2007]. Global COemissions measured in the 2002–2009 period range widely,between 1318 and 1504 Tg/year [Fortems-Cheiney et al.,2011]; it is assumed that they are dominated by incompletefossil fuel combustion and biomass burning. Fluctuations ingas emissions from natural sources (e.g., volcanic degassing)need to be quantified so as to separate them from those ofanthropogenic origin.[23] The magnitude of global volcanic CO emissions is
unknown. Next, we estimate their approximate value to putthem into perspective respect to other CO sources. Globalvolcanic CO2 emissions have been estimated to be between130 and 440 Tg/year (from data in Gerlach [2011]). Vol-canic CO and CO2 emissions depend on tectonic environ-ment and may vary from eruption to eruption. However, andunlike CO and SO2, we find that CO and CO2 are correlatedto some degree, regardless of tectonic setting. Based onmean global volcanic CO2 and linear regression parametersderived from volcanic CO and CO2 measurements [Halmeret al., 2002; Wardell et al., 2004; Oppenheimer et al.,2011] we estimate that global average volcanic CO emis-sions may be on the order of �5.5 Tg/year; errors fromthe linear regression are negligible compared to the CO2
estimates. This is equivalent to the annual CO emissionsproduced by fuels (fossil and biofuel) in Australia [Kopaczet al., 2010]. Though modest compared to anthropogenicsources, volcanic CO emissions are non-negligible.[24] Satellite measurements of volcanic CO may lead to a
better understanding of variations in the global CO budget,and thus improve climate models. They will also refine ourunderstanding of volcanic processes by answering basicquestions such as how much CO is emitted in an eruption
MARTÍNEZ-ALONSO ET AL.: SATELLITE IDENTIFICATIONS OF VOLCANIC CO L21809L21809
5 of 6

and what is the relative gas composition in different vol-canic events.
[25] Acknowledgments. Thanks to David Edwards and Gene Francisfor discussions on radiative effects and modeling help. Lieven Clarisse pro-vided IASI BT spectra. Armin Rauthe-Schöch provided CARIBIC CO data.OMI retrievals were obtained with the Giovanni online data system, devel-oped and maintained by the NASA GES DISC. IASI CO retrievals wereperformed at Université Libre de Bruxelles and can be downloaded fromthe French Ether atmospheric database (http://ether.ipsl.jussieu.fr). Weappreciate the helpful comments from Anne Boynnard and Laura Pan. Thispaper benefited from reviews fromMatthewWatson and Florian Schwandner.We acknowledge the mission scientists and Principal Investigators who pro-vided the data used in this research effort. The NCARMOPITT project is sup-ported by NASA’s Earth Observing System Program. NCAR is sponsored bythe National Science Foundation.[26] The editor thanks Iain Matthew Watson and Florian Schwandner
for assistance evaluating this manuscript.
ReferencesArason, P., G. N. Petersen, and H. Bjornsson (2011), Observations of thealtitude of the volcanic plume during the eruption of Eyjafjallajökull,April-May 2010, Earth. Syst. Sci. Data, 3, 9–17, doi:10.5194/essd-3-9-2011.
Brenninkmeijer, C. A. M., et al. (2007), Civil aircraft for the regular inves-tigation of the atmosphere based on an instrumented container: The newCARIBIC system, Atmos. Chem. Phys., 7, 4953–4976, doi:10.5194/acp-7-4953-2007.
Clarisse, L., D. Hurtmans, A. J. Prata, F. Karagulian, C. Clerbaux,M. De Mazière, and P. F. Coheur (2010), Retrieving radius, concentra-tion, optical depth, and mass of different types of aerosols from high-resolution infrared nadir spectra, Appl. Opt., 49, 3713–3722,doi:10.1364/AO.49.003713.
Clarisse, L., P. F. Coheur, S. Chefdeville, J. L. Lacour, D. Hurtmans, andC. Clerbaux (2011), Infrared satellite observations of hydrogen sulfide inthe volcanic plume of the August 2008 Kasatochi eruption, Geophys.Res. Lett., 38, L10804, doi:10.1029/2011GL047402.
Edwards, D. P., C. H. Halvorson, and J. C. Gille (1999), Radiative transfermodeling for the EOS Terra satellite Measurement of Pollution in theTroposphere (MOPITT) instrument, J. Geophys. Res., 104(D14),16,755–16,775, doi:10.1029/1999JD900167.
Forster, P., et al. (2007), Changes in atmospheric constituents and radia-tive forcing, in Climate Change 2007: The Physical Sciences Basis.Contribution of Working Group I to the Fourth Assessment Report ofthe Intergovernmental Panel on Climate Change, edited by S. Solomonet al., pp. 129–234, Cambridge Univ. Press, Cambridge, U. K.
Fortems-Cheiney, A., F. Chevallier, I. Pison, P. Bousquet, S. Szopa,M. N. Deeter, and C. Clerbaux (2011), Ten years of CO emissions as
seen from Measurements of Pollution in the Troposphere (MOPITT),J. Geophys. Res., 116, D05304, doi:10.1029/2010JD014416.
Gerlach, T. (2011), Volcanic versus anthropogenic carbon dioxide, EosTrans. AGU, 92(24), 201, doi:10.1029/2011EO240001.
Halmer, M. M., H. U. Schmincke, and H. F. Graf (2002), The annual vol-canic gas input into the atmosphere, in particular into the stratosphere:A global data set for the past 100 years, J. Volcanol. Geotherm. Res.,115, 511–528, doi:10.1016/S0377-0273(01)00318-3.
Jakobsdóttir, S. S., G. Sigurðsson, Ó. Þ. Árnason, M. T. Guðmundsson,I. Jónsdóttir, Þ. Högnadóttir, B. Oddsson, and B. S. Þorbjarnardóttir(2012), Grímsvötn Volcano Status Report: 17:00 GMT, 22 May2011, report, Icelandic Meteorol. Off. and Inst. of Earth Sci., Univ.of Iceland, Reykyavik.
Kopacz, M., et al. (2010), Global estimates of CO sources with highresolution by adjoining inversion of multiple satellite datasets (MOPITT,AIRS, SCIAMACHY, TES), Atmos. Chem. Phys., 10, 855–876,doi:10.5194/acp-10-855-2010.
OMI Team (2012), Ozone Monitoring Instrument (OMI) data user’s guide,Rep. OMI-DUG-5.0, NASA Goddard Space Flight Cent., Greenbelt, Md.
Oppenheimer, C., B. Scaillet, and R. S. Martin (2011), Sulfur degassing fromvolcanoes: Source conditions, surveillance, plume chemistry and Earthsystem impacts, Rev. Mineral. Geochem., 73, 363–421, doi:10.2138/rmg.2011.73.13.
Pan, L., D. P. Edwards, J. C. Gille, M. W. Smith, and J. R. Drummond(1995), Satellite remote sensing of tropospheric CO and CH4: Forwardmodel studies of the MOPITT instrument, Appl. Opt., 34, 6976–6988,doi:10.1364/AO.34.006976.
Prata, A. J., S. A. Carn, A. Stohl, and J. Kerkmann (2007), Long rangetransport and fate of a stratospheric volcanic cloud from Soufrière Hillsvolcano, Montserrat, Atmos. Chem. Phys., 7, 5093–5103, doi:10.5194/acp-7-5093-2007.
Rauthe-Schöch, A., et al. (2012), CARIBIC aircraft measurements ofEyjafjallajökull volcanic plumes in April/May 2010, Atmos. Chem.Phys., 12, 879–902, doi:10.5194/acp-12-879-2012.
Schumann, U., et al. (2011), Airborne observations of the Eyjafjalla volcanoash cloud over Europe during air space closure in April and May 2010,Atmos. Chem. Phys., 11, 2245–2279, doi:10.5194/acp-11-2245-2011.
Symonds, R. B., W. I. Rose, G. J. S. Bluth, and T. M. Gerlach (1994),Volcanic-gas studies; methods, results, and applications, Rev. Mineral.Geochem., 30, 1–66.
Thomas, H. E., and I. M. Watson (2010), Observations of volcanic emis-sions from space: current and future perspectives, Nat. Hazards, 54,323–354, doi:10.1007/s11069-009-9471-3.
Wardell, L. J., P. R. Kyle, and C. Chaffin (2004), Carbon dioxide andcarbon monoxide emission rates from an alkaline intra-plate volcano:Mt. Erebus, Antarctica, J. Volcanol. Geotherm. Res., 131, 109–121,doi:10.1016/S0377-0273(03)00320-2.
MARTÍNEZ-ALONSO ET AL.: SATELLITE IDENTIFICATIONS OF VOLCANIC CO L21809L21809
6 of 6