Embed Size (px)
Citation preview

Asian Economic and Financial Review, 2015, 5(4): 641-652
*Corresponding Author
641
FIRM’S LIFE CYCLE AND OHLSON VALUATION MODEL: EVIDENCE
FROM IRAN
Hossein Etemadi1 --- Forough Rahimi Mougouie
2*
1Department of Accounting, Tarbiat Modares University, Iran
2Tarbiat Modares University, Iran
ABSTRACT
Ohlson prediction and valuation models Ohlson (1995) are based on firm book value, accounting
profit and the assumption of "randomized, balanced and stabilized abnormal earnings". On the
other hand, the significance of risk and performance indicators during the firm’s life cycle is
different according to the life cycle theory. This literature represents the linkage of these indicators
with the firm’s value in different life cycle stages. In this study which is aimed to review the ability
to improve the Ohlson valuation model considering the firm’s life cycle variable, a sample of 110
firms listed in Tehran Stock Exchange between 2003 and 2013 was selected. Using Anthony and
Ramesh (1992) variables and Park and Chen (2006) methodology, the life cycle was divided into
three stages and then, considering the firm’s place in the life cycle, prediction models of abnormal
earnings and Ohlson firm’s valuation Ohlson (1995) were adjusted and afterward the adjusted
models were compared with the initial model in two short-term and long-term estimation periods of
5 and 10 years, respectively. The results show that during both estimation periods, the adjusted
model has a better performance in predicting abnormal earnings and firm’s valuation compared to
the initial model. During the 10-year estimation period, the two models’ estimated values were
significantly less than actual values. The probable reason for this difference is the sharp rise in the
value of stocks during the final years of the period especially between 2012 and 2013.
© 2015 AESS Publications. All Rights Reserved.
Keywords: Firm valuation, Firm life cycle, Abnormal earning, Ohlson valuation model, Growth, Decline, Maturity.
JEL Classification: M41, G11, G12.
Contribution/ Originality
The paper's primary contribution is providing a superior model for firm valuation by
considering firm's life cycle. While previous studies have shown the relationship between the
Asian Economic and Financial Review
journal homepage: http://www.aessweb.com/journals/5002

Asian Economic and Financial Review, 2015, 5(4): 641-652
642
accounting variables with firm value at different stages of the life cycle, none of them addressed
adjustment the valuation model using this variable.
1. INTRODUCTION
Capital market participants are always looking for value stocks and a valid valuation method
which will lead them into stock inherent value. Since then, several studies have been conducted to
predict stock prices, each of which has deemed effective one or more variables than other variables
on the stock price changes. So they have tried to control other variables in order to study the effect
of the variables considered on the price changes. In general, studies conducted show an increase in
the role of book value in stock valuation and the relationship of this variable with firms’ market
value Penman and Sougiannis (1998). As in recent years, Ohlson (1995) and Feltham and Ohlson
(1995) models have become landmark works in accounting data. Ohlson (1995) suggests that the
firm’s value is affected by three factors of the firm book value residual earnings and other
information so that we can fix a value close to the inherent value in order to determine fair value in
the capital market. (Frankel and Lee, 1998; Dechow et al., 1999; Callen and Morel, 2001) and
Khodadadi and Emami (2010) are among the researchers who have examined the role of
accounting data in determining the firm’s value using the Ohlson model Ohlson (1995). The results
of some of these investigations (such as Myers (1999)), Dechow et al. (1998), and Frankel and Lee
(1998), indicate that the estimated values of this model are significantly less than the actual
values.(Dechow et al., 1999; Myers, 1999; Francis et al., 2000; Lo and Lys, 2000; Callen and
Morel, 2001; Ota, 2002) and Giner and Iniguez (2006b) are among the researchers to have tried to
correct the Ohlson model Ohlson (1995) to raise its accuracy in predicting abnormal earnings and
firm value.
The life cycle theory of a business entity assumes that the latter presents different
characteristics in different stages of the life cycle. Therefore, selected strategies and performance
measures can be different in different stages Kallunki and Silvola (2008). The value of business
entities is influenced by internal factors, such as the choice of strategy, financial resources and
ability to manage, and external factors, such as competitive environment and macroeconomic
factors. Firm’s life cycles are different stages created by the change of these factors; most of these
changes are due to strategic activities selected by the firm Dickinson (2011). In recent years,
studies have been conducted on the difference of risk and performance indicators during the firm’s
life cycle (including (Anthony and Ramesh, 1992; Black, 1998; Kallunki and Silvola, 2008;
Dickinson, 2011). The main message of these studies is that the value assigned to a criterion by
capital market participants depends on the relative importance of this criterion in a certain stage of
life cycle. This study tries to test and examine the capacity of the firm’s life cycle in order to
present a better valuation pattern.
While previous literatures have directly studied the effect of the life cycle on value relevant to
accounting earnings, this research is important because it investigates how the life cycle affects the
relationship between accounting variables and the firm value.
Asian Economic and Financial Review, 2015, 5(4): 641-652
643
The second section of this study deals with literature review and theoretical framework. In the
third section, the research design is indicated and the fourth section states the research findings and,
finally, the conclusions are discussed.
2. STUDY OF LITERATURE REVIEW AND THEORETICAL FRAMEWORK
Ohlson (1995) showed that the firm’s inherent value is equal to the book value of shareholders
plus the current value of subsequent abnormal earnings. The latter is equal to accounting earning
and expected return on equity (discount rate multiplied by the book value). The inherent value is
also equal to the future dividend value, regardless of interest payment policies and/or quality of
accounting items. The advantage of Ohlson perspective which has stimulated a growing body of
researches is that it recognizes the potential effect of retained earnings on future earnings. For
instance, if a firm retains a great part of its earnings, naturally one can expect that due to the
advantage of excess earnings obtained by retained earnings, it will obtain higher future earnings.
Other advantages of the Ohlson perspective are the shift from excessive concentration on earning to
profitability. In his view, a difference between the book value and the market value is possible only
when we expect that the firm systematically earns from its assets, which is different from expected
rate of return of the market. Dechow et al. (1999) assert that the real achievement of Ohlson (1995)
and Feltham and Ohlson (1995) is that the linear models presented by them create a link between
current data and the firm’s inherent value. The main contribution of this model is to provide as old
theoretical frame work for the valuation of stock based on the fundamental accounting variables
(earnings and book value). In addition, these models allow any other information to intervene in
predicting the firm’s value. Howe ever the results of previous studies on these models show that
values calculated by these models are less than the market value.
The theory of the business life cycle uses a generalization of the developed concept of product
life cycle in marketing and microeconomics. Products (goods or services) move in four stages: start
up, growth, mature and stagnant. Similarly, businesses can also be described in stages of the life
cycle. Most researchers claim that businesses have different characteristics at different stages of the
life cycle which affect the relevant value or profitability of accounting performance measures. The
life cycle approach provides an analysis of the framework of economic content.
Life cycle models of the firm have entered financial strategy literature since 1960s. The main
message of the studies on the relevance of performance measures is that the value assigned to a
performance measure by capital market participants depends on the relative importance of this
measure in a certain stage of the life cycle.
Anthony and Ramesh (1992) investigated the fact that how the life cycle stages, as strategic
characteristics, may affect the relevance of accounting data. They stated that sales growth and
capital expenditures in the early stages of the life cycle are more important and the market gives
them more value.
Gaver and Gaver (1993) underlined that variation in investment opportunities will lead to
different financing policies, dividend and competition. They found that growing firms use smaller

Asian Economic and Financial Review, 2015, 5(4): 641-652
644
leverage and pay few dividends. They also use more share-based compensation bonus than the
firms which are in other life cycle stages.
Black (1998) suggests the uniform reduction of the relevance of earnings and cash flows in the
stages of life cycle. Investigating the relationship of earnings and cash flows with the firm’s value
in different stages of their life cycle, he showed that, in start up and decline stages, cash flows were
more relevant than the earnings; while the reverse is true in the mature stage.
By examining the relationship of sale growth and profitability with earnings and cash flows,
Martinez (2003) realized the non-linear effect of the life cycle on the relevance of earnings and
cash flows.
Jenkins et al. (2004) concluded that when earnings are decomposed into their components, the
effect of life cycle on the relevance of earnings will be clearer and stronger.
Aharony et al. (2006) examined the explanatory power of measures based on cash flows and
those based on accruals in defining the firm’s value at different stages of the life cycle. In the
growth stage, the explanatory power of measures based on cash flows was higher but in the mature
stage, the explanatory power of measures based on accruals was higher.
Xu (2007), using regression analysis, investigated the relevance of risk factors to the firm’s life
cycle. His research led to two important findings. First, risk factors in different stages of life cycle
are priced differently. Also, incremental explanatory power of risk factors varies with the change of
life cycle stages.
While the Ohlson (1995) prediction and valuation model relies on the firm’s book value,
accounting earnings and the assumption that "abnormal earnings are randomized, balanced and
stabilized", however, according to the theory of life cycle, risk and performance indicators during
the firm’s life cycle are of various importance (for example, see (Anthony and Ramesh, 1992;
Martinez, 2003; Xu, 2007)), and their relationship with the firm’s value varies during different
stages of the life cycle. The question which comes to mind is "whether considering the variable of
firm’s life cycle can improve Ohlson valuation model." Thus the main research hypotheses are
formulated as follows:
1. Considering the firm’s life cycle enhances the ability to predict abnormal earnings of the
Ohlson model Ohlson (1995);
2. Considering the firm’s life cycle enhances the ability to evaluate the Ohlson model Ohlson
(1995).
3. RESEARCH METHODOLOGY
To test hypotheses in this study, we record the firm’s place in the life cycle stages as a dummy
variable in the model. Since, according to previous literature, risk and performance indicators are of
various importance during the firm’s life cycle and that their relationship with the firm’s value
during different stages of life cycle is variable (for example, see (Anthony and Ramesh, 1992;
Martinez, 2003; Xu, 2007)), the characteristics of the firm in maturity, are different with growth

Asian Economic and Financial Review, 2015, 5(4): 641-652
645
and decline stages, so tjD , was defined as a dummy variable with zero and one values; in case the
year-firm belongs to growth and decline stages, its value will be zero, and if it belongs to the
maturity stage, a value of one will be assigned to. Similar to Black (1998), Jenkins et al. (2004) and
Kallunki and Silvola (2008) used Anthony and Ramesh (1992) variables and Park and Chen (2006)
methodology to classify firms’ life cycle in different stages of life cycle in this study. To
distinguish firms in life cycle stages, they used the Anthony and Ramesh (1992) variables:
SGit = [(SALEit / SALEit-1) -1] ×100
DPRit = (DPSit / EPSit) ×100
(CEXPit/ VALUEit) × 100 =CEit
AGEt= i- ESt
SG= percent sales growth
DPR= Annual dividend payout divided by net income
CE = Capital expenditure divided by total value of the firm
AGE= Age of the firm are computed as the difference between the current year and the earliest
year of incorporation for each firm-year. The four life cycle stage descriptors are calculated for
each firm-year and the four classification variable observations for each firm-year are assigned to
each industry quintile of the same variable and they are given a score as showed in figure 1.
Table-1. Life-Cycle Descriptors
Industry Quintile Life-Cycle Descriptors
AGE SG CE DP
80%-100% 1 5 5 3 60%-80% 2 4 4 3 40%-60% 3 3 3 3 20%-40% 4 2 2 4 (2)
0%-20% 5 1 1 5 (1)
Note: If the sum of scores for AGE, SG, and CE is low (i.e., smaller than 7.5), and DP is at the lowest (second lowest) quintile, then one (two)
is assigned as the DP score for decline stage firm-years.
The composite score ranges from four to 20. Each firm-year is classified into three life-cycle
stages using the following procedure:
1. "GROWTH": If it's composite score is between 16 and 20.
2. "MATURE": If it's composite score is between 9 and 15.
3. "DECLINE": If it's composite score is between 4 and 8.
To test the first hypothesis of the study, abnormal earnings were adjusted once by the Ohlson
model and once by other models taking into consideration the prediction life cycle; then, both the
initial and adjusted models were compared with each other by using the adjusted r squared, Akaike
info criterion and Schwarz criterion and sum of squared residuals in order to determine the best
model. The abnormal earnings valuated in the traditional model were estimated as follows:
Where: a
tjX , : Abnormal earnings of year t
11 : Persistence of abnormal earnings (0 < 11 <1)
Ohlson assumes that sources of abnormal earnings are monopoly rents. Although the latter
1,111 tj
a
t
a
t XX
Asian Economic and Financial Review, 2015, 5(4): 641-652
646
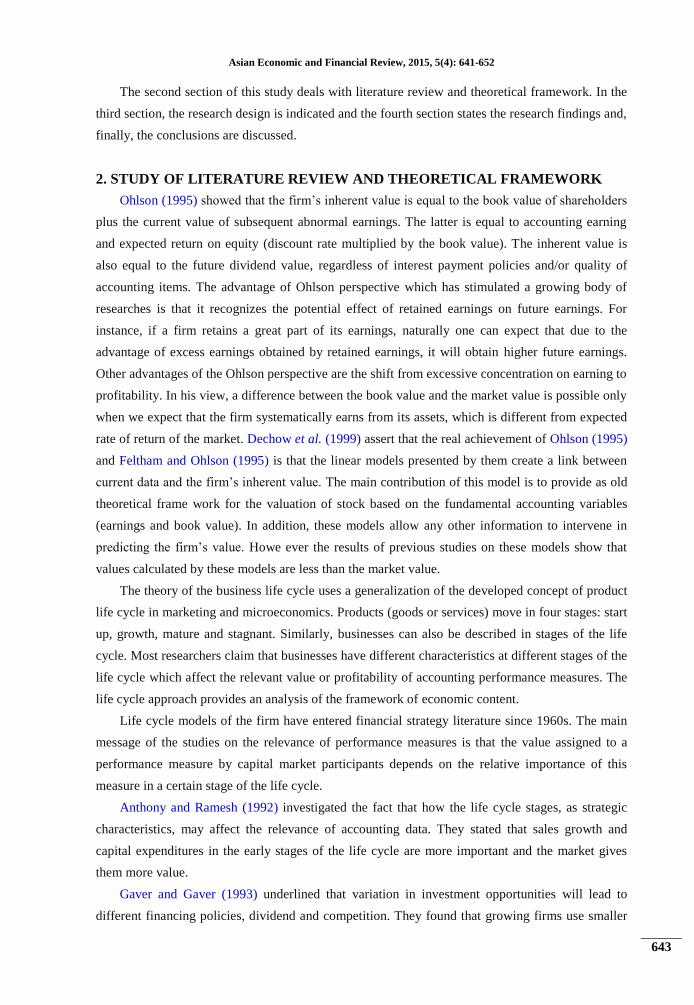
may be continued for a period of time, market competition in the long run will make them
equivalent to the cost of capital. Thus, it is expected that the 11wcoefficient is between zero and
one. Considering the firm’s life cycle stages and being inspired by the adjusted model of Giner and
Iniguez (2006b), the adjustment of the Ohlson model is as follows:
1,,,11,111,
tj
a
tjtj
a
tj
a
tj XDXX
a
tjX , : Abnormal earnings of year t
11 : Persistence of abnormal earnings of firms on growth and stagnant stages
11 +12 : Persistence of abnormal earnings of firms on mature
tjD , : Dummy variable for firm j at time t ( tjD , =1 if firm is in mature stage and 0 otherwise)
To test the second hypothesis, valuating of the firm is done once by the Ohlson valuation
model (Ohlson, 1995) and the second time by the adjusted model taking into account the life cycle.
The valuation in the traditional model was estimated as follows:
Where:
tbv : Book Value of firm of year t
a
tjX , : Abnormal earnings of year t
11
11
1
r
For valuation of firm value (V+) by adjusted model we use same traditional model. The
difference is that in the adjusted model, was calculated by the following method:
)(1
)(
,1111
,1111
Dr
D
tj
tj
In both traditional and adjusted models, equality of the average of estimated values was
verified by each of the above models (V, V+) with market actual prices (P) using the T-test; the
above equality was also investigated by Wilcoxon signed-rank test, and then the mean absolute
errors of prediction in both the initial and adjusted models was compared to establish the best
valuation model. There were great fluctuations over several years in Tehran Stock Exchange
index. Two short and long-term periods of 5 and10years, respectively, can be solution to control
the effect of these fluctuations. In addition, due to market volatility over the last few years of the
estimation period and especially 2012 and 2013, a more rational approach will be using data from
the early years of the short-term period. Therefore in this study, the test of hypotheses was done by
using pooled data of the adjusted population during the two estimation periods of 5 years (2003-
2008) and 10 years (2003-2013). The statistical population of this research was selected among the
firms listed in Tehran Stock Exchange. The population was adjusted with regard to the following
conditions and all firms who had these conditions were studied.
a
tjtt xbvV ,

Asian Economic and Financial Review, 2015, 5(4): 641-652
647
Table-2. Adjusting population procedure
Description Qty
Active Firms whose accounting data during the time interval of research is accessible 207
Deducted: firms whose monthly price data in this time interval have not been accessible 23
Deducted: firms whose fiscal year not ending to 20th March 56
Deducted: Insurance and Investment firms 18
Total sum of qualified firms selected 110
Accounting data required for this study were collected from financial statements, data on
prices, and market index using Rahavard Novin 3 software, and the data related to risk free rate was
collected from the archive of the Central Bank.
4. FINDINGS
Descriptive statistics for variables are shown in Table3 and the year-firms’ classification
statistics in different stages of life cycle are as shown in Table 5.
Table-3. Descriptive Statistics
Levin, Lin & Chu Unit Root Test was utilized to examine the reliability of the research
variables. As illustrated in Table 4, the reliability of the variables has been approved data
significance level of 99 percent.
Table-4. Levin, Lin & Chu Unit Root Test
Table-5. Firms’ Classification Statistics
Total Number of Firms On stages
Year Growth Mature Stagnant
110 15 90 5 2003
110 31 59 2 2004
110 5 98 7 2005
110 8 97 5 2006 Continue
sig Statistic Variables
0.000 -3.95924 Book value
0.000 -9.99080 Abnormal
Earnings

Asian Economic and Financial Review, 2015, 5(4): 641-652
648
110 4 99 7 2007
110 4 96 10 2008
110 3 90 17 2009
110 8 91 11 2010
110 12 81 17 2011 110 8 93 9 2012 110 14 88 8 2013
1210 94 1018 98 Total
4.1. The First Hypothesis Test Results
The results of fitting the two initial and adjusted regression models to test the first hypothesis
of the study during both estimation periods of 5 and 10 years are as described in Table 6 and Table
7. The research results indicate the confirmation of initial models’ efficiency in the prediction of
abnormal earnings. This result conforms to the most researches, i.e. McCrae and Nitsson (2001),
Callen and Morel (2001) and Khodadadi and Emami (2010). Regression test results show the
superiority of the adjusted model to the initial one in terms of AR2 index during both estimation
periods. The significance of Xadt variable of the previous period during both estimation periods at a
level of 1% indicates the significance of the adjustment done.
To make a better comparison of both the initial and adjusted models for predicting abnormal
earnings, Akaike Information Criterion (AIC) and Schwarz Criterion (SC) and sum of squared
residuals (SSR) were used. The results of this comparison are shown in Table 8. As shown in the
table, Akaike and Schwarz criteria to estimate the adjusted model are smaller in both periods. In
terms of criterion, the sum of squared residuals during both estimation periods of the initial model
is smaller than that of the adjusted model. In total, evidence suggests the superiority of the adjusted
model in comparison with the initial model in predicting the abnormal earnings. So the first
research hypothesis is confirmed.
Table-6. The results of first hypothesis in traditional model
The estimation period 11w Prob AR
2 DWS
5 years 0.385689 0.000 0.6337 1.621
10 years 0.438625 0.000 0.587051 1.713
Table-7. The results of first hypothesis in adjusted model
The estimation period 11w Prob 11w
+
11w Prob AR2 DWS
5 years 0.210329 0.000 0.380010 0.000 0.708578 1.674
10 years 0.262742 0.000 0.438640 0.000 0.592001 1.704
Table-8. Comparison of Research Models in Respect of First hypothesis
*-indicating superior model
Asian Economic and Financial Review, 2015, 5(4): 641-652
649
4.2. The Second Hypothesis Test Results
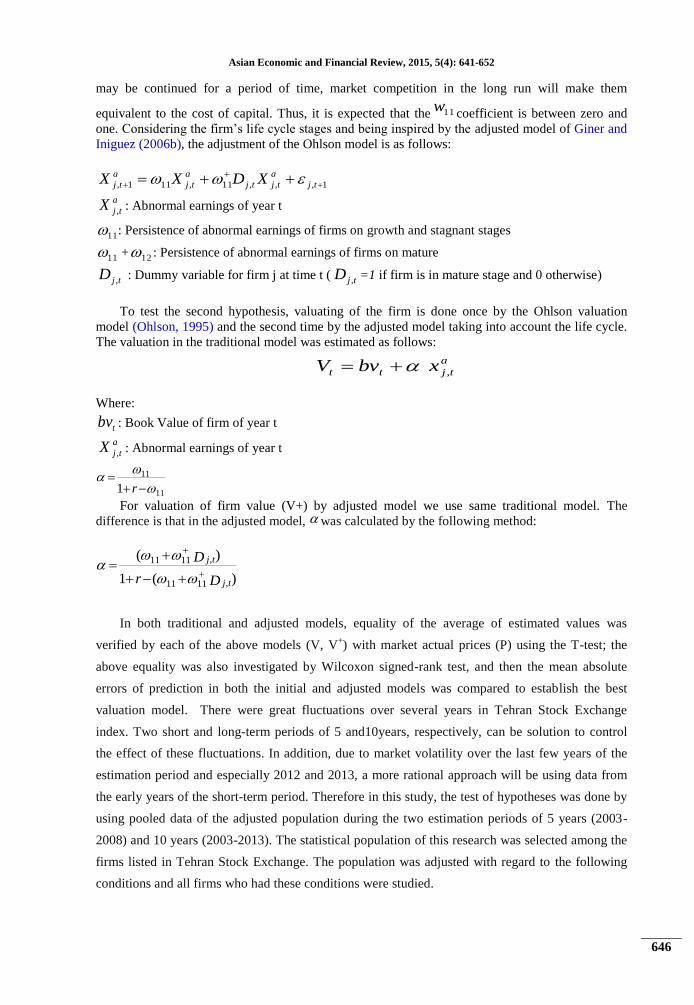
According to the results obtained during the 5-yearestimation period, values estimated by the
initial model are a good approximation of the actual values. This result is a support to the claim of
Ohlson (1995), McCrae and Nitsson (2001),Callen and Morel (2001). In this estimation period,
values estimated by adjusted model are a good approximation of the actual values too. The results
listed in Table9insure that adjustment of valuation model by considering the firm’s life cycle will
improve valuation power of the model during the 5-year estimation period. In terms of testing the
equality of means, the significance level in this period was increased from 0.717 in the initial
model to 0.773 in the adjusted model, and this indicates the valuation power improved in both
models. The equality of means of estimated and actual values at a confidence level of 99% is so
rejected. Improvement of valuation power in the adjusted model is also observable in terms of
testing the equality of means; so that the significance level has increased from 0.221 in the initial
model to 0.457 in the adjusted model.
As can be seen in Table9, the estimated values in the 10-year estimation period in both the
initial and adjusted models significantly differ from the actual values. In view of the sharp increase
of stock value of the firms listed on the Tehran Stock Exchange during the year 2012, especially in
2013 (with regard to the increase of the general index from 25,400 at the beginning of 2012 to
38,040 at the beginning of 2013, and to 78,968 at the end of this year), the reason of difference
between valuation models and actual values may be the price bubbles made during these years in
the Tehran Stock Exchange but Confirm this claim to need to a specific research in this area.
Table-9.The Results of means and medians Equality Test
Wilcoxon signed rank
test(H0:medv=medp)
T test(H0: μV = μP) The
estimation
period traditional model adjusted model traditional model adjusted model
Sig Z statistic Sig Z statistic Sig T statistic Sig T statistic
0.221 -1.234 0.475 0.000 0.717 -0.363 0.773 0.289 5 years
0.000 -8.632 0.000 -8.400 0.008 -2.705 0.009 2.268 10 years
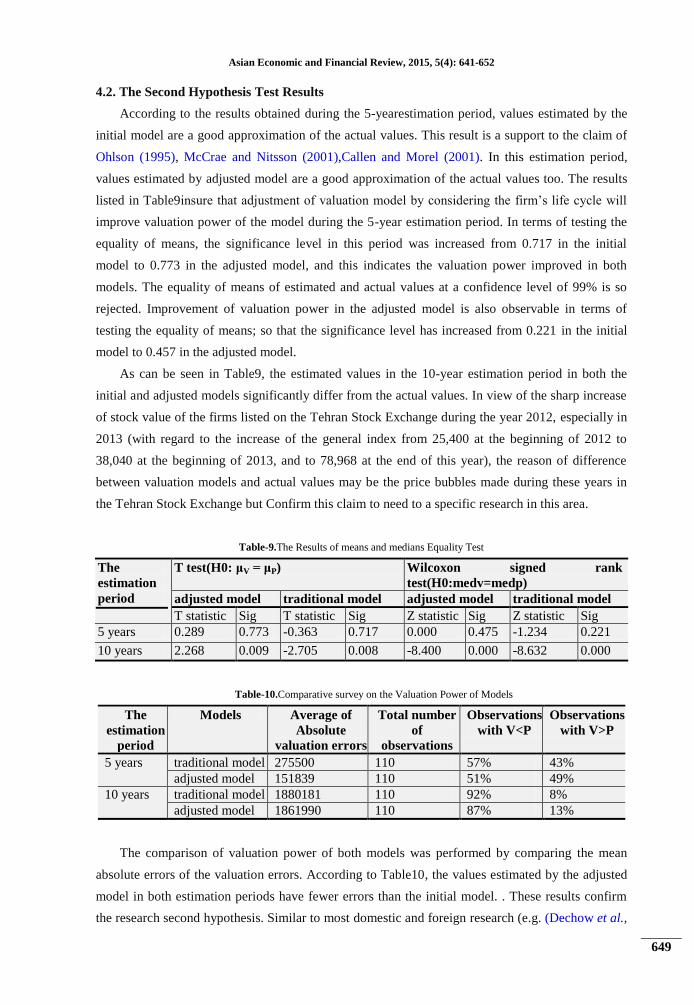
Table-10.Comparative survey on the Valuation Power of Models
The
estimation
period
Models Average of
Absolute
valuation errors
Total number
of
observations
Observations
with V<P
Observations
with V>P
5 years traditional model 275500 110 57% 43%
adjusted model 151839 110 51% 49%
10 years traditional model 1880181 110 92% 8%
adjusted model 1861990 110 87% 13%
The comparison of valuation power of both models was performed by comparing the mean
absolute errors of the valuation errors. According to Table10, the values estimated by the adjusted
model in both estimation periods have fewer errors than the initial model. . These results confirm
the research second hypothesis. Similar to most domestic and foreign research (e.g. (Dechow et al.,

Asian Economic and Financial Review, 2015, 5(4): 641-652
650
1999; Myers, 1999; Khodadadi and Emami, 2010)), most of the estimated values in both the initial
and adjusted models are less than the actual values. While the estimated values of the initial model
are less than market actual values in the initial model during the 5-year period at 57% of
observations and during the 10-year period at 92% of observations, this proportion has decreased in
the adjusted model to 51% and 87%, respectively.
5. CONCLUSION
Ohlson (1995) suggests that the firm value is influenced by three factors of the firm book
value, residual earnings and other information so that we can determine the fair value in capital
market by specifying the inherent value. Since Ohlson prediction and valuation model (Ohlson,
1995) relies on the firm book value, accounting earning and the assumption that "abnormal
earnings are randomized and stabilized", and also according to the theory of life cycle which asserts
that risk and performance indicators are of various importance during the firm’s life cycle and that
their relationship with the firm’s value varies during different stages of life cycle, this paper was
thus aimed at reviewing the ability to improve Ohlson valuation model with regard to the firm’s life
cycle variable. To this end, the pooled data of 110 firms listed on the Tehran Stock Exchange from
2003 to 2013 were used. Additionally, using Anthony and Ramesh (1992) variables and Park and
Chen (2006) methodology, all year-firms were divided into three life cycles, and then the adjusted
model for predicting abnormal earnings was compared with Ohlson initial model (Ohlson, 1995)
for the firm’s valuation during the estimation periods of 5 and 10 years. The results indicate that
during both estimation periods, the Ohlson adjusted model, through considering life cycle, had a
better performance than the initial model in predicting the abnormal earnings and the firm’s
valuation. Results are supports to Life Cycle Theory. The life cycle theory of a business entity
assumes that the latter presents different characteristics in different stages of the life cycle. The
value of business entities is influenced by internal factors, such as the choice of strategy, financial
resources and ability to manage, and external factors, such as competitive environment and
macroeconomic factors. The value assigned to a criterion by capital market participants depends on
the relative importance of this criterion in a certain stage of life cycle. Stability of sale, risk and
performance indicators in mature stage is different with growth and decline stages. Thus prediction
of abnormal earnings, as same as valuation, is different in mature firms with others. The research
results will be applicable for Investors and Firms’ Managers. It is expected that the research results
can indicate a model describing the investors’ stock theoretic value. The results help those making
better decisions. The firms’ stock price in financial markets is focused by most managers. Since
this is one of their assessment factors in shareholder’s viewpoint, achieving a model segregating
the stock unsubstantial price from the prices having theoretical backup will provide a better
criterion for the assessment made by shareholders and managers defending of their operation.

Asian Economic and Financial Review, 2015, 5(4): 641-652
651
REFERENCES
Aharony, J., H. Falk and N. Yehuda, 2006. Corporate life cycle and the value relevance of cash flow versus
accrual financial information. School of Economics and Management Bolzano ,Italy, Working
Paper. No. 34.
Anthony, J. and K. Ramesh, 1992. Association between accounting performance measures and stock prices: A
test of the life cycle hypothesis. Journal of Accounting and Economics, 15(2-3): 203- 227.
Black, E.L., 1998. Life-cycle impacts on the incremental relevance of earnings and cash flow measures.
Journal of Financial Statement Analysis, 4(1): 40-56.
Callen, J.L. and M. Morel, 2001. Linear accounting valuation when abnormal earnings are AR (2). Review of
Quantitative Finance and Accounting, 16(3): 191-203.
Dechow, P., S.P. Kothari and R.L. Watts, 1998. The relation between earnings and cash flows. Journal of
Accounting and Economics, 25(2): 133–168.
Dechow, P.M., A.P. Hutton and R.G. Sloan, 1999. Anempirical assessment of the residual income valuation
model. Journal of Accounting and Economics, 26(1): 1-34.
Dickinson, V., 2011. Cash flow patterns as a proxy for firm life cycle. The Accounting Review, 86(6): 1969-
1994.
Feltham, G.A. and J.A. Ohlson, 1995. Valuation and clean surplus accounting for operating and financial
activities. Contemporary Accounting Research, 11(2): 689-731.
Francis, J., P. Olsson and D. Oswald, 2000. Comparing the accuracy and explain ability of dividend, free cash
flow, and abnormal earnings equity value estimates. Journal of Accounting Research, 38(1): 45–70.
Frankel, R. and C. Lee, 1998. Accounting valuation, market expectation and cross-sectional returns. Journal of
Accounting and Economics, 25: 283-319.
Gaver, J.J. and K.M. Gaver, 1993. Additional evidence on the association between the investment opportunity
set and corporate financing, dividend, and compensation policies. Journal of Accounting and
Economics, 16(1-3): 125-160.
Giner, B. and R. Iniguez, 2006b. An empirical assessments of the Feltham-Ohlson models considering the
sign of abnormal earnings. Accounting and Business Research, 36(3): 169-190.
Jenkins, D.S., G.D. Kane and U. Velury, 2004. The impact of the corporate life cycle on the value relevance of
disaggregated earnings components. Review of Accounting and Finance, 3(4): 5-20.
Kallunki, J. and H. Silvola, 2008. The effect of organizational life cycle stage on the use of activity-based
costing. Management Accounting Research, 19(1): 62–79.
Khodadadi, V. and M.R. Emami, 2010. Comparative assessment of Fetham-Ohlson sign oriented and
traditional models. International Research Journal of Finance and Economics, 36(2): 59-73.
Lo, K. and T. Lys, 2000. The Ohlson model: Contribution to valuation theory, limitations, and empirical
applications. Journal of Accounting, Auditing and Finance, 15(3): 337-370.
Martinez, I., 2003. The impact of firm-specific attribute on the relevance in earnings and cash flows: A
nonlinear relationship between stock return and accounting numbers. Review of Accounting and
Finance, 2(1): 16-39.

Asian Economic and Financial Review, 2015, 5(4): 641-652
652
McCrae, M. and H. Nitsson, 2001. The explanatory and predictive power of different specifications of the
Ohlson (1995) valuation models. The European Accounting Review, 10(2): 315-341.
Myers, J., 1999. Implementing residual income valuation with linear information dynamics. Accounting
Review, 74(1): 1-28.
Ohlson, J.A., 1995. Earnings book values and dividends in equity valuation. Contemporary Accounting
Research, 11(2): 661-687.
Ota, K., 2002. A test of the Ohlson (1995) model: Empirical evidence from Japan. The International Journal of
Accounting, 37(2): 157-182.
Park, Y. and K. Chen, 2006. The effect of accounting conservatism and life-cycle stages on firm valuation.
Journal of Applied Business Research, 22(3): 75-92.
Penman, S. and T. Sougiannis, 1998. A comparison of dividend, cash flow and earnings approaches to equity
valuation. Contemporary Accounting Research, 15(3): 343–383.
Xu, B., 2007. Life cycle effect on the value relevance of common risk factor. Review of Accounting and
Finance, 6(2): 162-175.