Embed Size (px)
Citation preview

Fire Loss in the United States During 2017
October 2018
Ben Evarts NFPA
© October 2018 National Fire Protection Association

Fire Loss in the United States in 2017
i
Abstract United States fire departments responded to an estimated 1,319,500 fires in 2017. These fires resulted in 3,400 civilian fire fatalities, 14,670 civilian fire injuries and an estimated $23 billion in direct property loss (this figure includes a $10 billion loss in Northern California wildfires). There was a civilian fire death every 2 hours and 34 minutes and a civilian fire injury every 36 minutes 2017. Home fires caused 2,630, or 77%, of the civilian fire deaths. Fires accounted for four percent of the 34,683,500 total calls. Seven percent of the calls were false alarms; 64% of the calls were for medical aid such as emergency medical services (EMS) or rescues. Acknowledgements NFPA is grateful to the many fire departments that responded to the 2017 National Fire Experience Survey for their continuing efforts to provide the data necessary to make national projections. The author would also like to thank the members of NFPA staff who worked on this year’s survey, including Steve Belski, Frank Deely, and Jay Petrillo for editing the survey forms and making follow-up calls to fire departments. For more information about the National Fire Protection Association, visit www.nfpa.org. To learn more about Research go to www.nfpa.research. NFPA# FLX10 Copyright © 2018, National Fire Protection Association, Quincy, MA

Fire Loss in the United States in 2017
ii
Table of Contents
List of Tables and Figures iii
Section I: Overview of 2017 United States Fire Experience iv
A. Methods 1
Section II: Results 3
B. Number of Fires 7
C. Civilian Fire Deaths 13
D. Civilian Fire Injuries 18
E. Property Loss 19
F. Intentionally Set Fires 21
G. Regional Analysis 23
Section III: Conclusion 35
A. Definition of Terms 36

Fire Loss in the United States in 2017iii
List of Tables and Figures
Table 1 Fire Department Stratum by Size of Community Protected 1
Table 2 Number of Fire Departments Responding to 2017 NFPA Survey by Region and
Community Size
1
Table 3 Estimates of 2017 Fires, Civilian Deaths, Civilian Injuries and Property Loss in the
United States
4
Table 4 Estimates of 2017 Fires and Property Loss, by Property Use 5
Table 5 Estimates of 2017 Structure Fires and Property Loss, by Property Use 5
Figure 1 Fire Incidents by Type in the United States, by Year (1977-2017) 6
Figure 2 Fires per Thousand Population, by Size of Community (2017) 6
Figure 3 Civilian Fire Deaths per Million Population, by Community Size (2012-2017) 7
Figure 4 Civilian Home Fire Deaths and Rates per 1000 Fires (1977-2017) 8
Table 6 Estimates of 2017 Civilian Fire Deaths and Injuries, by Property Use 9
Figure 5 Average Loss per Structure Fire in the United States (1977-2017) 11
Table 7 Estimate of 2017 Losses in Intentionally Set Structure Fires 12
Table 8 Fire Loss Rates Nationwide and by Region, 2017 13
Table 9 2017 Fires per Thousand Population by Region and Size of Community 13
Table 10 2017 Civilian Fire Deaths per Million Population by Region and Size of Community 13
Table 11 Civilian Fire Injuries per Million Population by Region and Size of Community 13
Table 12 2017 Property Loss per Person by Region and Size of Community 13
Table 13 Fire Department Responses, by Type of Call, 2017 14
Table 14 Average Number of Fires and Non-Fire Incidents, by Community Size, 2014-2017 15
Table 15 Fire Department False Alarm Responses, by Type of Call, 2017 15
Table 16 2017 U.S. Fire Rates, by Unit of Time 18

Number of Fires
• Public fire departments responded to 1,319,500 fires in 2017, a slight decrease of 2% from the previous year.
• Of these, 499,000 fires occurred in structures, an increase of 5%.
• Of the structure fires in 2017, 357,000, or 72%, occurred in home structures, which include one- and two-family homes, manufactured homes, and apartments. This was an increase of 1%.
• There were also 168,000 fires in highway-type vehicles in 2017, a decrease of 3% from the previous year.
• The 623,000 fires that occurred in outside and other properties represented a decrease of 6%.
• Every 24 seconds, a fire department in the United States responds to a fire somewhere in the nation. A fire occurs in a structure at the rate of one every 63 seconds, and a home fire occurs every 88 seconds. Fires occur in highway vehicles at the rate of one every 3 minutes 8 seconds, and there is a fire in an outside and other property every 51 seconds.
Civilian Fire Deaths
• In 2017, 3,400 civilians died in fires, an increase of less than 1% from the previous year.
• Of these, 2,630, or 77% of all fire deaths, occurred in the home, a decrease of 4% compared to 2016.
• Another 400 civilians died in highway vehicle fires, which represents 12% of all fire deaths.
• Nationwide, a civilian died in a fire every 2 hours and 34 minutes, and a civilian died in a home fire every 3 hours and 20 minutes.
Civilian Fire Injuries
• Last year, 14,670 civilian fire injuries occurred, slight increase over the previous year. Many civilian injuries are not reported to the fire service, and the estimate for civilian injuries may be low.
• Of these, 12,160, or 83% of all civilian injuries, occurred in structure fires.
• Home fires were responsible for 10,600 civilian injuries, or 72% of all civilian injuries, in 2017.
• Another 1,370 civilian injuries, or 9% of all civilian injuries, occurred in highway vehicle fires.
• Nationwide, there was a civilian fire injury every 36 minutes, and a civilian fire injury in home fires every 50 minutes.
Property Damage
• An estimated $23 billion in property damage occurred as a result of fire in 2017, a large increase, as this number includes a $10 billion loss in wildfires in Northern California.
• $10.7 billion in property damage occurred in structure fires, including $7.7 billion in property loss in home fires.
• Highway vehicle fires resulted in $1.45 billion in property loss last year.
Intentionally Set Fires
• An estimated 22,500 structure fires were intentionally set in 2017, an increase of 13% over the year before.
• Intentionally set fires in structures also resulted in 280 civilian deaths in 2017, a decrease of 10% from the previous year.
• At the same time, intentionally set structure fires resulted in $582 million in property loss, an increase of 23% from 2016.
• There were 8,500 intentionally set vehicle fires in 2017, a decrease of 11% from the previous year. These fires resulted in $75 million in property damage, an increase of 88% from the year before.
Overview of 2017 United States Fire Experience
Section I

Fire Loss in the United States in 2017
1
Methods
Sample Selection
The NFPA currently has 29,806 public fire departments listed in the US in its Fire Service Inventory (FSI) file. Based on desired levels of statistical precision for the survey results and the staff available to process, edit, and follow up on the individual questionnaires, the NFPA set a target of 2,700 fire department survey responses for the 2017 sample.
Because of the variation in fire loss results by community size, fire departments were placed in one of the following 10 strata by size of community protected (Table 1).
Table 1. Fire Department Stratum, by Size of Community Protected
Stratum Population Size of Community Protected
1 1,000,000 and up 2 500,000 to 999,999 3 250,000 to 499,999 4 100,000 to 249,999 5 50,000 to 99,999 6 25,000 to 49,999 7 10,000 to 24,999 8 5,000 to 9,999 9 2,500 to 4,999
10 2.499 and under
Sample sizes for the individual strata were chosen to ensure the best estimate of civilian deaths in one-and two-family dwellings, the statistic that most aptly reflects the overall severity of the fire problem. All departments that protect 5,000 people or more were included. These 8,846 departments in the eight highest strata protect a population of 283 million, or 87% of the U.S. population as of July, 2017. The rest of the sample included 12,642 randomly selected departments from strata 9 and 10 (less than 5,000 population protected), for a total sample size of 21,488, or 72% of all departments in the United States known to the NFPA.
Data Collection
Surveys were mailed in early January 2018. A second mailing was sent in mid-March to fire departments that
had not responded to the first mailing. A total of 2,592 departments responded to the questionnaire.
Table 2 shows the number of departments that responded by region and size of community.
Table 2. Number of Fire Departments Responding to 2017 NFPA Survey, by Region and Community Size
Population of Community
All Regions Northeast Midwest South West
1,000,000 or
11 2 1 3 5
500,000 to
23 1 5 8 9 250,000 to
32 0 4 17 11
100,000 to
110 10 15 44 41 50,000 to
201 25 73 64 39
25,000
340 50 149 92 49 10,000 to
621 113 268 167 73
5,000 to
419 95 177 107 40 2,500 to
319 63 141 81 34
Under 2,500 516 88 255 87 86 Total 2,592 447 1,088 670 387
The overall response rate was 12%, although response rates were considerably higher for departments protecting larger communities than they were for departments protecting smaller communities. The overall response rate was 43% for departments protecting communities of 50,000 population or more (less than the previous survey), 23% for departments protecting communities of 10,000 to 49,999 (same as previous survey), and 7% for departments protecting communities less than 10,000 population, which are comprised of mostly volunteers (down from previous survey). Some fire departments were moved into different population strata, if appropriate, when they reported changes in the size of population they protect. The 2,592 departments that did respond protect 113 million people or 35% of the total U.S. population.
After the NFPA received the surveys, technical staff members of the Research, Data and Analytics Division reviewed them for completeness and consistency. When appropriate, they followed up on questions with a telephone call.
After the edit procedures were completed, the survey data were keyed to a computer file, where additional checks were made. The file was then ready for data analysis and estimation procedures
Source: NFPA’s Survey of Fire Departments for the 2017 Fire Experience.

Fire Loss in the United States in 2017
2
Estimation Methodology
The estimation method used for the survey was ratio estimation1 with stratification by community size. For each fire statistic a sample loss rate was computed for each stratum. This rate consisted of the total for that particular statistic from all fire departments reporting it, divided by the total population protected by the departments reporting the statistic. Note that this means that the departments used in calculating each statistic could be different, reflecting differences in unreported statistics. The sample fire loss rates by stratum were then multiplied by population weighing factors to determine the estimates and then are combined to provide the overall national estimate.
If this method of estimation is to be effective, estimates of the total number of fire departments and the total population protected in each stratum must be accurate. The NFPA makes every effort to ensure that this is the case. The population weights used for the national estimates were developed using the NFPA FSI (Fire Service Inventory) File and U.S. Census population figures.
For each estimate, a corresponding standard error was also calculated. The standard error is a measure of the error caused by the fact that estimates are based on a sampling of fire losses rather than on a complete census of the fire problem. Due to the fact that the survey is based on a random sample of the smaller departments, we can be confident that the actual value falls within the percentage noted in parentheses for the overall national fire loss statistics: number of fires (2%), number of civilian deaths (12%), number of civilian injuries (6%), and property loss (4%).
The standard error helps in determining whether year-to-year differences are statistically significant. Differences that were found to be statistically significant were so noted in the tables. Property loss estimates are particularly prone to large
standard errors because they are sensitive to unusually high losses, and, as a result, large percentage
differences from year to year may not always be statistically significant. In general, response rates have fallen over the past few years, and this has increased the uncertainty inherent in the estimates.
In addition to sampling errors, there are non-sampling errors. These include biases of the survey methodology, incomplete or inaccurate reporting of data to the NFPA, and differences in data collection methods by the fire departments responding. As an example of a non-sampling error, most of the fires included in the survey took place in highly populated residential areas because the fire departments selected for the surveys are primarily public fire departments that protect sizable residential populations. Fires that occur in sparsely populated areas protected primarily by State and Federal Departments of Forestry are not likely to be included in the survey results.
The NFPA Fire Incident Data Organization (FIDO) data base was also used in conjunction with the annual survey to help identify any large-loss fires or deaths that the survey might have missed.
The editors of survey data attempted to verify all reported civilian deaths in vehicle fires. They contacted most of the fire departments that reported fire-related deaths in vehicles and found that many of the deaths were indeed the results of fire. In some instances, however, impact was found to have been the cause of death. This effort can have a considerable impact on the estimates.
The results presented in this report are based on fire incidents attended by public fire departments. No adjustments were made for unreported fires and losses (e.g., fires extinguished by the occupant). Also, no adjustments were made for fires attended solely by private fire brigades (e.g., industry and military installations), or for fires extinguished by fixed suppression systems with no fire department response.
1 William G. Cochran, Sampling Techniques, John Wiley, New York, NY, 1977, pp. 150-161.

Number of Fires
Based upon the data from our 2017 National Fire Experience Survey, we estimate that public fire departments in the U.S. responded to 1,319,500 fires last year, a decrease of 2% from last year.
Of these fires, an estimated 499,000 were structure fires, 5% more than the year before. The number of structure fires has trended downward since 1977. Structure fires have fallen from a peak of 1,098,000 in 1977. From 1998 to 2008, the number of structure fires fluctuated between 505,000 and 530,500 annually before decreasing to 480,500 in 2009. Since then, estimates have ranged between 475,500 and 501,500 structure fires a year. Figure 1 shows these trends in more detail.
We categorize structure fires as residential and non-residential. Residential properties include one- and two-family homes, including manufactured homes, apartments or other multi-family housing, hotels and motels, dormitories, and boarding houses. “Home” encompasses one- and two-family homes including manufactured housing, and apartments or other multi-family residences. Homes are much less regulated than other residential properties. Non-residential structure properties include public assembly, schools and colleges, health care and correctional institutions, stores and offices, industrial facilities, storage facilities, and other structures such as outbuildings and bridges.
In 2017, there were 379,000 residential structure fires, accounting for 76% of all structure fires, an increase of 7,500 fires over 2016. Of these fires, 262,500 occurred in one- and two-family homes, accounting for 53% of all structure fires. Another 95,000 fires occurred in apartments (19% of the
structure fire total). The total number of home fires for 2017 is 357,000. There were also 120,000 non-residential structure fires in 2017, an increase of 15% over 2016.
The 623,000 outside fires or other non-structure, non-vehicle fires accounted for almost half (47%) of all reported fires. These included 283,000 brush, grass, and forest fires (21% of total fires); 174,500 outside rubbish fires (13% of total fires); 74,000 outside fires involving property of value (6%); and 91,000 (7% of total fires) other non-structure, non-vehicle fires.
From 2016 to 2017, outside or other fires decreased 6%. Outside and other fires peaked in 1977 at 1,658,500. The number of such fires then decreased steadily to 1,011,000 in 1983 and remained relatively flat through the 1980s. By 1993, the number of outside fires dropped to 910,500, and stayed near the 1 million level for the next three years. In 2013, outside and other fires dropped to a record low of 564,500 fires, the only year these fires have dropped below 600,000.
From 2016 to 2017, brush, grass, or forest fires decreased 5%; outside rubbish fires decreased 1%; fires involving property of value decreased by 16%; and other non-structure, non-vehicle fires decreased 13%.
In addition to residential, non-residential, and outside fires, there were an estimated 168,000 highway vehicle fires in 2017, a decrease of 3% from the year before, and 29,500 other vehicle fires, a decrease of 5%.
Results Section II

Fire Loss in the United States in 2017
4 Table 3. Estimates of 2017 Fires, Civilian Deaths, Civilian Injuries and Property Loss in the United States
Estimate Range1 Percent Change From 2016
Number of Fires 1,319,500 1.305,500 to 1,333,500 -2% Nimber of Civilian Deaths 3,400 3,200 to 3,600 +<1% Number of Civilian Injuries 14,670 14,200 to 15,140 +<1% Property Loss2 $23 Billion** $22.8 Billion to $23.3 Billion >100%
Source: NFPA's Survey of Fire Departments for 2017 U.S. Fire Experience The estimates are based on data reported to the NFPA by fire departments that responded to the 2017 National Fire Experience Survey. 1 These are 95% confidence intervals. 2 This includes overall direct property loss to contents, structures, vehicles, machinery, vegetation, and anything else involved in a fire. It does not include indirect losses. No adjustment was made for inflation in the year-to-year comparison. *Includes $10 Billion+ losses in Northern California wildfires. **Change was statistically significant to the .01 level.
Table 4. Estimates of 2017 Fires and Property Loss, by Property Use
Number of Fires Property Loss¹
Type of Fire Estimate Percent Change from 2016 Estimate Percent Change from 2016
Northern California Wildfires 2017 $10,000,000,000
Fires in Structures 499,000 +5%* $10,700,000,000 +35%**
Fires in Highway Vehicles 168,000 -3% $1,450,000,000 +55%** Fires in Other Vehicles2 29,500 -5% $594,000,000 +40%** Fire Outside but no vehicle (outside-storage, crops, timber, etc.) 74,000 -16%* $137,000,000 -30%**
Fires in Brush, Grass, Wildland (excluding crops and timber) with no value or loss involved 283,000 -5% Fires in Rubbish, including dumpsters (outside of structures), with no value or loss involved 174,500 +1% All Other Fires 91,000 -13% $136,000,000 -30% Total 1,319,500 -2% $23,000,000,000 +117%**
Source: NFPA's Survey of Fire Departments for 2017 U.S. Fire Experience The estimates are based on data reported to the NFPA by fire departments that responded to the 2017 National Fire Experience Survey. Note: Sums may not equal totals due to rounding errors. 1 This includes overall direct property loss to contents, structure, a vehicle, machinery, vegetation or anything else involved in the fire. It does to include indirect losses, e.g., business interruption or temporary shelter costs. No adjustment was made for inflation in the year-to-year comparison. 2 This includes trains, boats, ships, aircraft, farm vehicles and construction vehicles. *Change was statistically significant to the .05 level. **Change was statistically significant to the .01 level.
Fire Loss in the United States in 2017
5
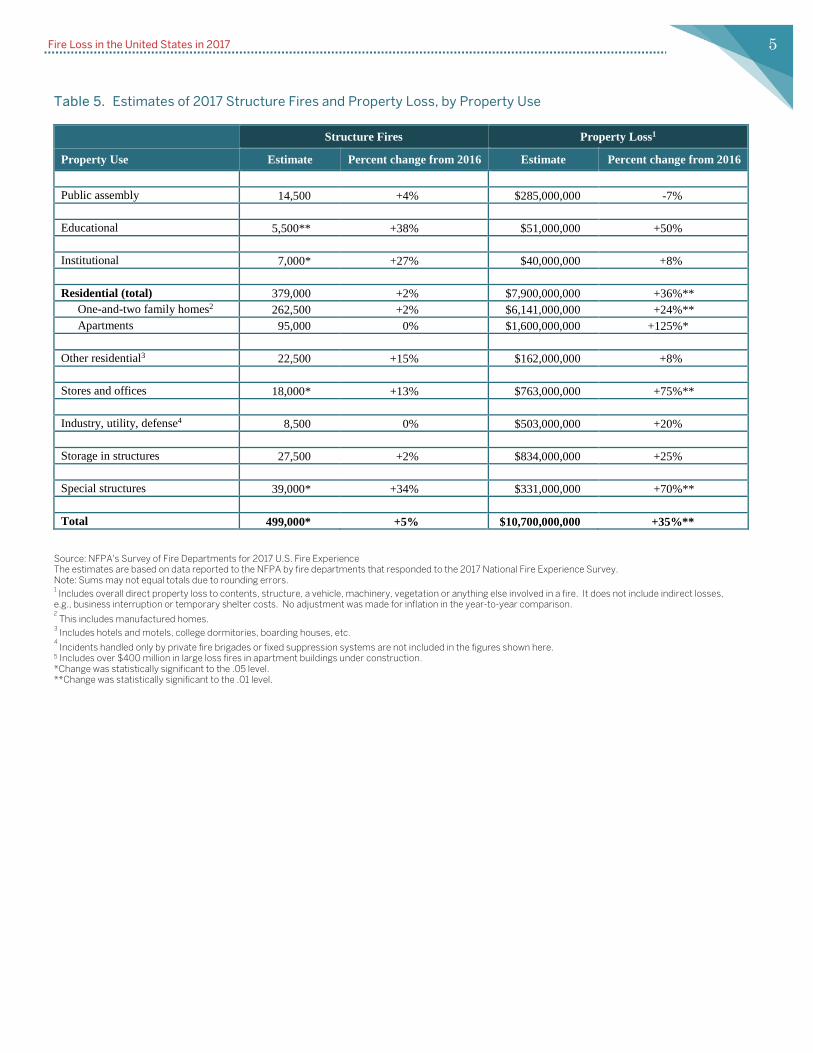
Table 5. Estimates of 2017 Structure Fires and Property Loss, by Property Use
Structure Fires Property Loss1
Property Use Estimate Percent change from 2016 Estimate Percent change from 2016 Public assembly 14,500 +4% $285,000,000 -7% Educational 5,500** +38% $51,000,000 +50% Institutional 7,000* +27% $40,000,000 +8% Residential (total) 379,000 +2% $7,900,000,000 +36%**
One-and-two family homes2 262,500 +2% $6,141,000,000 +24%** Apartments 95,000 0% $1,600,000,000 +125%*
Other residential3 22,500 +15% $162,000,000 +8% Stores and offices 18,000* +13% $763,000,000 +75%** Industry, utility, defense4 8,500 0% $503,000,000 +20% Storage in structures 27,500 +2% $834,000,000 +25% Special structures 39,000* +34% $331,000,000 +70%** Total 499,000* +5% $10,700,000,000 +35%**
Source: NFPA's Survey of Fire Departments for 2017 U.S. Fire Experience The estimates are based on data reported to the NFPA by fire departments that responded to the 2017 National Fire Experience Survey. Note: Sums may not equal totals due to rounding errors. 1 Includes overall direct property loss to contents, structure, a vehicle, machinery, vegetation or anything else involved in a fire. It does not include indirect losses, e.g., business interruption or temporary shelter costs. No adjustment was made for inflation in the year-to-year comparison. 2 This includes manufactured homes.
3 Includes hotels and motels, college dormitories, boarding houses, etc. 4 Incidents handled only by private fire brigades or fixed suppression systems are not included in the figures shown here.
5 Includes over $400 million in large loss fires in apartment buildings under construction. *Change was statistically significant to the .05 level. **Change was statistically significant to the .01 level.

Fire Loss in the United States in 2017
6 Figure 1. Fire Incidents by Type in the United States, by Year (1977-2017)
Figure 2. Fires per Thousand Population, by Size of Community (2017)
9.5
6.9
5.0
3.63.1 2.9 3.1 3.3
0.0
1.0
2.0
3.0
4.0
5.0
6.0
7.0
8.0
9.0
10.0
Fire
s pe
r Tho
usan
d Po
pula
tion
Size of Community
National Rate 4.1
3,264,500
1,319,5001,658,500
623,0001,098,000
499,000508,000
197,5000
500,000
1,000,000
1,500,000
2,000,000
2,500,000
3,000,000
3,500,000
Num
ber o
f Fire
Inci
dent
s
Year
Total
Outside
Structure
Vehicle

Fire Loss in the United States in 2017
7
Civilian Fire Deaths
The 1,319,500 fires reported by fire departments in 2017 resulted in an estimated 3,400 civilian deaths, an increase of less than one percent from the 2016 total. We can better understand the nature of these deaths by examining the types of properties where the deaths occurred.
The 357,000 home structure fires (which includes one- and two-family homes and apartments) caused 2,630 civilian deaths, a decrease of 4% from 2016. This includes 2,290 deaths in one- and two-family homes (67% of the total number of civilian deaths) and 340 in apartments or other multi-family housing, including condominiums. Deaths in one-or two-family homes decreased by 5%, while apartment deaths increased by 5% from 2016.
Home fire deaths were at their peak in 1978, when 6,015 people died in such fires. The number has trended downwards until recent years, with fewer than 5,000 annual deaths since 1982, and fewer than 4,000 deaths since 1991, with the exception of 1996. Since 2006, home fire deaths have remained below 3,000 per year.
Overall, home fire deaths over the period 1977 to 2017 declined from 5,865 to 2,630, a drop of 55%. The number of home fires also dropped steadily over the same period for an overall decrease of 51%. However, the death rate per 1,000 home fires fluctuated considerably during that period, from 8.1 in 1977 to a high of 9.7 in 1996 and a low of 6.5 in 2006. The death rate per 1,000 home fires was 7.4 in 2017. This suggests that, while the number of reported home fires and home fire deaths both declined during the period, the fire death rate risk has remained relatively unchanged. That is, given a fire serious enough to report to the fire department, the risk of dying in that fire has not decreased greatly over the past 40 years.
In 2017, there were also 80 civilian fire deaths in other residential occupancies, such as hotels, motels, dormitories, and boarding houses, for an increase of 23% compared to 2016. In addition, 105 civilians died in nonresidential structure fires, a decrease of 30% from the year before.
Of the 2,815 civilian deaths in structure fires, 280 (10%) died in fires that were intentionally set.
With 2,630 home fire deaths accounting for 77% of all civilian fire deaths, fire-safety initiatives targeted at the home remain the key to any reductions in the overall fire death toll. There are five major
strategies for reducing the death toll in home fires. First, more widespread public fire safety education is needed on how to prevent fires and how to avoid serious injury or death if a fire occurs. Information on the common causes of fatal home fires should be used in the design of fire safety education messages. Second, people need to install and maintain smoke alarms and develop and practice escape plans. Third, wider use of residential sprinklers must be aggressively pursued. Fourth, additional ways must be sought to make home products safer from fire. The regulations requiring more child-resistant lighters are a good example, as are fire-safe cigarettes. Finally, the special fire safety needs of high-risk groups such as older adults, the poor, and people with disabilities need to be addressed. Additionally, Figure 3 shows that risk of fire death (fire deaths per thousand population) is higher in less populous communities.
Figure 3. Civilian Fire Deaths per Million Population, by Community Size (2012-2017)
In the highway vehicle fires category, the
number of civilian deaths rose from an estimated 280 in 2016 to an estimated 400 in 2017. These numbers exclude deaths due to trauma if the fire was not a factor in the death. Between 1980 and 2009, the number of highway vehicle deaths decreased by 60%. Since a low of an estimated 260 deaths in 2009, the number of deaths has fluctuated, getting as high 445 in 2015.
21.1 20.4
14.7
11.3
9.07.7 8.2
6.3
0.0
5.0
10.0
15.0
20.0
25.0
Civ
ilian
Fire
Dea
ths
per M
illion
Pop
ulat
ion
Community Size
National Rate 11.1

Fire Loss in the United States in 2017
8
Figure 4. Civilian Home Fire Deaths and Rates per 1000 Fires (1977-2017)
Source: NFPA Survey of Fire Departments (1977-2017)
0.0
2.0
4.0
6.0
8.0
10.0
12.0
14.0
0
1000
2000
3000
4000
5000
6000
7000
Dea
th R
ate
per 1
000
Hom
e Fi
res
Civ
ilian
Hom
e Fi
re D
eath
s
Home fire Deaths
Deaths per 1000Fires

Fire Loss in the United States in 2017
9 Table 6. Estimates of 2017 Civilian Fire Deaths and Injuries, by Property Use
Property Use Civilian Deaths Civilian Injuries
Estimate Percent Change From 2016
Percent of all Civilian Deaths Estimate Percent Change
From 2016 Percent of all
Civilian Injuries
Residential (total) 2,710 -3% 80% 10,910 -2% 74% One- and Two- Family Homes1 2,290 -5% 67% 7,470 <1% 51% Apartments 340 +5% 10% 3,130 -7% 21% Other Residential2 80 +23% 1% 310 -17% 2%
Non-Residential Structures3 105 -30% 3% 1,250 -24%* 9% Highway Vehicles 400 +43% 12% 1,370 +27% 9% Other Vehicles4 30 -60%* 1% 240 +60% 2% All Other5 145 +71% 4% 900 +38% 6% Total 3,400 +<1% 14,670 +<1%
Source: NFPA's Survey of Fire Departments for 2017 U.S. Fire Experience The estimates are based on data reported to the NFPA by fire departments that responded to the 2017 National Fire Experience Survey. Note: Sums may not equal totals due to rounding errors. 1 This includes manufactured homes. 2 Includes hotels and motels, college dormitories, boarding houses, etc. 3 This includes public assembly, educational, institutional, store and office, industry, utility, storage, and special structure properties. 4 This includes trains, boats, ships, farm vehicles and construction vehicles. 5 This includes outside properties with value, as well as brush, rubbish, and other outside locations. *Change was statistically significant to the 0.05 level **Change was statistically significant to the 0.01 level

Fire Loss in the United States in 2017
10
Civilian Fire Injuries
In addition to the civilians who died in fires in 2017, there were an estimated 14,670 civilian fire injuries, an increase of less than one percent from 2016 and the second lowest since 1977. Since civilian fire injuries are not always reported to the fire service, estimates of civilian fire injuries may be lower than actual levels. For example, many injuries occur at small fires to which fire departments do not respond, and even when fire departments do respond, they may be unaware of injured persons they did not transport to medical facilities themselves.
Of the 14,670 civilians injured in 2017, we estimate that 12,160 civilians were injured in structure fires, with 10,600 injured in home structure fires, a decrease of one percent from the previous year. Of these injuries, 7,470 occurred in one- and two-family homes and manufactured homes, and 3,130 occurred in apartments. An additional 1,250 civilians were injured in nonresidential structure fires in 2017, a decrease of 24% from the year before. Additionally, 1,370 civilians were injured in highway vehicle fires, a 27% increase from 2016. Fires in other vehicles (including airplanes, trains, ships, construction vehicles, and farm vehicles) caused 240 civilian injuries in 2017.
Between 1977 and 2017, the number of civilian injuries ranged from a peak of 31,325 in 1979 to a low of 14,660 in 2016, a decrease of 53.2%. Since 1997, civilian injuries have remained below 35,000 per year, below 19,000 since 2002, and below 16,000 since 2013.
Property Loss
NFPA estimates that the 1,319,500 fires to which the fire service responded in 2017 caused $23 billion in property damage, a substantial increase over 2016. It is worth noting that the $23 billion figure includes a major wildfire in Northern California in 2017 which caused $10 billion in direct property damage.
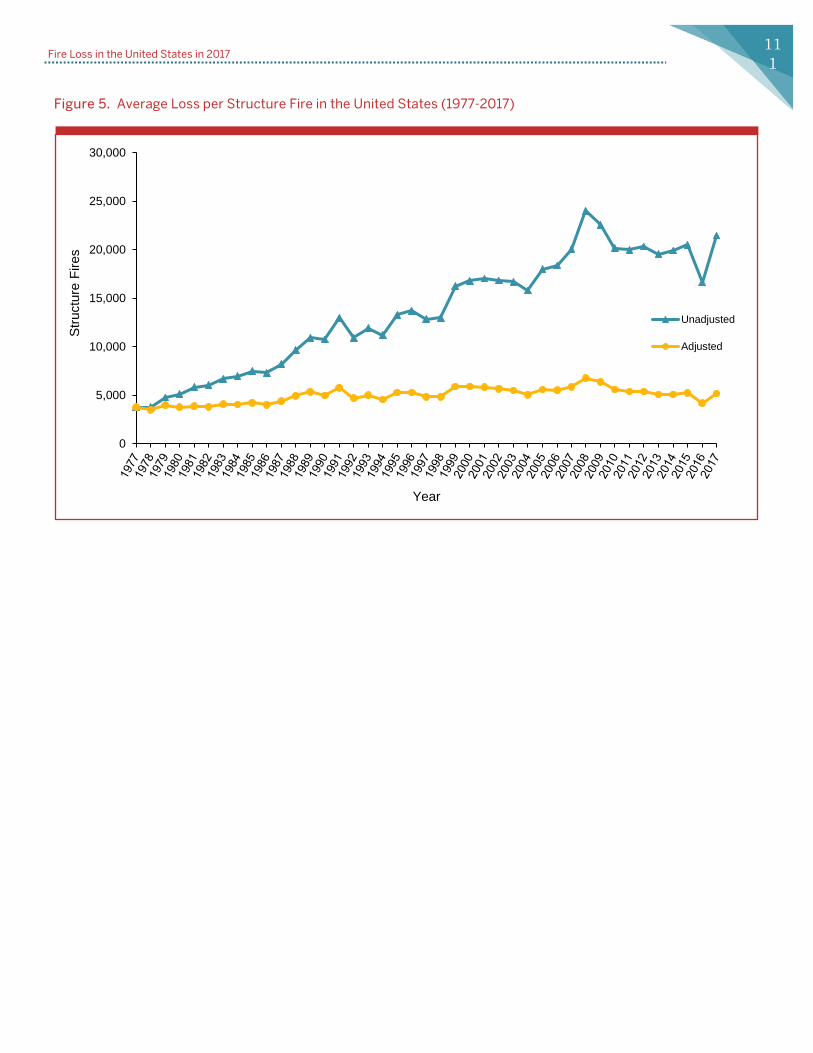
Fires in structures not related to these wildfires resulted in $10.7 billion in property damage, an increase of 35% from 2016. Each structure fire resulted in an average property loss of $21,463, an increase of 29% from the previous year. Figure 5 shows that 2016 was somewhat lower than previous years, and 2017 may be a return to the trend. From 1977 to 2017, excluding the events of September 11, 2001, the average loss per
structure fire was $3,757 in 1977 and $21,462 in 2017, for a nearly six-fold increase. When property loss is adjusted for inflation in 2017 dollars, however, the increase in the average structure fire loss between 1977 and 2017 is 36.4%.
Of the 2017 property loss in structures, $7.7 billion occurred in home structures, an increase of 35% from 2016. An estimated $6.1 billion of this loss occurred in one- and two-family homes, an increase of 25%. An estimated loss of $1.6 billion occurred in apartments or other multifamily housing, including condominiums. Over $400 million came from major fires in apartments that were under construction at the time of the fire.
Other property damage results for 2017 include $763 million in store and office properties, an increase of 75%; $503 million in industrial and manufacturing properties, a 20% increase; $1.4 billion in highway vehicles, a 55% increase; and $594 million in other vehicles, a 40% increase.
It should be kept in mind that property loss totals can change significantly from year to year due to the impact of occasional large-loss fires. NFPA provides an annual analysis of such fires in the November/December issue of the NFPA Journal.
Fire Loss in the United States in 2017
111
Figure 5. Average Loss per Structure Fire in the United States (1977-2017)
0
5,000
10,000
15,000
20,000
25,000
30,000
Stru
ctur
eFi
res
Year
Unadjusted
Adjusted

Fire Loss in the United States in 2017
12
Intentionally Set Fires
NFPA estimates that 22,500 structure fires were intentionally set in 2017, an increase of 13% from the year before. These fires resulted in an estimated 280 civilian deaths, a decrease of 10% from the previous year. These fires resulted in $582 million in property loss, an increase of 23% compared to 2016.
In 2017, there were also an estimated 8,500 intentionally set vehicle fires, a drop of 10.5% compared
to the year before. These fires resulted in $75 million in property loss, an increase of 88% from 2016.
Estimates of intentionally set fires do not include allocation of fires whose causes were unknown or unreported.
Table 7. Estimate of 2017 Losses in Intentionally Set Structure Fires
Intentionally1 Set Structure Fires Estimate Percent change
from 2016 Number of Structure Fires 22,500 +13% Civilian Deaths 280 -10% Property Loss1 $582,000,000 +23%
Source: NFPA's Survey of Fire Departments for 2017 U.S. Fire Experience The estimates are based on data reported to the NFPA by fire departments that responded to the 2017 National Fire Experience Survey. 1 This includes overall direct property loss to contents, structure, a vehicle, machinery, vegetation, or anything else involved in a fire. It does not include indirect losses, e.g., business interruption or temporary shelter costs. No adjustment was made for inflation in the year-to-year comparison.

13
Regional Analysis
Fire loss rates nationwide for 2017 and by region 1 can be seen in Table 8. The South had the highest fire incident rate per thousand people (4.6) and with 12.7 the highest civilian death rate per million population.
Table 8. Fire Loss Rates Nationwide and by U.S. Census
Region, 2017
Number of Fires per Thousand Population
Civilian Deaths per
Million Population
Civilian Injuries per
Million Population
Property Loss per Capita
Nationwide 4.1 10.5 40.6 $42.2 Northeast 4.0 9.4 38.1 $35.1 Midwest 4.0 11.7 49.1 $39.4 South 4.6 12.7 41.6 $44.3 West 3.5 6.8 32.1 $46.9
Source: NFPA’s Survey of Fire Departments for 2017 U.S. Fire Experience.
The Midwest (49.1) had the highest civilian injury rate per million population, while the West ($46.9) had the highest property loss per capita rate.
Fire incident rates by region and community size can be seen in Table 9. The Northeast had the highest rate for communities of 100,000 to 249,999 population. The South had the highest rate for every category of communities of less than 49,999 population. Table 9. 2017 Fires per Thousand Population, by Region and
Size of Community
Fires All Regions Northeast Midwest South West
250,000 or more 3.3 4.0 4.1 2.5 3.4 100,000 to 249,999 3.1 5.1 3.3 3.5 2.3 50,000 to 99,999 2.9 3.2 2.3 3.4 2.8 25,000 to 49,999 3.1 3.1 2.6 3.9 3.2 10,000 to 24,999 3.6 2.9 3.4 4.3 4.0 5,000 to 9,999 4.7 5.1 3.9 5.8 4.2 2,500 to 4,999 6.9 4.8 5.8 9.5 9.3 Under 2,500 9.5 6.3 8.2 16.1 10.2
Source: NFPA's Survey of Fire Departments for 2017 U.S. Fire Experience.
Civilian fire deaths per million population by region and community size are shown in Table 10 and civilian fire injuries per million population by region and community size are shown in Table 11. In general these numbers varied greatly, partially due to lower response rates. They are reported here but should be interpreted with caution. The Midwest had the highest rates in the largest communities.
Table 10. 2017 Civilian Fire Deaths per Million Population, by Region and Size of Community
Deaths All Regions Northeast Midwest South West
250,000 or more 5.6 * 10.4 5.9 5.4 100,000 to 249,999 8.5 10.1 20.0 9.1 3.7 50,000 to 99,999 7.2 10.9 6.0 8.2 5.1 25,000 to 49,999 8.5 11.5 7.2 9.9 6.8 10,000 to 24,999 11.5 5.7 12.4 13.6 12.5 5,000 to 9,999 17.3 5.7 14.4 34.7 10.0 2,500 to 4,999 18.8 12.8 15.6 26.9 24.1 under 2,500 21.0 44.3 14.0 10.1 26.6
Source: NFPA's Survey of Fire Departments for 2017 U.S. Fire Experience. *insufficient data
Table 11. 2017 Civilian Fire Injuries per Million Population, by Region and Size of Community
Injuries All Regions Northeast Midwest South West
250,000 or more 27.5 * 39.5 35.7 30.6 100,000 to 249,999 50.5 * 86.7 48.7 28.1 50,000 to 99,999 47.4 44.0 50.3 63.1 18.2 25,000 to 49,999 56.0 51.3 60.1 54.0 52.1 10,000 to 24,999 53.7 54.3 58.5 43.8 58.3 5,000 to 9,999 35.6 40.1 28.1 44.7 33.3 2,500 to 4,999 28.2 47.1 31.2 16.8 8.0 under 2,500 28.0 0.0 42.1 10.1 39.9
Source: NFPA's Survey of Fire Departments for 2017 U.S. Fire Experience. *insufficient data
Property loss per capita by region and community size are shown in Table 12. The Midwest had the highest rates for communities of 100,000 to 249,000 population. The South had the highest property loss per capita in communities with less than 2,500 population and 5,000 to 9,999. The West has the highest property loss in communities 2,500 to 4,999 as well as 50,000 to 99,999 and 10,000 to 24,999.
Table 12. 2017 Property Loss per Person, by Region and Size of Community (in Dollars)
Loss All Regions Northeast Midwest South West
250,000 or more 31.2 * 27.4 30.8 45.6 100,000 to 249,999 26.3 11.9 44.7 29.7 20.0 50,000 to 99,999 45.6 30.0 23.9 52.0 82.8 25,000 to 49,999 34.4 50.8 33.3 27.8 34.4 10,000 to 24,999 40.4 31.9 39.3 36.5 65.7 5,000 to 9,999 52.7 34.6 52.8 68.8 51.2 2,500 to 4,999 48.3 48.9 49.9 34.8 72.7 under 2,500 93.9 118.0 57.2 187.0 73.8
Source: NFPA's Survey of Fire Departments for 2017 U.S. Fire Experience. *Insufficient data
In general, these results should be interpreted cautiously, as small differences in responses can create wide variations due to the number of subcategories (region and strata) in the sample.
1 As defined by the U.S. Bureau of the Census, the four regions are: Northeast: Connecticut, Maine, Massachusetts, New Hampshire, New Jersey, New York, Pennsylvania, Rhode Island, and Vermont. Midwest: Illinois, Indiana, Iowa, Kansas, Michigan, Minnesota, Missouri, Nebraska, North Dakota, Ohio, South Dakota, and Wisconsin. South: Alabama, Arkansas, Delaware, District of Columbia, Florida, Georgia, Kentucky, Louisiana, Maryland, Mississippi, North Carolina, Oklahoma, South Carolina, Tennessee, Texas, Virginia, and West Virginia. West: Alaska, Arizona, California, Colorado, Hawaii, Idaho, Montana, Nevada, New Mexico, Oregon, Utah, Washington and Wyoming.
14
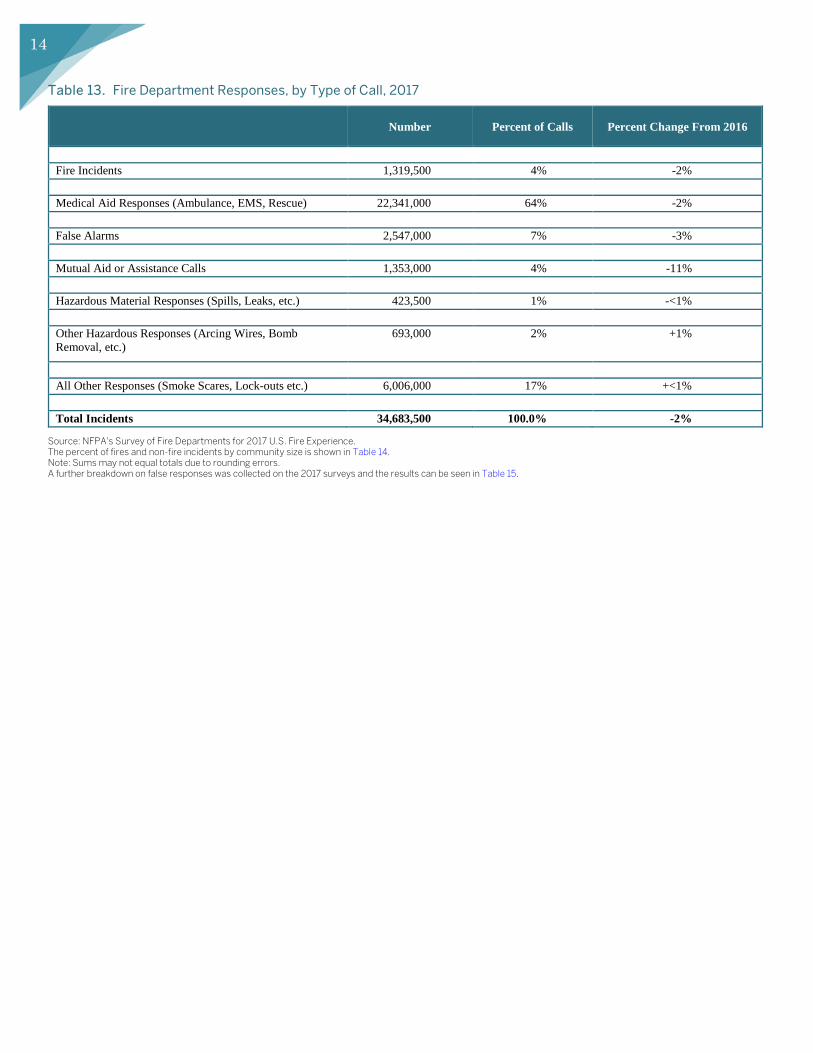
Table 13. Fire Department Responses, by Type of Call, 2017
Number Percent of Calls Percent Change From 2016
Fire Incidents 1,319,500 4% -2%
Medical Aid Responses (Ambulance, EMS, Rescue) 22,341,000 64% -2%
False Alarms 2,547,000 7% -3%
Mutual Aid or Assistance Calls 1,353,000 4% -11%
Hazardous Material Responses (Spills, Leaks, etc.) 423,500 1% -<1%
Other Hazardous Responses (Arcing Wires, Bomb Removal, etc.)
693,000 2% +1%
All Other Responses (Smoke Scares, Lock-outs etc.) 6,006,000 17% +<1%
Total Incidents 34,683,500 100.0% -2%
Source: NFPA's Survey of Fire Departments for 2017 U.S. Fire Experience. The percent of fires and non-fire incidents by community size is shown in Table 14. Note: Sums may not equal totals due to rounding errors. A further breakdown on false responses was collected on the 2017 surveys and the results can be seen in Table 15.

Fire Loss in the United States in 2017
15 Table 14. Average Number of Fires and Non-Fire Incidents, by Community Size, 2014-2017
Community Size
1,000,000 or more
500,000 to 999,999
250,000 to 499,999
100,000 to 249,999
50,000 to 99,999
25,000 to 49,999
10,0000 to 24,999
5,000 to 9,999
2,500 to 4,999
under 2,500
Fires 6,394 2,273 1,040 469 189 99 57 33 29 14 Rescue, EMS etc., 156,103 66,831 27,159 11,979 4,754 2,040 948 346 213 55 False alarm responses 16,674 5,800 2,362 1,074 582 288 131 53 26 7 Mutual aid responses 1,402 1,302 504 336 186 143 88 53 40 15 Hazardous materials 3,084 811 334 168 85 48 24 10 5 1 Other hazardous 2,562 1,111 617 279 139 69 35 17 12 3 All other responses 77,381 14,875 7,555 2,997 1,241 501 206 83 47 10 Total for all incidents 263,600 93,003 39,572 17,304 7,176 3,189 1,489 596 371 105
1,000,000 or more
500,000 to 999,999
250,000 to 499,999
100,000 to 249,999
50,000 to 99,999
25,000 to 49,999
10,0000 to 24,999
5,000 to 9,999
2,500 to 4,999
under 2,500
Fires 2% 2% 3% 3% 3% 3% 4% 6% 8% 13% Rescue, EMS etc., 59% 72% 69% 69% 66% 64% 64% 58% 58% 52% False alarm responses 6% 6% 6% 6% 8% 9% 9% 9% 7% 6% Mutual aid responses 1% 1% 1% 2% 3% 4% 6% 9% 11% 14% Hazardous materials 1% 1% 1% 1% 1% 2% 2% 2% 1% 1% Other hazardous 1% 1% 2% 2% 2% 2% 2% 3% 3% 3% All other responses 29% 16% 19% 17% 17% 16% 14% 14% 13% 9% Total for all incidents 100% 100% 100% 100% 100% 100% 100% 100% 100% 100%
Source: NFPA's Survey of Fire Departments for 2017 U.S. Fire Experience. Note: some large responses from cities are included here, but handled separately in the overall projection.
Table 15. Fire Department False Alarm Responses, by Type of Call, 2017
Type of Call Estimate Percentage Change From 2016 Percent of All False Alarms
Malicious, Mischievous False Call 141,000 -18% 6% System Malfunction 752,000 -10% 30% Unintentional Call 1,285,500 +5% 50% Other False Alarms (Bomb scares, etc.) 368,500 -5% 14% Total 2,547,000 -3% 100%
Source: NFPA's Survey of Fire Departments for 2017 U.S. Fire Experience. Note: Sums may not equal totals due to rounding errors.

Conclusions
The total number of fires continues to stay relatively steady, although some types of fires increased this year. In Figure 2, fires per thousand population, the frequency of fire incidents is much higher in communities with less than 5,000 population.
Since 1977, the number of home fires deaths has declined considerably, but the number of deaths per 1,000 fires has remained fairly flat, from a high of 9.7 deaths per 1,000 fires in 1996 to a low of 6.5 deaths per 1,000 fires in 2013 (See Figure 3). One can conclude that even though the number fires is decreasing, the risk of death in the event of a fire has remained relatively constant for the period 1977 to 2017. In Figure 4, the rate of civilian fire deaths per million population in communities with less than 5,000 people is significantly
worse than in larger communities. Since the majority of smaller communities are served predominately by volunteer fire departments, it may be helpful to invest in training, staffing and equipment in these departments to help reduce the death rates in these communities.
When looking at property loss adjusted for inflation (See Figure 5), the average loss per structure has remained relatively unchanged in recent years, with the exception of 2016, at around $5,000 per structure fire in 1977 dollars
In conclusion, although the frequency of fire incidents has gone down, the risk of death and property loss remains relatively constant when a fire incident occurs.
Conclusions
Section III

Fire Loss in the United States in 2017
17
Definition of Terms
Civilian: The term “civilian” includes anyone other than a firefighter, and covers public service personnel such as police officers, civil defense staff, non-fire service medical personnel, and utility company employees. Death: An injury that occurred as a direct result of a fire that is fatal or becomes fatal within one year. Fire: Any instance of uncontrolled burning. Includes combustion explosions and fires out on arrival. Excludes controlled burning (whether authorized or not), over pressure rupture without combustion, mutual aid responses, smoke scares, and hazardous responses (e.g., oil spill without fire). Fire department: A public organization that provides fire prevention, fire suppression and associated emergency and non-emergency services to a jurisdiction such as a county, municipality, or organized fire district. Injury: Physical damage that is suffered by a person as a direct result of fire and that requires (or should require) treatment by a practitioner of medicine (physician, nurse, paramedic, EMT) within one year of the incident (regardless of whether treatment was actually received), or results in at least one day of restricted activity immediately following the incident. Examples of injuries resulting from fire are smoke inhalation, burns, wounds and punctures, fractures, heart attacks (resulting from stress under fire condition), strains and sprains. Property Damage: Includes all forms of direct loss to contents, structure, machinery, a vehicle, vegetation or anything else involved in the fire but not indirect losses, such as business interruption or temporary shelter provisions. Structure: An assembly of materials forming a construction for occupancy or use in such a manner as to serve a specific purpose. A building is a form of structure. Open platforms, bridges, roof assemblies over open storage or process areas, tents, air-supported, and grandstands are other forms of structures. Vehicles, Highway and Other: Fires in these instances may have been associated with a crash; however, reported casualties and property loss should be the direct result of the fire only. Highway vehicles include any vehicle designed to operate normally on highways, e.g., automobiles, motorcycles, buses, trucks, trailers (not mobile homes on foundations), etc. Other vehicles include trains, boats and ships, aircraft, and farm and construction vehicles.

18
Table 16. 2017 U.S. Fire Rates, by Unit of Time
Property Class Fire per Hour Civilian Deaths per Day
Civilian Injuries per Day
Direct Dollar Damage per Hour
All Residential 43.3 7.4 29.9 $902,000
Homes1 40.8 7.2 29.0 $884,000 One- and -two family homes 30.0 6.3 20.5 $701,000 Apartments 10.8 0.9 8.6 $183,000 Other residential 2.5 0.2 0.8 $19,000
Public Assembly 1.7 $33,000
Educational 0.6 $6,000
Institutional 0.8 $5,000
Stores and Offices 2.1 $87,000
Industry, Utilities, and Defense 1.0 $57,000
Storage 3.1 $95,000
Special Structures 4.5 $38,000
All Non-Residential 13.7 0.3 3.5 $321,000
All Structures 57.0 7.7 33.3 $1,223,000
Vehicles 22.5 1.2 4.4 $233,000
Outside and other (not Structure or Vehicle) 71.1 0.4 0.8 $32,000
All Fires 150.6 9.3 40.2 $1,487,000*
(or 2.5 per
minute, or one every 24 seconds)
(or one every 155 minutes)
(or every 35.8
minutes)
(or $24,783 per minute, or $413
per second)
¹Homes are dwellings, duplexes, manufactured homes, apartments, rowhouses, townhouses, and condominiums. Direct property damage is expressed to the nearest thousand dollars. *Does not include Northern California wildfires with $10 billion property damage
Source: Fire Loss in the United States 2017, Ben Evarts, NFPA, September 2018 and previous reports in the series.