Embed Size (px)
Citation preview

Finnish Registry of Kidney Disease, FRKD
Quality Registries Meeting
Stockholm, December 8th-9th, 2014
presented by:
Carola Grönhagen-Riska (chair of the board)
in collaboration with:
Patrik Finne (leading physician)

Finnish Registry of Kidney Disease, FRKD
One of many national registries (our coverage ca. 97-99%)
One of a few registries supported by the Finnish government
Administered by the National Kidney Patient Association in cooperation with University hospital nephrologists and the Finnish Society of Nephrologists
Origin through co-operation with the pan-European EDTA-ERA registry
Documentation of Renal Replacement Therapies (RRT) of patients with End Stage Renal Disease (ESRD) since 1964

ESRD – RRT - Registries
ESRD leads to death or RRT, which is among the most demanding and expensive types of chronic therapies encompassing :
Dialysis (variations of hemodialysis or peritoneal dialysis) QoL of patients restricted Long term prognosis lower than in healthy persons due to primary disease, cardiovascular, infectious
and other treatment complications costs ca. 30000 – 50000 euros/year/patient
AND/OR
Transplantation from a living or dead donor QaL usually better Shortage of donors precludes optimal prognosis (”no waste of organs” from living or dead donors) Prognosis better (selected patient population), much improved immunosuppression costs usually much lower compared with dialysis, particularly after the second year
RRT is driven by prognostic factors and resources
Registration born out of specialty based self-detected needs
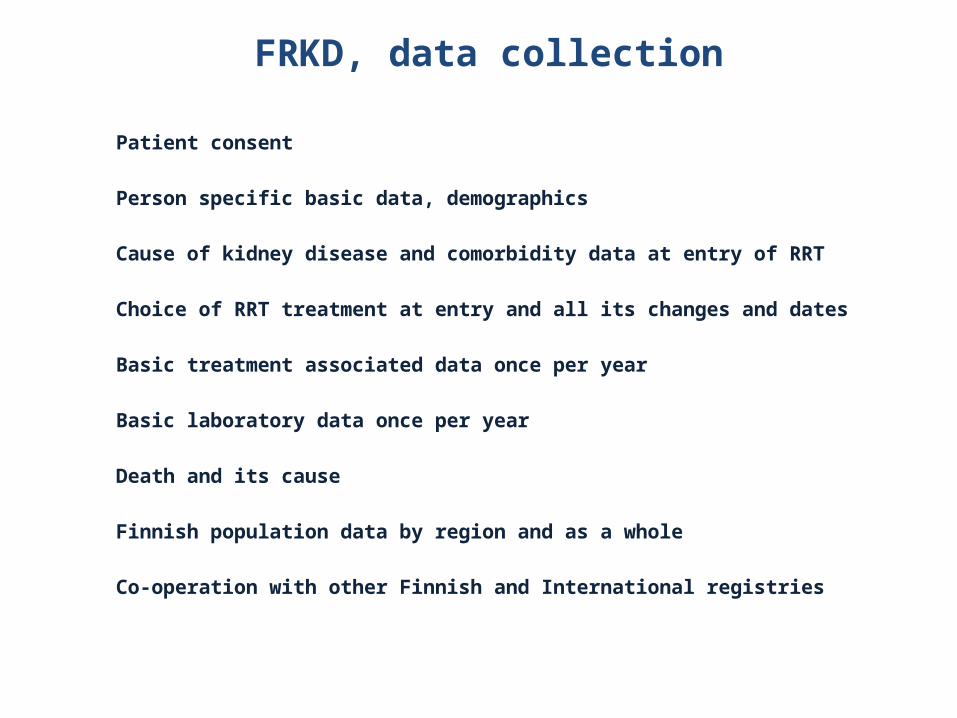
FRKD, data collection
Patient consent
Person specific basic data, demographics
Cause of kidney disease and comorbidity data at entry of RRT
Choice of RRT treatment at entry and all its changes and dates
Basic treatment associated data once per year
Basic laboratory data once per year
Death and its cause
Finnish population data by region and as a whole
Co-operation with other Finnish and International registries

South Western(0.72 mill.)
Western(1.23 mill.)
Southern (1.82 mill.)
Eastern(0.84 mill.)
Northern(0.73 mill.)
Renal replacement therapy (RRT) in Finland: 21 health care districts and five University hospital areas

RRT-registries – a global network

The process; examples
• ”Acceptance” (Incidence) rate for RRT
• Choice of dialysis mode• Prevalence of RRT• Choice of access• Dialysis dose• Transplant policy and
availability• Blood pressure levels• Laboratory values• Use of drugs
• Mortality• Graft function• Peritonitis• Other infections• Hospitalizations• QoL• Employment• Costs of care
Results; hard and softer
Variables of standard of care in RRT

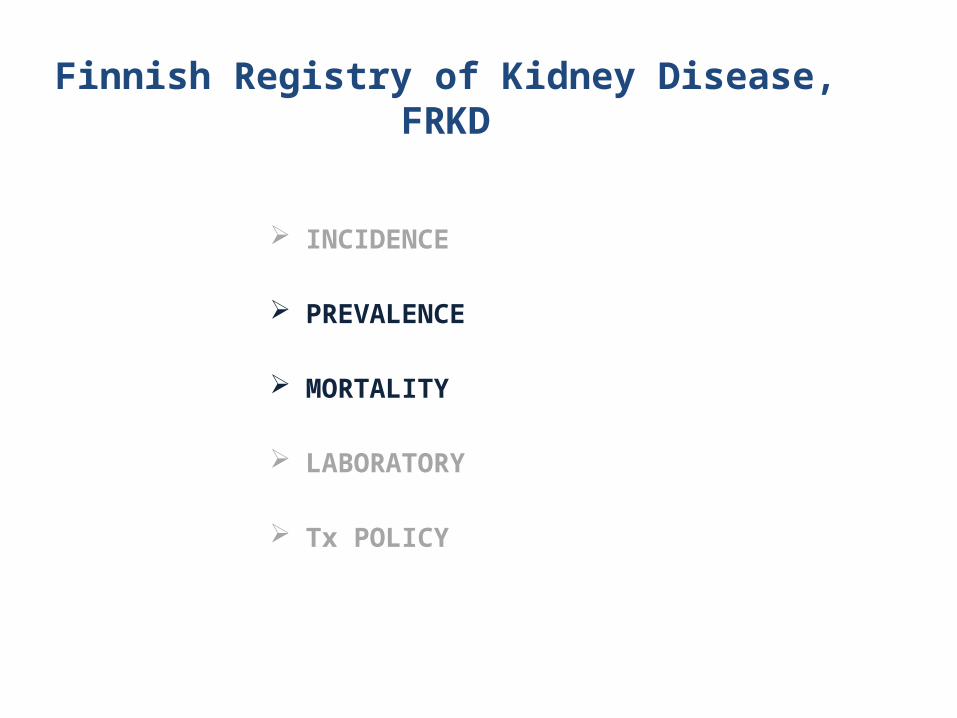
Finnish Registry of Kidney Disease, FRKD
INCIDENCE
PREVALENCE
MORTALITY
LABORATORY
Tx POLICY

Incidence of RRT in 1965-2011Great changes over time, FRKD
19651967
19691971
19731975
19771979
19811983
19851987
19891991
19931995
19971999
20012003
20052007
20092011
0
10
20
30
40
50
60
70
80
90
100
> 75 v
65-74 v
45-64 v
20-44 v
Incidence per million inhabitants
Year

Incidence of RRT by region, FRKD, 2013
Incidence/million inhabitants, age and sex adjusted
NorthernWesternWhole countrySouth Western EasternSouthern

Incidence of RRT in different diagnosis groups over time 1965-2013, FRKD
Type II diabetes
Type I diabetes
Polycystic kidneydegeneration
Amyloidosis, mostlysecondary to rheumatoid arthritis

1980-99
1975-79
1970-74
1965-69
0
1
2
3
4
5
6
7
8
9
10
0 5 10 15 20 25 30 35 40
Years from diagnosis of type 1 diabetes
Incidence rate of ESRD (cases/1000 patient-years)
Finne et al, JAMA 2005
Decreasing rate of RRT among type I diabetics in Finland

Incidence of RRT in different countries

Incidence of RRT in 1965-2011Great changes over time, FRKD
19651967
19691971
19731975
19771979
19811983
19851987
19891991
19931995
19971999
20012003
20052007
20092011
0
10
20
30
40
50
60
70
80
90
100
> 75 v
65-74 v
45-64 v
20-44 v
Incidence per million inhabitants
Year
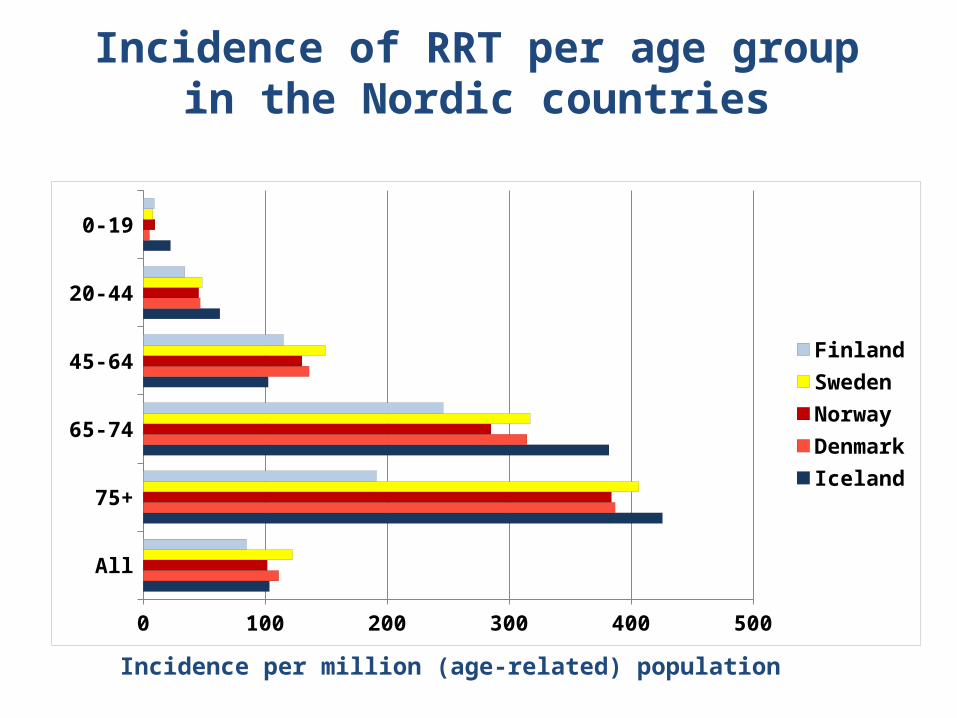
Incidence of RRT per age group in the Nordic countries
All
75+
65-74
45-64
20-44
0-19
0 100 200 300 400 500
FinlandSwedenNorwayDenmarkIceland
Incidence per million (age-related) population

Incidence of RRT in the age group 75+
FinlandSpain
United KingdomNorway
DenmarkSwedenIceland
The NetherlandsAustriaFrance
BelgiumGreece
0 100 200 300 400 500 600 700 800 900 1000
Incidence per million (age-related) population
ERA-EDTA Registry Annual Report 2011

Conclusions 1, FRKD
Incidence of RRT is fairly equally distributed among different regions
This century incidence has decreased.
This is also the trend among type I and type II diabetics, in spite of an increasing background population
The international difference in incidence seems concentrated to patients > 75 years
This phenomenon needs further studies
Finnish Registry of Kidney Disease, FRKD
INCIDENCE
PREVALENCE
MORTALITY
LABORATORY
Tx POLICY

Prevalence of RRT by treatment group , FRKD, 2013
In-center HD
Home HDAPDCAPD
Kidneytransplanted
Prevalence/million inhabitants

Prevalence of RRT by region, FRKD, 2013
Prevalence/million inhabitats, age and sex adjusted
South WesternSouthernWhole countryWestern EasternNorthern

Prevalence of RRT in different parts of the world

Calculated survival
20 30 40 50 60 70 800
10
20
30
40
50
60
70
Age
Expected survival (years)Annual Report
2010
General population
Kidney transplant patients
Dialysis patients

Mortality in RRT by region, FRKD, 2013
Mortality/1000 patient years, age and sex adjusted
NorthernEasternWesternWhole countrySouth Western Southern

0 1 2 3 4 5 6 7 8 9 10
0
0.1
0.2
0.3
0.4
0.5
0.6
0.7
0.8
0.9
1
PCKD
DM1
DM2Amyloidosis
Years after RRT start
Probability of survival, adjusted for age and sex
Probability of survival by diagnosis, FRKD

Conclusions 2, FRKD
Prevalence of RRT is fairly equally distributed among different regions
Prevalence has steadily increased due to improved survival
Mortality has decreased in all regions with some differences
International RRT mortality data are difficult to compare due to differences in background population and in distribution of diagnoses and mode of therapy (dialysis versus Tx)
How about a ”prevalence:incidence” ratio = ”yield”/ ”result” of administered RRT” ?

International ratio of prevalence/incidence ,FRKD Report 2009
RussiaUnited States
GreeceItaly
Belgium, Dutch speakingBelgium, French speaking
AustriaDenmark
New ZealandAustralia
The NetherlandsEstonia
United KingdomSweden
FranceIceland
NorwayJapanSpain
Finland
0 1 2 3 4 5 6 7 8 9

Finnish Registry of Kidney Disease, FRKD
INCIDENCE
PREVALENCE
MORTALITY
LABORATORY
Tx POLICY

Can we change prognosis?Adherence to guidelines
• Blood pressure• albumin• hemoglobin• urea• CRP• phosphorus• ionized Ca• PTH• lipids• Glucose balance

Distribution of hemoglobin values by hospital district , FRKD 2011
40 20
Hb < 100
20 40 60 80 100Proportion of dialysis patients (%)
Hb 100-119 Hb > 120
0
Country
Missingvalues:6/1774=0,3 %

Laboratory values and survival on dialysis,FRKD
Marker
AlbuminHbCRPPhosphorusCholesterolCreatinineIonized calciumUrea
*Adjusted for age and sex
Association withdeath
P-value*
<0.001<0.001<0.0010.0120.0460.0760.3470.528

Cholesterol and risk of death among dialysis patients
Cholesterol (mmol/l)
< 33-3,94-4,95-5,9> 6
1) Adjusted for age and sex2) Adjusted for age and sex , albumin and creatinine
n
27054344918384
RR1)
10,770,720,760,51
RR2)
10,960,830,830,46

Conclusions 3, FRKD
Undernourishment, anemia, on-going (vasculatory?) inflammation
and high phosphorus predict worse prognosis
Cholesterol is a fickle variable in RRT
- On one hand high values may indicate normal nutrition (good prognosis) and vice versa
- On the other hand might indicate cardiovascular risk, but not in the same way as in the general population - The issue is open
We have not detected great regional differences in adherence to guidelines, but repeated controls serve ”corrective measures”

Finnish Registry of Kidney Disease, FRKD
INCIDENCE
PREVALENCE
MORTALITY
LABORATORY
Tx POLICY

Different kidney transplant policy
Where are the living donors?

No. of kidney donors/1 mill. population
0 10 20 30 40 50 60 70
Norway NetherlandsAustriaFranceEstoniaU.K.Belgium
SwedenDenmarkFinlandIcelandRussia
Living / deceased donors

Time on dialysis before first kidney Tx
1990 1995 2000 2005 20100
1
2
3
4
Year of first kidney transplantation
Time on dialysis, years
50 % (median)
75 %
25 %

Helanterä et al, Transplantation 2014
Association between time on dialysis and patient survival after Tx 2000-2010
Probability of survival
0-11 mo.
12-23 mo.24-35 mo.
36-59 mo.
>60 mo.
Adjusted for:- Age- Sex- Kidney diagnosis- Donor status- Mode of dialysis- Mycophenolate- S-Alb before Tx No = 1638

0.5 1 1.5 2 2.5 3 3.5 4 4.5 5 5.50.5
5
1
2
345Risk ratio
0-11 12-23 24-35 36-59 > 60Months on dialysis
Time on dialysis and risk of death after Tx 2000-2010
Helanterä et al, Transplantation 2014

Conclusions 4, FRKD
Hardly any living donors
Great regional differences in organ retrieval (not shown)
Retrieval of dead donor organs could be improved
Long waiting time on dialysis increases mortality after Tx
Over the last years Much National and Registry activity to achieve change:
THIS YEAR OVER 20 PER CENT INCREASE in No. of KIDNEY TRANPLANTS !!!
When do registries serve quality aspects?
When they contain personal data on health care problems, their solutions and results
When they enable regional, national and international comparisons Document and analyze adherence to international guidelines When data and analyses lead to continual improvement of QoC When registries analyze the efficacy of given care
When they enable the identification of best care and how it is to be delivered
WE FEEL WE DO ! Thank You, FRKD