Embed Size (px)
Citation preview

FINITE ELEMENT BASED SIMULATION
OF PHASED COMPOSITE MATERIAL
FOR AIRCRAFT DESIGN
by
ADRIAN ALEGRE
BETH TODD, COMMITTEE CHAIRSTEVE SHEPARD
STEVE DANIEWICZ
A THESIS
Submitted in partial fulfillment of the requirementsfor the degree of Master of Science
in the Department of Mechanical Engineeringin the Graduate School of
The University of Alabama
TUSCALOOSA, ALABAMA
2019

Copyright Adrian Alegre 2019ALL RIGHTS RESERVED

ABSTRACT
Composite materials are frequently used in the aircraft and aerospace industries for
creating lighter, stronger and cheaper materials. In short, a composite material is a ma-
terial made up of two or more constituent materials that seek to exploit the most advan-
tageous aspects of each material. The design and development process of composite ma-
terials has seen little change in recent years despite an increasing necessity. The current
methodology for designing composites in the aircraft industry, described in Composite Ma-
terials Handbook [37], utilizes the ”Building-Block” approach. In this approach composites
are extensively tested, with tests rising in number and complexity, as the size of the com-
posite elements increases. This method is used due to the inability to predict composite
behaviors and can lead to high cost and time inefficiency.
This work presents an FEM based simulation of composite materials in order to cir-
cumvent large-scale testing by accurately predicting composite behavior. A common air-
craft composite material, Al/SiC, was replicated and verified against empirical data from
literature. Individual material simulations for Al and SiC were first developed and veri-
fied. Two subsequent analyses of the materials combined as a composite were performed in
which the percent weight fraction of SiC was varied. These simulations include Al as the
matrix and SiC as spherical inclusions. Analysis of stress-strain curves for the simulated
composite material demonstrated agreement with empirical data from the literature. This
thesis outlines the processes of geometry development, geometry implementation, simula-
tion set-up, and data analysis of the study.
ii

DEDICATION
This work is dedicated to my brother, Marco Alegre, without whom this work would
have been finished much sooner. Thank you for always being there for me and offering
many opportunities to divert my attention.
iii

LIST OF ABBREVIATIONS AND SYMBOLS
%wt.fr. Percent-Weight-Fraction
ρ Material density
m Body Mass
N Number of Specified Object
V Body Volume
Al Aluminum
Mg Magnesium
SiC Silicon-Carbide
CMC Ceramic Matrix Composite
F Force
FEM Finite Element Method
MD Material Designer
MMC Metal Matrix Composite
PMC Polymer Matrix Composite
RVE Representative Volume Element
SEM Scanning Electron Microscope
SFRC Short Fiber Reinforced Composite
UD Uni-Directional
iv

ACKNOWLEDGMENTS
This study was supported by the National Science Foundation’s (NSF) Louis Stokes
Alliance for Minority Participation (LSAMP) Fellowship. This fellowship assists under-
represented minority groups in obtaining graduate degrees in the STEM field. I would
like to thank Dr. Viola Acoff for accepting me as a recipient of this fellowship and offer-
ing guidance in various aspects of academia to ease the transition to graduate school. I
would also like to thank my committee members Dr. Beth Todd, Dr. Steve Shepard, and
Dr. Steve Daniewicz for their expertise and aid. I am thankful for Dr. Beth Todd’s con-
sistent support and counsel despite her regularly overloaded schedule. I would also like to
express gratitude to Dr. Steve Shepard for promptly addressing any and all concerns re-
lated to the department over the years and to Dr. Steve Daniewicz for his membership at
such short notice with informative feedback. Furthermore, I am appreciative of Dr. Vinu
Unnikrishnan for offering guidance and navigation on building simulation credibility, and
assisting with the basis of this research.
I would also like to take this opportunity to thank my personal mentor Dr. Laurie
Carrillo for offering advice and direction over the years. Without her knowledge and en-
couragement this research would not be possible. Lastly, I want to acknowledge my fel-
low graduate students, David Leech and Miranda Tanouye, for their support and feedback
throughout this process.
v

CONTENTS
ABSTRACT . . . . . . . . . . . . . . . . . . . . . . . . . . . . . . . . . . . . . . . . ii
DEDICATION . . . . . . . . . . . . . . . . . . . . . . . . . . . . . . . . . . . . . . . iii
LIST OF ABBREVIATIONS AND SYMBOLS . . . . . . . . . . . . . . . . . . . . . iv
ACKNOWLEDGMENTS . . . . . . . . . . . . . . . . . . . . . . . . . . . . . . . . . v
LIST OF TABLES . . . . . . . . . . . . . . . . . . . . . . . . . . . . . . . . . . . . . ix
LIST OF FIGURES . . . . . . . . . . . . . . . . . . . . . . . . . . . . . . . . . . . . x
CHAPTER 1 INTRODUCTION . . . . . . . . . . . . . . . . . . . . . . . . . . . . 1
CHAPTER 2 LITERATURE REVIEW . . . . . . . . . . . . . . . . . . . . . . . . . 4
2.1 Materials . . . . . . . . . . . . . . . . . . . . . . . . . . . . . . . . . . . . . 4
2.1.1 Aluminum . . . . . . . . . . . . . . . . . . . . . . . . . . . . . . . . . 4
2.1.2 Silicon-Carbide . . . . . . . . . . . . . . . . . . . . . . . . . . . . . . 5
2.2 Analysis . . . . . . . . . . . . . . . . . . . . . . . . . . . . . . . . . . . . . . 6
CHAPTER 3 MATHEMATICAL BACKGROUND . . . . . . . . . . . . . . . . . . 8
3.1 Basic Principles . . . . . . . . . . . . . . . . . . . . . . . . . . . . . . . . . . 8
3.2 Newtonian Equations of Motion . . . . . . . . . . . . . . . . . . . . . . . . . 9
3.2.1 Linear and Angular Momentum . . . . . . . . . . . . . . . . . . . . . 9
3.2.2 Stress . . . . . . . . . . . . . . . . . . . . . . . . . . . . . . . . . . . 10
3.2.3 Equations of Motion . . . . . . . . . . . . . . . . . . . . . . . . . . . 11
3.2.4 Principal Stress . . . . . . . . . . . . . . . . . . . . . . . . . . . . . . 12
3.3 Geometry of Deformation . . . . . . . . . . . . . . . . . . . . . . . . . . . . 13
vi

3.3.1 Strain and Strain-Displacement Relations . . . . . . . . . . . . . . . . 13
3.3.2 Small Strain Tensor . . . . . . . . . . . . . . . . . . . . . . . . . . . . 13
3.3.3 Finite Deformation and Strain Tensor . . . . . . . . . . . . . . . . . . 14
3.4 Stress-Strain Relations . . . . . . . . . . . . . . . . . . . . . . . . . . . . . . 14
3.4.1 Linear Elasticity . . . . . . . . . . . . . . . . . . . . . . . . . . . . . 14
3.4.2 Plasticity . . . . . . . . . . . . . . . . . . . . . . . . . . . . . . . . . 15
3.5 Rule of Mixtures . . . . . . . . . . . . . . . . . . . . . . . . . . . . . . . . . 17
3.6 Finite Element Method . . . . . . . . . . . . . . . . . . . . . . . . . . . . . . 18
CHAPTER 4 SIMULATION . . . . . . . . . . . . . . . . . . . . . . . . . . . . . . . 23
4.1 Material Parameters . . . . . . . . . . . . . . . . . . . . . . . . . . . . . . . 23
4.2 Mesh Convergence . . . . . . . . . . . . . . . . . . . . . . . . . . . . . . . . 24
4.3 Geometry . . . . . . . . . . . . . . . . . . . . . . . . . . . . . . . . . . . . . 27
4.3.1 Creating Geometry in MATLAB . . . . . . . . . . . . . . . . . . . . 27
4.3.2 Automated Drawing with JavaScript . . . . . . . . . . . . . . . . . . 30
4.4 Simulation Set Up . . . . . . . . . . . . . . . . . . . . . . . . . . . . . . . . 32
4.4.1 Assumptions . . . . . . . . . . . . . . . . . . . . . . . . . . . . . . . . 32
4.4.2 Loading and Constraints . . . . . . . . . . . . . . . . . . . . . . . . . 33
4.4.3 Analysis Settings and Output . . . . . . . . . . . . . . . . . . . . . . 34
CHAPTER 5 RESULTS AND DISCUSSION . . . . . . . . . . . . . . . . . . . . . . 37
5.1 Results . . . . . . . . . . . . . . . . . . . . . . . . . . . . . . . . . . . . . . . 37
5.2 Improvements . . . . . . . . . . . . . . . . . . . . . . . . . . . . . . . . . . . 41
5.3 Alternative Methods . . . . . . . . . . . . . . . . . . . . . . . . . . . . . . . 42
5.4 Future Work . . . . . . . . . . . . . . . . . . . . . . . . . . . . . . . . . . . . 44
CHAPTER 6 CONCLUSION . . . . . . . . . . . . . . . . . . . . . . . . . . . . . . 46
REFERENCES . . . . . . . . . . . . . . . . . . . . . . . . . . . . . . . . . . . . . . 47
vii

APPENDIX A Various ANSYS Plots of Modeled Bodies . . . . . . . . . . . . . . . . 53
APPENDIX B MATLAB Script for current and future work . . . . . . . . . . . . . . 58
APPENDIX C JavaScript Script for current and future work . . . . . . . . . . . . . 63
viii

LIST OF TABLES
4.1 Material Parameters for Constitutive Components in MMC . . . . . . . . . . 23
4.2 Relative error between desired weight fraction and actual weight fraction . . 29
ix

LIST OF FIGURES
1.1 Types of composites based on reinforcement shape and composite form (a)Layered Composites (b) Phased Composites . . . . . . . . . . . . . . . . . . 2
1.2 Flowchart representation of the “Building-Block” Approach . . . . . . . . . . 3
3.1 Position vector x and velocity vector v. Body force f dV acting on an ele-ment dV of volume and surface force TdS acting on an element dS of sur-face . . . . . . . . . . . . . . . . . . . . . . . . . . . . . . . . . . . . . . . . 9
3.2 The nine components of a stress tensor, where the first subscript denotesthe normal direction, and the second subscript indicates the direction of thestress. . . . . . . . . . . . . . . . . . . . . . . . . . . . . . . . . . . . . . . . 11
3.3 Summary of Stress-Strain Relations . . . . . . . . . . . . . . . . . . . . . . . 15
3.4 Isotropic hardening model: Demonstration of uniform increase in yield surface 16
3.5 Kinematic hardening model: Demonstration of shift in yield surface . . . . . 17
3.6 Demonstration of dividing a continuous shape into a finite number of ele-ments Number of elements increase with decrease in element size . . . . . . . 19
3.7 Example of mesh convergence where stress data converges to single valueNumber of elements increases from a to e with other parameters constant . . 19
3.8 Illustration of Cubic Element with nodes labeld A through H . . . . . . . . . 20
3.9 Example 1 of contour plot for strains within a complex geometry . . . . . . . 21
3.10 Example 2 of contour plot for strains within a complex geometry . . . . . . . 22
4.1 Representation of (a) Bi-Linear Isotropic Hardening and (b) Multi-LinearIsotropic Hardening correlation to data . . . . . . . . . . . . . . . . . . . . . 24
4.2 Mesh Convergence for simple cube with tetrahedron elements . . . . . . . . . 25
4.3 Representation of SOLID187 element geometry with nodes I through R . . . 26
x

4.4 Demonstration of compatibility of tetrahedron elements: Bounding box withspherical inclusions . . . . . . . . . . . . . . . . . . . . . . . . . . . . . . . . 26
4.5 Flow chart representation of MATLAB logic for point selection . . . . . . . . 28
4.6 Representative output from MATLAB of Sphere center points in boundingbox Sphere centers indicated in dark blue, bounding box in light blue . . . . 30
4.7 Finished composite geometry following automated procedure . . . . . . . . . 31
4.8 External planes used to cut away excess material Planes are scaled by boxdimensions. . . . . . . . . . . . . . . . . . . . . . . . . . . . . . . . . . . . . 32
4.9 Representation of Pure-Penalty calculation . . . . . . . . . . . . . . . . . . . 33
4.10 Demonstration of boundary conditions applied to composite geometry . . . . 34
4.11 Demonstration of stress calculations for the individual components . . . . . . 36
5.1 Comparison of empirical data from F. Shehata et al. vs FEM material modelfor Commercially Pure Al . . . . . . . . . . . . . . . . . . . . . . . . . . . . 38
5.2 Comparison of hand calculations to FEM material model for SiC . . . . . . . 39
5.3 Comparison of empirical data from F. Shehata et al. VS FEM materialmodel for 5%wt.fr. of SiC . . . . . . . . . . . . . . . . . . . . . . . . . . . . 40
5.4 Comparison of empirical data from F. Shehata et al. VS FEM materialmodel for 10%wt.fr. of SiC . . . . . . . . . . . . . . . . . . . . . . . . . . . . 40
5.5 Side by side comparison of all data F. Shehata et al. VS FEM model data . 41
5.6 Example of required periodicity in ANSYS Material Designer . . . . . . . . . 43
5.7 Example of non-periodic RVE that is not accepted by Material Designer . . 43
5.8 Example of aligned fiber generation for future work . . . . . . . . . . . . . . 44
5.9 Example of randomly oriented fiber generation for future work . . . . . . . . 45
A.1 Example 1 of scalability designed into modeling process with spheres . . . . 53
A.2 Example 2 of scalability designed into modeling process with spheres . . . . 54
A.3 Demonstration of inclusions embedded in bounding box geometry Boundingbox extruded as frozen material . . . . . . . . . . . . . . . . . . . . . . . . . 54
A.4 Example of scalability of number of inclusions and inclusion size . . . . . . . 55
xi

A.5 Demonstration of fiber modeling in MATLAB . . . . . . . . . . . . . . . . . 55
A.6 Left: All possible fibers in the given volume Right: Fibers that meet thenon-intersection criteria . . . . . . . . . . . . . . . . . . . . . . . . . . . . . 56
A.7 Demonstration of generating a 1-to-1 model from MATLAB to ANSYS . . . 56
A.8 Example 1 of scalability designed into modeling process with fibers . . . . . 57
A.9 Example 2 of scalability designed into modeling process with fibers . . . . . 57
xii

CHAPTER 1
INTRODUCTION
Composite materials are frequently used in the aircraft and aerospace industries for
creating lighter, stronger and cheaper materials. These materials can typically be found in
support structures, engine components, and even in the wings of various aircraft. Despite
the significance of these materials, little has been done to modernize their design process.
In short, a composite material is a material made up of two or more constituent ma-
terials that seeks to exploit the most advantageous aspects of each material. Common
attributes offered by composites are as follows: reduction in material weight, increased
stiffness and strength, decreased coefficient of thermal expansion, increased fatigue resis-
tance, increased resistance to corrosion, and ease of manufacturing for complex geome-
tries. There are two broad classifications of composite materials: Layered Composites, and
Phased Composites demonstrated in 1.1.
A subdivision of layered composites, laminated composites, consist of several layers, or
laminae, of material combined to create an overall laminate. Another subdivision of lay-
ered composites, sandwich composites, apply relatively thin but hard and strong material
around a light weight core. Comparatively phased composites consist of a continuous ma-
trix with reinforcements embedded in that matrix. These composites consist of three gen-
eral subdivisions: particulate, fiber, and flake phased composites based on reinforcement
type.
1

Figure 1.1: Types of composites based on reinforcement shape and composite form(a) Layered Composites (b) Phased Composites
The presented research of this study focuses solely on phased composites and any
mention of the general term composite from this point forward will refer to this class. In
this class of composite materials, purpose of the reinforcement is to provide structural sup-
port to the matrix. The matrix itself is a material that binds the reinforcements together
and transfers various loading and other conditions between them. A key feature of com-
posite materials is the mixing of constituents on a macro-scale. This allows for retention
of individual material properties while also exhibiting a combined response to loading or
other conditions. Composite materials are referenced by their matrix material followed
by their reinforcement material. For example a common composite Al/SiC, the focus of
this research, indicates a material with an Aluminum matrix and Silicon-Carbide rein-
forcements. Composites are also classified by matrix material. The above example is cat-
egorized as a Metal Matrix Composite (MMC). Other categories include Polymer Matrix
Composite (PMC) and Ceramic Matrix Composite (CMC), however, these composites are
not discussed further in this work.
2

Figure 1.2: Flowchart representation of the “Building-Block” Approach
The contemporary process for designing aircraft and aerospace materials is known as
the “Building-Block” method. This method, described in the 1999 Composite Materials
Handbook [37] and still used today, requires a multitude of tests beginning with the char-
acterization of individual constituent materials of composites, and continues all the way
up to the fully assembled component or technology. Each successive level of the “Building-
Block” approach requires separate testing of physically manufactured materials, increas-
ing in size and complexity. These numerous tests are then verified against simulation for
further assessment. This type of testing can lead to high cost and time inefficiency. The
purpose of this work is to present an alternative to the “Building-Block” approach when
designing Al/SiC composites for the aircraft and aerospace industry. This work provides
a comprehensive methodology for simulating Al/SiC composites for ease of testing and
behavior prediction. Simulation of Al/SiC is verified against data from literature for two
scenarios of varying SiC Percent-Weight-Fraction (%wt.fr.) Further details of simulation
and results are discussed in 4.3 and 5.1 respectively.
3

CHAPTER 2
LITERATURE REVIEW
2.1 Materials
2.1.1 Aluminum
In the late 19th century the large-scale implementation of the Hall-Heroult process led
to the commercialization of cast aluminum products. This process involved the electrol-
ysis of alumina-oxide from Bauxite, the primary ore from which aluminum is harvested,
using molten cryolite, an uncommon mineral [1]. This process yielded 99.5-99.8% purity
Aluminum. At the time cast Aluminum was used for small items such as cookware, clasps,
pins, etc. As the 19th century came to a close, the price for Aluminum declined and be-
came a practical material for engineering applications. This led to the emergence of three
primary markets in which Aluminum became a key material:
• Electrical Engineering
• Automotive Engineering
• Aviation and Aerospace
For the purposes of this study, the focus is placed on the Aviation and Aerospace indus-
try. In the initial days of aviation and flight, a majority of planes were constructed with
wooden beams of high strength. These beams were reinforced with steel wire to prevent
bending, and a smooth fabric was applied to wing and body surfaces to reduce aerody-
namic drag [22]. However the true innovation came from the Wright Brothers when they
4
constructed their engine crankcase from Aluminum in 1903 [9]. This provided the nec-
essary strength-to-weight ratio that allowed for prolonged flight, and ultimately revolu-
tionized aviation. Despite this demonstration, Aluminum was still too malleable and lack-
ing in strength to be considered a construction material for external parts. In 1901 Al-
fred Wilm discovered age hardening for Aluminum alloys [14] and perfected the process
by 1911 [53]. This revelation led to a drastic increase in strength, allowing Aluminum
to become a viable building material. Following the Wright Brothers innovation, aircraft
were constructed with internal, rigid truss supports surrounded by a smooth aerodynamic
surface[22]. The age hardened Aluminum allowed the external surface to be a critical part
of the plane strength, rendering the old truss supports unnecessary. This led to what is
known as the monocoque design, in which the external skin of the craft offers the primary
structural support [50]. With this airplane design, space within the aircraft was utilized
for passengers and cargo, resulting in a new form of travel and transportation. Today, Alu-
minum is still a crucial material in providing high strength for relatively low weight in air-
craft and is typically reinforced with other materials as a composite [50].
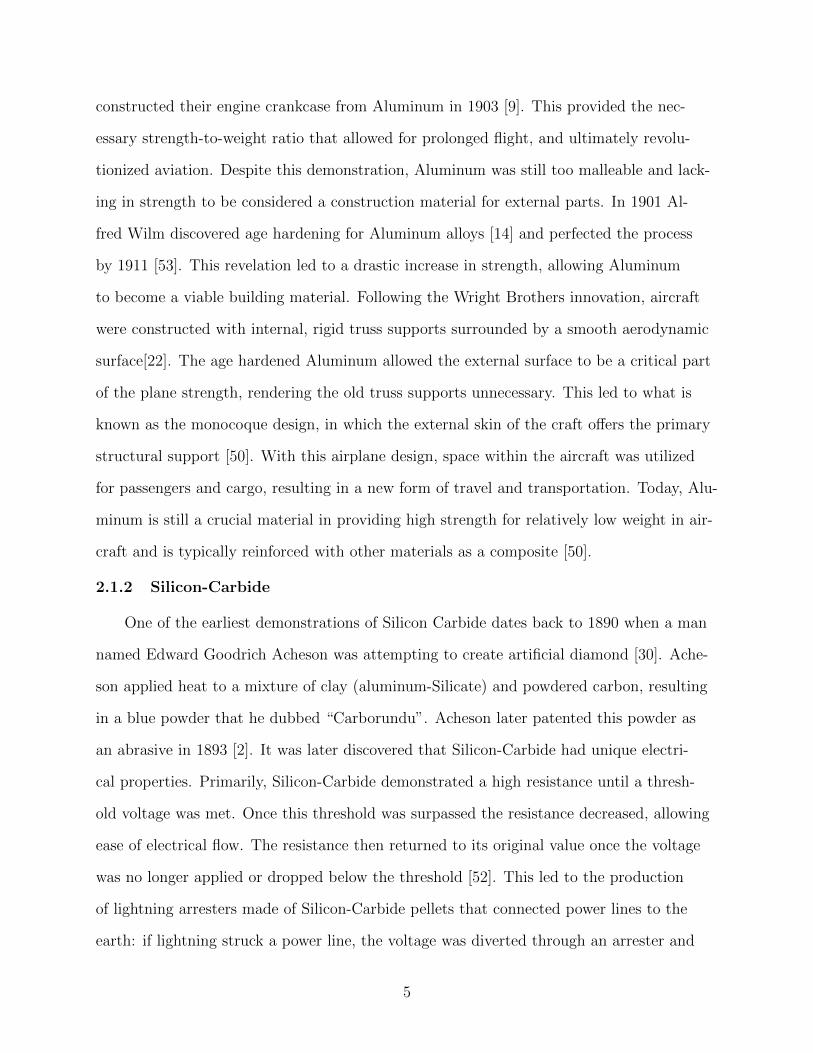
2.1.2 Silicon-Carbide
One of the earliest demonstrations of Silicon Carbide dates back to 1890 when a man
named Edward Goodrich Acheson was attempting to create artificial diamond [30]. Ache-
son applied heat to a mixture of clay (aluminum-Silicate) and powdered carbon, resulting
in a blue powder that he dubbed “Carborundu”. Acheson later patented this powder as
an abrasive in 1893 [2]. It was later discovered that Silicon-Carbide had unique electri-
cal properties. Primarily, Silicon-Carbide demonstrated a high resistance until a thresh-
old voltage was met. Once this threshold was surpassed the resistance decreased, allowing
ease of electrical flow. The resistance then returned to its original value once the voltage
was no longer applied or dropped below the threshold [52]. This led to the production
of lightning arresters made of Silicon-Carbide pellets that connected power lines to the
earth: if lightning struck a power line, the voltage was diverted through an arrester and
5

into the ground, preventing damage to the lines [6]. These electrical properties led Silicon-
Carbide to be the first semi-conductor material. The first electronic device to use this ma-
terial was a radio developed in 1906, by Henry Harrison Chase Dunwoody [13]. In more
recent years, Silicon-Carbide semi-conductors have allowed for the mass production of
high-speed, high-temperature, high-voltage electronics including MOSFETs (Metal-Oxide-
Semiconductor Field-Effect-Transistors), JFETs (Junction gate Field-Effect Transistor),
and SBDs (Schottky Barrier Diodes). These transistors have allowed for fast computation
on smaller and smaller computer chips [17]. Silicon-Carbide is also still used as an abrasive
in products such as sandpaper, grip tape, water-jet cutters, and many others [5]. In struc-
tural materials, it is included as a reinforcement to improve overall strength. In the 1990s
Silicon-Carbide was studied as a reinforcing material for turbine blades [40]. This increase
in strength is also utilized for safety equipment, such as bullet-proof vests, that employ
Silicon-Carbide disks [38]. The inclusion of Silicon-Carbide with Aluminum was found to
produce a light but strong composite material, suitable for the Aircraft and Aerospace in-
dustries [57].
2.2 Analysis
Current analyses of Al/SiC composites can be divided into two broad categories: Em-
pirical and Simulation based study. A common analysis of empirical studies is the exam-
ination of the affects of varied %wt.fr. of SiC, or other reinforcement materials, on the
mechanical behavior of the composite [18, 44, 46]. Other studies have included the wear
rate, and machinability of Al/SiC composites for specified %wt.fr. [21, 55]. Increasing the
wettability of SiC with Mg, and enhancing the overall bonding between the matrix and
reinforcement has also been an area if interest [46]. Simulated studies have examined key
principles that are more difficult to examine in empirical testing. A common analysis of
simulated studies is the examination of particle size, and intermediate distance between
particles on the stress behavior of a matrix as a 2D simulation [15, 26, 55]. 2D simula-
6

tions have also been employed for studies on reinforcement debonding (disconnect from
matrix) and crack propagation [28, 55]. A more accurate representation of SiC particles, as
straight-edged polygons, has been studied in 2D to determine peak stresses around parti-
cles [55]. While all of these simulated studies offer insight into the mechanical behavior of
Al/SiC composites, a common aspect is the simplification of composite geometries into a
2D plane-strain simulation [15, 21, 26, 55]. This study focused on developing a 3D simula-
tion of an Al/SiC composite. Data from F. Shehata et al [44] was utilized to verify simula-
tion results. This study included two simulations of varying SiC %wt.fr., based on testing
from [44]. Further details on the simulation parameters are discussed in chapter 4.3. Re-
sults of the simulation can be seen in chapter 5, and future study following this work is
discussed in 5.4. The overall purpose of this thesis was to develop a unique simulation to
be used in the design process of Al/SiC composites in the Aircraft and Aerospace indus-
tries.
7

CHAPTER 3
MATHEMATICAL BACKGROUND
3.1 Basic Principles
For solutions in either solid or continuum mechanics, there are 3 major considerations
that must be taken into account:
• Newtonian Equations of Motion
• Geometry of Deformation
• Stress-Strain Relations
The Newtonian equations of motion describe the principles of conservation of linear
and angular momentum for finite bodies (as opposed to a single point) and the associ-
ated concept of stress within those bodies. The geometry of deformation is the formula-
tion of strain with regard to the gradients of a displacement field for those bodies. Lastly,
the stress-strain relations help to characterize macroscopic behavior of the material under
analysis. These three principles are adequate to describe most mechanics solutions. Other
principles not discussed here included relations of diffusion of constituent materials, heat
and energy considerations, and others associated with electrical properties. Other neces-
sary formulation and considerations are also discussed in this chapter.
8

3.2 Newtonian Equations of Motion
3.2.1 Linear and Angular Momentum
Let x denote a position vector of a point in space relative to the origin of the refer-
ence frame with the components (x1, x2, x3) as shown in figure 3.1. Suppose a material
occupies the space illustrated in grey, where v = v(x, t) is the velocity vector of this mate-
rial at position x for time t. After an infinitesimal interval of dt, the material point will be
positioned at x + vdt.
Figure 3.1: Position vector x and velocity vector v. Body force f dV acting on anelement dV of volume and surface force TdS acting on an element dS of surface
At the basis of the Newtonian Equations of Motion are the principles of linear and
angular momentum such that:
P =
∫V
ρvdV (3.1)
and
H =
∫V
ρx× vdV, (3.2)
Where P and H denote linear and angular momentum respectively [39]. These integrals
9

describe the linear and angular momentum for a body that occupies a volume V at a point
in space x (in Cartesian coordinates) where ρ = ρ(x, t) is the mass density of the volume
at position x with respect to time. We can then describe the force and moment acting on
a body as:
F =∂P
∂t(3.3)
and
M =∂H
∂t. (3.4)
When dealing with bodies at static equilibrium, under the principle of conservation of mo-
mentum F = 0 and M = 0. This allows for the calculation of P and H for a given time
[39].
3.2.2 Stress
If F and M are assumed to be body forces f, defined as f dV acting on a volume ele-
ment of dV, and surface forces represented as a stress vector T, with TdS defined as sur-
face force acting over a surface element dS, as shown in figure 3.1, then linear and angular
momentum can be written as:
∫S
TdS +
∫V
fdV = F =∂P
∂t=
∫V
ρadV (3.5)
and ∫S
x×TdS +
∫V
x× fdV = M =∂H
∂t=
∫V
ρx× adV, (3.6)
Where a denotes acceleration as a = a(x, t). This leads to the classification of the stress
components, σij, which are nine quantities that vary with position and time, and act on
the surface of a body. For a given point x where a surface normal is oriented in the posi-
tive xi direction (i = 1,2 or 3 for 3D coordinates), then σi1,σi2, and σi3 are Cartesian com-
ponents of the stress vector T. Thus the stress σij is the stress in the j direction with re-
spect to the i face of the body.
10

Figure 3.2: The nine components of a stress tensor, where the first subscript denotesthe normal direction, and the second subscript indicates the direction of the stress.
These nine quantities make up the components of a 3 x 3 matrix that is the stress ten-
sor, T , such that:
T =
σ11 σ12 σ13
σ21 σ22 σ23
σ31 σ32 σ33
(3.7)
This matrix can be translated and transposed with relation to the original matrix, where
multiplication is such that if [A] = [B][C] then Aij = Bi1C1j +Bi2C2j +B13C3j [39].
3.2.3 Equations of Motion
Taking the multiplication properties of the stress tensor into consideration, we can
then define a second order tensor such that [σ′] = [a][σ][a]T . Using this expression in com-
bination with the divergence theorem:
∂σ1j∂x1
+∂σ2j∂x2
+∂σ3j∂x3
+ fj = ρaj (3.8)
11

where j = 1, 2, and 3. These equations are applicable when σij values are continuous and
differentiable, thus describing motions for a continuum. For further simplification, σij =
σji (i,j = 1, 2, and 3) as derived from angular momentum principles, causing the stress
tensor to be symmetric [39].
3.2.4 Principal Stress
The symmetry of the stress tensor leads to the crucial concept that for any point in
space, x, there exists a set of three mutually orthogonal directions where there is no shear
stress. These directions are referred to as the principle stress directions, and stresses along
these directions as the principle stresses. These stresses are the eigenvalues, s, while the
principle stress directions are the eigenvectors, n, such that: T = sn. A solution to this
eigenvalue problem is such that:
([σ]− s[I]) = −s3 + I1s2 + I2s+ I3 = 0 (3.9)
where:
I1 = tr[σ] (3.10)
I2 =1
2(σσ − I21 ) (3.11)
and
I3 = det[σ] (3.12)
Where tr is indicative of the trace, or sum, of diagonal elements in a matrix, and det is the
determinant of that [39].
12

3.3 Geometry of Deformation
3.3.1 Strain and Strain-Displacement Relations
The deformation of a solid structure implies its change in shape over a period of time.
This deformation, referred to as strain, is typically measured with respect to some refer-
ence configuration of the solid that is classified as an undeformed state. If the time mea-
sured when the reference configuration for a solid begins to exist is set to be zero, and
X describes the position vectors for that solid, then deformation may be described as
x = x(X, t) and it is known that x = x(X, 0) = X . Displacement can then be de-
scribed as a vector, u from the initial position to some arbitrary position at time t such
that u = x (X,t) - X. The extension for velocity and acceleration can then be made such
that v = ∂x(X, t)/∂t and a = ∂2x(X, t)/∂t2. These equations are applicable when the
reference configuration deformation is sufficiently small such that |∂ui/∂Xj| << 1. These
conditions are typically met in practice when examining sufficiently rigid materials that
elicit a linearized expression for strain [39].
3.3.2 Small Strain Tensor
For sufficiently small strains, εij, where |∂uk/∂Xl| << 1 for all k and l values, a set of
material strains can be defined as:
εij =1
2(∂uj∂Xi
+∂ui∂Xj
) (3.13)
where i, j = 1, 2, 3. Similar to the stress components, strain components are symmetric
such that εij = εji given the existance of principle strain directions (i.e. there exist three
mutually perpendicular directions at a given point). Despite this symmetry, it is impor-
tant to note that strains do not vary arbitrarily between various points in the body. This
is due to the fact the the six strain components are derived from three displacement com-
ponents [39].
13

3.3.3 Finite Deformation and Strain Tensor
Finite deformation theory is applicable to all bodies regardless of size. For a small
body deformed from initial vector dX to final vector dx during an arbitrary time t the de-
formation gradient is define as Fij = ∂xi(X, t)/∂Xj. The components of F can be describe
by a symmetric matrix [U ] and rigid rotation matrix [R] via the polar decomposition the-
ory such that: [F ] = [U ][R]. For example, a set of three fibers mutually orthogonal to one
another that have undergone stress in the principle direction are said to have undergone
extension strain without shear strain between them. In this case the deformed fibers are
said to have remained orthogonal but rotated by some operation [R] [39].
3.4 Stress-Strain Relations
3.4.1 Linear Elasticity
If a material is stressed within its linear elastic deformation region, then the stresses
and strains of that material are proportional to one another and scaled by a factor, E,
called Young’s Modulus. This relationship, known as Hooke’s law, is such that:
σ = Eε (3.14)
For a simple linear elastic bar loaded axially in a principle direction, the resulting strain
can be written as: ε11 = σ/E and ε22 = ε33 = −vε11 where ε12 = ε23 = ε31 = 0 due to
the loading being uniaxial in nature. The parameter v is a unit-less ratio of lateral strain
to axial strain called Poisson’s ratio that is often used to characterize behavior of various
types of materials. These equations most generally apply to isotropic solids that exhibit
the same material response regardless of the direction of stressing. Brittle materials, like
SiC, will only behave in the linear elastic region and tend to have a large Young’s Modu-
lus. This means that the material will exhibit large amounts of stress for small strains, as
shown in figure 3.3 [25].
14

3.4.2 Plasticity
Plasticity describes the deformation of a material beyond the region of a linear elas-
tic response in which the relationship between stress and strain is no longer linearly cor-
related. In a physical sense, the plastic region of a stress-strain curve for a given mate-
rial is indicative of when a material has undergone non-reversible deformation. The point
at which this occurs is referred to as the yield strength of a material. The plastic region
will have various characteristics dependent on material parameters and must be considered
when dealing with deformations expected to exceed the linear elastic region. This behavior
is typically observed in ductile materials, such as Al. For the purposes of this study, plas-
ticity is assumed to be rate-independent such that the strain rate of a material does not
effect the plastic response. If a material is stressed such that it reaches the plastic region it
is said to have undergone hardening as there is a reduction in the change of stress per unit
strain.
Figure 3.3: Summary of Stress-Strain Relations
In order to simulate this behavior there are two categories of hardening: Isotropic and
Kinematic hardening. The primary difference between these two hardening models, is the
way that they affect a material’s yield surface. In terms of mathematics, a yield surface
15

is described by a function called the yield function, F , where F < 0 is within the linear
elastic deformation region and F = 0 is in the plastic deformation region [25]. The most
utilized yield criteria is the von-Mises criteria that states:
F = (σ11 − σ22)2 + (σ22 − σ33)2 + (σ33 − σ11)2 − 2σ2y = 0 (3.15)
When plotted this function creates a plot known as the yield surface, where all points
within this surface are said to be in the elastic region. The primary difference between
isotropic and kinematic hardening is with respect to this surface. For isotropic harden-
ing, this yield surface exhibits uniform expansion in all directions when the yield strength
is reached. Comparitively, for kinematic hardening the yield surface remains unchanged
in sized, but shifts in position. A graphic representation for 2D hardening can be seen in
figure 3.4 and 3.5. For the purpose of this study an isotropic hardening model is used as it
is simple and adept for measuring a monotonic material response. For cyclic loading, both
the number of cycles and type of material must be taken into consideration when deter-
mining whether to use an isotropic or kinematic hardening model [25].
Figure 3.4: Isotropic hardening model: Demonstration of uniform increase in yieldsurface
16

Figure 3.5: Kinematic hardening model: Demonstration of shift in yield surface
3.5 Rule of Mixtures
Consider a composite of matrix material m with embedded reinforcements r. As dis-
cussed in 3.4.1 it can be assumed that σm = Emεm and that σr = Erεr. If the average
stress of the composite, σc, acts across the cross-sectional surface area of the Representa-
tive Volume Element (RVE), A, then it follows that:
σcA = σmAm + σrAr (3.16)
Taking the stress-strain relationship into consideration for the overall Young’s Modulus of
the composite, Ec it can then be said that:
Ec = ErAr
A+ Em
Am
A(3.17)
simplified to
Ec = ErVr + EmVr (3.18)
since the volume fraction of reinforcement can be written as Vr = Ar
Aas well as for the
matrix [31]. This general methodology is known as the Rule of Mixtures. This concept is
17

then extended such that:
σc = σrVr + σmVr (3.19)
and
εc = εrVr + εmVr (3.20)
These equations allow for calculation of a composite material’s predicted stress and strain
based on the volume fraction of its constituent materials. This methodology was utilized
to process data from the FEM analysis.
3.6 Finite Element Method
An engineer designing a mechanical structure will need to know how the structure
will behave under load. The equations deriving structural stresses are known, but they
cannot be directly solved for a complicated geometry such as a bridge, tower, walkway,
etc. However, these equations can be solved for very simple shapes. The finite element
method replaces a complex geometry with an approximately equivalent network of sim-
ple elements, as shown in figure 3.6. The overall pattern of elements is known as the finite
element mesh, and is a pattern unique to each engineering problem. The initial step is to
design this mesh by choosing how many, and what kind of elements to use. The accuracy
of the calculation depends on the number of elements in the mesh. As the number of ele-
ments increases, the average size of the elements decreases. The smaller the elements are
the more accurate the calculations will be and the more accurate the results. However,
more elements require more calculations. For efficiency purposes, just enough elements are
chosen to give an adequate accuracy while also ensuring a reasonable computation time.
This process, known as mesh convergence, compares data values of different mesh sizes in
order to determine where these values plateau and are no longer dependent on mesh size
(figure 3.7).
18

Figure 3.6: Demonstration of dividing a continuous shape into a finite number ofelements
Number of elements increase with decrease in element size
Figure 3.7: Example of mesh convergence where stress data converges to single valueNumber of elements increases from a to e with other parameters constant
Choosing the shape of the elements is also crucial for accuracy. The example in fig-
ure 3.8 illustrates 8 points, called nodes, which define a simple cubic element where there
is one node at each vertex of the cube. In general, these nodes have a total of 6 degrees of
freedom: translations and rotations in X, Y, and Z. The exceptions would be the nodes to-
wards the outside edge of the overall geometry that must abide by a given boundary con-
dition. These boundary conditions must be included to complete the description of the
physical problem so that the solution will be uniquely defined. Finally, the elastic proper-
ties of the simulated materials are specified as well as specific boundary conditions (load-
ing, fixed supports, rotations, etc.).
19

Figure 3.8: Illustration of Cubic Element with nodes labeld A through H
The mathematical analysis aims at deriving an equation to describe the whole sys-
tem. The analysis begins by expressing the displacement of any node as a function of its
coordinates in X, Y, and Z. In the above example there are 8 nodes in the element, giving
a total of 8 equations of displacement. These 8 equations form a matrix, that is now the
starting point for a series of steps based on the fundamental laws of mechanics. The initial
step relates displacements to stresses. From these stresses the strain energy is obtained,
followed by the derivation of potential energy. Finally, from minimum potential energy a
set of system equations is determined for the complete element. This new matrix is called
the stiffness matrix for the element. Instead of a single displacement, x, the matrix oper-
ates on the vector x whose components are the displacements for the whole element. This
same process is carried out for each element in the mesh.
The next step is to combine these matrices into a single, large matrix, representing
the stiffness of the whole system. Neighboring elements will have nodes in common, so val-
ues of these nodes will occur in matrices for both elements. The matrices are thus com-
bined using a simple merging technique. This process is done concurrently with the pro-
cess of solving for the overall system equation. This whole process is known as reduction.
As mentioned previously, the components of the matrices represent a set of simultaneous
equations. To reduce the size of the matrices, the first equation is solved and the solution
20

is substituted into subsequent equations.
This process repeats until the matrix for the next element is included to be solved.
When all of the element matrices have been solved, the resulting solution is for a single
node. This result acts as a key, working backwards through the equations of the system
until the displacement of every node in the system is obtained. From these results the cor-
responding stresses, strains, and other data can be easily calculated and represented in a
contour diagram, where intermediate values between nodes are calculated via interpola-
tion. An example can be seen in figures 3.9 and 3.10, where areas in blue represent low
strain and areas in red represent high strain.
Figure 3.9: Example 1 of contour plot for strains within a complex geometry
21

Figure 3.10: Example 2 of contour plot for strains within a complex geometry
22

CHAPTER 4
SIMULATION
4.1 Material Parameters
As discussed in chapter 2.2, data from [44] was utilized to develop an Al/SiC com-
posite simulation. In order to develop this simulation two individual sub-simulations for
Al and SiC were created. These simulations were then matched to experimental data and
theoretical calculations for the Al and SiC respectively, to verify accuracy of the mate-
rial replication. As described in [44], commercially pure Al is typically composed of 99%
Al, with small percentages of various other metals including Ti, Zn, Ni, Mg, Mn, Cu, Fe,
and Si. For the purposes of this study, these small percentages are not taken into consid-
eration when forming the base material as only the macroscopic response is needed. The
FEM software used for this study allows for user defined materials based on various input
parameters. The following parameters were utilized for material generation:
Parameter Al SiC Unit
Density 2.7 3.21 g/cm3
Young’s Modulus 68 410 GPaPoisson’s Ratio 0.33 0.18 −−−Yield Stress 35 1000 MPa
Table 4.1: Material Parameters for Constitutive Components in MMC
In order to accurately simulate the behavior of commercially pure Al, a multi-linear
isotropic hardening curve was utilized for the plastic deformation region. This curve was
developed by gathering empirical data from [44] and implementing plastic strain and stress
23

values in the proper fields. It is important to note that when using this feature, all data
points must be shifted such that the first stress-strain data point has an arbitrary plastic
strain of 0. This is because the initial point represents the yield strength of the material,
and points preceding it are calculated using the given Young’s Modulus. A multi-linear
curve was chosen as opposed to a bi-linear curve in order to increase predictive accuracy.
While the bi-linear curve uses the tangent modulus to make the general curve shape, the
multi-linear curve uses several line segments from specified data points as seen in figure
4.1.
Figure 4.1: Representation of (a) Bi-Linear Isotropic Hardening and(b) Multi-Linear Isotropic Hardening correlation to data
As described in [44], and is common for stir-casting composite generation [15, 18, 29,
46], particles are mixed into the molten matrix material as a fine powder. For this reason
stress-strain data for the SiC was not available to generate a material model. Instead, the
model for SiC was based on its general material properties associated with a theoretical
density of 3.1 g/cm3 since this information was provided. This model was then compared
against hand calculations via equation 3.14.
4.2 Mesh Convergence
After material simulations had been developed and verified against experimental data
and hand calculations, a mesh convergence study was performed to determine the opti-
24

mum mesh sizing for simulation. This was achieved by decreasing the maximum element
size and repeating simulation under identical conditions. The geometry for this study was
a solid cube without inclusions. The varied mesh sizes were then compared via the peak
stress value for that mesh size. Once the peak stress had converged to a general value, the
mesh sizing with the least number of elements and nodes for that value was chosen. The
average number of nodes was near 45,000 with variations depending on the number of in-
clusions.
Figure 4.2: Mesh Convergence for simple cube with tetrahedron elements
For this study the chosen element was a 3D, higher-order (having mid-side nodes)
element, that was tetrahedron in shape, including a total of 10 nodes with 3 degrees of
freedom each: translation in X, Y, and Z directions. This type of element, SOLID187
in the specified FEM software, is well suited to model plasticity, hyperelasticity, creep,
stress stiffening, large deflection, and large strain. This element is also capable of mod-
eling mixed formulation models including nearly incompressible elastoplastic materials,
and fully incompressible hyperelastic materials [41]. This element was primarily chosen for
its geometry as tetrahedrons allow for greater compatibility between straight and curved
edges. The need for this compatibility was derived from modeling particulate inclusions
as spheres. When dealing with FEM simulation it is imperative that all element nodes
25

contact directly with their neighboring nodes as skewed node pairs can produce mislead-
ing results. However, the SOLID187 elements demonstrated satisfactory node matching as
shown in figure 4.4.
Figure 4.3: Representation of SOLID187 element geometry with nodes I through R
Figure 4.4: Demonstration of compatibility of tetrahedron elements:Bounding box with spherical inclusions
26

4.3 Geometry
In order to simplify the model of particulates dispersed within a solid the particle ge-
ometry was generalized as a sphere. Due to the processing procedures utilized in [44], the
reported particle radius varied between 3 µm and 50 µm. For this reason the radii of spher-
ical inclusions was arbitrarily chosen to be 25 µm. It is assumed that the selected radius
size did not affect the simulated study excessively as there was general agreement between
simulation and empirical data. A combination of MATLAB and JavaScript was used in
tandom to create desired geometries in ANSYS’ DesignModeler. Details regarding this
process are discussed in the following subsections.
4.3.1 Creating Geometry in MATLAB
A MATLAB script was developed in order to generate the center points of the spher-
ical inclusions within a given bounding box geometry. In order to give the allusion of ran-
domly dispersed inclusions, the points were generated using a random number generator,
designed to operate within the bounding box geometry. This script included logic to pre-
vent the spheres from overlapping by creating a minimum distance criteria of twice the
radius. This script also allowed for the user to scale aspects of the model including bound-
ing box dimensions, sphere radius, and number of desired spheres. It is important to note,
however, that the script prevented excessive drawing of spheres via user input: the script
did not allow more spheres than could fit in the volume of the bounding box, under the
minimum distance criteria, regardless of the desired number of spheres. This added to the
inherent randomness of points as the desired number of spheres acted as an upper limit
rather than a specified amount. Points were also allowed to rest on the the outer edges of
the bounding box, where excess sphere volume extending beyond the bounding box was
extrude-cut away in the JavaScript step (demonstrated in appendix 4.8). Lastly, the gener-
ated points were output into a text file formatted to be readable by ANSYS’ DesingMod-
eler. This script can be found in appendix B.1.
27

Figure 4.5: Flow chart representation of MATLAB logic for point selection
The bounding box geometry was reduced to the smallest volume size possible to save
on computational effort, while still allowing for a reasonable number of spherical inclu-
sions. Based on SEM images from [44], a volume of 200 µm x 200 µm x 200 µm was deter-
mined to be sufficient. Calculation of spherical weight fraction first required calculation of
the total spherical volume. This was achieved by calculating the total mass of the bound-
ing box if it were created of pure Al. Then 5% and 10% of this mass was calculated for the
total mass of both weight fraction groups. The volume for each weight fraction group was
then calculated using the density of SiC. Lastly, the number of spheres was determined by
dividing this volume by the volume of a sphere with a radius of 25 µm.
VAl = Xdim ∗ Ydim ∗ Zdim
28

mAl = ρAl ∗ VAl
mSiC = (%wt.fr.) ∗mAl
VSiC =mSiC
ρSiC
VParticle =4
3πr2
NSpheres =VSiC
VParticle
This gave a guideline as to a minimum number of spheres needed to achieve the de-
sired percent weight fraction. As described above, center points for spheres were allowed
to rest on the edges of the bounding box, resulting in only a partial volume of a sphere
in some cases. For this reason multiple iterations took place until an optimal number of
center points was achieved for the desired percent weight fraction. Below in 4.2 is the cal-
culated data and relative error to percent weight fraction.
Desired Calculated vs Total Particle Actual Percent% wt.fr. Actual Points Weight % wt.fr. Error
5 % 6 - 6 1.11× 10⁻⁹ kg 5.1 % 2.00 %10 % 12 - 13 2.21× 10⁻⁹ kg 10.1 % 1.00 %
Table 4.2: Relative error between desired weight fraction and actual weight fraction
29

(a) MATLAB Demonstration 1(not used in simulation)
(b) MATLAB Demonstration 2(not used in simulation)
Figure 4.6: Representative output from MATLAB of Sphere center points in boundingbox
Sphere centers indicated in dark blue, bounding box in light blue
4.3.2 Automated Drawing with JavaScript
A JavaScript script was written to automate the drawing process in ANSYS’ Design-
Modeller. This script was written with the expectation of scalability in mind. For smaller
sized simulations such a script may not be necessary due to fewer inclusions, however, for
simulations that are much larger in size the inclusions may be too numerous for a user
to manually draw. This script utilizes the output text file generated by MATLAB as 3-
dimensional coordinates for center points of spheres with a uniform and fixed radius. A
for-loop parses through each data point and generates a sphere based on these coordinates
and a user-defined radius. Once this for-loop has completed, the bounding box geometry
is drawn and extruded as a frozen body to ensure that the spheres and matrix remain as
discrete volumes separate from one another.
The base sketch of the extruded box is designed to begin with its initial corner-point
at the origin of the X-Y-Z axes, and to extrude in the positive Y direction, normal to the
ZX-plane. Any volumes that fall outside the bounding box geometry are extrude cut away
30

by two external planes. These two planes are also scaled based on the user defined bound-
ing box geometry for varying dimension lengths.
Lastly, a boolean function was implemented to subtract sphere volumes from the bound-
ing box geometry while maintaining the spheres in their location. Another for-loop is uti-
lized such that the boolean is applied to all spheres within the data set and selected as
tool bodies, selecting the bounding box geometry last as the target body. The boolean is
then specified to subtract tool body volumes from the target body, while retaining tool
bodies in the geometry. This essentially creates pores within the matrix at the location
and volume of the spherical inclusions and fills those pores with the very same spheres.
The addition of the boolean function is necessary to ensure that sphere and matrix vol-
umes are discrete without overlap but that the spherical geometries are housed within the
matrix. This script can be found in appendix C.1.
(a) 19 Spherical Inclusions (b) 12 Spherical Inclusions
Figure 4.7: Finished composite geometry following automated procedure
31

Figure 4.8: External planes used to cut away excess materialPlanes are scaled by box dimensions.
4.4 Simulation Set Up
4.4.1 Assumptions
In order to simulate the composite material some boundary condition assumptions
were implemented in the set up. The first assumption was that the constitutive compo-
nents of composite were perfectly bonded. To simulate this bond, the contact pairs be-
tween the spherical inclusions and the matrix were assigned to a bonded-contact constraint.
This type of constraint uses a Pure-Penalty calculation method, in which a finite contact
force, Fn, is a function of normal contact stiffness, kn and penetration distance,xp, such
that Fn = kn × xp. The higher the contact stiffness, the lower the amount of penetra-
tion. Ideally, for an infinite kn the penetration would be equal to zero. However, this is
not numerically possible. As long as the penetration was reasonably small, it was consid-
ered negligible and results retained accuracy. This type of contact was applied to the outer
surfaces of the spheres and the corresponding contact surfaces inside the matrix.
32

Figure 4.9: Representation of Pure-Penalty calculation
Secondly, for Al/SiC composites it is understood that the SiC reinforcements typically
vary in size and geometry, with straight edges and a relatively low aspect ratio. Realistic
particles can have complex polygonal geometries, with a wide variety of features. In order
to save on computational time and effort, inclusions were assumed to be spherical with
identical radii, as previously mentioned at the beginning of, and throughout this chapter.
The final assumption was the size of the RVE. In order to improve computational effi-
ciency, the RVE was reduced to have the smallest volume possible while still maintaining
the desired reinforcement volume fraction. Based on SEM imaging, a model with a bound-
ing box of 400 µm x 400 µm x 400 µm was determined to be sufficient and then reduced to
18
in size at 200 µm x 200 µm x 200 µm. The %wt.fr. was also scaled accordingly, resulting
in fewer spheres required to meet the desired SiC content.
4.4.2 Loading and Constraints
Testing in [44] placed finalized composite samples under uniaxial tension and recorded
their stress-strain response. Replicating this procedure, the finalized geometry was placed
under tension using two basic boundary conditions. First, a fixed support was placed at
the base of the bounding box geometry, parallel to the ZX-plane. This condition prevents
translation and rotation in all directions. This condition was used primarily for its sim-
plicity and a broad application to all degrees of freedom. Secondly, a force was applied to
the top surface of the bounding box geometry, normal to the surface, in the positive Y-
direction. For the material verification of commercially pure Al, a force of 1.5× 10⁶µN was
33

applied. This value was chosen to produce a desired stress of 37.5 MPa, primarily to ex-
tend the Al material model beyond the linear elastic region (yield strength = 35 MPa,
table 4.1) and into the plastic deformation. This allowed for the demonstration of accu-
racy of the Al material model. Following the addition of spherical inclusions, the normal
force was reduced to values between 1.0× 10⁶µN and 1.2× 10⁶µN for better convergence.
As discussed in chapter 4.3.2, excess sphere volumes were cut away from the final model.
This resulted in various, circular cross-sectional faces at the boundaries where support
and loading conditions were applied. In order to reach simulation convergence successfully,
these faces were also included as part of the geometry selection on which the boundary
conditions were applied. Application of boundary conditions can be seen in figure 4.10.
(a) Force applied to top surface ofcomposite
geometry in the +Y-direction(b) Fixed support applied to bottom
surface of geometry parallel to ZX-plane
Figure 4.10: Demonstration of boundary conditions applied to composite geometry
4.4.3 Analysis Settings and Output
For this study a single load step was utilized with an end time of 1 second. As dis-
cussed in chapter 3.4.2, the plasticity for Al was determined to be rate independent, and
therefor a 1 second load step was sufficient. The analysis was broken down into sub-steps,
automated by the software, with the following conditions: initial number of sub-steps =
34

10, minimum number of sub-steps = 10, maximum number of sub-steps = 100. A sub-
step is a point within a load step in which a solution is calculated. This approach was
utilized as it provides more accurate results for non-linear, static analyses by gradually
applying loading and boundary conditions. This type of automation also allows the soft-
ware to choose where and when in the loading process to include more or fewer sub-steps,
as needed. By specifying the minimum number of sub-steps, no fewer than 10 data points
were output for the entire load step. When performing FEM analysis, it is crucial to ad-
equately determine how many sub-steps will be necessary for a simulation process as too
few steps can lead to inaccurate data and too many steps can cause convergence failure.
As a general method, it is suggested to begin with fewer sub-steps and slowly increase the
total number steps until the desired amount of data points is achieved. A direct solver was
chosen to perform the mathematical analysis of this system. A direct solver, as opposed to
an iterative solver, is based on the direct elimination of equations by factorization of ma-
trices. This type of solver is typically used for robustness and solving speed when dealing
with non-linear analysis, or for linear analysis with poorly shaped elements [43]. Lastly,
large deflection affects were taken into consideration. By including these affects the solver
was able to account for changes in material stiffness that were influenced by a change in
material shape. As a general rule, it is suggested that these affects are utilized unless it is
known that large deflection will not occur in the simulation environment [42]. Output data
for the simulation was in the form of stress and strain for the individual components of the
matrix and the reinforcements, where reinforcement data represented the whole group as
shown in figure 4.11. The stress and strains recorded were the Equivalent Total Strain and
Equivalent von-Mises Stress. This data was extracted into excel and further processed as
described in the results section.
35

(a) Matrix (b) Spherical Reinforcements
Figure 4.11: Demonstration of stress calculations for the individual components
36

CHAPTER 5
RESULTS AND DISCUSSION
The equivalent total strain and von-Mises stress were output by the FEA software
for the spherical reinforcements as a group and the matrix bounding box. These results
were then exported to excel where final values of stress and strain were calculated using
the Rule of Mixtures for each data point.
5.1 Results
Figure 5.1 illustrates the correlation between the aluminum material model and the
empirical data derived from F. Shehata et al [44]. Despite error near the yield point, the
overall data is in good agreement with the experimental data. However, this correlation
was expected due to the fact that this model utilized the empirical data as input argu-
ments to generate the plastic region. Figure 5.2 presents the comparison between hand
calculations and the FEM material model for SiC. These calculations were performed us-
ing equation (3.14) as a simple approach to model verification. As expected, the FEM ma-
terial model demonstrated good agreement with the calculated values for stress and strain.
Figure 5.3 demonstrates the agreement between the empirical data and FEM model for
the 5%wt.fr. geometry. While the Young’s Modulus was determined to be slightly lower,
and the ultimate strength slightly higher, the general trend of the FEM model matched
that of the experiment. It is speculated that these deviations in data may be due to a
lower number of spherical inclusions for the 5%wt.fr. geometry. This may have led to an
anisotropic response from the material, given the random dispersion of inclusions. How-
37

Figure 5.1: Comparison of empirical data from F. Shehata et al. vsFEM material model for Commercially Pure Al
ever, this hypothesis was not examined in further detail following the conclusion of the
study. The error between the curves measured 9.78% at its maximum and 4.2% on aver-
age. These values were derived from stress-strain output data of the reinforcements and
matrix separately, and then calculated using a weighted average following the form of
equations 3.19 and 3.20.
Figure 5.4 illustrates the correlation between empirical and simulation data for 10%wt.fr.
geometry. Similar to the previous geometry, the higher accuracy of this model may be
attributed to an increased number of spherical inclusions. This may have lead to a re-
sponse more reflective of an isotropic material. However, this hypothesis was also not stud-
ied further following the conclusion of the study. These data were also calculated using a
weighted averaged of individual stress-strain data points derived from the particles and
matrix, separately. The error between the FEM simulation and empirical data was mea-
sured to be 4.55% at its maximum, and 2.1% on average.
Figure 5.5 was included to present the data from the commercially pure Al, 5%wt.fr.,
38

Figure 5.2: Comparison of hand calculations to FEM material model for SiC
and 10% wt.fr. along side one another. Simulations were constrained to 5% and 10%wt.fr.
as these were the only two cases studied in F. Shehata et al [44]. However, given the gen-
eral trends of the data, this model may be able to accurately predict behaviors of Al/SiC
MMC with higher percentages of SiC. In the following sections, improvements and alterna-
tive approaches to the simulation of composite materials is discussed.
39

Figure 5.3: Comparison of empirical data from F. Shehata et al. VSFEM material model for 5%wt.fr. of SiC
Figure 5.4: Comparison of empirical data from F. Shehata et al. VSFEM material model for 10%wt.fr. of SiC
40

Figure 5.5: Side by side comparison of all dataF. Shehata et al. VS FEM model data
5.2 Improvements
The MATLAB script utilized for creating geometry is written such that the total num-
ber of spherical inclusions for a large volume fraction can be specified but are not guaran-
teed. This can be an issue if a known or desired large volume fraction is sought after for
study. Despite this aspect of the scripted logic, this method worked well in simulating the
exact number of reinforcements for relatively small volume fractions of less than 25%. Fur-
ther changes to this script would primarily address this volume fraction issue to increase
its applicability to a wider variety of composite simulations.
Secondly, the automation of geometry drawing by JavaScript required user input that
may lead to error. As stated above, the number of data points output from the MAT-
LAB portion can be unknown and will likely vary between consecutive script runs. This
requires the manual update of the JavaScript script following each run of the program.
Similarly, the bounding box geometry parameters and desired spherical radius must also
be updated if changed in the MATLAB script. Despite the fact that variables for these
41

values are included at the beginning of the JavaScript script, changing these variables may
be confusing if the user is unfamiliar with how to read and understand code. For this rea-
son, future iterations would likely include logic to extract this information from MATLAB
to JavaScript and reduce user input.
5.3 Alternative Methods
The FEM software utilized for this study, ANSYS, includes an analysis system de-
signed to homogenize the material response of RVE constituents for later use in subse-
quent analysis systems. This system, named Material Designer (MD), allows the user to
choose from predefined RVE geometries, including various lattice structures, UD aligned
fibers, UD aligned fibers with varying angles of inclination, randomly oriented short fibers,
woven fibers for laminae, and the ability to develop a user defined RVE. While this is an
innovative and unique tool, there are limitations to the MD system that ultimately led
to seeking other methods of simulation. Despite the fact that MD allows the user to de-
termine the aspect ratio, fiber radius, and volume fraction for fibers in the matrix, the
fibers themselves are ultimately not random. In order to satisfy the homogenization anal-
ysis conditions, the RVE must demonstrate periodicity at all boundaries. This results in
mirrored patterns of fibers, as shown in figure A.4. This condition also applies to user
defined RVE geometries, making it difficult to model truly random PMCs if a reinforce-
ment is drawn at the boundaries of the RVE ( see figure 5.7). The second caveat of the
MD system is the inability to model hyperelastic materials. While the MD system is able
to generate an averaged material response for constituent materials, it is ultimately only
able to do so for linearly elastic materials. This, unfortunately, excludes the MD system
from use in contemporary research that is primarily focused on PMC modeling with elas-
tomeric matrices. Lastly, the inconsistency in geometry sizing of MD makes it difficult for
the user to fit the system to their needs. The predefined RVE geometries are restricted
to the nano- and micro-scale, where as the user defined RVEs are limited to millimeters,
42

centimeters, and meters. For these reasons the approach to model the RVE in an external
software, MATLAB, was preferred.
(a) View of zx-plane from top face ofRVE
(b) View of zx-plane from bottom face ofRVE
Figure 5.6: Example of required periodicity in ANSYS Material Designer
Figure 5.7: Example of non-periodic RVE that is not accepted by Material Designer
43

Figure 5.8: Example of aligned fiber generation for future work
5.4 Future Work
Future work related to this thesis would include improving the fidelity between the
simulation and experimental data, and extending the study to different material and rein-
forcement types. Reducing the error of simulation results can likely be achieved via alter-
native mathematical methods of material homogenization. Production of simulated com-
posite materials may also be examined such that empirical data is derived from in-house
experiments and is easier to acquire. Other reinforcement types that were under consid-
eration, that may be utilized in future studies, include UD aligned fibers and randomly
oriented fibers for SFRC. An altered version of the MATLAB center point selection script,
designed for fibers, is included in B.2. This script similarly selects fibers in a bounding box
geometry under a minimum distance criteria. Intersections between fibers are mathemati-
cally determined using distance calculations. Only fibers without intersections are included
in a master list that is exported for further modeling. Examples can be seen in A.2.
44

Figure 5.9: Example of randomly oriented fiber generation for future work
45

CHAPTER 6
CONCLUSION
In conclusion, this thesis simulated the composite material, Al/SiC, that is typically
utilized in the Aircraft and Aerospace industries. This simulation was verified using empir-
ical data from a published study, with satisfactory agreement between FEA results and ex-
perimental results. While there is room for improvement, the methodology discussed here
offers a simplified approach to composite material simulation. Further work with respect
to this study would include reinforcements with different geometries, as well as different
materials for both the matrix and reinforcements. Composite materials offer several advan-
tages compared to their monolithic counter parts, but require extensive testing throughout
the design process. Composite simulations, such as the one presented in this research, can
be modified and altered to meet the needs of the user, reducing the time and cost associ-
ated with traditional design methods such as the “Building-Block” approach.
46

REFERENCES
[1] Production of aluminum: The Hall–Heroult Process. Historic Chemical Landmarks,1997.
[2] G. Acheson. U.S. Patent 492,767: ”Production of Artificial Crystalline CarbonaceousMaterial”, 1893.
[3] Aidy Ali, M. Housseini, and B. B. Sahari. A review and comparison on some rubberelasticity models. Journal of Scientific Industrial Research, 69:495–500, 2010.
[4] Reza Avazmohammadi and Pedro Ponte Castaneda. Macroscopic constitutive re-lations for elastomers reinforced with short aligned fibers: Instabilities and post-bifurcation response. Journal of Mechanics and Physics of Solids, 97:37–67, 2016.
[5] Narottam P. Bansal. Handbook of Ceramic Composites. Springer, 2005.
[6] Colin R. Bayliss. Transmission and distribution electrical engineering. Newnes, 1999.
[7] Lili Chen and Boqin Gu. Predicting fatigue damage in inter phase of short fiber re-inforced rubber composites under transverse load. Journal of Polymer Composites,pages 1455–1467, 2018.
[8] Lili Chen, Boqin Gu, Jiahui Tao, and Zhou Jianfeng. The average response andisotropy of 3d representative volume elements for random distributed short fibers rein-forced elastomer. Journal of Composite Structures, 216:279–289, 2019.
[9] Tom D. Crouch. 1908: The Year the Airplane Went Public. Air Space/Smithsonian,2008.
[10] J.R.M. D’Almeid and L.H. De Carvalho. An investigation on the tensile strength ofparticulate filled polymeric composites. Journal of Materials Science, 33:2215–2219,1998.
47

[11] Chayan Das, Naresh D. Bandsod, Bharat P. Kapgate, K. Rajkumar, and Amit Das.Incorporation of titania nanoparticles in elastomer matrix to develop highly reinforcedmulti-functional solution styrene butadiene rubber composites. Polymer, 162:1–10,2019.
[12] Joseph R. Davis. Aluminum and Aluminum Alloys. ASM International, 1993.
[13] Henry C. Dunwoody. U.S. Patent 837,616: ”Wireless telegraph system ”(silicon car-bide detector), 1906.
[14] Hornbogen Erhard. Hundred years of precipitation hardening. Journal of Light Met-als, 1(2):127–132.
[15] A.F. Fedotov. Interface model of the influence of particle size on the plastic deforma-tion resistance of particle-reinforced metal-matrix composites. Journal of Composites,Part B, 163:139–144, 2019.
[16] Johannes Gattinger, Michael Kirsch, and Benedikt Kirchebner. Flexible compositestrands through extrusion of crimped fiber reinforced thermoplastic elastomers. Mate-rials Today Communications, 15:43–47, 2018.
[17] Masafumi Horio, Yuzi Iizuka, and Yoshinari Iked. Packaging technologies for SiCpower modules. Fuji Electric Review, 58(2):75–78, 2012.
[18] Mohammed Imran and A.R. Anwar Khan. Characterization of Al-7075 metal matrixcomposites: a review. Journal of Materials Research and Technology, 691:10, 2019.
[19] I. Ivaneiko, V Toshchevikov, M. Saphiannikova, K.W. Stockelhuber, F. Petry,S. Wetermann, and G. Henrich. Modeling of dynamic-mechanical behavior of rein-forced elastomers using a multi-scale approach. Polymer, 82:356–265, 2016.
[20] Yunpeng Jiang and Hualin Fan. A micro-mechanics model for predicting the stress-strain relations of filled elastomers. Computational Materials Science, 67:104–108,2013.
[21] Sravan Kumar Josyula and Suresh Kumar Reddy Narala. Machinability enhancementof stir cast Al/TiC composites under cryogenic condition. Materials and Manufactur-ing Processes, 32(15):1764–1774.
48

[22] Josephy Jr. and Alven M. The American Heritage History of Flight. Simon Schuster,1962.
[23] Kinga Jurczuk and Andrzej Galeski. Thermoplastic elastomers reinforced withpoly(tetrafluoroethylene) nanofibers. European Polymer Journal, 80:58–69, 2016.
[24] M. Khafidh, D.J. Schipper, M.A. Masen, N. Vleugels, Dierkes W.K., and J.W.M. No-ordermeer. Friction and wear mechanism of short-cut aramid fiber and silica rein-forced elastomers. Journal of Wear, 428:481–487, 2019.
[25] Yung-Li Lee, Mark E. Barkey, and Hong-Tae Kang. Metal Fatigue Analysis Handbook.Butterworth-Heinemann, 2012.
[26] Qing Liu, Fu-gon Qi, Hai-min Ding, Xiao-Ling Fan, and Ying Yue. Distribution ofstress and strain between adjacent particles in particulate reinforced metal matrixcomposites. Transactions of Nonferrous Metals Society of China, 28(11):2314–2323,2018.
[27] Francisco Lopez Jimenez. On the isotropy of randomly generated representative vol-ume elements for fiber-reinforced elastomers. Journal of Composites, Part B, 87:33–39, 2016.
[28] Francisco Lopez Jimenez and Sergio Pellegrino. Constitutive modeling of fiber com-posites with a soft hyperelastic matrix. International Journal of Solids and Structures,49:635–647, 2012.
[29] Buragohain Manoj Kumar. Composite Structures : Design, Mechanics, Analysis,Manufacturing, and Testing. CRC Press, Boca Raton, FL, first edition, 2017.
[30] Charles F. Maybury. Notes, on carborundum. Journal of the American ChemicalSociety, 22(2):706–707, 1900.
[31] N.G. McCrum, C.P. Buckley, and C.B. Bucknall. Principles of Polymer Engineering.Oxford Science Publications, 1997.
[32] Kseniia A. Mokhireva, Alexander L. Svistkov, Vladislav N. Solod’ko, Lyudmila A.Komar, and Klaus W. Stockelhuber. Experimental analysis of the effect of carbonnanoparticles with different geometry on the appearance of anisotropy of mechanicalproperties in elastomeric composites. Polymer Testing, 59:46–54, 2017.
49

[33] Byung-Young Moon, Gyung-Ju Kang, Beom-Soo Kang, and James M. Kelly. Designand manufacturing of fiber reinforced elastomeric isolator for seismic isolation. Jour-nal of Materials Processing Technology, 130:145–150, 2002.
[34] Joaquın Moraleda, Javier Segurado, and Javier Llorca. Effect of interface fracture onthe tensile deformation of fiber reinforced elastomers. International journal of Solidsand Structures, 46:4287–4297, 2009.
[35] Joaquın Moraleda, Javier Segurado, and Javier Llorca. Finite deformation of incom-pressible fiber-reinforce elastomers: A computational micromechanics approach. Jour-nal of Mechanics and Physics of Solids, 57:1596–1613, 2009.
[36] H. Moussaddy, D. Therrialt, and M. Levesque. Assessment of existing and introduc-tion of a new and robust efficient definition of the representative volume element. In-ternational Journal of Solids and Structures, 50:3817–3828, 2013.
[37] U.S. Department of Defense. Composite Materials Handbook-MIL 17: Guidelines forCharacterization of Structural Materials. Technomic Publishing Co. and Inc.& Mate-rial Sciences Corporation, 1999.
[38] Department of Justice. Department of Justice: Findings on Dragon-Skin Body Armor.(NIJ07057), 2007.
[39] James Roberts Rice. Continuum mechanics of solids.
[40] David W. Richerson. Ceramics for turbine engines, 2003.
[41] Sharcnet-ANSYS. 3d 10 node tetrahedral structural solid: Solid187. ANSYS User’smanual: Selecting Element type, (2015).
[42] Sharcnet-ANSYS. Non-linear geometry options: Large deflection. ANSYS User’smanual: Including large-deflection effects in a static or full transient analysis,16.2(2014).
[43] Sharcnet-ANSYS. Selecting a solver. ANSYS User’s manual: Selecting Solver type,4.1(2015).
50

[44] Farouk Ahmed Shehata, Nahed ElMahallawy, Mohamed Arab, and Mohamed Agwa.Equal channel angular pressing of Al-SiC cmposites fabricated by stir casting. OpenJournal of Metal, 3(3):26–33.
[45] Morteza H. Siboni and Pedro Ponte Castaneda. Macroscopic response of particle-reinforced elastomers subjected to prescribed torques or rotation on the particles.Journal of Mechanics and Physics of Solids, 91:240–264, 2016.
[46] V.K. Singh, Sakshi Chauchan, P.C. Gope, and A.K. Chaudhary. Enhancement of wet-tability of aluminum based silicon carbide reinforced particulate metal matrix com-posite. High Temperature Materials and Processes, page 10, 2014.
[47] Maria Sonmez, Mihai Georgescu, Mihaela Valsan, Marius Radulescu, Denisa Ficai,Georgeta Voicu, Anton Ficai, and Laurentia Alexandrescu. Design and characteri-zation of polypropylene matrix/glass fibers composite materials. Journal of AppliedPolymer Science, 10(1002):4215342163, 2015.
[48] Matthias M. Stoll, Vincent Sessner, Manuel Kramar, Jakob Technau, and Kay A.Weidenmann. The effect of an elastomer interlayer thickness variation on the mechan-ical properties of fiber-metal-laminates. Journal of Composite Structures, 219:90–96,2019.
[49] Yves Termonia. Computer model for the elastic properties of short fiber and particu-late filled polymers. Journal of Materials Science, 22:1733–1736, 1987.
[50] U.S. Department of Transportation Federal Aviation Administration Standards Di-vision. Airframe and Powerplant Mechanics Airframe Handbook (Publication AC65-15A). US Department of Transportation, 1976.
[51] S.R.C. Vivekchand, U. Rmamurty, and C.N.R Rao. Mechanical properties of inor-ganic nano-wire reinforced polymer-matrix composites. Nanotechnology, 17:344–350,2006.
[52] Jerry C. Whitaker. The Electronics Handbook. CRC Press, 2005.
[53] Alfred Wilm. Physical metallurgical studies on magnesium-containing aluminum al-loys. Metallurgy: Magazine for metallurgy study, 8(8):225–227.
51

[54] Anthony J. Wolanski. Flexural behavior of reinforced and prestressed concrete beamsusing finite element analysis. Master’s thesis, Marquette University, May 2004.
[55] Qi Wu, Weixing Xu, and Liangchi Zhang. Microstrucure-based modelling of fractureof particulate reinforced metal matrix composites. Journal of Composites, Part B,163:384–392, 2019.
[56] Liming Xiong, Youping Chen, and James D. Lee. Atomistic simulation of mechanicalproperties of diamond and silicon carbide by a field theory. Journal of Modelling andSimulation in Materials Science and Engineering, 15:535–551, 2007.
[57] Cui Yan, Wang Lifeng, and Ren Jianyue. Multi-functional Al/SiC composites foraerospace applications. Chinese Journal of Aeronautics, 21(6):578–584, 2008.
52

APPENDIX A
VARIOUS ANSYS PLOTS OF MODELED BODIES
A.1 Current Study
Figure A.1: Example 1 of scalability designed into modeling process with spheres
53

Figure A.2: Example 2 of scalability designed into modeling process with spheres
Figure A.3: Demonstration of inclusions embedded in bounding box geometryBounding box extruded as frozen material
54

(a) Matrix (b) Inclusions
Figure A.4: Example of scalability of number of inclusions and inclusion size
A.2 Future Study
Figure A.5: Demonstration of fiber modeling in MATLAB
55

Figure A.6: Left: All possible fibers in the given volumeRight: Fibers that meet the non-intersection criteria
Figure A.7: Demonstration of generating a 1-to-1 model from MATLAB to ANSYS
56

Figure A.8: Example 1 of scalability designed into modeling process with fibers
Figure A.9: Example 2 of scalability designed into modeling process with fibers
57

APPENDIX B
MATLAB SCRIPT FOR CURRENT AND FUTURE WORK
B.1 MATLAB Point Selection
% This is a random Sphere generator designed to generate spheres within a
% given bounding box. The spheres are conditioned such that they do not
% intersect but may in fact touch on edge. The spheres are plotted inside a
% Cube using the plotcube.m script as a representation. While the number
% of spheres may be specified, only the spheres that meet the minimum distance
% criteria will be kept. The output is a Text File that can be read by
% DesignModeler. Units are consistent throughout script.
%
%Adrian Alegre, 2019
clear all;
close all;
%BOUNDING BOX
%--------------------------------------------------------------------------
%Length of bounding box in X, Y, and Z directions. Works best for cubes.
bx = 200;
by = 200;
bz = bx;
%--------------------------------------------------------------------------
%SPHERE STATS
%--------------------------------------------------------------------------
rad = 25; % Sphere Radius
numberOfPoints = 20; % Number of Spheres
minAllowableDistance = rad*2;
%--------------------------------------------------------------------------
%RANDOM POINT GENERATION
%--------------------------------------------------------------------------
% Generate array of random numbers for each axis
x = rand(1, 2000).*bx;
y = rand(1, 2000).*by;
z = rand(1, 2000).*bz;
% Set minimum distance between points and maximum number of points
58

% Initialize first point.
keeperX = x(1);
keeperY = y(1);
keeperZ = z(1);
% Add more points following initialized points
counter = 2;
for k = 2 : numberOfPoints
% Initialize each point one at a time for comparisson
thisX = x(k);
thisY = y(k);
thisZ = z(k);
% Calculate distance in 3D
distances = sqrt((thisX-keeperX).^2+(thisY-keeperY).^2+(thisZ-keeperZ).^2);
% Take minimum distance for comparisson
minDistance = min(distances);
% if distance is greater than allowed, then point is stored in keeper
% array. For this reason, not all points will be stored. A plateu of the
% # of points is determined by the min. allowable distance.
if minDistance >= minAllowableDistance
keeperX(counter) = thisX;
keeperY(counter) = thisY;
keeperZ(counter) = thisZ;
counter = counter + 1;
end
end
%--------------------------------------------------------------------------
%SPHERE PLOT
%--------------------------------------------------------------------------
% plot saved coords for visual representation
plotcube([1*bx 1*by 1*bz],[ 0 0 0],.2,[0 1 1]);
hold on;
plot3(keeperX, keeperY, keeperZ, ’b*’);
grid on;
%--------------------------------------------------------------------------
%FILE WRITE
%--------------------------------------------------------------------------
% Write coordinate values to text file including item ID & Counter
fileID = fopen(’pores.txt’,’w’);
for i = 1:counter-1
fprintf(fileID,’%li %li %12.8f %12.8f %12.8f\r\n’,i,1,keeperX(1,i),keeperY(1,i),keeperZ(1,i));
end
fclose(fileID);
%--------------------------------------------------------------------------
59

B.2 MATLAB Fiber Selection
%This is the 5th iteration of the Fiber Clean Test script. The purpose of
%this script is to determine whether two fibers intersect, and if so to
%remove them from the model. This script uses 2 auxillary functions:
%dcylinders takes the distance between cylinders, where > 0 =no overlap
% and < 0 =cylinder overlap; Cylinder draws physical representation
%of cylinders to verify that dcylinders is accurately describing the
%overlap. These are used in combination with the previous iterartions of
%fiber clean test. Units are consistent throughout the script.
%
%Adrian Alegre, 2019
clear all;
close all;
%BOUNDING BOX
%--------------------------------------------------------------------------
%Length of bounding box in X, Y, and Z directions. Works best for cubes.
bx = 5;
by = 15;
bz =bx;
%--------------------------------------------------------------------------
%FIBER STATS
%--------------------------------------------------------------------------
%Units are arbitrary, 1:1 ratio
rad = 0.1;% Fiber Radius
lf = by; % Fiber Length
nf = 50; % Number of Fibers
minAllowableDistance = rad*2;
%--------------------------------------------------------------------------
% FIBER GENERATION
%--------------------------------------------------------------------------
% Each random fiber needs 6 random numbers
% Here rns and rne are multiplied by bx because it is a cube, for shapes
% that do not have equal lengths on all sides this parameter must be
% changed to match necessary constraints.
rns = rand(nf,3)*bx; % Start
rne = rand(nf,3)*bz; % End
% Start Points
for i = 1:nf
rns(i,1) = rns(i,1);
rns(i,2) = rns(i,2);
end
% Unit Deltas
delta = zeros(nf,1);
for i = 1:nf
60

temp = rne(i,:);
delta(i) = norm(temp);
end
%--------------------------------------------------------------------------
%PRE-PROCESS PLOT
%--------------------------------------------------------------------------
%The following segment plots all cylinders within a cube (1 x 1 x 1 units).
%the generated plot shows all fibers regardless of crossing or intersect.
% plotcube([1*bx 1*by 1*bz],[ 0 0 0],.2,[0 1 1]);
% hold on;
for i = 1:nf
A = [rns(i,:); rne(i,:)];
B(:,:,i) = A(:,:);
% Cylinder(B(1,:,i),B(2,:,i),rad,20,’b’,1,1);
% hold on;
% grid on;
end
%-------------------------------------------------------------------------
%FIBER CLEAN UP
%--------------------------------------------------------------------------
%This segment parses through all of the fibers and calculates the distances
%between the fibers. If distance >=0 the fibers do not overlap. If distance
% < 0 then two fibers occupy the same volume. The number of overlaps is
%totalled and only the fibers with zero overlaps are kept in a master list
%of start and end points.
for i = 1:nf
for j = 1:nf
overLap(i,:,j) = dcylinders(B(:,:,i)’,rad,B(:,:,j)’,rad);
overLap(j,:,j) = 0;
tot(j,:) = sum(overLap(:,:,j)<0);
end
if tot(i) == 0
keepStart(i,:) = rns(i,:);
keepStart(keepStart(:,3)==0,:) = [];
keepEnd(i,:) = rne(i,:);
keepEnd(keepEnd(:,3)==0,:) = [];
end
end
%--------------------------------------------------------------------------
%POST-PROCESS PLOT & FILE WRITE
%--------------------------------------------------------------------------
% This segment plots the fibers that are kept in the master list following
% the requirement of no overlaps or intersections. The number of kept fibers
% is inversely proportional to the desired radius: i.e. the smaller the
% chosen radius, the greater the number of fibers that do not overlap. This
% segment also parses through all of the kept points and includes them into
% a .txt file to be read into ANSYS
61

figure;
plotcube([1*bx 1*by 1*bz],[ 0 0 0],.2,[0 1 1]);
hold on;
fileID = fopen(’fibers.txt’,’w’);
for i = 1:length(keepStart)
Cylinder(keepStart(i,:),keepEnd(i,:),rad,20,’b’,1,1);
hold on;
grid on;
axisDefX(i,:) = keepEnd(i,1) - keepStart(i,1);
axisDefY(i,:) = keepEnd(i,2) - keepStart(i,2);
axisDefZ(i,:) = keepEnd(i,3) - keepStart(i,3);
fprintf(fileID,’%1i %1i %12.8f %12.8f %12.8f\r\n’,i,1,keepStart(i,1),...keepStart(i,2), keepStart(i,3));
fprintf(fileID,’%1i %1i %12.8f %12.8f %12.8fr\n’,i,2, axisDefX(i,:),...
axisDefY(i,:),axisDefZ(i,:));
end
fclose(fileID);
62

APPENDIX C
JAVASCRIPT SCRIPT FOR CURRENT AND FUTURE WORK
C.1 Automated Sphere Drawing
//This script is designed to automate the drawing process of geometries
//in DesingModeler. The script takes input arguments for bounding box and
// fiber details, then calculates and draws the geometries appropriately.
//
//Adrian Alegre, 2019
//Define the edge length of the bounding box
var edgeLengthX = 200; //Length in X
var edgeLengthY = 200; //Length in Y
var edgeLengthZ = edgeLengthX; //Length in Z
var radius = 25.0; //Sphere Radius
var nSpheres = 13; //Number of Spheres output by MATLAB
//Import the points
var PF1 = agb.FPoint(agc.FPointConstruction, agc.FPointCoordinateFile);
PF1.Name = "pores";
PF1.CoordinateFile = "C:
Users
aalegre
Documents
MATLAB
pores.txt";
agb.Regen();
//=====================================================================================
//Generate spheres according to the sets of points from fp1 above
var i = 1;
while (PF1.GetPoint(i,1)) {var SP = ag.gui.CreatePrimitive(1);
//
SP.SphereRadius = radius;
//
ag.listview.ActivateItem("Sphere");
63

ag.listview.ItemValue = "SPHERE " + i ;
ag.listview.ActivateItem("Operation");
ag.listview.ItemValue = "Add Material";
ag.listview.ActivateItem("Origin Definition");
ag.listview.ItemValue = "Coordinates";
ag.listview.ActivateItem("FD3, Origin X Coordinate");
ag.listview.ItemValue = agb.GetPointX(PF1.GetPoint(i,1));
ag.listview.ActivateItem("FD4, Origin Y Coordinate");
ag.listview.ItemValue = agb.GetPointY(PF1.GetPoint(i,1));
ag.listview.ActivateItem("FD5, Origin Z Coordinate");
ag.listview.ItemValue = agb.GetPointZ(PF1.GetPoint(i,1));
agb.Regen();
//
i = i + 1;
}//=====================================================================================
// Create gel cube
var BO1 = ag.gui.CreatePrimitive(2);
ag.listview.ActivateItem("Box");
ag.listview.ItemValue = "Cube";
ag.listview.ActivateItem("Operation");
ag.listview.ItemValue = "Add Frozen";
ag.listview.ActivateItem("Diagonal Definition");
ag.listview.ItemValue = "Components";
ag.listview.ActivateItem("FD6, Diagonal X Component");
ag.listview.ItemValue = edgeLengthX;
ag.listview.ActivateItem("FD7, Diagonal Y Component");
ag.listview.ItemValue = edgeLengthY;
ag.listview.ActivateItem("FD8, Diagonal Z Component");
ag.listview.ItemValue = edgeLengthZ;
agb.Regen();
//
//=====================================================================================
//Create sketch to cut away
function planeSketchesOnly (p)
{//Plane
var ZXP1 = agb.GetZXPlane();
var YZP2 = agb.GetYZPlane();
p.Plane1 = ZXP1;
p.Plane2 = YZP2;
p.Origin1 = p.Plane1.GetOrigin();
p.XAxis1 = p.Plane1.GetXAxis();
p.YAxis1 = p.Plane1.GetYAxis();
p.Origin2 = p.Plane2.GetOrigin();
p.XAxis2 = p.Plane2.GetXAxis();
p.YAxis2 = p.Plane2.GetYAxis();
64

//Sketch
p.Sk1 = p.Plane1.NewSketch();
p.Sk1.Name = "Sketch1";
//Edges
//!!!!!SPECIFY EDGE LENGTHS OF BOUNDING BOX!!!!
{//Inner Box
p.Ln9 = Line(0.00000000, 0.00000000, edgeLengthZ, 0.00000000);
p.Ln10 = Line(edgeLengthZ, 0.00000000, edgeLengthZ, edgeLengthX);
p.Ln11 = Line(edgeLengthZ, edgeLengthX, 0.00000000, edgeLengthX);
p.Ln12 = Line(0.00000000, edgeLengthX, 0.00000000, 0.00000000);
//Outter Box
p.Ln13 = Line(-edgeLengthZ, -edgeLengthX, edgeLengthZ*2, -edgeLengthX);
p.Ln14 = Line(edgeLengthZ*2, -edgeLengthX, edgeLengthZ*2, edgeLengthX*2);
p.Ln15 = Line(edgeLengthZ*2, edgeLengthX*2, -edgeLengthZ, edgeLengthX*2);
p.Ln16 = Line(-edgeLengthZ, edgeLengthX*2, -edgeLengthZ, -edgeLengthX);
}//Dimensions and/or constraints
with (p.Plane1)
{//Dimensions
var dim;
dim = HorizontalDim(p.Ln11.Base, 1.00000000, 1.00000000,
p.Ln11.End, 0.00000000, 1.00000000,
0.36615130, 1.09137983);
if(dim) dim.Name = "H2";
dim = HorizontalDim(p.Ln15.Base, 1.25000000, 1.25000000,
p.Ln15.End, -0.25000000, 1.25000000,
0.42064846, 1.33228426);
if(dim) dim.Name = "H4";
dim = VerticalDim(p.Ln12.Base, 0.00000000, 1.00000000,
p.Ln12.End, 0.00000000, 0.00000000,
-0.09038732, 0.65207969);
if(dim) dim.Name = "V1";
dim = VerticalDim(p.Ln16.Base, -0.25000000, 1.25000000,
p.Ln16.End, -0.25000000, -0.25000000,
-0.34985290, 0.58181818);
if(dim) dim.Name = "V3";
dim = DistanceDim(p.Ln12, 0.00000000, 0.39240960,
p.Ln16, -0.44371298, 0.37704762,
-0.18486840, 0.21574679);
if(dim) dim.Name = "L5";
dim = DistanceDim(p.Ln9, 0.61626398, 0.00000000,
p.Ln13, 0.63162596, -0.32192262,
0.76988382, -0.14263115);
if(dim) dim.Name = "L6";
//Constraints
65

HorizontalCon(p.Ln9);
HorizontalCon(p.Ln11);
HorizontalCon(p.Ln13);
HorizontalCon(p.Ln15);
VerticalCon(p.Ln10);
VerticalCon(p.Ln12);
VerticalCon(p.Ln14);
VerticalCon(p.Ln16);
CoincidentCon(p.Ln9.End, 1.00000000, 0.00000000,
p.Ln10.Base, 1.00000000, 0.00000000);
CoincidentCon(p.Ln10.End, 1.00000000, 1.00000000,
p.Ln11.Base, 1.00000000, 1.00000000);
CoincidentCon(p.Ln11.End, 0.00000000, 1.00000000,
p.Ln12.Base, 0.00000000, 1.00000000);
CoincidentCon(p.Ln12.End, 0.00000000, 0.00000000,
p.Ln9.Base, 0.00000000, 0.00000000);
CoincidentCon(p.Ln9.Base, 0.00000000, 0.00000000,
p.Origin1, 0.00000000, 0.00000000);
CoincidentCon(p.Ln13.End, 1.25000000, -0.25000000,
p.Ln14.Base, 1.25000000, -0.25000000);
CoincidentCon(p.Ln14.End, 1.25000000, 1.25000000,
p.Ln15.Base, 1.25000000, 1.25000000);
CoincidentCon(p.Ln15.End, -0.25000000, 1.25000000,
p.Ln16.Base, -0.25000000, 1.25000000);
CoincidentCon(p.Ln16.End, -0.25000000, -0.25000000,
p.Ln13.Base, -0.25000000, -0.25000000);
}p.Plane1.EvalDimCons();
//Final evaluate of all dimensions and constraints in plane
//Sketch
p.Sk2 = p.Plane2.NewSketch();
p.Sk2.Name = "Sketch2";
//Edges
with (p.Sk2)
{//Inner Box
p.Ln9 = Line(0.00000000, 0.00000000, edgeLengthY, 0.00000000);
p.Ln10 = Line(edgeLengthY, 0.00000000, edgeLengthY, edgeLengthX);
p.Ln11 = Line(edgeLengthY, edgeLengthX, 0.00000000, edgeLengthX);
p.Ln12 = Line(0.00000000, edgeLengthX, 0.00000000, 0.00000000);
//Outter Box
p.Ln13 = Line(-edgeLengthY, -edgeLengthX, edgeLengthY*2, -edgeLengthX);
p.Ln14 = Line(edgeLengthY*2, -edgeLengthX, edgeLengthY*2, edgeLengthX*2);
p.Ln15 = Line(edgeLengthY*2, edgeLengthX*2, -edgeLengthY, edgeLengthX*2);
p.Ln16 = Line(-edgeLengthY, edgeLengthX*2, -edgeLengthY, -edgeLengthX);
}//Dimensions and/or constraints
66

with (p.Plane2)
{//Dimensions
var dim;
dim = HorizontalDim(p.Ln11.Base, 1.00000000, 1.00000000,
p.Ln11.End, 0.00000000, 1.00000000,
0.36615130, 1.09137983);
if(dim) dim.Name = "H2";
dim = HorizontalDim(p.Ln15.Base, 1.25000000, 1.25000000,
p.Ln15.End, -0.25000000, 1.25000000,
0.42064846, 1.33228426);
if(dim) dim.Name = "H4";
dim = VerticalDim(p.Ln12.Base, 0.00000000, 1.00000000,
p.Ln12.End, 0.00000000, 0.00000000,
-0.09038732, 0.65207969);
if(dim) dim.Name = "V1";
dim = VerticalDim(p.Ln16.Base, -0.25000000, 1.25000000,
p.Ln16.End, -0.25000000, -0.25000000,
-0.34985290, 0.58181818);
if(dim) dim.Name = "V3";
dim = DistanceDim(p.Ln12, 0.00000000, 0.39240960,
p.Ln16, -0.44371298, 0.37704762,
-0.18486840, 0.21574679);
if(dim) dim.Name = "L5";
dim = DistanceDim(p.Ln9, 0.61626398, 0.00000000,
p.Ln13, 0.63162596, -0.32192262,
0.76988382, -0.14263115);
if(dim) dim.Name = "L6";
//Constraints
HorizontalCon(p.Ln9);
HorizontalCon(p.Ln11);
HorizontalCon(p.Ln13);
HorizontalCon(p.Ln15);
VerticalCon(p.Ln10);
VerticalCon(p.Ln12);
VerticalCon(p.Ln14);
VerticalCon(p.Ln16);
CoincidentCon(p.Ln9.End, 1.00000000, 0.00000000,
p.Ln10.Base, 1.00000000, 0.00000000);
CoincidentCon(p.Ln10.End, 1.00000000, 1.00000000,
p.Ln11.Base, 1.00000000, 1.00000000);
CoincidentCon(p.Ln11.End, 0.00000000, 1.00000000,
p.Ln12.Base, 0.00000000, 1.00000000);
CoincidentCon(p.Ln12.End, 0.00000000, 0.00000000,
p.Ln9.Base, 0.00000000, 0.00000000);
CoincidentCon(p.Ln9.Base, 0.00000000, 0.00000000,
p.Origin2, 0.00000000, 0.00000000);
67

CoincidentCon(p.Ln13.End, 1.25000000, -0.25000000,
p.Ln14.Base, 1.25000000, -0.25000000);
CoincidentCon(p.Ln14.End, 1.25000000, 1.25000000,
p.Ln15.Base, 1.25000000, 1.25000000);
CoincidentCon(p.Ln15.End, -0.25000000, 1.25000000,
p.Ln16.Base, -0.25000000, 1.25000000);
CoincidentCon(p.Ln16.End, -0.25000000, -0.25000000,
p.Ln13.Base, -0.25000000, -0.25000000);
}p.Plane2.EvalDimCons();
//Final evaluate of all dimensions and constraints in plane
return p;
} //End Plane JScript function:planeSketchesOnly
//Call Plane JScript function
var ps1 = planeSketchesOnly (new Object());
//Finish
agb.Regen(); //To insure model validity
//End DM JScript
//=====================================================================================
//Extrude Cut Sides of spheres that extend beyond the edge of the cube
var ext1 = agb.Extrude(agc.Cut, ps1.Sk1, agc.DirSymmetric, agc.ExtendFixed,
edgeLengthY*1.1, agc.ExtendFixed, -1.5, agc.No, 0.0, 0.0)
agb.Regen();
var ext2 = agb.Extrude(agc.Cut, ps1.Sk2, agc.DirSymmetric, agc.ExtendFixed,
edgeLengthX, agc.ExtendFixed, -1.5, agc.No, 0.0, 0.0)
agb.Regen();
//=====================================================================================
//Boolean to subtract reinforcements from matrix
var nBoolean = ag.gui.CreateBoolean();
nBoolean.Name = "Perfect Bonding";
nBoolean.Operation = 2;
nBoolean.Preserve=ag.c.Yes;
ag.listview.ActivateItem("Target Bodies");
agb.ClearSelections();
body1 = ag.fm.Body(nSpheres);
agb.AddSelect(agc.TypeBody,body1);
ag.listview.ItemValue = "Apply";
agb.ClearSelections();
ag.listview.ActivateItem("Tool Bodies");
for(var i = 0;i<=nSpheres-1;i++){body = ag.fm.Body(i);
agb.AddSelect(agc.TypeBody,body);}ag.listview.ItemValue = "Apply";
ag.Regen;
68

C.2 Automated Fiber Drawing
//This script is designed to automate the drawing process of geometries in
//DesingModeler. The script takes input arguments for bounding box and
//fiber details, then calculates and draws the geometries appropriately.
//
//Adrian Alegre, 2019
//Define the edge length of the bounding box, radius of fibers, and
//number of fibers
var edgeLengthX = 20;
var edgeLengthY = 20;
var edgeLengthZ = edgLengthX;
var radius = 2;
//var nFibers = 9;
//Import the points
var PF1 = agb.FPoint(agc.FPointConstruction, agc.FPointCoordinateFile);
PF1.Name = "fibers";
PF1.CoordinateFile = "C:
Users
aalegre
Documents
MATLAB
fibers.txt";
var nFibers = PF1.length/2;
agb.Regen();
//Generate cylinders according to coordinates file
var i = 1;
while (PF1.GetPoint(i,1)) {var CY = ag.gui.CreatePrimitive(4);
//
ag.listview.ActivateItem("Cylinder");
ag.listview.ItemValue = "FIBER "+i;
ag.listview.ActivateItem("Operation");
ag.listview.ItemValue = "Add Material";
ag.listview.ActivateItem("FD3, Origin X Coordinate");
ag.listview.ItemValue = agb.GetPointX(PF1.GetPoint(i,1));
ag.listview.ActivateItem("FD4, Origin Y Coordinate");
ag.listview.ItemValue = agb.GetPointY(PF1.GetPoint(i,1));
ag.listview.ActivateItem("FD5, Origin Z Coordinate");
ag.listview.ItemValue = agb.GetPointZ(PF1.GetPoint(i,1));
ag.listview.ActivateItem("FD6, Axis X Component");
ag.listview.ItemValue = agb.GetPointX(PF1.GetPoint(i,2));
ag.listview.ActivateItem("FD7, Axis Y Component");
ag.listview.ItemValue = agb.GetPointY(PF1.GetPoint(i,2));
ag.listview.ActivateItem("FD8, Axis Z Component");
69

ag.listview.ItemValue = agb.GetPointZ(PF1.GetPoint(i,2));
ag.listview.ActivateItem("FD10, Radius (>0)");
ag.listview.ItemValue = radius;
//
i = i+1;
}//=====================================================================================
// Create gel cube
var BO1 = ag.gui.CreatePrimitive(2);
ag.listview.ActivateItem("Box");
ag.listview.ItemValue = "Cube";
ag.listview.ActivateItem("Operation");
ag.listview.ItemValue = "Add Frozen";
ag.listview.ActivateItem("Diagonal Definition");
ag.listview.ItemValue = "Components";
ag.listview.ActivateItem("FD6, Diagonal X Component");
ag.listview.ItemValue = edgeLengthX;
ag.listview.ActivateItem("FD7, Diagonal Y Component");
ag.listview.ItemValue = edgeLengthY;
ag.listview.ActivateItem("FD8, Diagonal Z Component");
ag.listview.ItemValue = edgeLengthZ;
agb.Regen();
//
//=====================================================================================
//Create sketch to cut away
function planeSketchesOnly (p)
{//Plane
var XYP1 = agb.GetXYPlane();
var YZP2 = agb.GetYZPlane();
p.Plane1 = XYP1;
p.Plane2 = YZP2;
p.Origin1 = p.Plane1.GetOrigin();
p.XAxis1 = p.Plane1.GetXAxis();
p.YAxis1 = p.Plane1.GetYAxis();
p.Origin2 = p.Plane2.GetOrigin();
p.XAxis2 = p.Plane2.GetXAxis();
p.YAxis2 = p.Plane2.GetYAxis();
//Sketch
p.Sk1 = p.Plane1.NewSketch();
p.Sk1.Name = "Sketch1";
//Edges
//!!!!!SPECIFY EDGE LENGTHS OF BOUNDING BOX!!!!
with (p.Sk1)
{//Inner Box
p.Ln9 = Line(0.00000000, 0.00000000, edgeLengthZ, 0.00000000);
70

p.Ln10 = Line(edgeLengthZ, 0.00000000, edgeLengthZ, edgeLengthX);
p.Ln11 = Line(edgeLengthZ, edgeLengthX, 0.00000000, edgeLengthX);
p.Ln12 = Line(0.00000000, edgeLengthX, 0.00000000, 0.00000000);
//Outter Box
p.Ln13 = Line(-edgeLengthZ, -edgeLengthX, edgeLengthZ*2, -edgeLengthX);
p.Ln14 = Line(edgeLengthZ*2, -edgeLengthX, edgeLengthZ*2, edgeLengthX*2);
p.Ln15 = Line(edgeLengthZ*2, edgeLengthX*2, -edgeLengthZ, edgeLengthX*2);
p.Ln16 = Line(-edgeLengthZ, edgeLengthX*2, -edgeLengthZ, -edgeLengthX);
}//Dimensions and/or constraints
with (p.Plane1)
{//Dimensions
var dim;
dim = HorizontalDim(p.Ln11.Base, 1.00000000, 1.00000000,
p.Ln11.End, 0.00000000, 1.00000000,
0.36615130, 1.09137983);
if(dim) dim.Name = "H2";
dim = HorizontalDim(p.Ln15.Base, 1.25000000, 1.25000000,
p.Ln15.End, -0.25000000, 1.25000000,
0.42064846, 1.33228426);
if(dim) dim.Name = "H4";
dim = VerticalDim(p.Ln12.Base, 0.00000000, 1.00000000,
p.Ln12.End, 0.00000000, 0.00000000,
-0.09038732, 0.65207969);
if(dim) dim.Name = "V1";
dim = VerticalDim(p.Ln16.Base, -0.25000000, 1.25000000,
p.Ln16.End, -0.25000000, -0.25000000,
-0.34985290, 0.58181818);
if(dim) dim.Name = "V3";
dim = DistanceDim(p.Ln12, 0.00000000, 0.39240960,
p.Ln16, -0.44371298, 0.37704762,
-0.18486840, 0.21574679);
if(dim) dim.Name = "L5";
dim = DistanceDim(p.Ln9, 0.61626398, 0.00000000,
p.Ln13, 0.63162596, -0.32192262,
0.76988382, -0.14263115);
if(dim) dim.Name = "L6";
//Constraints
HorizontalCon(p.Ln9);
HorizontalCon(p.Ln11);
HorizontalCon(p.Ln13);
HorizontalCon(p.Ln15);
VerticalCon(p.Ln10);
VerticalCon(p.Ln12);
VerticalCon(p.Ln14);
VerticalCon(p.Ln16);
71

CoincidentCon(p.Ln9.End, 1.00000000, 0.00000000,
p.Ln10.Base, 1.00000000, 0.00000000);
CoincidentCon(p.Ln10.End, 1.00000000, 1.00000000,
p.Ln11.Base, 1.00000000, 1.00000000);
CoincidentCon(p.Ln11.End, 0.00000000, 1.00000000,
p.Ln12.Base, 0.00000000, 1.00000000);
CoincidentCon(p.Ln12.End, 0.00000000, 0.00000000,
p.Ln9.Base, 0.00000000, 0.00000000);
CoincidentCon(p.Ln9.Base, 0.00000000, 0.00000000,
p.Origin1, 0.00000000, 0.00000000);
CoincidentCon(p.Ln13.End, 1.25000000, -0.25000000,
p.Ln14.Base, 1.25000000, -0.25000000);
CoincidentCon(p.Ln14.End, 1.25000000, 1.25000000,
p.Ln15.Base, 1.25000000, 1.25000000);
CoincidentCon(p.Ln15.End, -0.25000000, 1.25000000,
p.Ln16.Base, -0.25000000, 1.25000000);
CoincidentCon(p.Ln16.End, -0.25000000, -0.25000000,
p.Ln13.Base, -0.25000000, -0.25000000);
}p.Plane1.EvalDimCons();
//Final evaluate of all dimensions and constraints in plane
//Sketch
p.Sk2 = p.Plane2.NewSketch();
p.Sk2.Name = "Sketch2";
//Edges
with (p.Sk2)
{//Inner Box
p.Ln9 = Line(0.00000000, 0.00000000, edgeLengthY, 0.00000000);
p.Ln10 = Line(edgeLengthY, 0.00000000, edgeLengthY, edgeLengthX);
p.Ln11 = Line(edgeLengthY, edgeLengthX, 0.00000000, edgeLengthX);
p.Ln12 = Line(0.00000000, edgeLengthX, 0.00000000, 0.00000000);
//Outter Box
p.Ln13 = Line(-edgeLengthY, -edgeLengthX, edgeLengthY*2, -edgeLengthX);
p.Ln14 = Line(edgeLengthY*2, -edgeLengthX, edgeLengthY*2, edgeLengthX*2);
p.Ln15 = Line(edgeLengthY*2, edgeLengthX*2, -edgeLengthY, edgeLengthX*2);
p.Ln16 = Line(-edgeLengthY, edgeLengthX*2, -edgeLengthY, -edgeLengthX);
}//Dimensions and/or constraints
with (p.Plane2)
{//Dimensions
var dim;
dim = HorizontalDim(p.Ln11.Base, 1.00000000, 1.00000000,
p.Ln11.End, 0.00000000, 1.00000000,
0.36615130, 1.09137983);
if(dim) dim.Name = "H2";
72

dim = HorizontalDim(p.Ln15.Base, 1.25000000, 1.25000000,
p.Ln15.End, -0.25000000, 1.25000000,
0.42064846, 1.33228426);
if(dim) dim.Name = "H4";
dim = VerticalDim(p.Ln12.Base, 0.00000000, 1.00000000,
p.Ln12.End, 0.00000000, 0.00000000,
-0.09038732, 0.65207969);
if(dim) dim.Name = "V1";
dim = VerticalDim(p.Ln16.Base, -0.25000000, 1.25000000,
p.Ln16.End, -0.25000000, -0.25000000,
-0.34985290, 0.58181818);
if(dim) dim.Name = "V3";
dim = DistanceDim(p.Ln12, 0.00000000, 0.39240960,
p.Ln16, -0.44371298, 0.37704762,
-0.18486840, 0.21574679);
if(dim) dim.Name = "L5";
dim = DistanceDim(p.Ln9, 0.61626398, 0.00000000,
p.Ln13, 0.63162596, -0.32192262,
0.76988382, -0.14263115);
if(dim) dim.Name = "L6";
//Constraints
HorizontalCon(p.Ln9);
HorizontalCon(p.Ln11);
HorizontalCon(p.Ln13);
HorizontalCon(p.Ln15);
VerticalCon(p.Ln10);
VerticalCon(p.Ln12);
VerticalCon(p.Ln14);
VerticalCon(p.Ln16);
CoincidentCon(p.Ln9.End, 1.00000000, 0.00000000,
p.Ln10.Base, 1.00000000, 0.00000000);
CoincidentCon(p.Ln10.End, 1.00000000, 1.00000000,
p.Ln11.Base, 1.00000000, 1.00000000);
CoincidentCon(p.Ln11.End, 0.00000000, 1.00000000,
p.Ln12.Base, 0.00000000, 1.00000000);
CoincidentCon(p.Ln12.End, 0.00000000, 0.00000000,
p.Ln9.Base, 0.00000000, 0.00000000);
CoincidentCon(p.Ln9.Base, 0.00000000, 0.00000000,
p.Origin2, 0.00000000, 0.00000000);
CoincidentCon(p.Ln13.End, 1.25000000, -0.25000000,
p.Ln14.Base, 1.25000000, -0.25000000);
CoincidentCon(p.Ln14.End, 1.25000000, 1.25000000,
p.Ln15.Base, 1.25000000, 1.25000000);
CoincidentCon(p.Ln15.End, -0.25000000, 1.25000000,
p.Ln16.Base, -0.25000000, 1.25000000);
CoincidentCon(p.Ln16.End, -0.25000000, -0.25000000,
p.Ln13.Base, -0.25000000, -0.25000000);
73

}p.Plane2.EvalDimCons();
//Final evaluate of all dimensions and constraints in plane
return p;
}//End Plane JScript function: planeSketchesOnly
//Call Plane JScript function
var ps1 = planeSketchesOnly (new Object());
//Finish
agb.Regen(); //To insure model validity
//End DM JScript
//=====================================================================================
//Extrude Cut Sides of spheres that extend beyond the edge of the cube
var ext1 = agb.Extrude(agc.Cut, ps1.Sk1, agc.DirSymmetric, agc.ExtendFixed,
edgeLengthY, agc.ExtendFixed, -1.5, agc.No, 0.0, 0.0)
agb.Regen();
var ext2 = agb.Extrude(agc.Cut, ps1.Sk2, agc.DirSymmetric, agc.ExtendFixed,
edgeLengthY, agc.ExtendFixed, -1.5, agc.No, 0.0, 0.0)
agb.Regen();
//=====================================================================================
//=====================================================================================
//Boolean to subtract reinforcements from matrix, maintaining reinforcement
geomtries
var nBoolean = ag.gui.CreateBoolean();
nBoolean.Name = "Perfect Bonding";
nBoolean.Operation = 2;
nBoolean.Preserve=ag.c.Yes;
ag.listview.ActivateItem("Target Bodies");
agb.ClearSelections();
body1 = ag.fm.Body(nFibers);
agb.AddSelect(agc.TypeBody,body1);
ag.listview.ItemValue = "Apply";
agb.ClearSelections();
ag.listview.ActivateItem("Tool Bodies");
for(var i = 0;i<=nFibers-1;i++){body = ag.fm.Body(i);
agb.AddSelect(agc.TypeBody,body);}ag.listview.ItemValue = "Apply";
ag.Regen;
74