Embed Size (px)
Citation preview

June 2019
Findings from 2019 Employee Engagement SurveyUCSF Financial & Administrative Services

Copyright © 2019 Gallup, Inc. All rights reserved.
2019 FAS Key Findings
2
• Financial & Administrative Services (FAS) shows steady improvement on employee engagement over the years.
• Areas of strength in FAS are friendship, a strong connection to our mission and a focus on employee feedback and recognition.
• Recognition – had the highest overall improvement – showing that the contributions employees make are valued and rewarded.
• Similar to the rest of UCSF, there are two distinct “layers” of engagement within FAS. An encouraging development is that FAS shows significant increases in populations that have been historically less likely to be engaged. This was an area of focus in many of our work teams where data showed progress with staff feeling more cared for and that their opinions count.
• Opportunities for improvement remain in fostering dialogue that encourages engagement and belonging. Additionally, we need to do better to help our people develop and advance.
• Looking forward, we recognize a need to be deliberate in sustaining communications and engagement in groups during leadership transitions and organizational changes.
Copyright © 2018 Gallup, Inc. All rights reserved.

Copyright © 2019 Gallup, Inc. All rights reserved.
The Employee Engagement metric (Q12®) is built around 12 core items
3
GROWTHHow do
we grow?
TEAMWORKDo I belong?
INDIVIDUALWhat do I give?
BASIC NEEDSWhat do I get?
Q12. This last year, I have had opportunities at work to learn and grow.
Q11. In the last six months, someone at work has talked to me about my progress.
Q10. I have a best friend at work.
Q09. My associates or fellow employees are committed to doing quality work.
Q08. The mission or purpose of my company makes me feel my job is important.
Q07. At work, my opinions seem to count.
Q06. There is someone at work who encourages my development.Q05. My supervisor, or someone at work, seems to care about me as a person.
Q04. In the last seven days, I have received recognition or praise for doing good work.
Q03. At work, I have the opportunity to do what I do best every day.
Q02. I have the materials and equipment I need to do my work right.
Q01. I know what is expected of me at work.
The items were chosen specifically based on their link back to business
and clinical outcomes.
Copyright © 1993-1998, 2018 Gallup, Inc. All rights reserved.
Copyright © 2019 Gallup, Inc. All rights reserved.
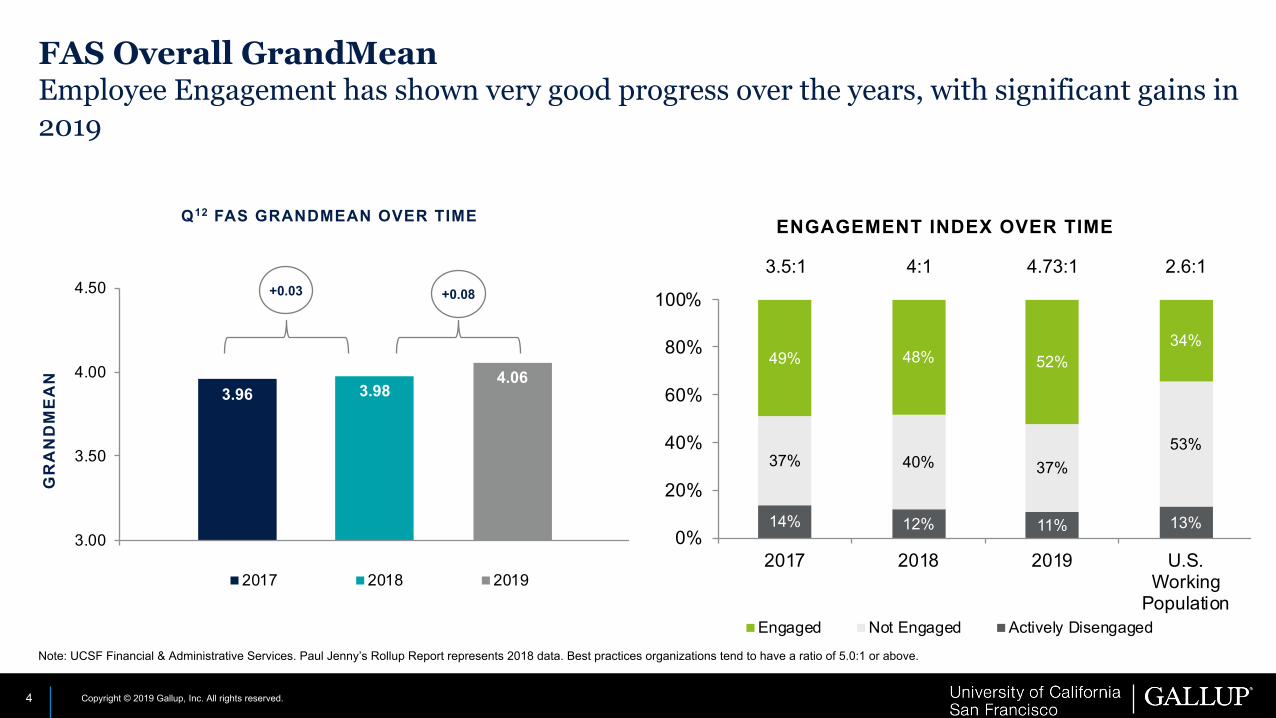
3.96 3.984.06
3.00
3.50
4.00
4.50
GR
AN
DM
EA
N
Q12 FAS GRANDMEAN OVER TIME
2017 2018 2019
FAS Overall GrandMean Employee Engagement has shown very good progress over the years, with significant gains in 2019
4
+0.03 +0.08
14% 12% 11% 13%
37% 40% 37%53%
49% 48% 52%34%
0%
20%
40%
60%
80%
100%
2017 2018 2019 U.S.Working
Population
ENGAGEMENT INDEX OVER TIME
Engaged Not Engaged Actively Disengaged
3.5:1 4:1 4.73:1 2.6:1
Note: UCSF Financial & Administrative Services. Paul Jenny’s Rollup Report represents 2018 data. Best practices organizations tend to have a ratio of 5.0:1 or above.

Copyright © 2019 Gallup, Inc. All rights reserved.5
CHANGE:
4.00 4.02 4.04
3.87 3.88 3.90
3.66 3.69 3.75
4.03 4.05 4.043.96 3.98
4.06
3.00
3.50
4.00
4.50
2017(n=5,131)
2018(n=5,343)
2019(n=5,521)
2017(n=6,925)
2018(n=7,387)
2019(n=7,906)
2017(n=1,385)
2018(n=1,407)
2019(n=1,624)
2017(n=2,725)
2018(n=2,744)
2019(n=2,934)
2017(n=1,119)
2018(n=1,214)
2019(n=1,205)
UCSF Campus UCSF Health UCSF BCHO UCSF School of Medicine UCSF Finance & AdministrativeServices
+0.02 +0.02 +0.06 -0.01 +0.08
Grand Mean Score by EntityOverall most UCSF entities had largely unchanged engagement levels; FAS had a strong year due to sustained discipline in team action planning
Note: UCSF Financial & Administrative Services. Paul Jenny’s Rollup Report represents 2018 data.

Copyright © 2019 Gallup, Inc. All rights reserved.
FAS Engagement ConditionsRecognition, Care and Opinions Count show good improvements
Note: UCSF Financial & Administrative Services. Due to rounding, percentages may add up to 100% ±1%; numerical values shown when 5% or higher
6
DISTRIBUTION OF Q12 RESULTS — UCSF FINANCIALIAL & ADMINISTRATIVE SERVICES2018
MEAN CHANGE2019
MEAN
Q12 Learn & Grow 3.97 +0.07 4.04
Q11 Progress 4.05 +0.04 4.09
Q10 Best Friend 3.86 +0.02 3.88
Q09 Quality 4.07 +0.05 4.12
Q08 Mission 4.12 +0.09 4.21
Q07 Opinions 3.74 +0.11 3.85
Q06 Development 3.87 +0.07 3.94
Q05 Cares 4.08 +0.11 4.19
Q04 Recognition 3.65 +0.13 3.78
Q03 Do Best 4.01 +0.09 4.10
Q02 Materials 4.05 +0.06 4.11
Q01 Expectations 4.32 +0.06 4.38
5%
5%
8%
7%
6%
12%
7%
6%
6%
5%
5%
8%
7%
5%
7%
6%
6%
14%
13%
18%
15%
12%
17%
16%
11%
15%
14%
16%
9%
27%
26%
25%
32%
26%
31%
28%
25%
23%
34%
32%
30%
47%
50%
42%
45%
53%
38%
43%
54%
43%
44%
44%
56%
1 2 3 4 5
Biggest increase
Copyright © 1993-1998, 2019 Gallup, Inc. All rights reserved.The Gallup Q12 items are Gallup proprietary information and are protected by law. You may not administer a survey with the Q12 items or reproduce them without written consent from Gallup.

Copyright © 2019 Gallup, Inc. All rights reserved.
Areas of strength in FAS are friendship, a strong connection to our mission and a focus on employee feedback and recognition
7
2018 MEAN
2018 %ILE2
2018 %ILE3
2019MEAN
2019%ILE2
2019%ILE3
GRANDMEAN SCORE 3.98 61st 46th 4.06 69th 50th
Mean Percentile Percentile Mean Percentile Percentile
GrowthQ12: Opportunities to learn and grow 3.97 48th 39th 4.04 59th 43rd
Q11: Progress in last six months 4.05 71st 51st 4.09 76th 50th
Teamwork
Q10: Best friend 3.86 68th 55th 3.88 71st 55th
Q09: Coworkers committed to quality 4.07 48th 43rd 4.12 58th 44th
Q08: Mission/purpose of company 4.12 65th 47th 4.21 74th 52nd
Q07: My opinions count 3.74 55th 41st 3.85 68th 46th
Individual
Q06: Encourages development 3.87 53rd 43rd 3.94 63rd 43rd
Q05: Supervisor/someone at work cares 4.08 48th 38th 4.19 66th 43rd
Q04: Recognition last seven days 3.65 64th 46th 3.78 76th 51st
Q03: Do what I do best every day 4.01 47th 43rd 4.10 58th 46th
Basic Needs
Q02: Materials and equipment 4.05 56th 45th 4.11 64th 45th
Q01: I know what is expected of me at work 4.32 37th 37th 4.38 49th 40th
Engagement at FAS is
higher on best friend,
mission and a focus on employee
feedback and recognition
Note: UCSF Financial & Administrative Services. Paul Jenny’s Rollup Report represents 2018 data. Percentiles based on Gallup’s Q12 2Overall Company – Level, and 3Overall Workgroup-Level Databases per respective year.
Copyright © 2019 Gallup, Inc. All rights reserved.
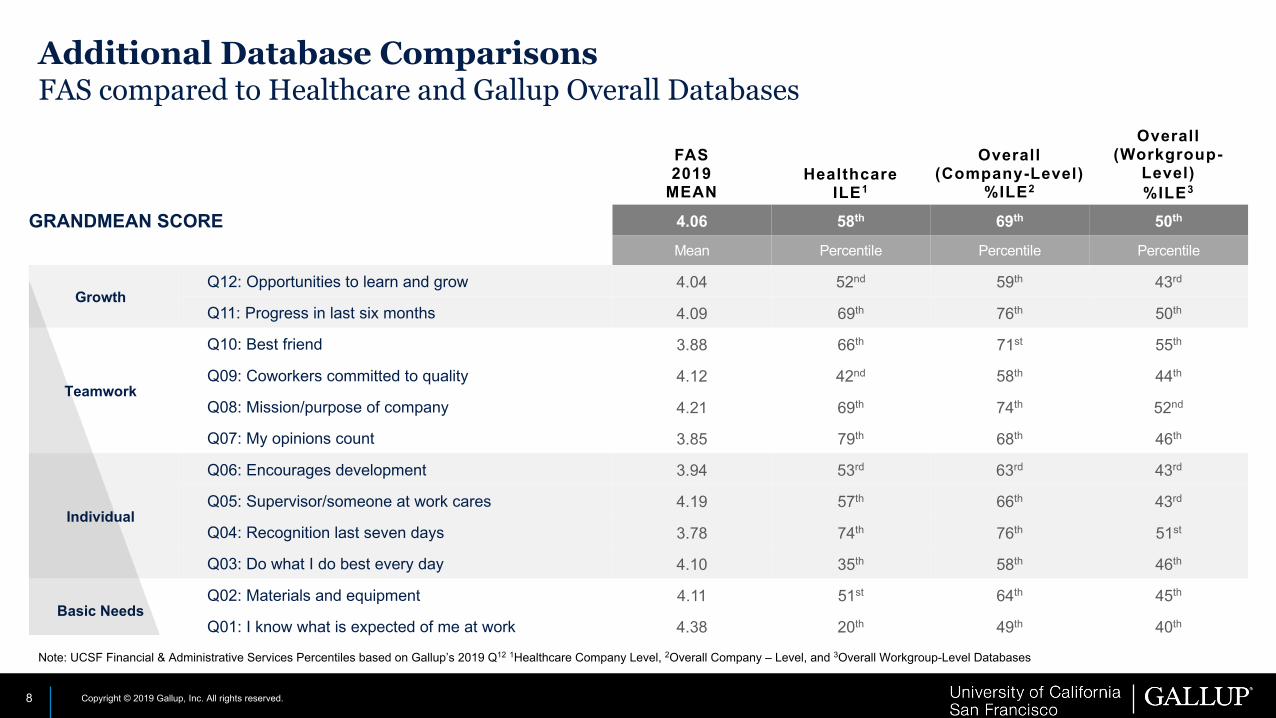
Additional Database ComparisonsFAS compared to Healthcare and Gallup Overall Databases
8
FAS2019
MEANHealthcare
ILE1
Overall (Company-Level)
%ILE2
Overall(Workgroup-
Level)%ILE3
GRANDMEAN SCORE 4.06 58th 69th 50th
Mean Percentile Percentile Percentile
GrowthQ12: Opportunities to learn and grow 4.04 52nd 59th 43rd
Q11: Progress in last six months 4.09 69th 76th 50th
Teamwork
Q10: Best friend 3.88 66th 71st 55th
Q09: Coworkers committed to quality 4.12 42nd 58th 44th
Q08: Mission/purpose of company 4.21 69th 74th 52nd
Q07: My opinions count 3.85 79th 68th 46th
Individual
Q06: Encourages development 3.94 53rd 63rd 43rd
Q05: Supervisor/someone at work cares 4.19 57th 66th 43rd
Q04: Recognition last seven days 3.78 74th 76th 51st
Q03: Do what I do best every day 4.10 35th 58th 46th
Basic NeedsQ02: Materials and equipment 4.11 51st 64th 45th
Q01: I know what is expected of me at work 4.38 20th 49th 40th
Note: UCSF Financial & Administrative Services Percentiles based on Gallup’s 2019 Q12 1Healthcare Company Level, 2Overall Company – Level, and 3Overall Workgroup-Level Databases

Copyright © 2019 Gallup, Inc. All rights reserved.
Understanding “belonging” at UCSF
9
The Belonging Index includes 4 key questions from the Q12 as well as 6 new questions that helps define belonging across there additional parameters
Engagement Roadmap Manager Advocate Unconscious BiasA clear roadmap that helps employees navigate UCSF’s
complex structure
Strong support and advocacy from managers
to drive growth and progress
Breaking unconscious bias and driving respect for diverse backgrounds and
viewpoints
Recognition
Care
Opinions
Learn and Grow
Find information and resources that I need to be effective
Have a clearly defined path for development and growth
Manager is a strong advocate for our unit and department
Manager consistently helps me progress in my role
I am respected for who I am as a person
I have the same opportunity for advancement as others with
similar experience and qualifications

Copyright © 2019 Gallup, Inc. All rights reserved.
2019 MEAN
Recognition 3.78
Cares 4.19
Opinions 3.85
Learn & grow 4.04
Find information & resources 4.16
Clearly defined path 3.52
Manager strong advocate 4.05
Manager helps me progress 3.90
Respected at work 4.21
Opportunities for advancement 3.77
10
12%
7%
5%
9%
6%
7%
9%
7%
5%
8%
7%
10%
6%
7%
8%
15%
11%
17%
14%
15%
26%
13%
17%
12%
17%
23%
25%
31%
27%
37%
29%
27%
27%
31%
28%
43%
54%
38%
47%
43%
26%
48%
42%
50%
38%
%1s %2s %3s %4s %5s
Note: UCSF Financial & Administrative Services. Due to rounding, percentages may add up to 100% ±1%; numerical values shown when 5% or higher
FAS Belonging IndexInvesting in employee growth and development could help employees feel a stronger sense of belongingness at Financial & Administrative ServicesOverall Belonging Index = 3.95

Copyright © 2019 Gallup, Inc. All rights reserved.
The belonging questions are highly correlated Q12 questions related to inclusiveness – specifically Development, Opinions and Learn & Grow
11
I know where to find the information and resources I need to help me do my job effectively.
There is a clearly defined path to growth and development in my role.
My manager or supervisor serves as a strong advocate for our unit/department.
My manager or supervisor is consistently trying to help me progress in my role.
At work, I am respected for who I am as a person.
I have the same opportunities for advancement as other employees at my organization with similar experience and qualifications
ü Q06. There is someone at work who encourages my development.
ü Q07. At work, my opinionsseem to count.
ü Q12. This last year, I have had opportunities at work to learn and grow.
Roadmap
ManagerAdvocate
UnconsciousBias
Note: Analysis for UCSF Overall

Copyright © 2019 Gallup, Inc. All rights reserved.
Belonging and EngagementA Focus on Belonging can considerably enhance Employee Engagement
12
2.13
3.55
4.61
2.32
3.47
4.44
1.87
3.58
4.72
2.20
3.60
4.66
Actively Disengaged(n=127)
Not Engaged(n=438)
Engaged(604)
FAS Average Mean Score for overall belonging and each domainBelonging Index Roadmap Manager Advocate Unconscious Bias
Note: UCSF Financial & Administrative Services
Copyright © 2019 Gallup, Inc. All rights reserved.
Driving Action on Engagement
13

Copyright © 2019 Gallup, Inc. All rights reserved.
Accountability IndexSteady performance on the Accountability Index has helped FAS to sustain and grow high engagement levels
14
3.96 4.03 4.02 3.924.16
2.00
3.00
4.00
5.00
2017 2018 2019 GallupHealthcare
50th
GallupHealthcare
75th
Financial & Administrative Services (FAS)Accountability Index:
Composite of the mean scores for the three Accountability Index items listed below
52nd 58th 60th
ACCOUNTABILITY ITEMS: MEAN PERCENTILE ∆
I received feedback on the previous Employee Engagement Survey conducted at my workplace. 4.25 67th -0.02
My team participated in an effective action planning session following last year’s Employee Engagement Survey. 3.95 56th -0.01
My team has made progress on the goals set during our action planning sessions after the last Employee Engagement Survey. 3.85 54th -0.04
Note: UCSF Finance & Administrative Services. Percentiles are based on Gallup’s Additional Items Company Level (1000+) Database for respective year.
Percentile:

Copyright © 2019 Gallup, Inc. All rights reserved.
Where there is dialogue around engagement at the local level, there tends to be much greater improvement
Note: UCSF Financial & Administrative Services; 1,079 n with 2019Accountability Index score and 2018 & 2019 GrandMean score. Percentiles are based on Gallup’s Additional Items Company Level (1000+) Database for respective year.
15
-0.40-0.27 -0.09
0.12
-0.60
-0.40
-0.20
0.00
0.20
0.40
Aver
age
Gra
ndM
ean
Cha
nge
2019 Accountability Index Score
FAS Average GrandMean Change in 2019 Based on Accountability Index Group
Those with high ratings on accountability showed an
average GrandMean increase of +0.12 in the 2019 survey; those rating accountability low showed an average GrandMean
decrease of -0.40.(<2.00) (2.01 to <3.00) (3.01 to <4.00) (4.01+)
(n=84) (n=139) (n=292) (n=564)
Copyright © 2018 Gallup, Inc. All rights reserved.
• Accountability Index Mean (2018): 4.03 (58th percentile) • Accountability Index Mean (2019): 4.02 (60th percentile)

Copyright © 2019 Gallup, Inc. All rights reserved.
Key Recommendations
16
• Continue to drive focus and accountability on engagement action planning.
• Focus on development - ensure that all employees have a clear individual development plan (and a clear path to growth in their departments).
• Amplify employee voice -- encourage people to speak up in meetings, openly share their opinions• Create safe spaces - where employees can be heard. But also ensure follow-up and accountability.• Leader rounding and Managers focus on continuous conversations.
• Understand how FAS can foster a greater sense of belonging for certain groups. Focus on three key areas of focus:
• Communication - create greater clarity around role, development and growth expectations.• Coaching – focus managers on ongoing coaching conversations that help employees grow and develop.• Role modeling – leaders focus on key behaviors that demonstrate belonging.
Copyright © 2018 Gallup, Inc. All rights reserved.

Copyright © 2019 Gallup, Inc. All rights reserved.
Next Step Date
17
• Complete Sharing of Results with teams July 11th
• Attend Organization-wide Town Hall July 11th
• Attend Manager Workshops July 15 - August 15
• Complete Action Plans August 31