Embed Size (px)
Citation preview

July - August, 2011
Conferences That Inspire Solutions
Financing Sustainable Water Infrastructure
www.foodandagpolicy.com
Public Food and Agricultural Research in the United States: The Rise and Decline of Public Investments, and Policies for Renewal
Philip G. Pardey, Julian M. Alston, and Connie Chan-Kang
April 2013

This publication was commissioned by AGree to inform and stimulate dialogue about policy reform; it does not represent official AGree positions. The views expressed here are those of the individual authors.
Acknowledgment
The work for this project was partly supported by a grant from AGree, with additional support from the University of Minnesota, the University of California, and the Giannini Foundation of Agricultural Economics. The authors thank Michelle Hallaway, Steve Dehmer, Vince Smith, and Matt Andersen for their help in preparing this report. Several other people contributed both to the ideas and arguments in this report and to the effective presentation of those ideas and arguments by commenting on drafts and discussing issues with us in depth. Without implication we thank, Deborah Atwood, Todd Barker, Ken Cassman, Dan Dooley, Mil Duncan, Mark Jacobs, Al Levine, Kie Riedel, Daniel Sumner, Tom Tomich, and Neal Van Alfen.

i
Foreword AGree seeks to drive positive change in the food and agriculture system by connecting and challenging leaders from diverse communities to catalyze action and elevate food and agriculture policy as a national priority. Through its work, AGree will support policy innovation that addresses four critical challenges in a comprehensive and integrated way to overcome the barriers that have traditionally inhibited transformative change. AGree anticipates constructive roles for the private sector and civil society as well as for policymakers.
AGree has developed the foundation for its work by articulating four interconnected challenges:
• Meet future demand for food;
• Conserve and enhance water, soil, and habitat;
• Improve nutrition and public health; and
• Strengthen farms and communities to improve livelihoods.
Meeting these challenges will require work over the long term and cannot be solved quickly or through a single policy vehicle. AGree is taking a deliberative, inclusive approach to developing a policy framework that can meet the challenges ahead. We are undertaking research to understand problems and assess options, and we are engaging a broad array of stakeholders to contribute insights, guidance, and ideas that lead to meaningful, evidence-based solutions.
This AGree backgrounder was prepared by Philip G. Pardey, Julian M. Alston, and Connie Chan-Kang. Pardey is a Professor in the Department of Applied Economics and Director of the International Science and Technology Practice and Policy (InSTePP) Center, both at the University of Minnesota; Alston is a Professor in the Department of Agricultural and Resource Economics at the University of California, Davis, is the Associate Director, Science and Technology at the University of California Agricultural Issues Center, and is a member of the Giannini Foundation of Agricultural Economics; and Chan-Kang is a Research Associate at the International Science and Technology Practice and Policy (InSTePP) Center.
This report shows how growth in U.S. agricultural productivity has slowed—not coincidentally—as public funds for research and development (R&D) have declined markedly in recent decades. As the authors note, major competitors—most notably China—have not reduced their spending on agricultural R&D, and their agricultural productivity growth has not slowed. The authors call for a doubling of total funding for agricultural R&D over the next 5–10 years. They cite this period as a crucial time to reposition the U.S. food and agricultural research and innovation system to address the changing scientific and market realities, and note the related implications for food safety, nutrition, health, the agricultural workforce, and rural and community development.
We hope you find this paper a helpful resource and source of ideas. And we hope you will join the effort to transform federal food and agriculture policy to meet the challenges of the future.
Deb Atwood Executive Director

iiPublic Food and Agriculture Research in the U.S
ContentsExecutive Summary . . . . . . . . . . . . . . . . . . . . . . . . . . . . . . . . . . . . . . . . . . . . . . . . iv
Setting the Scene . . . . . . . . . . . . . . . . . . . . . . . . . . . . . . . . . . . . . . . . . . . . . . . . . . . . . . . . . iv
U.S. Food and Agricultural Research Investments in Context . . . . . . . . . . . . . . . . . . . . . . v
Shifting Investment Patterns . . . . . . . . . . . . . . . . . . . . . . . . . . . . . . . . . . . . . . . . . . . . . . . . . v
Sources and Forms of Public Funding . . . . . . . . . . . . . . . . . . . . . . . . . . . . . . . . . . . . . . . . . vi
Priorities for Future Funding. . . . . . . . . . . . . . . . . . . . . . . . . . . . . . . . . . . . . . . . . . . . . . . . . vi
Institutional Initiatives . . . . . . . . . . . . . . . . . . . . . . . . . . . . . . . . . . . . . . . . . . . . . . . . . . . . viii
Setting the Scene . . . . . . . . . . . . . . . . . . . . . . . . . . . . . . . . . . . . . . . . . . . . . . . . . . 1
U.S. Agriculture in a Global Context . . . . . . . . . . . . . . . . . . . . . . . . . . . . . . . . . . . . . . . . 1
The Value of Productivity Growth . . . . . . . . . . . . . . . . . . . . . . . . . . . . . . . . . . . . . . . . . . 1
A Slowdown in Agricultural Productivity Growth . . . . . . . . . . . . . . . . . . . . . . . . . . . . . 2
A Slowdown in Agricultural Research Investments . . . . . . . . . . . . . . . . . . . . . . . . . . . . 3
Implied Imperatives . . . . . . . . . . . . . . . . . . . . . . . . . . . . . . . . . . . . . . . . . . . . . . . . . . . . . 5
U.S. Research and Development Trends . . . . . . . . . . . . . . . . . . . . . . . . . . . . . . . . 6
Global and Broader R&D Context for U.S. Agricultural R&D . . . . . . . . . . . . . . . . . . . . . . . . 6
Overall U.S. Science Spending . . . . . . . . . . . . . . . . . . . . . . . . . . . . . . . . . . . . . . . . . . . . 7
Global Public and Private Agricultural R&D . . . . . . . . . . . . . . . . . . . . . . . . . . . . . . . . . . 8
U.S. Agricultural Research Spending . . . . . . . . . . . . . . . . . . . . . . . . . . . . . . . . . . . . . . . 9
Evolving Federal Roles in U.S. Public Agricultural R&D . . . . . . . . . . . . . . . . . . . . . . . . . . . 11
Funding Flows and Performance of U.S. Public Agricultural R&D, 2010 . . . . . . . . . . 11
A Spending Slowdown. . . . . . . . . . . . . . . . . . . . . . . . . . . . . . . . . . . . . . . . . . . . . . . . . . 14
Spatial Patterns in Research Funding and Performance . . . . . . . . . . . . . . . . . . . . . . . 15
Shifting Patterns of Spending on U.S. Agricultural R&D . . . . . . . . . . . . . . . . . . . . . . . . . . 15
A Shift Away from Farm Productivity-Oriented R&D . . . . . . . . . . . . . . . . . . . . . . . . . . 17
Intensity of Investment . . . . . . . . . . . . . . . . . . . . . . . . . . . . . . . . . . . . . . . . . . . . . . . . . . 18
Research Personnel. . . . . . . . . . . . . . . . . . . . . . . . . . . . . . . . . . . . . . . . . . . . . . . . . . . . . 20
ContentsExecutive Summary . . . . . . . . . . . . . . . . . . . . . . . . . . . . . . . . . . . . . . . . . . . . . . . . vi
Setting the Scene . . . . . . . . . . . . . . . . . . . . . . . . . . . . . . . . . . . . . . . . . . . . . . . . . . . . . . . . . vi
U.S. Food and Agricultural Research Investments in Context . . . . . . . . . . . . . . . . . . . . . vii
Shifting Investment Patterns . . . . . . . . . . . . . . . . . . . . . . . . . . . . . . . . . . . . . . . . . . . . . . . . vii
Sources and Forms of Public Funding . . . . . . . . . . . . . . . . . . . . . . . . . . . . . . . . . . . . . . . . viii
Priorities for Future Funding. . . . . . . . . . . . . . . . . . . . . . . . . . . . . . . . . . . . . . . . . . . . . . . . viii
Institutional Initiatives . . . . . . . . . . . . . . . . . . . . . . . . . . . . . . . . . . . . . . . . . . . . . . . . . . . . . . x
Setting the Scene . . . . . . . . . . . . . . . . . . . . . . . . . . . . . . . . . . . . . . . . . . . . . . . . . . 1
U.S. Agriculture in a Global Context . . . . . . . . . . . . . . . . . . . . . . . . . . . . . . . . . . . . . . . . 1
The Value of Productivity Growth . . . . . . . . . . . . . . . . . . . . . . . . . . . . . . . . . . . . . . . . . . 1
A Slowdown in Agricultural Productivity Growth . . . . . . . . . . . . . . . . . . . . . . . . . . . . . 2
A Slowdown in Agricultural Research Investments . . . . . . . . . . . . . . . . . . . . . . . . . . . . 3
Implied Imperatives . . . . . . . . . . . . . . . . . . . . . . . . . . . . . . . . . . . . . . . . . . . . . . . . . . . . . 5
U.S. Research and Development Trends . . . . . . . . . . . . . . . . . . . . . . . . . . . . . . . . 6
Global and Broader R&D Context for U.S. Agricultural R&D . . . . . . . . . . . . . . . . . . . . . . . . 6
Overall U.S. Science Spending . . . . . . . . . . . . . . . . . . . . . . . . . . . . . . . . . . . . . . . . . . . . 7
Global Public and Private Agricultural R&D . . . . . . . . . . . . . . . . . . . . . . . . . . . . . . . . . . 8
U.S. Agricultural Research Spending . . . . . . . . . . . . . . . . . . . . . . . . . . . . . . . . . . . . . . . 9
Evolving Federal Roles in U.S. Public Agricultural R&D . . . . . . . . . . . . . . . . . . . . . . . . . . . 11
Funding Flows and Performance of U.S. Public Agricultural R&D, 2010 . . . . . . . . . . 11
A Spending Slowdown. . . . . . . . . . . . . . . . . . . . . . . . . . . . . . . . . . . . . . . . . . . . . . . . . . 14
Spatial Patterns in Research Funding and Performance . . . . . . . . . . . . . . . . . . . . . . . 15
Shifting Patterns of Spending on U.S. Agricultural R&D . . . . . . . . . . . . . . . . . . . . . . . . . . 15
A Shift Away from Farm Productivity-Oriented R&D . . . . . . . . . . . . . . . . . . . . . . . . . . 17
Intensity of Investment . . . . . . . . . . . . . . . . . . . . . . . . . . . . . . . . . . . . . . . . . . . . . . . . . . 18
Research Personnel. . . . . . . . . . . . . . . . . . . . . . . . . . . . . . . . . . . . . . . . . . . . . . . . . . . . . 20

iii
Federal Roles . . . . . . . . . . . . . . . . . . . . . . . . . . . . . . . . . . . . . . . . . . . . . . . . . . . . . 21
Intellectual Property . . . . . . . . . . . . . . . . . . . . . . . . . . . . . . . . . . . . . . . . . . . . . . . . . . . . . . . 21
Funding R&D . . . . . . . . . . . . . . . . . . . . . . . . . . . . . . . . . . . . . . . . . . . . . . . . . . . . . . . . . . . . . 23
Efficient Jurisdictions—Federal versus State Support . . . . . . . . . . . . . . . . . . . . . . . . . 23
Economics of Commodity Check-offs . . . . . . . . . . . . . . . . . . . . . . . . . . . . . . . . . . . . . . 24
Regulating Technologies . . . . . . . . . . . . . . . . . . . . . . . . . . . . . . . . . . . . . . . . . . . . . . . . . 25
Biotechnology Regulation . . . . . . . . . . . . . . . . . . . . . . . . . . . . . . . . . . . . . . . . . . . . . . . . . . 26
Prospective Research Priorities and Policies. . . . . . . . . . . . . . . . . . . . . . . . . . . . 27
Double the Total Funding for Public Agricultural R&D . . . . . . . . . . . . . . . . . . . . . . . . . . . . 27
Revitalize Federal R&D Support via the Farm Bill . . . . . . . . . . . . . . . . . . . . . . . . . . . . 28
Reengage State Government Support for SAES Research . . . . . . . . . . . . . . . . . . . . . 29
Policies to Increase Private Support for Publicly Performed Research . . . . . . . . . . . . 29
Rebuilding Capacity . . . . . . . . . . . . . . . . . . . . . . . . . . . . . . . . . . . . . . . . . . . . . . . . . . . . . . . 30
Contestability . . . . . . . . . . . . . . . . . . . . . . . . . . . . . . . . . . . . . . . . . . . . . . . . . . . . . . . . . . . . 30
Locally Contestable Funding for SAES Salary Support . . . . . . . . . . . . . . . . . . . . . . . . 30
Is 50 SAESs (and 110 Regional Agricultural Research Service Labs) the Right Number? . . . . . . . . . . . . . . . . . . . . . . . . . . . . . . . . . . . . . . . . . . . . . . . . . . . . . 31
Setting Priorities . . . . . . . . . . . . . . . . . . . . . . . . . . . . . . . . . . . . . . . . . . . . . . . . . . . . . . . 32
The Determinants of Research Benefits . . . . . . . . . . . . . . . . . . . . . . . . . . . . . . . . . . . . 32
Congruence as a Criterion . . . . . . . . . . . . . . . . . . . . . . . . . . . . . . . . . . . . . . . . . . . . . . . 33
Agricultural R&D as an Instrument of Social Policy. . . . . . . . . . . . . . . . . . . . . . . . . . . 34
Striking the Right Balance . . . . . . . . . . . . . . . . . . . . . . . . . . . . . . . . . . . . . . . . . . . . . . . . . . 34
A New Approach? . . . . . . . . . . . . . . . . . . . . . . . . . . . . . . . . . . . . . . . . . . . . . . . . . . . . . . . . . 36
New Sources of Funds . . . . . . . . . . . . . . . . . . . . . . . . . . . . . . . . . . . . . . . . . . . . . . . . . . 36
A New Institutional Arrangement . . . . . . . . . . . . . . . . . . . . . . . . . . . . . . . . . . . . . . . . . 36
Conclusion. . . . . . . . . . . . . . . . . . . . . . . . . . . . . . . . . . . . . . . . . . . . . . . . . . . . . . . 38
Endnotes . . . . . . . . . . . . . . . . . . . . . . . . . . . . . . . . . . . . . . . . . . . . . . . . . . . . . . . . 39

ivPublic Food and Agriculture Research in the U.S
Executive Summary• Agricultural research and development (R&D)
spending is a critical policy instrument that governments can apply to influence the path of agricultural productivity and the food and agricultural economies.
• Agricultural R&D also has consequences for food processing, nutrition, health, the agricultural workforce, consumer and producer household well-being, rural and community development, and food safety. It can also help sustain and enhance the value of ecosystem services used in, produced by, and otherwise affected by agriculture, and can reduce negative externalities from agricultural production and other sectors of the economy.
• Even though rates of return for productivity-enhancing research are demonstrably very high, we have seen a slowdown in both public and private spending on agricultural R&D in the United States and a diversion of public research funds away from farm productivity enhancement. Together these trends spell a further slowdown in U.S. farm productivity growth at a time when the market has begun to signal the beginning of the end of a half-century and more of global agricultural abundance.
• It is a crucial time to rethink national food and agricultural R&D and innovation policies and reposition the U.S. food and agricultural research and innovation system to address the changing scientific and market realities in the century ahead.
• To make informed public policy choices regarding federal roles in food and agricultural R&D requires a strategic understanding of the present patterns of investment in food and agricultural R&D in the United States and elsewhere in the world. The long lags between investing in food and agricultural R&D and realizing a social return on that investment dictate taking a very long-run perspective on these R&D spending trends, one spanning many decades, not just several years.
• In this report we review the evolution of U.S. food and agricultural R&D institutions and investments, and emphasize the slowing growth and shifting emphasis of public agricultural R&D spending.
• Against that background we discuss a series of interrelated options for reallocating public spending devoted to agriculture, revitalizing investments in agricultural research, restructuring joint public and private arrangements for financing agricultural R&D, and reforming the institutions that fund publicly performed agricultural research in the U.S.
Setting the Scene• Over the past century and more, R&D has
contributed to a transformation of the U.S. food and agricultural sectors. R&D has fueled productivity growth, enabling U.S. farmers to do more with less, thus helping them to remain competitive in increasingly integrated global commodity markets and better achieve an environmentally sustainable supply of biofuels, fiber, and feed, as well as safe, nutritious, and affordable food.
• In 2007, U.S. agriculture produced more than five times the quantity of agricultural output (as measured by an index aggregating the quantities of all crop and livestock products) produced in 1910. The 1.74 percent per year increase in output from 1910 to 2007 was achieved with only a 0.15 percent per year increase in the total quantity of inputs (as measured by an index aggregating quantities of labor, capital, land, and purchased inputs such as agricultural chemicals and seeds).
• The resulting growth in U.S. production of food and feed staples such as corn, wheat, and soybeans has also been a significant element of growing feed and food supplies worldwide: in 2010, the U.S. share of world production was 37 percent for corn, 35 percent for soybeans, 16 percent for sorghum, and 9 percent for wheat.

vExecutive Summary
U.S. Food and Agricultural Research Investments in Context • In 2009, the United States invested a total of
$400.5 billion in R&D of all types. The business sector accounted for $289 billion (72 percent) of this total, with the federal government picking up $31 billion (8 percent) of the tab. An estimated $11.1 billion (just 2.8 percent) of the total spent on science in the United States in 2009 was related directly to food and agriculture.
• The business sector conducted a larger share of total R&D (72 percent of the total in 2009) than food and agricultural R&D (57 percent). In contrast, universities performed only 15 percent of the total R&D in the United States in 2009, whereas 32 percent of the food and agricultural R&D was done in academic institutions by way of the Land Grant colleges under the auspices of State Agricultural Experiment Stations (SAESs) and other cooperating agencies (including the 1890 Colleges and schools of veterinary medicine).
• Almost 8 percent of total U.S. science in 2009 took place in federal government labs, whereas 11 percent of U.S. food and agricultural R&D was conducted in federal facilities, mainly “intramural” research conducted by the U.S. Department of Agriculture (USDA) in its own labs (compared with “extramural” research funded by the USDA and others and conducted elsewhere).
Shifting Investment Patterns• Public food and agricultural R&D spending
(net of forestry) grew from 1889 at an average of 7.7 percent per year in nominal terms and 3.9 percent in real (inflation-adjusted, 2009 base-year prices) terms to a total of $4.7 billion in 2009. Inflation-adjusted growth in spending averaged only 3.4 percent per year for the period 1950–1980 and slowed to 0.71 percent per year for the period 1980–2009.
• In more recent years, aggregate real spending on public agricultural R&D has been on the decline. Real spending in 2009 was 7 percent below the corresponding amount in 2004.
• Research conducted by the USDA and the SAESs accounted for roughly equal shares of public food and agricultural research spending until the early 1940s, after which the SAES share grew to 73 percent by 2009.
• Spending on cooperative extension grew from 1915 at an average rate of 6.7 percent per year, but during the period 1950–1980 inflation-adjusted growth in extension spending slowed to 2.39 percent per year, and during the period 1980–2006, real extension spending shrank by 0.25 percent per year, to reach $1.76 billion in 2006 (the last year for which complete data are available).
• The real rate of growth of U.S. science spending has also progressively slowed in recent decades. However, the slowdown in U.S. public and private agricultural R&D spending has been much more pronounced such that total spending on agricultural R&D, as a share of total U.S. science spending, gradually slipped from 4 percent in 1953 to under 3 percent in 2009.
• Significant investments—between 35 and 70 percent of all food and agricultural R&D by available estimates—in so-called maintenance research are required just to maintain farm productivity and prevent it from falling given the inevitable co-evolution of pests and diseases to overcome the technology in use, whether it uses genetics, chemicals, or integrated pest management approaches.
• As other agendas such as research on health, nutrition, the environment, and biofuels have gained ground, the share of SAES research directed to enhancing the productivity of U.S. farmers—or simply sustaining past farm productivity gains via maintenance research—has declined from an estimated 65 percent of the total in 1976 to only 56 percent in 2009.

viPublic Food and Agriculture Research in the U.S
• Over the past half-century, the growth in private agricultural R&D spending outpaced the growth in public spending, such that the private share of total public and private agricultural R&D grew over time. In 2009, the private share was around 57 percent, compared with 44 percent in 1953.
• Food processing research accounted for a significant share (around 38 percent) of the $6.3 billion of total private food and agricultural R&D in the United States in 2009.
Sources and Forms of Public Funding• Of the $3.6 billion spent in 2009 on food and
agricultural R&D by the SAESs and related institutions (including schools of veterinary medicine or forestry, and the 1890 institutions), 38.0 percent was from federal sources, 38.3 percent from state government, 8.2 percent from industry grants and contracts, and 15.5 percent from income earned from sales, royalties, and various other sources.
• Research conducted by USDA labs was almost entirely reliant on federal government funding: $1.47 billion (or 96 percent) of the total of $1.53 billion of that research in 2009 was so funded.
• The state government share of total SAES funding has fallen dramatically from 69.3 percent in 1970 to just 38.3 percent in 2009. Since 1975, funding from industry, self-generated, and miscellaneous funds has risen, accounting for 23.7 percent of total SAES funding in 2009.
• In the 1920s, on average, states provided $2.68 for every dollar of federal support to the SAESs. Given the decline in the share of funding from state governments, by 2009 only $1.01 of state funding flowed to the SAESs for every dollar of federal funding support.
• State versus federal government funding shares of SAES support vary widely across regions. In 2009, the Plains and Southeast regions averaged more
than $1.27 from state sources for every dollar of federal support, and the Pacific and Central regions had almost equal shares of federal and state funding, whereas the Mountain and Northeast regions each spent well less than one dollar of state funding for each dollar from federal government coffers.
• Historically, the USDA was the dominant federal government agency channeling funds to the SAESs, but that has changed. In 1975, the USDA disbursed about 74 percent of the federal funds flowing to the SAESs through a combination of formula funds, grants, and contracts, but by 2009 that share had declined to around 50 percent. The other half of federal funds is now being disbursed by a wide range of federal agencies.
• The share of federal funding for SAES research from NIFA-cum-CSREES (i.e., the USDA National Institute of Food and Agriculture or the USDA Cooperative State Research, Education and Extension Service, which it replaced) also declined (from 66 percent in 1975 to 39 percent in 2009), such that NIFA now provides just 16 percent of total SAES funding.
Priorities for Future Funding• The first priority is to substantially increase
the total funding available for food and agricultural R&D performed in the public sector, especially research directed toward sustainably increasing productivity.
• Broadly conceived, “productivity” encompasses the use of stocks of environmental resources and incorporates positive and negative environmental impacts. Innovations that improve the environmental performance of agriculture while improving farm financial performance are valuable, but not necessarily more valuable than innovations that simply enhance yields, a narrower concept of productivity.

viiExecutive Summary
• The primary economic criterion for public investment is maximum net social benefits, whether those benefits come primarily as returns to producers and consumers or primarily as environmental benefits. The empirical evidence that is available mainly relates to agricultural R&D that enhances narrowly defined agricultural productivity. Much less evidence is available on the social payoff to investments in agricultural research oriented to reducing the environmental impacts of agriculture, especially if those environmental effects spread beyond the farm gate.
• Evidence on returns suggests it should be socially profitable to at least double the total annual investment, but it would make sense to phase in any major increase over 5–10 years given the current limitations on capacity of the system that have arisen from past funding and spending patterns. Nevertheless, a relatively rapid rate of increase in spending is implied.
• Increased federal and state government funding are two potential sources of enhanced support. Increased funding from producers, including farmers as well as the food and agribusiness sectors, is another source of enhanced support. Producer and consumer co-financing arrangements are equitable and potentially more efficient financing instruments, with both groups sharing in the benefits from food and agricultural R&D.
• Some of the increased funding could be dedicated to rebuilding the capacity of the system, reinvesting in people and the infrastructure with which they work. At least half of U.S. agricultural researchers are older than age 55, and the age distribution is relatively concentrated around the median. This current age distribution reflects a progressive aging of the agricultural science profession since the era of rapid expansion in the 1970s and 1980s. Investing in people is an urgent priority.
• Investing in research oriented to maintaining or sustainably increasing farm productivity is a priority. Some of the growth funds could be spent on initiating
new projects in this and other high-priority areas—including investments in areas such as weed science, crop breeding, pest management, veterinary medicine, the quantity and quality of surface water and groundwater, and other areas where there are demonstrably high social payoffs and attenuated incentives for private investments—in view of the long R&D lags before effects will be seen in farmers’ fields.
• Mechanisms should be found to ensure that SAES researchers have appropriate incentives to undertake farm productivity enhancing research, as well as the other directions that have attracted their attention with more abundant sources of extramural research support.
• Priority should be given to research investments that have high expected rates of social payoff but where the private sector has attenuated incentives to invest. These will tend to be projects with high odds of success, that if successful will produce new ideas or innovations that yield large benefits per unit of adoption, and that will be widely adopted by large numbers of producers in economically important parts of agriculture. Choices to commit scarce R&D dollars to particular areas of inquiry involve opportunity costs (i.e., benefits forgone arising from research not pursued), and these costs should be borne in mind when setting priorities for research.
• The greatest payoffs are likely to be found in research that is significantly important for agriculture on a broad scale. It is a matter of simple arithmetic: total economic benefits are approximately equal to benefits per unit times the number of units affected. Marginal topics will not yield the greatest social payoffs. Although such issues are also worthy of some attention, an economically rational approach will not allocate disproportionate shares of scarce research resources to minor subjects with commensurately low potential social payoff.

viiiPublic Food and Agriculture Research in the U.S
• The optimal allocation of research resources involves matching research capacity appropriately with broader social purposes established by policymakers in a context where information about scientific opportunity and payoffs is decentralized—held by various scientists and others and not necessarily available to policymakers. Designing research funding and incentive mechanisms that blend scientific judgment with commercial and community concerns—supported by evidence-based, economically conceived, priority-setting assessments—is key to getting the strategic research priorities best aligned with funding opportunities.
• The appropriate balance and division of labor between public and private research is shifting with evolving intellectual property regimes, changes in commercial opportunities, and commensurate changes in the pace and nature of scientific progress (both at home and abroad). Public-private partnerships are an increasing feature of the landscape in which policymakers seek to allocate public research resources to areas of high social payoff that are complementary with and do not crowd out private investment and activity.
• Policymakers are best placed to establish broad goals and general directions, but researchers and research administrators have a better understanding of how best to achieve the goals that policymakers set. Having policymakers pick specific prospective R&D winners and other specific means to achieve those goals is typically a bad idea. Rather, given a framework of goals defined by policymakers, researchers and research administrators, in the context of professional peer review, are typically better placed to prioritize research projects in view of their informed judgments about scientific opportunity, the odds of success, and the agricultural implications, combined with a basic economic way of thinking about the issues.
Institutional Initiatives• Substantial changes in total funding will
likely require substantial changes in funding institutions. A significant use of levies on farm production combined with reallocated or additional federal funds could generate significant amounts of new funds for agricultural R&D. These funds could be directed to farm productivity enhancing agricultural research and other high-payoff areas where markets fail to fund the economically justifiable amount of research.
•These funds could be used to bid SAES researchers’ effort away from other sources of extramural funds.
•They could be applied in a contestable fashion and made available to non-SAES scientists on a competitive basis, thereby expanding the total research capacity available for research affecting agriculture.
•They could be used flexibly, shifting in application as priorities change among research areas and among researchers, unlike the existing core SAES funds that are tied up predominantly in salaries of tenured faculty.
• Contestability and flexibility could extend beyond individual scientists within the SAESs to the entire SAES system. Is it efficient in the modern era to try to sustain 50 stand-alone SAESs (or 110 regional USDA research labs), based on geopolitical boundaries that were drawn in eras long past? Can these boundaries be redrawn for the purpose of making most effective use of a very scarce resource, and with a view to preserving a system of state-based agricultural R&D, albeit in a revised form, rather than losing it altogether? Policies could be devised to redirect the balance of resources, even if all 50 SAESs survive in name.
1Setting the Scene
Setting the SceneIn the 20th century, agricultural science achieved a great deal. Since 1960, the world’s population has more than doubled, from 3.1 billion to more than 7.0 billion, and so has real per capita income.1 Over the same period, total production of cereals grew faster than population, from 877 million metric tons in 1961 to more than 2,433 million metric tons in 2010, and this increase is largely attributable to unprecedented increases in crop yields, reflecting increased use of modern inputs, including fertilizers and irrigation, as well as higher yielding varieties.2 More broadly, global production of food has grown faster than a rapidly growing demand over a sustained period of decades, such that a much larger total population is now better fed with much lower food prices. The fact that the Malthusian nightmare has not been realized over the past 50 years is attributable in large part to improvements in agricultural productivity achieved through technological change enabled by investments in agricultural R&D. The United States has played a central role in this remarkable accomplishment. Until recently, the U.S. government has led the world in investing in and undertaking agricultural science and the more basic sciences that underpin it, generating agricultural innovations globally, not just in the United States. The U.S. private research industry has been a major force, too.
Many people appear to take for granted a continuation into the future of the past pattern of ever-falling food commodity prices, but that era of rising global agricultural abundance may be already over.3 The past half-century was characterized by historically unprecedented, sustained rates of growth in agricultural productivity, combined with increases in availability of land and water and other resources for agriculture that together enabled the growth in production to more than outstrip the growth in demand. Looking forward, in the face of competition for water and shrinking opportunities to expand the arable land base, the world will rely even more than in the past
on productivity growth from technological change, enabled by public and private research investments, to achieve an environmentally sustainable supply of safe, nutritious, and affordable food.4 Questions arise about who will conduct that research, what it will emphasize, who will pay for it, and who will have access to the resulting technologies and on what terms. In the United States, for both self-interested and humanitarian reasons, we are interested in the consequences of the answers to those questions, both at home and abroad.
U.S. Agriculture in a Global ContextThe United States has been, and remains, a major contributor to the global food and fiber economy, but this role has evolved over time. In 1961, the United States accounted for 14.8 percent by value of the world’s entire agricultural output. By 2010 that share had slipped to a still sizable 10.6 percent, with the Asia and Pacific region (including India and China) now accounting for 48.6 percent of world agricultural output (compared with 29.1 percent in 1961). Nonetheless, the United States continues to be a major producer of many important food and feed commodities. In 2010, it accounted for 37.4 percent of the world’s corn production, 34.6 percent of soybeans, 15.8 percent of sorghum, and 9.2 percent of wheat. The United States has an even more prominent position in agricultural trade than its sizable shares of global agricultural production might suggest.
The Value of Productivity GrowthAgricultural productivity growth has contributed remarkably to agricultural abundance in ways that are little appreciated by the broader population. U.S. multifactor agricultural productivity grew at an average rate of 1.78 percent per year in the 58-year period, 1949–2007, with average productivity growth rates ranging from 1.48 percent per year in the Mountain states to 1.96 percent per year in the Southeast. We can infer an approximate value for the productivity gains in terms of resource savings or additional output.
2Public Food and Agriculture Research in the U.S
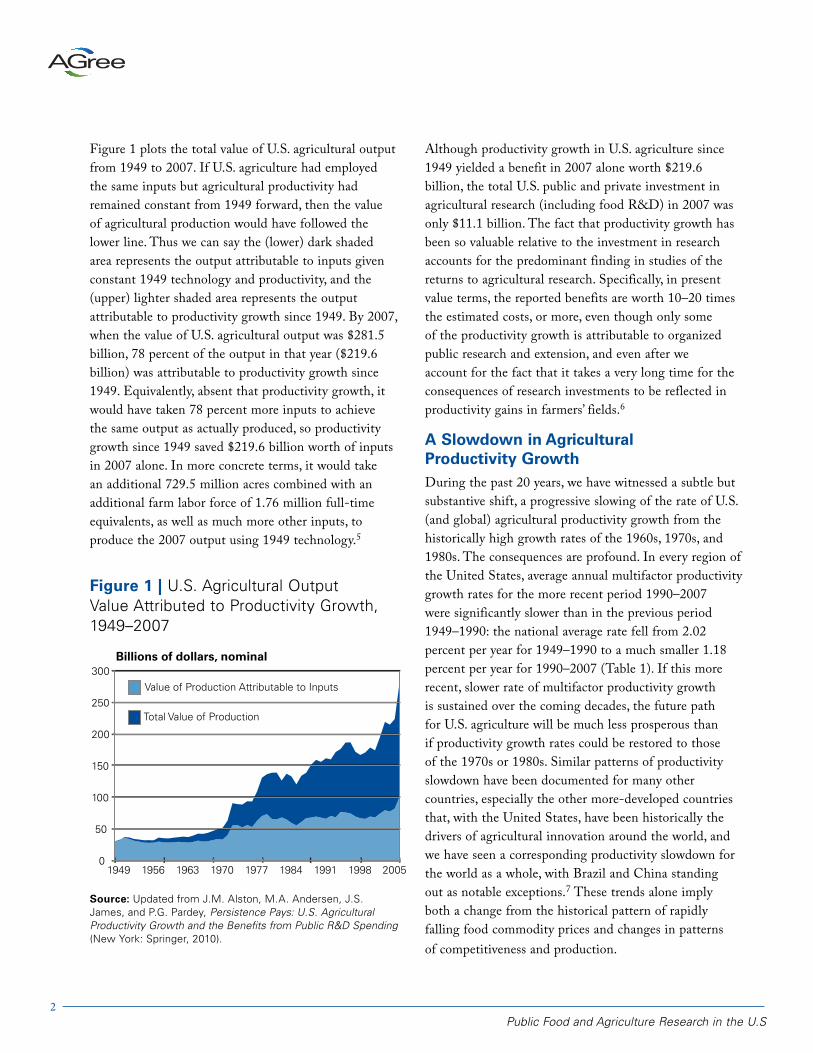
Figure 1 plots the total value of U.S. agricultural output from 1949 to 2007. If U.S. agriculture had employed the same inputs but agricultural productivity had remained constant from 1949 forward, then the value of agricultural production would have followed the lower line. Thus we can say the (lower) dark shaded area represents the output attributable to inputs given constant 1949 technology and productivity, and the (upper) lighter shaded area represents the output attributable to productivity growth since 1949. By 2007, when the value of U.S. agricultural output was $281.5 billion, 78 percent of the output in that year ($219.6 billion) was attributable to productivity growth since 1949. Equivalently, absent that productivity growth, it would have taken 78 percent more inputs to achieve the same output as actually produced, so productivity growth since 1949 saved $219.6 billion worth of inputs in 2007 alone. In more concrete terms, it would take an additional 729.5 million acres combined with an additional farm labor force of 1.76 million full-time equivalents, as well as much more other inputs, to produce the 2007 output using 1949 technology.5
Although productivity growth in U.S. agriculture since 1949 yielded a benefit in 2007 alone worth $219.6 billion, the total U.S. public and private investment in agricultural research (including food R&D) in 2007 was only $11.1 billion. The fact that productivity growth has been so valuable relative to the investment in research accounts for the predominant finding in studies of the returns to agricultural research. Specifically, in present value terms, the reported benefits are worth 10–20 times the estimated costs, or more, even though only some of the productivity growth is attributable to organized public research and extension, and even after we account for the fact that it takes a very long time for the consequences of research investments to be reflected in productivity gains in farmers’ fields.6
A Slowdown in Agricultural Productivity GrowthDuring the past 20 years, we have witnessed a subtle but substantive shift, a progressive slowing of the rate of U.S. (and global) agricultural productivity growth from the historically high growth rates of the 1960s, 1970s, and 1980s. The consequences are profound. In every region of the United States, average annual multifactor productivity growth rates for the more recent period 1990–2007 were significantly slower than in the previous period 1949–1990: the national average rate fell from 2.02 percent per year for 1949–1990 to a much smaller 1.18 percent per year for 1990–2007 (Table 1). If this more recent, slower rate of multifactor productivity growth is sustained over the coming decades, the future path for U.S. agriculture will be much less prosperous than if productivity growth rates could be restored to those of the 1970s or 1980s. Similar patterns of productivity slowdown have been documented for many other countries, especially the other more-developed countries that, with the United States, have been historically the drivers of agricultural innovation around the world, and we have seen a corresponding productivity slowdown for the world as a whole, with Brazil and China standing out as notable exceptions.7 These trends alone imply both a change from the historical pattern of rapidly falling food commodity prices and changes in patterns of competitiveness and production.
Figure 1 | U.S. Agricultural Output Value Attributed to Productivity Growth, 1949–2007
Source: Updated from J.M. Alston, M.A. Andersen, J.S. James, and P.G. Pardey, Persistence Pays: U.S. AgriculturalProductivity Growth and the Benefits from Public R&D Spending (New York: Springer, 2010).
Total Value of Production
Value of Production Attributable to Inputs
Billions of dollars, nominal
0
50
100
150
200
250
300
1949 1956 1963 1970 1977 1984 1991 1998 2005

3Setting the Scene
A Slowdown in Agricultural Research InvestmentsWithin an evolving global agricultural and scientific context, the recent past has seen some drift in patterns of U.S. private and public research investments in agricultural R&D. There has been a slowdown in spending growth even though rates of return to agricultural productivity-related research are demonstrably very high, and despite slowing productivity growth and the prospects for additional challenges associated with the new bio-economy and climate change. The pace of growth in real (inflation-adjusted) public plus private investment in agricultural R&D slowed considerably during the past several decades, from 3.77 percent per year during the 1950s and 1960s, to 2.66 percent per year during the 1970s and 1980s, and slowing still further to just 1.20 percent per year during the years 1990–2009 (Figure 2). In
To make matters worse from the viewpoint of the world food equation, the prospects for the world’s poor, and stress on the natural resource base in the decades to come, the slowdown in trend productivity growth has coincided with two other major shifts. First, the rise of biofuels, significantly stimulated by U.S. ethanol mandates and other policies along with high oil prices, has diverted a significant share of the world’s agricultural capacity from producing food and feed to producing fuel, and there has been a corresponding diversion of agricultural R&D capacity to research on biofuels. Second, an evolving climate and attendant demands for adaptive innovations pose a new set of challenges such that simply to maintain current productivity may require an increased investment in farm productivity oriented research. Unfortunately, at the very time when current and prospective productivity performance is already of concern, present funding trends may exacerbate rather than ameliorate the problem.
Table 1 | Agricultural Multifactor Productivity Growth in the United States and Selected Regions
Average Annual Productivity Growth Ratesb
Regionsa 1949-2007 1949-1990 1990-2007
percent per year
United States 1.78 2.02 1.18
Northeast 1.72 2.16 0.67
Central 1.64 1.71 1.48
Northern Plains 2.04 2.32 1.38
Southern Plains 1.82 2.01 1.37
Southeast 1.96 2.49 0.68
Mountain 1.48 1.89 0.50
Pacific 1.82 2.02 1.33
Source: Updated version of Alston et al., Persistence Pays, Appendix Table 5-3.
a The regions are as follows: Mountain – Arizona, Colorado, Idaho, Montana, Nevada, New Mexico, Utah, Wyoming; Northern Plains – Kansas, Nebraska, North Dakota, South Dakota; Southern Plains – Arkansas, Louisiana, Mississippi, Oklahoma, Texas; Central – Illinois, Indiana, Iowa, Michigan, Minnesota, Missouri, Ohio, Wisconsin; Southeast – Alabama, Florida, Georgia, Kentucky, North Carolina, South Carolina, Tennessee, Virginia, West Virginia.
b The entries in this table are national (48 state) and regional and national (48 state) estimates of multifactor productivity growth rates that account for changes in the use of 58 different categories of inputs over the time periods examined. These include 32 categories of labor inputs, 12 categories of capital inputs (including seven physical capital categories and five biological capital categories), as well as 3 land categories, and 11 material input categories.

4Public Food and Agriculture Research in the U.S
the very recent past, funding for public agricultural R&D has moved from slowing down to cutting back: after adjusting for the rising costs of R&D, aggregate agricultural R&D spending declined in all but one year after 2004 such that real spending in 2009 was 7 percent below the corresponding amount in 2004.8
The consequences of this slowdown for future productivity may be exacerbated by the fact that the United States has also reduced the share of its total agricultural R&D investment spent on R&D designed to increase, or at least maintain, agricultural productivity. In 1976, around 64.6 percent ($339 million, or $1.473 billion in 2009 prices) of all state agricultural experiment station (SAES) research was so oriented. By 2009, only 56.3 percent ($2.046 billion) of SAES research sought to raise or maintain farm productivity, reflecting an average real rate of growth of spending on farm productivity oriented research of barely 1 percent per year since the mid-1970s. If anything, rather than a restoration of growth the recent trends in U.S. agricultural R&D spending portend a further slowdown in U.S. farm productivity growth in the decades to come. Major competitors—most notably China—have not slowed their spending on agricultural R&D, and their agricultural productivity growth has not slowed. If these patterns are sustained for more than a few years, we can anticipate that U.S. farmers (or at least those currently underserved by public and private innovation efforts) will find it increasingly difficult to compete globally. Even if the United States can benefit to some extent by adapting and adopting technology developed overseas, adaptive research takes time and the greatest benefits from particular innovations will accrue to the earlier adopters, and typically to those for whom the technology was designed.
Alston and colleagues projected U.S. agricultural multifactor productivity (MFP) growth under alternative research spending scenarios.9 Under a pessimistic scenario, with R&D spending growing in real terms at the 1990–2002 rate, the productivity path is quite flat, converging on a growth rate of 0.52 percent per year. Under an optimistic scenario with the real growth rate of R&D spending restored to that of the period 1949–2002, the productivity path accelerates toward a growth rate of 0.88 percent per year. However, even with revitalized funding, it will take many years to achieve that higher rate because of the very long lags between investing in R&D and full effects on productivity.10
Percent per year (2009 prices)
USDA Intramural SAES Total
4.0
3.5
3.0
2.5
2.0
1.5
1.0
0.5
0.01950-60s 1970-80s 1990-2000s
Sources: The SAES R&D series (excluding forestry) from 1985 to 2009 is from USDA sources cited in Alston et al., Persistence Pays, Appendix III, and for more recent years from USDA, CRIS (various years). The USDA intramural series for years prior to 1985 are also from the USDA sources cited in Alston et al., Persistence Pays, Appendix III. For the periods 1985 to 1989 and 1990 to 2009 they are from National Science Foundation (NSF), “Table 2: Federal Outlays for Research and Development, by Agency: Fiscal Years 1967-2002,” Federal Funds for Research and Development, Detailed Historical Tables: Fiscal Years 1951-2002 (Arlington: National Science Foundation, 2012), http://www.nsf.gov/statistics/nsf03325 and NSF, “Table 95: Federal outlays for research and development, by agency: FY 2000-2010,” Federal Funds for Research and Development: Fiscal Years 2008–10, Detailed Statistical Tables NSF 12-308 (Arlington: National Science Foundation, 2012), http://www.nsf.gov/statistics/nsf12308/content.cfm?pub_id=4121&id=2, respectively.
Notes: Public agricultural R&D includes SAES and USDA intramural spending, exclusive of forestry research. The series was deflated using an agricultural R&D deflator from Pardey, P.G., C. Chan King, M.A. Andersen. U.S. Agricultural R&D Deflator, 1890-2010. Staff Paper, Department of Applied Economics. (St. Paul: University of Minnesota, 2012). Average annual growth rates were calculated using the least-squares method described in World Bank, World Development Indicators 2012 (Washington, DC: World Bank, 2012), http://data.worldbank.org/data-catalog/world-development-indicators/wdi-2012, p. 402.
Figure 2 | Agricultural Research Spending Slowdown
5Setting the Scene
Implied ImperativesEconomic arguments and evidence justify substantially enhanced and revised public roles in U.S. agricultural R&D. The formal evidence is clear and compelling: public agricultural R&D yields benefits to producers and consumers worth many times more than the costs, and agricultural R&D has been systematically underfunded despite past policies to encourage or supplement private investment. Recent trends call for a redoubled investment, especially in farm productivity oriented agricultural R&D. But, if anything, the problem of underfunding is getting worse, and the scientific staff critical for continued innovation in agriculture are aging and shrinking in numbers. Even within agricultural policy circles, other issues typically rank above enhanced support for public agricultural R&D as matters of urgent priority. Why is it so? Agricultural R&D is “slow magic.” Most people are impatient, many are skeptical, and the links from investing in R&D and achieving productivity growth are largely invisible. The effects occur with long time lags, often indirectly, and it is difficult to ascribe productivity growth definitely to particular research investments versus other causes amidst the many influences at work without undertaking detailed and painstaking analysis.
Some commentators seem to expect that we can take productivity growth for granted, or that we can rely on the private sector to play all the required roles. But careful examination of what the private sector is doing, and where its effects will be felt, suggests that many opportunities for socially profitable research investments will be neglected unless public policies change.11 In addition, the private sector typically focuses its effort on the development end of the R&D spectrum, with an eye to developing commercial applications of new ideas and technologies that yield market rewards of increased productivity and profitability for those who develop and deploy the resulting innovations. Much of this effort stands firmly on the shoulders of the more basic, sometimes “blue sky” research that can have, and demonstrably has had, large social value. This type of research is often best conducted in public settings, where the scientific incentives reward research accomplishments without an explicit eye to their commercial consequences.
Seen from this perspective, public and private R&D are more often complements rather than substitutes, suggesting that as well as revitalizing public research, attention should be paid to creating incentives for public-private linkages rather than cutting back on publicly conducted (as distinct from publicly funded) R&D in the belief that the private sector will fill the void.12 The evolving institutional arrangements for Australian wheat research funding and performance provide an interesting example.13
In the next section, we document the recent trends indicating that rates of private and public investment in agricultural R&D have slowed and in some areas declined, and that a shrinking share of the total investment is being devoted to farm productivity oriented research. The implications are easy to anticipate. Persistent underinvestment will impose increasingly large costs on the national economy over time in the form of (a) forgone net national income, (b) increased pressure on the U.S. and global natural resource base, (c) higher trend food commodity prices, and (d) a progressive and persistent decline in U.S. competitiveness. These dire consequences will develop gradually, progressively, and cumulatively, and although they may be largely invisible to many people, they will matter much and they will persist for a long time.
The long-term dynamic relationships matter for policy. Agricultural R&D generally takes 10–20 years to have its full effects on productivity, and then the effects persist for another 10–20 years. These long lags mean that to a great extent the die is already cast for productivity patterns over the next 10–20 years, but action taken today can begin to have substantial effect within 15–20 years. If we are to achieve important changes in the productivity path of U.S. (and global) agriculture for the decades of the 2030s and 2040s and beyond, it is necessary to make substantial changes in the patterns of investments in agricultural R&D now. In subsequent sections of this report, we discuss appropriate federal government roles in U.S. agricultural R&D, priorities for investment, and potential initiatives that could be introduced to revitalize the time path of agricultural science and reinvigorate the productivity dividend that flows from it.

6Public Food and Agriculture Research in the U.S
U.S. Research and Development TrendsTrends in the sources of funding and amounts invested in agricultural R&D in the United States, and evolving public and private-sector roles, can be better understood by considering U.S. agricultural R&D spending in the contexts of both broader science spending and global agricultural R&D.
Global and Broader R&D Context for U.S. Agricultural R&DIn 2006, about $1,023 billion (2005 international dollars), or 1.7 percent of global GDP, was spent on all the sciences worldwide.14 Patterns of R&D spending changed significantly in the past two decades. Global spending on R&D more than doubled in real terms between 1980 and 2006. The United States accounted for 31 percent of the world’s science spending in 1980 and 33 percent in 2006. Collectively, the high-income countries (those with 2010 per capita incomes in excess
of $10,726) accounted for 81 percent of the world’s R&D in 2006.15 The low- and middle-income country share of the world total has changed little over time although China, India, and Brazil have accounted for a growing and now dominant share of the developing world total. These three countries collectively accounted for just 12 percent of total R&D spending by the low- and middle-income countries in 1980; but this share had risen to 63 percent (or 12 percent of the corresponding total spending worldwide) by 2006. China ranked third, behind the United States and Japan, in total science spending worldwide in 2006 (denominated in international dollars), South Korea ranked seventh, India ninth, and Brazil twelfth.
Overall U.S. Science SpendingIn 2009, the United States invested $400.5 billion current U.S. dollars in all areas of R&D, substantially up from the $5.2 billion it invested in 1953 when these data were first collected (Figure 3, left side). About 86.4 percent ($346 billion) of total science spending in 2009 was non-defense-related, compared with 67.4 percent in 1967.16
All R&DIndustry$ 288.8 billion
Federal gov't$ 30.9 billion
Universities and colleges$ 59.4 billion
Other non-profit$ 21.4 billion
72.1%
7.7%14.8%5.3%
57.2%
11.3%
4.4%27.1%
AgriculturalR&D Industry
$ 6.3 billion
Federal gov't$ 1.3 billion
Other universities andcolleges $ 0.5 billion
SAES$ 3.0 billion
Total universities and colleges $3.5 billion, 31.5 %
$400.5 billion $11.1 billion
Sources: All R&D spending figures are from NSB, “R&D: National Trends and International Comparisons,” Chapter 4 in Science and Engineering Indicators 2012 (Arlington: National Science Foundation, 2012), http://www.nsf.gov/statistics/seind12/pdf/c04.pdf. For public agricultural research series see Figure 2 (SAES excludes forestry). Private food and agricultural research series are from S. Dehmer and P.G. Pardey, “Private Food and Agricultural R&D in the United States, 1953-2009” (International Science and Technology Practice and Policy (InSTePP) Center Report, University of Minnesota [in preparation]).
Notes: All figures are in nominal U.S. dollars. The “Other Universities and Colleges” category of agricultural R&D spending includes 1890 Colleges, Veterinary Schools, Cooperating Extension Institutions, and Other Cooperating Institutions. The agricultural R&D series includes spending in all U.S. 50 states and D.C., and excludes research expenditures by Forestry Schools, which are reported by USDA, CRIS to total $174.3 million in 2009. The “All R&D” figure includes R&D performed by industry FFRDCs (Federally Funded Research and Development Centers).
Figure 3 | U.S. R&D Spending By Performing Sectors, 2009

7U.S. Research and Development Trends
Around 77 percent of the total R&D in the United States was done by private entities in 2009: about 72 percent by industry and 5 percent by nonprofit organizations (Figure 3, left side). The industry share of total R&D has varied somewhat over time, fluctuating between 70 and 80 percent since the 1950s, and around 70–75 percent in the most recent decade. The share of research performed by federal government labs has fallen over time from around 20 percent in 1955 to 8 percent in 2009, about half the corresponding university and college share of 15 percent, which is substantially up from its 8 percent share in 1953.
Although it performed only 8 percent of total U.S. R&D in 2009, the federal government funded 30 percent. Although the nondefense (civilian) share of research in the United States has risen over the past several decades (Figure 4, Panel a), in 2009 around 43 percent of all federal government funding for R&D ($54.5 billion) was still disbursed by way of the Department of Defense (DOD) (Figure 4, Panel b). Most of this DOD spending (90.5 percent) went into development—predominantly encompassing the costs of developing, testing, and evaluating defense
Sources: Adapted from Dehmer and Pardey, “Private Food and Agriculture.” Panel a: Public and private R&D totals are from NSB“R&D: National Trends and International Comparisons.” Chapter 4 in National Science Board, Science and Engineering Indicators 2012 (Arlington VA: National Science Foundation, 2012). http://www.nsf.gov/statistics/seind12/pdf/c04.pdf, and NSB, “R&D: National Trends and International Comparisons,” Science and Engineering Indicators 2012, Appendix Table 4-35 (Arlington VA: National Science Foundation, 2012), http://www.nsf.gov/statistics/seind12/pdf/at.pdf.The Department of Defense R&D expenditures used to construct the nondefense share of R&D are from NSF, “Table 2: Federal Outlays.” Civilian R&D is from OECD, Main Science and Technology Indicators Vol 2012 release 01, OECD. StatExtracts Database (Paris: Organisation for Economic Co-operation and Development, 2012), http://stats.oecd.org. Panel b: NSF, “NSF Survey of Federal Funds for Research and Development,” WebCaspar Database. (Arlington, VA: National Science Foundation, 2012), http://webcaspar.nsf.gov/. Implicit GDP deflator used to express R&D in 2000 prices from BEA, “National Income and Product Accounts (NIPA) Tables” (Washington, DC: United States Department of Commerce, 2012), http://www.bea.gov/national/nipaweb/SelectTable.asp.
Notes: Panel a: Public totals are the sum of research performed by the federal government agencies and universities and colleges (including Federally Funded Research and Development Centers). Research and development performed by state agencies is not explicitly considered. Private total is the sum of R&D performed by industry and nonprofit agencies (including Federally Funded Research and Development Centers). Nondefense share of R&D is calculated by subtracting the Department of Defense R&D expenditures from the domestic total. Civil R&D is another estimate of nondefense R&D produced by the OECD. Panel b: Sector shares are by performer of R&D. Panel b: DOD indicates Department of Defense, DHHS indicates Department of Health and Human Services, and USDA indicates U.S. Department of Agriculture. The inset represents the real annual rate of growth in R&D outlays by agency between 1967 and 2009 (calculated using the regression method).
0
10
20
30
40
50
60
70
80
1967 1973 1979 1985 1991 1997 2003 2009
DOD
Other
DHHS
USDA
Billions of dollars, 2009
0
10
20
30
40
50
60
70
80
90
100
0
50
100
150
200
250
300
350
1953 1961 1969 1977 1985 1993 2001 2009
Billion of U.S. dollars, 2009 prices Percentage
Civil R&D Share (right-hand axis)
Private R&D
Public R&D
Non-defense R&D Share(right-hand axis)
Figure 4 | Structure of Science Spending in the United States
Panel a: Overall public (civilian and defense) and private R&D trends, 1953–2009
Panel b: U.S. Federal Government R&D Spending by Department, 1967–2009
8Public Food and Agriculture Research in the U.S
systems, technologies, and components.17 Moreover, most DOD-funded research (74 percent) was carried out by industrial firms.18
The orientation of R&D performed in the United States has shifted markedly over the years, along with the R&D spending priorities of the federal government. Federal outlays on all forms of R&D grew nominally from $16.1 billion in 1967 (1.9 percent of GDP in that year) to $112.2 billion (0.8 percent of GDP) in 2009, a nominal rate of growth of 5.4 percent per year (or 1.5 percent per year once inflation is taken into account using an implicit GDP deflator). Federal research disbursements to the DOD were $7.7 billion (or 47 percent of total federal outlays on R&D) in 1967 and $54.5 billion in 2009 (42.6 percent of the federal total) (Figure 4, Panel b). The major growth area was research spending by the Department of Health and Human Services (DHHS), in particular spending directed to the National Institutes of Health (NIH). Inflation-adjusted federal government R&D spending by the United States Department of Agriculture (USDA) grew 1.5 percent per year during the 40-year period after 1967 compared with 7.0 percent per year for the National Science Foundation (NSF), 4.7 percent per year for DHHS, and 1.7 percent per year for DOD. The combined R&D expenditures by all other federal government departments (including the Department of Energy, DOE) decreased by 0.3 percent per year.
Although both federal government funding and the emphasis of academic R&D swung heavily toward life sciences R&D in the past several decades, this additional funding largely bypassed the agricultural sciences, a branch of the biological-cum-life sciences. The agricultural research share of federal government funds directed to the life sciences declined precipitously, from 10.7 percent in 1980 to just 3.4 percent in 2009, an average rate of decline in federal spending on the agricultural sciences of 6.8 percent per year.19 Likewise, in 1980 about 23.0 percent of academic life sciences research was oriented to agriculture, but by 2009, it was just 11.2 percent.
Global Public and Private Agricultural R&D20
Agriculture’s share of global R&D is generally modest. Total (public and private) R&D spending by rich countries oriented toward agriculture has remained steady among the developed countries in the 2–3 percent range since 1980. In contrast, among developing countries the share of public research spending directed to agriculture declined from 21.7 percent in 1980 to 8.4 percent in 2005, albeit still more than four times the corresponding rich-country share.
Worldwide, public investment in agricultural R&D increased by 73.4 percent in inflation-adjusted terms (2005 base-year prices) between 1980 and 2005, from an estimated $15.9 billion to $27.5 billion in 2005 international dollars (Figure 5). The low- and middle-income countries as a group accounted for about 45 percent of global public-sector spending in 2005, up from their estimated 38 percent share in 1980. Public spending on agricultural R&D is highly concentrated among countries, with the top 5 percent of countries in the data set (just six countries in a total of 126) accounting for over half of the spending (55 percent in 2005) and the top 15 percent of countries accounting for more than 80 percent of spending.
Public agricultural research spending grew faster in the low- and middle-income countries than in the high-income countries as a group during both the 1980s and the 1990s. Moreover, driven largely by trends in the larger economies, the overall annual rate of increase in the low- and middle-income countries was slower during the 1990s (2.20 percent per year on average) than the 1980s (2.96 percent per year on average). Likewise, the rate of growth in the OECD countries slowed markedly during the 1990s (2.12 percent per year in the 1980s, down to 1.62 percent per year in the 1990s), which combined to cause the global annual rate of growth in public agricultural R&D spending to be substantially slower in the 1990s (1.86 percent per year) than the 1980s (2.45 percent per year). The developing country, Asia and Pacific region gained considerable ground, accounting for an ever-larger share of the world

9U.S. Research and Development Trends
and low-plus-middle-income country total since 1980 (24.9 percent of the world total in 2005, up from 14.2 percent in 1980).21 In 2005, just two countries from this region, China and India, accounted for 43.5 percent of all expenditure on public agricultural R&D by low- and middle-income countries, almost double their 25.9 percent combined share in 1980.
The private sector has continued to emphasize inventions that are amenable to various intellectual property (IP) protection options such as hybrid crops, patents, and more recently, plant breeders’ rights, along with other (sometimes technological) forms of protection. The private sector has a large presence in agricultural R&D, but with dramatic differences among countries. In 2000, the global total spending on agricultural R&D (including pre-, on-, and post-farm oriented R&D) was estimated to be $36.2 billion (2005 international dollars).22 Private firms conducted approximately one-third of the research and public agencies conducted the remaining two-thirds. Notably, researchers in developed countries performed more than 90 percent of that private agricultural R&D. In those countries, approximately one-half the total agricultural R&D was privately funded.
U.S. Agricultural Research Spending23 In 2009, an estimated $11.1 billion was spent on food and agricultural R&D performed in the United States—including intramural research undertaken by the USDA and the State Agricultural Experiment Stations (SAESs) plus the private-sector totals discussed immediately above. This agricultural R&D total represented just 2.8 percent of the total spending on all areas of R&D in the United States in 2009. The public sector performed just over 42.8 percent of U.S. agricultural R&D, compared with only 22.5 percent of the total for all areas of R&D. Universities and colleges conducted nearly 32 percent of total agricultural R&D in 2009 compared with 14.8 percent of R&D generally; similarly, federal government research labs conducted 11.3 percent of agricultural R&D compared with 7.7 percent of R&D overall.
In the United States today, the private sector spends more than the public sector on agricultural research, but it has not always been so and the emphasis of that spending is different, reflecting different incentives and opportunities available to the private sector (Figure 6).24 According to Dehmer and Pardey, in 2009 $6.3
China7%
Japan13%
USA17%
Other highincome32%
Other lowand middle
income31%
1980China14%
Japan11%
USA16%Other high
income28%
Other low andmiddle income
31%
2005
$ 15.9 billion $ 27.5 billion
Figure 5 | Global Public Agricultural R&D Spending, 1980 and 2005
Sources: From P.G. Pardey, C. Chan-Kang, and S. Dehmer, Global Food and Agricultural R&D Spending, 1960-2009 (InSTePP Report, University of Minnesota, 2012). Notes: Data in nominal local currency units were first deflated with an implicit GDP deflator to 2005 prices then converted to international dollars using 2005 purchasing power parity conversion factor from World Bank, World Databank. Data exclude Former Soviet Union countries and Eastern European countries.
10Public Food and Agriculture Research in the U.S
80 percent in the period 1956–1958.27 Agriculture’s share of total private R&D in the United States has fluctuated between 1.4 and 3.0 percent since 1953, with an overall declining trend since 1977.
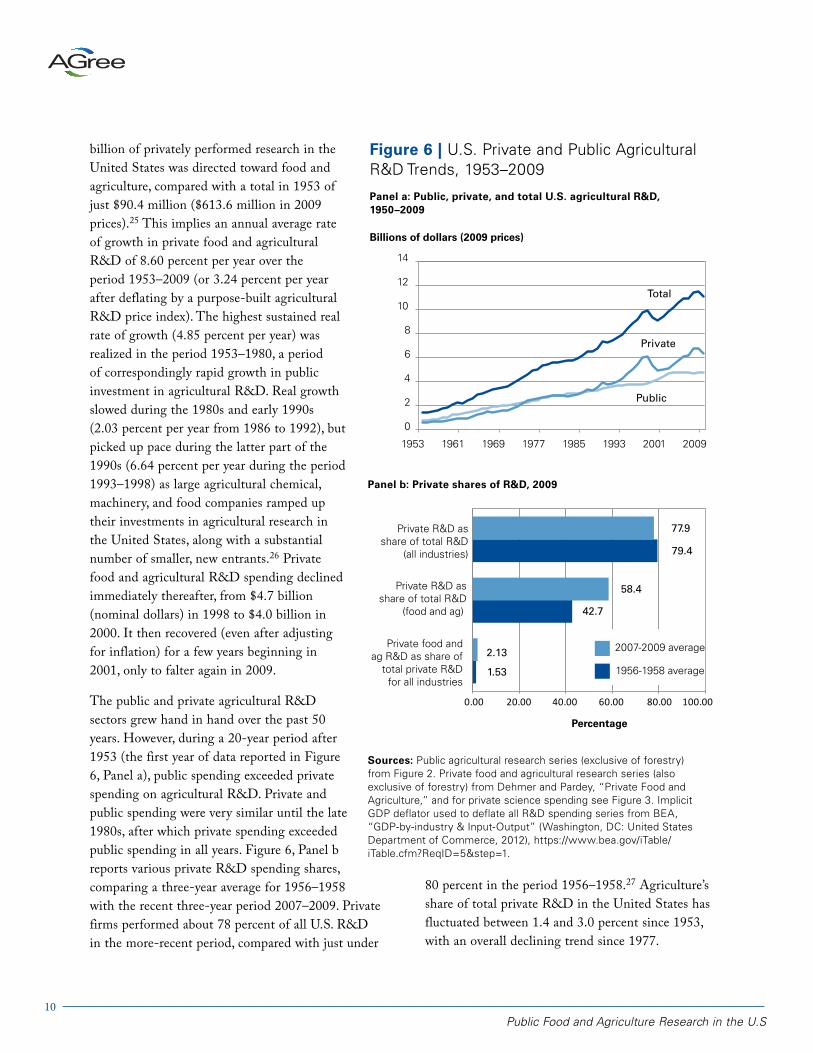
billion of privately performed research in the United States was directed toward food and agriculture, compared with a total in 1953 of just $90.4 million ($613.6 million in 2009 prices).25 This implies an annual average rate of growth in private food and agricultural R&D of 8.60 percent per year over the period 1953–2009 (or 3.24 percent per year after deflating by a purpose-built agricultural R&D price index). The highest sustained real rate of growth (4.85 percent per year) was realized in the period 1953–1980, a period of correspondingly rapid growth in public investment in agricultural R&D. Real growth slowed during the 1980s and early 1990s (2.03 percent per year from 1986 to 1992), but picked up pace during the latter part of the 1990s (6.64 percent per year during the period 1993–1998) as large agricultural chemical, machinery, and food companies ramped up their investments in agricultural research in the United States, along with a substantial number of smaller, new entrants.26 Private food and agricultural R&D spending declined immediately thereafter, from $4.7 billion (nominal dollars) in 1998 to $4.0 billion in 2000. It then recovered (even after adjusting for inflation) for a few years beginning in 2001, only to falter again in 2009.
The public and private agricultural R&D sectors grew hand in hand over the past 50 years. However, during a 20-year period after 1953 (the first year of data reported in Figure 6, Panel a), public spending exceeded private spending on agricultural R&D. Private and public spending were very similar until the late 1980s, after which private spending exceeded public spending in all years. Figure 6, Panel b reports various private R&D spending shares, comparing a three-year average for 1956–1958 with the recent three-year period 2007–2009. Private firms performed about 78 percent of all U.S. R&D in the more-recent period, compared with just under
Figure 6 | U.S. Private and Public Agricultural R&D Trends, 1953–2009
Panel a: Public, private, and total U.S. agricultural R&D, 1950–2009
0
2
4
6
8
10
12
14
1953 1961 1969 1977 1985 1993 2001 2009
Billions of dollars (2009 prices)
Total
Private
Public
0.00 20.00 40.00 60.00 80.00 100.00
Percentage
Private R&D asshare of total R&D
(all industries)
Private R&D asshare of total R&D
(food and ag)
Private food andag R&D as share of
total private R&Dfor all industries
79.4
77.9
42.7
58.4
1.53
2.13 2007-2009 average
1956-1958 average
Sources: Public agricultural research series (exclusive of forestry) from Figure 2. Private food and agricultural research series (also exclusive of forestry) from Dehmer and Pardey, “Private Food and Agriculture,” and for private science spending see Figure 3. Implicit GDP deflator used to deflate all R&D spending series from BEA, “GDP-by-industry & Input-Output” (Washington, DC: United States Department of Commerce, 2012), https://www.bea.gov/iTable/iTable.cfm?ReqID=5&step=1.
Panel b: Private shares of R&D, 2009

11U.S. Research and Development Trends
Evolving Federal Roles in U.S. Public Agricultural R&D Current spending patterns reflect the consequences of an evolution over the past 150 years, with significant recent shifts in the balance among sources of funding, in the roles played by different agencies, and in the topical emphasis of investments in the context of flattening growth paths. In this section, we summarize the current patterns before discussing how we got here.
Funding Flows and Performance of U.S. Public Agricultural R&D, 2010Of the $3.63 billion spent on agricultural R&D by the SAESs and related institutions (including schools of veterinary medicine or forestry, and the 1890 institutions) in 2009, 38.0 percent came from federal sources, 38.3 percent from state government, 8.2 percent from industry grants and contracts, and 15.5 percent from income earned from sales, royalties, and various other sources (Figure 7). Research conducted by USDA labs was almost entirely reliant on federal government funding: $1.47 billion (or 96.3 percent of the total of $1.53 billion) of that research in 2009 was so funded.
Figure 7 | Funding Channels for U.S. Public-Sector Agricultural R&D, 2009
Sources: Compiled by authors from unpublished USDA, CRIS data files.
Notes: All data are reported in millions of nominal U.S. dollars. SAES series spans all U.S. states, DC and territories. a. ERS expenditures were obtained from ERS (personal communication) as no ERS data were not reported in CRIS after 2006. We applied the 2006 shares of USDA in-house, contracts and other grants to apportion the ERS intramural estimate of $76.7 million to USDA intramural funding sources.
SAESs $3,022.0
Veterinary medicine schools $361.5
Forestry schools $169.51890 institutions $69.9For SAES research
Other Cooperating institutions $59.3NIFA administered Formula funds $251.7
Total $3,682.3 Competitive funds $132.3 USDA grants and contracts $155.3
Other grants and contracts $175.8
Total $715.1
Regular in-house(block grants)
$1,384.2 Agricultural ResearchService $1,085.8
Contract $9.2 U.S. Forest Service
Economic Research Service* $76.7
$360.0Other $72.1
Total $1,465.5Total $1,522.5
Public Funding Sources Research Performers Other Funding Sources
SAESs and related institutions
Federal funds from USDA
Industry grants andcontracts $296.4
$13.5
Non-USDA federal funds
Total public (federal and state)$5,204.8
Other non-federal fundsFor intramural USDA research USDA intramural
For SAES research $312.3
For SAES research $689.5
For USDA research $43.6
For intramural USDAresearch
State governments $1,415.3
Self-generated funds $253.7

12Public Food and Agriculture Research in the U.S
The current structure of funding for SAES research represents a significant departure from past patterns of support. During the founding phases of the SAESs, the federal government was a significant source of support, accounting for an average of 68.0 percent of total SAES funding during the 1890s (Figure 8). Putting aside the years of the Great Depression and Second World War, the state government share of total SAES funding grew fairly steadily from 1890 to a peak of 69.3 percent in 1970. Since then, the state government share of SAES funding has declined dramatically, down to 38.3 percent in 2009. Beginning in 1975, funding from industry, self-generated funds, and other nonfederal funds was on the rise, accounting for 23.7 percent of total SAES funding in 2009 (and 62 percent of total funding when combined with state appropriations).28
Although SAES funding from federal sources has been increasing by an annual average (inflation-adjusted) rate of 3.73 percent per year since 1890 (against the corresponding rate of growth in total SAES funding of 4.15 percent per year), the composition of those funds has changed too. In the United States, the federal government funds agricultural research through a variety of mechanisms. Historically, the USDA was the primary federal government agency channeling funds to the SAESs, mostly through the Cooperative State Research Education and Extension Service (CSREES, now NIFA), but that has changed. In 1975, the USDA disbursed about 74 percent of the federal funds flowing to the SAESs through a combination of formula funds, grants, and contracts, but by 2009 that had declined to about 50 percent. A wide range of federal agencies now disburses the other half of federal funds, including NSF, NIH, DOE, DOD, the U.S. Agency for International Development (USAID), and others. The NIFA share of federal funding for SAES research also declined (from 66 percent in 1975 to 39 percent in 2009), such that NIFA now oversees just 16 percent of total SAES funding (Figure 9).
0
10
20
30
40
50
60
70
80
0.0
0.5
1.0
1.5
2.0
2.5
3.0
3.5
4.0
1890
1900
1910
1920
1930
1940
1950
1960
1970
1980
1990
2000
Billions of dollars (2009prices) Percentage
2009
State government share(right-hand axis)
Other sources share(right-hand axis)
State sources
Federalsources
Other sources
Sources: See Figure 2 for data details.
Notes: SAES funding includes 48 contiguous states, excluding Alaska and Hawaii, and are inclusive of all R&D performed by the SAESs and other cooperating institutions. Nominal research funding data were deflated by a U.S. agricultural research price index reported in Pardey, P.G., C. Chan King, M.A. Andersen. U.S. Agricultural R&D Deflator, 1890-2010. Staff Paper, Department of Applied Economics. (St. Paul: University of Minnesota, 2012).
Figure 8 | SAES Research Expenditures by Sources of Funds, 1890–2009
Figure 9 | USDA Roles in Funding SAES Research, 1970–2009
Sources:See Figure 2 for data details.
Notes: SAES total includes 48 contiguous states. Data are inclusive of all but the forestry R&D performed by the SAESs, other cooperating institutions, and the USDA.
Percentage
0
10
20
30
40
50
60
70
80
1890 1905 1920 1935 1950 1965 1980 1995 2009
NIFA share of SAES
Federalshareof SAES
USDA share oftotal federal
NIFA share oftotal federal

13U.S. Research and Development Trends
Behind these overall national trends lies a good deal of variation among states in their sources of support and the pattern of change in those funding sources over time. On average between 2007 and 2009, federal funding accounted for 38.3 percent of all SAES funding, and state governments paid 39.2 percent, such that $1.02 of state funding flowed to the SAESs for every dollar of federal funding support (Table 2). This is well below the $2.68 of state funding for every dollar of federal support in the 1920s. In 2009, the Plains and Southeast regions averaged more than $1.25 from state sources for every dollar of federal support, and the Pacific and Central regions received almost equal shares of federal and state funding, whereas the Mountain and Northeast regions each spent less than one dollar of state funding for each dollar coming from federal government coffers.
The public provision of extension services in the United States is essentially a state or local activity. Consequently, in 2006 (the latest year for which these data are available), funds from within-state sources accounted for 79 percent of the total funds for extension. Federal funds accounted for the remaining 21 percent, well down from the peak federal share of 62 percent in 1919. In contrast to the funding trend for public R&D, funding for extension from within-state (mainly state and county government) sources increased from 72 percent in 1990 to 79 percent in 2006. During this period, the share of funding for extension from federal sources dropped from 28 percent in 1990 to 21 percent in 2006 (in contrast to the trends in funding for SAES research where the federal share grew from 28 percent in 1990 to 38 percent in 2009). This trend reflects a shift of priorities of federal funding away from extension and toward research.
Table 2 | Ratio of State to Federal Government Support for SAES Research, 1920s–2000s
1920s 1950s 1980s 2000s
Total United States 2.68 2.95 1.81 1.05
48 States:
Average 2.68 2.95 1.81 1.06
Minimum 0.03 0.55 0.40 0.20
Maximum 11.20 13.44 3.96 3.26
Selected States:
California 10.20 13.44 2.57 1.03
Minnesota 6.57 4.06 3.01 1.57
Wyoming 0.63 1.63 1.52 2.08
Regions:
Pacific 4.80 8.49 2.05 1.03
Mountain 1.15 1.98 1.20 0.61
Northern Plains 2.13 2.44 2.06 1.51
Southern Plains 2.42 2.39 2.41 1.53
Central 5.52 3.23 1.50 0.97
Southeast 1.70 2.11 2.39 1.42
Northeast 2.26 2.81 1.30 0.69
Sources: See Figure 2 for details of agricultural research series.
Notes: The figures for the total United States include all 50 states and D.C. The value for the 1920s is a simple average of 1921–1930 observations, and similarly for remaining decades except the 2000s, which is an average for 2001–2009. In this compilation, research data exclude U.S. territories.

14Public Food and Agriculture Research in the U.S
Spending on extension slowed earlier and has fallen substantially in recent decades. In 1915, the government made federal funds available for cooperative extension between the USDA and various state extension agencies for the first time. In that year, almost $1.5 million of federal funds was combined with $2.1 million made available from various state and local government sources for a total of $3.6 million. This total grew by 6.73 percent per year to reach $1.76 billion by 2006. Extension spending grew hand-in-hand with public spending on agricultural R&D for much of the first half of the 20th century. Then, during the period 1950–1980, inflation-adjusted growth in extension spending slowed to 2.39 percent per year, compared with 3.42 percent per year for agricultural R&D. During the period 1980–2006, extension spending shrank by 0.25 percent per year while public agricultural R&D continued to grow, but only by 0.79 percent per year.
A Spending SlowdownIn 1889, shortly after Congress passed the Hatch Act, federal and state spending appropriations for agricultural R&D totaled $0.98 million. More than a century later, in 2009, the public agricultural R&D enterprise had grown to $4.72 billion, a long-run annual rate of growth of 7.72 percent per year in nominal terms and 3.93 percent per year in real (inflation adjusted) terms.29 For much of the first half of the 20th century (specifically 1903–1942), intramural USDA and SAES research accounted for roughly equal shares of public research spending, after which the SAES share grew to a peak of 74 percent of total public spending on agricultural R&D in 1998 (Figure 10). Thereafter, nominal SAES and intramural USDA spending (excluding forestry) grew at about the same rate (around 4 percent per year), such that the USDA share of U.S. publicly performed agricultural R&D remained stable at around 28 percent between 2002 and 2009.
Beginning in the middle of the 20th century, U.S. agricultural R&D spending experienced several distinct growth phases. Public and private spending on all science, including agricultural R&D, surged during the 1950s and 1960s, growing at an annual average rate of 7.9 percent per year during this period (Figure 11, Panel a). Thereafter, the real rate of growth of U.S. science spending progressively slowed to average of around 3.6 percent per year during the period 1970–2009. The slowdown in total agricultural R&D spending growth has been even more dramatic and is ongoing: from 3.77 percent per year during the years 1953–1970 (in real terms), to 1.85 percent per year for 1970–2009, and dropping farther to just 1.20 percent per year for 1990–2009 (Figure 11, Panel b).30 Moreover, in more recent years real public spending on agricultural R&D has begun to contract, dropping from $5.03 billion (2009 prices) in 2005 to $4.71 billion in 2009. In all subperiods, total spending on private and public science grew faster than spending on agricultural R&D such that agricultural R&D as a share of total U.S. science spending gradually slipped from 4.0 percent in 1953 to an estimated 2.8 percent in 2009.31
Figure 10 | U.S. Public-Sector Agricultural R&D Spending by Performing Agencies, 1890–2009
Sources: SAES research series (total excluding forestry research) and USDA intramural series from Figure 2.Notes: Nominal research expenditure data were deflated by a U.S. agricultural research price index reported in Pardey, P.G., C. Chan King, M.A. Andersen. U.S. Agricultural R&D Deflator, 1890-2010. Staff Paper, Department of Applied Economics. (St. Paul: University of Minnesota, 2012). SAES Total includes 48 contiguous states, excluding Alaska and Hawaii, which totaled $34.0 million in 2009—just 0.93 percent of the 50 state total. These data are inclusive of all but the forestry R&D performed by the SAESs and other cooperating institutions and the USDA.
0
10
20
30
40
50
60
0.0
0.5
1.0
1.5
2.0
2.5
3.0
3.5
4.0
1890 1905 1920 1935 1950 1965 1980 1995
Expenditures(billions of 2009 US$)
SAES Total(left- hand axis)
USDA Intramural(left-hand axis)
USDA intramural shareof total public ag R&D(right-hand axis)
Percent
2009

15U.S. Research and Development Trends
Spatial Patterns in Research Funding and PerformanceTable 3 gives some perspective on the geographically dispersed nature of SAES research. Averaging across all 48 contiguous states, $75.7 million was spent per SAES in 2009, but with a large range around that average. California ranked first with $339.7 million of agricultural R&D (performed throughout the state, but with the Experiment Station located primarily on the University of California campuses in Davis, Berkeley, and Riverside). New Hampshire ranked last, with just $5.8 million spent on research conducted by its SAES.
Where the research is performed is one aspect; who pays for it is another. Table 3 points to very substantial differences among states in terms of who pays for the R&D. States that are smaller in terms of their agricultural R&D investments or their agricultural production or both tend to rely more heavily on federal funding. At the same time, states with larger agricultural sectors tend to spend more than smaller states on agricultural research. The right-hand column in Table 3 normalizes SAES spending by the value of agricultural production, a type of agricultural research intensity ratio. On average $1.15 was spent on SAES research for every $100 of state agricultural output. Three states—Rhode Island, Massachusetts, and Connecticut—each spent $5 or more on public agricultural research per $100 of agricultural output, whereas 15 states had public research intensity ratios less than $1 per $100.
Shifting Patterns of Spending on U.S. Agricultural R&DAlong with changes over time in total funding for agricultural R&D, and who pays for it, there has been an evolution in the intensity of total investment and the orientation of the investment between research and extension, between commodity-oriented and non-commodity-oriented research, and whether research is focused on farm productivity. Enhanced productivity as a result of agricultural R&D means that consumers have access to a more abundant, cheaper, safer, higher quality, more diverse, and more convenient food supply, produced with lower stress on the natural resource base and the environment. But the relevant
Figure 11 | Research Spending Slowdown: Five-Year Moving Average of Annual Rates of Change
Sources: Public agricultural R&D series (excluding forestry) were extracted by authors from unpublished USDA, CRIS data tapes. Private agricultural R&D series (also excluding forestry) from 1953–2006 are from Dehmer and Pardey, “Private Food and Agricultural R&D,” whereas the 2007–2009 data were estimated by applying the 2006 ratio of private-to-public agricultural R&D to the 2007 to 2009 public agricultural R&D estimates. Total R&D from 1953 to 2003 is from NSF (National Science Foundation. National Patterns of R&D Resources: 2008 Data Update. NSF 10-314 (Arlington: National Science Foundation, 2010), http://www.nsf.gov/statistics/nsf10314/, and the 2004–2009 data are from NSB, “R&D: National Trends and International Comparisons,” Chapter 4 in National Science Board, Science and Engineering Indicators 2012 (Arlington: National Science Foundation, 2012), http://www.nsf.gov/statistics/seind12/pdf/c04.pdf.
Notes: Nominal research expenditure data were deflated by GDP implicit deflator downloaded from BEA, NIPA table 1.1.9. Line plots represent five-year moving averages of annual growth rates and are calculated using the exponential growth rate (which assumes continuous growth), as described, for example, by World Bank, World Development Indicators, p. 403. The “All R&D” series in Panel a were deflated by an implicit GDP deflator, and the “Agricultural R&D” series in Panel b was deflated with an agricultural R&D deflator.
1614121086420-2
1958
1961
1964
1967
1970
1973
1976
1979
1982
1985
1988
1991
1994
1997
2000
2003
2006
2009
Public Private Total
perc
enta
ge p
er y
ear
14121086420-2-4
1958
1961
1964
1967
1970
1973
1976
1979
1982
1985
1988
1991
1994
1997
2000
2003
2006
2009
perc
enta
ge p
er y
ear
Panel a: All R&D
Panel b: Agricultural R&D

16Public Food and Agriculture Research in the U.S
Table 3 | SAES Research Spending Amounts, Intensities, and Sources of Support, circa 2009
Performance in 2009 Sources of support (average 2007–2009)R&D intensity
(average 2007–2009)
Ran
k
Sta
te
Cu
rren
t sp
end
ing
a
Sta
te
Fed
eral
sh
areb
Sta
te
Sta
te
shar
ec
Sta
te
Inte
nsi
tyd
million $ percentage percentage$ per
$100 in ag output
Top 10 states
1 California 339.7 Vermont 93.9 Georgia 78.3 Rhode Island 9.73
2 Texas 232.7 Delaware 76.2 Wyoming 64.5 Massachusetts 8.28
3 New York 206.0 Massachusetts 73.1 Oregon 63.7 Connecticut 5.65
4 Florida 146.2 Rhode Island 72.6 Louisiana 60.2 New York 4.16
5 Michigan 140.1 Maryland 68.3 Arkansas 57.9 Nevada 3.85
6 North Carolina 133.2 Montana 63.0 Maine 57.2 West Virginia 3.29
7 Colorado 124.3 South Carolina 62.9 North Carolina 56.8 New Jersey 3.13
8 Wisconsin 122.3 Alabama 62.1 New Hampshire 54.5 Virginia 3.03
9 Washington 110.2 Colorado 58.7 Oklahoma 53.5 New Hampshire 2.91
10 Indiana 109.5 New Mexico 58.3 New Jersey 53.2 Louisiana 2.87
Bottom 5 states
44 Wyoming 10.8 Georgia 24.0 Maryland 26.4 Idaho 0.62
45 Vermont 9.8 Oklahoma 23.6 New York 25.8 New Mexico 0.48
46 Maine 9.8 Arkansas 23.0 Delaware 20.0 Iowa 0.46
47 Rhode Island 5.9 Nebraska 20.8 Massachusetts 17.0 Illinois 0.46
48 New Hampshire 5.8 Louisiana 18.4 Colorado 12.2 South Dakota 0.39
Average across all states
75.7 40.2 41.1 1.15
Regional Aggregates
Pacific 544.5 42.7 44.8 1.02
Mountain 355.1 52.7 31.1 1.52
N. Plains 257.4 26.6 43.0 0.63
S. Plains 520.1 33.2 48.4 1.30
Central 823.4 39.5 35.9 0.87
Southeast 656.6 36.9 50.8 1.53
Northeast 475.1 49.4 31.3 2.64
Sources: See Figure 2 for data details.a. SAES spending, exclusive of forestry, in nominal dollars. b. Federally sourced share (from all federal agencies) of state’s spending total.c. State sourced share of state’s spending total.d. SAES spending (excluding forestry) per $100 of gross value of agricultural output.

17U.S. Research and Development Trends
comparison is not against a counterfactual scenario in which productivity would be sustained even without any R&D. Significant investments in so-called maintenance research, particularly in plant breeding, pathology, entomology, and veterinary medicine, are required just to maintain productivity. Various estimates indicate that 35–70 percent of U.S. agricultural research could be considered as research intended to maintain productivity and prevent it from falling.32 The requirements for maintenance research can be expected to increase with changes in climate, which will demand that agricultural production systems or crop varieties adapt if they are to remain productive in the face of changed weather conditions or pest and disease pressures.
A Shift Away from Farm Productivity-Oriented R&DFigure 11 reveals a gradual ratcheting down in the rate of growth in public agricultural R&D spending during the past several decades. The consequences of that slowdown for the future path of productivity may be exacerbated by the fact that the United States has also reduced the share of its total agricultural R&D investment spent on R&D designed to increase, or at least maintain, agricultural productivity. In 1976, approximately 65 percent ($339.1 million, or $1,473 million in 2009 prices) of all SAES research was so oriented. During the subsequent few years, that share rose to a contemporary peak of 69 percent in 1985. The subsequent two decades saw a sizable and sustained reduction in the farm productivity orientation of SAES research. By 2009, only 56 percent ($2,046 million) of SAES research sought to raise or maintain farm productivity (Figure 12). The farm productivity orientation of SAES research varies markedly among U.S. states, ranging from 37.4 percent of SAES spending for Rhode Island to 88.1 percent for Colorado.
The research intensity for livestock has always been below that for crops, but the two have moved together, along with the total intensity for all commodity-specific research. Research intensity is a measure of all public agricultural R&D—including research targeted to specific commodities plus all non-commodity R&D—relative to the total value of agricultural production. The overall research intensity ratio rose steadily from 0.80 percent in 1970 to 1.43 percent in 2009, almost 1.5 times
the intensity of investment in commodity-specific R&D of 0.97 percent in 2009. This pattern is consistent with the finding that a sizable and, of late, growing share of public agricultural R&D does not target specific commodities (Figure 13). The U.S. public agricultural research agenda has increasingly focused on concerns such as food safety, food security, and the environmental implications of agriculture, programs of research that have little if any impact on enhancing or maintaining farm-level productivity.
Percentage
55
57
59
61
63
65
67
69
71
1976
1979
1982
1985
1988
1991
1994
1997
2000
2003
2006
2009
Sources: Extracted by authors from unpublished USDA CRIS data tapes. SAES total (inclusive of forestry research) was used to form productivity shares.
Note: To categorize research spending into farm productivity and non-farm productivity we used the RPA (research problem areas) codes reported in the 1993, 1998, and 2005 USDA CRIS manuals of classification, and took allowance of the 1998 change in RPA classifications when doing so. In October 2005, CRIS recast this classification scheme from RPAs to knowledge areas (KA). The KA schema includes additional research, education, and extension designations not identified in the RPA classification (see USDA CRIS 2005). Our farm productivity category includes RPA/KA tagged projects related to soil (such as RPA/KA 102 “Soil, plant, water, nutrient relationships,” plant protection (such as RPA 205 / KA 212: Diseases and nematodes affecting plants), and animal production and protection (such as RPA 310 / KA 301: Reproductive performance of animals). Our non-farm productivity related research includes more basic areas of inquiry (that ultimately may, or may not, affect farm productivity) and areas of research not directly related to farm productivity (such as genomics, economics, environmental, postfarm, and “other” research). USDA CRIS, Manual of Classification of Agricultural and Forestry Research: Revisions V–VII (Washington, DC: United States Department of Agriculture, Cooperative State Research Service, 1993, 1998, 2005).
Figure 12 | Share of SAES Research Oriented to Farm Productivity, 1976–2009

18Public Food and Agriculture Research in the U.S
Alston and colleagues reported an apparent but loose concordance between the value of production of a given commodity and the amount of public R&D spending—higher valued commodities garner greater R&D spending.33 However, the amount of R&D spending does not rise uniformly with the value of production, and the more valuable commodities tend to have relatively low intensities of R&D spending. This is most apparent when comparing among crops. Large-acreage field crops have comparatively low public research spending per acre (and especially corn, wheat, and soybeans, where less than $2 per acre is spent on publicly performed R&D) while, for the smaller-acreage specialty crops, research spending per acre often exceeds $20, and in quite a few cases more than $40.34 Spending patterns suggest there may be economies of scale and
size in research—solving a production problem for one acre solves it for all similar acres for any given crop. These particular types of scale and scope economies also make it more likely that the considerable (fixed) or sunk costs of R&D can be recouped, thus making it more attractive for private parties to invest in research.
Intensity of InvestmentDuring the period 2007–2009, on average, the United States spent $3.83 on public agricultural R&D for every $100 of farm value added—almost $2,182 of research spending per farm, and around $3,341 for every square mile of farmed area (Table 4). The corresponding public extension spending ratios were typically about half the corresponding public research spending ratios. The ratios expressing research spending per farm, farm area, and farm population continued to grow throughout the entire period 1890–2009 (Figure 14, Panel a). The stagnation in extension spending during the past several decades means that public extension spending per farm and per farm-acre also stalled after 1980 (Figure 14, Panel b). Extension spending per farm population continued growing until 1991, as the farm population continued to shrink against a relatively stable trend in extension spending.
Research and extension intensities are comparatively high among states in the Northeast. Research intensities also tend to be high in the Mountain and Southeast states, and are at the lower end of the range for states in the Northern Plains and Central regions. The Pacific and Northern Plains states have among the lowest intensities of investment in extension, less than one-third the average extension intensity among the much higher ranked southeastern states (such as Tennessee, South Carolina, and Louisiana). The spatial pattern of research (and extension) spending has never been especially congruent with the value of production. During the first half of the 20th century, the state distribution of research and extension intensities was quite tightly clustered. By the 1970s, and increasingly thereafter, the variation among states became more pronounced, mainly because of rapid growth in intensities in northeastern states like Rhode Island, Massachusetts, New York, Connecticut, and New Hampshire, reflecting the contraction of their agriculture.
Total: $ 635.6 million in 1975; $3.97 billion in 2009
Sources: Extracted by authors from unpublished USDA CRIS data tapes.
Notes: Percentages in the figure represent the amount spent on public agricultural R&D as a percentage of the corresponding value of production. Public agricultural research includes SAES and intramural USDA agricultural R&D spending for 48 states, exclusive of research on forestry, rangeland, recreation and wildlife, game birds and animals, pets, laboratory animals, aquaculture and fisheries, horses, ponies, and mules. Other (including non-commodity specific) includes food (not readily associated with specific plant and animal products), and research areas designated as soil and land, water, air and climate, irrigation, farm structure, agricultural economy, etc. In both 1975 and 2009, food (not readily associated with specific plant and animal products) accounted for only 7 percent of the R&D spending grouped into the “other (including non-commodity specific)” category.
Figure 13 | Commodity-specific Research Intensities, 1975 vs. 2009
0 10 20 30 40
Other (includingnon-commodity
specific)
Livestock
Specialty crops
Other crops
percentage
1975
2009

19U.S. Research and Development Trends
Table 4 | U.S. Public Agricultural Research and Extension Intensity Ratios, 1890–2009
1891 1910 1930 1950 1970 1990 2008a
Relative to farm value-added Percent
Research 0.02 0.08 0.42 0.42 1.73 2.94 3.83
Extension 0.01 0.35 0.36 1.16 1.67 1.74
Relative to Ag. GDP Percent
Research - - - 0.40 1.50 2.37 3.09
Extension - - - 0.34 1.01 1.35 1.38
Relative to farm numbers dollars per farm, 2009 prices
Research 12.66 41.25 125.36 265.76 954.45 2,011.52 2,182.33
Extension 2.65 93.84 203.88 594.22 1,072.01 994.92
Relative to total population dollars per capita, 2009 prices
Research 0.89 2.75 6.46 9.49 13.44 17.04 15.76
Extension 0.18 4.84 7.28 8.36 9.08 7.04
Relative to farm population dollars per capita, 2009 prices
Research 2.34 8.20 26.82 64.68 287.34 923.65
Extension 0.53 20.07 49.61 179.15 492.24
Relative to total farm area dollars per square mile, 2009 prices
Research 58.84 190.57 532.08 801.61 1,634.39 2,800.06 3,340.96
Extension 12.25 398.33 615.31 1,016.94 1,492.30 1,440.07
Sources: Research data were extracted by authors from unpublished USDA CRIS data tapes. Extension data series was obtained from U.S. House of Representatives and USDA CSREES (now NIFA) sources as detailed in Alston et al. (2010, Appendix III). Alston, J.M., M.A. Andersen, J.S. James, and P.G. Pardey. Persistence Pays: U.S. Agricultural Productivity Growth and the Benefits from Public R&D Spending. (New York: Springer, 2010). General population data for 1961–2010 are from FAO, FAOSTAT database (Rome: Food and Agriculture Organization of the United Nations, 2012), http://faostat.fao.org. Data were backcast to 1869 using the rate of change of population data from Haines, M. and R. Sutch. “National Population and the Demographic Components of Change, 1790-2000,” Series Aa6-8 in Historical Statistics of the United States, Earliest Times to the Present: Millennial Edition, edited by S. B. Carter, S. S.Gartner, M. R. Haines, A. L. Olmstead, R. Sutch, and G. Wright. (New York: Cambridge University Press, 2006. Farm population for 1869–1909 are from Bureau of the Census, Historical Statistics of the United States: Colonial Times to 1970 (Washington, DC: Government Printing Office, 1975), series K-1. 1910–1991 data are from A.L. Olmstead and P.W. Rhode, “Farms–number, population, land, and value of property: 1910–1999 [Annual],” Table Da1-13 in Historical Statistics of the United States–Millennial Edition (Cambridge: Cambridge University Press, 2006), http://dx.doi.org/10.1017/ISBN-9780511132971.Da1-66010.1017/ISBN-9780511132971.Da1-660. Number of farms and land in farms from 1870 to 1911 are from Bureau of Census (series K-4 and K-5, respectively). For both variables, values for 1912–1989 are from Olmstead and Rhode (series Da-4 and Da-5, respectively), whereas values for 1990 onward are from USDA ERS (Economic Research Service). Farm Income. Data Sets. (Washington, DC: United States Department of Agriculture, 2012), http://www.ers.usda.gov/data/farmincome/finfidmu.htm. Farm value added 1929–2010 are from Bureau of Economic Analysis, “National Income and Product Accounts (NIPA) Tables,” Table 1.3.5. This series was extended back to 1873 using Bureau of the Census (series F-127). Agricultural GDP values are from Bureau of Economic Analysis, “GDP-by-industry & Input-Output.”
Notes: Intensities are three-year averages centered on the year noted in the column heading, thus, for example, 2008 data are a simple average of observations for 2007–2009. Research and extension expenditures are expressed in 2009 prices using deflator in Pardey, P.G., C. Chan King, M.A. Andersen. U.S. Agricultural R&D Deflator, 1890-2010. Staff Paper, Department of Applied Economics. (St. Paul: University of Minnesota, 2012). Research expenditures exclude forestry.

20Public Food and Agriculture Research in the U.S
Research PersonnelIn line with Peterson’s 1992 prediction, Alston and colleagues reported that the demand for Experiment Station personnel has grown little over the past several decades.35 The number of scientific full-time equivalent (FTE) years in the SAESs increased by about 1,000 from the mid-1970s to 1990, and appears to have declined thereafter. In 2009, a total of 9,493 scientific FTE years were employed in the public agricultural R&D system in the United States, about 76 percent of whom worked in SAESs. The USDA and SAES systems employed
approximately three professional, technical, and clerical staff years for every scientist year, for a total of 39,961 scientific, professional, and technical FTE years in 2009.
Since 1970, average spending per public scientist—combining those working in the SAESs and the USDA—trended up in inflation-adjusted terms by 1.23 percent per year, from around $299,347 (2009 prices) per FTE scientist in 1970 to $497,451 per FTE scientist in 2009. The range around this average is quite large. Taking the average of spending per scientist in the period 2007–2009, Delaware spent just $245,233 (2009 dollars) whereas 20 other states spent more than $500,000 per scientist. This contrast no doubt reflects variation among the states in the types of research being done (e.g., basic versus applied; livestock versus crop; annual versus perennial plants), the mix, age, and skills of scientists and support personnel; and the factor intensities (e.g., capital versus labor versus material cost shares) of the R&D enterprise, among other things.
In many places, the median age of faculty in colleges of agriculture is well over 55 (especially in some of the older disciplinary departments) such that, as in much of agriculture, succession planning is an important consideration if the existing organizations are to survive in recognizable form beyond the current decade. For example, at UC Davis, among a total of 300 faculty in the College of Agricultural and Environmental Sciences (CAES) in 2010, only 90 (30 percent) were age 50 or younger, and 73 (almost 25 percent) were over age 60. Among 57 faculty in plant sciences, only 14 (less than 25 percent) were 50 years of age or younger and 16 (28 percent) were over 60 (UCD-CAES 2010). If no new, young faculty members were added for five years, and all of the 2010 faculty stayed, in 2015 only 63 (21 percent) of the 300 CAES faculty would be 50 or younger and 158 (53 percent) would be over 60. The years since 2010 have seen very few new faculty appointments in the CAES at UC Davis. This is not a sustainable path. Similar patterns can be seen nationally. For instance, in 2009 the American Phytopathological Society reported that the median age of the university faculty in the field of plant pathology in 2009 was 52, and the distribution was “markedly compressed around the median.”36
0
500
1,000
1,500
2,000
2,500
3,000
3,500
4,000
1890
1900
1910
1920
1930
1940
1950
1960
1970
1980
1990
2000
2009
U.S. dollars (2009 prices)
0
200
400
600
800
1,000
1,200
1,400
1,600
1,800
1890
1900
1910
1920
1930
1940
1950
1960
1970
1980
1990
2000
U.S. dollars (2009 prices)
Per square mileof farmland
Per farm
Per farmpopulation
Per farmpopulation
Per square mileof farmland
Per farm
Figure 14 | U.S. Public Agricultural Research and Extension Intensities, 1890–2009
Panel a: Public agricultural R&D
Panel b: Extension
Sources: See Table 4.

21Federal Roles
Federal RolesIf the objective is to maximize total economic welfare in society, the optimal policy for the government is to choose the policy instrument, or combination of instruments, that will minimize the total deadweight losses due to competitive market failures (and private-sector underinvestment) in agricultural research. Federal government intervention to correct private-sector underinvestment in agricultural R&D can, and does, take a number of forms including:
• Improving the set of legal institutions governing the property rights over inventions to increase the degree to which returns to R&D are privately appropriable (e.g., patents for machinery and chemicals and multiple forms of plant variety rights have increased the incentives for firms to invest in genetic engineering to develop new private varieties of plants);37
• Creating institutions that reduce free-rider problems such that industry can raise revenues equitably and efficiently to support research as a collective good (e.g., R&D institutions funded by check-offs under marketing orders or other arrangements);
• Providing inducements to private-sector firms to encourage them to increase their investments in R&D (e.g., R&D subsidies, grants, or tax credits for R&D expenditures); and
• Providing funds from general revenues to support R&D and, therefore, directly to diminish the extent of the underinvestment in R&D.
Intellectual PropertyThe introduction of intellectual property rights, beginning in the United States with patents, trademarks, and copyrights in the 18th century, rates among the more prominent public policy measures intended to stimulate the creation and dissemination of U.S. inventions. Many of the patents in the middle of the 19th century dealt with agricultural machinery, implements, and devices. Even something as seemingly simple as farm fencing material was heavily patented, with more than 400 patents, most issued in the 1800s, being granted for designs and manufacturing methods related just to barbed wire.
1975 1990 2000 2009
full-time equivalents
Scientific years
SAESs 48 states total 6,219 7,464 7,161 7,234
USDA total 4,019 3,717 2,007 2,259
USDA and SAESs total 10,237 11,181 9,168 9,493
Professional, technical, and clerical years
SAESs, 48 states total 15,406 23,156 26,289 25,244
USDA total 6,730 6,345 5,611 5,170
USDA and SAESs total 22,136 29,501 31,900 30,413
Full-time equivalent, total
SAESs, 48 states total 21,624 33,969 33,182 32,478
USDA total 11,082 9,705 5,793 7,483
USDA and SAES total 32,706 43,674 38,976 39,961
Sources: Extracted by authors from unpublished USDA CRIS data tapes.
Notes: Researchers working in federal institutions require at least a GS11 ranking to be classified a scientist. Those working at nonfederal institutions require at least an assistant professor rank to be so classified.
Table 5 | Full-Time Equivalent Personnel in USDA and SAES Research, 1975, 1990, 2000, and 2009

22Public Food and Agriculture Research in the U.S
The scope of intellectual property protection in the United States for 150 years after ratification of the U.S. Constitution offered little protection for biological inventions such as new crop varieties. Trademarks and trade secrecy laws were applicable, but these did not protect against reverse engineering or self-replication. Therefore, the common practice of saving seeds for own reuse—or for sharing seed with other farmers or selling to them—did not constitute legal infringement of new seed varieties. Intellectual property protection did apply to product and process inventions related to chemical, mechanical, storage, transport, and food processing inventions, among others.
Intellectual property protection for plant varieties became a reality when President Herbert Hoover signed the Plant Patent Act into law in 1930. Plant patents, granted by the United States Patent and Trademark Office, cover asexually reproduced plants, a category that largely encompasses ornamental plants, fruits, vines, and tree nuts. Sexually reproduced crops, a category that includes grains, oilseed crops, and grasses, gained intellectual property protection in 1970 under the Plant Variety Protection Act. Plant variety protection certificates (PVP certificates) are administered by the U.S. Department of Agriculture, and they are weaker than a plant or utility patent in two important ways. A “breeders’ exemption” allows others to use protected varieties for breeding, though not for commercialization, and a “farmers’ exemption” allows farmers to save seed for reproductive purposes and even to resell it to other farmers whose primary occupation is growing crops for consumption or feed.
A third form of protection became possible from the 1980 U.S. Supreme Court case Diamond vs. Chakrabarty, in which the court narrowly found (5 to 4) that “anything under the sun that is made by man” is patentable subject matter. In practice, this case and subsequent legal rulings clarified that plant varieties, parts of plants, genetically engineered organisms, and gene products themselves were eligible for the same U.S. utility patents that cover most other inventions. In 2001, the Supreme Court further clarified that plants covered by a plant patent or PVP certificate could obtain utility patent protection as well.38
From 1930 to 2008, a total of 34,340 varietal rights were granted or lodged in the United States. The number of rights continues to grow, with 42 percent of all varietal rights being claimed since 2000. Contrary to popular perception, most of these rights are for horticultural crops (69 percent), with ornamentals accounting for the lion’s share of the horticulture-related rights. Food and feed crops constitute only 24 percent of the total rights, although just two crops (corn and soybeans) made up 84 percent of all varietal rights claimed via utility patents. The structure of plant intellectual property rights has changed dramatically over the years. During the 1930s when the only rights on offer were plant patents, 72 percent of the rights pertained to ornamental crops, and individuals constituted half of all applicants. In recent years, however, utility patents and plant variety protection certificates accounted for 40 percent of all the rights (Figure 15). In the modern era, ornamentals make up a much reduced share of the total, and the corporate sector has sought the large majority of varietal rights. Despite much research activity in plant varietal development, universities and other public entities account for only a small share of property rights.
Figure 15 | U.S. Varietal Rights, 1930–2008
Source: P.G. Pardey, B. Koo, J. Drew, and C. Nottenburg, “The Evolving Landscape of IP Rights for Plant Varieties in the United States, 1930-2008” (Staff Paper P12-1, University of Minnesota, Department of Applied Economics, January 2012).
Notes: PVP indicates plant variety protection certificates. All data are reported by the year of application. The PVP series represents the number of certificate applications, whereas the utility and plant patents are the number of granted patents.
0
300
600
900
1,200
1930
1935
1940
1945
1950
1955
1960
1965
1970
1975
1980
1985
1990
1995
2000
2005
Number
Plant Patents
Plant VarietyProtection Certificates
Utility Patents

23Federal Roles
Court rulings and the growing practice of contractual licensing arrangements between patent-holders and customers will continue to shape the legal landscape and, in many cases, impose additional restrictions beyond intellectual property protections.39 Trade negotiations over intellectual property continue to shift the international landscape, and new legislation creates changes in the United States. The Leahy-Smith America Invents Act, passed late in 2011, makes it easier to challenge patents, expands the categories of prior art, and changes the U.S. to a “first to file” regime for all patents, including plant patents and all utility patents applying to plants.40
The use of intellectual property rights to make benefits appropriable has implications for both the amounts of certain types of research that are undertaken in the private sector, and the distribution of the benefits. In particular, in those cropping industries for which private incentives and rates of investment in varietal improvement research have been stronger in recent years (particularly genetically modified varieties of maize, soybeans, canola, and cotton) rates of yield growth have been more rapid than in others such as wheat and rice.41 Although the lion’s share (say, three-quarters) of the resulting benefits go to adopting farmers and consumers, technology firms and seed companies have been able to charge significantly for the use of these privately produced technologies. For example, Alston, Gray, and Bolek reported that U.S. and Canadian farmers who use proprietary varieties of maize, soybeans, canola, or cotton are paying on the order of 10 percent of their gross income for seed technology, on the same scale as the rental cost of the land used to grow the crop. They also found that the technology firms are reinvesting on the order of one-tenth of their royalty income in R&D.42 The distribution of net benefits would be much different if the government funded the research and provided the technology for free, or if the cropping industry funded the investment on a collective basis. Such considerations may become increasingly pertinent as we look to alternative research funding models for the future.
Funding R&D43
As detailed above, SAES have used a shifting mix of federal- and state-government support to fund agricultural R&D. In addition, federal and state governments conduct separately administered programs of research. Economic arguments pertain to the appropriate matching of sources of funding to particular types of research, including private- versus public-sector roles, and state versus federal government roles, as well as the total amount of funding and its allocation.
Efficient Jurisdictions—Federal versus State SupportThe appropriate balance of federal versus state funding, in terms of efficient financing principles, would be to finance “local” public goods using “local” taxes. The eff icient jurisdiction for a particular set of R&D services is defined by the range of geographic spillovers of benefits. An interjurisdictional externality exists when R&D in one political jurisdiction (e.g., a state) results in spillover benefits in another political jurisdiction whose residents have not participated in the choice about what R&D to do, and have not contributed to the costs of the R&D. As with externalities among individuals, externalities among jurisdictions involve efficiency losses.
Problems arise because political jurisdictions do not coincide with economically efficient jurisdictions.44 Geopolitical boundaries are perhaps the main basis of defining jurisdictions for public goods, including public-sector agricultural R&D, but not the only one. Another basis might be whether people are producers or consumers of a particular commodity or not. If this characteristic can be used to define a tax base, as it often can, then there are available commodity tax alternatives to a geopolitically based tax. Similarly, users of particular resources (e.g., recreational use of public parks or irrigation from public streams) might be defined as a tax base for some purposes. Then discussion can turn to whether a particular program of public-sector agricultural R&D might best be funded by general taxes (income taxes, sales taxes, payroll taxes, and property taxes, depending on the situation) levied on

24Public Food and Agriculture Research in the U.S
the residents of some particular geopolitical region (e.g., a city, a county, a state, a group of states, or the nation as a whole), and which one of those, or on the basis of production or consumption of a particular commodity or a particular input to production.
The criterion for efficiency, as well as fairness, is to whom the benefits accrue. If the benefits accrue as spillovers beyond a particular state, the state is too small a jurisdiction because it will underinvest from a national perspective. The penalty for extending the tax base beyond the state if benefits accrue only within a state is that nonbeneficiaries (from other states) would be expected to resist the use of general funds and, again, underinvestment will result. Hence, different agricultural R&D programs and projects call for different funding arrangements. The circumstances under which the nation as a whole is the efficient jurisdiction—where benefits would be expected to accrue in every state, or at least most of them—are likely to be restricted to cases where the same technology is applicable everywhere in the nation (as may be roughly correct for certain livestock technologies) or for comparatively basic research that could be applicable in a wide range of technologies and situations. Much of the agricultural research that is done is applied work that relates to particular crops in specific locations and, although the technology may well spill over beyond the state boundary, a national program is inefficient when the efficient jurisdiction is only a few states or a certain group of producers and consumers.
In the case of agricultural research, the efficient jurisdiction will vary among research institutes and among programs of research. Commodity research is highly likely to spill across county and state lines, if not internationally. For instance, an individual state is highly unlikely to be an efficient jurisdiction for R&D into new crop traits or varieties or improved management practices for corn or soybeans. An efficient jurisdiction might include all of the midwestern states where these commodities are important and where local technological innovations are likely to be approximately equally applicable. Even so, certain types of corn research might be locally applicable within a particular
state whereas certain types would be applicable beyond the Midwest. This is because biological technologies are sensitive to variations in agro-ecological factors such as day length, soil type, rainfall patterns, and so on, factors that do not usually vary in ways that correspond closely to political boundaries. Nevertheless, for certain types of commodity research, a regional approach will be more appropriate than for individual states to operate uncoordinated, competing programs of research. The same may be said of certain types of noncommodity research—in particular, natural resource problems tend to be geographically specific, by definition. Again, simple generalizations are impossible. Some resource issues cross state and national boundaries (e.g., rivers or off-shore fisheries) while others are confined within a local government area.
Some issues are clearly national and are appropriately addressed by federal programs. But the federal government can choose whether to address an issue using federal funds in federal research institutes, or in state organizations, or by using incentives to encourage state organizations to take joint action. In the decades ahead, greater flexibility may be necessary to achieve efficient jurisdictions for agricultural R&D that differ among commodities and according to the lines of work being undertaken, especially in light of the rapidly changing technologies of agriculture, communication, bioinformatics, transportation, and science itself.
Economics of Commodity Check-offsUsing industry check-off funds, rather than general government revenues, to support publicly or privately executed R&D, can
• Be a more efficient funding mechanism, a lower cost source of funds;
• Ensure that the costs of the R&D are borne approximately in proportion to the benefits; and
• Provide mechanisms (through the scrutiny by the industry of the expenditures on R&D) for monitoring the efficiency of research resource allocation, and improving it.

25Federal Roles
All three arguments are efficiency arguments, but the second involves some elements of equity, or fairness, as well.45 Check-off funding is clearly applicable to research on a particular commodity. By definition, this is not basic research.46 Similarly, check-off schemes tend to preclude (or, at least, to be less applicable to) research that affects multiple commodities and research that applies to particular factors of production or that has an environmental focus.
The incidence of a commodity check-off depends on the elasticities of supply and demand for the commodity. The costs of a tax collected from producers are passed on to consumers (and vice versa). Under standard assumptions of linear supply and demand and a parallel research-induced supply shift, the final incidence of a tax is identical to the final distribution of benefits from research. Thus, the consumer benefits from a 1 percent research-induced cost saving is exactly equal to the consumer costs of a 1 percent tax on production or consumption.
The same is not true for different types of research, such as research applying at a different stage of a multistage production system or research that causes a nonparallel supply shift or demand shift. Benefits from research applied at one stage of a multistage production process (e.g., at the food processing stage) will be distributed between the producers and consumers of the product approximately in proportion to their shares of the burden of a tax applied at the same stage of the chain. But taxes collected at different stages of production will have different final incidences.47 Thus, if a tax at one stage (say, primary production) is used to finance research at another (say, processing), the benefits will be distributed differently from the costs: primary producers will pay a disproportionate share of the costs and processors will reap a disproportionate share of the benefits.
For both efficiency and equity reasons, this means that a primary producer check-off scheme might not be the best way to deal with underinvestment in food processing R&D; a tax applied further up the food chain may be more appropriate. Even when the benefits from research are not distributed identically to the costs
of a commodity tax to fund it, the proximity of the distributions of benefits and costs is much greater with a commodity tax than when the research is funded by general revenues. Commodity taxes cross geopolitical boundaries, including international ones, so funding research by commodity taxes avoids some problems of inappropriate geopolitical jurisdictions for research that involves spillovers.
Commodity check-offs could be used more extensively to support the significant proportion of research that can be identified with a well-defined commodity (or other) interest group. Some of these mechanisms are already in place in the United States but are relatively underused in the sense that only a small fraction of total R&D resources are generated in this fashion, and the check-off funds are directed mainly toward market promotion.48 Even when check-off funds have been established specifically to fund agricultural R&D, it may be difficult to achieve consensus within the affected group of producers over the rate of check-off and the appropriate use of the funds, and consequently an economically efficient outcome may not be achieved. Alston and Fulton discuss some issues with respect to the institutional structure of check-off-based funds for agricultural R&D.49 They suggest that diverse interests among producers, combined with an implicit political requirement for support from a supermajority of producers, can account for a tendency for underfunding of R&D by levy-based programs, even with an added incentive of matching government support.
Regulating Technologies50
Although they generally provide net economic benefits, new technologies arising from R&D almost always involve some losers, and some of the negative consequences may involve external effects on human health or the environment. The actual or perceived existence of externalities—associated with food safety, environmental pollution, animal welfare, farm-worker safety, costs of product segregation, or loss of market access—is a type of market failure that provides a justification for regulation (or other government intervention) aimed at increasing national net benefits from production and consumption.51

26Public Food and Agriculture Research in the U.S
Government regulations to address concerns such as these are pervasive, and largely taken for granted, but they evolve as knowledge and other factors change. Various agricultural chemicals, for instance, have been banned (e.g., DDT is only one of many pesticides that are no longer allowed in U.S. agriculture) or are only allowed to be used in particular applications, and there are environmental and occupational health and safety regulations over how they may be applied and so on. Similarly, the laws and rules governing rights to natural resources are constantly evolving as circumstances and institutions change and research reveals the implications of past production practices and provides new options for agriculture. And with rising affluence, and in the wake of various food scares, we have witnessed increasing calls for providing more public information and food-safety assurance, and an attendant rise in food-safety regulation and related R&D.
In contemplating the economics of regulation of agricultural technologies, one set of questions concerns understanding the nature of the costs and benefits and obtaining measures of the costs and benefits and their distribution. To get this right, it is important to get the counterfactual right, in terms of the nature of the preexisting distortions that the regulation may be designed to address, but also to deal with the complications of further distortions created by the intervention. Government intervention that purports to correct one distortion may create another, and all such interventions have redistributive consequences.
A second set of questions relates to explaining the policy choices, which to some extent turns on understanding their consequences. The question of who bears the costs and who reaps the benefits may be difficult to answer precisely but is nevertheless likely to be worth asking if we want to understand why particular regulations are applied. It seems likely in many cases that the redistributive consequences have more to offer as an explanation of particular regulatory choices than any theory based on a simple notion of correcting market failures. The distribution of benefits and costs may help explain choices of particular regulatory instruments, and the choice to regulate versus alternative policies including laissez faire.
Biotechnology RegulationThe regulation of agricultural biotechnology is an important contemporary example that serves also to illustrate the main issues in regulating agricultural technologies more generally. Biotechnologies are regulated from the point of initial experimentation, through the stages of field trials, and ultimate release, and the process of compliance with these regulations adds considerably to the costs borne by biotech companies and to the number of years consumed in the process. For example, Kalaitzandonakes and colleagues estimated that compliance with regulatory requirements added between $6 million and $16 million to the cost of developing a single new biotech crop product.52 Even after the technologies are “deregulated,” such that farmers are allowed to grow biotech crops, further regulations govern where and how the crops may be grown, and how and where the products may be sold.53
It is notable that the substantial adoption of agricultural biotechnology to date has been concentrated in a small number of countries and confined to a small number of traits in a small number of crops: specifically, pest resistance and herbicide tolerance in feed grains, oil seeds, and cotton, and virus-resistant sugar beets. Biotech food products emphasizing output traits (e.g., long shelf-life tomatoes) or input traits (e.g., Bt potatoes or sweet corn) have been ignored or discontinued by food manufacturers or retailers in the face of perceived market resistance or political opposition (although virus-resistant papayas are a rare exception).
One set of regulations governs the R&D process and whether a new biotech crop variety is allowed to be grown commercially. Prior to the development and release of a new genetically modified crop variety, a biotech company must satisfy a host of regulations that govern what is allowed to be done in the lab and in the field. In the United States, “deregulation” to allow a crop to be grown commercially requires separate authorization from the USDA, the Food and Drug Administration (FDA), and the Environmental Protection Agency (EPA), reflecting the separate roles played by these agencies in relation to the environment, food safety, and agricultural production. To obtain

27Prospective Research Priorities and Policies
these approvals requires a very significant investment in testing, evaluation, and reporting, in a process that adds many years and tens of millions of dollars of costs to the commercial process of research and development.54
Even though the U.S. policy explicitly is to evaluate the product, not the process of invention, it seems to discriminate against biotechnology.55 Presently the requirements on biotech crops are much more onerous than the corresponding requirements on competing technologies, such as crop varieties developed by conventional techniques (including mutagenesis and selection) or chemical pest-control technologies. Concern about the potential implications for market acceptance mean that U.S. biotech firms in many cases also go through regulatory approval processes in other countries, such as Japan, before they will release a new biotech crop variety for production in the United States. The cost of compliance with international regulations is additional to the domestic cost.
Prospective Research Priorities and PoliciesIn this document and in others, we have presented evidence of a persistent U.S. national and global underinvestment in agricultural R&D. On the basis of this evidence and the prospects for patterns of supply and demand for agricultural outputs over the coming decades, we have advocated reforming policies and institutions to redress the deficiency, reinvigorate public and private investments in agricultural R&D, and revive agricultural productivity growth. These are very broad and general propositions. It is reasonable, in response, to ask for more specific information: How much should funding increase and how rapidly? Who should provide the funds? What are the priority areas for research funding that are currently being neglected? What process should be used to allocate the funds to best address those priorities? In this section, we first present some ideas related to the question of total funding and identifying research priorities based on the economic principles described above and some additional notions broached below. Next we consider institutional initiatives for addressing the funding shortfall and to address the priorities.
Double the Total Funding for Public Agricultural R&D In 2009, the United States spent a little over $11 billion on agricultural R&D (not including extension), of which less than half was spent in the public sector. The benefit-cost evidence indicates that a marginal increase in public-sector spending could be expected to yield benefits in the range of 10 to 20 dollars per dollar of R&D. In the near term (a horizon of, say, 5–10 years), agricultural research is subject to diminishing (marginal) returns because of fixed factors of two main types: (a) the existing stocks of scientific knowledge and knowledge about agricultural technology, which reflect an accretion of new ideas and knowhow arising both from investments in public agricultural R&D and private and public research investments made in areas outside of agriculture; and (b) the available stock of scientific manpower and infrastructure resources, which can be increased over time if resources are available. Diminishing returns means that the marginal benefit-cost ratio will decline with progressive increases in agricultural research investments, such that eventually the marginal benefit-cost ratio (factoring in all the costs and all the benefits) will be 1:1, and the economically efficient outcome for the nation will have been achieved.
Although no one really knows much quantitatively about the nature of diminishing returns to public agricultural research investments, it seems safe to say that the total U.S. public agricultural research enterprise could double in size without exceeding the national economic optimum—and certainly in the “longer run,” after allowing appropriate time for building up the stocks of human and physical capital inputs to take efficient advantage of increases in operating funds. Taking near-term capacity constraints into account, it may be reasonable to contemplate doubling the total annual funding for U.S. public agricultural R&D over a period of 5 to 10 years, from about $4.5 billion to about $9 billion. Such funding increases might involve a shifting emphasis over time, considering the benefits from building capacity by investing in people and infrastructure and from restoring operating budgets to allow additional work to be initiated sooner, given the importance of the long time lags between investments in knowledge creation and observing better outcomes in farmers’ fields.

28Public Food and Agriculture Research in the U.S
Revitalize Federal R&D Support via the Farm Bill The implied annual increases in total funding would be comparatively modest, around half a billion dollars of incremental funding per year over two cycles of the Farm Bill. Nonetheless, U.S. federal budget projections are dire, and without doubt it is a hard sell to rehabilitate commitments to agricultural R&D from the federal public purse. Redirecting some federal tax revenues to public agricultural R&D is one option, and it is relevant to consider the federal spending priorities within which that commitment would have to be made. In 2009 federal spending on agricultural R&D was 8.6 percent of the federal budget spending on all areas of science. Agricultural R&D represented only 1.7 percent of total USDA expenditures (which totaled just over $114 billion in 2009), in the range of one-tenth of the amount spent annually on farm commodity program subsidies in typical years, a tiny fraction of the amount spent annually on food and nutrition programs (more than two-thirds of the USDA budget in 2009), and a little more than one-third of the public funds spent on crop insurance programs that same year.56 The agricultural science vote could have been doubled in 2009 (that is, a 100 percent increase in federal support to agricultural R&D) in exchange for an 18 percent reduction in farm subsidy payments (which have been low recently because of high commodity prices), a very modest reduction (2.8 percent) in food subsidies for consumers, or a 39 percent reduction in the subsidies paid into crop insurance programs. In the long run, such an increase in agricultural R&D might well have a bigger favorable effect on both farm incomes and on nutrition for the poor compared with the subsidy programs that are much better funded, and increasingly so.
By the middle of 2012, both the House Agriculture Committee and the Senate had passed proposals for the 2012 Farm Bill, neither of which proposes to increase the research title significantly.57 They do, however, propose to eliminate about $5 billion per year of “direct payments” to farmers, to reduce entitlements under the food and nutrition programs marginally, and to redirect
most of the projected savings in expenditure to finance increases in other farm subsidies and subsidized crop insurance—among the most economically inefficient forms of subsidy to farmers and the least defensible uses of public funds.58
As Alston demonstrated, agricultural research is a much more efficient way to assist farmers, and public-sector agricultural R&D would be a much more socially productive use of the $5 billion per year.59 This follows because agricultural R&D generates social benefit-cost ratios in the range of 20:1 or higher, with about half of the total benefits accruing to farmers (and the other half being shared between landlords and consumers), whereas farm subsidies involve a net social cost, a benefit-cost ratio of less than 1:1. Consequently, if an additional $2 billion were spent on farm subsidies, farmers would see benefits of well less than $1 billion, and society as a whole would take a loss on the transaction. In contrast, assuming a very conservative benefit-cost ratio of only 10:1 for agricultural R&D, if an extra $2 billion were spent on agricultural R&D, farmers would see a benefit of $10 billion and the nation as a whole would see net benefits of $20 billion.
Taken at face value, these estimates suggest that agricultural R&D is much more efficient than farm commodity programs as a mechanism for transferring income from taxpayers to agricultural producers. Compared with agricultural R&D, it costs 10 times as much (or more) to achieve a given producer benefit using subsidies. Moreover, the subsidy imposes a deadweight loss while the R&D yields a net gain. Nevertheless, producer groups seem to be much more interested in subsidies than R&D, and the U.S. government continues to spend in the range of $10 on farm subsidies for every dollar it spends on agricultural R&D. Differences that could help account for this puzzling outcome include the fact that agricultural R&D takes a long time to take effect and its impacts are difficult to discern from other influences, whereas subsidy payments are immediate and comparatively transparent. But the economic arguments in favor of agricultural R&D versus subsidies—especially highly inefficient forms of subsidies such as subsidized crop insurance—are clear and compelling.

29Prospective Research Priorities and Policies
Reengage State Government Support for SAES ResearchState government budgets are hurting too. Unlike some other areas of the economy, where state governments have stepped in to fill gaps created by the withdrawal of federal funds, the weakening of federal support has been accompanied by a weakening of state government support for agricultural R&D. USDA-administered formula funding to the SAESs requiring some state matching of federal government funds fell from almost 87 percent of total USDA support to the states in 1970 to just 35.2 percent ($251.7 million) in 2009.60 This shrinking share of formula funds was the flip-side of an increase in competitive grants funding and funding made available to the SAESs by way of grants and contracts from a variety of federal agencies.61 As a consequence, by 2009 state governments committed just 1.01 dollars on average for every dollar of federal funding made available for research conducted in the SAES, compared with $4.36 of state funding per federal dollar in 1925 (and still $4.11 of state for each federal dollar as late as 1954).
Of course state-federal matching arrangements vary considerably among the states. In 2009, 27 state governments contributed less than $1 for every federal dollar, 14 states contributed between $1 and $2, and only seven states provided more than $2 of funding for each federal dollar directed to the SAESs.62 Expanding the scope of the state matching requirements to secure federal funding for SAES research is one practical way of rebalancing federal versus state support for SAES research. It could also serve to improve the spatial alignment of the performance of research with the location of agricultural production, with the potential for achieving increased efficiencies in the productiveness of R&D given the strong site-specific attributes that affect agriculture, while expanding the overall amount of support for publicly performed R&D.
Policies to Increase Private Support for Publicly Performed ResearchPaying for more of the publicly performed R&D using state or federal general tax revenues is one option, and is certainly consistent with the notion that the general population ultimately benefits from this investment by way of lower food prices and access to a broader array of agricultural products with higher quality and other desirable attributes, as well as enhanced or rehabilitated environmental services associated with new agricultural production practices. But farmers who adopt the new technologies arising from R&D also gain by way of improved productivity, lower costs of production, and enhanced competitive positions in global food and feed markets. Thus, another option is for farmers and other agribusiness interests to co-finance the research conducted, in part, on their behalf.
Arguably the most straightforward approach would be for the government to pass enabling legislation that empowers industry to impose a research levy on producers. In the United States, agricultural producers have shown a propensity for using taxes to fund commodity collective goods, but by far the lion’s share of this has been devoted to generic commodity promotion programs, which have attracted funding of over $1 billion in recent years. Comparable amounts of check-off-based funding for agricultural R&D would go a long way toward achieving the proposed doubling of total spending, but an increase of this magnitude is unlikely to be achieved without some significant new inducement, which the federal government could provide.
One way to encourage producers to implement such a scheme would be for the government to provide dollar-for-dollar matching of levy funds up to some predetermined limit (say 0.5 or 1.0 percent) of the gross value of production of the industry. Such a scheme was implemented to good effect in Australia in 1985, and now almost half the funding to agricultural R&D performed by public agencies in Australia is jointly financed with taxpayer and

30Public Food and Agriculture Research in the U.S
industry funding via this institutional instrument.63 Other countries have analogous research levy schemes in place, for instance the Netherlands and Uruguay, which also has a public-private matching requirement.64 Expanding the range of potential levy payers beyond farmers to include farm input suppliers and the post-farm food processors, bioenergy, and other industries that draw directly on the fruits of agricultural R&D could also help address the persistent underinvestment problem in U.S. agricultural research and in some types of pre- and post-farm research.65
Rebuilding CapacityMuch of the physical infrastructure of the U.S. public agricultural research enterprise is antiquated; for whatever reason, in the SAESs, funding permanent faculty positions tends to take precedence over bricks and mortar and cutting-edge research equipment. Even so, buildings and equipment might not be the immediately pressing priority given the demographic structure of the SAESs, as we discussed above. At least some funds should be devoted urgently to rebuilding the stock of human capability to undertake Experiment Station research and arranging for a next generation of researchers to be both available and prepared to sustain the mission.
Continuing to focus on the SAESs, where a large part of the U.S. public agricultural R&D enterprise is carried out, it is reasonable to ask what would happen if the current research administrators had to face a challenge that would be without precedent in their experience, at least during the current century: how to deal with a substantial increase in Experiment Station funding? If the future would be anything like the past, we could expect many of them in the first instance to use the incremental resources to secure new appointments of permanent faculty within the Experiment Station. In the light of our previous comments about demographics, that might not be a bad response. On the other hand, the past trend of shifting the balance of SAES funds into permanent salaries, and away from support for capital investments and operating expenses, has increasingly meant that faculty
must look for external funds to support their research. And, increasingly over time the readily accessible external funds have come from less-traditional sources (such as DOE, NSF, and NIH) and have emphasized research subjects that do not necessarily support agricultural productivity growth. Consideration should be given to the implications for the research quality as well as its topical emphasis if the core funds are used entirely to support faculty lines, leaving it to other sources to provide capital and operating funds.
ContestabilityMuch of the current funding for agricultural R&D is locked in through various kinds of institutional arrangements to be spent in particular ways (e.g., on salary for research faculty holding appointments in the SAESs) at particular places (e.g., within a particular state or institution within a state). Alternative arrangements could be introduced to make these funding lines contestable, and in that way allow them to be allocated to more efficient uses and at the same time expand the total effective capacity of the system.
Locally Contestable Funding for SAES Salary SupportThe traditional approach to financing and managing agricultural R&D in the SAESs has been to appoint faculty in tenure-track positions in disciplinary departments, with a funding commitment expected to last approximately 35 years, and to provide them with basic infrastructure resources and some operating funds with which to conduct their research. But core funding support has shrunk over time, and research faculty are now expected to bring in extramural funds to cover their operating expenses, including funding for research staff, graduate students, postdoctoral students, and specialized equipment. As the research agendas have evolved, within particular departments individual faculty members may become more or less useful and more or less productive relative to the market for research, but the core funding commitment is irrevocable. This fact means that the structure is very safe and secure in many senses for the individual faculty members, but at the same time it is comparatively

31Prospective Research Priorities and Policies
inflexible, allowing little scope for adjusting human capital resources in response to a research agenda that has shifted very extensively over time periods much shorter than the professional life expectancy of the individual scientists.
More creative approaches to financing agricultural R&D might allow for greater flexibility in, and thus potentially more efficient use of, human scientific resources to pursue the Experiment Station mission. For example, as an alternative to providing a permanent commitment of funding for salary of particular individuals, the same total funds could be committed but on a more flexible basis, funding selected individuals temporarily, on specific projects, and on a competitive basis. In this way, researchers could be “rented” from disciplinary departments, in which they hold tenured positions, to work on a fixed-term basis on particular Experiment Station projects. Some faculty members might be very successful in such projects and have a large share of their time dedicated on a continuing basis to such work, whereas others may have smaller shares always, or have shares that decline during different stages of their careers. Others might scale up or down their commitment to research (in line with their ability to attract funds for research) and shift more or less of their attention to teaching, extension, or administrative roles. Presently, in many cases, faculty with, say, 50:50 research and teaching appointments, continue to be paid half their salary from an Experiment Station budget regardless of the balance of their professional effort.
Adopting concepts along these lines would give SAESs access to a much greater pool of talent if the arrangements were devised such that any members of the faculty, not just those holding appointments within the Experiment Station, were allowed to compete for roles within projects funded by the Experiment Station. In turn, this would increase the capacity of the system to respond relatively rapidly to changes in the available sources of funds, such as the rapid increases proposed at the beginning of this section, or to shifts in the agenda. And it has the potential to attract industry groups to support faculty salaries .
Is 50 SAESs (and 110 Regional Agricultural Research Service Labs) the Right Number?66
As we celebrate the sesquicentennial of the Morrill Land Grant College Act and head toward the 150 year celebration of the Hatch Act, which in March 1887 ushered in federal enabling legislation to establish an Experiment Station in each state of the Union, several obvious questions present themselves. Are 50 SAESs and 110 regional Agricultural Research Service (ARS) labs optimal for the 21st century? Can the (federal) funds presently directed to these SAESs and USDA facilities be deployed in ways that make more efficient use of the taxpayers’ dollars going toward food and agricultural R&D? Is the notion of redeploying these resources in a configuration involving less than 50 SAESs and 110 ARS labs a political dead duck?
The federal government could play a variety of roles in striving for efficient jurisdictional arrangements that deal with interstate R&D externalities, including improved property rights, new institutions, and federal government grants. Among these alternatives, the opportunity to develop new institutions that enable the individual states to internalize the effects, perhaps through the development of multistate regional R&D programs, seems to have been underused. Why this is so is unclear, but state-level politics, paranoia, and parochialism may have played a role. For instance, it would indeed be a remarkable coincidence if it turned out to be efficient, from both a state and a national perspective, to have an independent Experiment Station for every state.
Aside from duplication of effort and bureaucratic overhead, independent state-level organizations are liable to suffer from inadequate size (economies of size, scale, and scope mean that resources may be “stretched too thinly” in smaller states with diverse research problems) and market failures owing to incomplete ability to appropriate research returns within states. But no one seems to be proposing to merge Experiment Stations—say, between North and South Dakota or among midwestern states.
32Public Food and Agriculture Research in the U.S
Arrangements that may have made economic, as well as political, sense more than 100 years ago are likely to make less sense today. Goods, services, and factors of production are much more mobile now, and the technology used to transfer new ideas and production practices has also greatly improved.
Setting PrioritiesIn the book Science under Scarcity: Principles and Practice for Agricultural Research Evaluation and Priority Setting we laid out a logic of choice for evaluating alternative research investments and allocating research resources to achieve the greatest total benefit from a research portfolio.67 The economic principles and relevant measures are conceptually straightforward. Returns to the nation from the total investment are maximized if the marginal social benefit from an additional dollar invested is equalized across all investments, taking into account all relevant costs and benefits. Putting these principles into practice is more difficult, mainly because it is difficult to quantify the particular outcomes in farmers’ fields that can be attributed to particular research investments, given the multitude of influences at work. This is so even in hindsight, after we know the results from the research, and after the adoption process for the derived innovations has run its course. It is even harder beforehand, at the priority-setting stage, when we cannot know whether the research will be successful, whether the findings will result in technologies that farmers will adopt, where and when the innovations will be adopted, and what will be the consequences of that adoption.
The Determinants of Research BenefitsThese factors notwithstanding, a simple approximation procedure for estimating benefits from research investments captures the main influences at work. The expected gross annual research benefits (GARB) flowing from the adoption by farmers of a particular innovation such as a new crop variety in a particular year, t, are approximately equal to:
(1)
where a is the fraction of producers adopting (e.g., in this instance, the fraction of total acreage on which the new variety is planted), y is the proportional yield advantage of the new variety over the varieties it replaces, c is the proportional increase in costs per acre of growing the new variety compared with the varieties it replaces, P is the price per unit of the output, A is the total acreage of the crop, and Y is yield per acre. For simplicity, we can replace price times acreage times yield with the total value of output (V = P × A × Y), and the net effect of changes in yields and variable inputs with k = y – c, the proportional reduction in costs per unit output for those who adopt the new technology:
(2)
Thus the annual benefit from adoption is equal to the adoption rate times the proportional unit cost saving for those who adopt times the gross value of production in the industry affected.68
Suppose a particular research investment It has a probability p of successfully producing an improved variety that at least some farmers will choose to adopt and in doing so earn a stream of annual benefits as represented in equation (2), and a probability 1–p of yielding no benefits. Then the net present value (NPV) of the investment made in time t is equal to:
(3)
In this equation it can be seen how the present value of the payoff to a particular research investment depends on
• The odds of research success;
• The size of the industry to which the research is applicable;
• The gain per unit of adoption; and
• The maximum adoption rate within the industry and the time path of the adoption.

33Prospective Research Priorities and Policies
Previous economic analysis has shown that, taken together, the research lag before results are available and the subsequent adoption lag can total 10 or 20 years or more, even for comparatively applied research, and modest differences in these lags can have major impacts on the present value of the payoff .69
Congruence as a CriterionSimple analytics like this are helpful for identifying the key determinants of the relative ranking of alternative research investments. In the absence of other information, a simple “congruence” rule might indicate allocating research resources among agricultural industries according to their shares of the total value of production, such that research intensities would be equal. But such a rule might be too generous to the smaller industries, because the total payoff for a given innovation is greater if it applies to more units.70
To say more than this requires having some useful knowledge about the odds of successful research, the size of the gain per unit to be expected if the research is successful, the rate of adoption within the industry, and the time path of these outcomes. Those questions are best answered within the context of peer assessments made by scientists and others who are knowledgeable about the industries, the scientific possibilities, and the likelihoods of success; the role of economists is to provide the means for considering these attributes of the alternatives in an appropriate benefit-cost context as summarized by the approximation in equation (3).
Some people advocate spending a larger proportion of research resources on issues related to specialty crops, organic production, small farms, and local production. Political arguments for a greater emphasis of research on particular areas are often couched in terms of perceptions of the ethical superiority of particular production systems. Addressing such arguments is outside the scope of the economic approach and analysis provided here.71 The implicit economic argument rests on a view that research investments in these areas will yield relatively large payoffs because the private sector tendency to underinvest, relative to the social optimum,
is comparatively great in these areas. Whether this is so has not been clearly established, and the mechanisms are not altogether clear.72
Alston and Pardey explored the issues and arguments in their comprehensive analysis of the case of specialty crops research.73 As they demonstrated, a lack of private incentive and lack of private investment in a particular subject are not sufficient to prove a relatively large market failure. The private sector has comparatively strong incentives to invest in technologies applicable to larger scale production, but the attributes that determine private incentives also determine to a great extent the social payoffs. Both private and social returns are likely to be lower for research on smaller scale issues—such as particular minor specialty crops—and this means the relative payoff for public investments may still be higher for the larger scale issues that also attract private investments (even though the benefits accruing to certain producer or consumer groups with a stake in the specialty crop may be substantial).74
Alston and Pardey discussed the issue of congruence in this context. In the absence of information to the contrary, research resources might be allocated among categories of research focus (e.g., farm sizes, forms of production, commodities) according to the value share of production.75 Consider, for example, organic production, which represents about 3 percent of the total value of U.S. farm production.76 Even though organic production is growing as a share of the total, it is likely to remain a relatively minor element of U.S. agriculture for the coming decades. Evidence on the comparative merit of organic farming systems is mixed. A subset of the U.S. population is prepared to pay a substantial premium (typically in the range of 50–100 percent) for organic food based in part on their personal perceptions of the relative health benefits of organic versus other types of food.77 But organic production uses substantially more land (on the order of 20 percent) for a given quantity of output in exchange for avoiding the use of synthetic pesticides and other precautions.78

34Public Food and Agriculture Research in the U.S
These arguments are pertinent to the question of research resource allocation. How much of the total quantity of research resources should be devoted to organic production per se given that organic agriculture will benefit to some extent from research devoted to crop and livestock production generally? Should as much as 3 percent (or more) of the total research resources be devoted specifically to organic production? At least some of this discussion should be conducted in the context of specific expectations about the nature of the research to be undertaken, the likelihood of useful findings, and the probability of those results being adopted on a large enough scale and soon enough to justify the investment (relative to the opportunity costs of the benefits forgone from the other research opportunities forsaken). In the absence of additional arguments and evidence, a reasonable starting point is an allocation based on congruence. Then economic arguments for spending disproportionately larger shares of research resources on topics such as specialty crops, organic production, small farms, and local production would be based on evidence about the comparative payoffs and the comparative size of market failures.
Agricultural R&D as an Instrument of Social PolicyTo this point we have taken for granted that the rationale for government intervention is market failure and the appropriate criterion for public-sector investments in agricultural R&D is to choose the total investment and the allocation of those resources that will maximize the net social benefits from the investment. This is a powerful and important idea. Other criteria such as achieving a particular income distribution, a particular structure of agriculture, particular human health outcomes, or particular environmental outcomes are not mentioned. Without question, to the extent that agricultural R&D achieves social benefits by reducing costs of environmental externalities or public health-care costs, these benefits should be counted when computing the net benefits—and that is central to the economic arguments we have presented. But having counted all the benefits and costs, maximum net social benefits is the only consideration in this standard economic calculus.
This result follows because other, more suitable, policy instruments are typically available for addressing other concerns. The least-cost way of addressing environmental externalities is through environmental policy. For example, it would be uneconomic to seek to reduce social costs of nitrogen pollution of surface water or groundwater by shifting the allocation of agricultural research resources away from the national benefit-maximizing allocation (which by our benefit-cost calculus encompasses these social costs); policies related directly to the use of fertilizers should be used instead to address this concern. Likewise, the optimal allocation of research resources among commodities should take into account any impacts on the social costs of obesity. But it would be uneconomic to stray from that optimum and spend a larger share of resources on specialty crops research with a view to reducing the social costs of obesity; other policies focused directly on obesity will almost surely be cheaper and more effective for that purpose. Similar cases can be made against shifting the balance of research resources away from the national benefit-maximizing allocation aiming thereby to achieve particular outcomes with respect to the size distribution of farms, the nature of technology they employ, or farm income distributions. If these outcomes are socially or politically preferred, they can be achieved at much lower social costs using other policy instruments rather than distorting the research agenda.
Striking the Right BalanceEquation (3) has implicit in it some other considerations that are potentially quite important, related to some in-principle arguments about the appropriate roles for the public-sector in agricultural R&D. The main economic argument for government involvement in agricultural R&D is that the private sector underinvests from society’s point of view in certain types of agricultural R&D for which the benefits are not privately appropriable, giving rise to a form of market failure.79 The role of government is to address this market failure either by enhancing private-sector incentives (e.g., through subsidies or intellectual property rights) or by providing agricultural R&D as a public good using government funds. In the context of

35Prospective Research Priorities and Policies
equation (3), research areas that have been neglected as a result of problems in appropriation of benefits, and that would have been undertaken privately otherwise, will be characterized by a high probability of research success, a large impact for those who adopt, and high and rapid rates of adoption.
To make a case for giving high priority to research in a particular area requires first establishing that private incentives are attenuated (for instance, this is clearly not so in the case of hybrid maize varieties but might be more so for conventional varieties of other crops, especially those with more limited acreages or production value), and second, that the other conditions for a profitable investment are fulfilled, as illustrated in equation (3). Many (politically) popular priorities for federal research investments will fail both tests. Having made a case for government intervention is only a necessary condition. Sufficient conditions require comparing alternative investments and ranking them, because typically the total research resources are not sufficient to fund all of the potentially worthwhile investments.
The discussion to this point has related to the division of labor between the government and the private sector. Some related questions concern the division of labor among alternative arms of the federal government and between federal and state government entities. For example, research on nutrition, energy, or environmental pollution might be undertaken within the USDA or in SAESs or within the DOE, NIH, EPA, or NSF, but over time an increasing share of SAES effort has been devoted to these topics. How should the resources of the Experiment Station be allocated between farm productivity oriented agricultural R&D versus topics related to human health and nutrition, energy, or the natural environment? These are matters of policy, in principle, but to a great extent in practice it has been left to individual researchers to choose the emphasis of research within the SAESs, and thus the effective allocation of the resources provided by the Experiment Station, based on the availability of extramural funds that they could apply along with their own capacity.
Although we have made strong arguments about the general directions for policy, including a strong case for a much expanded public investment with a renewed focus on broadly conceived farm productivity enhancement, it is not our role in this report to identify specific subjects or research issues to emphasize within the public agricultural R&D portfolio—such as between crop varietal improvement (and whether it be more or less conventional versus bioengineered modes of crop improvement), weed science, and soil science. Those judgments are better made by others who have a contemporary understanding of the scientific opportunities and the emerging agricultural issues, ideally informed by structured, prior assessments of the likely social returns to the prospective investment in R&D. The real art of research policy is to decentralize those decisions as much as possible within a management system that provides appropriate opportunities and incentives that are compatible with the broader policy purposes.
Clearly there will be continuing demands for the types of research that have been important in the past. These include maintaining and increasing crop and livestock yields, and productivity more generally, in the face of co-evolving pests and diseases and, going forward, changing climate. As well as coping with a climate that will become warmer, drier, and more variable in many parts of the United States, farmers will also have to deal with new pest and disease pressures that will accompany climate change. The SAESs have come to play a role in conducting research across a broad range of subjects that extend well beyond farm productivity, and well beyond farms and the resources used by farmers. All such research is potentially worthwhile and within the ambit of the Experiment Station, but funders and researchers ought to pay serious attention to the forces that are shaping and shifting the balance, and to restoring the competitive position of farm productivity oriented agricultural R&D within the range of alternative uses of SAES researchers’ time and other resources.

36Public Food and Agriculture Research in the U.S
A New Approach?There is much that can be done to reform and revitalize public policies and existing institutional arrangements to increase the overall agricultural R&D effort in the United States and to make more efficient use of these ever-scarcer research resources. Other, entirely novel institutional arrangements that bring together the economic elements described above into a single, coordinated (rather than piecemeal) vision are also possible, and perhaps even desirable. In this section we speculate about an approach that could be taken to revitalize public agricultural R&D in the United States, combining new sources of funds and new approaches to employ those funds to good effect.80
New Sources of FundsOne potentially significant new source of funds is the significant stream of revenue that will be saved by the elimination of direct payments—around $5 billion per year—as proposed by the Senate and the House Agriculture Committee. If even half of these funds could be diverted to agricultural R&D, rather than countercyclical payments or crop insurance, they could yield very large dividends for the nation and a greater benefit for farmers. It would be desirable to have this funding committed, by mandate, to agricultural R&D so it could not be diverted to some other use easily, especially given the long time lags between making investments in agricultural R&D and reaping the resulting social benefits.
Another potential new source of funds is the food and agribusiness sectors, with an interest in issues primarily beyond the farm gate. To generate this funding requires a different approach from the past, whereby the industry would see a clear path to benefits and would participate as partners in the research decisions and the outcomes. A third potential source of substantial new funds is farm commodity groups, if they could begin to generate check-off type income for agricultural research on a
scale commensurate with the Australian research and development corporations (RDCs). As in Australia, such funding is only likely to be generated at scale if the industry has significant say in the use of the resources and the government is seen to be contributing new funds on a matching basis.
A New Institutional ArrangementTo generate, sustain, and productively allocate substantial new funding from any or all of these sources is likely to require novel approaches to the management and use of the funds. One approach would be to establish a new National Agency for Food and Agricultural Science (NAFAS).81 What we have in mind here involves a fundamentally different set of institutional and funding arrangements from the NIFA that was created in 2008.82 We could envisage substantial reforms to the mandate of NIFA that would achieve what we have in mind, but considerably enhanced operational independence, unencumbered by the legacy of past funding (and legislative) practices, would be critical to its success. Another option, which we favor, is to establish an agency separate from NIFA, focused just on R&D, with the operational independence to foster public-private partnerships in the funding and execution of the research, as a complement to NIFA.
The proposed NAFAS might operate strictly as a provider of funding for research to be undertaken by other bodies, with the funds to be distributed using appropriate processes combining competition and other elements intelligently (akin to the Australian RDCs and cooperative research centers, the CGIAR, or the NSF). Alternatively, it might operate more like the NIH, with a mixture of grants to others, as NIFA does now, plus programs of in-house research. This agency could have separate programs for food and for agriculture and other issues such as natural resources and the environment. It could operate outside but in close collaboration with the Land Grant College system and the USDA. It

37Prospective Research Priorities and Policies
might prefer not committing to employing particular scientists, dedicated to particular disciplines or fields of research, on a long-term basis. Instead, a large part of the work it funds could be undertaken by SAES scientists and others employed on a project or programmatic basis—seconded, full- or part-time, for shorter or longer periods from their substantive positions. The funds could also be used to secure the time of scientists working in the private sector. This approach would allow for greater flexibility over time in the use of resources, compared with the current structure in which a large share of existing SAES funds are committed to individual tenured faculty regardless of their research effectiveness or relevance. It would allow greater contestability among scientists for access to the research funds.
Key questions concern the division of labor between the NAFAS and other public and private institutions that fund and perform agricultural research and related activities, including the existing NIFA, and other related agencies devoted to research in other issues. Responsibility for funding research into human health, nonfarm environmental issues, nonfarm energy issues, and more basic science questions could be left to other agencies such as NIH, EPA, NSF, and DOE. Responsibility (with commensurate funding) for carrying out research into more basic biology, chemistry, bioinformatics, economics, and so on, could be located to a greater extent within the existing departments and colleges operating within or outside the college of agriculture, as distinct from the Experiment Station.
Ideally, the NAFAS would have the capacity to ignore geopolitical boundaries to a greater extent than is possible under the current arrangements where agricultural R&D is undertaken primarily by individual states in SAESs, with a mixture of federal and state government funding. It would have the capacity to dedicate funding to issues on a project
or programmatic basis, and employ the best and most appropriate researchers and others to do the required work. Some scientists might be employed 100 percent of the time in the NAFAS on a long-term basis; others might take leave from substantive faculty or other government or private-sector positions for a particular period of time to work in the NAFAS; others might remain in their current place of employment and be funded part time to work on NAFAS projects, with commensurately reduced expectations for their other duties.
Notably, the NAFAS also would have some flexibility in terms of modus operandi with respect to its engagement with the private sector in joint ventures, in view of the increasingly interconnected and, ideally, complementary private- and public-sector roles, and the rising importance of public-private partnerships in mixed models of funding and even conducting R&D.83 The commingling of public and private funds (from agribusiness firms in the input supply and food processing and logistics sectors to farm commodity and environmental organizations with an interest in agriculture) for clearly defined public-good and pre-commercialization research purposes is likely to better align and harmonize public and private interests and spur additional funding than do existing institutional arrangements. At present, private funding of SAES research is typically done on an ad hoc, piecemeal (e.g., position-by-position, or project-by-project), and often highly time-bound, basis. This style of funding is expensive to negotiate, typically lacks the critical mass required to tackle many of the present and emerging problems facing the food and agricultural sectors, and makes it difficult to delineate and coherently manage intellectual property and subsequent commercialization opportunities in ways that properly represent the joint public and private interests involved.

38Public Food and Agriculture Research in the U.S
ConclusionThis report began with a review of the changing pattern of U.S. agricultural R&D and the place of agricultural research in the overall spectrum of scientific research during the past century or more. This longer term meta-review provided context for a more detailed documentation and discussion of the changes in public agricultural R&D during the latter half of the 20th century. The review reveals marked changes in the funding, structure, and performance of public agricultural R&D in the United States, changes that may not be fully appreciated by those who work in the system or make policy recommendations and decisions that directly affect it. The balance between state and federally performed agricultural research has changed markedly, as has the spatial structure of SAES-based research, the balance among sources of funds for SAES research, and the topics researched.
A sustained trend of strong growth in real (inflation-adjusted) R&D spending has given way to a slowdown in the rate of growth of spending in recent decades,; with the rate of growth in agricultural R&D slowing to a greater extent than overall science spending since the early 1970s. In recent years, the slowdown has become a cutback, with real spending on public agricultural R&D in 2009 down 7 percent from the corresponding 2004 amount. Real spending on extension has effectively been stalled for decades. Combined with these slowdowns and cutbacks is a shift in public agricultural R&D away from preserving or promoting productivity gains in agriculture. This reorientation has developed in conjunction with a diversification of support for that research. Notably, although the USDA is still an important conduit for federal government funding, its share of federal support has shrunk considerably, with a host of other government agencies now helping to fund R&D. State government funding as a share of total SAES funding has declined as well.
A doubling of total funding for public agricultural R&D could easily be justified. This could not be done usefully overnight, even if the funds were immediately available. It takes time to build the capacity to make effective use
of additional funds. But the total annual spending could be doubled over 5–10 years, with appropriate attention to the balance between investments in bricks-and-mortar and equipment, and to rebuilding the human capital capability. The current aging of the population of SAES scientists is unsustainable. Rebuilding this capacity may take a long time. One way to accelerate the restoration and revitalization of SAES research is to open the door to the use of non-SAES scientists on the same campuses, or beyond, on short- or longer term, program- or project-specific bases to work on Experiment Station research.
Substantially enhanced support for food and agricultural R&D that sustainably preserves and promotes farm productivity growth and supports a safe and nutritious food supply system cannot be expected to arise from federal or state government sources alone. It could, however, be engendered from industry sources if the United States adopted a funding model similar to that used elsewhere in the world, in which farm productivity oriented agricultural R&D and appropriate regulatory and food-safety R&D, which primarily are collective goods for the respective industry participants, are funded by a combination of government and industry funds. The role for the federal government in this context is to take the lead in devising the institutional arrangements and providing incentives for the industry to participate through the use of matching government grants.
The issues are urgent. U.S. agricultural productivity growth is slow and slowing. The Experiment Station capacity is dwindling as the SAES human capability is shrinking and aging. Even if we act immediately to revive the Experiment Station and restore spending, the effects will not be felt for a long time. Agricultural R&D is slow magic. And this all presupposes the availability of funds. Institutional change to enable enhanced agricultural R&D spending takes time, too, even when we have support within the industry and in government. The situation is not yet desperate, and not hopeless, but the need for change is clear, and a meaningful change of the sort envisioned will require a seismic shift in attitudes, expectations, and aspirations, and soon.

39Endnotes
Endnotes1 World Bank, World Development Indicators 2012
(Washington, DC: World Bank, 2012), http://data.worldbank.org/data-catalog/world-development-indicators/wdi-2012. World average per capita income was $2,382 per person (2000 prices, U.S. dollars) in 1960 and $5,997 per person in 2010, a 2.5-fold increase. World Bank, World Databank: World Development Indicators (WDI) & Global Development Finance (GD) Online database (Washington, DC: World Bank, 2012), http://databank.worldbank.org/ddp/home.do?Step=12&id=4&CNO=2
2 Food and Agricultural Organization of the United Nations, FAOSTAT Database (Rome: Food and Agriculture Organization of the United Nations, 2012), http://faostat.fao.org; P. Pardey, J. James, J. Alston, S. Wood, B. Koo, E. Binenbaum, T. Hurley, and P. Glewwe, Science, Technology and Skills. Background paper for the World Bank’s World Development Report 2008 (St. Paul, Rome and Washington, DC: University of Minnesota, CGIAR Science Council and World Bank, 2007).
3 For a summary of the recent global food price spikes and an assessment of their effects on poor people, see International Monetary Fund & World Bank, Global Monitoring Report 2012-Food Prices, Nutrition and the Millennium Development Goals (Washington, DC: International Monetary Fund and World Bank, 2012).
4 Our conception of farm productivity is a broad one. Specifically, we have in mind a ratio of the total quantity of output (or value of output) to the total quantity (or cost) of inputs used. It reflects the consumption of nonrenewable resources and the effects of environmental pollution to the extent that they arise, even if these are not part of the producers’ decision calculus. This conception of productivity reflects a concern with sustainable production and resource use such that these aspects are taken fully into account. When we talk about total factor productivity (TFP) we have this concept in mind. If our measures fully corresponded to this broad concept of productivity, additional accounting for sustainability should not be necessary. Typically measures of productivity are incomplete in this sense, and some further accounting for environmental impacts and sustainable resource use may be necessary. But our discussion in principle relates to the broad concept in which all resource use and all environmental impacts are fully taken into account. For a broader discussion, see J.M. Alston, J.R. Anderson, and P.G. Pardey, “Perceived Productivity, Forgone Future Farm Fruitfulness, and Rural Research Resource Rationalization,” in Agricultural Competitiveness: Market Forces and Policy Choice, ed. G.H. Peters and D.D. Hedley (Aldershot, UK: Ashgate, 1995).
5 This computation assumes that factor proportions would remain as they are in 2007. But in 1949 agriculture was more land- and especially labor-intensive than at present. Some of these differences reflect the substantial changes in relative prices, especially of labor, but some may reflect the factor bias of technological change, which was to some extent land- and labor-saving, rather than factor neutral.
6 J.M. Alston, M.A. Andersen, J.S. James, and P.G. Pardey, Persistence Pays: U.S. Agricultural Productivity Growth and the Benef its from Public R&D Spending (New York: Springer, 2010); J.M. Alston, M.A. Andersen, J.S. James, and P.G. Pardey, “The Economic Returns to U.S. Public Agricultural Research,” American Journal of Agricultural Economics 93(5)(2011): 1257-1277.
7 See, e.g., J.M. Alston, J.M. Beddow, and P.G. Pardey, “Agricultural Research, Productivity and Food Prices in the Long Run,” Science 325(4)(September 2009): 1209-1210. Whether measures of growth of total factor productivity (TFP) or multifactor productivity (MFP) in agriculture are exhibiting a slowdown is the subject of a continuing debate among agricultural economists, but the participants in that debate have agreed that growth rates of partial factor productivity measures such as crop yields have slowed for the world as a whole and for most producing countries; e.g., see J.M. Alston, B.A. Babcock, and P.G. Pardey, eds., The Shifting Patterns of Agricultural Production and Productivity Worldwide, CARD-MATRIC on-line volume (Ames: Iowa State University, 2010), http://www.matric.iastate.edu/shifting_patterns/pdfs. The specific findings and the general discussion of slowing U.S. and global productivity growth in this report are based on work by Alston, Andersen et al., Persistence Pays, and Alston et al., “Agricultural Productivity,” and related work by the same authors. Some other agricultural economists have reached different conclusions regarding the question of a slowdown in TFP or MFP in the United States and globally; e.g., see V.E. Ball, S.L. Wang, and R. Nehring, “Agricultural Productivity in the United States: Data Documentation and Methods” (Washington DC: USDA Economic Research Service, May 2010), http://www.ers.usda.gov/data/agproductivity/methods.htm; K. Fuglie, “Is a Slowdown in Agricultural Productivity Growth Contributing to the Rise in Agricultural Prices?” Agricultural Economics 39(2008): 431-444; K. Fuglie, “Total Factor Productivity in the Global Agricultural Economy: Evidence from FAO Data,” in The Shifting Patterns of Agricultural Production and Productivity Worldwide, ed. J.M. Alston, B.A. Babcock, and P.G. Pardey (CARD-MATRIC online volume, Iowa State University, 2010). Available at http://www.matric.iastate.edu/shifting_patterns/pdfs/chapter2.pdf; and . Fuglie, K. Day-Rubenstein, P. Heisey, R. Karmarkar-Deshmukh, J. King, C. Pray, D. Schimmelpfennig, and S.L. Wang, Private-sector Research Investments in Agriculture, Food and Bioenergy (Economic Research Report 130, Economic Research Service, U.S. Department of Agriculture, 2012). The issue of underinvestment does not depend on a slowdown in

40Public Food and Agriculture Research in the U.S
productivity growth but the consequences are more concerning if we are right in our view that productivity growth has slowed and is likely to slow further given slower growth (or reductions) in spending on agricultural R&D oriented toward farm productivity enhancement.
8 In the one year in which it grew, 2008, spending increased by a mere 0.42 percent over the 2007.
9 Alston et al., Shifting Patterns.
10 More recently, using a related approach based on different models and different data, Heisey et al. derived even more pessimistic projections. P.W. Heisey, S.L. Wang, and K.O. Fuglie, Public Agricultural Research Spending and Future U.S. Agricultural Productivity Growth: Scenarios for 2010-2050 (USDA-ERS Economic Brief No. EB-17, U.S. Department of Agriculture, Economic Research Service, July 2011).
11 Over time, with the rise of major chains such as Wal-Mart, the U.S. and global agribusiness sector has become more concentrated and the role of private food regulations in the economy has changed. These changes have implications for the way markets for food and fiber operate and for the extent and nature of market failures in agricultural and food R&D; T. Reardon, C.P. Timmer, C.B. Barrett, and J. Berdegue, “The Rise of Supermarkets in Africa, Asia, and Latin America,” American Journal of Agricultural Economics 85(5)(2003): 1140-1146; L. Busch, “Performing the Economy, Performing Science: from Neoclassical to Supply Chain Models in the Agrifood Sector,” Economy and Society 36(3)(2007): 437-466. While reducing some forms of market failure in agricultural R&D, these structural changes might worsen some others, and also change the potential for various forms of public-private partnerships.
12 Although in some cases the public R&D precedes and provides the basis for follow-on research by the private sector, this is certainly not always the case. Research is a cumulative endeavor but the precise sequencing of public and private roles and their interconnectedness varies from technology to technology; see, for example, the respective and distinctive public and private roles in the technology timelines provided in J.M. Alston, P.G. Pardey, and V.W. Ruttan, “Research Lags Revisited: Concepts and Evidence from U.S. Agriculture” (Department of Applied Economics Staff Paper No. P08-14, University of Minnesota, December 2008). The point here is that because it is hard for private investors to appropriate sufficient returns from certain types of R&D effort (because of market realities, the nature of the technology itself, or the long lags in the research process), economically justifiable amounts of investment will not be provided by the private sector acting alone, even though those investments yield high social returns. To realize these high returns requires complementary action by the public sector; otherwise society forgoes substantial benefits.
13 That the involvement of private partners might influence the direction of public research is an issue of concern to some. This issue has been the subject of some research, but the results are mixed and the implications for policy are not clear in a world in which the total investment is too small and it is a complex business to evaluate the consequences of a public-private partnership that changes both the direction and the quantity of research. See, for example, N. Rosenberg and R.R. Nelson, “American Universities and Technical Advance in Industry,” Research Policy 23(1994): 232-348; G. Rausser, L. Simon, and R. Stevens, “Public vs. Private Good Research at Land-Grant Universities,” Journal of Agricultural & Food Industrial Organization 6(2)(2008): 1-29.
14 This figure includes the total spending by public and private entities across all areas of science (i.e., including agricultural, medical, and engineering R&D, information technology, social sciences, and so on). S. Dehmer and P.G. Pardey, “Private Food and Agricultural R&D in the United States, 1953-2009” (International Science and Technology Practice and Policy Center Report, University of Minnesota, 2012).
15 The per capita income classes used here come from the World Bank, World Development Indicators. We took countries classif ied by the World Bank as either low- or middle-income countries to be “developing countries.” So-called transition economies were included in the respective income class based on their per capita income status.
16 The estimate of the nondefense share reported by Dehmer and Pardey, “Private Food and Agricultural R&D,” approximately tracks the U.S. “civil research” share reported by OECD since 1981. Organisation for Economic Co-operation and Development, Main Science and Technology Indicators Vol 2012 release 01, OECD.StatExtracts Database (Paris: Organisation for Economic Co-operation and Development, 2012), http://stats.oecd.org.
17 U.S. Department of Defense, Fiscal Year 2008: Agency Financial Report (Washington DC: U.S. Department of Defense), pp. 96-98. Obtained May 2009 from http://www.defenselink.mil/comptroller/afr.
18 Ibid, pp. 4–23.
19 The federal government spending shares here relate only to research (excluding development). Data for 1980 are constructed from information obtained from National Science Board (NSB), Science and Engineering Indicators 2009, Appendix Tables 4-15 and 4-16 (Arlington VA: National Science Foundation, 2009), http://www.nsf.gov/statistics/seind93/chap4/atab/at41593.xls. Data for 2009 are from NSB, Science and Engineering Indicators 2012, Appendix Table 4-35 (Arlington VA: National Science Foundation, 2012), obtained July 2012 from http://www.nsf.gov/statistics/seind12/pdf/at.pdf.

41Endnotes
(eds.), Public-Private Collaboration in Agricultural Research: New Institutions and Economic Implications (Ames: Iowa State University Press, 2000); P. Heisey, J. King, K. Day-Rubenstein, and R. Shoemaker, Government Patenting and Technology Transfer (Economic Research Report No. 15, Economic Research Service, U.S. Department of Agriculture, 2006); D. Schimmelpfennig and P. Heisey, U.S. Public Agricultural Research: Changes in Funding Sources and Shifts in Emphasis, 1980-2005 (Economic Information Bulletin No. 45, Economic Research Service, United States Department of Agriculture, 2009); Fuglie et al., Private-sector Research; and J. King, A. Toole, and K. Fuglie, The Complementary Roles of the Public and Private Sectors in U.S. Agricultural Research and Development (ERS Economic Brief No. 19, United States Department of Agriculture, Economic Research Service, September 2012).
25 The Dehmer and Pardey series is an entirely new compilation of U.S. private food and agricultural R&D spending; Denner and Pardey, Private Food and Agricultural R&D. An earlier, beta version of this series was reported in Alston et al., Persistence Pays. For an alternative set of private-sector R&D estimates, see K.O. Fuglie, P.W. Heisey, J.L. King, C.E. Pray, K. Day-Rubenstein, D. Schimmelpfennig, S.L. Wang, and R. Karmarkar-Deshmukh, Research Investments and Market Structure in the Food Processing, Agricultural Input and Biofuel Industries Worldwide (USDA-ERS Research report No. 130, United States Department of Agriculture, Economic Research Service, 2011).
26 J. King, Concentration and Technology in Agricultural Input Industries (USDA Agricultural Information Bulletin No. 763, U.S. Department of Agriculture, Economic Research Service, March 2001).
27 The private share of agricultural R&D is substantially less, averaging around 58.4 percent over 2007–2009 compared with 42.7 percent over 1956–1958.
28 Food and Water Watch erroneously claimed that “By 2010, private donations provided nearly a quarter of the funding for agricultural research at land-grant universities”; Food and Water Watch, Public Research, Private Gain: Corporate Influence over University Agricultural Research (Washington, DC: Food and Water Watch, 2012), p. 1. In that 2012 report, the funding share incorrectly sourced as “private donations” was taken from CRIS data and in fact represents self-generated funds (i.e., revenue generated from fee-for-service activities, patent or plant variety royalties and such), industry grants and contracts, and other miscellaneous funds.
20 This section draws heavily on two sources: P.G. Pardey, J.M. Alston, and C. Chan-Kang, “Agricultural Production, Productivity and R&D over the Past Half Century: An Emerging New World Order” (Department of Applied Economics Staff Paper P12-7, University of Minnesota, 2012); P.G. Pardey, C. Chan-Kang, and S. Dehmer, “Global Food and Agricultural R&D Spending, 1960-2009” (InSTePP Report, University of Minnesota [in preparation]). R&D expenditures are taken to consist of “creative work undertaken on a systematic basis in order to increase the stock of knowledge, including knowledge of man, culture and society, and the use of this stock of knowledge to devise new applications,” Organisation for Economic Co-Operation and Development, Frascati Manual: Proposed Standard Practice for Surveys on Research and Experimental Development (Paris: Organisation for Economic Co-Operation and Development, 2002), p. 30. They ostensibly exclude spending on marketing new ideas or innovations or associated extension efforts. Public expenditures on agricultural extension are reported separately from R&D spending in this report.
21 Note, the developing-country, Asia and Pacific total used here omits Japan and South Korea, which are both classified as high-income countries.
22 P.G. Pardey and P.L. Pingali, Reassessing International Research for Food and Agriculture (Rome: Global Forum for Agricultural Research, 2010).
23 This section draws heavily on Dehmer and Pardey, “Private Food and Agricultural R&D.”
24 For prior compilations and interpretations of U.S. agricultural R&D spending data see: W.E. Huffman and R.E. Evenson, Science for Agriculture: A Long-Term Perspective, Second Edition (Ames: Iowa State University Press, 2006 [f irst published 1993]); W.E. Huffman and R. E. Evenson, “Do Formula or Competitive Grant Funds Have Greater Impacts on State Agricultural Productivity?” American Journal of Agricultural Economics 88(2006): 783-798; J.M. Alston and P.G. Pardey, Making Science Pay: The Economics of Agricultural R&D Policy (Washington DC: American Enterprise Institute Press, 1996); J.M. Alston and P.G. Pardey, “Public Funding for Research into Specialty Crops,” HortScience 43(5)(2008): 1461-1470; K. Fuglie, N. Ballenger, K. Day, C. Klotz, M. Ollinger, J. Reilly, U. Vasavada, and J. Yee, Agricultural Research and Development: Public and Private Investments Under Alternative Markets and Institutions (Agricultural Economic Report No. 735, Economic Research Service, United States Department of Agriculture, 1996); K.O. Fuglie and D. Schimmelpfennig

42Public Food and Agriculture Research in the U.S
33 J.M. Alston, M.A. Andersen, J.S. James, and P.G. Pardey, Persistence Pays: U.S. Agricultural Productivity Growth and the Benef its from Public R&D Spending (New York: Springer, 2010): 166-169.
34 See Alston and Pardey, “Public Funding,” Table 1.
35 W.L. Peterson, “Is the Demand for Experiment Station Personnel Declining?” Review of Agricultural Economics 14(1)(1992): 55-64. See also J.M. Alston, M.A. Andersen, J.S. James, and P.G. Pardey, Persistence Pays: U.S. Agricultural Productivity Growth and the Benef its from Public R&D Spending (New York: Springer, 2010): 160.
36 D.M. Gadourey, J. Andrews, K. Baumgartner, T.J. Burr, M.M. Kennelly, A. Lichens-Park, J. MacDonald, S. Savary, H. Scherm, A. Tally, and G.-L. Wang, “Disciplinary, Institutional, Funding, and Demographic Trends in Plant Pathology: What Does the Future Hold for the Profession?” Plant Disease 93(12)(2009): 1228-1237.
37 For a comprehensive legal and quantitative review of the evolution of plant varietal rights in the United States, see P.G. Pardey, B. Koo, J. Drew, and C. Nottenburg, “The Evolving Landscape of IP Rights for Plant Varieties in the United States, 1930-2008” (Staff Paper P12-1, University of Minnesota, Department of Applied Economics, January 2012).
38 At the time of preparing this report, the U.S. Supreme Court is hearing another case that has implications for the legal standing of so-called gene patents; R. Cook-Deegan, “Law and Science Collide over Human Gene Patents,” Science 338(2012): 745-747. Most of the attention surrounding this case is on the use of genetic technologies in medicine, but the patent claims pertaining to genes used in agriculture are also at legal risk; D. Graff, D. Phillips, Z. Lei, S. Oh, C. Nottenburg, and P.G. Pardey, “Not Quite a Myriad of Gene Patents: The Changing Landscape of U.S. Patents that Claim Isolated Nucleic Acids” (InSTePP Report, University of Minnesota [in preparation]).
39 In addition, the U.S. Congress has promulgated a host of legislative instruments that have changed the assignment and use of R&D-derived intellectual property with the expressed intent of accelerating the commercialization of new products and processes emerging from federally funded R&D. Some of this legislation was specific to agriculture; some spanned multiple sectors, including agriculture. For example, the Bayh-Dole Act of 1980 generalized the rights of researchers to patent inventions achieved under federal funding in nondefense areas and ushered in the Stevenson-Wydler Technology
29 These figures are net of forestry research; including it would increase total public agricultural R&D spending to $4.89 billion in 2009. To convert research spending from nominal values to constant priced values (base year 2009 prices), we divide nominal U.S. spending by a price index for agricultural R&D, documented by P.G. Pardey, C. Chan-Kang, and M.A. Andersen, “U.S. Agricultural R&D Deflator, 1890-2010” (Staff Paper, Department of Applied Economics, University of Minnesota [in preparation]). To reflect the opportunity cost of that spending we might alternatively deflate by a general price index such as the price deflator for GDP.
30 The magnitude of the measured slowdown in real agricultural R&D spending growth is sensitive to the price deflator employed. The corresponding growth rates when deflating nominal agricultural R&D spending with an implicit GDP deflator (rather than an agricultural R&D deflator as used for the figures in the text) are 6.31 percent per year during the period 1953–1970, 2.86 percent per year during 1970–2009, and 2.32 percent per year during 1990–2009.
31 Total (public and private) agricultural R&D spending grew at a slower rate during the 2000s (1.57 percent per year) than the 1990s (2.04 percent). The contemporary 21st century rate of growth is also well below the rate of growth during the 1950s (which averaged 5.13 percent per year from 1953 to 1960), 3.10 percent per year during the 1960s, and 5.66 percent per year during the 1970s, all in inflation-adjusted terms using an agricultural R&D spending deflator.
32 For a range of earlier estimates, see M.N. Heim and L.L. Blakeselee, “Biological Adaptation and Research Impacts on Wheat Yields in Washington” (paper presented at the annual meeting of the American Agricultural Economics Association, Reno, 1986); B.M. Swallow, G.W. Norton, T.B. Brumback, and G.R. Buss, Agricultural Depreciation and the Importance of Maintenance Research (Department of Agricultural Economics Research report No. 56, Virginia Polytechnic Institute and State University, 1985); and E.O. Adusei and G.W. Norton, “The Magnitude of Agricultural Maintenance Research in the USA,” Journal of Production Agriculture 3 ( January-March 1990): 1-6. J.A. Sparger, Is the Share of Agricultural Maintenance Research Rising? Implications for Future Productivity Growth in U.S. Agriculture (Unpublished MSc Thesis, Department of Agricultural and Applied Economics, Virginia Polytechnic Institute and State University, 2009) reports results from a 2008 survey of U.S. agricultural scientists that suggests the share of commodity research directed to maintenance has risen to around 41 percent from the 35 percent estimate for the mid-1980s reported by Adusei and Norton.
43Endnotes
Innovation Act of 1980, which encouraged federal laboratories to cooperate with the private sector in technology development and transfer; the National Cooperative Research Act of 1984, which provided antitrust exemptions for private participation in research consortia; the Federal Technology Transfer Act of 1986, which amended the Stevenson-Wydler Act to facilitate the formation of Cooperative Research and Development Agreements (CRADAs, which involved agreements between collaborating government agencies and private firms designed to speed the development and commercialization of technology); and the Alternative Agricultural Research and Commercialization Act of 1990, which directed some of the agricultural research and commercialization efforts of federally funded R&D to new nonfood and nonfeed products derived from agricultural commodities.
40 Beginning March 16, 2013, the U.S patent system will switch from a first-to-invent system, in which the first to conceive of an invention has the prima facie right to the grant of a patent, to a first-inventor-to-file system, in which the patent right resides with the first inventor to file for a patent, irrespective of the date when the invention was conceived; United States Patent and Trademark Office, “U.S. Patent and Trademark Office to Implement New Patent Quality Process” (press release, United States Patent and Trademark Office, September 12, 2012), http://www.uspto.gov/news/pr/2012/12-56.jsp.
41 See, for example, Pardey et al., “Agricultural Production.”
42 J.M. Alston, R.S. Gray, and K. Bolek, “Farmer-Funded R&D: Institutional Innovations for Enhancing Agricultural Research Investments” (Canadian Agricultural Innovation and Regulation Network Working Paper, University of Saskatchewan, March 2012), http://www.ag-innovation.usask.ca/cairn_briefs/publications%20for%20download/CAIRN_2012_FarmerFundedRD_AlstonGrayBolek.pdf.
43 This section draws heavily on Alston and Pardey, Making Science Pay.
44 This is not unique to agricultural research. Different efficient-sized catchment areas apply for rural hospitals, schools, police, and other services, depending on population densities among other things, and mapping local government areas (e.g., cities, counties, and states) to match services is often challenging—especially when the technology and institutions for service delivery, and the geographic pattern of demand, are changing rapidly.
45 It should be noted that such arrangements do not eliminate all appropriability problems given spillover effects among commodity-producer groups as well as within them.
46 The term “basic” or “pretechnology” research is used in relation to research that might not have any particular application but that is thought to have potential to contribute in a more fundamental way toward a variety of, perhaps undef ined, more applicable innovations. The OECD def ined these different types of research, for international comparisons, in two ways: (a) according to the purpose of R&D, and (b) according to the general content of the R&D; OECD, Frascati Manual.
47 The relevant issues were introduced by J.M. Alston and G.M. Scobie, “The Distribution of Research Gains in Multistage Production Systems: Comment,” American Journal of Agricultural Economics 65(1983): 353-356; J.W. Freebairn, J.S. Davis, and G.W. Edwards, “Distribution of Research Gains in Multistage Production Systems,” American Journal of Agricultural Economics 64(1)(1982): 39-46; and J.W. Freebairn, J.S. Davis, and G.W. Edwards, “Distribution of Research Gains in Multistage Production Systems: Reply,” American Journal of Agricultural Economics 65(2)(1983): 357-359. For a review of the arguments, see J.M. Alston, G.W. Norton, and P.G. Pardey, Science Under Scarcity: Principles and Practice for Agricultural Research Evaluation and Priority Setting (Ithaca: Cornell University Press, 1995). See also J.M. Alston and M.E. Fulton, “Sources of Institutional Failure and Underinvestment in Levy-Funded Agricultural Research” (invited paper, AARES Annual Conference, Fremantle WA, February 2012).
48 See, e.g., H.F. Carman and J.M. Alston, “California’s Mandated Commodity Programs,” in The Economics of Commodity Promotion Programs: Lessons from California, ed. H. Kaiser, J.M. Alston, J. Crespi, and R.J. Sexton (New York: Peter Lang, 2005).
49 Alston and Fulton, “Sources of Institutional Failure.”
50 This discussion draws significantly on R.E. Just, J.M. Alston, and D. Zilberman (eds.), Regulating Agricultural Biotechnology: Economics and Policy (Washington, DC: Kluwer, 2006). See also T. Josling, D. Roberts, and D. Orden, Food Regulation and Trade: Toward a Safe and Open Global System (Washington, DC: Institute for International Economics, 2003).
51 The conventional economic argument for government intervention in the economy is based on the idea of market failure—that the unfettered working of the free market mechanism has given rise to an inefficient allocation of resources or an unsatisfactory distribution of income—and that government intervention can make things better. The argument for regulation, as opposed to other policies, is that it will work better than the next-best intervention that might be applied to correct the perceived market failure.

44Public Food and Agriculture Research in the U.S
farm population. A similar formula was included in the 1955 Hatch Act amendment that replaced the original Hatch, Adams, and Purnell Acts; formula funding also found its way into the 1962 McIntire-Stennis Forestry Research Act, the Research Facilities Act of 1963, and the periodic Farm Bills reauthorizing federal support for the SAESs thereafter.
61 It also reflected an increase in congressionally earmarked funding during this period. Until recently, the USDA had certain program funds earmarked by Congress to support designated institutions for various research, education, and extension (REE) activities in annual agricultural appropriations Acts. In FY 2009, Congress appropriated over $159 million for ARS research projects at different labs across the nation and $122 million for research and extension projects at various land-grant institutions. In FY 2010 earmarks totaled $115 million for ARS and $135 million for land-grant institutions. Ending these trends, both FY 2011 and FY 2012 enacted appropriations did not include any earmarks for REE-related activities and Congress adopted a ban on earmarks for the 112th Congress; D.A. Shields, Agricultural Research, Education, and Extension: Issues and Background (CRS Report for Congress R40819, U.S. Congressional Research Service, March 23, 2012), pp. 19-20. http://www.fas.org/sgp/crs/misc/R40819.pdf.
62 The seven states with 2009 state-federal funding ratios in excess of 2.0 were Arkansas, Georgia, Louisiana, Nebraska, North Dakota, Oklahoma, and Wyoming (with Louisiana having the maximum ratio of $2.99 of state funding for every federal dollar). The ratio of state funding to USDA-sourced funds averaged 2.01 in 2009, with a high of 4.73 (Louisiana) and a low of 0.32 (Rhode Island). A total of 9 states failed to match USDA-sourced funds with funds from state sources, while 15 (26) states were below a 1.5 (2.0) state-to-USDA funding threshold.
63 This arrangement was implicitly criticized to some extent by the Productivity Commission in its draft report in which it recommended reducing the rate of matching support; Productivity Commission, Rural Research and Development Corporations (Draft Inquiry Report) (Canberra: Productivity Commission, September, 2010) At issue was (a) the extent to which the investments yielded benef its beyond the farming sector, and (b) the extent to which the government support was effectively additional rather than simply crowding out industry funding; see also. Productivity Commission, Rural Research and Development Corporations (Inquiry Report, Canberra: Productivity Commission, June 2011). These are diff icult questions to resolve, because they are essentially empirical questions and the measurement problems are challenging. Similar questions will arise with any such scheme. The issue for the U.S. government is what rate of matching support would be necessary to generate signif icant
52 N. Kalaitzandonakes, J.M. Alston, and K.J. Bradford, “Compliance Costs for Regulatory Approval of New Biotech Crops,” Nature Biotechnology 25(2007): 509-511.
53 The development of resistant pests or herbicide-tolerant weeds is an important potential consequence of the adoption of biotech crops; G.B. Frisvold, T.M. Hurley, and P.D. Mitchell, “Overview: Herbicide Resistant Crops--Diffusion, Benefits, Pricing, and Resistance Management,” AgBioForum 12(3&4)(2009): 244-248; T.M. Hurley, P.D. Mitchell, and G. Frisvold, “Characteristics of Herbicides and Weed-Management Programs Most Important to Corn, Cotton, and Soybean,” AgBioForum 12(3&4)(2009): 269-280. The U.S. government has opted to treat this as an externality—apparently presuming that the biotech f irms would not have appropriate incentives to manage the problem, even with proprietary technologies—and therefore it has imposed refuge requirements as part of its regulatory approval process for biotechnologies, although it has not done likewise with chemical pesticides.
54 Kalaitzandonakes et al., “Compliance Costs.”
55 H.I. Miller and G. Conko, “The Science of Biotechnology Meets the Politics of Global Regulation,” Issues in Science and Technology (Fall 2000): 47-54.
56 In 2009 crop insurance programs cost the federal government $5.6 billion, $1.7 billion of which was spent subsidizing farmer indemnities and $3.9 billion subsidizing the delivery costs of insurance companies. Averaging over the 2008–2011 period the farmer plus insurance company subsidies paid by the federal government averaged $6.6 billion per year; V.H. Smith, personal communication (Bozeman: Montana State University, July 2012).
57 R. Nixon, “Split Among House Republicans Over How Deeply to Cut May Delay Farm Bill,” The New York Times, July 12, 2012. Obtained September 2012 from http://www.nytimes.com/2012/07/13/us/politics/house-agriculture-committee-agrees-on-farm-bill.html?_r=1.
58 V.H. Smith and J.W. Glauber, “Agricultural Insurance in Developed Countries: Where Have We Been and Where Are We Going?” Applied Economic Perspectives and Policy (September 2012).
59 J.M. Alston, “Efficiency of Income Transfers to Farmers through Public Agricultural Research—Theory and Evidence from the United States,” American Journal of Agricultural Economics 91(5)(2009): 1281-1288.
60 The 1935 Bankhead-Jones Act imposed a formula that tied SAES support to each state’s share of the nation’s rural population; a more complicated formula was used in the Research and Marketing Act of 1946, with part of the funds divided equally among states, part distributed on the basis of rural population, and a third part based on

45Endnotes
68 This same conception of benefits can be applied for all kinds of research, not just crop varietal improvement. The key determinants of the annual flow of gross annual research benefits in any case are given by the gain per unit (which could be a reduction in private costs, a reduction in external costs, or an increase in value reflecting quality improvement) times the number of units affected; or, equivalently, the proportional gain times the value of the sector affected. Even so-called basic research, conducted with no particular application in mind, can be considered in the same way: it has value eventually because it leads to applications that result in innovations that are adopted. Indeed, the reason why basic research might have comparatively high rates of return is that the successful investments lead to results that are widely applied on an enduring basis (although this advantage might be offset by a higher proportion of dry wells given the more speculative nature of some of this research, or longer lag times in realizing economic returns from this R&D).
69 For instance, see Alston et al., Persistence Pays; “Economic Returns.”
70 Some say that besides doing research on topics too risky, long-term, and basic for the private sector, the public sector is supposed to be doing research that the private sector will not do because markets are too small or the research lags are too long; see, e.g., G.P. Robertson, J.C. Broome, E.A. Chornesky, J.R. Frankenberger, P. Johnson, M. Lipson, J.A. Miranowski, E.D. Owens, D. Pimentel, and L.A. Thrupp, “Rethinking the Vision for Environmental Research in US agriculture,” BioScience 54(2004): 61–65; G.P. Robertson, V.G. Allen, G. Boody, E.R. Boose, N.G. Creamer, L.E. Drinkwater, J.R. Gosz, L. Lynch, J.L. Havlin, L.E. Jackson, S.T.A. Pickett, L. Pitelka, A. Randall, A.S. Reed, T.R. Seastedt, R.B. Waide, and D.H. Wall, “Long-Term Agricultural Research (LTAR): A Research, Education, and Extension Imperative,” BioScience 58(7)(2008): 640–645. However, the same conditions that discourage private investment reduce the payoff to society from public research investment, and reduce the odds of the investment meeting the necessary condition that national benef its exceed national costs; see, e.g., Alston and Pardey, “Public Funding.”
71 We acknowledge that some ethical positions and value judgments are inherent in the conventional economic approach that we adopt, but we take that framework as given for this work.
72 An economic basis for giving emphasis to particular forms of production—such as organic production, local production, or production on smaller or larger family (or nonfamily) farms—requires that they will be comparatively important (i.e., they will have a comparatively large V) or the research possibilities are much greater there (i.e., they will have a larger p, a larger k, or faster results and more rapid adoption).
industry interest in such an approach to funding agricultural R&D, and to what extent would that be a more effective use of government funds than (a) 100 percent federal funding of agricultural R&D by some other means, or (b) some other investment. Alston and Fulton, “Sources of Institutional Failure,” review some of the recent history of these policies in Australia and some aspects of the design that influence their effectiveness in practice.
64 J. Roseboom and H. Rutten, “Financing Agricultural R&D in the Netherlands: The Changing Role of Government.” In Paying for Agricultural Productivity, ed. J.M. Alston, P G. Pardey, and V.H. Smith (Baltimore, MD: Johns Hopkins University Press, 1999); N.M. Beintema, G.G. Hareay, M. Bianco, and P.G. Pardey, Agricultural R&D in Uruguay: Policy, Investment and Institutional Prof ile (Washington, DC: International Food Policy Research Institute, 2000); J. Bervejillo, J.M. Alston, and K.P. Tumber, “The Benefits from Public Agricultural Research in Uruguay,” Australian Journal of Agricultural and Resource Economics 56(4)(2012): 475-497. Beintema et al. (p. 12) observed that “In 1999 more than 30 percent…[of the funding for INIA, Uruguay’s national agricultural research agency]…came from a commodity tax of 0.4 percent on the value of farm sales of most commodities. The government provides funding on a matching basis with annual tax revenue through its contribution to INIA, allocated quarterly.” They also noted that “By law, government contributions must equal or be greater than the total funds obtained via the commodity tax. In practice, however, the government has matched the cess revenues dollar for dollar.”
65 The Specialty Crops Research Initiative, introduced in the 2008 Farm Bill and administered as an element of NIFA, requires matching support from nonfederal sources, such as industry or state government, for relatively large-scale federal competitive grants. This has some features in common with the Australian RDC model—although it is based on matching at the level of individual projects rather than, as in the RDCs, for the entire program of research with the allocation of the finds left separate—and some with the Australian Cooperative Research Center model, which provided for joint public- and private-sector funding of applied research on a specific issue for a particular time period.
66 In addition to the 50 state Experiment Stations, f ive other agencies (including other cooperating entities such as the 1890 Colleges, Forestry schools, Schools of Veterinary Medicine, Cooperating Extension Institutions, and other Cooperating Institutions) received support from the U.S. federal government in 2009. Federal legislation establishing the USDA was passed in 1862. In 2012, the USDA operated 110 (regional) research labs throughout the United States.
67 Alston et al., Science Under Scarcity.
46Public Food and Agriculture Research in the U.S
79 Alston and Pardey, Making Science Pay.
80 Much of what is discussed in this section was inspired by conversations we held with Dan Dooley, Dan Sumner, Neal Van Alfen, and Al Levine, but they are not accountable for the specific propositions developed here.
81 This new agency would be similar in spirit but would differ in some significant details from the proposed Foundation for Food and Agricultural Research (FFAR) that formed part of the Agricultural Reform, Food and Jobs Act of 2012, which passed the U.S. Senate on June 21, 2012 (see http://www.govtrack.us/congress/bills/112/s3240/text). The FFAR was modeled after the Foundation for the National Institutes of Health (and other similar entities), and also seen as a means of stimulating investment in food and agricultural R&D; see, for example, E. Stokstad, “Congress Looks for Donors to Boost Agricultural Science,” ScienceInsider, April 24, 2012. Obtained December 28, 2012, from www.news.sciencemag.org/scienceinsider/2012/04/congress-looks-for-donors-to-boost.html.
82 NIFA operates as an agency within the USDA with a mission to “advance knowledge for agriculture, the environment, human health and well-being, and communities by supporting research, education, and extension programs in the Land-Grant University System and other partner organizations. NIFA does not perform research, education, and extension but rather helps fund it [from Federal government funds made available via annual formula grants to land-grant universities and competitively granted funds to researchers in land-grant and other universities it at the state and local level]”; USDA National Institute of Food and Agriculture, “NIFA Overview” (Washington, DC: National Institute of Food and Agriculture, 2012), http://www.csrees.usda.gov/about/background.html.
83 These public-private interrelationships may be better developed regarding defense and health (and, perhaps, energy) research. In any event, there may be much untapped innovation potential in food and agricultural R&D that goes wanting because of a lack of suitable institutional arrangements and incentives.
73 Alston and Pardey, “Public Funding.”
74 It is perfectly understandable that members of particular groups who stand to benefit from research with a particular emphasis will press for shifting the balance of public research spending in that direction, even if that might mean a lower total national benefit. “Rent-seeking” with respect to public research is similar to rent-seeking with respect to farm subsidies, in that it entails benefits for some at the expense of the whole. An important difference is that agricultural R&D yields a net social benefit, and is likely to do so even if the balance is distorted to favor particular politically influential groups.
75 Alston and Pardey, “Public Funding.”
76 See C. Dimitri and C. Greene, “Recent Growth Patterns in the U.S. Organic Foods Market” (USDA Economic Research Service, Agriculture Information Bulletin No. AIB-777, September 2002). Obtained September 2012 from http://www.ers.usda.gov/publications/aib-agricultural-information-bulletin/aib777.aspx; USDA Economic Research Service, “Organic Overview” (Washington, DC: United States Department of Agriculture, 2012). Obtained September 2012 from http://www.ers.usda.gov/topics/natural-resources-environment/organic-agriculture/organic-market-overview.aspx.
77 Smith-Spangler and colleagues conducted an extensive meta-analysis of the evidence on the health consequences of consuming organic food. They did not find any scientific evidence that organic foods are more nutritious or carry lower health risks than conventional alternatives. They did report that consumption of organic foods can reduce the risk of pesticide exposure, while noting that all foods generally fall within allowable safety limits. C. Smith-Spangler, M.L. Brandeau, G.E. Hunter, J. C. Bavinger, M. Pearson, P.J. Eschbach, V. Sundaram, H. Liu, P. Schirmer, C. Stave, I. Olkin, and D.M. Bravata, “Are Organic Foods Safer or Healthier Than Conventional Alternatives? A Systematic Review,” Annals of Internal Medicine 157(5)(September 2012): 348-366.
78 Dmitri and Green, “Recent Growth Patterns.” The same ideas can be couched in terms of “market” versus “nonmarket” benefits. If organic production yields greater nonmarket benefits (i.e., in addition to the benefits from the lower perceived food safety risk for which consumers are paying a substantial premium), then we will understate the research benefits if we use the market value alone in equation (3), but the calculation of GARB is done in the same way regardless of whether the impact is to increase market or nonmarket benefits from production or consumption.
About AGree
AGree is designed to tackle long-term food and agriculture issues. The initiative seeks to drive positive change in the food and agriculture system by connecting and challenging leaders from diverse communities to catalyze action and elevate food and agriculture policy as a national priority. AGree also recognizes the interconnected nature of agriculture policy globally and seeks to break down barriers and work across issue areas.
AGree is a collaborative initiative of nine of the world’s leading foundations, including the Ford Foundation, Bill & Melinda Gates Foundation, The David and Lucile Packard Foundation, W.K. Kellogg Foundation, The McKnight Foundation, Robert Wood Johnson Foundation, Rockefeller Foundation, and The Walton Family Foundation, and will be a major force for comprehensive and lasting change.
Contact us:
1920 L Street, NW • Washington, DC 20036 • 202-354-6440
www.foodandagpolicy.org

www.foodandagpolicy.com