Embed Size (px)
Citation preview

SUSTAINABLE WATER INFRASTRUCTURE
MARCH 2017 |
COLUMBIA UNIVERSITY

SOURCE: FOOD AND AGRICULTURE ORGANIZATION OF THE UNITED NATIONS, 2011
Global distribution of physical water scarcity by major basin (2011)
Note: The map shows the global distribution of water scarcity by major river basin based on consumptive use of water in irrigation.
Worldwide Water Scarcity

Objectives
Water Infrastructure
Emerging Water Technologies
Water Markets
International Case Studies

Objectives
Examine freshwater infrastructure and energy related technologies to forecast potential areas for investment.

Objectives
Water Infrastructure
Emerging Water Technologies
Water Markets
Case Studies

Water Infrastructure Current Condition
Most of the drinking water infrastructure in the U.S. was built in the post-World
War II era, over 50 years ago, with some of it having been in the ground for
more than a century. Northeast and Midwest Large Water Systems are the
oldest.
Large:
> 50,000 ppl
Medium:
10,000-49,999 ppl
Small:
3,300 – 9,999 ppl
Very Small:
< 3,300 ppl
DATA SOURCE: AMERICAN WATER WORKS ASSOCIATION

Aging Water Infrastructure Reasons
Economic Reasons
- Lacking of capital: 30%-35% water infrastructure projects do not have enough
working capital to complete construction after engineers design them.1
- Large scale projects interrupt residents’ lives and generate extra costs,
especially in big cities.
Political Reasons
- New technologies for water infrastructure have been in existence for 15-20
years, but some municipalities don’t want to use them. E.g. New York City and
Los Angeles city do not allow the use of plastic pipes in water applications.1
a) Engineers have old mentality and do not have experience using new materials
b) People do not pay attention to underground pipes until some incident occurs and are not
promoting change
c) Some unions, e.g. iron and steel unions, very strong political organizations with
extensive lobbying budgets to maintain high levels of employment for members.
- Each state has 2-7 water agencies and they function autonomously.2
1. INTERVIEW WITH JMEAGLE’S CEO & CHAIRMAN MR. WALTER WANG2. WATER WEBSTER STATE WATER AGENCIES

Water Infrastructure Capital Need
Estimated total replacement costs for water pipes in the U.S. add up to over $2.1
trillion and investment in water mains added up to over $1.7 trillion through
2050. The system that needs the most capital are Medium & Small pipes in the
South.
0
100
200
300
400
500
600
NortheastLarge
NortheastMedium &
Small
NortheastVerySmall
MidwestLarge
MidwestMedium &
Small
MidwestVerySmall
SouthLarge
SouthMedium &
Small
SouthVerySmall
WestLarge
WestMedium &
Small
WestVerySmall
AggregateReplacementValue of Water Pipes(billions)
Water Utility Location and Size
Aggregate Replacement Value of Water Pipes in the U.S.
DATA SOURCE: AMERICAN WATER WORKS ASSOCIATION

Water Infrastructure Finance – National• Federal Level – “Water Infrastructure Finance and Innovation Act of
2014”(WIFIA)
• Issued by Environmental Protection Agency (EPA)
• > $1.0 billion in credit assistance & may finance > $2.0 billion in water
infrastructure1
• The new EPA Chief Scott Pruitt includes water structures in plans for
national infrastructure renewal2
1. UNITED STATES ENVIRONMENTAL PROTECTION
AGENCY (EPA)
2. BLOOMBERG BNA

Water Infrastructure Finance – Partnerships
• Federal-State Partnerships (EPA & States)
• The self-perpetuating loan assistance Clean Water State Revolving Fund (CWSRF) &
The Drinking Water State Revolving Fund (DWSRF) were established in 1987
• The nation's largest water quality financing source has provided $133 billion in low-
cost funding over the last 25 years, using a combination of federal and state funds1
• Public-Private Partnerships (P3s)
• Long-term contractual agreements between a public and private entities to provide
high quality services in a cost effective way, can leverage both the WIFIA and SRFs
• Water Finance Center under EPA performs research in water P3s and provides
technical assistance for projects2
It is hard to carry out P3s projects in the U.S. like in China because of different
political systems3
IdeasChina
• Selling a Package (Treatment Plant + Pipes)
U.S.
• Wastewater Trade
• Public – Infrastructure & Private – Equipment
1. UNITED STATES ENVIRONMENTAL PROTECTION AGENCY (EPA)
2. EPA P3S
3. INTERVIEW WITH JMEAGLE CEO&CHAIRMAN MR. WALTER WANG

U.S. Water System Violations
Lead and Copper Rule Violations1
• Safe Drinking Water Act passed in 1974
• 49 States have primacy, EPA retains
enforcement authority
• Lead and Copper Rule established in
1991 by EPA
• Regulates lead levels and testing of
high risk homes -15 ppb cutoff
• ~5,360 community water systems were in
violation in 2015
• Incorrect testing methods, failure to
report and treat contamination
• Over 18 million Americans live in these
communities
• EPA took formal enforcement measures in
only 11.2% of the 8,000 violations
• Only ~5% of violations were compliant
by 12/31/15
Community Water Systems in Violation of Lead and Copper Rule (2015)1
1. NRDC WATER REPORT 2016

Lead Action Level Exceedance
• 1,110 community water systems
exceeded 15 ppb1
• ~3,950,000 people
• Communities above 15 ppb are
underrepresented on this map due to
poor state monitoring and testing methods
• 33 cities have been accused of using
water testing cheats in determining lead
levels (Jun. 2016)2
• Major cities include Chicago, Boston,
Buffalo, and Philadelphia, which is
accused of having the worst water testing
in the U.S.2
• Testing methods such as pre-flushing
and running water slowly contributed to
the Flint, Michigan crisis
Community Water Systems that Exceed 15 ppb (2015)1Testing Methods
1. NRDC WATER REPORT 20162. THE GUARDIAN

Other Major Cities Requiring Investment
• PWSA (Pittsburgh Water and Sewer Authority) is investing $60.0 million in Pittsburgh’s water system in 20171
• In June 2016, top 10% of tested Pittsburgh homes had lead levels of 22 ppb, Flint was 20 ppb1
• December 2016, Top 10% was 18 ppb
• The city of Pittsburgh is planning to invest $1.0 million in facet filters to distribute to the city’s residents
• Pittsburgh Mayor Bill Peduto is searching for private investors to form a public private partnership with PWSA in
hopes of reducing debt levels and overhauling the city’s water infrastructure
Requirement for Infrastructure Investment
4. BOSTON GLOBE
5. BALTIMORE SUN
Pittsburgh Water Infrastructure
• New York: 14% of water school outlets outside of NYC showed lead levels of more than 15 ppb (Jan. 2017)2
• Governor Cuomo recently announced the Clean Water Infrastructure Act of 2017, invest $2.0 billion in
water infrastructure
• Estimates say that New York requires $80.0 billion over the next 20 years
• Wisconsin: ~176,000 lead service pipes and the cost of replacing them is between $511 and $756 million3
• Milwaukee plans to spend $6.8 million in 2017 to replace lead pipes (Jan. 2017)
• Massachusetts: 164 schools had at least one sample that was above the 15 ppb. (Nov. 2016)4
• Baltimore: 4% of all samples taken from a Baltimore water survey in 2016 were above 15 ppb (Apr. 2016)5
1. PGH2O.COM
2. SYRACUSE NEWTIMES
3. WISCONSINWATCH.ORG

“Nothing is more useful than water: but it will purchase scarce anything; scarce anything can be had in exchange for it. A diamond, on
the contrary, has scarce any use-value; but a very great quantity of other goods may frequently be had in exchange for it.”
— Adam Smith, Chapter 4, Book I, Wealth of Nations (1776)
Pricing of Water1
• Key difference between water and other commodities is the lack of sufficiently accurate price signals
determined by the forces of supply and demand
• Regulators require that monopolistic suppliers charge prices that cover the cost of delivery – cost does
not include scarcity price. This results in administrative cost far lower than value of water or cost of a
shortage
• Survey of 30 metropolitan regions in the United States found that cities in rain-scarce regions have the
lowest residential water rates and the highest level of water use
The Economics of Water Scarcity
1. DAVID ZETLAND – INTERVIEW, MARCH 2017
2. TABLE DATA: USGS

Transaction Overview

• The plant produces approximately 50 million US gallons (190,000 m3) of fresh water per day
• Operating cost of $49 million to $59 million a year. It will provide about 7% of the potable water needs
for the San Diego metropolitan area
• The cost of water from the plant is roughly $.03-$.06 more per gallon than recycled water, $.31-$.34
more than reservoir water, but $.03 to $.06 less than importing water from outside the county
• However, San Diego still imports roughly 90% of its water, leaving potential opportunities for
further water infrastructure investment in an area not without significant demand
Efficacy of the Project

Bayonne, NJ – P3 Concession
• December 21, 2012 – Bayonne Municipal Utilities Authority (“BMUA”) took part in Public-
Private Partnership with United Water (dba Suez) and KKR for a 40-year concession
• In 2012, BMUA increased rates 27%, resulting in decreased revenue due to conservation
efforts on the part of customers
• A major barrier for proceeding with the P3 concession approach was BMUA’s double-digit
debt burden coupled with the significant necessary capital and maintenance needed to
update infrastructure

• Under the deal terms of the 40-year contract, United Water (dba Suez) formed a joint venture
with KKR to form the Bayonne Water Joint Venture
• The transaction was structured with a $150 million upfront concession payment coupled with
annual $500,000 concession fees
• BMUA issued roughly $110 million in privately placed taxable bonds with a November 2037
maturity and a 5.07% coupon
• KKR-Suez provided $63.8 million in equity in order to finance BMUA’s upfront payment and
initial capital obligations, with KKR accounting for 90% of the total position
Transaction Overview

• Customers would be forced to absorb the bulk of the price increase over the first year
• Deal structure designed to lock in fixed rate increases over the 40-year life
• Structure included a 2-year rate increase freeze as well as a 4th year 3.5% fixed rate
Revenue Path Model
Initial based year 2011 revenue has
been set at $20,639,000 as per the
BMAU Agreement
$20.6 mm
2011 Revenue
2013-2014
Rate Freeze Period
For the period covering 2013-2014 rates
will be fixed
Rates increase by 8.5% initially and then
remain flat in 2013 and 2014, increasing
3.5% in 2015
$26.3 mm
2015 Revenue
$19.4 mm
$6.9 mm
2015 Fixed
Revenue
2015 Inflation
Linked Revenue
2015-2052
2015-2052
~3.5% from 2015-2021
3.75% thereafter
20% at the Labor Adjustment Index plus
(i) 1.0% per year during 2015 to 2021 and
(ii) 1.25% per year thereafter
10% at the Standard Adjustment Index
plus (i) 1.0% per year during 2015 to
2021 and (ii) 1.25% per year thereafter

Objectives & Deliverables
Water Infrastructure
Emerging Water Technologies
Water Markets
Case Studies

Permian Basin
• Total wells: 14,662
• Total water usage: 63.6 billon gallons
Eagle Ford Shale
• Total wells: 14,687
• Total water usage: 82.1 billions gallons
DJ Basin
• Total wells: 7,376
• Total water usage: 17.0 billons gallons
California Basin
• Total Wells: 2,649
• Total water usage: 0.3 billons gallons
Approximate % of wells in high and
extreme water stress:
• Permian Basin ~69%
• California Basin 99%
• Eagle Ford 89%
• DJ Basin 100%
Shale Basins & Water Scarcity
Basin Statistics1
The average shale well in the United States requires roughly 71 - 119 thousands barrels of water to hydraulically fracture depending on location1
1. CERES2. U.S. GEOLOGICAL SURVEY

1. Where will operators in water scarce areas continue to get their freshwater for fracking operations?• Majority of shale producers are highly dependent on ground water resources for their fracking operations
2. What will operators do with their produced water from their exploration and production operations?
• The national weighted average is 9.2 barrels of produced water for every barrel of crude and 97 barrels of produced water for every million cubic feet of natural gas1
O&G Water Problems & Plays
Two Water Problems
Marcellus, Eagle Ford, and Permian
Marcellus
• Surface water accounts for 63% of water used, municipalities & recycled water account for 20% & 18% respectively2
• Companies operating in the Marcellus play typically recycle 80-90% of their waster water3
• Factors include seven state permitted disposal wells and high trucking costs of waste water to Ohio
Eagle Ford
• Approximately 90% of water used in fracking is sourced from fresh groundwater,, in some counties consumption
exceeds recharge rates by a 2.5x factor4
• Majority of operators use disposal wells due to their abundance and low cost
Permian
• Operators source roughly 100% of their water from fresh and brackish aquifers due to low cost5
• Majority of operators use disposal wells due to low costs and abundance
4. BUSH SCHOOL OF GOVERNMENT
REPORT
5. TEXAS UNIVERSITY REPORT
1. GROUND WATER PROTECTION COUNCIL 2015
2. STATE IMPACT NPR
3. PENN STATE REPORT

Fracking Water Economics
Costs Of Recycle Technology
• Halliburton electrocoagulation procedures have been cited at costing roughly between $1.68 to $1.89 per barrel3
• Ecosphere Energy Services provides on-site treatment for roughly $0.3- $0.5 per barrel, trucking and disposal fee costs $1 per barrel3
• Basic Energy Services estimates cost of recycling produced water at roughly $0.1 - $1.5 per barrel4
• Veolia: building Antero a $275 million treatment plant, $150,000 expected savings per well5
• Halliburton: saved Permian basin operator more than $500,000 using Cleanwave6
4. INTERVIEW WITH BASIC
5. WATER ONLINE
6. HALLIBURTON CASE STUDY
Produced Water Industry
• The current market for treating produced water is estimated to exceed $4.3 billon for the next five years and is
expected to grow at a 6.8% CAGR annually. The is expected to reach $8.56 billion by 2025.2
Water Costs
• Water treatment and disposal is extremely costly to E&P companies; typically produced water management
technology is categorized as minimization, recycle reuse, or disposal.
• Purchasing freshwater is expensive and total costs can range between $0.75 and $9.75 per barrel.1
• Disposal of produced water is expensive and can cost between $1.00 and $17.00 per barrel, this includes trucking
costs.1
1. EP MAG
2. GLOBAL PRODUCED WATER TREATMENT REPORT
3. BREAKING ENERGY

Pressure
• Due to the increasing water scarcity, desalination
has become an important source of fresh water,
especially for human consumption and
agriculture.
• Global desalinated water production amounts to
90 million m3, equivalent to 1% of global water
supply.
• Reverse Osmosis is the dominant technology for
desalination accounting for 63% of the installed
capacity around the world3.
RO Membrane Separation Mechanism
Reverse Osmosis (RO)1
Normal Osmosis
Reverse Osmosis
High salinity water
Membrane and water movement
1. ECONOMIC EVALUATION OF SEAWATER DESALINATION, SAUD MOHAMMED H BIN MARSHAD, HERIOT WATT UNIVERSITY, EDINBURGH, UNITED KINGDOM, AUGUST 20142. NITTO HYDRANAUTICS COMPANY, CRAIG R. BARTELS, PHD3. IEA-ETSAP AND IRENA© TECHNOLOGY BRIEF I12 – MARCH 2012
Desalination Technology: Reverse Osmosis
• Desalination cost is determined largely by the cost
of electricity. On average, the cost of electricity in
Reverse Osmosis desalination accounts for
around 31% of the production cost.
• Seawater Reverse Osmosis technology has
decreases its cost of production more than 200%
since 1970. By 2015 the cost of production
reached round $0.74 per m3.
• RO Desalination growth has been fueled by lower
energy consumption, higher reliability and lower
maintenance costs.
Cost Reduction in Membrane Desalination 1970-2010
Reverse Osmosis Cost Structure: $0.74 per m3
SOURCE: AMERICA’S AUTHORITY IN MEMBRANE TREATMENT,. DESALINATION, 2015.
38.2%
31.6%
3.9%
13.2%
9.2%3.9%
Capital Cost
Electrical Energy
Membranes
Labor
Chemical
Others
Cost of Reverse Osmosis Desalination

Florida, California, and Texas are the largest players
• Approximately, 2,000
desalination facilities larger
than 0.3 million gallons per
day (MGD) operate in the
U.S. This represents 2% of
U.S. municipal and industrial
freshwater use.
• Florida, California, and Texas
have the greatest installed
desalination capacity and
account for 68% of municipal
desalination facilities.
California:Orange County(Waste water)
100 MGD, 2015
California:Carlsbad
(Sea water)50 MGD, 2015
Texas:El Paso
(Brackish)27.5 MGD, 2004 Florida:
Tampa(Sea water)
25 MGD, 2006
Major Desalination Plants in U.S.
SOURCE: DESALINATION - INTERNATIONAL JOURNAL, 2014.
RO process in Wastewater
Seawater desalination
Brackish desalination
Desalination in U.S.

• Improvements in membrane technology leads to:
Reduction of energy consumption.
Reduction O&M cost.
Higher permeability.
Increases water recoveries.
• Material science promises important advances in
membrane development for reverse osmosis
technology:
Nanocomposite
Chlorine resistant membranes
Nanotube
Graphene based membrane
Scheme of graphene membrane for desalination1
1. WANG , Y. CARBON , 20172. AMY, G.,MEMBRANE-BASED SEAWATER DESALINATION: PRESENT AND FUTURE PROSPECTS, DESALINATION, 2016.
• Costs associated with desalination are expected to decrease is by 20% by 2021.
Developments in desalination

Objectives
Water Infrastructure
Emerging Water Technologies
Water Markets
Case Studies

Water MarketsWater Trading Schemes Around the World
1. Australia:
- Since 1994
- Largest system
- $3.1 billion market
- Electronic Exchanges
2. US:
- Since the 1980s
- Markets in AZ, CA, CO, NM
3. South Africa:
- Since 1997
- Early stage, small
volumes, local areas
4. Chile:
- Since 1981
- Only water entitlement
- Weak regulation
3. UK
- Since 2001
- Only water entitlement
6. Oman:
- Since 2500 BC
- Aflaj irrigation system
7. Canary Islands:
- Since 1975
- Informal
SOURCE: THE NATURE CONSERVANCY “WATER SHARE REPORT”,; REUTERS “WATER TRADING SCHEMES AROUND THE WORLD”

• Pre-conditions:
• Second dryest continent
• Uncertainty about rainfall
• Variation in river flow
• The Murray-Darling Basin:
• 65% of all irrigated farmland in Australia
• 55% of all farm revenue in Australia
• 90% of the consumptive use of Murray-
Darling water goes to irrigating cotton,
rice, cereals, pasture, etc.
Trading Water in Australia
Water Markets
SOURCE: AUSTRALIAN GOVERNMENT NATIONAL WATER COMMISSION “WATER MARKETS IN AUSTRALIA”; THE NATURE CONSERVANCY “WATER SHARE REPORT

Water Markets
Water Trading Types• Temporary Water Trade
• A transfer of water specifically for the irrigation season
• In some regions, temporary transfers are solely transfers of allocation
• In other regions, an entitlement can be transferred on a temporary basis
• Permanent Water Trade
• A transfer of the water entitlement to the purchaser on a permanent basis
• The purchaser will retain the parcel and receive any allocation granted upon it from
the date of the transfer indefinitely or until the time at which they sell the entitlement
• Forward Water Market
• Enables the contracting of temporary or permanent water parcels at a set price to be
delivered at a future date, to be determined by the seller and purchaser
SOURCE: WATERFIND; : AUSTRALIAN GOVERNMENT NATIONAL WATER COMMISSION “WATER MARKETS IN AUSTRALIA”
• Water Access Entitlement
• The perpetual or ongoing entitlement to exclusive access to a share of water from a
specified consumptive pool
• Water Allocation
• The specific volume of water allocated to a water access entitlement in a given
season
Water Right Types

• 1994 Water Reforms:
• Separation of water rights from land
• Allow inter-state trading
• 2004 National Water Initiative: Further unbundling of water rights into:
• Water access entitlement
• Water allocation
• Delivery share
• Water use license
Building up the Water Market
Water Markets
SOURCE: AUSTRALIAN GOVERNMENT NATIONAL WATER COMMISSION “WATER MARKETS IN AUSTRALIA”; THE NATURE CONSERVANCY “WATER SHARE
REPORT

• Millennium Drought (worst during 2007-09): water trading reduced losses in the
regional from $11.3 billion to $7 billion over 5 years
• Investment Partnerships:
• e.g. Nature Conservancy’s Water Sharing Investment Partnership
• e.g. Waterfind’s involvement with the On-Farm Irrigation Efficiency Program
Economic Results and Future Opportunities
Water Markets
SOURCE: AUSTRALIAN GOVERNMENT NATIONAL WATER COMMISSION “WATER MARKETS IN AUSTRALIA”; THE NATURE CONSERVANCY “WATER SHARE
REPORT

Water MarketsDevelopment of California’s Water Market
• In the mid 1990’s, water
regulation reforms began
allowing the transfer of water
from water rich areas to areas
of water scarcity through state-
owned water banks.
• Amidst large scale drought
allocation problems became
worse beginning in 2011, with
2011 and 2014 the State’s
driest years on record.
• As the State now enters a
phase of recovery, water
scarcity will remain a problem
as population growth
projected from 38 million today
to 44 million by 2030.
SOURCES: PERC 2016, HTTP://GRIST.ORG/ARTICLE/THE-CALIFORNIA-DROUGHT-IS-ON-ITS-WAY-OUT-BUT-DEEPER-DROUGHTS-LIE-AHEAD/

How can you sell water in California?
IDENTIFY & APPLY FOR RELEVANT PERMITS FOR TRANSFER
Prospective sellers should consult with relevant state and federal
regulatory bodies (i.e. Bureau of Reclamation, Department of Water
Resources, etc) to determine the permits required to execute a sale of
a quantity of water or the transfer of title to water rights in the specific
context.
FIND A BUYER EITHER PRIVATELY OR WATER BANK
Prospective sellers may either sell their water to a water
bank or locate prospective buyers through professional
networks or advertisements.
COMPLETE SALE THROUGH CONTRACT
The finalization of the sale of the rights typically occurs through
private contract (either executed by two private parties or
between a water bank and a seller).
12
3
?
Once the transfer is complete, the buyer is
generally responsible for the transportation of
water resources.
Water Markets

Water MarketsCalifornia’s Water Market Today: 5% of Water Use or 2,000,000 acre-feet/year, representing a $500,000,000 market
Environment
Municipal & Industrial
San Joaquin Valley Farmers
Sacramento Valley Farmers
Other
Mixed Use
42% Municipal &
Industrial
Market Participants
Short-term
Long-term
Permanent Flow
Additional Long-term Commitment
Additional Permanent Commitment
33% Long-term
Same County
Same Region
Different Region
Unspecified
50% Same County
Type of Transfer Location of Transfer
SOURCES: HANAK, ELLEN, AND ELIZABETH STRYJEWSKI. "CALIFORNIA’S WATER MARKET, BY THE NUMBERS: UPDATE 2012." PUBLIC POLICY INSTITUTE
OF CALIFORNIA (2012). HTTP://WATERINTHEWEST.STANFORD.EDU/GROUNDWATER/CHARTS/COST-COMPARISON/INDEX.HTML

Water Markets Who’s Buying Water: Key Market Participants
Agriculture Industrial Municipal
Growers of high yield perennial crops.
• e.g. almond producers, pistachio
producers.
• Paramount Farming
• South Value Farms
‒ Two of the largest producers of
nuts globally by acres of crops
managed
Industries engaged in water intensive
processes.
• e.g. concrete contractors, data
center owners/operators (water
required for cooling)
• Muse Concrete Contractors (San
Francisco)
• Digital Realty Trust (San Francisco)
‒ Digital currently has 20.5% of
global data management market
share
Utilities responsible for provision of
residential and public use water sources.
• e.g. City Water Utilities
• Los Angeles Department of Water &
Power
• City of Sacramento Department of
Utilities
‒ Debt guaranteed by city
Largest potential private buyers are established companies with strong balance
sheets. Among public buyers, city water utilities are the largest market segment
and their credit is guaranteed by municipal authorities.
SOURCES: PERC 2016, DIGITAL REALTY 2016, WWW.GROWINGPRODUCE.COM

Water MarketsGrowth in California’s Water Markets: Current Growth Prospects & Potential Catalysts
Volume Traded
• In 2011, 687 billion gallons of water were traded
• Assuming levelized growth, this would grow to over 1.3 trillion
gallons by 2040
• Other catalysts that might further increase the volume of water
traded include:
• Currently discussion in state legislature to streamline
regulatory process for transfer approval that would lower
transaction costs
• Anticipated infrastructure investment will lower transportation
costs
Water Pricing
• The average price of a water transfer per gallon in 2011 was $.08.
Assuming an annualized increase in prices of 10%, water prices
would reach $1.21 by 2040
• Other catalysts that might further increase water prices might
include:
• Project higher demand for water in the industrial and
agricultural sector
• Significant population growth in the short to medium term will
stimulate residential demand
-1,000,000
0
1,000,000
2,000,000
3,000,000
4,000,000
5,000,000
1982 1991 2000 2011 2040
(Ac
re-f
ee
t)
Year
Volume of Water Traded
Assuming annualized growth in water prices of 10% per year, this will be a $15 billion market by 2040
SOURCES: PERC 2016 & DATA APPENDIX
Objectives
Water Infrastructure
Emerging Water Technologies
Water Markets
Case Studies

International Case Studies--China
• Challenges and issues in Chinese water sector
• Unequal access to water resources
• Infrastructure lags behind
• Poor water quality
• State Council, the highest level of government, supports water related projects
• Law enforcement on promoting and supervising urban drainage and wastewater
treatment
• Support of PPP through legislations and administrative orders
• Promotes Sponge Cities ideal
• Enable buildings, streets and wetlands in cities to absorb, store and release
rainwater like a sponge to better serve the cities’ urban development
• Cities will collect and utilize 70% of rainwater, with 20% of urban areas meeting the
target by 2020. The proportion will increase to 80% by 20301
1. THE STATE COUNCIL OF THE PEOPLE'S REPUBLIC OF CHINA
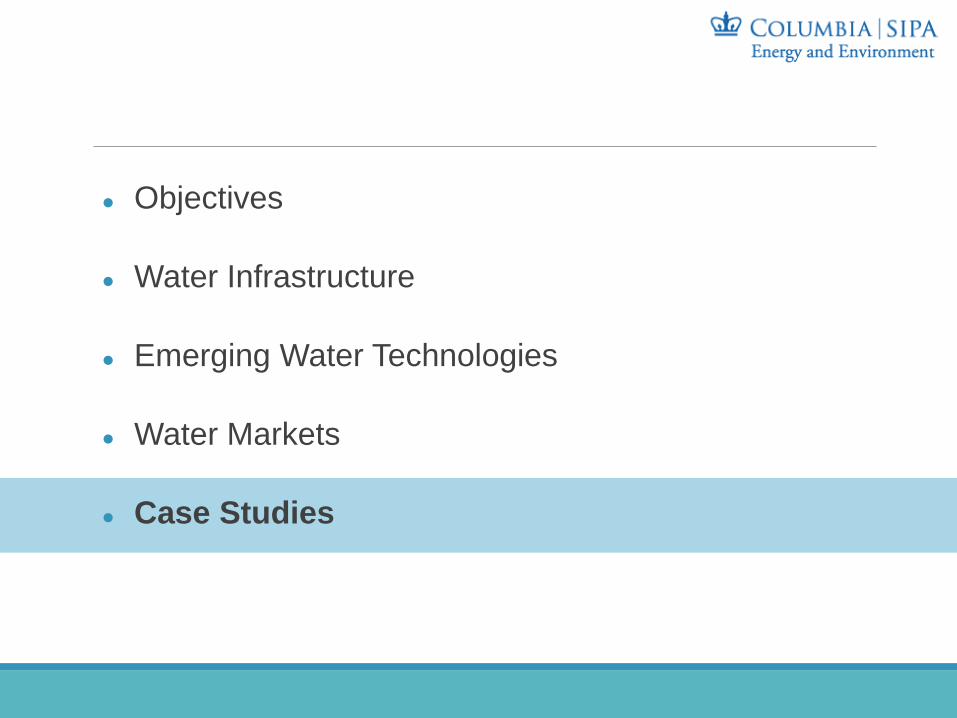
Popularity in PPP
• By September 2016, of the total 10,471 PPP projects, 33.5% are water-related1
• Key players—State Owned Enterprises (SOEs) and their satellite companies
• Foreign firms’ role tend to be limited -- advanced technology provider
• Hard access to local decision makers
• Hard access to financing
1. CHINA PRIVATE PUBLIC PARTNERSHIP CENTER

Foreign Corporation in PPP -- Veolia Environment in Shanghai
• Largest market share in sewage treatment facilities in China (13% in 20171)
• 60 projects in China, covering about 40 cities
• 1st PPP for full water service, including drinking water production, distribution and customer service
• Veolia Environment listed in Europe. But no data provided for this project
Municipal (local) investmentForeign Investment
Veolia Environment Group
Veolia Water
Shanghai Municipal Investment (Group)
Shanghai Water Assets Operation & Development
Shanghai Pudong Veolia Water Corporation Ltd(50-year joint venture)
Drinking Water Production Water Distribution Customer Services
ControlControl
50% shareholding 50% shareholding
1. IBIS, INDUSTRY REPORT

Foreign Corporation in PPP -- Veolia Environment in Shanghai
• Reason for Success
• Early entrance in 1980s
• Advanced technology and good reputation as a leading water resource management conglomerate
• Actively build relationship with municipal governments
• Prospects
• Weaker presence, compared with local major players
1. IBIS, INDUSTRY REPORT
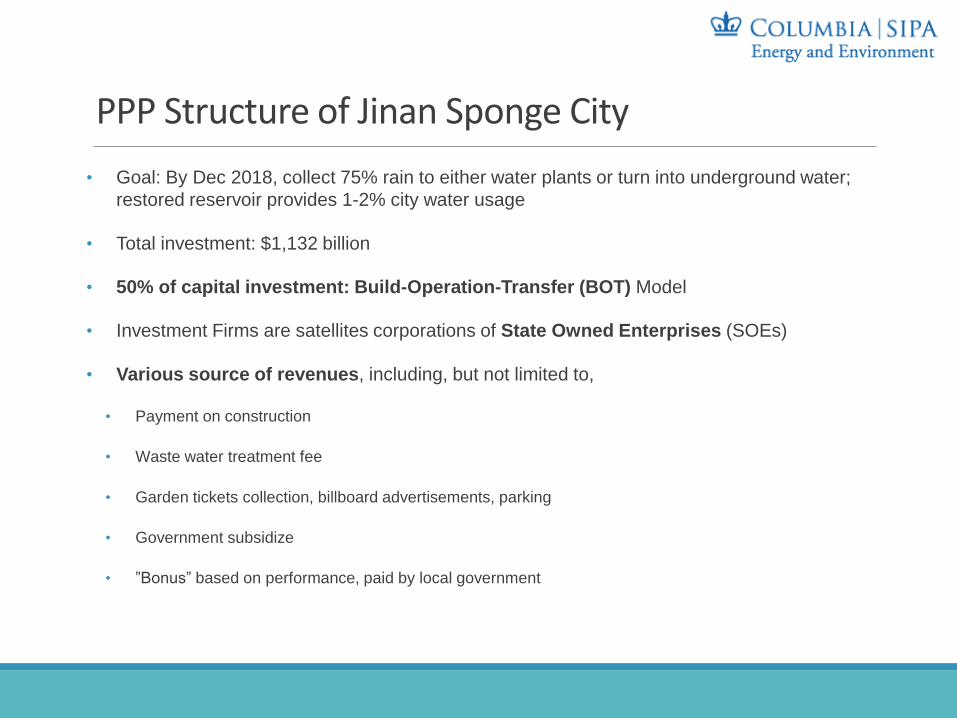
PPP Structure of Jinan Sponge City
• Goal: By Dec 2018, collect 75% rain to either water plants or turn into underground water;
restored reservoir provides 1-2% city water usage
• Total investment: $1,132 billion
• 50% of capital investment: Build-Operation-Transfer (BOT) Model
• Investment Firms are satellites corporations of State Owned Enterprises (SOEs)
• Various source of revenues, including, but not limited to,
• Payment on construction
• Waste water treatment fee
• Garden tickets collection, billboard advertisements, parking
• Government subsidize
• ”Bonus” based on performance, paid by local government

PPP Structure of Jinan Sponge City –Capital Contribution
• Investment firm (private partner) has controlling interests -- holds 90% shares and capital
investment
• Asset management company (public partner on behalf of the local government)
Construction Package
Project Company (Special Purpose
Vehicle)
Local Bureau of Finance
Government Subsidize
Annual Payment Based on Performance
Local Government
Bureau of Municipal Utility
Asset Management Company (Public
Partner)
Investment Firm (Private Partner)
Drainage, sewage
Wastewater treatment
Water pipelines
Gardens, rivers, lawns
Shareholding Agreement
Authorize
Supervise
Authorize
Public Tender
Franchise
Transfer Ownership upon Full Ferm
Operate, Maintain, collect
revenue
10% Shares
90% Shares(controlling interest)
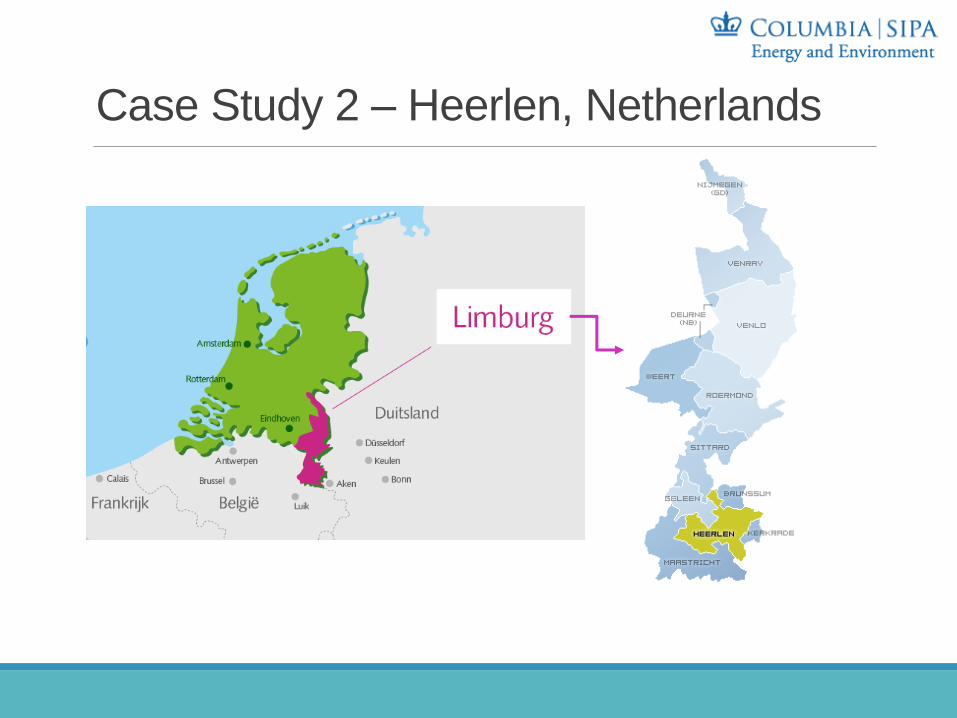
Case Study 2 – Heerlen, Netherlands

Minewater Project – Heerlen
Minewater 1.0(2007-2013)
Minewater 2.0(2012-Present)
Minewater 3.0(Near Future)
A straightforward pilot system for turning an abandoned coal mine into
a geothermal energy source for the sustainable low-energy heating and
cooling of buildings
Demand and Supply
Controlled System
Full-scale hybrid sustainable energy
infrastructure

Deeper Layer:
• Depth: 2,300 ft
• Temperature: 82.4°F
Upper Layer:
• Depth: 820 ft
• Temperature: 60.8°F
Middle Section: Intermediate well
for injecting of the cooled hot and
warmed cold mine water
• Depth: 1,148 ft
• Temperature: 64.4-71.6°F
Minewater Project 1.0, Heerlen

Minewater Project – Heerlen
Minewater 1.0(2007-2013)
Minewater 2.0(2012-Present)
Minewater 3.0(Near Future)
Transformation of the straight forward
geothermal minewater pilot system into full-scale
hybrid sustainable energy infrastructure
Demand and Supply
Controlled System
Straightforward Pilot System
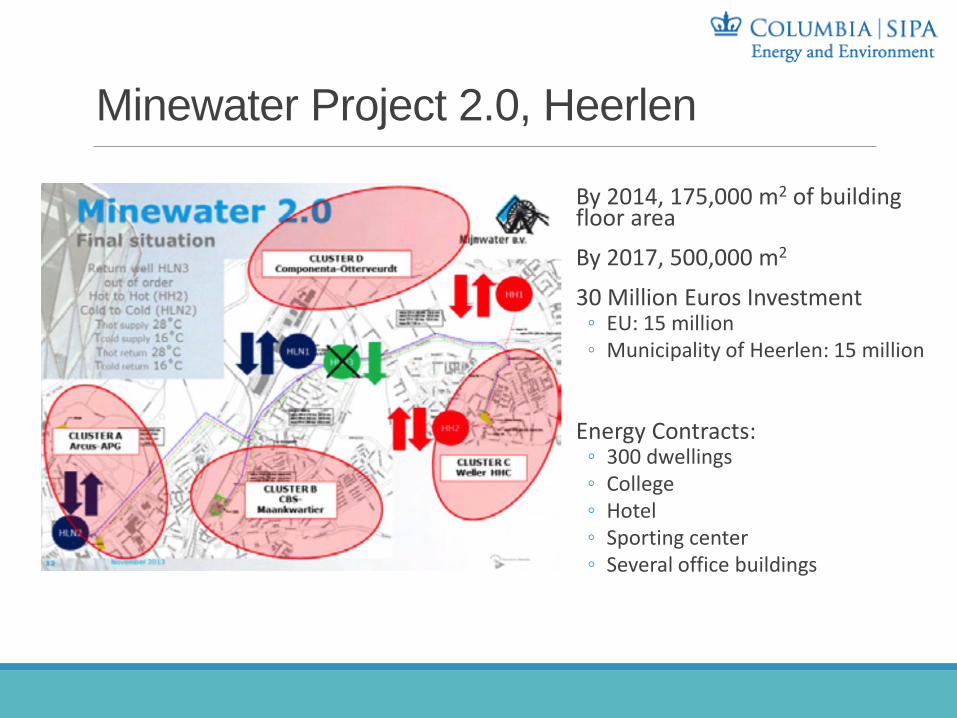
Minewater Project 2.0, Heerlen
By 2014, 175,000 m2 of building floor area
By 2017, 500,000 m2
30 Million Euros Investment◦ EU: 15 million◦ Municipality of Heerlen: 15 million
Energy Contracts:◦ 300 dwellings◦ College◦ Hotel◦ Sporting center ◦ Several office buildings

Privatization: Minewater Corporation (2013)
70%
30%
TRADITIONAL ENERGY
Fixed cost
Variable Cost(Energy Service)
70%
30%
MINEWATER SYSTEM
Fixed cost
Variable Cost(Energy Service)
Traditional gas boiler Minewater heat pump Difference
Cost of energy 22 Euros/GJ 6 Euros/GJ 16 Euros
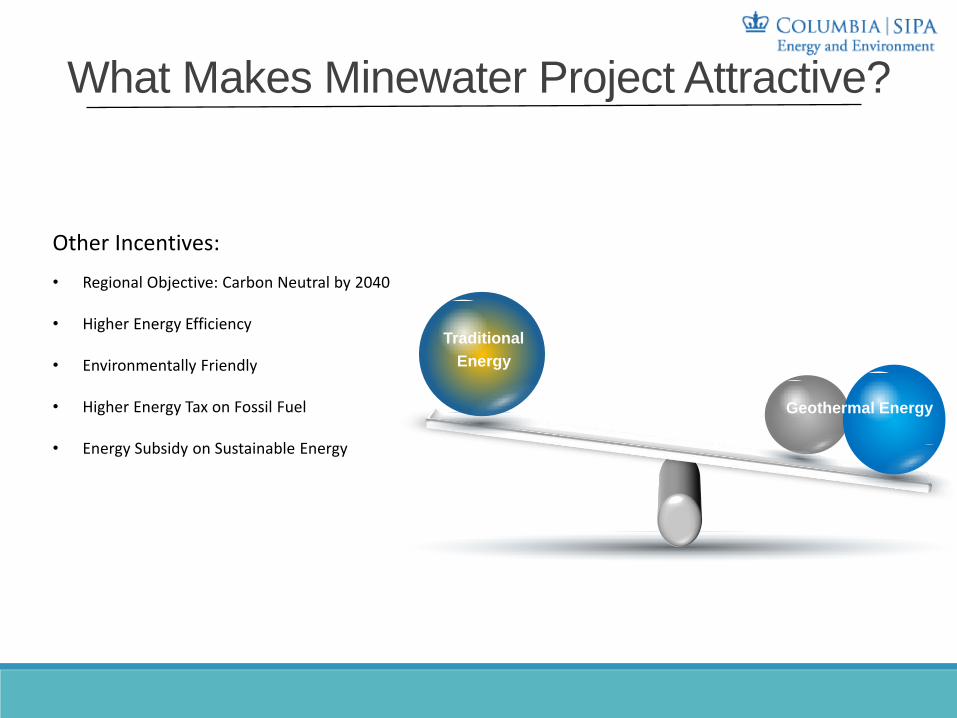
What Makes Minewater Project Attractive?
Traditional
Energy
Geothermal Energy
Other Incentives:
• Regional Objective: Carbon Neutral by 2040
• Higher Energy Efficiency
• Environmentally Friendly
• Higher Energy Tax on Fossil Fuel
• Energy Subsidy on Sustainable Energy

Minewater Project 3.0, Heerlen (nearfuture)
2 Key Elements:• Time• Intelligence
SUSTAINABLE WATER INFRASTRUCTURE
MARCH 2017 |
COLUMBIA UNIVERSITY