Embed Size (px)
DESCRIPTION
Financing Public Schools In Colorado (The Intersection With TABOR and Gallagher) Presented To: School Finance Partnership Presented By: Rudy Andras Economist - Vice President RBC Capital Markets ([email protected]) 303-595-1213. - PowerPoint PPT Presentation
Citation preview

Financing Public Schools In Colorado(The Intersection With TABOR and Gallagher)
Presented To:
School Finance Partnership
Presented By:
Rudy AndrasEconomist - Vice President
RBC Capital Markets([email protected])
303-595-1213

$ in
mil
lio
ns
$168.2
$189.7
$211.8
$229.9
$245.9
$266.2
$374.2
$385.9
$403.4
$365.1
$343.8$348.5
$347.7
$318.9
$290.4
$160.00
$200.00
$240.00
$280.00
$320.00
$360.00
$400.00
Douglas County Fiscal Year 11/12 Funding Will Be At The FY 08/09 Level,Even As Funded Pupil Growth Was In Excess Of 4,100 Pupils
School Finance Act Funding WITHOUT Schools Funding Crisis
(funding at Amendment 23 required level)
School Finance Act Funding WITH Schools Funding Crisis
Note: School Finance Act funding excludes Online pupil funding (a pass-through funding source).
Amendment 23Additional 1%
Funding Begins
$ in
mil
lio
ns
$23.81$24.25
$28.69
$30.76 $30.72$30.98
$26.96
$29.45
$22.41
$20.62
$19.13
$24.94
$26.91$27.54
$30.06
$18.00
$20.00
$22.00
$24.00
$26.00
$28.00
$30.00
$32.00
Cheyenne Mountain Fiscal Year 11/12 Finance Act Funding Will Approach The Level Of 5 Years Ago
School Finance Act Funding WITHOUT Schools Funding Crisis
School Finance Act Funding WITH Schools Funding Crisis
$ in
mil
lio
ns
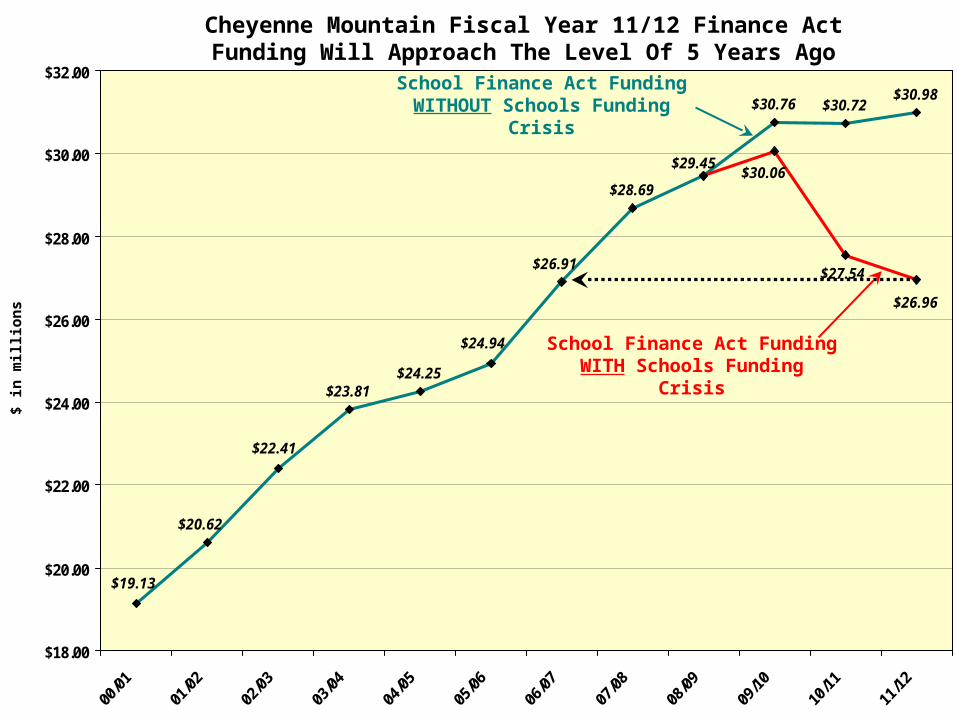
$19.37
$19.77
$20.45
$20.99$21.32
$23.53$23.88
$23.73$23.36
$23.00 $23.01$23.32
$23.57
$22.15
$22.65$22.65
$21.80
$18.50
$19.28
$20.30
$23.03
$15.000
$17.000
$19.000
$21.000
$23.000
$25.000
Englewood Schools Fiscal Year 11/12 Funding Will Equal The Level Experienced 16 Years Ago
School Finance Act Funding WITHOUT Schools Funding Crisis
School Finance Act Funding WITH Schools Funding Crisis
$990,000OverrideElection
$1,600,000OverrideElection
“This Is A Fine Mess We’ve Gotten Ourselves Into!”
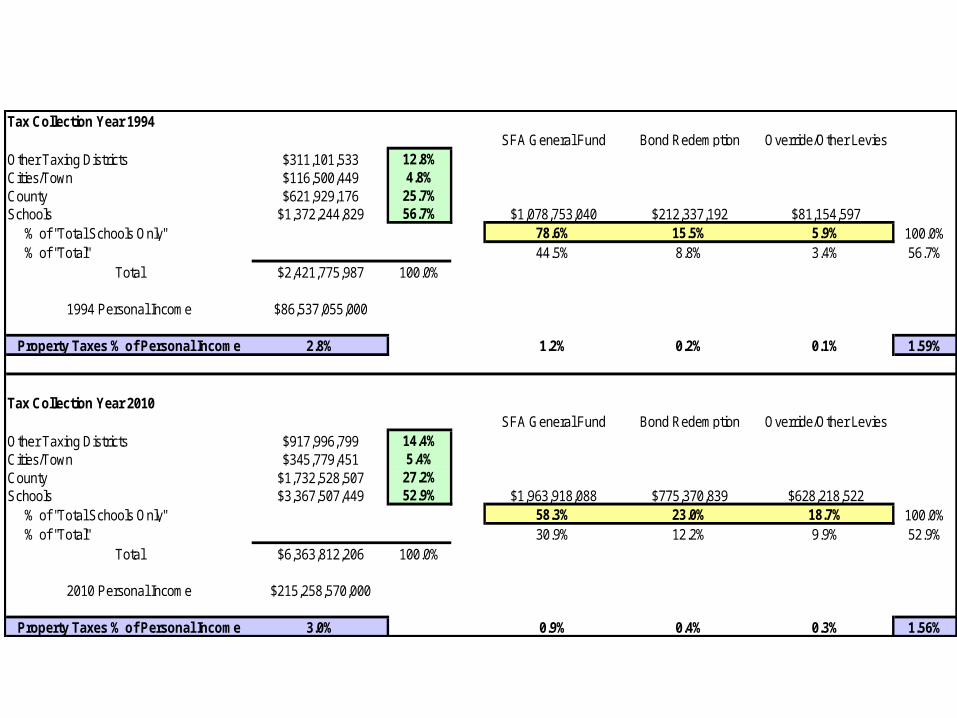
Tax Collection Year 1994 SFA General Fund Bond Redemption Override/Other Levies
Other Taxing Districts $311,101,533 12.8%Cities/Town $116,500,449 4.8%County $621,929,176 25.7%Schools $1,372,244,829 56.7% $1,078,753,040 $212,337,192 $81,154,597 % of "Total Schools Only" 78.6% 15.5% 5.9% 100.0% % of "Total" 44.5% 8.8% 3.4% 56.7%
Total $2,421,775,987 100.0%
1994 Personal Income $86,537,055,000
Property Taxes % of Personal Income 2.8% 1.2% 0.2% 0.1% 1.59%
Tax Collection Year 2010
SFA General Fund Bond Redemption Override/Other LeviesOther Taxing Districts $917,996,799 14.4%Cities/Town $345,779,451 5.4%County $1,732,528,507 27.2%Schools $3,367,507,449 52.9% $1,963,918,088 $775,370,839 $628,218,522 % of "Total Schools Only" 58.3% 23.0% 18.7% 100.0% % of "Total" 30.9% 12.2% 9.9% 52.9%
Total $6,363,812,206 100.0%
2010 Personal Income $215,258,570,000
Property Taxes % of Personal Income 3.0% 0.9% 0.4% 0.3% 1.56%

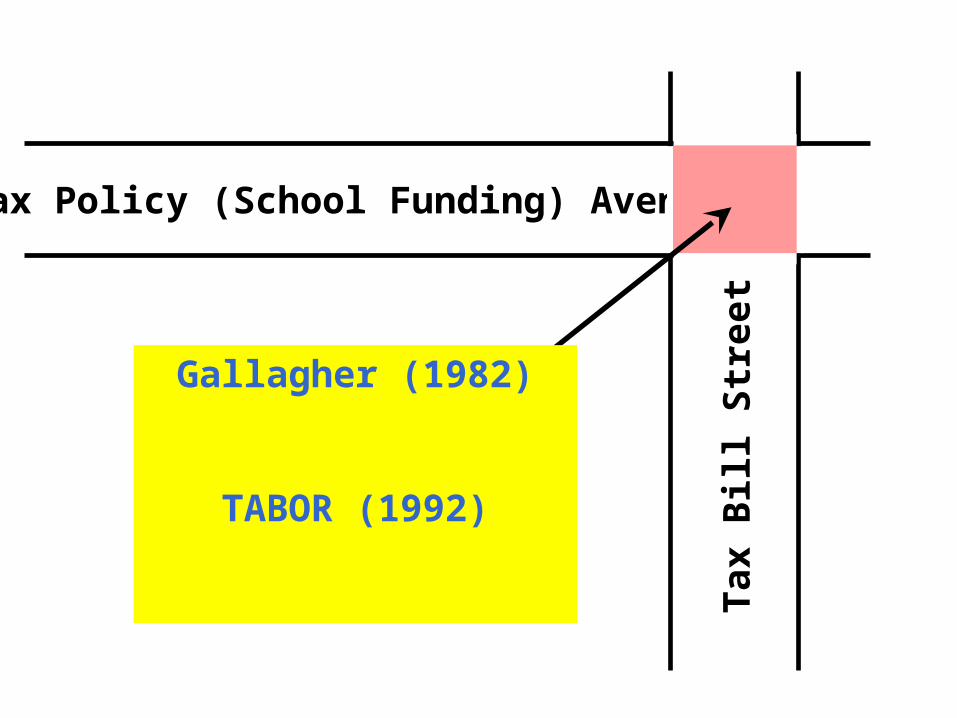
Tax Policy (School Funding) Avenue
Tax
Bill
Str
eet
Tax Policy (School Funding) Avenue
Tax
Bill
Str
eet
Gallagher (1982)
TABOR (1992)
Amendment 23 (2000)
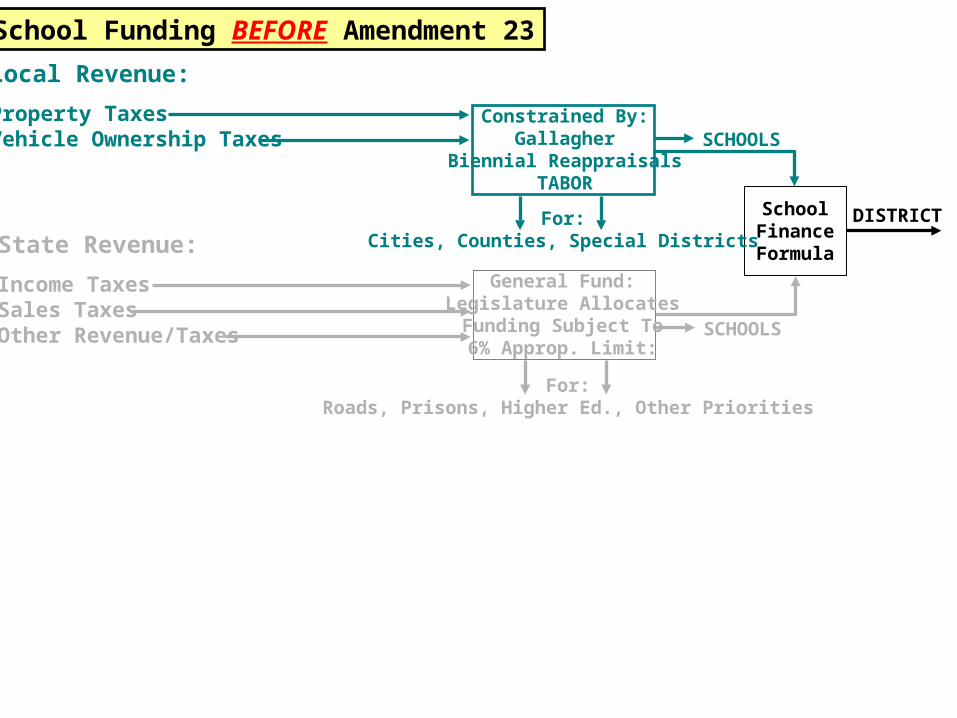
School Funding BEFORE Amendment 23
Local Revenue:
Property TaxesVehicle Ownership Taxes
Constrained By:Gallagher
Biennial ReappraisalsTABOR
SchoolFinanceFormula
For:Cities, Counties, Special Districts
General Fund:Legislature AllocatesFunding Subject To6% Approp. Limit:
For:Roads, Prisons, Higher Ed., Other Priorities
SCHOOLS
SCHOOLS
State Revenue:
Income TaxesSales TaxesOther Revenue/Taxes
DISTRICT

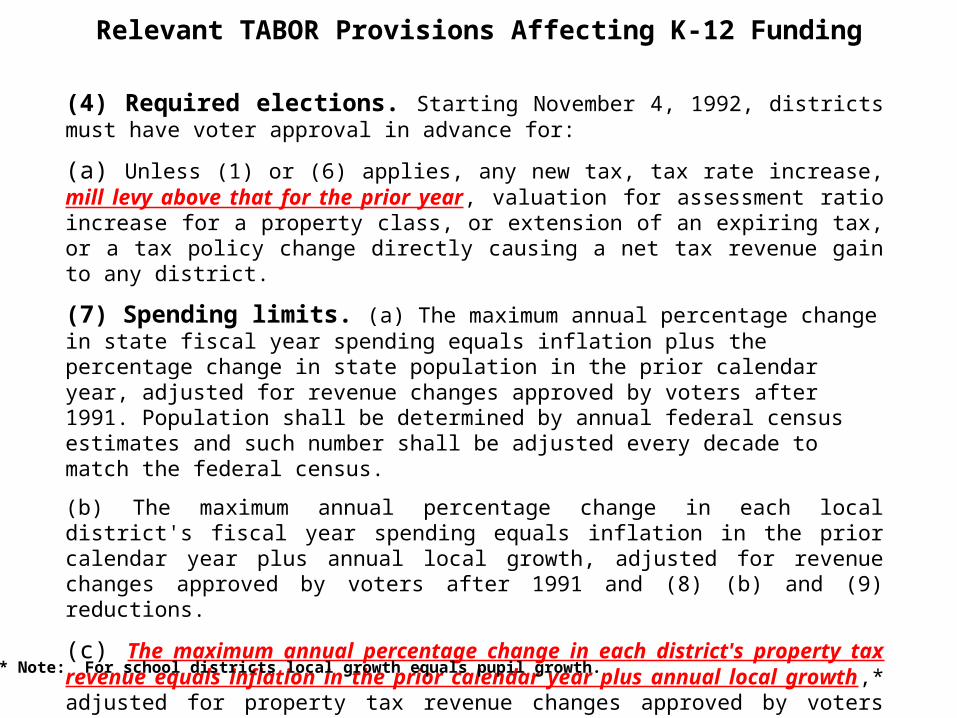
(4) Required elections. Starting November 4, 1992, districts must have voter approval in advance for:
(a) Unless (1) or (6) applies, any new tax, tax rate increase, mill levy above that for the prior year, valuation for assessment ratio increase for a property class, or extension of an expiring tax, or a tax policy change directly causing a net tax revenue gain to any district.
(7) Spending limits. (a) The maximum annual percentage change in state fiscal year spending equals inflation plus the percentage change in state population in the prior calendar year, adjusted for revenue changes approved by voters after 1991. Population shall be determined by annual federal census estimates and such number shall be adjusted every decade to match the federal census.
(b) The maximum annual percentage change in each local district's fiscal year spending equals inflation in the prior calendar year plus annual local growth, adjusted for revenue changes approved by voters after 1991 and (8) (b) and (9) reductions.
(c) The maximum annual percentage change in each district's property tax revenue equals inflation in the prior calendar year plus annual local growth,* adjusted for property tax revenue changes approved by voters after 1991 and (8) (b) and (9) reductions.
Relevant TABOR Provisions Affecting K-12 Funding
* Note: For school districts local growth equals pupil growth.
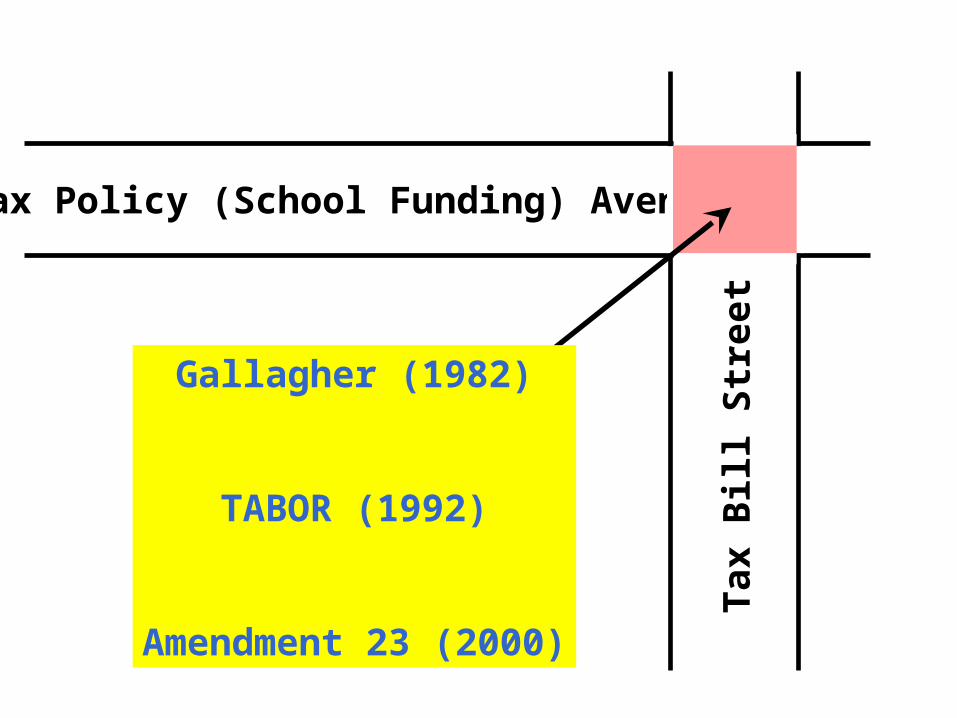
Tax Policy (School Funding) Avenue
Tax
Bill
Str
eet
Gallagher (1982)
TABOR (1992)
Amendment 23 (2000)
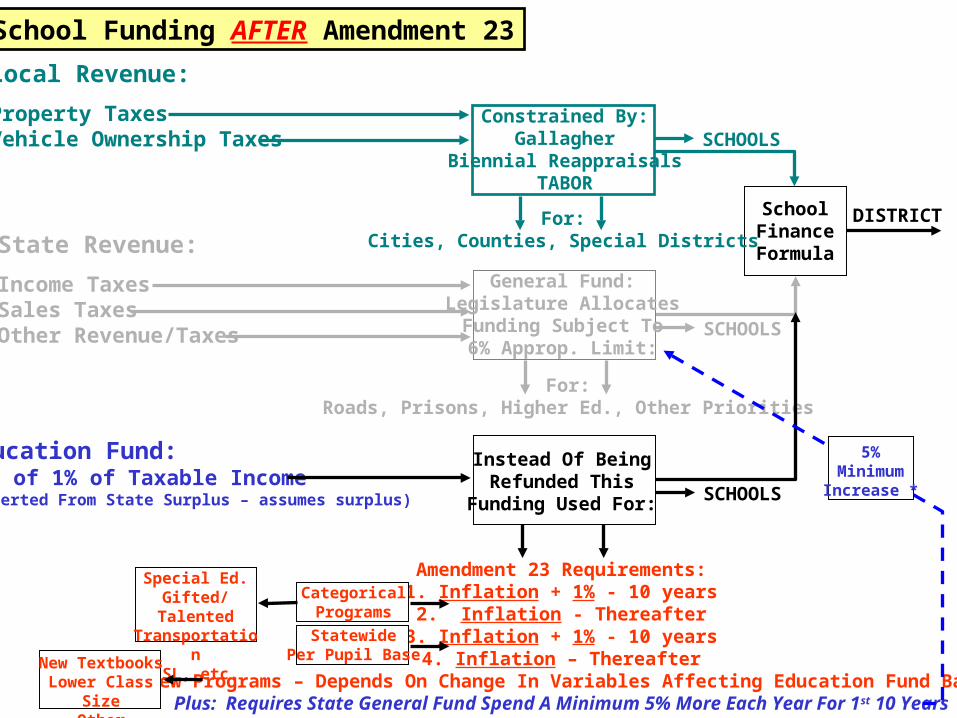
School Funding AFTER Amendment 23
Local Revenue:
Property TaxesVehicle Ownership Taxes
Constrained By:Gallagher
Biennial ReappraisalsTABOR
SchoolFinanceFormula
For:Cities, Counties, Special Districts
General Fund:Legislature AllocatesFunding Subject To6% Approp. Limit:
For:Roads, Prisons, Higher Ed., Other Priorities
SCHOOLS
SCHOOLS
State Revenue:
Income TaxesSales TaxesOther Revenue/Taxes
Education Fund:1/3 of 1% of Taxable Income(Diverted From State Surplus – assumes surplus)
Instead Of BeingRefunded This
Funding Used For:
Amendment 23 Requirements:1. Inflation + 1% - 10 years
2. Inflation - Thereafter3. Inflation + 1% - 10 years
4. Inflation – Thereafter5. New Programs – Depends On Change In Variables Affecting Education Fund BalancePlus: Requires State General Fund Spend A Minimum 5% More Each Year For 1st 10 Years
StatewidePer Pupil Base
CategoricalPrograms
Special Ed.Gifted/TalentedTransportation
ESL, etc.
New TextbooksLower Class SizeOther Initiatives
SCHOOLS
5%MinimumIncrease *
DISTRICT
(4) Required elections. Starting November 4, 1992, districts must have voter approval in advance for:
(a) Unless (1) or (6) applies, any new tax, tax rate increase, mill levy above that for the prior year, valuation for assessment ratio increase for a property class, or extension of an expiring tax, or a tax policy change directly causing a net tax revenue gain to any district.
(7) Spending limits. (a) The maximum annual percentage change in state fiscal year spending equals inflation plus the percentage change in state population in the prior calendar year, adjusted for revenue changes approved by voters after 1991. Population shall be determined by annual federal census estimates and such number shall be adjusted every decade to match the federal census.
(b) The maximum annual percentage change in each local district's fiscal year spending equals inflation in the prior calendar year plus annual local growth, adjusted for revenue changes approved by voters after 1991 and (8) (b) and (9) reductions.
(c) The maximum annual percentage change in each district's property tax revenue equals inflation in the prior calendar year plus annual local growth,* adjusted for property tax revenue changes approved by voters after 1991 and (8) (b) and (9) reductions.
Relevant TABOR Provisions Affecting K-12 Funding
* Note: For school districts local growth equals pupil growth.
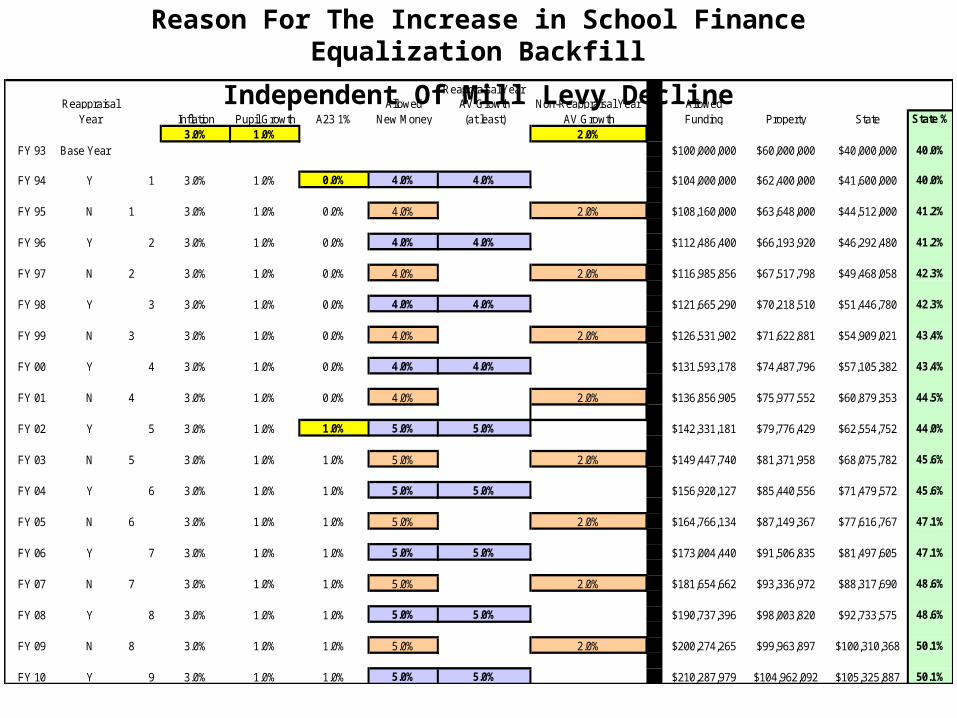
Reason For The Increase in School Finance Equalization Backfill
Independent Of Mill Levy DeclineReappraisal Year
Reappraisal Allowed AV Growth Non-Reappraisal Year AllowedYear Inflation Pupil Growth A23 1% New Money (at least) AV Growth Funding Property State State %
3.0% 1.0% 2.0%FY 93 Base Year $100,000,000 $60,000,000 $40,000,000 40.0%
FY 94 Y 1 3.0% 1.0% 0.0% 4.0% 4.0% $104,000,000 $62,400,000 $41,600,000 40.0%
FY 95 N 1 3.0% 1.0% 0.0% 4.0% 2.0% $108,160,000 $63,648,000 $44,512,000 41.2%
FY 96 Y 2 3.0% 1.0% 0.0% 4.0% 4.0% $112,486,400 $66,193,920 $46,292,480 41.2%
FY 97 N 2 3.0% 1.0% 0.0% 4.0% 2.0% $116,985,856 $67,517,798 $49,468,058 42.3%
FY 98 Y 3 3.0% 1.0% 0.0% 4.0% 4.0% $121,665,290 $70,218,510 $51,446,780 42.3%
FY 99 N 3 3.0% 1.0% 0.0% 4.0% 2.0% $126,531,902 $71,622,881 $54,909,021 43.4%
FY 00 Y 4 3.0% 1.0% 0.0% 4.0% 4.0% $131,593,178 $74,487,796 $57,105,382 43.4%
FY 01 N 4 3.0% 1.0% 0.0% 4.0% 2.0% $136,856,905 $75,977,552 $60,879,353 44.5%
FY 02 Y 5 3.0% 1.0% 1.0% 5.0% 5.0% $142,331,181 $79,776,429 $62,554,752 44.0%
FY 03 N 5 3.0% 1.0% 1.0% 5.0% 2.0% $149,447,740 $81,371,958 $68,075,782 45.6%
FY 04 Y 6 3.0% 1.0% 1.0% 5.0% 5.0% $156,920,127 $85,440,556 $71,479,572 45.6%
FY 05 N 6 3.0% 1.0% 1.0% 5.0% 2.0% $164,766,134 $87,149,367 $77,616,767 47.1%
FY 06 Y 7 3.0% 1.0% 1.0% 5.0% 5.0% $173,004,440 $91,506,835 $81,497,605 47.1%
FY 07 N 7 3.0% 1.0% 1.0% 5.0% 2.0% $181,654,662 $93,336,972 $88,317,690 48.6%
FY 08 Y 8 3.0% 1.0% 1.0% 5.0% 5.0% $190,737,396 $98,003,820 $92,733,575 48.6%
FY 09 N 8 3.0% 1.0% 1.0% 5.0% 2.0% $200,274,265 $99,963,897 $100,310,368 50.1%
FY 10 Y 9 3.0% 1.0% 1.0% 5.0% 5.0% $210,287,979 $104,962,092 $105,325,887 50.1%
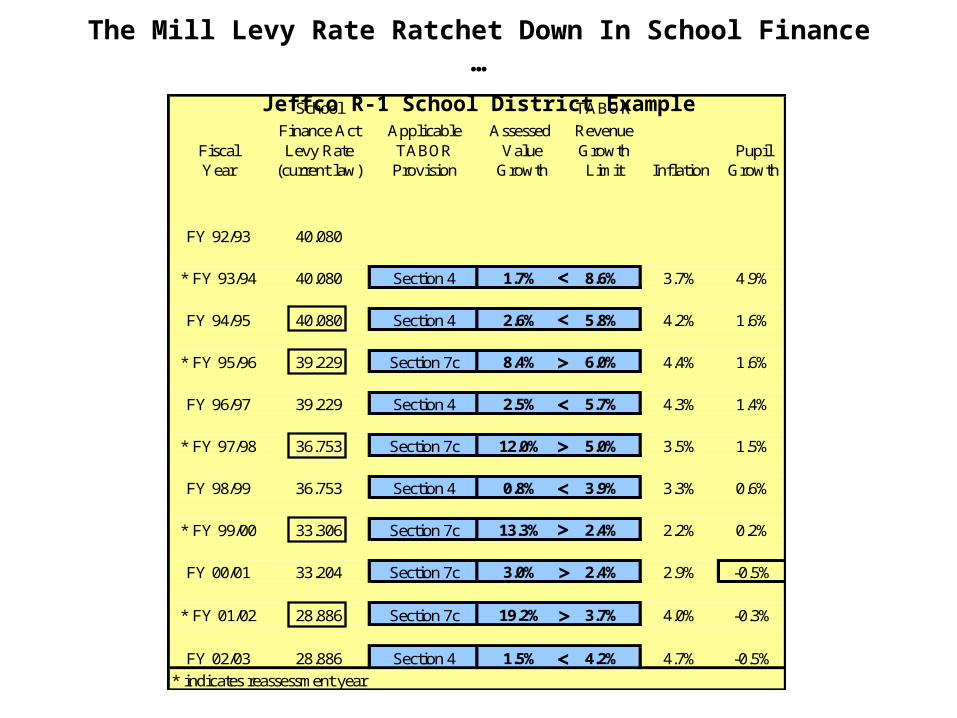
School TABOR
Finance Act Applicable Assessed RevenueFiscal Levy Rate TABOR Value Growth PupilYear (current law) Provision Growth Limit Inflation Growth
FY 92/93 40.080
* FY 93/94 40.080 Section 4 1.7% 8.6% 3.7% 4.9%
FY 94/95 40.080 Section 4 2.6% 5.8% 4.2% 1.6%
* FY 95/96 39.229 Section 7c 8.4% 6.0% 4.4% 1.6%
FY 96/97 39.229 Section 4 2.5% 5.7% 4.3% 1.4%
* FY 97/98 36.753 Section 7c 12.0% 5.0% 3.5% 1.5%
FY 98/99 36.753 Section 4 0.8% 3.9% 3.3% 0.6%
* FY 99/00 33.306 Section 7c 13.3% 2.4% 2.2% 0.2%
FY 00/01 33.204 Section 7c 3.0% 2.4% 2.9% -0.5%
* FY 01/02 28.886 Section 7c 19.2% 3.7% 4.0% -0.3%
FY 02/03 28.886 Section 4 1.5% 4.2% 4.7% -0.5%
* indicates reassessment year
<
>
<
>
<
>
<
>
<
>
<
<
<
<
<
The Mill Levy Rate Ratchet Down In School Finance …
Jeffco R-1 School District Example

Based On Both Fixed Mill Levy & Property Tax Revenue Growth Limit Based On Property Tax Revenue Growth Limit Only
School Finance School Single Family Single Family Constant
Act Property Finance Act Home Value Residential Home Value Current $ 1992 $Fiscal Tax Revenue Levy Rate (Market Assessment (Assessed Tax Bill Tax BillYear (current law) (current law) Value) Rate Value) (current law) (current law)
FY 92/93 $129,577,078 40.080 $95,000 14.34% $13,623 $546 $546
* FY 93/94 $131,829,560 40.080 $105,000 12.86% $13,503 $541 $518
FY 94/95 $135,926,005 40.080 $105,000 12.86% $13,503 $541 $497
* FY 95/96 $143,511,921 39.229 $137,000 10.36% $14,193 $557 $494
FY 96/97 $147,100,556 39.229 $137,000 10.36% $14,193 $557 $478
* FY 97/98 $154,409,755 36.753 $154,000 9.74% $15,000 $551 $462
FY 98/99 $155,585,774 36.753 $154,000 9.74% $15,000 $551 $449
* FY 99/00 $159,692,177 33.306 $175,000 9.74% $17,045 $568 $445
FY 00/01 $163,971,306 33.204 $175,000 9.74% $17,045 $566 $424
* FY 01/02 $171,704,542 28.886 $223,000 9.15% $20,405 $589 $433
FY 02/03 $172,591,392 28.886 $223,000 9.15% $20,405 $589 $421
10 yr. change -11.194 $128,000 $6,782 $43 -$125
10 yr. % change 135% 50% 8% -23%
… Combined With Gallagher To Keep Finance Act Tax Bills Stable.

More Concrete Examples:
Hanover
Durango
Alamosa
Aurora
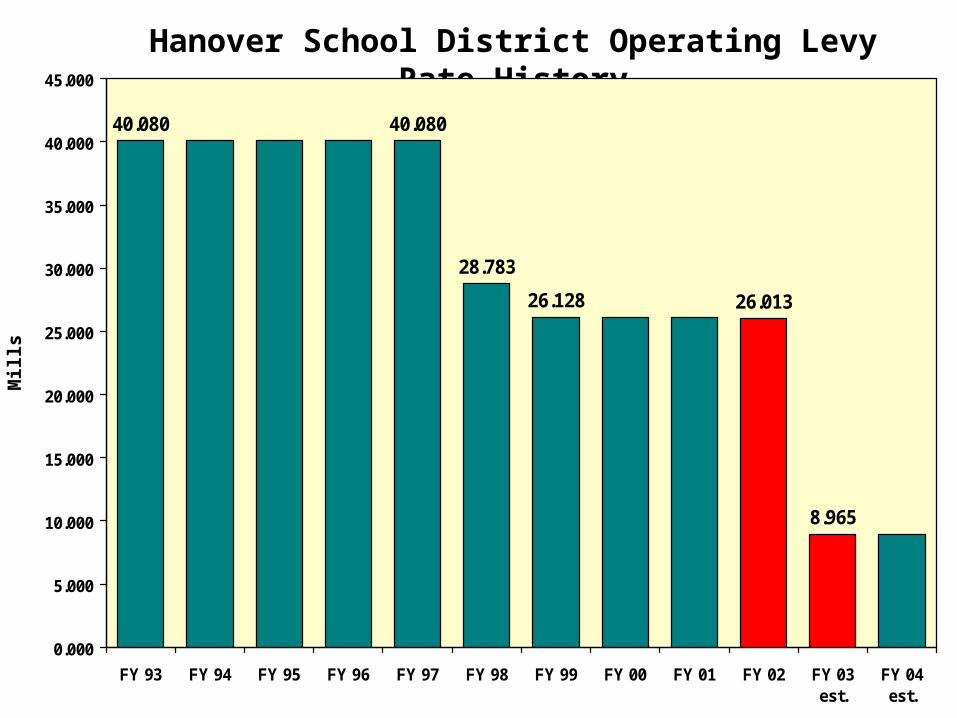
Hanover School District Operating Levy Rate HistoryM
ills
40.080 40.080
28.783
26.128 26.013
8.965
0.000
5.000
10.000
15.000
20.000
25.000
30.000
35.000
40.000
45.000
FY 93 FY 94 FY 95 FY 96 FY 97 FY 98 FY 99 FY 00 FY 01 FY 02 FY 03est.
FY 04est.

Hanover School District Assessed Value History
$0
$10,000,000
$20,000,000
$30,000,000
$40,000,000
$50,000,000
$60,000,000
FY 93 FY 94 FY 95 FY 96 FY 97 FY 98 FY 99 FY 00 FY 01 FY 02 FY 03est.
FY 04est.
$17.5 Million
$52.5 Million
$6.3 Million

$0
$50
$100
$150
$200
$250
$300
$350
$400
$450
FY 93 FY 94 FY 95 FY 96 FY 97 FY 98 FY 99 FY 00 FY 01 FY 02 FY 03est.
FY 04est.
$238
$219 $217
$401
$62,000 Home Value
$100,000 Home Value
$110,000 Home Value
$123$82
Without Bonds
With Bonds
If One’s Objective Is To Virtually Eliminate Property Taxes Paid To Support Hanover Schools, THEN VOTE NO, DEPRIVING HANOVER’S
STUDENTS OF FACILITIES ENJOYED BY ALL OTHER STUDENTS