Embed Size (px)
Citation preview

September 2015
Financing for Low Carbon Development in India

Discussion Paper Financing for Low Carbon Development in India
About the Project
The study on low carbon development in India is directed towards developing specific strategies for low carbon development in crosscutting areas such as financing, technology and innovation policy, and subnational initiatives. By engaging with stakeholders, the project seeks to support policy incubation and development at both the national and sub-national level. Targeted policymaker engagement and advocacy will support design and adoption of new policies and programs based on findings from the study. The study is implemented by The Energy and Resources Institute and is supported by Shakti Sustainable Energy Foundation.
Suggested Citation
TERI (2015). Financing for Low Carbon Development in India. Discussion Paper. Supported by Shakti Sustainable Energy Foundation. New Delhi: The Energy and Resources Institute. 74 pages.
Team for Financing
Advisors Chandrashekhar Dasgupta, Prodipto Ghosh, Suneel Pandey
Lead Authors Shailly Kedia, Nishant Jain
Contributing Authors Supriya Francis, Arnab Bose, Hina Zia, Ankit Narula, Chinmay Kinjavdekar, Prosanto Pal, Yogesh Gokhale, Ankita Gupta, Nutan Kaushik, Sumit Sharma, Sachin Kumar, Pooja Adhikari, Ramit Malhotra, Agneev Mukherjee, Rohit Pathania, Akshima Ghate, Sahil Malhotra, Anand Upadhyay
Executive support M K Bineesan, P D Tiwari
Contact
Shailly Kedia (Fellow, TERI); Email: [email protected]
Nishant Jain (Research Associate, TERI); Email: [email protected]

Discussion Paper Financing for Low Carbon Development in India
Abstract
The Discussion Paper provides an understanding on financing and low carbon development in the Indian context. It seeks to highlight the different financial mechanisms currently in place for low carbon development; these include public finance instruments, market mechanisms and banking sector initiatives. Insights from stakeholder consultations inform the paper’s sector-wise analysis in context of low carbon development. Suggestions for incubation of policies and measures for promoting and strengthening innovation for low-carbon development are provided.

Discussion Paper Financing for Low Carbon Development in India
Contents 1. INTRODUCTION ............................................................................................... 1 2. STAKEHOLDER PERSPECTIVES ......................................................................... 4 3. FINANCIAL M ECHANISM S IN INDIA FOR LOW CARBON DEVELOPM ENT..10
3.1 Public Finance Initiatives ....................................................................................................... 10
Special national funds ........................................................................................................... 10
Fiscally supported guarantee schemes ............................................................................... 12
Special funds at the sub-national level ............................................................................... 12
3.2 Traditional Finance................................................................................................................. 14
Banking .................................................................................................................................... 14
Innovation in financial products .......................................................................................... 17
Green Bonds ............................................................................................................................ 19
3.3 Risk Management Tools ........................................................................................................ 21
3.4 Climate Change and Market-based Instruments ............................................................... 22
International carbon markets ............................................................................................... 22
Domestic carbon market ....................................................................................................... 24
Other market-based innovations ......................................................................................... 26
3.5 International Climate Finance............................................................................................... 28
3.6 Public–private partnerships .................................................................................................. 30
3.7 Philanthrophy ......................................................................................................................... 31
4. LCD SECTORS AND FINANCE .......................................................................33
4.1 Renewable Energy .................................................................................................................. 33
4.2 Non-renewable Energy .......................................................................................................... 37
4.3 Transportation......................................................................................................................... 39
4.4 Buildings .................................................................................................................................. 41
4.5 Demand Side Management ................................................................................................... 43
4.6 Agriculture .............................................................................................................................. 45
4.7 Industry .................................................................................................................................... 48
Iron and steel .......................................................................................................................... 49
Cement ..................................................................................................................................... 50
Fertilizer .................................................................................................................................. 50
Micro, small and medium enterprises (MSMEs) ............................................................... 51
4.8 Forestry .................................................................................................................................... 52
Clean Development Mechanism (CDM) ............................................................................ 54
Financial Mechanism of REDD+ .......................................................................................... 55
Ecosystem services funding mechanisms ........................................................................... 55
4.9 Waste Management ................................................................................................................ 56
5. WAYS FORWARD ............................................................................................61 REFERENCES ........................................................................................................65
i

Discussion Paper Financing for Low Carbon Development in India
ANNEXURES: STAKEHOLDER PERSPECTIVES ....................................................69
Annexure 1: Key Challenges in Financing ................................................................................ 69
Annexure 2: Decision-making and Finance .............................................................................. 70
Annexure 3: Financial Support Needed .................................................................................... 71
Annexure 4: Financial Innovations Needed ............................................................................. 72
Annexure 5: Prominent Source of Financing in Future .......................................................... 73
Annexure 6: Market Aspects ....................................................................................................... 74
Discussion Paper Financing for Low Carbon Development in India
Financing for Low Carbon Development in India
1. Introduction Financing sustainability (including low-carbon development) is arguably the most critical challenge of this century. The difficulty of this challenge has been greatly augmented in the wake of serious global macro-economic imbalances. While macro-economic decisions (including banking) come from the policy side, the finance decisions come from the investment side. When it comes to sustainability issues, synchronization of macro-economic and finance decisions have become fairly arduous. Macro-economic and banking regulations are moving towards safety; ironically, these regulations are impeding investments in sustainability. For instance, the forthcoming Basel III rules (for banking) may significantly limit the ability of financial institutions to provide long-term, non-recourse project finance which is considered unsafe in banking parlance but are quite important for renewable energy projects to get started. Tax regimes in various countries are also not helpful for financing sustainability.
Typically, sustainability projects (say, developing sustainable habitats or green buildings) are attributed with high initial capital costs which are usually offset by lower operations and maintenance (O&M) costs; however, in various economies, tax rebates are available for O&M costs but not for the initial capital costs. All these issues make financing sustainability extremely challenging. It can also be understood that making money available for sustainability in an effective and efficient method is not only a decision in finance but also of macro-economics.
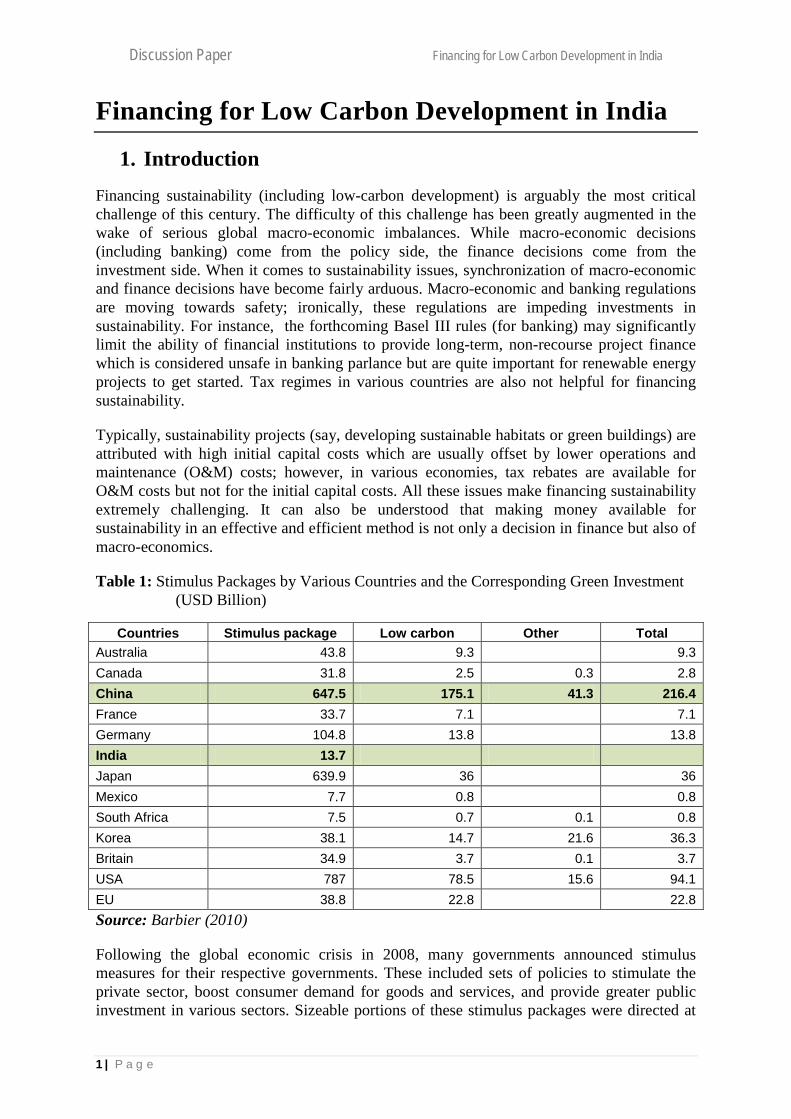
Table 1: Stimulus Packages by Various Countries and the Corresponding Green Investment (USD Billion)
Countries Stimulus package Low carbon Other Total Australia 43.8 9.3 9.3 Canada 31.8 2.5 0.3 2.8 China 647.5 175.1 41.3 216.4 France 33.7 7.1 7.1 Germany 104.8 13.8 13.8 India 13.7 Japan 639.9 36 36 Mexico 7.7 0.8 0.8 South Africa 7.5 0.7 0.1 0.8 Korea 38.1 14.7 21.6 36.3 Britain 34.9 3.7 0.1 3.7 USA 787 78.5 15.6 94.1 EU 38.8 22.8 22.8 Source: Barbier (2010)
Following the global economic crisis in 2008, many governments announced stimulus measures for their respective governments. These included sets of policies to stimulate the private sector, boost consumer demand for goods and services, and provide greater public investment in various sectors. Sizeable portions of these stimulus packages were directed at
1 | P a g e

Discussion Paper Financing for Low Carbon Development in India
environmental goals, particularly the reduction of GHG emissions (ILO 2011). China’s National Development and Reform Commission announced a variety of green stimulus measures. Over one-third of the massive Chinese stimulus package and nearly 27 per cent of the 2009 budget was allocated to green themes, mostly rail, grids, and water infrastructure, along with spending on environmental improvement. Table 1 depicts the stimulus packages by various countries and the climate change investment in the economic stimulus plans.
Figure 1 shows the global financial architecture. It is time that the multilateral financial regime recognizes the need for engaging with global financial regulatory frameworks such the Bank for International Settlements, International Monetary Fund and International Accounting Standards Board.
It is the policy side which takes a pre-eminent position on such matters which are considered as provisioning of public goods. However, the scale required in terms of public goods for climate action may show various attributes which will not be completely sufficient under a public finance outlay format. The question is whether the private sector would be interested in such implementation frameworks and what would incentivize them to work towards operationalizing the same.
Figure 1: Actors in the Global Financial Architecture
Source: Author compilation
According to a survey of the World Economic Forum in 2015 (WEF 2015), major investment side players from across the world are increasingly worried about extreme weather events and recognize climate change related risks (Table 2). It may be reasonable to say that there is no way to measure actions in sustainability or climate actions through a method, including financial accounting, most understandable to the investment side players.
2 | P a g e

Discussion Paper Financing for Low Carbon Development in India
Table 2: Top Five Global Risks in Terms of Likelihoods
2007 2008 2009 2010 2011 2012 2013 2014 2015 1st
Breakdown of critical information infrastructure
Asset price collapse
Asset price collapse
Asset price collapse
Meteorological catastrophes
Severe income disparity
Severe income disparity
Income disparity
Interstate conflicts with regional consequences
2nd
Chronic disease in developed countries
Middle East instability
Slowing Chinese economy (<6%)
Slowing Chinese economy (<6%)
Hydrological catastrophes
Chronic fiscal imbalances
Chronic fiscal imbalances
Extreme weather events
Extreme weather events
3rd
Oil price shock
Failed and failing states
Chronic disease
Chronic disease
Corruption
Rising greenhouse gas emissions
Rising greenhouse gas emissions
Unemployment and underemployment
Failure of national governance
4th
China economic hard landing
Oil and gas price spike
Global governance gaps
Fiscal crises
Biodiversity loss
Cyber attacks
Water supply crises
Climate change
State collapse or crisis
5th
Asset price collapse
Chronic disease in the developed world
Retrenchment from globalization (emerging)
Global governance gaps
Climatological catastrophes
Water supply crises
Mismanagement of population ageing
Cyber attacks
High structural unemployment or underemployment
Note: Boxes in green represent risks related to the environment as classified in WEF (2015) Source: WEF (2015)
There have been attempts to measure sustainability for investors, such as the Equator Principles and the Triple Bottom Line, but both these practices are for measuring environmental and social risks; they do not affect the actual bottom line (net profits) at all. Only if there is a liability which is real and present, will it get reported in the balance sheet as a liability. Environmental and social liability should have a “valuation” with a time line attached, and clarity in terms of causality. When these criteria are met, the environmental and social liabilities will start affecting the net profits of a firm.
Investment related decision-making is also made on financial ratios, which thus play an important role in this kind of decision-making. There is a need for a method—similar to financial ratio analysis—to obtain the efficiencies of private finance without getting into the grey area of actual financial impact reporting of environmental and social factors. Thus, another fundamental issue relevant to financing strategies in the low-carbon development field is the absence of financial indicators.
3 | P a g e

Discussion Paper Financing for Low Carbon Development in India
2. Stakeholder perspectives Finance is a very multi-faceted topic in low carbon development which encompasses public finance, banking, and market instruments. Moreover the process of decision-making in finance is important to understand. To understand these key aspects for low carbon development, structured questionnaire-based consultations were carried out for various stakeholder groups including government, industry, and research & academia with an objective of understanding sector-wise needs for low carbon development. A total of 298 stakeholders were interviewed during the targeted stakeholder consultations.
What are the key challenges in financing low carbon development projects?
Collectively for all sectors, high costs (including high interest rates) of financing turns out to be the major reason for lack of financing of sustainability projects. Other prime reasons that emerge based on the responses are inadequate subsidies, sustainability issues not prioritized by financial institutions (including banks), and lack of awareness/ understanding of such projects. The questionnaire analysis reveals that for different sectors, the nature of challenges varies. Details of the challenges faced in financing sustainability projects are listed in annexure 1.
In renewable energy, respondents believe that inadequate subsidies are the prime reason that’s thwarting financing. This was also witnessed when the generation based incentive (GBI) and the accelerated depreciation (AD) were removed for wind power during 2012-13 which led to major reductions in investments. Though they were continued later, it has proven that inadequate subsidies could prove detrimental to finance sustainability projects. Lack of awareness and understanding of such projects supplemented with high costs (including high interest rates) also need to be addressed.
In buildings, a majority of respondents believe that the lack of awareness and inadequate understanding of such projects makes it difficult to meet the finance requirement. This could also be the reason for non-adherence to norms by most of the real estate developers. The other choice for not being able to meet financing requirement for building sector is the high costs (including high interest rates) of financing. Stakeholders also felt that there were inadequate tax incentives and inadequate subsidies. Some municipalities in India have taken a lead in providing fiscal incentives such a tax rebates along with subsidies for renewable energy and rainwater harvesting in buildings. Such efforts need to be scaled up further.
In transport, stakeholder feel that sustainability issues not prioritized by financial institutions, making it difficult to finance the transport sector. Much action in this sector is happening at the local and sub-national levels, priorities of financial decision makers at the national level still remain ambiguous. Also, inadequate institutional processes manifested in failure of many PPP projects in this sector, and high costs (including high interest rates) of financing hamper financing of sustainability projects in transport sector.
According to stakeholders in agriculture, sustainability issues not being prioritized by financial institutions (e.g. Banks, FIs) is the key challenge in terms of financing in agriculture. Choices that follow this are inadequate subsidies and inadequate public finance availability.
4 | P a g e

Discussion Paper Financing for Low Carbon Development in India
For the industries high costs (including high interest rates) of financing emerged as the prime reason for not being able to muster the required finance for industries. Respondents also believe lack of awareness/ understanding of such projects and inadequate subsidies need improvements to tackle challenges in finance sustainability projects. India would need to improve upon its knowledge on green technologies if it needs to improve its awareness/ understanding of sustainable projects.
In waste management, most of the respondents opine that sustainability an issue not being prioritized by financial decision makers (e.g. Banks, FIs) is the reason for not being able to secure sufficient finance. Collection, treatment and processing of waste, all have their own issues. Further, inadequate government coordination and tax incentives for waste treatment emerge to be another challenge in terms of financing low carbon development.
In non-renewable energy, respondents primarily attribute lack of awareness/ understanding of such projects to challenges in financing sustainability projects. There is again technology gap in this sector which needs to be filled up by knowledge enhancement. Stakeholders also feel that inadequate subsidies and inadequate public finance availability are the other two prime challenges in terms of financing for sustainability projects.
What is the nature of the financial analysis for decision making?
Financial analysis plays a significant role in decision making in organizations. This analysis could either be quantitative or qualitative. An important aspect in quantitative financial analysis is how to incorporate environmental parameter when calculating costs and benefits. For quantitative financial analysis the choices given to respondents included: cost benefit analysis, payback period, NPV (net present value), II (internal rate of return), detailed financial statement analysis, DSCR (debt service cost ratio), financial statement modelling and real options analysis (Annexure 2).
Combing all sectors, according to stakeholders, cost-benefit analysis turned out to be the most preferred alternative for financial analysis for decision making. Cost-benefit analysis has traditionally been used to list out potential costs and revenue flows in the project which are then analysed to determine if the project is financially feasible or not. In sustainability projects, cost-benefit analysis provides an approach which can measure and value environmental and social impacts which would otherwise be difficult to quantify. Also, given the uncertainty in net economic flows of sustainability projects in all the above sectors, cost-benefit analysis could have been the preferred choice of the respondents. The top choice that emerged for different sectors based on the responses for ‘quantitative financial analysis’ is as follows:
• Cost benefit analysis turns out to be the most frequent choice of respondents in renewable energy.
• In buildings, also cost-benefit analysis is the most preferred choice. • Transport employs the use of payback period method the most for quantitative
analysis. • Cost benefit analysis again finds the top choice of the respondents in agriculture. • Industry mostly uses payback period as the tool for their financial analysis. • Waste management uses cost-benefit analysis the most.
5 | P a g e
Discussion Paper Financing for Low Carbon Development in India
• Non-renewable energy also preferred cost-benefit analysis the most among the available alternatives for financial analysis for decision making.
For qualitative financial analysis the choices given to respondents included: risk perception, experience, needs based and conservative estimates (Annexure 2). Subjective judgements about risks and hazards in sustainability projects are common to most respondents. Overall, risk perception has come out to be the most preferred qualitative method for carrying out qualitative financial analysis for decision making. The top choice that emerged from the responses for different sectors for qualitative financial analysis is as follows:
• In renewable energy, risk perception is the preferred choice of respondents. • Respondents chose experience the maximum number of times for qualitative analysis
in decision making in buildings. • Transport sector respondents cite risk perception as the prominent reason. • Agriculture sector respondents also cite risk perception as the salient reason. • Industry sector mainly utilizes conservative estimates for the analysis. • Conservative estimate find the most usage for analysis in waste management. • Non-renewable energy chooses risk perception to be the most prime reason.
Presently, what is the nature of financial support required in your sector?
Respondents feel that subsidy is the most preferred option by all the sectors. In line with the choice most preferred by the respondents for the key challenge faced in financing sustainability projects i.e. inadequate subsidies; respondents chose provision of subsidies the most as the nature of financial support required for all sectors.
On the question of nature of financial support required under the present policy scenario in different sectors, the choices presented to the respondents included: subsidies, loans, grants and funding for R&D (Annexure 3). The top choice that emerged in the seven sectors from the responses is given below:
• Subsidy is the top choice for renewable energy. • For buildings as well subsidies is the preferred choice. • Transport respondents also chose subsidies as the primary nature of financial support. • Agriculture sector also require subsidies. • Industry respondents also feel presently, financial support is needed in form of
subsidies. • In waste management, stakeholders prefer subsidies. • Non-renewable energy is the only sector among the seven that sees loans as the
preferred nature of financial support.
Where do you think financial innovation will be important in terms of the present policy environment?
Need of financial innovation in different sectors through different means can’t be undermined. A question was framed based on this understanding for the present policy environment, for which the choices included: Market mechanism, government stimulus,
6 | P a g e

Discussion Paper Financing for Low Carbon Development in India
special funds, debt financing, interventions by central banking regulatory body, tax reforms to increase funding for local bodies, seed financing/ angel investing and financial risk management tools (insurance/ hedging) (Annexure 4).
Collectively, respondents feel that government stimulus require maximum financial innovation. Special funds and tax reforms to increase funding for local bodies should also receive financial innovation according to the responses of the stakeholders interviewed. The role of Ministry of Finance along with sectoral nodal ministries becomes crucial in designing innovative instruments for financing sustainability projects. The top three choices that emerged from the responses for the sectors are enlisted below:
• For renewable energy, government stimulus is the area where most of the respondents feel that financial innovation may be required. With ambitious target of achieving 175 GW of renewable energy by 2022, government stimulus would certainly be required through innovative ways to carry out the task of promoting renewable energy in different ways. It is followed by market mechanism and tax reforms to increase funding for local bodies.
• In buildings, most of the respondents believed that market mechanism should be the major area for financial innovation, after which government stimulus and special funds should be where innovation should take place the most.
• Maximum respondents in transport sector believe that government stimulus is where financial innovation is required the most. Reducing decongestion on roads, improving transport infrastructure and abating vehicular pollution levels will surely require more than just subsidies, which is currently one of the preferred forms of government stimulus. Tax reforms to increase funding for local bodies is the second most preferred option followed by financial risk management tools (insurance/ hedging). Risk management might as well be necessary in case the PPP mode that’s being followed in transport sector doesn’t deliver the promises.
• Respondents in agriculture sector opine that seed financing/ angel investing is where financial innovation is required the most. There are limitations of traditional finance despite its reach. More streamlined and rural focused services like those based on mobile technologies, micro loans can bring in more innovation in sustainable agriculture. Government stimulus and interventions by central banking regulatory body are the next choices as per the responses.
• Industry sector believes special funds require financial innovation the most, followed by debt financing and government stimulus. Funds for R&D and technology development would be welcome in the country.
• For waste management, financial innovation should take place the most in government stimulus followed by special funds and tax reforms to increase funding for local bodies. The need to modernize the existing municipal solid waste management system in urban local bodies needs to be accelerated.
• In non-renewable energy, government stimulus was chosen the highest number of times so it is where financial innovation would be required the most under current policy scenario. Special funds and interventions by central banking regulatory body also require suitable financial innovation. While there is added thrust on re sector, the
7 | P a g e
Discussion Paper Financing for Low Carbon Development in India
non-re sector would still prevail in the energy mix of India in future and it needs suitable support from the government to make its projects more sustainable.
What kind of financing do you think would be the most prominent source for financing sustainability projects in future?
Finding ways to finance sustainability projects in future would be very important. To know respondents’ views on the most prominent sources of financing sustainability projects in future, the choices presented included: equity, debt, public finance, grants, angel investments, international finance (low interest debt/ grants), finance from multilateral agencies, government stimulus and venture capital (Annexure 5).
Overall, respondents feel that public finance should be an important avenue where financial innovations will take place. Fiscal stimulus in low carbon sectors as well also equity based instruments would be other options that should be considered for financing low carbon development projects in future. Respondents believe that the role of government in providing stimulus to these sectors would continue to be important. The top three choices that emerged for the seven sectors are as follows:
• In renewable energy, most of the respondents believe that public finance would be the prominent source for financing sustainability projects. Till the cost of renewable energy reaches grid parity, public finance will play a key role. Many also believe that equity followed by government stimulus would also be the prominent source for financing sustainability projects.
• For buildings, public finance is the preferred choice as a source for financing sustainability projects. Debt is the next choice of respondents followed by government stimulus.
• Respondents in transport sector opine that government stimulus should be the primary source of financing sustainability projects. Public finance, equity and angel investments should the next source of financing as per the responses.
• In agriculture sector, public finance should act as source of financing. Government stimulus and equity are the next two choices which should act as source of financing sustainability projects.
• Industry sector also believes that public finance should be the source of financing. Next in order are equity and venture capital.
• In waste management as well, public finance is believed to be the primary source of financing, to be followed by government stimulus and international finance (low interest debt/ grants).
• In non-renewable energy, government stimulus should form the source of financing. Equity and public finance are the other two choices of respondents as the source of financing sustainability projects.
What market aspects do you think is relevant for sustainability projects?
To gauge market aspects relevant for sustainability projects, respondents were asked to choose one of the following choices: New market mechanisms (e.g. CDM [Clean Development Mechanism], RECs [Renewable Energy Certificates], ESCOs [Energy Saving
8 | P a g e

Discussion Paper Financing for Low Carbon Development in India
Certificates]), markets as a source for funding (IPOs [Initial Public Offerings] for sustainability companies) and market indices for sustainability (e.g. BSE’s Greenex, Hang Seng Corporate Sustainability Index Series) (Annexure 6). Overall respondents opine that new market mechanisms are most important as market aspect relevant for sustainability projects. The choices which received highest number of responses for the seven sectors are enlisted below:
• ‘New market mechanisms’ is the highest preferred choice in renewable energy. • In buildings, markets as a source for funding was chosen by the maximum
respondents as key market aspect relevant for sustainability projects. • Transport sector respondents feel that new market mechanisms are more important. • New market mechanisms are preferred in agriculture sector. • Industry sector respondents feel that markets as a source for funding is more
important as the key market aspect. • In waste management, majority of respondents find new market mechanisms relevant. • In non-renewable energy sector markets as a source for funding is the key market
aspect for low carbon development projects.
9 | P a g e

Discussion Paper Financing for Low Carbon Development in India
3. Financial Mechanisms in India for Low Carbon Development
The chapter will now look into the various aspects of financial mechanisms for low carbon development in India. Seven types of financial mechanisms will be covered as depicted in figure 2. These include public finance, traditional finance, risk management instruments, market-based tradable instruments, international climate finance, public-private partnerships, and philanthropy.
Figure 2: Financial mechanisms for low carbon development in India
3.1 Public Finance Initiatives
Special national funds
The National Clean Energy Fund (NCEF), announced in the Union Budget 2010–11, is seen as a major step in India’s quest for energy security and reducing carbon intensity of energy. Funding research and innovative projects in clean energy technologies, and harnessing renewable energy sources to reduce dependence on fossil fuels constitute the objectives of the NCEF. The NCEF is being built up using the cess imposed on both the domestically produced and imported coal. This cess, which was earlier INR 50 per tonne of coal, was increased to INR 100 per tonne in July 2014. At this price the cess would have fetched INR
1) Public Finance Initiatives •Special national funds •Fiscally supported guarantee schemes •Special funds at the sub-national level
2) Traditional Finance •Banking •Innovation in financial products •Green Bonds
3) Risk Management Instruments
4) Climate Change and Market-Based Instruments
•International carbon markets •Domestic carbon market •Other market-based innovations
5) International Climate Finance
6) Public–private Partnerships
7) Philanthropy
10 | P a g e

Discussion Paper Financing for Low Carbon Development in India
6,000 crore ever year1. The cess has now been doubled again to INR 200 per tonne on all forms of coal in the Union Budget of 2015-16 – this would add an approximate amount of INR 12,000 crore (approx. USD 2 billion) annually for clean energy initiatives. Box 1 presents projects that are eligible to be financed through the NCEF.
Box 1: Projects Eligible to be Financed through the NCEF
According to the Guidelines issued by the Ministry of Finance, the following initiatives are eligible for financing under the National Clean Energy Fund.
1. Development and demonstration of integrated community energy solutions, smart grid
technology, renewable applications with solar, wind, tidal and geothermal energy; 2. Critical renewable energy infrastructure in areas such as silicon manufacturing; 3. Replacing existing technology in energy generation with more environmentally sustainable
approaches; 4. Environment management projects particularly in the geographical areas surrounding energy
sector projects; 5. Renewable/alternate energy including advanced solar technologies, geothermal energy, bio-
fuels from cellulosic bio-mass/algae/any waste, offshore marine technologies (wind, wave and tidal), onshore wind energy technologies, hydrogen, and fuel cells;
6. Clean fossil energy including power, oil, gas and coal technologies including coal gasification, shale oil/ gas, lignite/coal bed methane, and advanced turbine and technology for integrated gasification combined cycle power (IGCC) plants, methane hydrates, enhanced recovery from unconventional resources and fossil energy advanced research, carbon capture and sequestration, and carbon capture and reformation;
7. Basic energy sciences including energy storage for hybrid and plug-in electric vehicles, solid state lighting, catalysis, biological and environmental research, advanced computing, high energy and nuclear physics;
8. Pilot and demonstration projects for commercialization of clean energy technologies; 9. Projects identified under the eight missions of the National Action Plan on Climate Change
(NAPCC) and projects relating to R&D to replace existing technologies with more environment friendly ones under the National Mission on Strategic Knowledge for Climate Change (NMSKCC).
10. Projects relating to creation of power evacuation infrastructure for renewables.
Source: Compiled from MOF (2011)
The coal cess goes to the National Clean Energy Fund, which has a fund amounting to INR 17,000 crore (approx. USD 2.833 billion) in its kitty. By September, 2014, 46 clean energy projects worth INR 16,511.43 crore (approx. USD 2.752 billion) were recommended for funding out of the NCEF (MoF, 2015). Also, so far, projects that have been approved or are under consideration to be funded under the NCEF are of routine nature, and should have been funded by the ministries through their regular schemes. While the objectives of NCEF seem to be in line with the critical needs of the clean energy sector in India, there is no guidance for the overall vision and the strategy that should be employed to realize these (NIPFP 2013). There is also a need to both substantially augment the resources made available for energy related R&D and allocate these strategically according to its needs and priorities.
1 http://www.livemint.com/Politics/7008Rw5aY79CmN9MEzqpcO/Govt-uses-green-energy-fund-for-fiscal-balancing.html accessed on 6th May, 2015
11 | P a g e

Discussion Paper Financing for Low Carbon Development in India
Fiscally supported guarantee schemes
The Government of India adopted the National Action Plan on Climate Change in 2008 that consisted of several targets on climate change issues and addressed the urgent and critical concerns of the country through a directional shift in development patterns. The Partial Risk Guarantee Fund (PRGF) has been proposed under the National Mission on Enhanced Energy Efficiency (NMEEE) to cover specified technology and the associated commercial risks for new technologies in energy efficiency and renewable energy that are not usually priced by commercial banks. To help extend the reach of private financing by mitigating perceived risk and encourage private sector involvement in these sectors, this facility will act as a risk-sharing mechanism that will provide commercial banks with partial coverage of their risk exposure, thereby helping investors get lower cost debt. Government of India has approved around INR 312 crore (approx. USD 52 million) for PRGF for Energy Efficiency (PRGFEE) (Kanwal, 2015).
The fund would be available only in case of default, that is, it will be paid out to participating banks in the event of a loss or default, as specified in the structure of the PRGF mechanism. The mechanism is intended to address the key barriers of (i) availability of long-term finance at reasonable rates of interest to solar and energy-efficient applications, and (ii) build capacity within financial institutions to assess commercial risks in these businesses.
Similar to PRGF, the World Bank is facilitating efforts from Clean Technology Fund (CTF) and Global Environmental Facility (GEF) for a Partial Risk Sharing Facility (PRSF) to initiate the Energy Service Performance Contracting market for Energy Efficiency projects in large scale industries. Its objective is to achieve energy savings by catalyzing the market for energy service companies (ESCO)-implemented energy efficiency projects in India.
The PRSF comprises of a risk-sharing fund corpus of USD 35 million implemented by SIDBI, the Project Execution Agency (PEA) and funded from the CTF contribution of USD 25 million and a GEF contribution of USD 10 million (Component 1) and a TA and capacity building component from a GEF component of USD 8 million, with USD 6 million implemented by SIDBI & USD 2 million implemented by EESL (Component 2) (SIDBI, 2014).
Such initiatives aiming at lower cost financing can help make more projects financially viable, bring advanced renewable energy investments closer to grid parity faster and reduce payback periods of energy-efficient investments (CTFIPI 2011).
Special funds at the sub-national level
A formal mandate to set-up state energy conservation funds is mentioned in the Energy Conservation Act 2001 (EC Act 2001) that requires each state to designate an agency to implement the Act, and establish the State Energy Conservation Fund (SECF). The establishment of SECF is for the purposes2 of promotion of efficient use of energy and its conservation within the State. The Bureau of Energy Efficiency (BEE), Ministry of Power provides a contribution3 of INR 4 crores (approx. USD 0.66 million) to those states willing to set up an SECF managed by a designated agency in the individual states.
2 Paragraph 16, Energy Conservation Act, 2001 3 The government scheme is for contribution by the Ministry of Power to all the State/UTs with a maximum ceiling of INR 4.00 crore (approx. USD 0.67 million) for any State/UT provided in two instalments of INR 2.00 crore (approx. USD 0.33
12 | P a g e

Discussion Paper Financing for Low Carbon Development in India
Some of state level energy conservation initiatives are as follows:
• Urja Ankur Fund in Maharashtra (conceived in 2006) • Gujarat Green Energy Fund (conceived in 2011) • Rajasthan State Energy Conservation Fund (conceived in 2010) • Haryana State Clean Energy Fund (conceived in 2010) • Kerala State Energy Conservation Fund (conceived in 2010)
Apart from the above state energy conservation funds, states such as Orissa, Uttar Pradesh, and Punjab among others have also constituted their energy conservation funds so that they could receive the fund disbursed by the BEE to invest in Energy Efficiency projects.
The Urja Ankur Fund was designed to promote power generation using bagasse as a source during the first phase and small hydro, municipal waste and geothermal energy in the second phase. It helps project development by placing 20% equity and providing project development support. The Urja Ankur fund is an example of a fund created by collecting an additional amount in electricity bills but without any contribution from the energy charges development. The fund was created to support large renewable energy projects in Maharashtra with a legislative mechanism allowing an additional charge to be levied on industrial consumers in the state (IIEC 2012).
The focus of operation of these funds has been promotion of medium to large renewable energy projects.
Special financing institutions under public finance
There is a need to facilitate public sector investment for low-carbon growth, build carbon market access, accelerate technological innovation, and support adaptation to mitigate the impacts of climate change. Support for development and commercialization of low-carbon technologies (LCTs) needs to be significantly augmented by targeted public sector financing interventions, directly by the Indian government, through its agencies or indirectly through universities or research institutes. Public sector funding would reduce the risks of investing in LCTs and demonstrate their commercial viability so as to create a scaled-up, commercially viable business activity. This in turn would stimulate and mobilize private finance and investment to scale up their deployment over time.
The Indian government, realizing the barriers associated with financing renewable energy projects, under its strategy to develop sustainable energy created the Indian Renewable Energy Development Agency (IREDA) in 1987. IREDA’s resources have come mostly from international assistance and domestic borrowings in the form of credit from other banks and issuance of long-term bonds.
IREDA has intended to lend INR 14000-16000 crore (approx. USD 2.333-2.666 billion) in 2014 over the next three years (Upadhyay, IREDA to raise Rs 1,500 crore via tax-free bonds next fiscal, 2014); equivalent to as much as it has disbursed for the past 28 years it has existed, illustrating the growing interest of investors in clean energy business. It launched its first green bond in February 2014 worth INR 500 crore (approx. USD 83.33 million) total
million) each. The second instalment of contribution to SECF was released only after the states have provided a matching contribution to the BEE's first instalment. Source: http://powermin.nic.in/Energy-Efficiency (last accessed 22 May 2015)
13 | P a g e

Discussion Paper Financing for Low Carbon Development in India
(with an option to extend to INR 1000 crore (approx. USD 166.67 million)) to support renewable energy projects. At the end of 2014, the US EXIM bank agreed to provide medium and long-term loans for up to USD 1 billion for IREDA affiliated projects. This credit facility can be utilized during commercial development activities within the clean energy sector by IREDA to import US technologies, products and services and finance up to 30% of domestically manufactured components.
Given the magnitude of the required resources, IREDA would have to be significantly strengthened to be capable of responding to, and in many areas anticipating, the needs and complexities of the low-carbon transition, and thereby designing new and efficient financial instruments to meet these needs. Therefore, there is a need to broaden the sources of funds for financing such investments as well as the manner in which these funds are intermediated (Purkayastha et al. 2011). Effective long-term availability of funds for facilitating the shift to low-carbon investment would necessitate large-scale, well-constructed involvement of public financial institutions with specific focus on driving the transformation to low-carbon energy.
3.2 Traditional Finance
Banking
Traditional finance in India has not managed to come up with a common framework to encourage companies to go green. However, despite the absence of green credit guidelines, some banks have taken initiatives independently.
This is the case of the State Bank of India, the country’s largest bank, which introduced a ‘Green Home’ loan, with special concessions (reduced margin, softer interest rate, and zero processing fees) for environment-friendly housing projects. The other well-known bank which finances green projects is SIDBI (Small Industries Development Bank of India). It provides micro, small and medium enterprises financial assistance for technology innovative projects, with a preference being given to the green sector. Thanks to special lines of credit given by international agencies (JICA, KFW, AFD), SIDBI is able to grant loans with relatively low interest rates compared to those of commercial banks. By October, 2012, SIDBI had provided assistance worth approximately INR 3,000 crore (approx. USD 500 million) to around 6,000 MSME units for green and energy-efficient technologies (MMR Online Foundry Review, 2012).
The Infrastructure Development Finance Company (IDFC) is the only Indian bank that has joined, this year, the Equator Principles—an internationally accepted credit risk management framework for determining, assessing, and managing environmental and social risk in project finance transactions.
The issuance of the Green Credit Guidelines by China’s banking regulatory commission in February 2012 marked a milestone in China’s commitment to sustainable banking practices and in helping address environmental challenges. The guidelines promote the implementation of Green Credit policies to a new level. It is a kind of financial innovation for achieving sustainability objectives.
These guidelines have been formed to encourage banking financial institutions to promote green credit, effectively fend off environmental and social risks, boost the transformation of the economic growth mode and the adjustment of the economic structure, and hence, better
14 | P a g e

Discussion Paper Financing for Low Carbon Development in India
serve the real economy. Thus, they encourage Chinese banks to lend more to energy-efficient and environmentally sustainable companies and less to polluting and high energy-consuming enterprises. The guidelines show the banks how to integrate sustainability thinking into their lending cycle and will be applied to all lending—both domestic and overseas.
The Chinese Green Credit Guidelines require the board of directors or the supervisory board of banking institutions to build and promote green credit concepts concerning energy saving, environmental protection and sustainable development; be committed to giving play to the functions of facilitating holistic, coordinated and sustainable economic and social development; and establish a sustainable development model that will benefit the society at the same time (Article 6, Green Credit Guidelines).
The Reserve Bank of India (RBI) which is India's central banking institution controls the monetary policy for the country. The institution is responsible for regulating and supervising the financial system and prescribes broad parameters for banking operations within which the country's banking and financial system functions.
The RBI guidelines on loans and advances provides a framework of rules, regulations and instructions issued to scheduled commercial banks on statutory and other restrictions on loans and advances. Commercial banks should implement these instructions and adopt adequate safeguards in order to ensure that the banking activities undertaken by them are run on sound, prudent and profitable lines (RBI, 2014). The restrictions pertain to the following
• Statutory restrictions
• Regulatory restrictions
• Restrictions on other loans and advances
• Transfer of borrowal accounts from one bank to another
• Guidelines on Fair Practices Code for lenders
• Guidelines on recovery agents engaged by banks
RBI guidelines with respect to loans and advances, non-performing assets, interest payments, prudential norms, capital adequacy, know your customer (KYC) are very well-structured and set according to international standards. RBI revised its priority sector lending norms in April, 2015 and notably accorded priority sector lending status to renewable energy (RBI, 2015). Banks can now provide loan up to INR 15 crore (approx. USD 2.5 million) to borrowers for purposes like solar based power generators, biomass based power generators, wind mills, micro-hydel plants and for non-conventional energy based public utilities viz. street lighting systems, and remote village electrification. For individual households, the loan limit will be INR 10 lakh (approx. USD 0.016 million) per borrower. However, there is a lack of a mechanism that would make the banks invest more to support a green and low-carbon economy. There is an absence of green credit guidelines or guidelines on similar lines to China in India that prescribes banking institutions to establish and constantly improve the policies, systems and processes for environmental and social risk management, and identify the directions and priority areas for green credit support.
15 | P a g e
Discussion Paper Financing for Low Carbon Development in India
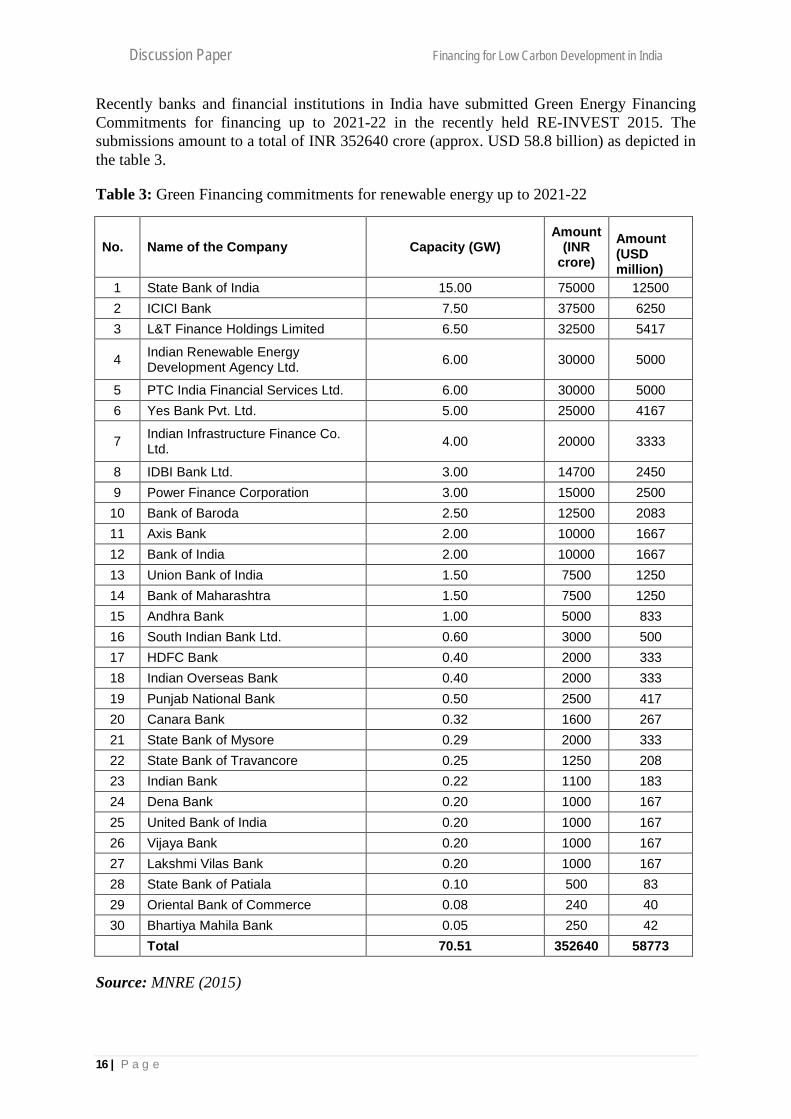
Recently banks and financial institutions in India have submitted Green Energy Financing Commitments for financing up to 2021-22 in the recently held RE-INVEST 2015. The submissions amount to a total of INR 352640 crore (approx. USD 58.8 billion) as depicted in the table 3.
Table 3: Green Financing commitments for renewable energy up to 2021-22
No. Name of the Company Capacity (GW) Amount
(INR crore)
Amount (USD million)
1 State Bank of India 15.00 75000 12500 2 ICICI Bank 7.50 37500 6250 3 L&T Finance Holdings Limited 6.50 32500 5417
4 Indian Renewable Energy Development Agency Ltd. 6.00 30000 5000
5 PTC India Financial Services Ltd. 6.00 30000 5000 6 Yes Bank Pvt. Ltd. 5.00 25000 4167
7 Indian Infrastructure Finance Co. Ltd. 4.00 20000 3333
8 IDBI Bank Ltd. 3.00 14700 2450 9 Power Finance Corporation 3.00 15000 2500 10 Bank of Baroda 2.50 12500 2083 11 Axis Bank 2.00 10000 1667 12 Bank of India 2.00 10000 1667 13 Union Bank of India 1.50 7500 1250 14 Bank of Maharashtra 1.50 7500 1250 15 Andhra Bank 1.00 5000 833 16 South Indian Bank Ltd. 0.60 3000 500 17 HDFC Bank 0.40 2000 333 18 Indian Overseas Bank 0.40 2000 333 19 Punjab National Bank 0.50 2500 417 20 Canara Bank 0.32 1600 267 21 State Bank of Mysore 0.29 2000 333 22 State Bank of Travancore 0.25 1250 208 23 Indian Bank 0.22 1100 183 24 Dena Bank 0.20 1000 167 25 United Bank of India 0.20 1000 167 26 Vijaya Bank 0.20 1000 167 27 Lakshmi Vilas Bank 0.20 1000 167 28 State Bank of Patiala 0.10 500 83 29 Oriental Bank of Commerce 0.08 240 40 30 Bhartiya Mahila Bank 0.05 250 42
Total 70.51 352640 58773
Source: MNRE (2015)
16 | P a g e
Discussion Paper Financing for Low Carbon Development in India
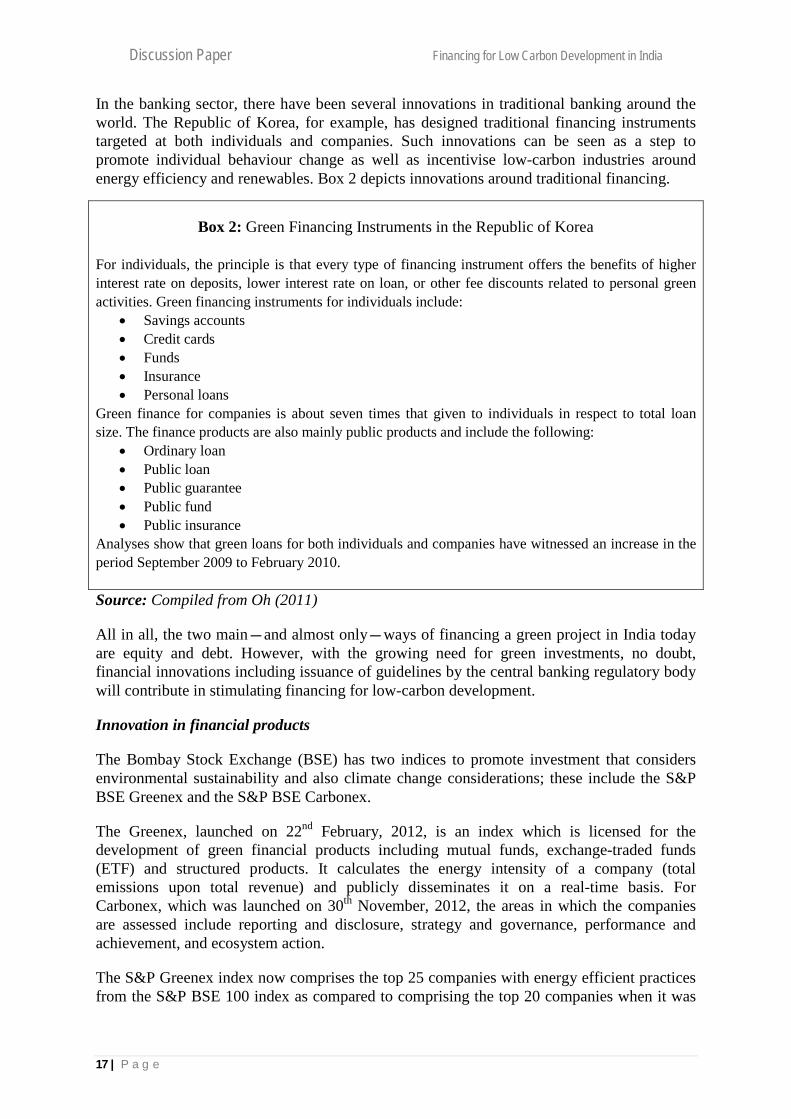
In the banking sector, there have been several innovations in traditional banking around the world. The Republic of Korea, for example, has designed traditional financing instruments targeted at both individuals and companies. Such innovations can be seen as a step to promote individual behaviour change as well as incentivise low-carbon industries around energy efficiency and renewables. Box 2 depicts innovations around traditional financing.
Box 2: Green Financing Instruments in the Republic of Korea For individuals, the principle is that every type of financing instrument offers the benefits of higher interest rate on deposits, lower interest rate on loan, or other fee discounts related to personal green activities. Green financing instruments for individuals include:
• Savings accounts • Credit cards • Funds • Insurance • Personal loans
Green finance for companies is about seven times that given to individuals in respect to total loan size. The finance products are also mainly public products and include the following:
• Ordinary loan • Public loan • Public guarantee • Public fund • Public insurance
Analyses show that green loans for both individuals and companies have witnessed an increase in the period September 2009 to February 2010. Source: Compiled from Oh (2011)
All in all, the two main—and almost only—ways of financing a green project in India today are equity and debt. However, with the growing need for green investments, no doubt, financial innovations including issuance of guidelines by the central banking regulatory body will contribute in stimulating financing for low-carbon development.
Innovation in financial products
The Bombay Stock Exchange (BSE) has two indices to promote investment that considers environmental sustainability and also climate change considerations; these include the S&P BSE Greenex and the S&P BSE Carbonex.
The Greenex, launched on 22nd February, 2012, is an index which is licensed for the development of green financial products including mutual funds, exchange-traded funds (ETF) and structured products. It calculates the energy intensity of a company (total emissions upon total revenue) and publicly disseminates it on a real-time basis. For Carbonex, which was launched on 30th November, 2012, the areas in which the companies are assessed include reporting and disclosure, strategy and governance, performance and achievement, and ecosystem action.
The S&P Greenex index now comprises the top 25 companies with energy efficient practices from the S&P BSE 100 index as compared to comprising the top 20 companies when it was
17 | P a g e
Discussion Paper Financing for Low Carbon Development in India
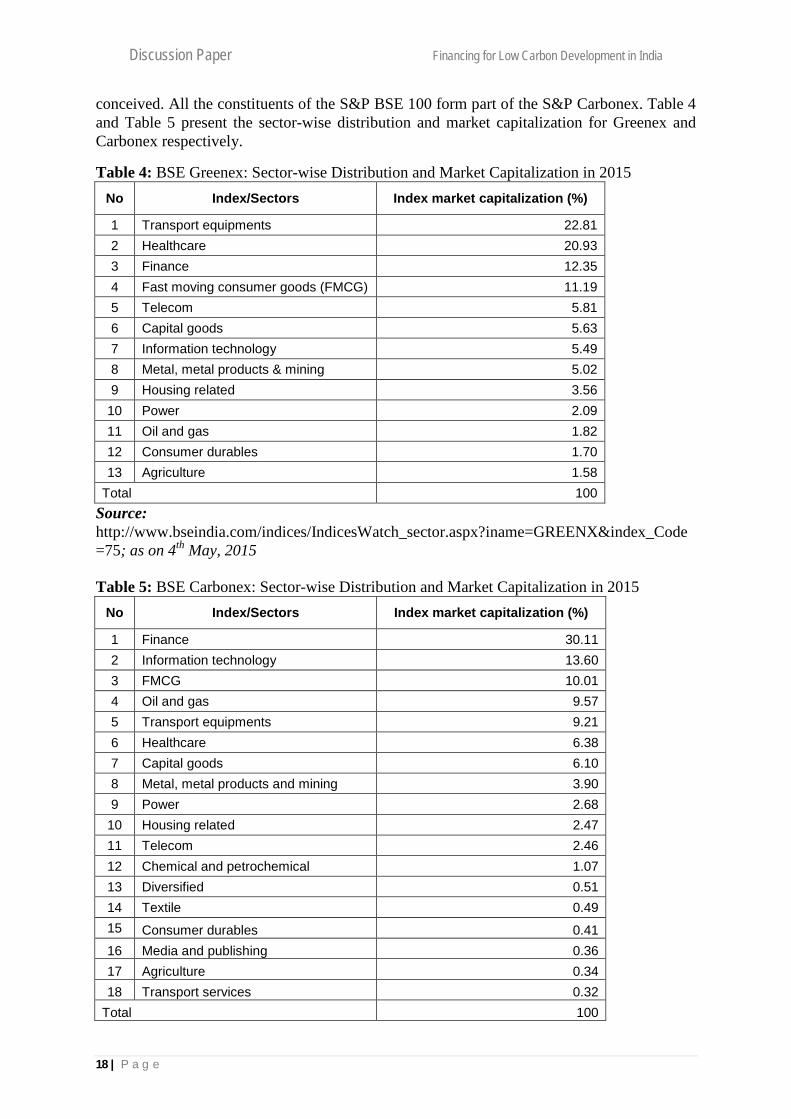
conceived. All the constituents of the S&P BSE 100 form part of the S&P Carbonex. Table 4 and Table 5 present the sector-wise distribution and market capitalization for Greenex and Carbonex respectively.
Table 4: BSE Greenex: Sector-wise Distribution and Market Capitalization in 2015 No Index/Sectors Index market capitalization (%)
1 Transport equipments 22.81 2 Healthcare 20.93 3 Finance 12.35 4 Fast moving consumer goods (FMCG) 11.19 5 Telecom 5.81 6 Capital goods 5.63 7 Information technology 5.49 8 Metal, metal products & mining 5.02 9 Housing related 3.56
10 Power 2.09 11 Oil and gas 1.82 12 Consumer durables 1.70 13 Agriculture 1.58
Total 100 Source: http://www.bseindia.com/indices/IndicesWatch_sector.aspx?iname=GREENX&index_Code=75; as on 4th May, 2015 Table 5: BSE Carbonex: Sector-wise Distribution and Market Capitalization in 2015
No Index/Sectors Index market capitalization (%)
1 Finance 30.11 2 Information technology 13.60 3 FMCG 10.01 4 Oil and gas 9.57 5 Transport equipments 9.21 6 Healthcare 6.38 7 Capital goods 6.10 8 Metal, metal products and mining 3.90 9 Power 2.68
10 Housing related 2.47 11 Telecom 2.46 12 Chemical and petrochemical 1.07 13 Diversified 0.51 14 Textile 0.49 15 Consumer durables 0.41 16 Media and publishing 0.36 17 Agriculture 0.34 18 Transport services 0.32
Total 100
18 | P a g e

Discussion Paper Financing for Low Carbon Development in India
Source: http://www.bseindia.com/indices/IndicesWatch_sector.aspx?iname=CARBON&index_Code=77; as on 4th May, 2015
Green Bonds
Green bonds are an innovative financing mechanism which can help in raising long-term and low-cost debt capital to fund ‘green’ projects involving emission reduction such as improvement in energy efficiency, and production of renewable energy. They can prove to be extremely useful to fund India’s ambitious target of building 175 GW renewable energy capacity by 2022 (MNRE, 2015). In the next five years, proposals are likely to generate business opportunities of the order of USD 160 billion in the renewable energy sector (MoF, 2015).
Although, the Green Bond Principles (GBPs) – voluntary process guidelines that recommend transparency and disclosure and promote integrity in the development of the Green Bond market by clarifying the issuance process – do mention the broad categories wherein the proceeds from the sale of the green bonds should be allocated; determination of projects under ‘green’ category remains ambiguous because of the lack of a standard definition of green bonds.
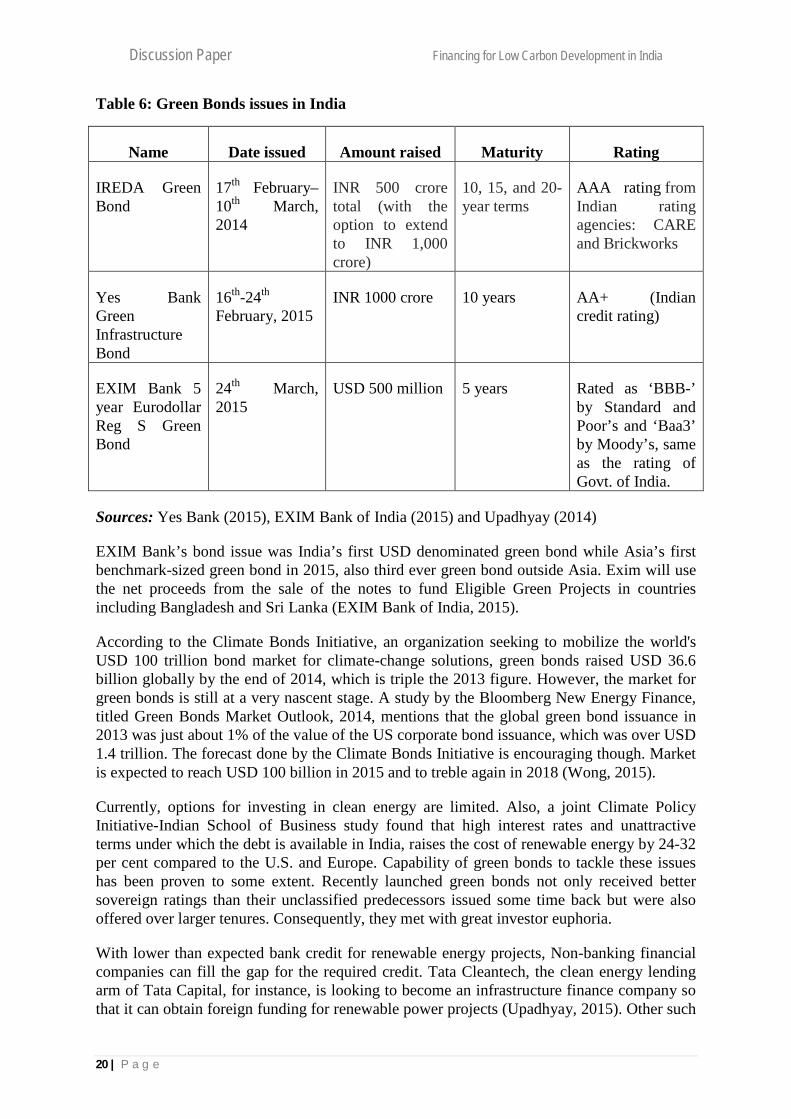
In India, examples of green bonds include: green bond launched by IREDA in February, 2014, Green Infrastructure Bond launched by Yes Bank India in February, 2015, Reg S Green Bond issued by the Export-Import Bank of India in March, 2015 etc. The following content and table 6 gives details on the bonds issued.
IREDA launched its first green bond to support renewable energy projects in February 2014. They offered it to both private and public investors and issues at INR 1000 each totaling to INR 500 crore (approx. USD 83.33 million) with an option to extend it to INR 1000 crore (approx. USD 166.67 million). Tenure of the bonds is 10, 15, 20 years with interest rates at 8.16%, 8.55% and 8.55% per year, respectively. This green bond received an AAA rating from two top Indian rating agencies, CARE and Brickworks.
YES Bank issued first ever Green Infrastructure Bonds raising an amount of INR 1000 crore, twice the original issue amount of INR 500 crore with green shoe option. The bonds are for a tenor of 10 years. Yes Bank intends to finance Green Infrastructure Projects in Renewable Energy including Solar Power, Wind Power, Biomass, and Small Hydel Projects from the proceeds of this green infrastructure bond.
EXIM Bank of India launched a 5 year Reg S Green Bond issue of USD 500 million on March 24, 2015 at a coupon of 2.75% pa. The issue attracted subscription of around 3.2 times the issue size led by strong demand, across 140 accounts. Majority participation was from fund managers (58%) followed by banks (20%) and sovereign wealth funds / insurance companies (18%). The issue was distributed 60% to Asian investors, 30% to Europe, Middle East and Africa and balance to offshore US investors. S & P rated EXIM Bank of India at ‘BBB-‘ and Moody rated it at ‘Baa3’.
19 | P a g e
Discussion Paper Financing for Low Carbon Development in India
Table 6: Green Bonds issues in India
Name Date issued Amount raised Maturity Rating
IREDA Green Bond
17th February–10th March, 2014
INR 500 crore total (with the option to extend to INR 1,000 crore)
10, 15, and 20-year terms
AAA rating from Indian rating agencies: CARE and Brickworks
Yes Bank Green Infrastructure Bond
16th-24th February, 2015
INR 1000 crore 10 years AA+ (Indian credit rating)
EXIM Bank 5 year Eurodollar Reg S Green Bond
24th March, 2015
USD 500 million 5 years Rated as ‘BBB-’ by Standard and Poor’s and ‘Baa3’ by Moody’s, same as the rating of Govt. of India.
Sources: Yes Bank (2015), EXIM Bank of India (2015) and Upadhyay (2014)
EXIM Bank’s bond issue was India’s first USD denominated green bond while Asia’s first benchmark-sized green bond in 2015, also third ever green bond outside Asia. Exim will use the net proceeds from the sale of the notes to fund Eligible Green Projects in countries including Bangladesh and Sri Lanka (EXIM Bank of India, 2015).
According to the Climate Bonds Initiative, an organization seeking to mobilize the world's USD 100 trillion bond market for climate-change solutions, green bonds raised USD 36.6 billion globally by the end of 2014, which is triple the 2013 figure. However, the market for green bonds is still at a very nascent stage. A study by the Bloomberg New Energy Finance, titled Green Bonds Market Outlook, 2014, mentions that the global green bond issuance in 2013 was just about 1% of the value of the US corporate bond issuance, which was over USD 1.4 trillion. The forecast done by the Climate Bonds Initiative is encouraging though. Market is expected to reach USD 100 billion in 2015 and to treble again in 2018 (Wong, 2015).
Currently, options for investing in clean energy are limited. Also, a joint Climate Policy Initiative-Indian School of Business study found that high interest rates and unattractive terms under which the debt is available in India, raises the cost of renewable energy by 24-32 per cent compared to the U.S. and Europe. Capability of green bonds to tackle these issues has been proven to some extent. Recently launched green bonds not only received better sovereign ratings than their unclassified predecessors issued some time back but were also offered over larger tenures. Consequently, they met with great investor euphoria.
With lower than expected bank credit for renewable energy projects, Non-banking financial companies can fill the gap for the required credit. Tata Cleantech, the clean energy lending arm of Tata Capital, for instance, is looking to become an infrastructure finance company so that it can obtain foreign funding for renewable power projects (Upadhyay, 2015). Other such
20 | P a g e

Discussion Paper Financing for Low Carbon Development in India
companies, like L & T Infrastructure Finance and PTC Financial have similar plans and their capacity to offer faster financial closure than traditional banks can act to their advantage.
Indian companies can also learn from countries which have developed municipal bond market. Municipal bonds can help city corporations raise funds without looking for grants from state or central government or loans from international agencies. The municipal bond market in India, albeit more than a decade and a half old, is still at a nascent stage. After 2010, no municipal bonds were issued and the market has been dormant due to low ratings, reluctant investors and unclear regulations (Chakrabarti, 2014). On a positive note though, the rating agency, CARE, estimates that INR 1,000- INR 1,500 crore (approx. USD 166.67-250 million) could be raised by way of Municipal bonds every year over the next five years by the larger urban local bodies with investment grade (CARE Ratings, 2014). Thus municipal/ local bonds hold large untapped potential waiting to be explored to bring about sustained development in infrastructure and fund green projects.
Although larger issues of standardization, credibility and proper classification of bonds as ‘green’ are yet to be taken care of; credit enhancement and larger participation from other eligible entities could still help India leverage the early mover position in the burgeoning green bonds market. Under that scenario, India should remain hopeful of the opportunity green bonds provide to raise capital to fund its green ventures.
3.3 Risk Management Tools
Two-third of the Indian population depends on agriculture to live, which is a sufficient reason to demonstrate the importance of crop insurance in this country. In 2013, National Crop Insurance Program (NCIP) was introduced which merged Modified National Agricultural Insurance Scheme (MNAIS), Pilot Weather Based Crop Insurance Scheme (WBCIS), and Pilot Coconut Palm Insurance Scheme (CPIS) existing at that time.
MNAIS provides for insurance cover and financial support to the farmers in the event of prevented sowing and failure of any of the notified crops as a result of natural calamities, pests and diseases. WBCIS aims to reduce hardships faced by insured farmers on account of financial loss caused due to crop loss resulting from incidences of adverse weather conditions. CPIS assists coconut growers in insuring coconut palms against natural and other perils.
The NAIS which started in 1999 has been quite successful in insuring farmers and is sponsored by the Indian government. Any farmer can apply for this insurance, whatever the size of his holding, at an interest rate ranging from 1.5% to 3.5% depending on what he grows. The insurance can be either area-based or individual-based (viz., for widespread or localized calamities) (Raju & Chand, 2008). In the case of an area-based insurance, an average yield of this particular area is defined (based on previous years' data) and if the actual yield is below the historical level, the insured farmers in this unit can ask for indemnification (70, 80 or 90 per cent respectively for high, medium and low risk areas).
In total, some 25 million farmers have been insured, thanks to the NAIS, which makes it the largest crop insurance programme in the world. However, India has around 121 million farmers, out of which 80 per cent do not get any help from financial institutions but rely on themselves to meet their financial needs—a lot of efforts remain to be made to meet the demand.
21 | P a g e

Discussion Paper Financing for Low Carbon Development in India
The Ministry of Micro, Small and Medium Enterprises, GoI and Small Industries Development Bank of India (SIDBI), established a Trust named Credit Guarantee Fund Trust for Micro and Small Enterprises (CGTMSE) to implement the Credit Guarantee Fund Scheme for Micro and Small Enterprises. The scheme was formally launched on 30th August, 2000. The corpus of CGTMSE is being contributed by the GoI and SIDBI in the ratio of 4:1 respectively and INR 2295.30 crore (approx. USD 382.55 million) had been contributed to the corpus of the Trust up to 31st August, 2014 (MSME, 2014). According to CGTMSE, this scheme reassures the lender that in case an MSE unit fails to discharge its liabilities to the lender, the Guarantee Trust would cover for the loss incurred by the lender up to 75 / 80/ 85 per cent of the credit facility. SIDBI has been able to cover over 14 lakh units under that scheme for MSMEs for loans of about INR 70,000 crore (Maini, 2014) (approx. USD 11.66 billion).
A risk sharing mechanism that has been introduced under the National Mission on Enhanced Energy Efficiency (NMEEE) of the National Mission on Climate Change (NAPCC) is Partial Risk Guarantee Fund (PRGF). It provides commercial banks with partial coverage of risk exposure against loans issued for energy efficiency projects by substituting a portion of the risk of the borrower by providing guarantees.
On 31st March 2015, World Bank and the Government of India have signed a USD 43 million grant and guarantee agreement towards the Partial Risk Sharing Facility for Energy Efficiency Project. The project has the potential to leverage funds and unlock private sector financing to over three-times of World Bank funds. It will also help build the capacity of ESCOs to structure and seek financing; and that of financial institutions to finance EE projects on a commercially-sustainable basis (World Bank, 2015).
Although the atmosphere surrounding financing for low carbon transitioning technologies is improving, yet it is still fraught with uncertainties and risks which are preventing lending at larger scale. There is a need to look out for more risk management tools for low-carbon development in India.
3.4 Climate Change and Market-based Instruments
International carbon markets
The global carbon market grew rapidly from 2005 until 2011, from an initial value of USD 11 billion to USD 176 billion after which prices in the major existing markets were at historic low. Prices in the EU ETS – the largest carbon market – remained in the depressed range of about USD 5-9 in 2013 as compared to USD 13 three years ago. Similarly Kyoto credit prices also reached their lowest in 2013 and 2014, with Certified Emission Reductions (CERs) worth just USD 0.51. Private sector experienced significant losses and as they remain reluctant to engage, robust consensual and international solutions are required to revive private sector confidence in the global carbon market (World Bank, 2014).
Progress across the globe is however steadily increasing; eight new carbon markets opened their doors in 2013 alone. According to the World Bank (2014), about 40 national and over 20 sub-national jurisdictions are putting a price on carbon. It estimates the world’s emission trading schemes to be USD 30 billion (it doesn’t include the Kyoto Protocol international emission trading) in 2013. Point Carbon at Thomson Reuters estimates that the global carbon
22 | P a g e

Discussion Paper Financing for Low Carbon Development in India
market is set to near Euro 70 billion (approx. USD 79.1 billion4) in 2015 after strong growth in 2014 when it reached to Euro 45 billion (approx. USD 50.85 billion).
Flexible mechanisms were established under the Kyoto Protocol (KP) to provide industrialized countries alternatives to reducing greenhouse gas (GHG) emissions domestically. The three KP mechanisms include:
• International Emissions Trading • Joint Implementation (JI) • Clean Development Mechanism (CDM)
A second commitment period to the Protocol was negotiated at the 17th Conference of the Parties (COP 17) in Durban in 2011 implying that the KP flexible mechanisms will continue until 2020 at least.
A number of new market mechanisms are being considered to scale up carbon offsetting in developing countries, namely bilateral and sectoral mechanisms, the Reducing Emissions from Deforestation and Forest Degradation (REDD+) mechanism and credited nationally appropriate mitigation actions (NAMAs). All these new mechanisms aim to scale up the CDM significantly. Table 7 lists the new market mechanisms.
Table 7: New Market Mechanisms
New market mechanisms
Description Status Private sector involvement
Bilateral offsetting crediting mechanism
Agreement between a country with international emissions reduction targets and developing countries without such a target. The scheme will have similar objectives to the CDM, yet with a simplified administrative process and on a larger scale.
Japan is currently funding pilot projects.
As with CDM, the private sector has a similar role to play through investments in return for offsets.
REDD+
Mechanism to stop global deforestation by offering developing countries financial incentives to preserve forests in return for carbon credits.
COP 16 in Cancún delivered an international agreement on the formation of the REDD mechanism. However, the design has not been established. The mechanism is currently only operational in the voluntary carbon market.
The key issue in the design is finance. Public finance will not be adequate for this kind of funding, which means that much depends on the private sector. At present, financials are mainly involved in the carbon market forestry sector, financing projects in return for carbon credits for speculative or CSR purposes.
Sectoral crediting
The design is not established; however the common idea is to
Subject to design and negotiations.
As with CDM, the private sector has a
4 For currency conversion purposes: I Euro = 1.13 USD
23 | P a g e

Discussion Paper Financing for Low Carbon Development in India
New market mechanisms
Description Status Private sector involvement
mechanisms
credit emissions reductions achieved on aggregate in a specific sector below a certain predefined baseline. The scope could either be on sectors within one country or across sectors internationally.
role to play through investments in return for offsets.
Sectoral trading mechanisms
A (developing) country commits to legally binding emissions reduction targets for specific sectors under the UNFCCC umbrella. Rules and requirements would be comparable to an ETS.
Subject to design and negotiations.
Companies would be subject to a compliance regime such as through an ETS.
NAMAs Very broad definition for voluntary emission reduction measures undertaken by developing countries that meet the needs of their specific national circumstances. NAMAS are expected to be one of the main vehicles for mitigation action in developing countries under a future climate agreement, and can take the form of policies or actions implemented at national, regional or local levels. They can be project-based (like the CDM), sectoral, or nationwide (for instance, as an ETS). Possible inclusion of carbon crediting mechanisms.
Scope and design unclear.
As funding is essential, and public finance is limited, the private sector has an important role to play. Potential to present vast opportunities for companies.
Source: Ernst & Young (2012)
In India, to date, the CDM has been the main international mechanism for mitigation. Data analysis of CDM registered projects in India reveals that the projects are concentrated in states that are more industrialized, such as Gujarat and Maharashtra (Urpelainen, 2012). China, in contrast, has central and provincial governments offering institutional support to CDM project developers across provinces. The slow bureaucratic process, complex design, and costs related to CDM in India have also drawn criticism.
Domestic carbon market
At present, there are a number of sub-national, national and supra-national voluntary and mandatory cap-and-trade schemes active in the EU, the US, Australia, New Zealand, and Japan. Developing countries such as China and South Korea are following suit (Ernst & Young 2012). Regional schemes are in operation in China and Korea launched its carbon market in January, 2015. These schemes are usually designed within domestic climate change policy frameworks and mostly involve the private sector including business and industry.
India has not shown propensity towards designing a domestic carbon emission trading system. Upadhyay (2010) and Sterk & Mersmann (2011) explain that this is because of two
24 | P a g e

Discussion Paper Financing for Low Carbon Development in India
reasons: first, there is political reluctance; second, there seems to be an institutional overlap between existing policy mechanisms including CDM CERs which have been successful in India. In this regard, lessons can be learnt from the Chinese experience of implementing domestic trading schemes.
China’s domestic carbon markets are part of China's strategy to cut its greenhouse gas emissions per unit of GDP to 40–45% below 2005 levels by 2020 as the country seeks to limit climate change, address future energy security issues and stave off international criticism for being the world's biggest emitter. Table 8 depicts a comparison of emissions coverage under the emission trading scheme (ETS) pilots.
Table 8: A comparison of emissions coverage under the ETS pilots in 2010
Region GHGs Covered CO2emissions (Mton)
Share of total emissions
Direct or indirect emissions
Number of covered entities
Emissions threshold for coverage (tons CO2/year)
Historical emissions period
Beijing CO2 58 50% Direct and indirect
approx. 490
>10,000 (average (stationary emissions))
2009–2012
Tianjin CO2 112 45% Direct and indirect
197 >20,000 for industry;>10,000 for other sectors
2010–2011
Shanghai CO2 90 60% Direct and indirect
191 >20,000 2009–2012
Chongqing CO2 No data Not yet available
Direct and indirect
No data >20,000 (or 10,000 tce)
2008–2010
Hubei CO2 117 33% Direct and indirect
107 >Approx.120,000(or 60,000 tce)
2010–2011
Guangdong CO2 209 42% Direct and indirect
830 >20,000 (or 10,000 tce)
2010–2012
Shenzhen CO2 32 40% Direct and indirect
635 >5000 2009–2011
All ETS pilots
CO2 >620 7% of China׳s total
Direct and indirect
>2535 - -
EU-ETS (Phase I)
CO2 2014 47% Direct 11,500 >10,000 1996–2004
Duan (2013), International Carbon Action Partnership (ICAP) (2013), European Commission (2013), Qiu (2013), and Xu (2013)
Source: Zhang et al (2014)
Enterprises and buildings that emit more than they have permits to cover can buy additional permits in the form of emissions allowances or use offset credits issued by the central
25 | P a g e

Discussion Paper Financing for Low Carbon Development in India
government, known as Chinese Certified Emissions Reductions (CCERs). China’s National Development and Reform Commission (NDRC) developed the first batch of 52 CCER methodologies for voluntary greenhouse gas emissions reduction in March 2013. The CCER methodologies are based on the evaluation of Clean Development Mechanism (CDM) methodologies approved by the UN Executive Board, and adapted to China’s need. The 52 CCER methodologies align with China’s traditional focus on renewable energy, energy efficiency and fuel switch, and methane.
Shenzen became China’s first city to launch the pilot. By the end of 2013, Shenzhen, Shanghai, Beijing, Guangdong Province and Tianjin had all launched carbon emission trading markets. In the second quarter of 2014, Hubei Province and Chongqing followed.
The pilot provinces and cities have taken measure, including formulating relevant laws and regulations, setting the total amount of carbon emissions and the coverage, establishing measurement, reporting and verification (MRV) system for greenhouse gases, determining quota allocations, establishing trading system and rules, developing a registration system, setting up special administrative organs, establishing a market regulation system, training staff and enhancing the capacity building.
By the end of October 2014, the total trading volume of carbon dioxide in the carbon emissions trading markets of seven pilot provinces and cities reached 13.75 million tons of CO2 and the turnover was more than RMB 500 million. A total of 15.21 million tons of carbon quota have been sold at auction for RMB 760 million (China's Policies and Actions on Climate Change, 2014).
Other market-based innovations
There are two domestic market-based innovations in India: Renewable Energy Certificates (REC) trading system; and the Energy Saving Certificate (ESCerts) trading system. These are described below.
Renewable Energy Certificate (REC) in India:
According to the Power Exchange of India Limited (PXIL), an REC is a market-based instrument (Source: Power Exchange India Ltd.) which provides evidence that a generator has produced a certain amount of electricity from a renewable energy resource. The Electricity Act 2003, the policies framed under the Act, as also the National Action Plan on Climate Change (NAPCC) act as key policy drivers that provide a roadmap for increasing the share of renewable energy in the total generation capacity of the country. Thus, an REC signifies the environmental attribute of renewable energy.
RECs can be traded in the market to meet Renewable Purchase Obligation (RPO) which is mandated by the State Electricity Regulatory Commission (SERCs) and Central Electricity Regulatory Commission (CERC) (Terms for Issuance and Recognition of Renewable Energy Certificates for Renewable Energy Generation Regulations 2010). PXIL secured permission for trading in RECs in September 2010. The National Load Despatch Centre (NLDC) has been designated as the central agency for the REC scheme. Table 9 depicts the accredited renewable energy source break up under REC in terms of percentage of total capacity.
26 | P a g e

Discussion Paper Financing for Low Carbon Development in India
Table 9: Accredited Renewable Energy Source Break up Under REC (% of total capacity)
Renewable energy source Capacity (%share of total) Wind 49.18 Urban or municipal waste 0.16 Solar thermal 0.05 Solar PV 11.81 Small hydro 6.37 Others 0.03 Biomass 13.92 Bio-fuel cogeneration 18.46 Total 100
Source: Based on Renewable Energy Certificate Registry of India https://www.recregistryindia.nic.in; as on 5th May, 2015; Data until May 05, 2015
According to the Renewable Energy Certificate Registry of India, the total signed up RE generators till now is 2672 (Renewable Energy Certificate Registry of India, 2015). The REC market summary for the year 2015 until now is depicted in Table 10. It is seen that there is a gap between RECs issued and RECs redeemed.
Table 10: Renewable Energy Certificate (REC) Market Summary for 2015
Month, Year Opening balance REC issued REC redeemed Closing balance May, 2014 6968438 568843 31375 7505906 June, 2014 7505906 471982 141108 7836780 Jul, 2014 7836780 1485060 38442 9283398 Aug, 2014 9283398 702700 51844 9934254 Sep, 2014 9934254 859795 49013 10745036 Oct, 2014 10745036 1074046 94381 11724701 Nov, 2014 11724701 731207 222619 12233289 Dec, 2014 12233289 1087197 398182 12922304 Jan, 2015 12922304 411590 615234 12718660 Feb, 2015 12718660 593085 850103 12461642 Mar, 2015 12461642 453091 737510 12177223 Apr, 2015 12177223 810257 72697 12914783 Total: - 22651840 9737057 -
Source: Renewable Energy Certificate Registry of India https://www.recregistryindia.nic.in; as on 5th May, 2015
Energy Saving Certificates (ESCerts):
Energy Saving Certificates will be introduced in India under the Perform Achieve Trade scheme (PAT) propelled by the Bureau of Energy Efficiency (BEE) under the National Mission of Energy Efficiency (NMEE) of the National Action Plan on Climate Change. The genesis of the PAT mechanism comes from the Energy Conservation Act 2001. Eight energy-intensive industries have been selected (namely aluminium, cement, chor-alkali, fertilizer, iron and steel, pulp and paper, textiles, and thermal power plants). Each industry has three years to reach a Specific Energy Consumption (SEC) and will get ESCerts that can then be
27 | P a g e

Discussion Paper Financing for Low Carbon Development in India
sold to those who failed. With this mechanism, India hopes to unlock energy efficiency opportunities, estimated to be about INR 74,000 crore (approx. USD 12.33 billion), as well as avoid an electricity capacity addition of 19,000 MW and mitigate 98 million tonnes of CO2 emissions per year by 2014–15. The energy saving targets of 8 sectors covered under PAT cycle I (1st April, 2012 to 31st March, 2015) is 6.686 million toe distributed among 478 Designated Consumers (DCs). Under cycle II, the DCs undertake measures to reduce their energy consumption. Within three months of the end of the cycle I, they have to submit Performance Assessment Document to State Designated Agency and BEE. BEE then verifies the report and sends it to Accredited Energy Auditor. Currently the cycle II is underway following which ESCerts will be issued and trading can begin on electricity exchanges such as IEX. The EC Act details the notified industrial units and other establishments consuming more energy than the defined threshold energy consumption. The ESCerts will be issued by the Bureau of Energy Efficiency (BEE), Ministry of Power, Government of India to eligible DCs.
An ESCert is an instrument issued by an authorized body to a DC who guarantees that a stipulated amount of energy savings has been achieved under the PAT scheme. It is a tradable commodity that gives property rights over benefits created by energy saved above the baseline level. The monitoring and verification would be done by Designated Energy Auditors (DENA) who will be notified by BEE in due course. Table 11 depicts the authority and their action with regard to the process of issuing ESCerts.
Table 11: Authority and Action for Issuance of Energy Saving Certificates
Authority Action Energy Conservation Act 2001 • Determination of targeted designated consumers
Bureau of Energy Efficiency (BEE) • Computation of baseline • Determination of target reduction
Obligated entities • Installation of energy efficiency measures Designated energy auditors (DENA)
• Third party verification of savings by accredited auditors • Determination of savings
BEE and EESL (Energy Efficiency Services Limited)
• Certification of ESCerts eligible projects • Issuance of ESCerts
Power Exchange (PXIL and IEX) • Trading of ESCerts
BEE and EESL • Tracking ownership of ESCerts • Retirement of ESCerts
Source: Adapted from Bhattacharya and Kapoor (2012)
The important question for future policies for incubation is how existing market mechanisms on energy efficiency and renewable energy in India can be coordinated with an emissions trading system, especially to avoid double counting.
3.5 International Climate Finance
The international climate finance architecture comprises actors including the donor countries, recipient countries, multilateral organizations, bilateral organizations and the private sector. The architecture of international climate finance is depicted in Figure 3.
28 | P a g e

Discussion Paper Financing for Low Carbon Development in India
Figure 3: Architecture of international climate finance
Source: http://www.climatefundsupdate.org/about-climate-fund/global-finance-architecture
One such international fund established to provide deeply concessional funding to promote low-emission and climate resilient development in eligible developing countries is the Green Climate Fund (GCF). GCF was established on 11th December, 2010 in Cancun, Mexico. Under the UNFCCC, developed country heads of state formally committed to jointly mobilize USD 100 billion per year by 2020 to advance the global paradign shift towards low-emission and climate resilient development pathways (Green Climate Fund, 2014). GCF is a step taken to achieve that goal. It places equal emphasis on allocating its resouces for adaptation as well as mitigation. Total pledges of contributions to the fund is USD 10.2 billion equivalent so far. Till 30th April, 2015, USD 4 billion equivalent has been signed in contribution, representing 42% of the amount that was committed during the fund’s initial pledging conference in 2014 (UNFCCC, 2015). As soon as at least 50% of the total amount pledged at GCF’s High-Level Pledging Conference in Berlin in November, 2014 i.e. USD 4.7 billion equivalent is available, the Fund is authorized to allocate resources and start having any positive impact on the global climate.
Multilateral climate funds in India are anchored in the Ministry of Environment and Forests with the United Nations Development Programme (UNDP) and the World Bank being key implementing agencies.
Multilateral funds such as the Clean Technology Fund have been operational in India. The Ministry of Environment and Forests lists four supply side initiatives for Phase I financing under the Clean Technology Fund (CTFIPI, 2011); these include:
29 | P a g e

Discussion Paper Financing for Low Carbon Development in India
• Himachal Pradesh: Development Policy Loan on Environmental Sustainability and Climate Change
• Support for the National Mission for Enhanced Energy Efficiency (NMEEE) • Partial Risk Guarantee for Energy Efficiency Technologies • Support to the Jawaharlal Nehru National Solar Mission (JNNSM)
It can be seen that one initiative is also at the sub-national level while the other three are inclined towards the missions under the National Action Plan on Climate Change (NAPCC). International finance in climate and sustainability areas have sought to leverage and attract private finance. However, according to Climate Funds Update, as of the beginning of 2012, globally, for every USD 1 spent between 2010 and 2012, only USD 0.25 of private finance had been drawn. In terms of climate finance initiatives in India, there is also scope for private sector funding in a national climate fund.
3.6 Public–private partnerships
Effectively engaging the private sector is crucial to filling the financing gap for mitigation. Therefore, a mechanism is required to deploy limited public funds in such a manner that private low-carbon capital can be mobilized at scale. PPPs represent an option to augment the government’s infrastructure delivery standards.
At the national level, the Indian government has laid out a well-defined framework for undertaking PPP projects. The viability gap funding (VGF) mechanism, formation of the India Infrastructure Finance Corporation Limited (IIFCL), and the India Infrastructure Project Development Fund have been designed to meet specific requirements of PPP projects, and provide the framework and incentives for urban local governments to promote PPP.
The Union Cabinet in April, 2015 approved the Smart Cities Mission and the Atal Mission for Rejuvenation and Urban Transformation (AMRUT) with outlays of INR 48,000 crore (approx. USD 8 billion) and INR 50,000 crore (approx. USD 8.33 billion) respectively. Under Smart cities mission, government would give an assistance of INR 100 crore (approx. USD 16.67 million) per year for five years so that 100 smart cities to be developed promote adoption of smart solutions for efficient use of available assets, resources and infrastructure with the objective of enhancing the quality of urban life and providing clean and sustainable environment. But considering the enormous amount of infrastructure needed to raise such cities, INR 100 crore is a small amount and there would be substantial efforts would be needed to supplement city development with other sources of financing. The Smart Cities project is expected to be achieved through active public private participation wherein the government will provide VGF and act as facilitator (Prime Minister's Office, 2015). In addition, the second phase of the Jawaharlal Nehru National Urban Renewal Mission (JNNURM), renamed as AMRUT, which is a 10-year programme slated to rejuvenate 500 towns and cities, led by the Ministry of Urban Development, Government of India is also expected to promote PPPs in urban India. Minimum investment of over INR 2 lakh crore (approx. USD 33.33 billion) would flow into urban areas over the next five years for promoting urban reforms. It is envisaged that to meet this massive requirement, substantial private investment will have to be mobilised by states and urban local bodies through PPP model as required to meet the project cost.
30 | P a g e

Discussion Paper Financing for Low Carbon Development in India
PPP mechanisms in India utilize a number of public finance instruments that can help remove barriers to private investment. The policy rationale for PPP, in India, is often limited to the use of PPPs as a source of investment capital when the public sector lacks fund. Consequently, on ground, they seldom deliver efficient service and value for consumers and taxpayers. The instruments in PPPs include loan guarantees, which allow lower interest rates for borrowers as the lender is protected against default; mixed equity funds, which lower the risks for private equity investors by subordinating the public capital in the fund, thus giving private investors their returns first and again protecting against the risk of project default or lower than expected financial performance (KPMG 2011).
Current Finance Minister of India, Mr. Arun Jaitley, during his Union Budget 2014-15 speech (Ministry of Finance, 2014), had mentioned that India has emerged as the largest PPP market in the world with over 900 projects in various stages of development. However, weaknesses of the PPP framework have also been quite evident. Delays in 110 central infrastructure projects due to regulatory hurdles have resulted in over INR 1.57 lakh crore (approx. USD 26.17 billion) cost overruns (Outlook India, 2014).
Private sector has called for improvement in India’s enabling environment including transparency in the bidding process, standardization of procurement procedures and transparency in the entire PPP project cycle. For public private partnerships to work, both sectors need to work collectively and keep the focus on project and outcomes rather than fulfilling self-interests (Nataraj, 2007). There is need to build capacity for evaluation and oversight. Set of policy, regulatory and capacity issues need to be addressed to use PPPs more widely for better infrastructure service delivery (World Bank, 2006).
3.7 Philanthrophy
The private sector’s participation through financial and technical contribution in India is through corporate social responsibility (CSR) and philanthrophy. The Companies Act of 2013 mandates that a company having net worth of rupees five hundred crore or more (approx. USD 83.33 million or more), or turnover of rupees one thousand crore or more (approx. USD 166.67 million) or a net profit of rupees five crore or more (approx USD 0.83 million or more) during any financial year shall constitute a Corporate Social Responsibility Committee to impement CSR activities.
According to the World Giving Index Report5 of 2014, India ranked 52nd in terms of donating money to charity; overall, India ranks 69th. Table 12 lists philanthropic causes and contribution in India for the year 2014. It is seen that philanthropic contribution for the cause of environment is negligible (0.06% of total philanthropic contribution) for the year 2013-14. It can be thus said that there is wide scope for activities around environmental sustainability in terms of both CSR and philanthropic activities.
5The World Giving Index (WGI) was compiled by the Charities Aid Foundation, using data gathered by Gallup, and ranks 153 countries in the world according to how charitable their populations are.
31 | P a g e

Discussion Paper Financing for Low Carbon Development in India
Table 12: Philanthropic Causes and Contribution in India (2013-14)
Rank Cause Total contribution
(INR Crores) Total contribution
(USD million) % (total) 1 Education 15,791 2361.83 78.89 2 Social & rural development 2,333 388.83 12.98 3 Healthcare 1,447 241.12 8.05 4 Environmental protection 12 2 0.07
Total = 19,583 2993.78 100.00 Note: Values are rounded, and past figures are subjected to exchange rate fluctuations.
1 USD = INR 60. Source: Hurun India Philanthropy List 2014; available from http://www.hurun.net/EN/ArticleShow.aspx?nid=9583 accessed on 5th May, 2015
32 | P a g e

Discussion Paper Financing for Low Carbon Development in India
4. LCD Sectors and Finance Finance plays a crucial role in resource allocation towards an economic activity. The role of finance is no different in economic activities concerning low-carbon development. However, the challenges are far greater. A study (IDFC 2010) suggests that the lack of familiarity of financial institutions to low-carbon space and consequently, the inability to assess risks make financing of low-carbon space difficult and inadequate. It adds that there is a prevalence of high transactions costs in such activities, which also require initial high capital outlays and long payback periods. The tendency of financial institutions to ask for recourse finance and the absence of specific funds for low-carbon space make the challenge even more daunting. These add to making economic activities concerning low-carbon development extremely policy dependent. With public finance becoming ever scarce, and the demand for public finance for other strategic areas increasing, low-carbon space may be found wanting for more. The silver lining however is that, for India, for energy security reasons, renewable energy and energy efficiency projects have become an important area of engagement. Renewable energy initiatives are showing promising results in terms of financial resource allocation, particularly as investments are helped by proactive policy making.
While it is difficult to have an overall figure for financial allocations towards low-carbon space, it is possible to get sector-specific figures or trends. We will later on in this chapter seek to understand the financial scenario of nine sectors relevant to low-carbon development. Financial indicators and case studies are a part of the sectoral overview. The quantum of public finance allocations or the closest approximate of that figure or trend is given. Moreover each sector analysis tries to see if there are financial indicators other than public finance indicators which can help to understand the trends in low-carbon development in those sectors. It must be emphasized investment grade finance is as important as public finance.
4.1 Renewable Energy
Renewable energy resources are, by definition, non-exhausting and clean energy sources. According to the Ministry of New and Renewable Energy, energy generation based on biomass, wind, hydropower (Small Hydro Power (SHP) projects up to 25 MW), solar, geothermal, and tidal are renewable energy sources. India has an estimated renewable energy potential of about 900 GW from commercially exploitable sources viz. Wind – 100 GW (at 80 metre mast height); Small Hydro – 20 GW; Bio-energy – 25 GW; and 750 GW solar power, assuming 3% wasteland is made available (MNRE 2015). Concerns about sustainable development, energy security, access to energy and adverse impact of climate change are major drivers for the Government of India to accelerate the deployment of renewable energy harnessing technologies.
At a global level, renewable energy investments have had a very interesting growth story as Figure 4 explains. The figures are for new investments in renewable energy. The projected growth in RE investments is also noteworthy. The compounded annual growth rate (CAGR) for the total new investment in the renewable energy sector was 20% for 2004-14. In 2014, the global investment in renewable power & fuels (excluding large hydro-electric projects) was USD 270.2 billion which is nearly 17% higher than the previous year; it was also the first increase in the last three years and reflected influences from investments in China, Japan and Europe.
33 | P a g e

Discussion Paper Financing for Low Carbon Development in India
In terms of new financial investments in clean energy in 2014 (Table 13), Asia was the leader in clean energy investments ahead of North America and Europe. 2014 also witnessed the continuing spread of renewable energy to new markets. Investment in developing countries, at USD 131.3 billion, was up by 36% over the previous year and came closest ever to beating the total for developed economies, at USD 138.9 billion, up just 3% on the year. It can be deciphered that the emerging economies have seized the importance of renewable energy investments. BNEF (2012) also found that with improvements in technology in solar energy and cost reduction, India and China will reach grid parity for solar electricity by 2025.
Figure 4: Global New Investment in Renewable Energy by Asset Class, 2004–2014 (USD billion)
Source: Compiled from BNEF (2015)
Table 13: Global New Investment in Renewable Energy by Region, 2004–2014 (USD billion)
Region/ Country 2004 2005 2006 2007 2008 2009 2010 2011 2012 2013 2014 United States 5.4 11.6 29.1 33.0 35.1 24.3 35.1 50.0 38.2 36.0 38.3 Brazil 0.8 3.1 5.2 11.8 12.1 7.9 7.7 10.1 7.2 3.9 7.6 AMER (excl. US & Brazil 1.7 3.3 3.9 5.0 5.8 5.8 12.2 9.2 10.2 12.2 14.8 Europe 23.6 33.6 46.7 66.4 81.6 81.2 111.1 120.7 89.6 57.3 57.5 Middle East & Africa 0.6 0.8 1.1 2.4 2.3 1.7 4.2 2.9 10.4 8.7 12.6 China 3.0 8.2 11.1 16.6 25.7 39.5 38.7 49.1 62.8 62.6 83.3 India 2.7 3.1 4.9 6.3 5.6 4.3 9.0 12.7 7.4 6.4 7.4 ASOC (excl. China & India) 7.2 9.2 10.0 12.5 13.6 13.7 19.3 24.1 30.5 44.7 48.7 Total 45.1 72.9 112.1 153.9 181.8 178.5 237.2 278.8 256.4 231.8 270.2
Source: Compiled from BNEF (2015)
0
50
100
150
200
250
300
2004 2005 2006 2007 2008 2009 2010 2011 2012 2013 2014
Asset Finance
Small Distributed Capacity
Public Markets
VC/PE
Government R&D
Corporate R&D
34 | P a g e

Discussion Paper Financing for Low Carbon Development in India
Table 13 outlines the global investment flows into RE over the years. A country-wise break-up is also shown.
It can be observed that China had a CAGR of the ten year investment in renewable energy of 39.43% (USD 3.0 Billion to USD 83.3 billion) and India had a CAGR of 10.61% (USD 2.7 billion to USD 7.4 billion) in renewable energy investment during the same period. For India, there was a steady increase from 2004 to 2011 but it declined in 2012 & 2013. However, investment in RE sector has caught up again with setting up of massive renewable power production of 175 GW by 2022.
The Government of India and the state governments have been promoting the use of renewable energy technologies through a variety of promotional schemes, policies, and regulatory measures. Some of the measures such as capital subsidies to users and manufacturers, low interest loans, duties and taxes exemptions, and net metering form part of the fiscal and financial incentives. While other mandatory initiatives such as renewable energy purchase obligations are part of the regulatory measures.
Other methods of revenue creation for RE developers include tax incentives like accelerated depreciation while others are public finance based incentives like generation based incentives. It should be noted that the financial and business models are dependent primarily on granular details very specific to the project sites, the state (or province), and the kind of RE in question like wind, solar or any other type. There can also be independent power purchase agreements (PPAs) which can be beneficial to both RE developers and obligated buyers. A list of policies and regulations concerning renewable energy is given in Table 14.
Table 14: Policy Instruments for Renewable Energy in India Capital subsidies To popularize the use of solar water heating and solar lighting equipment in
homes, MNRE offers suitable incentives in form of capital subsidies for purchase and installation of solar equipment which results in their reduced cost. MNRE has previously been running similar capital subsidy schemes to promote small capacity SPV systems under JNNSM.
Low interest loans Lending at concessional rates is beneficial to bring down the cost of funds for RE projects, One such instrument is being provided under IREDA NCEF Refinance Scheme in which scheduled commercial banks and FIs are eligible for refinance from IREDA with funds sourced from NCEF. With several organizations showing willingness to raise low-cost and long term funds by selling tax-free bonds, the lending to RE developers should come at lower interest rates.
Taxes and duties exemption
To accelerate generation of RE, Government of India has either exempted or reduced various duties on the machinery, equipment and other associated components involved in renewable energy generation. Undertakings engaged in generation/ distribution of RE have been offered a 10-year holiday as well.
Renewable Purchase Obligations
RPOs (Renewable Purchase Obligations) are part of the government’s policy initiatives wherein the government is making it mandatory for power consumers to buy a certain percentage of its required power consumption from power produced using renewable energy sources. These obligations are for utilities (also known as DISCOMs—Distribution Companies) and consumers who use captive power or who buy power from generators directly and not through utilities. The RPOs are part of the Electricity Act 2003 (EA 2003) which is the basis for the development of the regulatory framework in the power sector in India.
Preferential tariff scheme/Feed in Tariff
Under the preferential tariff scheme (also known as Feed in Tariff), the utilities or central agency appointed by the government buys renewable electricity at a preferential tariff decided by the regulatory commission. This tariff is designed
35 | P a g e

Discussion Paper Financing for Low Carbon Development in India
to give the required return on investment for RE generators without putting a strain on the government or consumers.
Net metering Net metering allows a solar PV user to sell surplus solar energy generated to the utility and get compensated for that or buyback the deficit energy from the utility. The net import of electricity will be chargeable to the consumer. Net metering can increase the energy in the grid and make-up for the peak hour demand helping states facing power shortages.
Renewable Energy Certificate Scheme
Renewable energy resources, such as wind, or solar, are not equally distributed across India. Moreover, small states like Delhi do not have areas to tap enough renewable energy resources. This would lead to unequal distribution of obligations. To avoid this situation, CERC (Central Electricity Regulatory Commission) has introduced the REC (Renewable Energy Certificate) scheme wherein, the renewable energy generator can sell electricity at a price decided by the respective regulatory commission. The REC registry issues one REC for each MWh of electricity sold. The certificate can then be purchased by the obligated entities that are not able to buy renewable electricity directly.
Accelerated depreciation
Accelerated depreciation is a useful tool for deferring corporate income taxes by reducing taxable income in current years by considering the amount of depreciation each year as higher during the pioneering years of an asset’s life. Reintroduction of AD, which was withdrawn in 2012, is already giving a significant fillip to wind energy generation.
Generation Based Incentives
GBI incentivises actual generation of power. The GBI scheme for Grid Interactive Wind Power projects was extended in 2013 for the whole 12th Plan period. Under this scheme, INR 0.50 is provided to wind electricity producers per unit of electricity fed into the grid for a period not less than 4 years and a maximum of 10 years with a cap of INR 100 lakh per MW. The total disbursement in a year will not exceed one-fourth of the maximum limit of the incentive.
Source: Self compiled
Figure 5 gives a summary of the options available for RE developers and the buyers (distribution companies).
Figure 5: Options Available for Distribution Companies and Renewable Energy Generators
Source: CPI and ISB (2013)
Given the importance of renewable energy, there have been various innovations and one such policy innovation is captured later on in this section in a short case study on the concept of ‘solar cities’ in India (see Box 3).
Distribution companies
•Meet RPO by self generation •Purchase renewable energy power from third parties
•Purchase RECs
Renewable energy generators
•Sell renewable energy power at Feed in Tariff
•Sell renewable energy power at Average Pooled Purchase Cost (APPC) and RECs and the REC market
•Contract directly with obligated entities through power purchase agreements
36 | P a g e

Discussion Paper Financing for Low Carbon Development in India
Currently available business models for RE generators are as follows:
• Sale to utility at preferential tariff/ feed in tariff (RPOs cannot be met in this method) • Sale of power under REC scheme (RPOs can be met) • Captive power consumption (RPOs can be met)
Box 3: Solar Cities in India
Rapid urbanization is increasing the demand for power quite drastically in India. The conventional system is not keeping pace with the energy demand. Therefore, the concept of ‘solar cities’ fit the Indian context well. The Ministry of New and Renewable Energy launched the ‘Solar Cities’ programme (sometimes also referred to as Green Cities) which aims to support and encourage urban local bodies (ULBs) to prepare a roadmap to guide their cities in becoming ‘solar cities’ (TEDDY 2012). Under the scheme, 60 cities/ towns are proposed to be supported for development as ‘Solar/ Green Cities’. According to the Status Note on Solar Cities by MNRE, till 15th January, 2015, 48 cities have been issued the sanctions, out of which 44 have prepared their master plans, 7 have been given ‘in-principle’ approvals after which their respective corporations/ state nodal agencies are in the process of engaging consultants for preparation of master plans. 18 cities have also provided their Detailed Project Reports (DPRs) which are under consideration. Chandigarh is one such designated solar city. A sum of INR 16.25 crore had been allocated to the union territory administration for implementing the Model Solar City Programme in financial year 2013-14. According to Mr. Santosh Kumar, CEO of Chandigarh Renewable Energy, Science and Technology (CREST), overall capacity of 5 MWp rooftop SPV plants have been commissioned on more than 75 government buildings of UT Chandigarh and the UT administration has also decided to enhance its solar energy target to 30 MW by 2022 from the earlier target of 10 MW. Though at the moment, Chandigarh’s financial allocation is completely public financed, private investments can soon find its way in the solar cities programmes across India. Urban areas of India have the financial resources to absorb the risks of trying out new technologies such as the ones envisaged in solar cities. Learning may be drawn with mobile telephones in India. Though mobile phones are now all pervasive and can be found in every corner of India, they were first deployed in urban areas. Urban areas may well be the necessary platform for solar projects to be implementable on a large scale throughout India.
4.2 Non-renewable Energy
India’s installed electricity generation capacity reached 272.7 GW in 2015 (CEA 2015). The share of the different resources in India’s installed capacity is given in Figure 2.5. Power generation is the single largest source of CO2 emissions in India and thermal power plants are the single largest sources of these emissions (Figure 6). India is and will remain dependant on thermal power plants for quite some time. Coal, in particular, is expected to remain the mainstay of India’s power sector in the near future, with most of the 100 GW of power capacity addition planned in the Twelfth Five Year Plan (2012–17) coming from coal-based power. With respect to low-carbon development strategies, all future capacity addition is expected to be increasingly based on super-critical technology, with fifty per cent of the capacity in the Twelfth Plan period targeted to be through super-critical units, and all coal-based plants in the Thirteenth plan period to be based on super-critical technology (GoI 2010; TERI 2013).
37 | P a g e

Discussion Paper Financing for Low Carbon Development in India
Figure 6: India’s Installed Electricity Generation by Type
Source: CEA (2015)
In keeping with the requirement of providing additional power, sixteen super-critical technology-based Ultra Mega Power Plants (UMPPs) (PFC 2012; TERI 2013), each generating about 4000 MW, have been prioritized as a thrust area by the Indian Ministry of Power in 2005-06. These UMPPs will be of two types—either pithead projects with dedicated captive coal blocks, or coastal projects using imported coal. Nine such projects have been identified to be taken up. They are awarded to developers under the tariff-based competitive bidding path on a build, own and operate basis. The Power Finance Corporation (PFC), which is the nodal agency for the development of these projects, sets up (as is the procedure) Special Purpose Vehicles (SPVs) for each UMPP to act as authorised representatives of the procuring distribution companies. Once the bidding process for selection of the project developer is completed, the SPVs are transferred to the selected bidders.
Given that there will be a continued dependence on coal-based thermal power plants, low-carbon development pathways will depend on two things specifically for coal-based power plants—-first, the use of super-critical technologies or better; second, as a pure mitigation action, the deployment of carbon capture and sequestration. Carbon Capture and Sequestration/Storage (CCS) refers to “the separation of CO2 from industrial and energy-related sources, transport to a storage location and long-term isolation from the atmosphere” (IPCC 2005). It is one among the portfolio of measures being considered for reducing Greenhouse Gas (GHG) emissions with a view to mitigating climate change. While no single measure may alone be sufficient for climate change mitigation, CCS, along with energy efficiency improvements, renewable energy, enhancement of biological sinks, and other measures, may be able to achieve the emissions reductions needed to achieve climate stabilization.
While there are various methods of arriving at the costs of CCS, according to a scoping study (TERI 2013), the most important financial indicators are not the absolute values of costs but the increase in the cost of electricity entailed as a result of CCS activity. It should also be
38 | P a g e
Nuclear 2.12%
Hydro 15.27%
Non-hydro renewable
13.12%
Coal 60.60%
Gas 8.46%
Diesel 0.44%
Thermal 69.50%

Discussion Paper Financing for Low Carbon Development in India
noted that the costs of CCS are very specific to projects. Therefore, average values will not be a good indicator. CCS deployment makes most sense in case of large thermal power plants or other large point emission sources, but since no such CCS project exists in India, a normative case was considered of a UMPP. Other than the variety of coal, all other plant specifications were considered to remain the same. In Table 15, we can see a fifty per cent increase in the cost of electricity with CCS. A monitoring cost was also incorporated in this study. The other cost heads for CCS were standard costs of capture, transport and storage.
Table 15: Cost of Electricity with CCS for Imported Coal and Indian Coal
Indicator Imported coal Indian coal CoE without capture (Rs/kWh) 5.26 4.84 CoE with capture (Rs/kWh) 7.52 6.97 CoE with CCS (Rs/kWh) 7.67 7.12 CoE with CCS and monitoring (Rs/kWh) 7.98 7.43 Increase in CoE due to CCS and monitoring 52% 53%
Source: TERI (2013)
4.3 Transportation
According to the International Energy Agency (IEA), the transport sector contributed approximately 23% of the global CO2 emissions due to fuel combustion in 2012. The fast emission growth in transport is driven largely by emissions from the road sector. Transport sector in India contributed 216.2 million tonnes of CO2 in 2012 which is nearly 11% of its total CO2 emissions from fuel combustion (IEA, 2014).
Looking for trends in financing low-carbon development in the transport sector is a challenge. This is because defining low-carbon space for transport is difficult. One good area for trends is to look at financial indicators for public transport in urban areas. It might not be necessary to look into rural areas in India as rural transport by all parameters is low carbon. Moreover, rural areas which are seeing rapid development into mechanized transport might have moved from rural to urban areas. Another thing to note will be that currently, in India, car ownership is extremely low; although, the ownership will increase significantly in urban areas in the future (MoUD 2008). From the observation of trends of financial indicators in the low carbon space for transport in India, two aspects emerge—first, public transport in urban areas and second, low-carbon space in non-public modes of travel (electric vehicles,- EVs).
The National Electric Mobility Plan (NEMMP-2020) released in January 2013 laid down an aspirational target of 6-7 million hybrid and electric vehicles per year by 2020. Based on this target, the Union Minister of Heavy Industries and Public Enterprises in April 2015 launched a scheme for Faster Adoption and Manufacturing of (Hybrid &) Electric Vehicles (FAME), India with an outlay of INR 795 crore (approx. USD 132.5 million) for its phase I (2015-17). This will cover all forms of hybrid (Mild/ Strong/ Plug-in) and pure electric vehicles. The broad range of demand incentive available for different categories of vehicles can be found in the table 16 below:
39 | P a g e

Discussion Paper Financing for Low Carbon Development in India
Table 16: Demand incentive available for different categories of vehicles under FAME
Vehicle Segment Minimum incentive (INR) Maximum incentive (INR)
2 wheeler scooter 1,800 22,000
Motorcycle 3,500 29,000
3 wheeler auto-rickshaw 3,300 61,000
4 wheeler cars 11,000 1,38,000
LCVs 17,000 1,87,000
Bus 30,00,000 66,00,000
Retro fitment category 15% or INR 30,000 if reduction in fuel consumption is 10-30%
30% of kit price or INR 90,000 if reduction in fuel consumption is more than 30%
Source: Ministry of Heavy Industries & Public Enterprises, Government of India, 2015
Noting that urban areas and urban population in India are both increasing, the need for sustainable public transport is also high. The financial cost estimated by the Ministry of Urban Development was INR 4353.8 billion (approx. USD 87 billion). This estimate covered 87 cities (MoUD 2008). More recent investment requirements as estimated by the urban ministry are given in Table 17.
Table 17: Financing Required for Public Transport during the Twelfth Five Year Plan Period (2012–17)
Public transport INR crores USD million (approx.) Buses 13759 2293 Bus rapid transit system 29603 4934 Metro rail 130726 21787 Commuter/ regional rail 19780 3296 Bus infrastructure 8760 1460 Total 202628 33771
Source: MoUD (2011)
The important challenge with respect to finance can be broken into two parts. First, figuring out the sources of finance; and second, given that most of these projects will need substantial amounts of capital, each project might have multiple sources of financing which in turn would need co-ordination. This co-ordination has become popular under the name ‘public–private partnerships’ (PPPs). These two aspects will be discussed in more detail in the following section.
40 | P a g e
Discussion Paper Financing for Low Carbon Development in India
Traditionally, the urban public transport was funded by the government. Part of the finance was made available from the central government and then the state government, and finally the urban local body. However, this form of financing—a traditional public finance method—is fast being replaced by PPPs.
Other sources are multilateral agencies like the World Bank, the global environment fund (GEF) and bilateral agencies like the Japan International Cooperation Agency (JICA). Of course, the private sector itself is also a source of finance and predominantly as an equity player. There has been an increase in structured finance in this sector, with various financial institutions pitching in with various financial products like subordinated debt, that is, mezzanine financing, commercial exploitation of land and air rights over land used for transport infrastructure and enhanced levies on real estate projects near these transport infrastructure projects. All this is to create a method by which positive externalities can be monetized.
As explained earlier, evolving space for financing public infrastructure needs a framework where divergent sources of finance can combine together to create synergies in providing public infrastructure which is efficient, robust, and long term.
JNNURM phase I, which ended in 2014, is a good example of the government acknowledging the need to address issues associated with urbanization. However, while assessing the method, it is important to look at how JNNURM has fared. According to the Ministry of Urban Development, Government of India, till 31st March, 2014, only 42.19% i.e. 227 of the total sanctioned projects (538) in India could get completed. A major criticism of JNNURM has been that it has followed a structure of a PPP model which has failed to deliver. However, it is also important to understand the reasons behind the failure of PPP. It may be reasonable to say that there is no tool to understand the financial implications of public finance and investment-grade finance involved in a common framework; nor is there one to understand financial returns and also the implications for sustainability. It is hence important to fully understand the interactions within PPP as a business model.
4.4 Buildings
A burgeoning population, escalating economic development and internal migration to urban centres from rural areas has resulted in India’s cities bursting at the seams. The cities are also plagued with numerous environmental problems which negatively impact the health and well-being of its residents. Contiguously, the increasing scarcity of environmental resources has transformed them into economic goods, with people willing to pay more for better environmental quality. One of the sectors where environmental quality is explicitly traded is real estate; buyers bid up the prices of residential properties that enjoy proximity to and/or have a provision for facilities that reduce environmental pollution and wastage (energy efficiency, water conservation and waste management processes).
A green building refers to a building created by using processes that are environmentally responsible and that is resource-efficient throughout its life cycle. This requires the close cooperation of various stakeholders involved in the creation of the green building comprising the design team, the architects, the engineers, and the client, at all stages of the project. In India, there are mainly two rating systems for green buildings, namely GRIHA (Green Rating for Integrated Habitat Assessment), and LEED (Leadership in Energy and Environmental
41 | P a g e
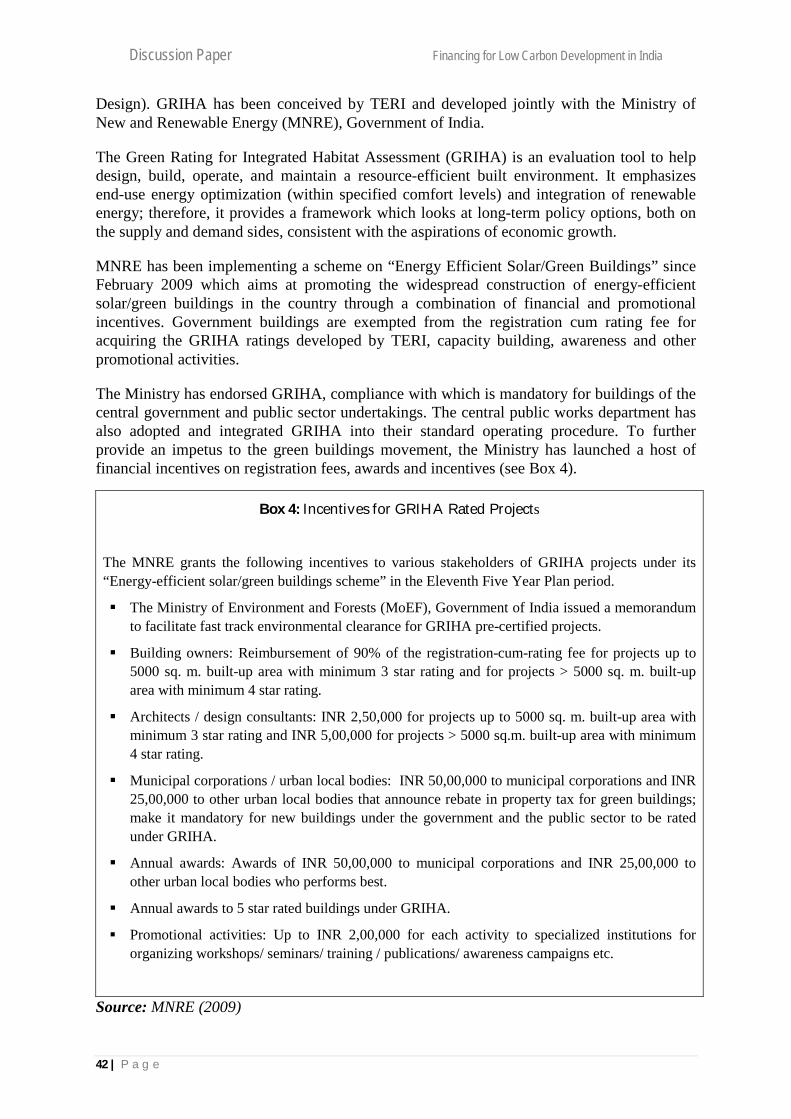
Discussion Paper Financing for Low Carbon Development in India
Design). GRIHA has been conceived by TERI and developed jointly with the Ministry of New and Renewable Energy (MNRE), Government of India.
The Green Rating for Integrated Habitat Assessment (GRIHA) is an evaluation tool to help design, build, operate, and maintain a resource-efficient built environment. It emphasizes end-use energy optimization (within specified comfort levels) and integration of renewable energy; therefore, it provides a framework which looks at long-term policy options, both on the supply and demand sides, consistent with the aspirations of economic growth.
MNRE has been implementing a scheme on “Energy Efficient Solar/Green Buildings” since February 2009 which aims at promoting the widespread construction of energy-efficient solar/green buildings in the country through a combination of financial and promotional incentives. Government buildings are exempted from the registration cum rating fee for acquiring the GRIHA ratings developed by TERI, capacity building, awareness and other promotional activities.
The Ministry has endorsed GRIHA, compliance with which is mandatory for buildings of the central government and public sector undertakings. The central public works department has also adopted and integrated GRIHA into their standard operating procedure. To further provide an impetus to the green buildings movement, the Ministry has launched a host of financial incentives on registration fees, awards and incentives (see Box 4).
Box 4: Incentives for GRIHA Rated Projects
The MNRE grants the following incentives to various stakeholders of GRIHA projects under its “Energy-efficient solar/green buildings scheme” in the Eleventh Five Year Plan period.
The Ministry of Environment and Forests (MoEF), Government of India issued a memorandum to facilitate fast track environmental clearance for GRIHA pre-certified projects.
Building owners: Reimbursement of 90% of the registration-cum-rating fee for projects up to 5000 sq. m. built-up area with minimum 3 star rating and for projects > 5000 sq. m. built-up area with minimum 4 star rating.
Architects / design consultants: INR 2,50,000 for projects up to 5000 sq. m. built-up area with minimum 3 star rating and INR 5,00,000 for projects > 5000 sq.m. built-up area with minimum 4 star rating.
Municipal corporations / urban local bodies: INR 50,00,000 to municipal corporations and INR 25,00,000 to other urban local bodies that announce rebate in property tax for green buildings; make it mandatory for new buildings under the government and the public sector to be rated under GRIHA.
Annual awards: Awards of INR 50,00,000 to municipal corporations and INR 25,00,000 to other urban local bodies who performs best.
Annual awards to 5 star rated buildings under GRIHA.
Promotional activities: Up to INR 2,00,000 for each activity to specialized institutions for organizing workshops/ seminars/ training / publications/ awareness campaigns etc.
Source: MNRE (2009)
42 | P a g e

Discussion Paper Financing for Low Carbon Development in India
Since buildings account for 40 per cent of the greenhouse gas emissions worldwide, the realty sector has the greatest potential for reducing emissions. Currently, 20 projects are under way in Pune and the Pimpri Chinchwad Municipal Corporation (see Box 5), which incidentally, has made it mandatory for all new projects to conform to GRIHA.
Box 5: Initiatives by Pimpri-Chinchwad Municipal Corporation for Green Buildings
The Pimpri-Chinchwad Municipal Corporation has decided to grant rebate in property tax for GRIHA rated buildings. The developers in Pimpri Chinchwad Municipal Corporation will get the following discounts on the premium amount of building permission charges, as per the rating awarded by GRIHA.
Points scored Rating Discount in premium 50–60 1 10% 61–70 2 20% 71–80 3 30% 81–90 4 40% 91–100 5 50%
Moreover, once the construction is complete, the developer will hand over the green building to flat owners, and the flat owners of the green building will get a discount of 5-10% on property tax.
Source: GRIHA (2012)
There are other forms of incentives as well. In March, 2009, the State Bank of India (SBI) announced various incentives (Table 18) under green home loans.
Table 18: Financial Incentives Given by SBI for Green Home Loan
Product feature Values for SBI Green Home Loan
Margin 5% less than the margin stipulated for ordinary SBI home loan, subject to the condition that the margin does not go below 15% under any condition
Interest rate 0.25% concession (Instead of 0.10% being offered presently); maximum cumulative interest rate concession will be within the ceiling prescribed from time to time (presently 0.25%)
Note: Concession shall not be applicable on the 8% interest rate under the SBI Happy Home Loan Offer, nor the 8.5% and 9.25% rates under the SBI Special Loan Offer
Source: GRIHA (2012)
The Ministry of Environment and Forests (MoEF) in 2011 has given special consideration to pre-certified LEED India and GRIHA projects by having a separate queue for clearance. This is supposedly with the assurance that green rating agencies have carried out the due diligence of these project designs and will be accountable for the environmental performance of such projects. However, pre-certification is only a pledge and there is no legal provision for requiring the project proponents to achieve the level of rating promised in the pre-certification application.
4.5 Demand Side Management
The Energy Conservation Act 2001 provides the legal framework, institutional, and regulatory mechanism for energy efficiency initiatives in India at both the national and sub-national level. The Act led to the formation of the Bureau of Energy Efficiency (BEE) to
43 | P a g e

Discussion Paper Financing for Low Carbon Development in India
implement the provisions of the Act in the form of new policies on energy conservation and energy efficiency. The State Energy Conservation Fund (SECF) which is required to be constituted at the sub-national level was set up under section 16 of the Energy Conservation Act with the objective of promoting energy conservation and energy efficiency within the state. SECF was established in the 11th five-year plan with an outlay of INR 66 crore and is continuing in the 12th five-year plan with a budget outlay of INR 50 crore. Till date, 26 states have constituted SECF out of which 16 have also provided matching contribution and an amount of INR 82 crore has been disbursed under the SECF scheme (Ministry of Power, 2015).
Despite being technically and economically viable, certain Demand Side Management (DSM) programmes do not get implemented due to lack of adequate finance. Power utility companies in India are often reluctant to undertake DSM measures because of the uncertain nature of the outcomes and the difficulty in arranging necessary funding. Some of the barriers in implementing DSM measures in India include lack of necessary institutional capacity and funds, lack of clarity about baseline data and monitoring and verification (M&V) protocol, and non-availability of financing options to develop a practical approach for undertaking energy efficiency and demand side management initiatives. Thus, regulatory interventions to ensure adequate funding for design, development, and implementation of DSM initiatives by utility companies are essential.
Currently, the tariff regulation for determining the Aggregate Revenue Requirement (ARR) in India does not have an exclusive provision under which the state utilities can book the expenses incurred by it for various DSM initiatives. The State Commission could consider providing suitable provisions under the tariff regulations to allow recovery of DSM related expenditure as part of the ARR. This would create the necessary funding for the design and implementation of DSM initiatives by the states. For instance, a certain percentage of the ARR could be utilized for DSM programmes—this percentage could be worked out on the basis of the indicated savings from the power purchase costs and peak clipping. In this way, the utility will be certain of recovering the costs through consumer tariffs, and will therefore not be reluctant to undertake DSM measures which would benefit the state.
Financing many of the DSM initiatives through commercial banks remains challenging, as they often do not meet the standard investment criteria, such as collateral requirements. Energy Service Companies (ESCOs) can be helpful here. An ESCO provides a wide range of comprehensive energy solutions to the client company/utility which includes design and implementation of energy savings projects, energy infrastructure outsourcing, and risk management. The ESCO typically signs a contract with the client company/utility to finance and implement DSM projects; it may borrow the amount required for the project and repay it from project revenues which it gets back over the contract period. In case a project does not provide returns on the investment, the ESCO is responsible for paying the difference. The different energy services that ESCOs provide include energy audits, energy management, energy or equipment supply, etc. to the client company/utility. ESCOs may also provide or arrange financing. A full-service ESCO business model includes designing, financing and implementation of the project. Here the ESCO verifies energy savings and shares an agreed percentage of the actual energy savings over a fixed period with the client company/utility.
Leasing or vendor financing are viable financing options for many energy efficiency projects and DSM initiatives. A special fund to provide equity capital for these projects is now available through the Venture Capital Fund for Energy Efficiency (VCFEE) under the
44 | P a g e
Discussion Paper Financing for Low Carbon Development in India
National Mission for Enhanced Energy Efficiency (NMEEE). This fund invests in the form of equity. A single investment by the fund does not exceed INR 2 crores (approx. USD 0.33 million). The fund provides last mile equity support to specific energy efficiency projects and is limited to INR 2 crores or a maximum of 15% of the total equity required through Special Purpose Vehicles (SPVs), whichever is less. However, during XII plan, revision of rules and its notification is under process to slightly modify the operational structure of the VCFEE (Kanwal, 2015).
NMEEE has been adopted by India for the role it is expected to play in meeting the country’s energy demands. The Mission seeks to promote market-based approaches to unlock the potential of energy efficiency, which is estimated to be about INR 74,000 crores (approx. USD 12.33 billion). It will help achieve fuel savings of around 23 million tonnes per year, total carbon dioxide gas emissions reductions of 98 million tonnes per year, and avoid capacity addition of 19,000 MW by 2014–15 (Bureau of Energy Efficiency).
The Energy Efficiency Financing Platform (EEFP) is one of the four initiatives under NMEEE. Some of the key objectives of this initiative include: to ensure availability of finance at reasonable rates for energy efficiency project implementation by including financial institutions, and public and private sector banks; help stimulate necessary funding for ESCOs based delivery mechanisms for energy efficiency; create demand for energy efficiency products, goods and services through awareness, public policy; ensure credible monitoring and verification protocols to capture energy savings; and capacity building of banks and financial institutions.
Another initiative by the Government of India to develop fiscal instruments to promote energy efficiency is the Framework for Energy-Efficient Economic Development (FEED). This includes innovative fiscal instruments and policy measures like the Partial Risk Guarantee Fund (PRGF) and the Venture Capital Fund for Energy Efficiency (VCFEE), public procurement of energy efficient goods and services, and utility based demand side management. FEED supports electricity regulatory commissions to stimulate utility based demand side management by incentivizing utilities for DSM including time-of-day tariffs and load management directives. It also develops guidelines for evaluating DSM options and integrating these with supply side options. FEED provides tax exemptions for promotion of energy-efficient appliances by promoting income and corporate tax incentives for ESCOs/venture capital funds in energy efficiency and providing infrastructure status to ESCO business.
4.6 Agriculture
India’s National Action Plan on Climate Change (NAPCC) highlighted that the thrust areas of the National Mission for Sustainable Agriculture (NMSA) would be dry land agriculture; access to information; bio-technology; and risk management. The Department of Agriculture and Cooperation (DAC) and the Department of Agricultural Research and Education (DARE) under the Ministry of Agriculture (MoA) has been identified by the Prime Minister’s Council on Climate Change to plan and implement NMSA in India (MoA, undated). The NMSA caters to key aspects such as ‘Water use efficiency’, ‘Nutrient Management’ and ‘Livelihood diversification’ through adoption of sustainable development pathway by progressively shifting to environmental friendly technologies, adoption of energy efficient equipment, conservation of natural resources, integrated farming, etc. The NMSA has four major programme components or activities, namely:
45 | P a g e
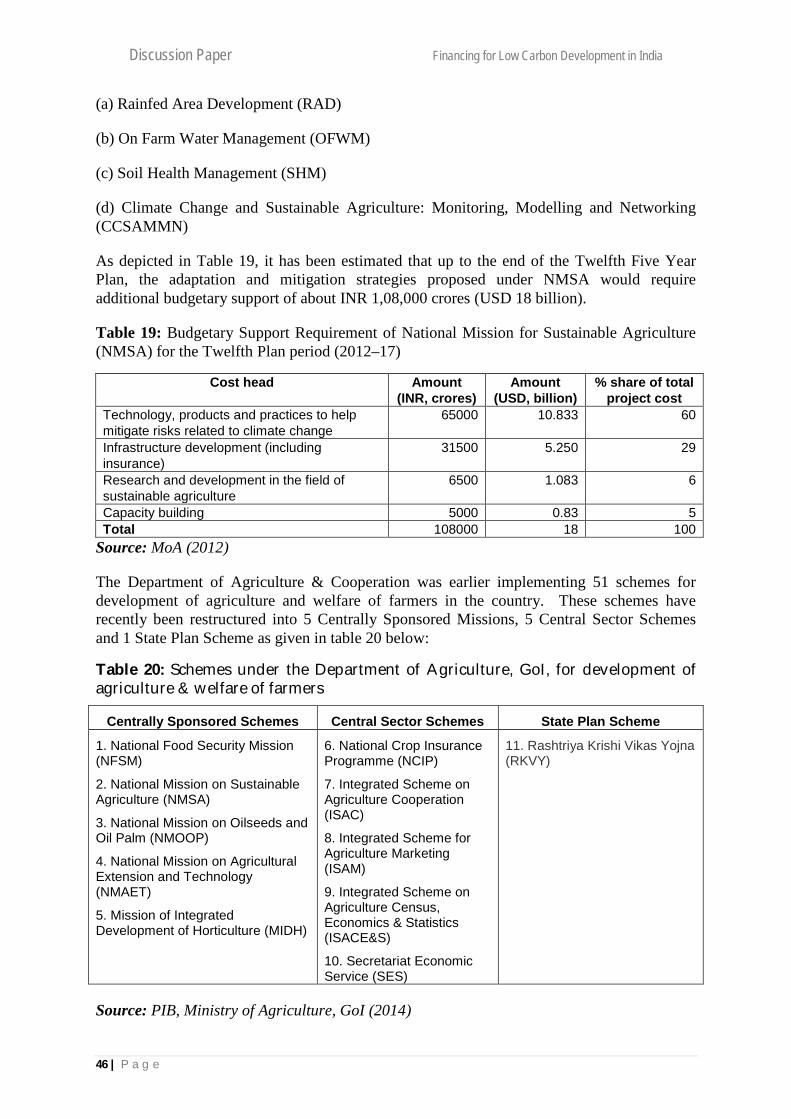
Discussion Paper Financing for Low Carbon Development in India
(a) Rainfed Area Development (RAD)
(b) On Farm Water Management (OFWM)
(c) Soil Health Management (SHM)
(d) Climate Change and Sustainable Agriculture: Monitoring, Modelling and Networking (CCSAMMN)
As depicted in Table 19, it has been estimated that up to the end of the Twelfth Five Year Plan, the adaptation and mitigation strategies proposed under NMSA would require additional budgetary support of about INR 1,08,000 crores (USD 18 billion).
Table 19: Budgetary Support Requirement of National Mission for Sustainable Agriculture (NMSA) for the Twelfth Plan period (2012–17)
Cost head Amount (INR, crores)
Amount (USD, billion)
% share of total project cost
Technology, products and practices to help mitigate risks related to climate change
65000 10.833 60
Infrastructure development (including insurance)
31500 5.250 29
Research and development in the field of sustainable agriculture
6500 1.083 6
Capacity building 5000 0.83 5 Total 108000 18 100
Source: MoA (2012)
The Department of Agriculture & Cooperation was earlier implementing 51 schemes for development of agriculture and welfare of farmers in the country. These schemes have recently been restructured into 5 Centrally Sponsored Missions, 5 Central Sector Schemes and 1 State Plan Scheme as given in table 20 below:
Table 20: Schemes under the Department of Agriculture, GoI, for development of agriculture & welfare of farmers
Centrally Sponsored Schemes Central Sector Schemes State Plan Scheme
1. National Food Security Mission (NFSM)
2. National Mission on Sustainable Agriculture (NMSA)
3. National Mission on Oilseeds and Oil Palm (NMOOP)
4. National Mission on Agricultural Extension and Technology (NMAET)
5. Mission of Integrated Development of Horticulture (MIDH)
6. National Crop Insurance Programme (NCIP)
7. Integrated Scheme on Agriculture Cooperation (ISAC)
8. Integrated Scheme for Agriculture Marketing (ISAM)
9. Integrated Scheme on Agriculture Census, Economics & Statistics (ISACE&S)
10. Secretariat Economic Service (SES)
11. Rashtriya Krishi Vikas Yojna (RKVY)
Source: PIB, Ministry of Agriculture, GoI (2014)
46 | P a g e

Discussion Paper Financing for Low Carbon Development in India
NABARD’s rural innovation fund (RIF) extends support to agricultural communities after evaluating the environmental aspects associated with the activities funded with the loan amount. Specifically, preference is given to sectors such as dry land or rain-fed farming; rural energy from agricultural wastes; and, storage devices for agricultural and rural products (NABARD 2007). The farmers’ technology transfer fund (FTFT) by NABARD facilitates the adoption and dissemination of better and clean technologies in the agriculture sector (NABARD, undated).
NABARD, in its capacity of National Implementing Entity (NIE) for Adaptation Fund (see box 2.7 for brief introduction about Adaptation Fund), had submitted four proposals with financial outlay of USD 5.96 million to Adaptation Fund Board (AFB), out of which two proposals with a financial assistance of USD 3.2 million were accorded approval by the AFB during its 24th meeting held at Bonn, Germany on 09 & 10 October 2014 while clarifications were sought on two projects. This was the first time the AFB sanctioned projects in India. These two proposals are expected to enhance adaptive capacity of coastal community in Krishna district of Andhra Pradesh and increase resilience of small and marginal farmers in Purulia and Bankura districts of West Bengal.
The recently concluded 25th meeting of the AFB on 9-10 April, 2015 sanctioned another proposal from NABARD in India worth USD 1,790,500 which is expected to build adaptive capacities of small inland fishers for climate resilience and livelihood security in the state of Madhya Pradesh, while it rejected the other two submitted proposals.The trend of contract farming (CF) has also been emerging significantly in the agriculture sector of India. Private sectors companies such as Satyam, ITC Limited, and PepsiCo, Rallis, Bharti Walmart have been involved in contract farming with small farmers. Like Bharti Walmart and McDonalds did, proper technical knowledge and guidance was provided by the contractor to farming communities to ensure quality in the production of output. Contract farming provides assured income and financial support to the farmers and has been identified as a potential policy intervention to promote economic development in the agriculture sector. However, contract farming is often accused of inculcating agricultural practices involving excessive use of fertilizers, pesticides and water— thereby, causing environmental degradation (Singh 2011). This at the same time also presents the opportunity of using responsible contractual farming models to help farmers adopt sustainable agriculture practices. These private sector firms could also help mobilize funds for the farming communities to help them adopt eco-friendly technologies (Sethi, undated).
There is a need to invoke technologies that promote environment protection, energy savings and satellite mapping for the agriculture sector of India. Countries like China, Brazil, and various South-east Asian countries have been able to leverage technologies by bringing in private sector investments into the agriculture sector. The average land holding size in India for a majority of landholdings is less than two acres. Therefore, it becomes essentially important to explore economically viable solutions with the involvement of the private sector to improve farmers’ incomes. So far, the private sector has largely remained outside the purview of agricultural capital expenditure. Thus, in order to augment private sector investments in the agriculture sector to help farmers adopt clean environment-friendly practices, there is a need to relax the existing legal and policy framework to some extent (Mittal 2012). Literature also points towards the need to mobilize increased government investment in the agriculture sector all-together, which at present is scarce. Government funding is considered a crucial component in creating an enabling environment to attract private investments in the sector (FAO 2012). There is also a need to ensure careful use of
47 | P a g e

Discussion Paper Financing for Low Carbon Development in India
subsides in the agriculture sector, including the fertilizer subsidy, to be able to plough back the subsidy savings—this could then be used for the development of agricultural practices which are low carbon in nature.
Agriculture sector in India can also make use of the funding available under the Adaptation Fund to implement adaptation measures as response to negative impacts of climate change. Box 6 gives highlight of the adaptation fund:
Box 6: Adaptation Fund under UNFCCC
The Adaptation Fund (AF) was established in 2001 to finance concrete adaptation projects and programmes in developing country Parties to the Kyoto Protocol that are particularly vulnerable to the adverse effects of climate change. It is financed with a share of proceeds from the CDM project activities and other sources of funding. The share of proceeds amounts to 2 per cent of CERs issued for a CDM project activity. The fund also receives contributions from governments, the private sector, and individuals. The AF is supervised and managed by the Adaptation Fund Board (AFB) which is composed of 16 members and 16 alternates.
One unique feature of the Adaptation Fund is its direct access mechanism, which enables accredited national implementing entities (NIEs) and regional implementing agencies (RIEs) in developing countries to directly access climate adaptation financing. The National Implementing Entities (NIEs) prepares and submit projects to the designated authority of the national government for endorsement to the AFB Secretariat for consideration and sanction. India is eligible to seek financial support under the AF. It can undertake climate adaptation activities at national and regional level. NABARD has been accredited by the Adaptation Fund Board of UNFCCC as National Implementing Entity (NIE) in India. The NIE bears full responsibility for the overall management, all financial, monitoring, and reporting responsibilities for the project. It may appoint Executing Entities to execute projects and programmes under its oversight.
4.7 Industry
India’s industry sector consists of both large industries that are at par with world standards and scale, as well as small units which are primarily unorganized and constrained in being able to access and make gainful use of knowledge, processes and mechanisms that allow technological progress. In terms of primary energy consumption, industry remains the largest consumer of energy in India, accounting for over 50% of the total energy consumption in the country. Energy-intensive industries namely fertilizers, aluminium, textiles, cement, iron and steel, pulp and paper, and chlor-alkalis consume around 65 per cent (TERI, 2013) of the total industrial energy.
Performance, Achieve, and Trade (PAT) is a market-based mechanism that was launched under the National Mission on Enhanced Energy Efficiency (NMEEE). The mechanism has a goal to mandate specific energy efficiency improvements for industrial units known as Designated Consumers (DC) (see Box 7 for an overview on PAT mechanism).
48 | P a g e

Discussion Paper Financing for Low Carbon Development in India
Box 7: Performance, Achieve, and Trade (PAT) Mechanism
The Government, in March 2007, identified certain units in nine industrial sectors, namely aluminium, cement, chlor-alkali, fertilizers, iron and steel, pulp and paper, railways, textiles and thermal power plants as DCs. The DCs in the industrial sectors were shortlisted based on their annual energy consumption expressed in terms of tonnes of oil equivalent (TOE). A total of 478 DCs across eight sectors were notified in the first phase. Each DC has been mandated to achieve a prescribed reduction in its specific energy consumption. The reduction targets were notified in March, 2012. Overall, all the plants together are to achieve a 4.05% reduction in the average energy consumption by 2014-15.
At present, the second phase of the scheme is under progress wherein empanelled accredited energy auditors (EmAEA) perform independent evaluation of each activity the DC undertook to comply with energy reduction targets.
PAT is expected to accelerate the adoption of low-carbon technologies among Indian industries. The policy will also complement the efforts being made under various multilateral/bilateral processes to promote adoption of low-carbon technologies. The unit-specific Specific Energy Consumption (SEC) benchmark established under PAT can serve as a baseline for new international mechanisms and schemes.
While large industry sub-sectors such as cement, iron and steel, aluminium and fertilizers have made significant progress in terms of improved efficiency in energy use and adoption of cleaner technologies, there is a need to focus on the challenges faced by the Micro, Small, and Medium Enterprises (MSMEs) in terms of access to technology and finance and therefore their challenges in pursuing green growth. The MSME sector is a major engine for growth in employment and poverty reduction—in India, MSMEs have been playing a pivotal role in the country’s overall economic growth. They have achieved steady progress over the last couple of years. This sector contributes 8.7 per cent of the country’s GDP, 45 per cent of the manufactured output and 40 per cent of its exports. The MSMEs provide employment to about 60 million persons through over 26 million enterprises producing over six thousand products (MSME 2011). They can make a substantial contribution to achieving a low-carbon economy, provided the barriers to the growth of the MSME sector can be addressed appropriately.
Iron and steel
To supplement R&D in the steel sector, the Government had decided, in 1997–98, to fund up to INR 150 crore (approx. 25 USD million) per year from the interest proceeds of the Steel Development Fund (SDF) for R&D projects in the sector. The Empowered Committee on R&D under the Chairmanship of Secretary (Steel) under the Steel Development Fund has so far approved 83 research projects costing INR 696.27 crore (approx. USD 116 million) including SDF component of INR 389.63 crore (approx. USD 65 million) of these 47 projects have been completed. Research results of several R&D projects have already been implemented by the steel plants, resulting in improvement in productivity, reduction in energy consumption and pollution (MoS 2015). In the 11th Plan (2007-12), a new scheme for “promotion of Research & Development in Iron and Steel sector” was included with a budgetary provision of INR 118.00 crore (approx. USD 19.67 million) for promotion of
49 | P a g e
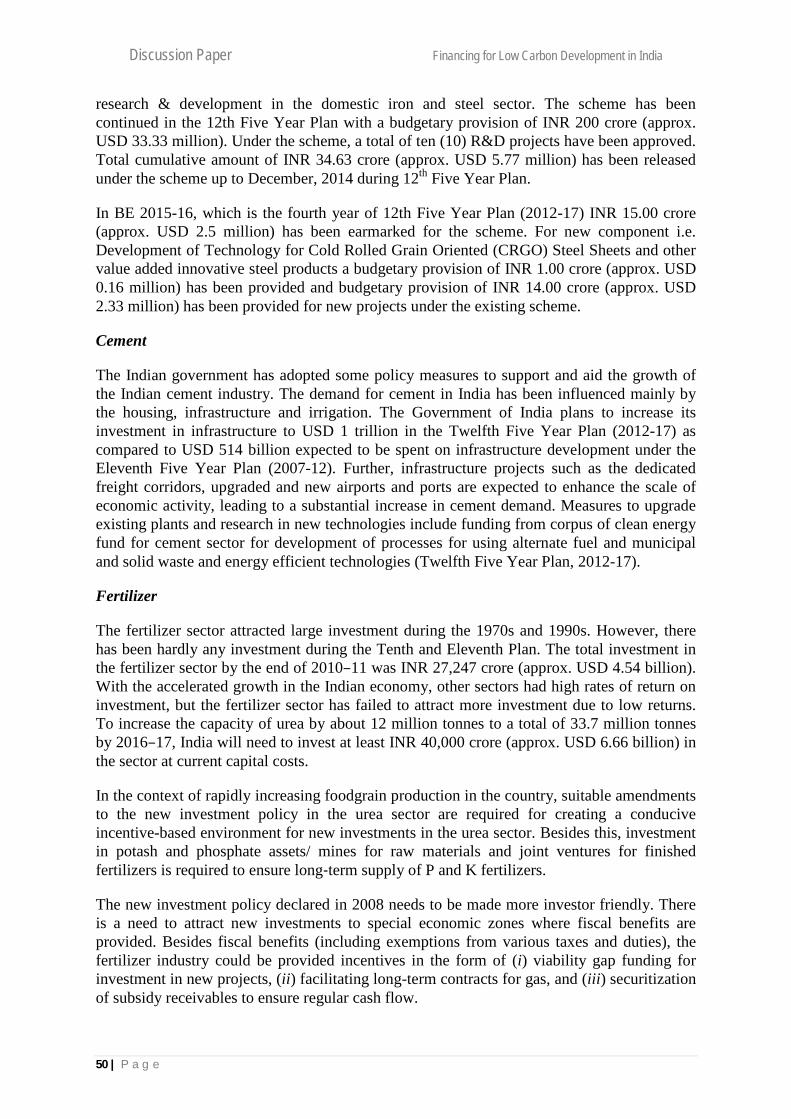
Discussion Paper Financing for Low Carbon Development in India
research & development in the domestic iron and steel sector. The scheme has been continued in the 12th Five Year Plan with a budgetary provision of INR 200 crore (approx. USD 33.33 million). Under the scheme, a total of ten (10) R&D projects have been approved. Total cumulative amount of INR 34.63 crore (approx. USD 5.77 million) has been released under the scheme up to December, 2014 during 12th Five Year Plan.
In BE 2015-16, which is the fourth year of 12th Five Year Plan (2012-17) INR 15.00 crore (approx. USD 2.5 million) has been earmarked for the scheme. For new component i.e. Development of Technology for Cold Rolled Grain Oriented (CRGO) Steel Sheets and other value added innovative steel products a budgetary provision of INR 1.00 crore (approx. USD 0.16 million) has been provided and budgetary provision of INR 14.00 crore (approx. USD 2.33 million) has been provided for new projects under the existing scheme.
Cement
The Indian government has adopted some policy measures to support and aid the growth of the Indian cement industry. The demand for cement in India has been influenced mainly by the housing, infrastructure and irrigation. The Government of India plans to increase its investment in infrastructure to USD 1 trillion in the Twelfth Five Year Plan (2012-17) as compared to USD 514 billion expected to be spent on infrastructure development under the Eleventh Five Year Plan (2007-12). Further, infrastructure projects such as the dedicated freight corridors, upgraded and new airports and ports are expected to enhance the scale of economic activity, leading to a substantial increase in cement demand. Measures to upgrade existing plants and research in new technologies include funding from corpus of clean energy fund for cement sector for development of processes for using alternate fuel and municipal and solid waste and energy efficient technologies (Twelfth Five Year Plan, 2012-17).
Fertilizer
The fertilizer sector attracted large investment during the 1970s and 1990s. However, there has been hardly any investment during the Tenth and Eleventh Plan. The total investment in the fertilizer sector by the end of 2010–11 was INR 27,247 crore (approx. USD 4.54 billion). With the accelerated growth in the Indian economy, other sectors had high rates of return on investment, but the fertilizer sector has failed to attract more investment due to low returns. To increase the capacity of urea by about 12 million tonnes to a total of 33.7 million tonnes by 2016–17, India will need to invest at least INR 40,000 crore (approx. USD 6.66 billion) in the sector at current capital costs.
In the context of rapidly increasing foodgrain production in the country, suitable amendments to the new investment policy in the urea sector are required for creating a conducive incentive-based environment for new investments in the urea sector. Besides this, investment in potash and phosphate assets/ mines for raw materials and joint ventures for finished fertilizers is required to ensure long‐term supply of P and K fertilizers.
The new investment policy declared in 2008 needs to be made more investor friendly. There is a need to attract new investments to special economic zones where fiscal benefits are provided. Besides fiscal benefits (including exemptions from various taxes and duties), the fertilizer industry could be provided incentives in the form of (i) viability gap funding for investment in new projects, (ii) facilitating long-term contracts for gas, and (iii) securitization of subsidy receivables to ensure regular cash flow.
50 | P a g e

Discussion Paper Financing for Low Carbon Development in India
The New Pricing Scheme-III is aimed at promoting further investment in the urea sector to maximize urea production from the existing urea units, including through conversion of non-gas based units to gas, incentivizing additional urea production and encouraging investment in joint venture projects abroad. The policy is aimed at establishing a more efficient urea distribution and movement system in order to ensure availability of urea in the remotest corners of the country.
Micro, small and medium enterprises (MSMEs)
Only about 7% of all MSMEs have access to finance from institutional/non-institutional sources, while close to 92% operate without access to finance/through self-financing. Over the last decade, while the quantum of bank credit given to medium and small enterprises by public sector banks has increased, the share of credit to the MSE sector in Net Bank Credit (NBC) has declined from 12.5% to 10.9% and the share for the micro sector has decreased by nearly 3% (GoI 2010).
A number of initiatives to boost the MSME sector have been taken up by government agencies as well as by the private sector. An INR 50 billion (approx. USD 0.83 billion) India Opportunities Venture Fund with the Small Industries Development Bank of India (SIDBI) has been established with the aim of enhancing the availability of equity to MSMEs, among other schemes supporting technology upgradation by the government. The Twelfth Five Year Plan outlays three new schemes with an allocation of over INR 75 billion (approx. USD 1.25 billion) that would infuse funds into the sector through different paths which include equity financing to supplement promoter contribution, venture capital funds to encourage start-ups, and MSME exchange to facilitate equity access and spread awareness.
The Working Group on MSME’s growth has also proposed a budget allocation of INR 40 billion (approx. USD 0.67 billion) under the Scheme for Technology Acquisition and Development in the TFYP (Twelfth Five Year Plan). Furthermore, the Group has recommended systematically leveraging the National Clean Energy Fund to increase the uptake of clean energy technology in the MSME sector. Besides this, a fund of INR 3 billion (approx. USD 50 million) has been proposed for technology collaboration and acquisition.
Technological modernization is the key to high industrial growth. There are a large number of energy-intensive MSME clusters (around 178 clusters manufacturing about 15 product categories like castings, forgings, glass and ceramics, food processing, textile processing and so on) in the country where energy efficient and cleaner technologies can be facilitated. Yet, only a few programmes have targeted development and demonstration of cleaner technologies at cluster level. Hence, there is a need to focus greater attention in this area.
A preliminary review undertaken by TERI of 390 MSME clusters, covering 12 product categories, suggest the presence of at least 175 energy-intensive clusters in India. TERI has recently collated preliminary energy data for 43 clusters under SAMEEEKSHA. It was found that the energy consumption of these 43 clusters alone account for 6.6 million tonnes of oil equivalent (mtoe) (nearly 4% of the country’s commercial energy consumption in the industrial sector). There is a need to institutionalize data collection on energy consumption patterns in the Indian MSME sector as a whole. Energy consumption data is important for policymakers and other agencies working in the MSME sector for initiating programmes and activities in energy-intensive clusters.
51 | P a g e

Discussion Paper Financing for Low Carbon Development in India
State governments would also need to take steps to create an investor-friendly climate. It is essential to ensure that delays in land registration, water and utility connections, environmental and other clearances are minimized through a single window clearance of applications for establishment of industrial units6. If the MSME sector has to take its rightful place as the growth engine of Indian economy, it is necessary to support the sector with resources—both human and economic—to help it keep pace with global developments.7
4.8 Forestry
Increasing the density of forestry and tree cover on forest and community lands has been identified as one of the key low-carbon strategies for India’s forestry sector. To achieve the goals of low-carbon growth in the forestry sector, the Green India Mission (one of the eight missions under the National Action Plan for Climate Change (NAPCC)) has been acknowledged as a powerful instrument through its interventions relating to climate adaptation & mitigation, food security, biodiversity conservation, livelihood conservation, and others. The time frame for implementation of the mission is ten years (FY 2010–11 to FY 2019–20). The total mission cost is estimated to be INR 46000 crore (approx. USD 7.66 billion) for treatment of approximately 10 million ha of land. This cost is an indicative figure for the country as a whole; there would be variance according to state-specific situations. Table 21 discusses the major costs that are to be incurred to implement the activities stated in the Green India Mission (GIM). The mission also aims at enhanced CO2 sequestration by 50-60 million tonnes in the year 2020.
Table 21: Costs under Green India Mission
No. Activities Costs (INR, crores)
Costs (USD, millions)
1. Resources needed for the mission to meet specific objectives and activities
34000 5666.67
2. Resources for support activities (including research, outreach, GIS, livelihood improvement, strengthening local level institutions etc.)
12000 2000
3. Total mission costs (1+2) 46000 7666.67 Source: Adapted from (MoEFCC, 2013)
Table 22 discusses the various sub-missions and components, stated in the GIM.
GIM has been approved by the Cabinet Committee on Economic Affairs (CCEA) in February 2014 with projected cost of INR 13000 crore (approx. USD 2.167 billion) and one year spill over in 13th five-year plan. This includes INR 2,000 crore (approx. USD 333.33 million) from 12th Plan Outlay, INR 400 crore (approx. USD 66.67 million) from 13th Finance Commission grant, and convergence with CAMPA to the tune of INR 6000 crore (approx. USD 1 billion) and MNREGS to the tune of INR 4000 crore (approx. USD 666.67 million). At the national level, the mission would seek convergence with other missions, programs and schemes such as Mahatma Gandhi National Rural Employment Guarantee Scheme (MGNREGS), Compensatory Afforestation Management and Planning Authority (CAMPA), National Afforestation Program (NAP), National Rural Livelihood Mission and Integrated Watershed Management Program. The Ministry of Environment, Forests & Climate Change
6Approach paper for Twelfth Five Year Plan 7http://www.smechamberofindia.com/
52 | P a g e

Discussion Paper Financing for Low Carbon Development in India
(MoEFCC) has already issued guidelines for convergence of GIM with MGNREGS and CAMPA.
Table 22: GIM Interventions and Tentative Costs
S No. Sub Mission Category Area to be
worked upon (ha)
1 Enhancing quality of forest
cover and improving ecosystem services
4.9 m
(a) Moderately dense forest cover, but showing degradation 1.5 m
(b) Eco-restoration of degraded open forests 3 m
(c) Restoration of grasslands 0.4 m
2 Ecosystem restoration and increase in forest cover 1.8 m
(a) Rehabilitation of Shifting Cultivation areas 0.6 m
(b)Restoring scrublands 0.8 m (c) Restoring/ planting seabuckthorn 0.1 m
(d) Restoration of mangroves 0.1 m (e) Ravine reclamation 0.1 m
(f) Restoration of abandoned mining areas 0.1 m
3
Enhancing tree cover in Urban and Peri-Urban areas
(including inst7itutional lands)
0.2 m
4 Agro-Forestry and Social
Forestry (increasing biomass and creating carbon sink)
3 m
5 Restoration of wetlands 0.1 m Source: MoEFCC, 2013
Forests provide us with a range of ecosystem goods and services such as carbon sequestration and storage, climate regulation, food production and socio-cultural services. Forests also play a fundamental role in the preservation of global ecological systems. However, with the recent phase of forest degradation and deforestation, the critical functions provided by the forest ecosystems are being increasingly threatened (FAO 1997). To address these issues and in order to safeguard forest ecosystems, it is important that forestry resources and services are valued appropriately. Viable financial mechanisms need to be used to promote sustainability across forest ecosystems. The Fourteenth Finance Commission rightly identified the need to ‘balance management of ecology, environment and climate change consistent with sustainable economic development’ and added the new criterion of forest cover for devolution of central taxes to the states. This would encourage states to take up afforestation & reforestation activities on their land and still compensate for the opportunity cost lost in
53 | P a g e

Discussion Paper Financing for Low Carbon Development in India
terms of area which could have otherwise been used for generating economic activities. The table 23 below outlines the new horizontal formula for inter-se determination of the shares of taxes to the states:
Table 23: Criteria and Weights for inter-se determination of the shares of union tax revenues to states
Criteria Weight
Population 17.5
Demographic change 10
Income distance 50
Area 15
Forest cover 7.5
Source: Ministry of Finance, 2014
An estimated 100 million forest dwellers depend on Minor Forest Produce (MFP) for food, shelter, medicines, cash income etc. yet the price of MFP (or NTFPs) is most often decided by traders rather than by demand/ supply (barring few high revenue items nationalized by the state governments). Thus the government of India has introduced the scheme of ‘Mechanism for marketing of MFP through Minimum Support Price (MSP) and development of value chain’ as a social safety net for improvement of livelihood of MFP gatherers. Under this scheme, 12 different MFPs have been identified by the Ministry of Tribal Affairs. The scheme has been implemented in States having areas under the Fifth Schedule of the Indian constitution i.e. Andhra Pradesh, Chhattisgarh, Gujarat, Jharkhand, Madhya Pradesh, Maharashtra, Odisha, Rajasthan and Telangana. However, since Andhra Pradesh and Telangana have put all the MFP under monopoly of the State, the scheme has not been implemented in these two States so far (Ministry of Tribal Affairs, 2015).
Clean Development Mechanism (CDM)
As provided under Article 12 of the Kyoto Protocol, CDM enables developing countries to issue certified emission reductions (CERs) to developed economies who invest in these developing countries to reduce their GHG emissions in order to meet their targets stated in the Kyoto Protocol (UNFCCC, What is CDM, undated). A part of the investments received by developing countries go towards afforestation activities and to promote sustainable forestry. The CDM is also the main source of income for the UNFCCC Adaptation Fund, which was established to finance adaptation projects and programmes in developing country Parties to the Kyoto Protocol that are particularly vulnerable to the adverse effects of climate change. The Adaptation Fund is financed by a 2% levy on CERs issued by the CDM. However, the number of registered CDM projects and requests for new registrations in India are minuscule. Not only this, the share of forestry related projects in the total CDM projects for India is almost negligible (UNFCCC, undated; Earthwatch, undated).
54 | P a g e

Discussion Paper Financing for Low Carbon Development in India
Financial Mechanism of REDD+
The UN financial mechanism of Reducing Emissions from Deforestation and Degradation (REDD+) incentivizes avoided deforestation and sustainable management of forests with the view to reduce GHG emissions. REDD+ aims at compensating forest owners in developing countries for conserving forests by assigning value to the forest carbon stock, one of the ecosystem services provided by the forests.
India continues to play an important role in REDD+ negotiations and has been guiding current international negotiations relating to REDD+. India’s position on REDD+ underscores the need for reducing emissions through sustainable management of forests, and enhancement of forest carbon stocks, in addition to reducing emissions from deforestation and forest degradation (TERI 2009; 2012). India also released its draft National Policy on REDD+ in 2014 to provide a roadmap for effective implementation of REDD+ projects and programmes across the country and create financial incentives for the local communities who are at the forefront of forest conservation efforts (MoEFCC, 2014). Even though the number of REDD+ pilot initiatives is rapidly rising in India, comprehensive financial arrangements for full-scale implementation of REDD+ projects are yet to be made (Lang 2011; CarbonMarketWatch 2013).
Ecosystem services funding mechanisms
Payments for ecosystem services or PES mechanism is a broad term used for a variety of financial arrangements made between the beneficiaries of ecosystem services and providers of those services. This mechanism for the forestry sector is particularly considered as a useful instrument to preserve forest ecosystems (UNEP 2011). It has the potential to ensure effective provisioning of forest ecosystem services such as carbon sequestration, nutrient storage and recreational services.
However, the applicability of PES mechanisms is limited only to the areas where property rights over the forest resources are identified clearly—unlike the case for many of India’s forest ecosystems (Box 8). The PES mechanism relating to issues of upstream–downstream pollution in the forests, soil hill nutrient management, biodiversity conservation and others have been implemented across the forests of India; however, many of these arrangements have not remained viable in the long run due to weak institutional set-up and policies (Singh 2008).
Box 8: Payments for Ecosystem Services in Himachal Pradesh
The Government of Himachal Pradesh in November 2013 came out with the 'State Policy on Payments for Ecosystem Services'. The policy is targeted at protection and management of natural resources for sustained production of ecosystem services; and provision of economic incentives to the communities for conserving natural ecosystems. The state government is committed to institutionalize ecosystems approach and put in place PES mechanism in the state. The PES policy mentions the various ecosystem services that will be eligible for the PES models; these include soil erosion control, carbon sequestration, sediment load reduction, fire control, rehabilitation of weed infested areas, organic and conservation agriculture, conservation horticulture, and biodiversity conservation. The policy envisages to develop partnerships amongst different departments, research and civil society organizations; and is envisioned to build capacities at all levels in the process for effective ecosystems and natural resource management (GoHP, 2013).
55 | P a g e

Discussion Paper Financing for Low Carbon Development in India
4.9 Waste Management
Solid waste is often regarded as an indicator of the level of urbanization achieved in any country. The generation of solid waste in the country is increasing over the years due to changing lifestyles and increasing consumerism resulting from rapid urbanization and economic growth. This rising levels of waste generation without efficient collection, processing, and disposal are posing an environmental threat, impacting human health as well as the ecosystem.
According to a study, about 960 MT of solid waste is being generated per year in India from industrial, mining, municipal, agricultural, and other sources (Pappu et al. 2007). Of this, about 290 MT is inorganic wastes from industrial and mining sectors, 62 MT is municipal wastes, 8.3 MT is hazardous wastes, and about 350 MT is organic wastes from agricultural sources (TEDDY 2011/12). With rapid development in India, the generation of solid wastes is expected to rise dramatically. According to the latest data available from the World Bank, urban India generates 0.34 kg per capita per day of municipal solid waste, resulting in a daily waste quantum of 109 589 tonnes (TEDDY 2012/13).
The increasing generation of solid waste is a growing problem in all Indian cities. Lately, dumping garbage into landfills is not a preferred option in our land-scarce cities. It is to be noted that the overall requirements of funds for municipal solid waste management (MSWM) is unattainable if only the internal resources of urban local bodies (ULB) are available. The scale of investment needed in this sector is substantial. Financial support from government agencies either in the form of grants and/or subsidies is needed to accelerate the efforts of ULBs to modernize the MSWM system in their respective cities.
The Fourteenth Finance Commission, responsible for devolution of funds to state governments for five years from 2015-20, has worked out the total size of the grant to be INR 2,87,436 crore (approx. USD 47.9 billion) for the period 2015-20, constituting an assistance of INR 488 per capita per annum at an aggregate level. Of this, the grant recommended to panchayats is INR 2,00,292.2 crore (approx. USD 33.38 billion) and that to municipalities is INR 87,143.8 crore (approx. USD 14.52 billion). These grants will be in two parts – a basic grant and a performance grant. For gram panchayats, the division between basic and performance grants will be on 90:10 basis and for municipalities it would be on 80:20 basis.
The basic grant provided should be used to improve basic civic services including water supply, sanitation including septage management, sewerage and solid waste management, storm water drainage, maintenance of community assets, maintenance of roads, footpaths and street-lighting, and burial and cremation grounds (Finance Commission, 2015). The Thirteenth Finance Commission had even linked the performance-related funds to improvements in Service Level Benchmarking (SLBs)8 including SWM. It had also recommended that of all the grants given to the ULBs, 50% should be for SWM.
CPCB 2012-13 report suggests that 30% of the municipal solid waste generated is not even collected and even of the 70% that gets collected, only 12.45% gets treated or processed. It is observed that smaller towns where the main activity is solid waste management (SWM)
8 Service Level Benchmarking is an initiative of the Ministry of Urban Development (MoUD), Government of India to increase accountability for service delivery in sectors such as water and sanitation (which includes solid waste management), e-governance and urban transportation. It involves measuring and monitoring of service provider performance on a systematic and continuous basis. Source: http://moud.gov.in/servicelevel
56 | P a g e

Discussion Paper Financing for Low Carbon Development in India
spend up to 70% of their budget on the same. Metropolitan cities, on the other hand, due to a wider resources base and the responsibility of providing a larger number of services, spend only around 10% of their budget on solid waste management. A majority of urban centres however spend 5–40% of their budget on solid waste management. This is approximately between INR 50 to INR 250 (approx. USD 0.83 to USD 4.17) per capita per year. It is observed that a large proportion of this expenditure is incurred for salaries and only a limited amount is spent on operation and maintenance (O&M) and development works.
One of the priority areas within first phase of JNNURM, which ended in March, 2014 and is now being replaced by the Atal Mission for Rejuvenation and Urban Transformation (AMRUT), was solid waste management. Since the inception of JNNURM in 2005-06, Indian cities have witnessed widespread infrastructure development linked to municipal services. For select cities in the country, till 8th August, 2014, 46 projects in the MSWM sector had been sanctioned with an approved cost of INR 2110.2181 crores (approx. USD 351.67 million). One of the sets of benchmarks established by the MoUD for Smart Cities also talks about achieving 100% efficiency in collection & treatment of waste water and sewerage network. It also ambitiously targets at achieving 100% collection, segregation and recycling of solid waste.
Another new initiative with the target to make the country clean by 2019 is the Swachh Bharat Mission launched by the Government of India on 2nd October, 2014. Its specific objectives include elimination of open defecation, modern and scientific municipal solid waste management and eradication of manual scavenging among others. The estimated cost of implementation of SBM (Urban) based on unit and per capita costs for its various components is INR 62,009 crore (approx. USD 10.33 billion). The Government of India’s share as per approved funding pattern amounts to INR 14,623 crore (approx. USD 2.43 billion). In addition, a minimum additional amount equivalent to 25% of GoI funding, amounting to INR 4,874 crore (approx. USD 0.81 billion) shall be contributed by the States as State/ULB share. The balance fund is proposed to be generated through various other sources of fund which are, but not limited to:
a. Private Sector Participation
b. Additional Resources from State Government/ULB
c. Beneficiary Share
d. User Charges
e. Land Leveraging
f. Innovative revenue streams
g. Swachh Bharat Kosh
h. Corporate Social Responsibility
i. Market Borrowing
j. External Assistance
57 | P a g e

Discussion Paper Financing for Low Carbon Development in India
The GoI sanctioned the implementation of the Programme on Energy from Urban, Industrial and Agricultural Wastes / Residues in 2013 during the 12th Plan period. It aims to promote setting up of projects for recovery of energy from urban, industrial & agricultural wastes; and to create conducive conditions and environment, with fiscal and financial regime, to develop, demonstrate and disseminate utilization of wastes and residues for recovery of energy. The table 24 below illustrates the capital subsidy available to the promoters:
Table 24: Capital subsidy available to the promoters
Waste/Processes/Technology Capital Subsidy
1. Power generation from Municipal Solid Waste INR 2.00 crore/ MW (Max. INR 10 crore/ project)
2. Power generation from biogas at Sewage Treatment Plant or through biomethanation of Urban and Agricultural Waste/ residues
INR 2.00 crore/ MW or bio-CNG from 12000 m3 biogas/ day (Max. INR 5 crore/ project)
3. Biogas generation from Urban, Industrial and Agricultural Wastes/ residues
INR 0.50 crore / MWeq. (12000 m3 biogas / day with maximum of INR 5 crore/ project)
4. Power Generation from Biogas (engine / gas turbine route) and production of bio-CNG for filling into gas cylinders
INR 1.00 crore/ MW Or bio-CNG from 12000 m3 biogas (Max. INR 5 crore/ project)
5. Power Generation from Biogas, Solid Industrial, Agricultural Waste/ residues excluding bagasse through Boiler + Steam Turbine Configuration
INR 0.20 crore/ MW (Max. INR 1 crore/ project)
Source: MNRE, 2013
Apart from the above incentives to the promoters, there are monetary incentives for the state nodal agencies, financial assistance for promotional activities and financial support for R&D activities as well.
Apart from the above-mentioned programmes and subsidies provided by the central/state governments, various incentives are also available for financing of infrastructure related to solid waste management in India. A tax holiday for the project “Entity for Solid Waste Management” has been provided according to the Union Budget 2001/02, provision for deduction has been made under Section 801A of the Act in respect to profits and gains of the undertaking/ or enterprise engaged in infrastructure facilities relating to solid waste management, which is allowed at 100 per cent of such profits for ten consecutive assessment years out of the first twenty years of the project under certain conditions.
PPPs (Public–Private Partnerships) in solid waste management in India are involved in waste collection, transportation, and treatment. As may be known, a PPP is a contract between a public sector authority and a private party which is funded and operated by both the parties, and in which the private party provides a public service or project and assumes substantial
58 | P a g e

Discussion Paper Financing for Low Carbon Development in India
financial, technical and operational risk in the project. Table 25 showcases the scope of activities and implementation frameworks that are prevalent in the MSWM space.
Table 25: Prevalent PPP Formats in MSWM
No Scope of services PPP format
1 Door-to-door collection Service Management Contracts
2 Street sweeping Service Contracts
3 Construction and maintenance of community bins
BOT( Build—Operate—Transfer) and its variance and/or separate EPC (Engineering, Procurement and Construction) and O&M Contract
4 Transportation of waste to integrated, processing and disposal facility
Concession and/or O&M Contract
5 Design, development, operations and maintenance of processing and treatment facility for MSW including special waste like vegetable market and/or abattoir waste.
BOT and its variance and/or separate EPC and O&M Contract
6 Design, development, operations and maintenance of sanitary landfill site.
BOT and its variance and/or DFBOT and/or separate EPC and O&M Contract
Source: MoUD (2011)
The role of the private sector in municipal solid waste management is taking off rapidly in the country. Metro cities like Chennai, Hyderabad, etc., were the first to witness large-scale private sector participation sometime during the mid-1990s. During the late 1990s, the urban local bodies (ULBs) gradually realised the need for processing/recycling solid waste to reduce the burden on landfills. Along with this, came the notification of MSW Rules (Management and Handling) 2000 that made waste processing and development of sanitary landfill mandatory. There was an increased involvement of private operators during the mid-2000s driven mainly due to technical, financial and managerial constraints at the ULBs.
It has been observed that since the late 1990s, the private sector is eager to invest and manage projects on primary collection and transportation, which was earlier limited to only local contractors. A few integrated projects have also been successfully developed on PPP formats including integrated processing and disposal in the cities of Coimbatore, Bangalore, Chennai, Delhi, Kolkata, and Ahmadabad. Integrated MSWM systems for the entire value chain provided by a single private operator have come up in the cities of Guwahati (Box 9) and Hyderabad.
More than half of the waste budget of Indian cities is typically spent in collection alone (mainly on labour and fuel); still the collection rate remains low and the transport of waste inefficient. Spending on other segments of the waste management chain such as appropriate
59 | P a g e
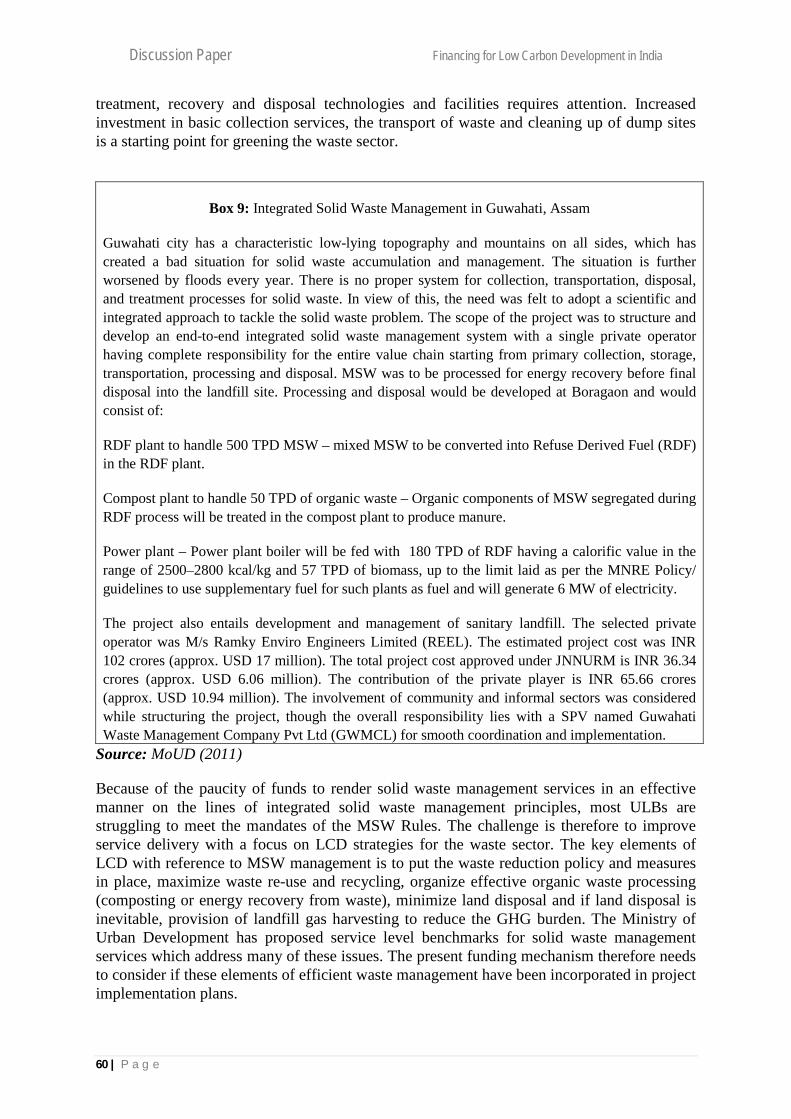
Discussion Paper Financing for Low Carbon Development in India
treatment, recovery and disposal technologies and facilities requires attention. Increased investment in basic collection services, the transport of waste and cleaning up of dump sites is a starting point for greening the waste sector.
Box 9: Integrated Solid Waste Management in Guwahati, Assam
Guwahati city has a characteristic low-lying topography and mountains on all sides, which has created a bad situation for solid waste accumulation and management. The situation is further worsened by floods every year. There is no proper system for collection, transportation, disposal, and treatment processes for solid waste. In view of this, the need was felt to adopt a scientific and integrated approach to tackle the solid waste problem. The scope of the project was to structure and develop an end-to-end integrated solid waste management system with a single private operator having complete responsibility for the entire value chain starting from primary collection, storage, transportation, processing and disposal. MSW was to be processed for energy recovery before final disposal into the landfill site. Processing and disposal would be developed at Boragaon and would consist of:
RDF plant to handle 500 TPD MSW – mixed MSW to be converted into Refuse Derived Fuel (RDF) in the RDF plant.
Compost plant to handle 50 TPD of organic waste – Organic components of MSW segregated during RDF process will be treated in the compost plant to produce manure.
Power plant – Power plant boiler will be fed with 180 TPD of RDF having a calorific value in the range of 2500–2800 kcal/kg and 57 TPD of biomass, up to the limit laid as per the MNRE Policy/ guidelines to use supplementary fuel for such plants as fuel and will generate 6 MW of electricity.
The project also entails development and management of sanitary landfill. The selected private operator was M/s Ramky Enviro Engineers Limited (REEL). The estimated project cost was INR 102 crores (approx. USD 17 million). The total project cost approved under JNNURM is INR 36.34 crores (approx. USD 6.06 million). The contribution of the private player is INR 65.66 crores (approx. USD 10.94 million). The involvement of community and informal sectors was considered while structuring the project, though the overall responsibility lies with a SPV named Guwahati Waste Management Company Pvt Ltd (GWMCL) for smooth coordination and implementation.
Source: MoUD (2011)
Because of the paucity of funds to render solid waste management services in an effective manner on the lines of integrated solid waste management principles, most ULBs are struggling to meet the mandates of the MSW Rules. The challenge is therefore to improve service delivery with a focus on LCD strategies for the waste sector. The key elements of LCD with reference to MSW management is to put the waste reduction policy and measures in place, maximize waste re-use and recycling, organize effective organic waste processing (composting or energy recovery from waste), minimize land disposal and if land disposal is inevitable, provision of landfill gas harvesting to reduce the GHG burden. The Ministry of Urban Development has proposed service level benchmarks for solid waste management services which address many of these issues. The present funding mechanism therefore needs to consider if these elements of efficient waste management have been incorporated in project implementation plans.
60 | P a g e
Discussion Paper Financing for Low Carbon Development in India
5. Ways Forward Attracting investments for low carbon development has been challenging. Although, progress is being made; there is still unmet need to achieve low carbon development. The global community recognizes the need to create an enabling environment for low carbon development. After the 2002 Monterrey Consensus and the 2008 Doha Declaration, the Heads of State and Government and High Representatives, gathered in Addis Ababa from 13 to 16 July 2015, to reaffirm their political commitment to address the challenge of financing for sustainable development. The Addis Ababa Action Plan suggests that “solutions can be found, including through strengthening public policies, regulatory frameworks and finance at all levels, unlocking the transformative potential of people and the private sector, and incentivizing changes in financing as well as consumption and production patterns to support sustainable development”.
Low carbon development (LCD) provides a solution in the larger debate of economic growth vis-a-vis environmental conservation. Path to LCD holds several advantages including achieving energy security as well maintaining sound state of environment. But transition to low carbon space would require significant flow of finance. The fund flow in this space gets impeded due to number of factors including inadequate policy environment, unfamiliarity with risks associated with low carbon initiatives and longer payback periods of low carbon projects. Despite the barriers, transition is gaining momentum in India, which is evident in the increased investments in low carbon space, particularly renewable energy sector, and initiatives such as levy of coal cess, trading of renewable energy certificates and changes in the structure of devolution of funds to states.
It is generally understood that projects in low carbon space possess higher risks because of their longer payback periods, high initial capital outlay and lack of familiarity of lenders with this concept. Financial constraints, inadequate policy provisions and system complexity often doesn’t allow funds to flow as freely in low carbon projects as it would have flown for their conventional alternatives. Banks, micro-finance institutions, non-banking financial companies (NBFCs) require risk offsets to invest in low carbon development projects. In this light, funds created to cover for such risks, such as the Partial Risk Guarantee Fund and the Partial Risk Sharing Facility, should be further strengthened to boost investment for low carbon growth.
Inclusion of renewable energy as one of the priority sectors by the Reserve Bank of India (RBI) is a welcome move which could encourage renewable energy industry. However, there is a need for concerted effort to spread awareness regarding this banking provision among stakeholders especially project developers and investors. Also, low carbon interventions in sectors other than renewable energy, such as buildings, transport, agriculture, industry, waste and forestry should also be given due consideration under RBI norms. For many low carbon technologies, there is a need to better study and research to discern their long term viability and before launching them on a large scale. For instance, carbon capture and storage needs a careful contemplation to determine its cost-competitiveness and safety in longer time horizon. Some other such technologies require more research & development and adequate incentives for their commercialization e.g. promoting the use of hybrid vehicles requires more effort in terms of technology, geographical suitability, and infrastructure for charging needs of the cars.
61 | P a g e

Discussion Paper Financing for Low Carbon Development in India
Public sector financing has a definite role to play in pushing LCD further. Targeted public sector financing interventions need to be augmented. This is crucial not just from the point of view of scaling up and commercializing LCD activities but also to stimulate and mobilize private sector investment in LCD. Public and private sector institutions needs to be strengthened to respond and anticipate the complexities and needs emerging in the low carbon space.
Effectively engaging the private sector is crucial to filling the financing and implementation gap for LCD. Provisions to facilitate PPPs through providing framework and incentives for urban local governments in India include the viability gap funding (VGF) mechanism, formation of the India Infrastructure Finance Corporation Limited (IIFCL), and the India Infrastructure Project Development Fund. Risk reduction mechanisms in PPPs for low carbon development projects are needed including loan guarantees and mixed equity funds. There is also a need for a mechanism for enhanced coordination between public and private sector.
LCD requires capital availability for which it is required to broaden the sources of funding as well as the way in which these are intermediated. Traditional finance has not been able to successfully capture the opportunity to fund the emerging requirements in low carbon space. Initiatives taken by banks and financial institutions have not been large scale enough as there is no common framework or guidelines in India that banks can follow to offer credit for ‘green’ initiatives by organizations and reduce their risks. There have been some traction in the involvement of banks and financial institutions in the renewable energy sector; however, other low carbon development sectors (including MSMEs) need a similar participation from banks.
The RBI can take steps in the direction of bringing financial innovations such a designing ‘green’ credit guidelines that can guide the Indian banks on lending to organizations that would want to be more sustainable. The guideline can also promote voluntary sustainability reporting by banks.
Investors should focus on new sources of funds like pension funds and sovereign wealth funds; burgeoning market of green bonds; access to capital markets and low cost debt which can help achieve the financial needs for low carbon development. They should also constantly evolve suitable policies to securely fund low carbon projects and streamline their existing policies on these aspects as per market requirements.
At the same time, building a suitable policy scenario at national level is equally important. Policymakers need to find vehicles for modifying existing consumer preferences to more sustainable practices. This could be done by creating awareness and building capacity towards voluntary sustainability initiatives.
Policymakers should devise ways that do not just generate interest among individuals and organizations towards adoption of green practices in their routine activities but also be able to sustain it. The Ministry of Finance, the RBI and the banks together can develop a suitable environment which can entice investors towards LCD.
Sectors like transport, habitat (or buildings), industries, waste and others provide states huge opportunity to improve their low carbon scenario and simultaneously achieve better living conditions for its citizens. Policies in the state should promote organizations which work towards low carbon initiatives by extending them incentives such as tax credits. Through
62 | P a g e

Discussion Paper Financing for Low Carbon Development in India
knowledge sharing of the lessons learnt at subnational level, national policy scenario could be improved upon.
Local level government in India has better connect with the civil society and the businesses. It understands the actual scenario in their areas and would be in a better position to respond to the existing challenges in low carbon space. It will be up to the municipal corporations and the panchayats to obtain funds to engage more in low carbon space and judiciously utilize those funds. It also has to ensure that the national or sub-national ‘green’ guidelines and/ or policies are efficaciously followed.
Overall, following recommendations emerge from the above discussion:
• The sustainable development community as a whole needs to recognize the importance of engaging with global financial regulatory frameworks such as the Bank for International Settlements, International Monetary Fund and International Accounting Standards Board.
• Banks, micro-finance institutions, non-banking financial companies (NBFCs) require risk offsets to invest in low carbon development projects.
• RBI needs to spread awareness regarding the priority sector lending norms among other stakeholders. Also, sectors other than renewable energy which can also contribute potentially towards environmental sustainability, such as buildings, transport, agriculture, industry, waste and forestry should be given due consideration under RBI norms.
• Public finance will be crucial in helping stimulate investments for low carbon development. Apart from initiatives such as the National Clean Energy Fund, there is need for more public spending on low carbon development initiatives.
• Institutions needs to be strengthened to respond and anticipate the complexities and needs emerging in the low carbon space.
• Private sector should be engaged to fill the financing and implementation gap for LCD. Coordination between private and public sector needs to be improved.
• RBI can take steps in the direction of bringing financial innovation like designing ‘green’ credit guidelines. It should also promote voluntary sustainability reporting by banks.
• Ministry of Finance should actively monitor the usage of its fund flow towards various LCD activities. One such mechanism could be ‘green budgeting’.
• Policymakers should devise ways that do not just generate interest among individuals and organizations towards adoption of green practices in their routine activities but also be able to sustain it.
• Policies in the state should promote organizations which work towards low carbon initiatives by extending them incentives such as tax credits.
• There should be a knowledge sharing platform to document lessons learnt at subnational level can feed into national level policymaking and improve national policy scenario.
• It will be up to the municipal corporations and the panchayats to obtain funds to engage more in low carbon space and judiciously utilize those funds. It also has to
63 | P a g e
Discussion Paper Financing for Low Carbon Development in India
ensure that the national or sub-national ‘green’ guidelines and/ or policies are efficaciously followed.
• Awareness about Carbonex and Greenex should be enhanced. These can also be extended to more companies.
• Market mechanisms in India will need to be strengthened for instruments such as the Renewable Energy Certificates (RECs) and Energy Saving Certificates (ESCerts). Trading of instruments under the Power Exchange India Limited can be further explored.
• In terms of international carbon market related instruments, there is a need for institutional support to CDM project developers across various states in India. There is also a need to relook at the current institutional processes which are bureaucratic and complex in design.
• While international climate finance has sought to leverage and attract private finance, according to Climate Funds Update, as of the beginning of 2012, globally, for every USD 1 spent between 2010 and 2012, only USD 0.25 of private finance had been drawn. Green Climate Fund should be able to boost this gap.
• For improving the enabling environment for PPPs there is a need for better transparency in the entire PPP project cycle including bidding processes and standardization of procurement procedures. There is need to build capacity for evaluation and oversight. There is a need for clear policy and regulatory guidelines specifically targeted at addressing issues in low carbon development projects as these are perceived to have higher risks.
• According to the World Giving Index Report of 2014, India ranked 52nd in terms of donating money to charity; overall, India ranks 69th. Moreover, the money going for environmental activities is seen to be less. Apart from stepping up philanthropic resources, there is a need to pay greater emphasis in the environment sector.
64 | P a g e

Discussion Paper Financing for Low Carbon Development in India
References
Adaptation Fund. (2015, April 10). Decisions of the twenty-fifth meeting of the Adaptation Fund Board. Retrieved May 29, 2015, from https://www.adaptation-fund.org/sites/default/files/AFB.B.25.7%20Decisions.pdf
Bloomberg New Energy Finance. (2015). Global trends in renewable energy investment 2015.
CARE Ratings. (2014). Municipal Bond Market in India: The Way Ahead. Retrieved from %20India-%20The%20Way%20Ahead.pdfhttp://www.careratings.com/upload/NewsFiles/Studies/Municipal%20Bond%20Market%20in
CEA. (2015, April 30). All India installed capacity (in MW) of power stations. Retrieved May 27, 2015, from Central Electricity Authority, Government of India: http://www.cea.nic.in/reports/monthly/inst_capacity/apr15.pdf
Central Pollution Control Board, MOEFCC. (2012). Status Report on Municipal Solid Waste Management. New Delhi.
CGTMSE. (n.d.). About CGTMSE. Retrieved May 25, 2015, from Credit Guarantee Fund Trust for Micro and Small Enterprises: http://www.cgtmse.in/about_us.aspx
Chakrabarti, M. (2014, March). Municipal Bond Market in India. Indian Journal of Applied Research, 4(3), 83-85.
Charities Aid Foundation. (2014). World Giving Index 2014: A global view of giving trends.
Clean Technology Fund Investment Plan for India (CTFIPI). (2011). Retrieved May 25, 2015, from Ministry of Environment, Forests and Climate Change : http://envfor.nic.in/sites/default/files/IP-CTF-2011_0.pdf
EXIM Bank of India. (2015, March). Press Releases. Retrieved May 25, 2015, from EXIM Bank: http://www.eximbankindia.in/press-releases
Fourteenth Finance Commission. (2015). Report of the Fourteenth Finance Commission, Volume I. New Delhi.
Green Climate Fund. (2014). Introducing the GCF. Retrieved May 25, 2015, from http://news.gcfund.org/download/PDF/introducing-the-GCF.pdf
International Energy Agency. (2014). CO2 Emissions from Fuel Combustion Highlights. Paris.
International Finance Corporation. (2012). Micro, Small and Medium Enterprise Finance in India. New Delhi.
Kanwal, V. (2015, Feb 19). Financing Initiatives of Bureau of Energy Efficiency. New Delhi.
Kumar, S. (2015, May 20-22). Development of Chandigarh as Model Solar City. Retrieved May 27, May, from Smart Cities India 2015 Expo: http://www.smartcitiesindia.com/smart-cities-india-2015-speaker-profile.aspx?speaker=173
Maini, N. (2014, June 7). SIDBI supports MSMEs through collateral-free loans. Retrieved May 25, 2015, from The Hindu: http://www.thehindu.com/news/cities/Coimbatore/sidbi-supports-msmes-through-collateralfree-loans/article6092332.ece
65 | P a g e

Discussion Paper Financing for Low Carbon Development in India
Ministry of Agriculture, Government of India. (2014, July 15). Schemes for Development of Agriculture and Farmers’ Welfare. Retrieved May 29, 2015, from Press Information Bureau: http://pib.nic.in/newsite/PrintRelease.aspx?relid=106668
Ministry of Environment, Forest & Climate Change, Government of India. (2013). Mission Document, National Mission for Green India. New Delhi.
Ministry of Environment, Forests & Climate Change. (2014). National REDD+ Policy and Strategy (Draft). New Delhi.
Ministry of Finance. (2014). Union Budget 2014-15. New Delhi.
Ministry of Heavy Industries & Public Enterprises, Government of India. (2015, April 8). FAME India. Retrieved July 1, 2015, from Press Information Bureau: http://pib.nic.in/newsite/PrintRelease.aspx?relid=118088
Ministry of Law and Justice. (2013). The Companies Act, 2013. New Delhi.
Ministry of Micro, Small and Medium Enterprises. (2014). Credit Guarantee Fund Scheme for Micro and Small Enterprises.
Ministry of Power, Government of India. (2012). PAT: Perform, Achieve and Trade.
Ministry of Power, Government of India. (2015). Annual Report 2014-15. New Delhi.
Ministry of Steel, Government of India. (2015). Outcome budget of Ministry of Steel 2015-16. New Delhi.
Ministry of Tribal Affairs. (2015, May 13). Identification of 15 Minor Forest Produce for Minimum Support Price. Retrieved June 25, 2015, from Press Information Bureau: http://pib.nic.in/newsite/PrintRelease.aspx?relid=121630
Ministry of Urban Development, Government of India. (2014, March 31). Sector wise projects sanctioned & projects completed. Retrieved May 28, 2015, from JNNURM: http://jnnurm.nic.in/wp-content/uploads/2014/04/Completed-Projects-29-04-20141.pdf
Ministry of Urban Development, Government of India. (2014, September 11). Documents. Retrieved June 26, 2015, from Smart Cities: http://indiansmartcities.in/downloads/Benchmarks_for_Smart_Cities1.pdf
MMR Online Foundry Review. (2012, October). SIDBI has provided Rs 3000 cr to 6000 MSME units for green, energy efficient technology. (B. Verma, Ed.) Foundry Review, 1(2)
MNRE. (2015). Annual Report 2014-15. New Delhi: Ministry of New and Renewable Energy .
MNRE. (2015, January 15). Development of Solar City Programme. Retrieved May 27, 2015, from Ministry of New and Renewable Energy: http://mnre.gov.in/file-manager/UserFiles/Status-Note-on-Solar-Cities.pdf
MNRE. (2015, March 30). Physical progress (achievements). Retrieved May 25, 2015, from Ministry of New and Renewable Energy: http://mnre.gov.in/file-manager/UserFiles/Tentative-State-wise-break-up-of-Renewable-Power-by-2022.pdf
MoF. (2015, February 27). Clean Energy Cess Doubled to Rs.100 per Tonne to Mop up Rs. 17,000 Crores in NCEF. Retrieved May 22, 2015, from Press Information Bureau, Ministry of Finance Press Release:
66 | P a g e

Discussion Paper Financing for Low Carbon Development in India
http://pib.nic.in/newsite/PrintRelease.aspx?relid=116037
Money Control. (2015, March 03). Budget 2015: What’s in it for MSMEs? Retrieved July 22, 2015, from MoneyControl SME Step Up: http://www.moneycontrol.com/sme-stepup/news/budget_2015_whats_in_it_for_msmes-1317923.html
MSME. (2014). Credit Guarantee Fund Scheme for Micro & Small Enterprises. Retrieved May 25, 2015, from Ministry of Micro, Small & Medium Enterprises: http://www.dcmsme.gov.in/schemes/CGTMSE%20guidelines.pdf
NABARD. (2014). Adaptation Fund Board sanctions two projects in India for the first time. Retrieved May 29, 2015, from Press Release National Bank for Agriculture and Rural Development: https://www.nabard.org/pdf/AFB_Press_Release.pdf
Outlook India. (2014, July 10). Budget 2014-15: PPP Is the New Mantra for Infrastructure. Retrieved May 13, 2015, from http://www.outlookindia.com/news/article/budget-201415-ppp-is-the-new-mantra-for-infrastructure/849086
Power Exchange India Ltd. (n.d.). Trading Renewable Energy Certificates (REC). Retrieved May 25, 2015, from PXIL: http://www.powerexindia.com/pxil/rec.aspx
Prime Minister's Office. (2015, April 29). Union Cabinet approves AMRUT and Smart Cities Mission to drive conomic growth and foster inclusive urban development. Retrieved May 25, 2015, from PM India: http://pmindia.gov.in/en/news_updates/union-cabinet-approves-atal-mission-for-rejuvenation-and-urban-transformation-and-cities-mission-to-drive-economic-growth-and-foster-inclusive-urban-development/#rightSubMenusmart-
Raju, S. S., & Chand, R. (2008). Agricultural Insurance in India: Problems and Prospects. New Delhi: National Centre for Agricultural Economics and Policy Research.
Renewable Energy Certificate Registry of India. (2015, May). REC. Retrieved May 14, 2015, from REC Registry India: https://www.recregistryindia.nic.in/
Reserve Bank of India. (2014, July 1). Master Circular - Loans and Advances – Statutory and Other Restrictions.
Reserve Bank of India. (2015, April 23). Priority sector lending - Targets and classification. Mumbai.
Small Industries Development Bank of India (SIDBI). (April, 2014). Environmental Risk Management Framework for Partial Risk Sharing Facility for Energy Efficiency - Volume I.
TERI. (2013). A framework for energy sustainability assessment. Retrieved May 13, 2013, from http://www.teriin.org/ee/pdf/section3.pdf
UNEP. (2012). Promoting low carbon transport in India. Nairobi.
UNFCCC. (2015, April 30). Green Climate Fund: Governments requested to accelerate signing of contributions. Retrieved May 11, 2015, from Financial Flows: http://newsroom.unfccc.int/financial-flows/governments-requested-to-accelerate-signing-of-contributions-to-green-climate-fund/
Upadhyay, A. (2014, December 17). IREDA to raise Rs 1,500 crore via tax-free bonds next fiscal. Retrieved from The Economic Times: http://articles.economictimes.indiatimes.com/2014-12-17/news/57154471_1_ireda-tax-free-bonds-renewable-energy-development-agency
67 | P a g e
Discussion Paper Financing for Low Carbon Development in India
Upadhyay, A. (2015, February). Growing demand for renewable projects to benefit NBFCs. The Times Group.
Urpelainen, J. (2012, October 1). The Clean Development Mechanism in India – is it working? . Ideas for India, International Growth Centre.
Wong, C. M. (2015, March 24). Exim India launches country's first green bond. Finance Asia.
World Bank. (2006). India: Building Capacities for Public Private Partnerships.
World Bank. (2015, March 31). Government of India and World Bank sign agreement for $43 million Partial Risk Sharing Facility for Energy Efficiency Project. Retrieved May 11, 2015, from World Bank press release: http://www.worldbank.org/en/news/press-release/2015/03/31/partial-risk-sharing-facility-energy-efficiency-singing
Yes Bank. (2015, February). Press Releases (2014-15). Retrieved from Yes Bank: http://www.yesbank.in/media-centre/press-releases/fy-2014-15/yes-bank-successfully-issues-india-s-first-green-infrastructure-bond.html
Zhang, D., Karplus, V. J., Cassisa, C., & Zhang, X. (2014). Emissions trading in China: Progress and prospects. Energy Policy, 75, 9-16.
68 | P a g e

Discussion Paper Financing for Low Carbon Development in India
Annexures: Stakeholder Perspectives Annexure 1: Key Challenges in Financing
What are the key challenges in financing low carbon development projects?
RE
Building
Transport
Agriculture
Industry
Waste
Non-RE Total
Lack of awareness/understanding of such projects 69% 75% 45% 14% 40% 29% 65% 48% Sustainability issues not prioritized by financial decision makers (e.g. Banks, FIs) 38% 39% 82% 57% 28% 62% 41% 49% High costs (including high interest rates) of financing 63% 51% 68% 27% 55% 38% 50% 50% Lack of commercialization 31% 16% 14% 11% 9% 14% 41% 19% Inadequate tax incentives 40% 43% 55% 38% 19% 43% 38% 39% Inadequate subsidies 71% 43% 64% 54% 34% 29% 54% 50% Inadequate public finance availability 42% 22% 50% 49% 26% 29% 50% 38% Inadequate legislation 38% 25% 14% 5% 14% 19% 21% 19% Inadequate Government coordination 25% 34% 73% 14% 25% 48% 38% 36% Procedural complexities 29% 18% 41% 11% 7% 38% 21% 24% Lack of guidelines by banks 17% 10% 32% 46% 7% 19% 17% 21% Note: Highlighted cell indicates top three reasons
69 | P a g e

Discussion Paper Financing for Low Carbon Development in India
Annexure 2: Decision-making and Finance
What is the nature of the financial analysis for decision making?
RE Building Transport
Agriculture Industry Waste Non-RE Total
Quantitative Cost benefit analysis 72.92% 43% 82% 63% 51% 84% 71% 67% Payback period 37.50% 31% 86% 24% 54% 79% 58% 53% NPV (net present value) 33.33% 37% 73% 21% 26% 63% 42% 42% IRR (internal rate of return) 47.92% 28% 68% 16% 37% 61% 29% 41% Detailed financial statement analysis 41.67% 27% 71% 13% 35% 53% 54% 42% DSCR (debt service cost ratio) 37.50% 34% 73% 45% 37% 51% 29% 44% Financial statement modelling 31.25% 36% 77% 43% 25% 63% 8% 41% Real options analysis 39.58% 30% 77% 29% 5% 68% 54% 43% Qualitative Risk perception (Yes = 1) 47.92% 25% 18% 54% 30% 32% 21% 33% Experience (Yes = 1) 43.75% 34% 14% 35% 37% 31% 17% 30% Needs based (Yes = 1) 31.25% 21% 9% 45% 14% 21% 17% 23% Conservative estimates (Yes = 1) 33.33% 15% 5% 16% 49% 36% 4% 23% Note: Highlighted cell indicates option with highest value
70 | P a g e
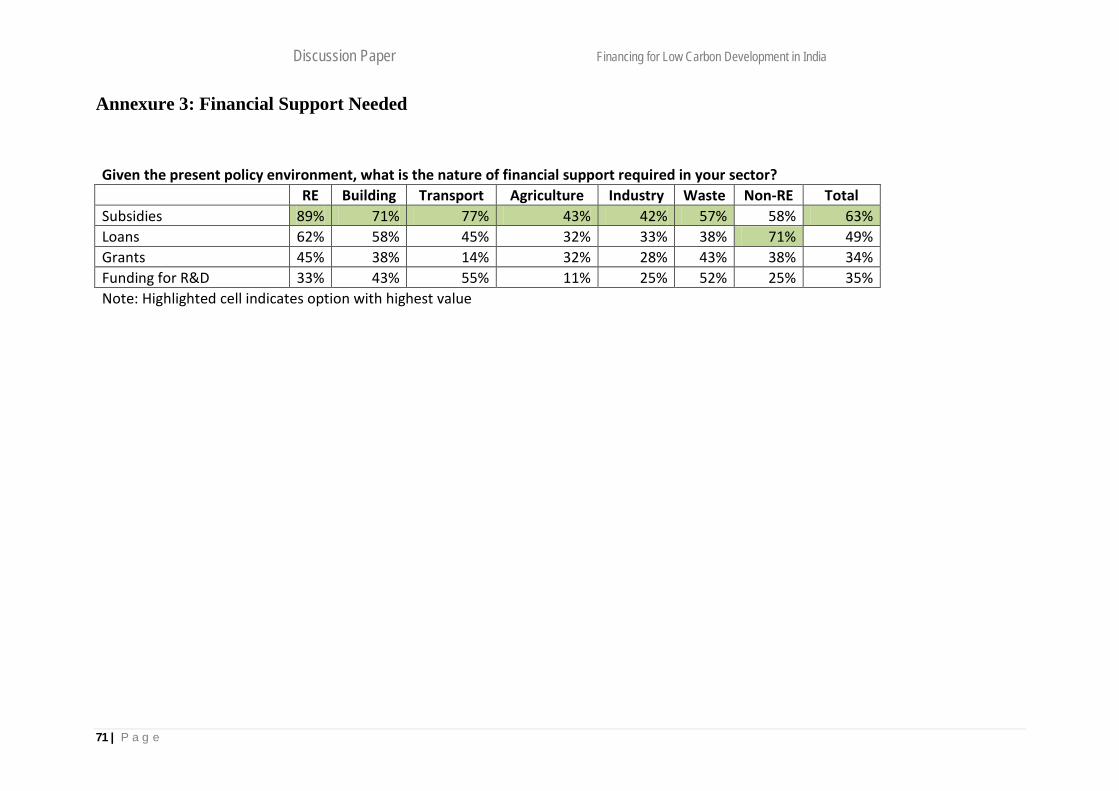
Discussion Paper Financing for Low Carbon Development in India
Annexure 3: Financial Support Needed
Given the present policy environment, what is the nature of financial support required in your sector? RE Building Transport Agriculture Industry Waste Non-RE Total
Subsidies 89% 71% 77% 43% 42% 57% 58% 63% Loans 62% 58% 45% 32% 33% 38% 71% 49% Grants 45% 38% 14% 32% 28% 43% 38% 34% Funding for R&D 33% 43% 55% 11% 25% 52% 25% 35% Note: Highlighted cell indicates option with highest value
71 | P a g e
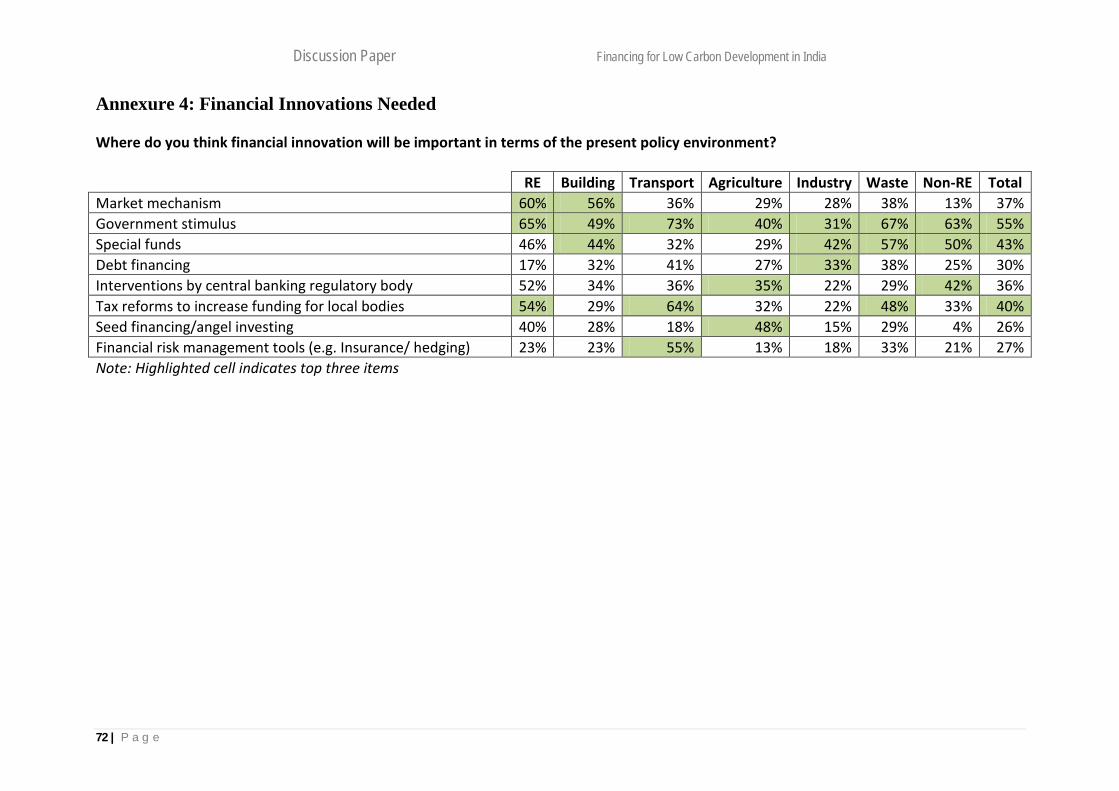
Discussion Paper Financing for Low Carbon Development in India
Annexure 4: Financial Innovations Needed
Where do you think financial innovation will be important in terms of the present policy environment?
RE Building Transport Agriculture Industry Waste Non-RE Total Market mechanism 60% 56% 36% 29% 28% 38% 13% 37% Government stimulus 65% 49% 73% 40% 31% 67% 63% 55% Special funds 46% 44% 32% 29% 42% 57% 50% 43% Debt financing 17% 32% 41% 27% 33% 38% 25% 30% Interventions by central banking regulatory body 52% 34% 36% 35% 22% 29% 42% 36% Tax reforms to increase funding for local bodies 54% 29% 64% 32% 22% 48% 33% 40% Seed financing/angel investing 40% 28% 18% 48% 15% 29% 4% 26% Financial risk management tools (e.g. Insurance/ hedging) 23% 23% 55% 13% 18% 33% 21% 27% Note: Highlighted cell indicates top three items
72 | P a g e

Discussion Paper Financing for Low Carbon Development in India
Annexure 5: Prominent Source of Financing in Future
What kind of financing do you think would be the most prominent source for financing sustainability projects in future?
RE Building Transport Agriculture Industry Waste Non-RE Total Equity 54% 28% 32% 32% 34% 24% 38% 35% Debt 40% 37% 9% 14% 22% 29% 25% 25% Public Finance 65% 64% 41% 43% 37% 57% 33% 49% Grants 23% 21% 14% 19% 19% 33% 33% 23% Angel investments 15% 19% 32% 3% 9% 0% 4% 12% International finance (low interest debt/grants) 46% 22% 9% 27% 24% 43% 29% 29% Finance from multi-lateral agencies 35% 25% 9% 22% 15% 14% 21% 20% Government stimulus 48% 31% 45% 43% 12% 48% 46% 39% Venture capital 20% 13% 14% 14% 30% 5% 17% 16% Note: Highlighted cell indicates top three reasons
73 | P a g e
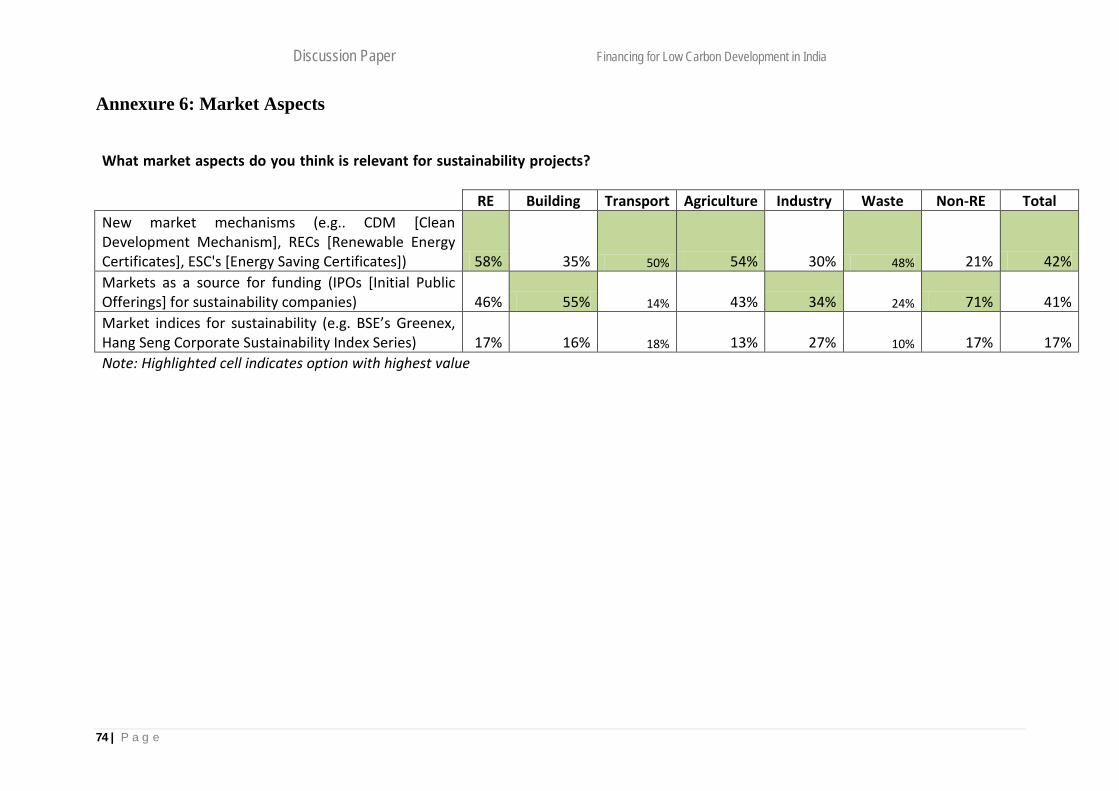
Discussion Paper Financing for Low Carbon Development in India
Annexure 6: Market Aspects
What market aspects do you think is relevant for sustainability projects?
RE Building Transport Agriculture Industry Waste Non-RE Total New market mechanisms (e.g.. CDM [Clean Development Mechanism], RECs [Renewable Energy Certificates], ESC's [Energy Saving Certificates]) 58% 35% 50% 54% 30% 48% 21% 42% Markets as a source for funding (IPOs [Initial Public Offerings] for sustainability companies) 46% 55% 14% 43% 34% 24% 71% 41% Market indices for sustainability (e.g. BSE’s Greenex, Hang Seng Corporate Sustainability Index Series) 17% 16% 18% 13% 27% 10% 17% 17% Note: Highlighted cell indicates option with highest value
74 | P a g e