Embed Size (px)
Citation preview

1
Full Year 2011 Earnings 16 February 2012
Financial Supplement

2
3
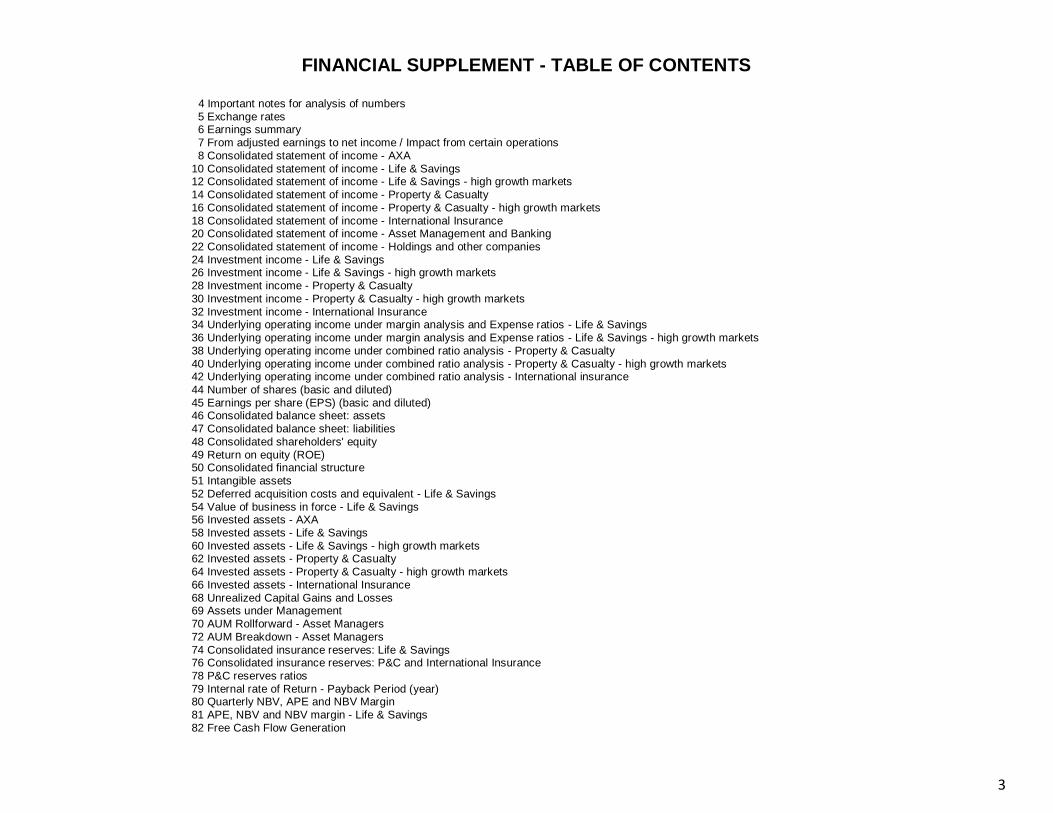
FINANCIAL SUPPLEMENT - TABLE OF CONTENTS
4 Important notes for analysis of numbers 5 Exchange rates 6 Earnings summary 7 From adjusted earnings to net income / Impact from certain operations 8 Consolidated statement of income - AXA 10 Consolidated statement of income - Life & Savings 12 Consolidated statement of income - Life & Savings - high growth markets 14 Consolidated statement of income - Property & Casualty 16 Consolidated statement of income - Property & Casualty - high growth markets
18 Consolidated statement of income - International Insurance 20 Consolidated statement of income - Asset Management and Banking 22 Consolidated statement of income - Holdings and other companies 24 Investment income - Life & Savings 26 Investment income - Life & Savings - high growth markets 28 Investment income - Property & Casualty
30 Investment income - Property & Casualty - high growth markets 32 Investment income - International Insurance 34 Underlying operating income under margin analysis and Expense ratios - Life & Savings 36 Underlying operating income under margin analysis and Expense ratios - Life & Savings - high growth markets 38 Underlying operating income under combined ratio analysis - Property & Casualty 40 Underlying operating income under combined ratio analysis - Property & Casualty - high growth markets 42 Underlying operating income under combined ratio analysis - International insurance
44 Number of shares (basic and diluted) 45 Earnings per share (EPS) (basic and diluted) 46 Consolidated balance sheet: assets 47 Consolidated balance sheet: liabilities 48 Consolidated shareholders' equity 49 Return on equity (ROE) 50 Consolidated financial structure
51 Intangible assets 52 Deferred acquisition costs and equivalent - Life & Savings 54 Value of business in force - Life & Savings 56 Invested assets - AXA 58 Invested assets - Life & Savings 60 Invested assets - Life & Savings - high growth markets 62 Invested assets - Property & Casualty 64 Invested assets - Property & Casualty - high growth markets 66 Invested assets - International Insurance 68 Unrealized Capital Gains and Losses 69 Assets under Management 70 AUM Rollforward - Asset Managers 72 AUM Breakdown - Asset Managers
74 Consolidated insurance reserves: Life & Savings 76 Consolidated insurance reserves: P&C and International Insurance 78 P&C reserves ratios 79 Internal rate of Return - Payback Period (year) 80 Quarterly NBV, APE and NBV Margin 81 APE, NBV and NBV margin - Life & Savings 82 Free Cash Flow Generation
4
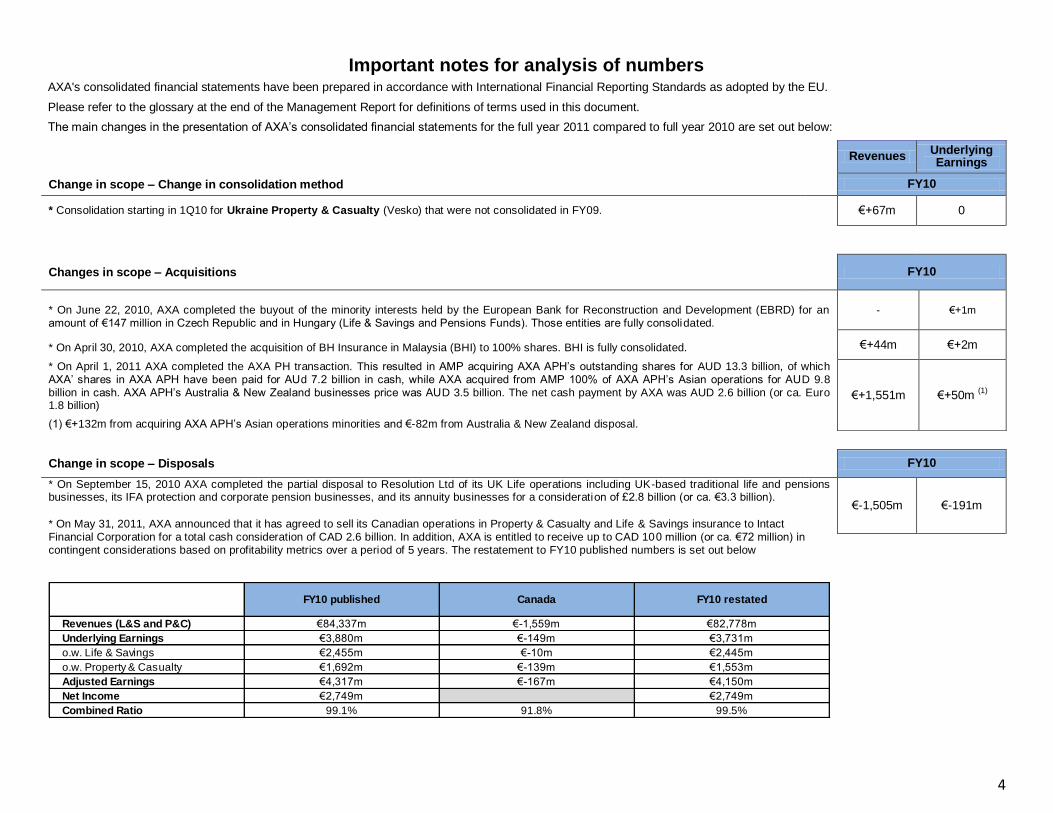
Important notes for analysis of numbers
AXA's consolidated financial statements have been prepared in accordance with International Financial Reporting Standards as adopted by the EU.
Please refer to the glossary at the end of the Management Report for definitions of terms used in this document.
The main changes in the presentation of AXA’s consolidated financial statements for the full year 2011 compared to full year 2010 are set out below:
Revenues Underlying Earnings
Change in scope – Change in consolidation method FY10
* Consolidation starting in 1Q10 for Ukraine Property & Casualty (Vesko) that were not consolidated in FY09. €+67m 0
Changes in scope – Acquisitions
FY10
* On June 22, 2010, AXA completed the buyout of the minority interests held by the European Bank for Reconstruction and Development (EBRD) for an amount of €147 million in Czech Republic and in Hungary (Life & Savings and Pensions Funds). Those entities are fully consolidated.
- €+1m
* On April 30, 2010, AXA completed the acquisition of BH Insurance in Malaysia (BHI) to 100% shares. BHI is fully consolidated. €+44m €+2m
* On April 1, 2011 AXA completed the AXA PH transaction. This resulted in AMP acquiring AXA APH’s outstanding shares for AUD 13.3 billion, of which AXA’ shares in AXA APH have been paid for AUd 7.2 billion in cash, while AXA acquired from AMP 100% of AXA APH’s Asian operations for AUD 9.8
billion in cash. AXA APH’s Australia & New Zealand businesses price was AUD 3.5 billion. The net cash payment by AXA was AUD 2.6 billion (or ca. Euro 1.8 billion)
(1) €+132m from acquiring AXA APH’s Asian operations minorities and €-82m from Australia & New Zealand disposal.
€+1,551m €+50m (1)
Change in scope – Disposals
FY10
* On September 15, 2010 AXA completed the partial disposal to Resolution Ltd of its UK Life operations including UK-based traditional life and pensions businesses, its IFA protection and corporate pension businesses, and its annuity businesses for a consideration of £2.8 billion (or ca. €3.3 billion).
* On May 31, 2011, AXA announced that it has agreed to sell its Canadian operations in Property & Casualty and Life & Savings insurance to Intact Financial Corporation for a total cash consideration of CAD 2.6 billion. In addition, AXA is entitled to receive up to CAD 100 million (or ca. €72 million) in contingent considerations based on profitability metrics over a period of 5 years. The restatement to FY10 published numbers is set out below
€-1,505m €-191m
FY10 published Canada FY10 restated
Revenues (L&S and P&C) €84,337m €-1,559m €82,778m
Underlying Earnings €3,880m €-149m €3,731m
o.w. Life & Savings €2,455m €-10m €2,445m
o.w. Property & Casualty €1,692m €-139m €1,553m
Adjusted Earnings €4,317m €-167m €4,150m
Net Income €2,749m €2,749m
Combined Ratio 99.1% 91.8% 99.5%
5
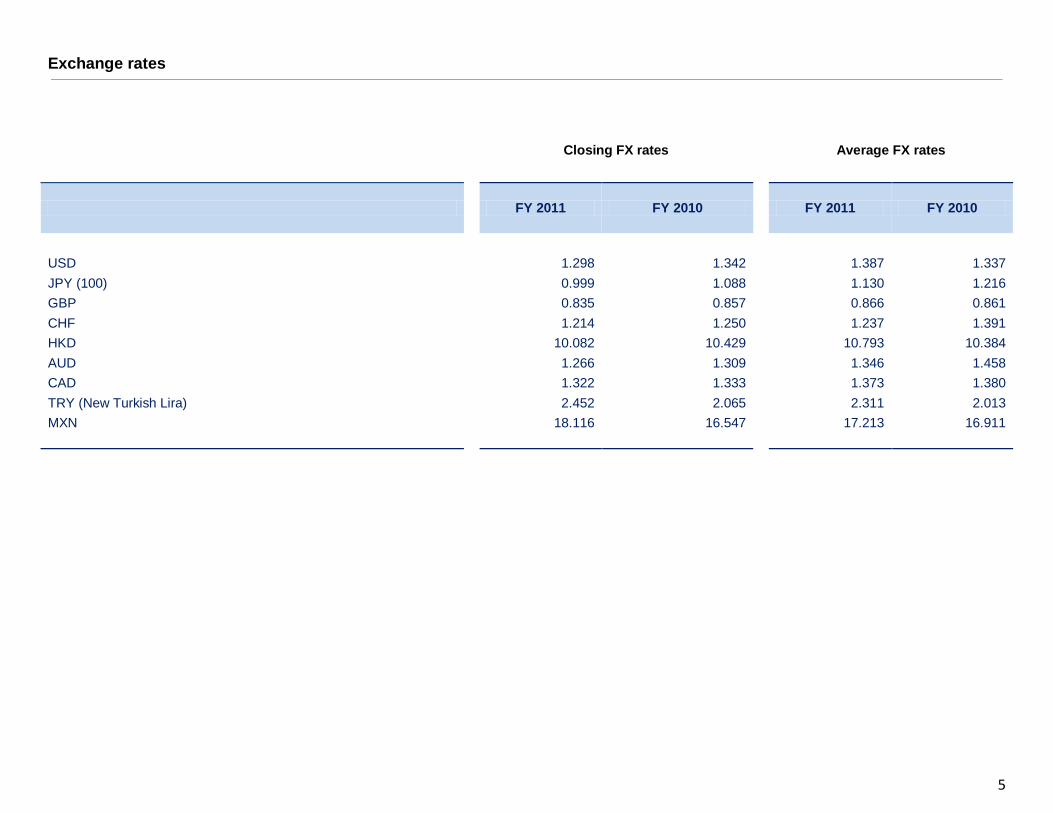
Exchange rates
Closing FX rates
Average FX rates
FY 2011 FY 2010
FY 2011 FY 2010
USD
1.298 1.342
1.387 1.337
JPY (100)
0.999 1.088
1.130 1.216
GBP
0.835 0.857
0.866 0.861
CHF
1.214 1.250
1.237 1.391
HKD
10.082 10.429
10.793 10.384
AUD
1.266 1.309
1.346 1.458
CAD
1.322 1.333
1.373 1.380
TRY (New Turkish Lira)
2.452 2.065
2.311 2.013
MXN
18.116 16.547
17.213 16.911

6
EARNINGS SUMMARY
CONSOLIDATED EARNINGS (in Euro million) - Group Share
Net income
Group Share
Exceptional and
Discontinued operations
Integration and
restructuring costs
Goodwill and related
Intangibles
Profit or Loss
(including change) on
financial assets
(under Fair Value option) & derivatives
Adjusted Earnings
Net realized capital gains attributable
to shareholders
Underlying earnings
FY
2010 FY
2011 FY
2010 FY
2011 FY
2010 FY
2011 FY
2010 FY
2011 FY
2010 FY
2011 FY
2010 FY
2011 Change
Change at
constant FX
FY 2010
FY 2011
FY 2010
FY 2011
Change
Change at
constant FX
Life & Savings
1,396 2,193 (1,634) 745 (16) (42) (22) (1,015) 347 273 2,721 2,232 -18% -19% 276 (35) 2,445 2,267 -7% -9%
France
917 741 0 0 0 0 0 0 63 (83) 854 825 -3% -3% 247 193 607 632 4% 4%
United States
410 (343) 0 0 (3) (29) (1) (944) 73 330 340 301 -12% -8% (138) (11) 478 312 -35% -32%
United Kingdom
(1,468) (93) (1,642) (37) (1) (3) (12) (50) 59 3 128 (5) n.a n.a (6) 2 134 (6) n.a n.a
Japan 377 354 0 0 (9) 0 0 0 46 19 340 335 -2% -9% 5 12 335 323 -4% -10%
Germany
214 152 1 0 (0) (1) 0 0 29 2 185 151 -18% -18% 11 (42) 174 192 11% 11%
Switzerland 361 1,172 51 798 0 0 (6) (7) 69 100 247 280 14% 1% 34 (13) 212 293 38% 23%
Belgium 265 (9) (4) 0 (3) (7) 0 0 33 (70) 239 68 -72% -72% 69 (88) 170 155 -9% -9%
Central & Eastern Europe
6 6 0 0 (0) 0 (3) (2) (1) (0) 10 8 -11% -12% 1 (0) 9 9 4% 2%
Mediterranean & Latin American Region
127 24 0 (0) 0 (2) (0) (12) (24) 14 152 24 -84% -84% 35 (80) 117 104 -11% -11%
Asia excl. Japan (a)
117 200 (50) (18) 0 0 0 0 0 (45) 167 263 57% 62% 22 (10) 145 273 88% 94%
Other countries (b)
71 (11) 11 2 (0) (0) 0 0 1 5 59 (18) n.a n.a (4) 2 64 (19) n.a n.a
Property & Casualty
1,750 1,700 153 147 (22) (78) (59) (66) 29 (90) 1,649 1,786 8% 6% 96 (62) 1,553 1,848 19% 16%
France
452 431 0 0 0 0 0 0 (7) (14) 459 445 -3% -3% 34 (52) 424 496 17% 17%
United Kingdom & Ireland
83 97 0 53 (10) (20) (1) (1) 5 (120) 89 184 107% 107% (9) (26) 98 211 115% 116%
Germany
190 186 0 0 (3) (8) (0) (4) 7 25 185 172 -7% -7% 8 (49) 177 221 25% 25%
Switzerland
370 375 9 0 0 0 (26) (29) (12) 2 400 402 1% -11% 40 5 359 397 11% -2%
Belgium
145 233 (2) 0 (9) (22) (2) (2) 20 17 137 240 75% 75% (15) 98 153 142 -7% -7%
Central & Eastern Europe (c)
31 17 0 0 0 0 0 (3) (0) 2 31 18 -42% -42% 0 (19) 30 37 21% 22%
Mediterranean & Latin American Region
379 306 (1) 0 0 (21) (24) (22) 13 14 391 336 -14% -14% 23 (17) 368 353 -4% -3%
Direct
(65) (63) 0 0 0 (7) (5) (4) 2 (15) (62) (36) 41% 40% (0) (4) (62) (33) 47% 46%
Other countries (d)
166 118 147 93 (0) 0 0 0 (0) (0) 19 25 34% 31% 13 2 6 23 285% 279%
International Insurance
378 276 3 1 0 (4) 0 0 32 (15) 343 294 -15% -15% 53 17 290 276 -5% -6%
AXA Corporate Solutions Assurance
192 142 0 0 0 0 0 0 26 (13) 166 155 -6% -6% 5 5 161 150 -7% -7%
Other
186 134 3 1 0 (4) 0 0 6 (2) 177 138 -22% -23% 48 12 129 126 -2% -4%
Asset Management
255 153 2 (3) (31) (137) 0 0 21 (25) 264 318 21% 21% (5) (2) 269 321 19% 20%
AllianceBernstein
116 (38) 2 0 (29) (136) 0 0 0 (7) 143 106 -26% -23% 0 0 143 106 -26% -23%
AXA Investment Managers 139 191 0 (3) (2) (1) 0 0 20 (18) 120 212 76% 74% (5) (2) 125 215 72% 69%
Banking
9 (237) 0 (144) (6) (21) (0) (86) 9 (13) 7 27 309% 331% (3) (5) 9 32 240% 256%
Holdings and other companies (1,040) 240 20 1,324 (0) (0) 0 0 (226) (17) (834) (1,067) -28% -28% 2 (224) (836) (843) -1% -1%
TOTAL
2,749 4,324 (1,456) 2,069 (76) (281) (81) (1,167) 212 114 4,150 3,589 -14% -15% 419 (312) 3,731 3,901 5% 2%
(a) Asia excl. Japan corresponds to Hong Kong, South-East Asia, India & China. (b) Other countries correspond to Australia/New Zealand, Luxembourg, ARCHITAS, AXA Life Europe and AXA Global Distributors. (c) Including Russia (d) Other countries correspond to Luxembourg, Singapore, Hong Kong and Malaysia
7
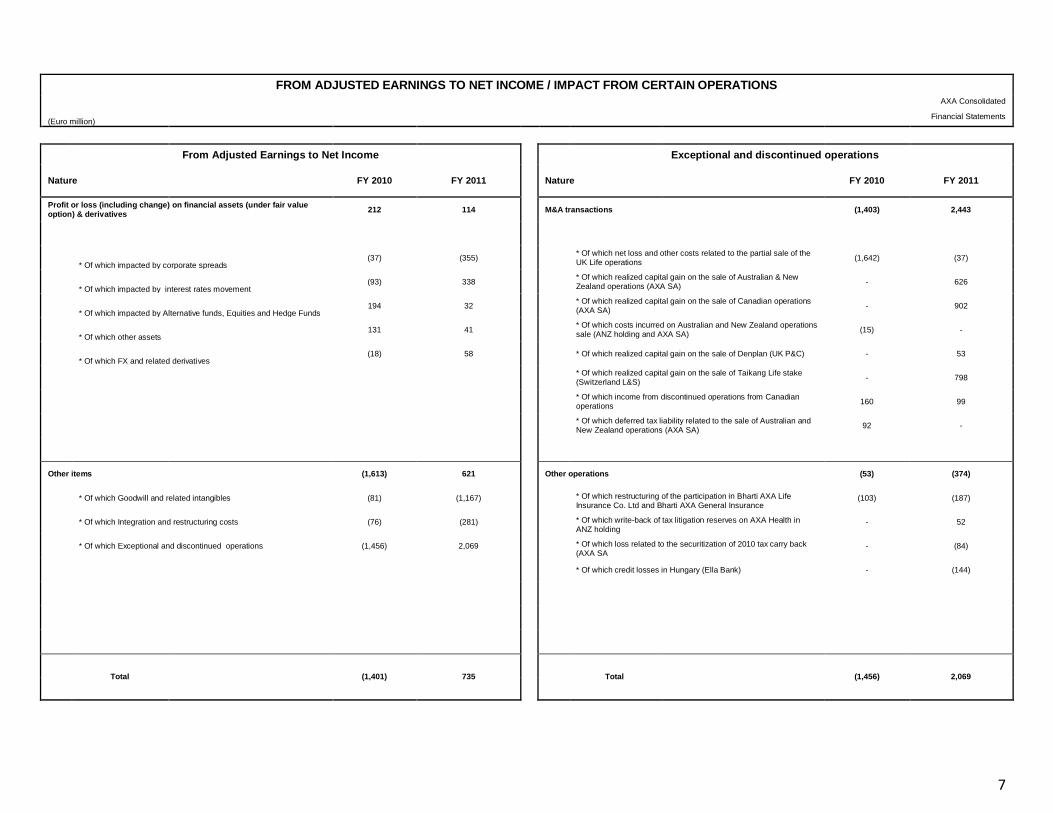
FROM ADJUSTED EARNINGS TO NET INCOME / IMPACT FROM CERTAIN OPERATIONS
AXA Consolidated
(Euro million) Financial Statements
From Adjusted Earnings to Net Income
Exceptional and discontinued operations
Nature FY 2010 FY 2011 Nature FY 2010 FY 2011
Profit or loss (including change) on financial assets (under fair value option) & derivatives
212 114
M&A transactions (1,403) 2,443
* Of which impacted by corporate spreads
(37) (355)
* Of which net loss and other costs related to the partial sale of the UK Life operations
(1,642) (37)
* Of which impacted by interest rates movement
(93) 338
* Of which realized capital gain on the sale of Australian & New Zealand operations (AXA SA)
- 626
* Of which impacted by Alternative funds, Equities and Hedge Funds
194 32
* Of which realized capital gain on the sale of Canadian operations (AXA SA)
- 902
* Of which other assets
131 41
* Of which costs incurred on Australian and New Zealand operations sale (ANZ holding and AXA SA)
(15) -
* Of which FX and related derivatives
(18) 58
* Of which realized capital gain on the sale of Denplan (UK P&C) - 53
* Of which realized capital gain on the sale of Taikang Life stake (Switzerland L&S)
- 798
* Of which income from discontinued operations from Canadian operations
160 99
* Of which deferred tax liability related to the sale of Australian and New Zealand operations (AXA SA)
92 -
Other items
(1,613) 621
Other operations (53) (374)
* Of which Goodwill and related intangibles (81) (1,167)
* Of which restructuring of the participation in Bharti AXA Life Insurance Co. Ltd and Bharti AXA General Insurance
(103) (187)
* Of which Integration and restructuring costs (76) (281)
* Of which write-back of tax litigation reserves on AXA Health in ANZ holding
- 52
* Of which Exceptional and discontinued operations (1,456) 2,069
* Of which loss related to the securitization of 2010 tax carry back (AXA SA
- (84)
* Of which credit losses in Hungary (Ella Bank) - (144)
Total
(1,401) 735
Total
(1,456) 2,069
8
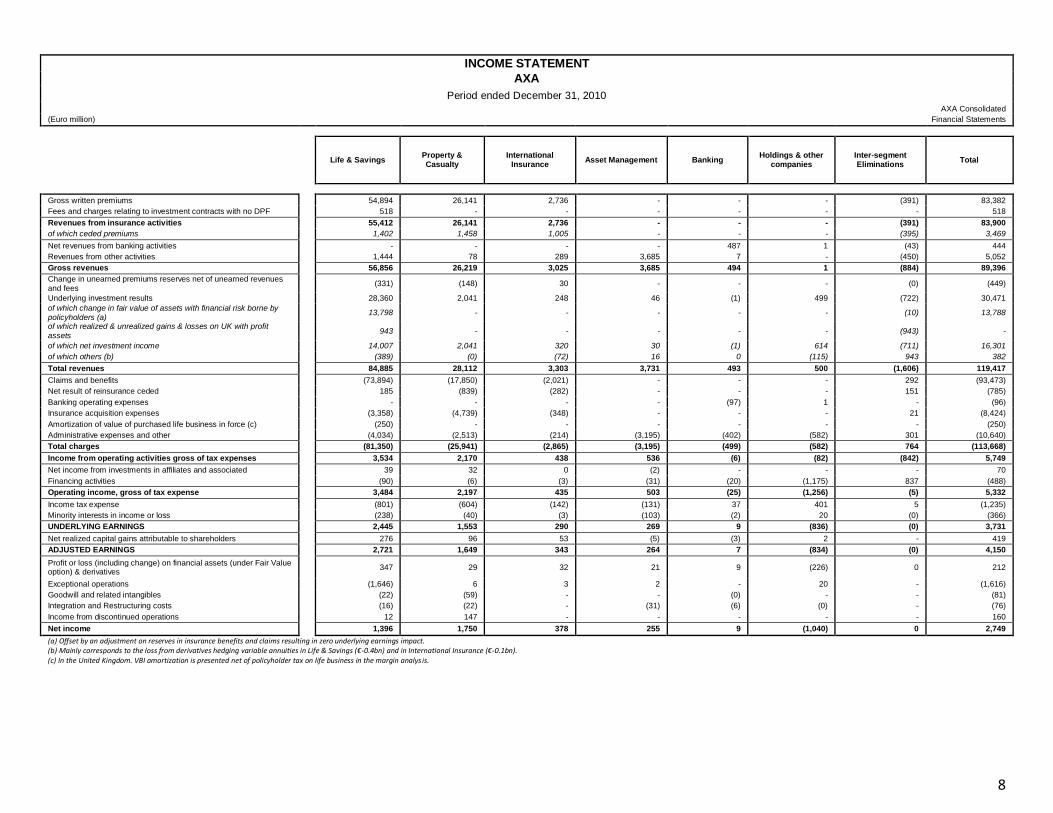
INCOME STATEMENT
AXA
Period ended December 31, 2010
AXA Consolidated
(Euro million) Financial Statements
Life & Savings Property & Casualty
International Insurance
Asset Management Banking Holdings & other
companies Inter-segment Eliminations
Total
Gross written premiums 54,894 26,141 2,736 - - - (391) 83,382
Fees and charges relating to investment contracts with no DPF 518 - - - - - - 518
Revenues from insurance activities 55,412 26,141 2,736 - - - (391) 83,900
of which ceded premiums 1,402 1,458 1,005 - - - (395) 3,469
Net revenues from banking activities - - - - 487 1 (43) 444
Revenues from other activities 1,444 78 289 3,685 7 - (450) 5,052
Gross revenues 56,856 26,219 3,025 3,685 494 1 (884) 89,396
Change in unearned premiums reserves net of unearned revenues and fees
(331) (148) 30 - - - (0) (449)
Underlying investment results 28,360 2,041 248 46 (1) 499 (722) 30,471
of which change in fair value of assets with financial risk borne by policyholders (a)
13,798 - - - - - (10) 13,788
of which realized & unrealized gains & losses on UK with profit assets
943 - - - - - (943) -
of which net investment income 14,007 2,041 320 30 (1) 614 (711) 16,301
of which others (b) (389) (0) (72) 16 0 (115) 943 382
Total revenues 84,885 28,112 3,303 3,731 493 500 (1,606) 119,417
Claims and benefits (73,894) (17,850) (2,021) - - - 292 (93,473)
Net result of reinsurance ceded 185 (839) (282) - - - 151 (785)
Banking operating expenses - - - - (97) 1 - (96)
Insurance acquisition expenses (3,358) (4,739) (348) - - - 21 (8,424)
Amortization of value of purchased life business in force (c) (250) - - - - - - (250)
Administrative expenses and other (4,034) (2,513) (214) (3,195) (402) (582) 301 (10,640)
Total charges (81,350) (25,941) (2,865) (3,195) (499) (582) 764 (113,668)
Income from operating activities gross of tax expenses 3,534 2,170 438 536 (6) (82) (842) 5,749
Net income from investments in affiliates and associated 39 32 0 (2) - - - 70
Financing activities (90) (6) (3) (31) (20) (1,175) 837 (488)
Operating income, gross of tax expense 3,484 2,197 435 503 (25) (1,256) (5) 5,332
Income tax expense (801) (604) (142) (131) 37 401 5 (1,235)
Minority interests in income or loss (238) (40) (3) (103) (2) 20 (0) (366)
UNDERLYING EARNINGS 2,445 1,553 290 269 9 (836) (0) 3,731
Net realized capital gains attributable to shareholders 276 96 53 (5) (3) 2 - 419
ADJUSTED EARNINGS 2,721 1,649 343 264 7 (834) (0) 4,150
Profit or loss (including change) on financial assets (under Fair Value option) & derivatives
347 29 32 21 9 (226) 0 212
Exceptional operations (1,646) 6 3 2 - 20 - (1,616)
Goodwill and related intangibles (22) (59) - - (0) - - (81)
Integration and Restructuring costs (16) (22) - (31) (6) (0) - (76)
Income from discontinued operations 12 147 - - - - - 160
Net income 1,396 1,750 378 255 9 (1,040) 0 2,749
(a) Offset by an adjustment on reserves in insurance benefits and claims resulting in zero underlying earnings impact. (b) Mainly corresponds to the loss from derivatives hedging variable annuities in Life & Savings (€-0.4bn) and in International Insurance (€-0.1bn). (c) In the United Kingdom. VBI amortization is presented net of policyholder tax on life business in the margin analys is.

9
INCOME STATEMENT
AXA
Period ended December 31, 2011
AXA Consolidated
(Euro million) Financial Statements
Life & Savings Property & Casualty
International Insurance
Asset Management Banking Holdings & other
companies Inter-segment Eliminations
Total
Gross written premiums 50,947 27,212 2,791 - - - (380) 80,570
Fees and charges relating to investment contracts with no DPF 350 - - - - - - 350
Revenues from insurance activities 51,298 27,212 2,791 - - - (380) 80,920
of which ceded premiums 1,207 1,652 985 - - - (364) 3,480
Net revenues from banking activities - - - - 494 1 (81) 414
Revenues from other activities 1,183 74 267 3,601 6 - (423) 4,708
Gross revenues 52,481 27,286 3,057 3,601 500 1 (883) 86,042
Change in unearned premiums reserves net of unearned revenues and fees
(150) (431) 26 - - - 7 (547)
Underlying investment results 12,725 2,040 396 (11) (2) 449 (483) 15,114
of which change in fair value of assets with financial risk borne by policyholders (a)
(4,977) - - - - - - (4,977)
of which realized & unrealized gains & losses on UK with profit assets
- - - - - - - -
of which net investment income 13,510 2,041 328 7 (2) 519 (475) 15,928
of which others (b) 4,192 (1) 68 (18) - (70) (9) 4,162
Total revenues 65,056 28,895 3,479 3,590 498 451 (1,359) 100,609
Claims and benefits (55,429) (18,143) (2,048) - - - 199 (75,422)
Net result of reinsurance ceded 181 (905) (217) - - - 209 (733)
Banking operating expenses - - - - (88) 1 - (87)
Insurance acquisition expenses (3,075) (4,736) (359) - - - 10 (8,160)
Amortization of value of purchased life business in force (c) (241) - - - - - - (241)
Administrative expenses and other (3,475) (2,514) (430) (2,977) (352) (590) 224 (10,113)
Total charges (62,038) (26,298) (3,054) (2,977) (440) (589) 641 (94,755)
Income from operating activities gross of tax expenses 3,018 2,597 425 613 58 (138) (718) 5,854
Net income from investments in affiliates and associated 47 38 0 (0) - - - 85
Financing activities (113) (6) (4) (37) (18) (1,100) 918 (360)
Operating income, gross of tax expense 2,951 2,629 421 576 39 (1,238) 200 5,579
Income tax expense (597) (748) (143) (146) (6) 387 (200) (1,453)
Minority interests in income or loss (87) (33) (2) (109) (2) 8 - (224)
UNDERLYING EARNINGS 2,267 1,848 276 321 32 (843) 0 3,901
Net realized capital gains attributable to shareholders (35) (62) 17 (2) (5) (224) - (312)
ADJUSTED EARNINGS 2,232 1,786 294 318 27 (1,067) 0 3,589
Profit or loss (including change) on financial assets (under Fair Value option) & derivatives
273 (90) (15) (25) (13) (17) - 114
Exceptional operations 739 53 1 (3) (144) 1,324 - 1,970
Goodwill and related intangibles (1,015) (66) - - (86) - - (1,167)
Integration and Restructuring costs (42) (78) (4) (137) (21) (0) - (281)
Income from discontinued operations 6 93 - - - - - 99
Net income 2,193 1,700 276 153 (237) 240 0 4,324
(a) Offset by an adjustment on reserves in insurance benefits and claims resulting in zero underlying earnings impact. (b) Mainly corresponds to the gain from derivatives hedging variable annuities in Life & Savings (€+4.2bn) and in International Insurance (€+0.1bn). (c) In the United Kingdom. VBI amortization is presented net of policyholder tax on life business in the margin analysis.
10
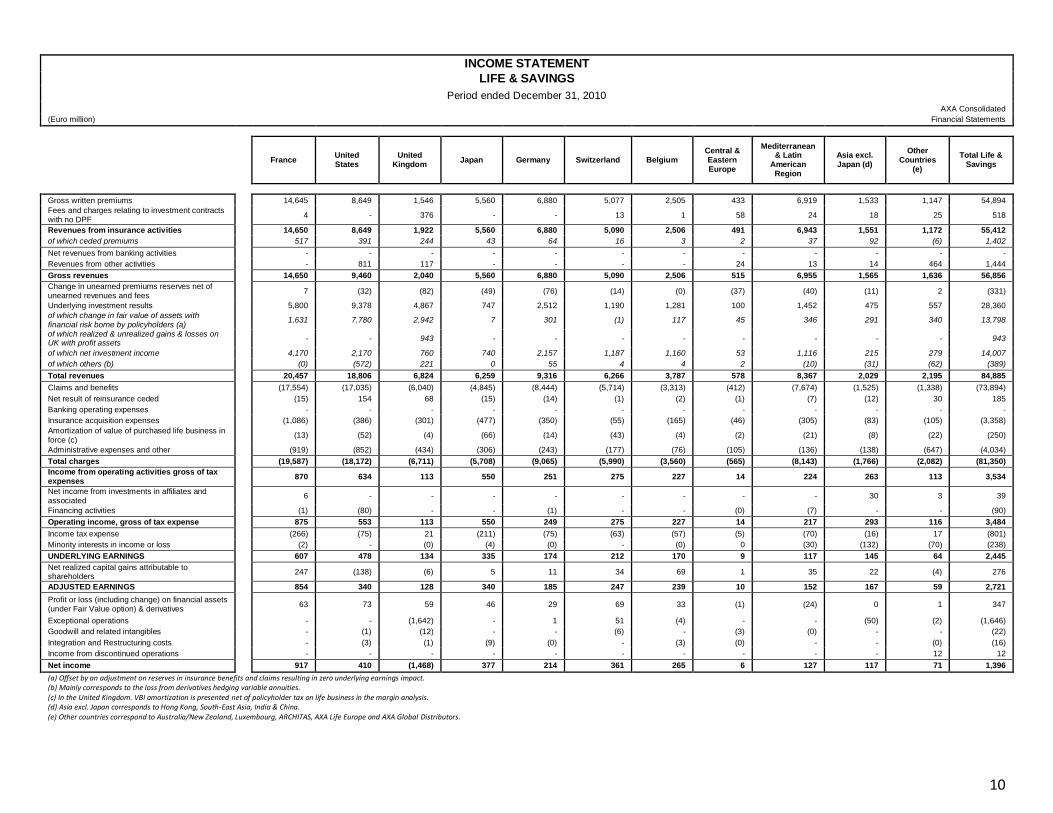
INCOME STATEMENT
LIFE & SAVINGS
Period ended December 31, 2010
AXA Consolidated
(Euro million) Financial Statements
France United States
United Kingdom
Japan Germany Switzerland Belgium Central & Eastern Europe
Mediterranean & Latin
American Region
Asia excl. Japan (d)
Other Countries
(e)
Total Life & Savings
Gross written premiums 14,645 8,649 1,546 5,560 6,880 5,077 2,505 433 6,919 1,533 1,147 54,894
Fees and charges relating to investment contracts with no DPF
4 - 376 - - 13 1 58 24 18 25 518
Revenues from insurance activities 14,650 8,649 1,922 5,560 6,880 5,090 2,506 491 6,943 1,551 1,172 55,412
of which ceded premiums 517 391 244 43 64 16 3 2 37 92 (6) 1,402
Net revenues from banking activities - - - - - - - - - - - -
Revenues from other activities - 811 117 - - - - 24 13 14 464 1,444
Gross revenues 14,650 9,460 2,040 5,560 6,880 5,090 2,506 515 6,955 1,565 1,636 56,856
Change in unearned premiums reserves net of unearned revenues and fees
7 (32) (82) (49) (76) (14) (0) (37) (40) (11) 2 (331)
Underlying investment results 5,800 9,378 4,867 747 2,512 1,190 1,281 100 1,452 475 557 28,360
of which change in fair value of assets with financial risk borne by policyholders (a)
1,631 7,780 2,942 7 301 (1) 117 45 346 291 340 13,798
of which realized & unrealized gains & losses on UK with profit assets
- - 943 - - - - - - - - 943
of which net investment income 4,170 2,170 760 740 2,157 1,187 1,160 53 1,116 215 279 14,007
of which others (b) (0) (572) 221 0 55 4 4 2 (10) (31) (62) (389)
Total revenues 20,457 18,806 6,824 6,259 9,316 6,266 3,787 578 8,367 2,029 2,195 84,885
Claims and benefits (17,554) (17,035) (6,040) (4,845) (8,444) (5,714) (3,313) (412) (7,674) (1,525) (1,338) (73,894)
Net result of reinsurance ceded (15) 154 68 (15) (14) (1) (2) (1) (7) (12) 30 185
Banking operating expenses - - - - - - - - - - - -
Insurance acquisition expenses (1,086) (386) (301) (477) (350) (55) (165) (46) (305) (83) (105) (3,358)
Amortization of value of purchased life business in force (c)
(13) (52) (4) (66) (14) (43) (4) (2) (21) (8) (22) (250)
Administrative expenses and other (919) (852) (434) (306) (243) (177) (76) (105) (136) (138) (647) (4,034)
Total charges (19,587) (18,172) (6,711) (5,708) (9,065) (5,990) (3,560) (565) (8,143) (1,766) (2,082) (81,350)
Income from operating activities gross of tax expenses
870 634 113 550 251 275 227 14 224 263 113 3,534
Net income from investments in affiliates and associated
6 - - - - - - - - 30 3 39
Financing activities (1) (80) - - (1) - - (0) (7) - - (90)
Operating income, gross of tax expense 875 553 113 550 249 275 227 14 217 293 116 3,484
Income tax expense (266) (75) 21 (211) (75) (63) (57) (5) (70) (16) 17 (801)
Minority interests in income or loss (2) - (0) (4) (0) - (0) 0 (30) (132) (70) (238)
UNDERLYING EARNINGS 607 478 134 335 174 212 170 9 117 145 64 2,445
Net realized capital gains attributable to shareholders
247 (138) (6) 5 11 34 69 1 35 22 (4) 276
ADJUSTED EARNINGS 854 340 128 340 185 247 239 10 152 167 59 2,721
Profit or loss (including change) on financial assets (under Fair Value option) & derivatives
63 73 59 46 29 69 33 (1) (24) 0 1 347
Exceptional operations - - (1,642) - 1 51 (4) - - (50) (2) (1,646)
Goodwill and related intangibles - (1) (12) - - (6) - (3) (0) - - (22)
Integration and Restructuring costs - (3) (1) (9) (0) - (3) (0) - - (0) (16)
Income from discontinued operations - - - - - - - - - - 12 12
Net income 917 410 (1,468) 377 214 361 265 6 127 117 71 1,396
(a) Offset by an adjustment on reserves in insurance benefits and claims resulting in zero underlying earnings impact. (b) Mainly corresponds to the loss from derivatives hedging variable annuities. (c) In the United Kingdom. VBI amortization is presented net of policyholder tax on life business in the margin analysis. (d) Asia excl. Japan corresponds to Hong Kong, South-East Asia, India & China. (e) Other countries correspond to Australia/New Zealand, Luxembourg, ARCHITAS, AXA Life Europe and AXA Global Distributors.
11
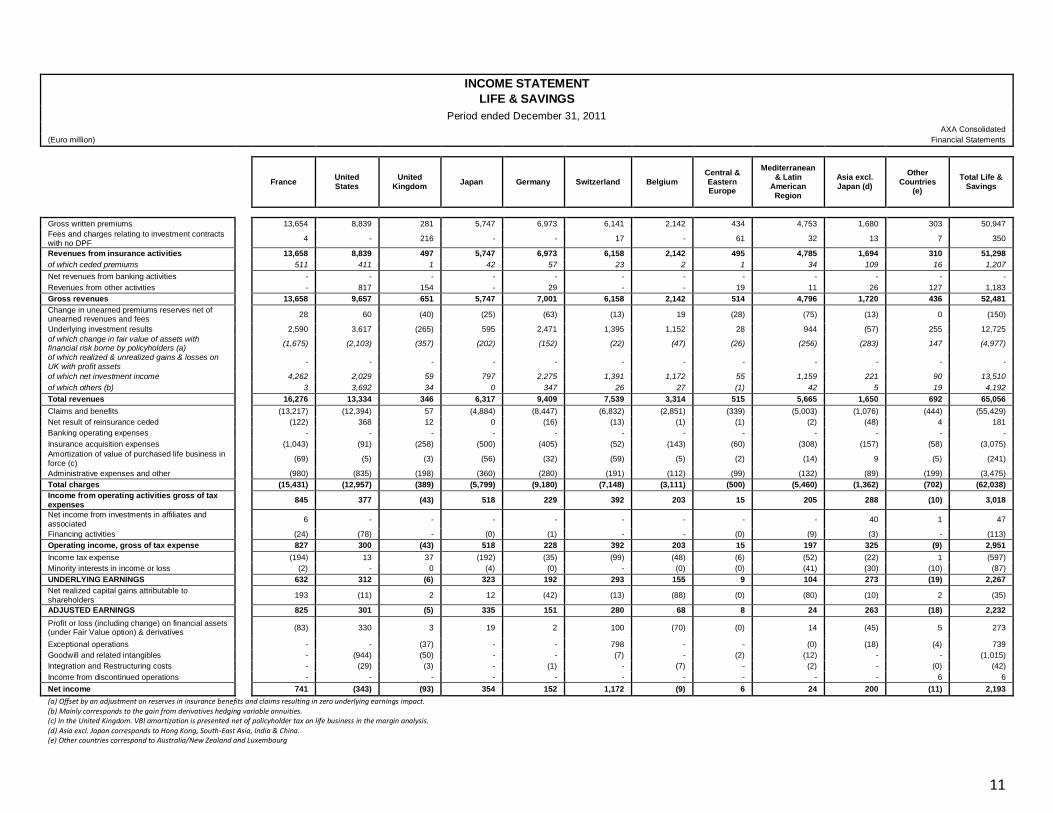
INCOME STATEMENT
LIFE & SAVINGS
Period ended December 31, 2011
AXA Consolidated
(Euro million) Financial Statements
France United States
United Kingdom
Japan Germany Switzerland Belgium Central & Eastern Europe
Mediterranean & Latin
American Region
Asia excl. Japan (d)
Other Countries
(e)
Total Life & Savings
Gross written premiums 13,654 8,839 281 5,747 6,973 6,141 2,142 434 4,753 1,680 303 50,947
Fees and charges relating to investment contracts with no DPF
4 - 216 - - 17 - 61 32 13 7 350
Revenues from insurance activities 13,658 8,839 497 5,747 6,973 6,158 2,142 495 4,785 1,694 310 51,298
of which ceded premiums 511 411 1 42 57 23 2 1 34 109 16 1,207
Net revenues from banking activities - - - - - - - - - - - -
Revenues from other activities - 817 154 - 29 - - 19 11 26 127 1,183
Gross revenues 13,658 9,657 651 5,747 7,001 6,158 2,142 514 4,796 1,720 436 52,481
Change in unearned premiums reserves net of unearned revenues and fees
28 60 (40) (25) (63) (13) 19 (28) (75) (13) 0 (150)
Underlying investment results 2,590 3,617 (265) 595 2,471 1,395 1,152 28 944 (57) 255 12,725
of which change in fair value of assets with financial risk borne by policyholders (a)
(1,675) (2,103) (357) (202) (152) (22) (47) (26) (256) (283) 147 (4,977)
of which realized & unrealized gains & losses on UK with profit assets
- - - - - - - - - - - -
of which net investment income 4,262 2,029 59 797 2,275 1,391 1,172 55 1,159 221 90 13,510
of which others (b) 3 3,692 34 0 347 26 27 (1) 42 5 19 4,192
Total revenues 16,276 13,334 346 6,317 9,409 7,539 3,314 515 5,665 1,650 692 65,056
Claims and benefits (13,217) (12,394) 57 (4,884) (8,447) (6,832) (2,851) (339) (5,003) (1,076) (444) (55,429)
Net result of reinsurance ceded (122) 368 12 0 (16) (13) (1) (1) (2) (48) 4 181
Banking operating expenses - - - - - - - - - - - -
Insurance acquisition expenses (1,043) (91) (258) (500) (405) (52) (143) (60) (308) (157) (58) (3,075)
Amortization of value of purchased life business in force (c)
(69) (5) (3) (56) (32) (59) (5) (2) (14) 9 (5) (241)
Administrative expenses and other (980) (835) (198) (360) (280) (191) (112) (99) (132) (89) (199) (3,475)
Total charges (15,431) (12,957) (389) (5,799) (9,180) (7,148) (3,111) (500) (5,460) (1,362) (702) (62,038)
Income from operating activities gross of tax expenses
845 377 (43) 518 229 392 203 15 205 288 (10) 3,018
Net income from investments in affiliates and associated
6 - - - - - - - - 40 1 47
Financing activities (24) (78) - (0) (1) - - (0) (9) (3) - (113)
Operating income, gross of tax expense 827 300 (43) 518 228 392 203 15 197 325 (9) 2,951
Income tax expense (194) 13 37 (192) (35) (99) (48) (6) (52) (22) 1 (597)
Minority interests in income or loss (2) - 0 (4) (0) - (0) (0) (41) (30) (10) (87)
UNDERLYING EARNINGS 632 312 (6) 323 192 293 155 9 104 273 (19) 2,267
Net realized capital gains attributable to shareholders
193 (11) 2 12 (42) (13) (88) (0) (80) (10) 2 (35)
ADJUSTED EARNINGS 825 301 (5) 335 151 280 68 8 24 263 (18) 2,232
Profit or loss (including change) on financial assets (under Fair Value option) & derivatives
(83) 330 3 19 2 100 (70) (0) 14 (45) 5 273
Exceptional operations - - (37) - - 798 - - (0) (18) (4) 739
Goodwill and related intangibles - (944) (50) - - (7) - (2) (12) - - (1,015)
Integration and Restructuring costs - (29) (3) - (1) - (7) - (2) - (0) (42)
Income from discontinued operations - - - - - - - - - - 6 6
Net income 741 (343) (93) 354 152 1,172 (9) 6 24 200 (11) 2,193
(a) Offset by an adjustment on reserves in insurance benefits and claims resulting in zero underlying earnings impact. (b) Mainly corresponds to the gain from derivatives hedging variable annuities. (c) In the United Kingdom. VBI amortization is presented net of policyholder tax on life business in the margin analysis. (d) Asia excl. Japan corresponds to Hong Kong, South-East Asia, India & China. (e) Other countries correspond to Australia/New Zealand and Luxembourg
12
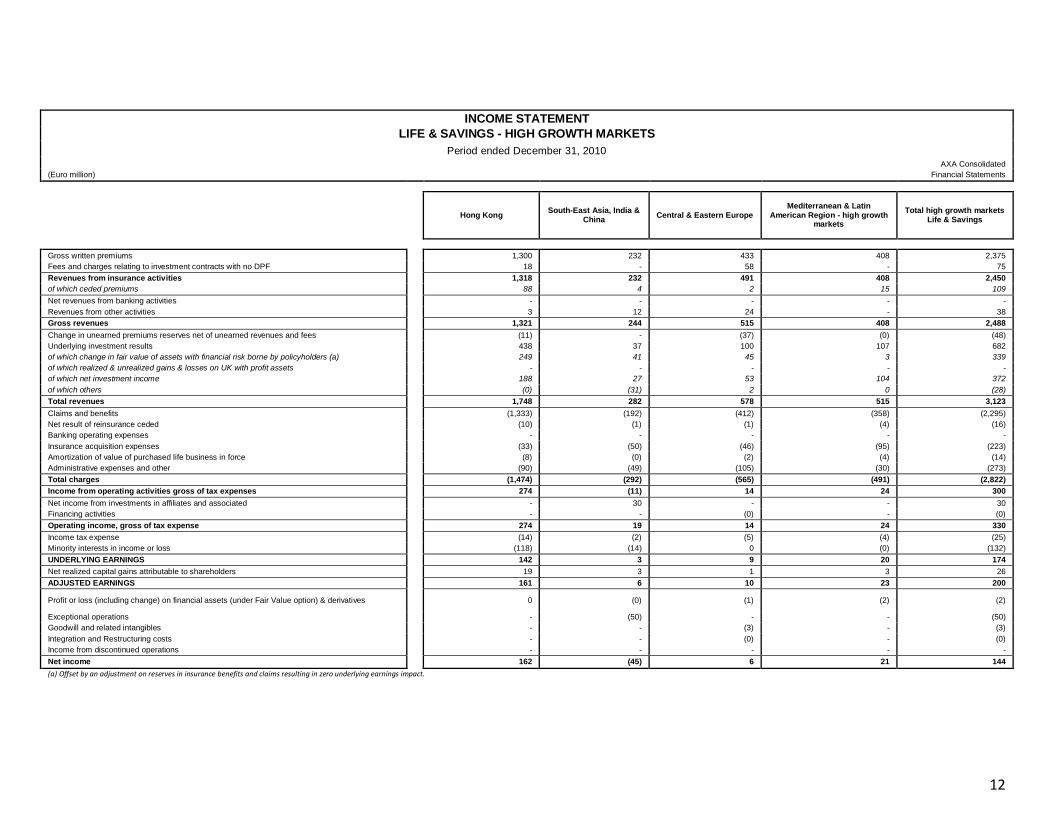
INCOME STATEMENT
LIFE & SAVINGS - HIGH GROWTH MARKETS
Period ended December 31, 2010
AXA Consolidated
(Euro million) Financial Statements
Hong Kong South-East Asia, India &
China Central & Eastern Europe
Mediterranean & Latin American Region - high growth
markets
Total high growth markets Life & Savings
Gross written premiums 1,300 232 433 408 2,375
Fees and charges relating to investment contracts with no DPF 18 - 58 - 75
Revenues from insurance activities 1,318 232 491 408 2,450
of which ceded premiums 88 4 2 15 109
Net revenues from banking activities - - - - -
Revenues from other activities 3 12 24 - 38
Gross revenues 1,321 244 515 408 2,488
Change in unearned premiums reserves net of unearned revenues and fees (11) - (37) (0) (48)
Underlying investment results 438 37 100 107 682
of which change in fair value of assets with financial risk borne by policyholders (a) 249 41 45 3 339
of which realized & unrealized gains & losses on UK with profit assets - - - - -
of which net investment income 188 27 53 104 372
of which others (0) (31) 2 0 (28)
Total revenues 1,748 282 578 515 3,123
Claims and benefits (1,333) (192) (412) (358) (2,295)
Net result of reinsurance ceded (10) (1) (1) (4) (16)
Banking operating expenses - - - - -
Insurance acquisition expenses (33) (50) (46) (95) (223)
Amortization of value of purchased life business in force (8) (0) (2) (4) (14)
Administrative expenses and other (90) (49) (105) (30) (273)
Total charges (1,474) (292) (565) (491) (2,822)
Income from operating activities gross of tax expenses 274 (11) 14 24 300
Net income from investments in affiliates and associated - 30 - - 30
Financing activities - - (0) - (0)
Operating income, gross of tax expense 274 19 14 24 330
Income tax expense (14) (2) (5) (4) (25)
Minority interests in income or loss (118) (14) 0 (0) (132)
UNDERLYING EARNINGS 142 3 9 20 174
Net realized capital gains attributable to shareholders 19 3 1 3 26
ADJUSTED EARNINGS 161 6 10 23 200
Profit or loss (including change) on financial assets (under Fair Value option) & derivatives
0 (0) (1) (2) (2)
Exceptional operations - (50) - - (50)
Goodwill and related intangibles - - (3) - (3)
Integration and Restructuring costs - - (0) - (0)
Income from discontinued operations - - - - -
Net income 162 (45) 6 21 144
(a) Offset by an adjustment on reserves in insurance benefits and claims resulting in zero underlying earnings impact.

13
INCOME STATEMENT
LIFE & SAVINGS - HIGH GROWTH MARKETS
Period ended December 31, 2011
AXA Consolidated
(Euro million) Financial Statements
Hong Kong South-East Asia, India &
China Central & Eastern Europe
Mediterranean & Latin American Region - high growth
markets
Total high growth markets Life & Savings
Gross written premiums 1,438 243 434 384 2,498
Fees and charges relating to investment contracts with no DPF 13 - 61 - 74
Revenues from insurance activities 1,451 243 495 384 2,572
of which ceded premiums 105 3 1 13 123
Net revenues from banking activities - - - - -
Revenues from other activities 14 12 19 - 45
Gross revenues 1,465 255 514 384 2,618
Change in unearned premiums reserves net of unearned revenues and fees 4 (16) (28) (0) (41)
Underlying investment results (15) (43) 28 104 75
of which change in fair value of assets with financial risk borne by policyholders (a) (216) (67) (26) (256) (308)
of which realized & unrealized gains & losses on UK with profit assets - - - - -
of which net investment income 201 20 55 102 379
of which others - 5 (1) 258 4
Total revenues 1,454 195 515 487 2,651
Claims and benefits (959) (116) (339) (350) (1,765)
Net result of reinsurance ceded (48) (0) (1) 2 (47)
Banking operating expenses - - - - -
Insurance acquisition expenses (118) (40) (60) (93) (311)
Amortization of value of purchased life business in force 9 (0) (2) (4) 4
Administrative expenses and other (62) (28) (99) (27) (215)
Total charges (1,178) (184) (500) (473) (2,334)
Income from operating activities gross of tax expenses 276 12 15 14 317
Net income from investments in affiliates and associated (7) 47 - - 40
Financing activities (3) - (0) - (3)
Operating income, gross of tax expense 266 59 15 14 354
Income tax expense (17) (5) (6) (2) (30)
Minority interests in income or loss (26) (4) (0) 19 (10)
UNDERLYING EARNINGS 224 50 9 32 314
Net realized capital gains attributable to shareholders (12) 2 (0) 5 (5)
ADJUSTED EARNINGS 211 52 8 37 309
Profit or loss (including change) on financial assets (under Fair Value option) & derivatives
(49) 4 (0) 6 (39)
Exceptional operations (1) (17) - (0) (18)
Goodwill and related intangibles - - (2) - (2)
Integration and Restructuring costs - - - - -
Income from discontinued operations - - - - -
Net income 161 39 6 43 248
(a) Offset by an adjustment on reserves in insurance benefits and claims resulting in zero underlying earnings impact.
14
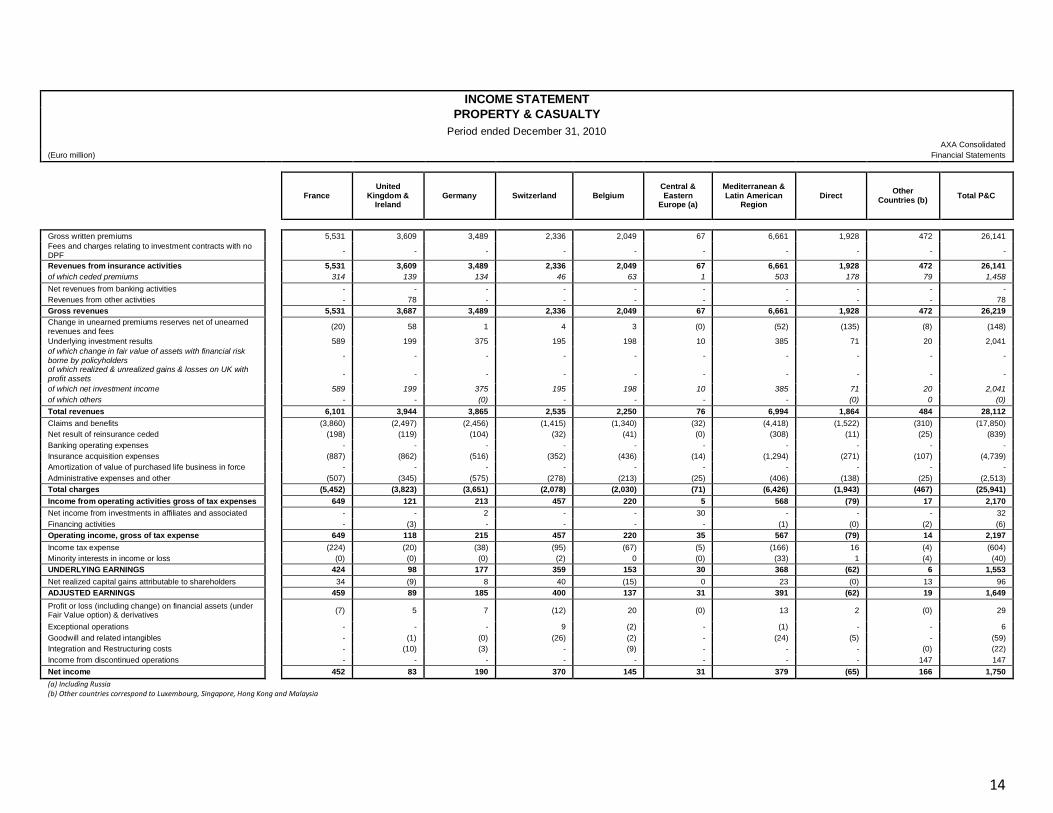
INCOME STATEMENT
PROPERTY & CASUALTY
Period ended December 31, 2010
AXA Consolidated
(Euro million) Financial Statements
France United
Kingdom & Ireland
Germany Switzerland Belgium Central & Eastern
Europe (a)
Mediterranean & Latin American
Region Direct
Other Countries (b)
Total P&C
Gross written premiums 5,531 3,609 3,489 2,336 2,049 67 6,661 1,928 472 26,141
Fees and charges relating to investment contracts with no DPF
- - - - - - - - - -
Revenues from insurance activities 5,531 3,609 3,489 2,336 2,049 67 6,661 1,928 472 26,141
of which ceded premiums 314 139 134 46 63 1 503 178 79 1,458
Net revenues from banking activities - - - - - - - - - -
Revenues from other activities - 78 - - - - - - - 78
Gross revenues 5,531 3,687 3,489 2,336 2,049 67 6,661 1,928 472 26,219
Change in unearned premiums reserves net of unearned revenues and fees
(20) 58 1 4 3 (0) (52) (135) (8) (148)
Underlying investment results 589 199 375 195 198 10 385 71 20 2,041
of which change in fair value of assets with financial risk borne by policyholders
- - - - - - - - - -
of which realized & unrealized gains & losses on UK with profit assets
- - - - - - - - - -
of which net investment income 589 199 375 195 198 10 385 71 20 2,041
of which others - - (0) - - - - (0) 0 (0)
Total revenues 6,101 3,944 3,865 2,535 2,250 76 6,994 1,864 484 28,112
Claims and benefits (3,860) (2,497) (2,456) (1,415) (1,340) (32) (4,418) (1,522) (310) (17,850)
Net result of reinsurance ceded (198) (119) (104) (32) (41) (0) (308) (11) (25) (839)
Banking operating expenses - - - - - - - - - -
Insurance acquisition expenses (887) (862) (516) (352) (436) (14) (1,294) (271) (107) (4,739)
Amortization of value of purchased life business in force - - - - - - - - - -
Administrative expenses and other (507) (345) (575) (278) (213) (25) (406) (138) (25) (2,513)
Total charges (5,452) (3,823) (3,651) (2,078) (2,030) (71) (6,426) (1,943) (467) (25,941)
Income from operating activities gross of tax expenses 649 121 213 457 220 5 568 (79) 17 2,170
Net income from investments in affiliates and associated - - 2 - - 30 - - - 32
Financing activities - (3) - - - - (1) (0) (2) (6)
Operating income, gross of tax expense 649 118 215 457 220 35 567 (79) 14 2,197
Income tax expense (224) (20) (38) (95) (67) (5) (166) 16 (4) (604)
Minority interests in income or loss (0) (0) (0) (2) 0 (0) (33) 1 (4) (40)
UNDERLYING EARNINGS 424 98 177 359 153 30 368 (62) 6 1,553
Net realized capital gains attributable to shareholders 34 (9) 8 40 (15) 0 23 (0) 13 96
ADJUSTED EARNINGS 459 89 185 400 137 31 391 (62) 19 1,649
Profit or loss (including change) on financial assets (under Fair Value option) & derivatives
(7) 5 7 (12) 20 (0) 13 2 (0) 29
Exceptional operations - - - 9 (2) - (1) - - 6
Goodwill and related intangibles - (1) (0) (26) (2) - (24) (5) - (59)
Integration and Restructuring costs - (10) (3) - (9) - - - (0) (22)
Income from discontinued operations - - - - - - - - 147 147
Net income 452 83 190 370 145 31 379 (65) 166 1,750
(a) Including Russia (b) Other countries correspond to Luxembourg, Singapore, Hong Kong and Malaysia
15
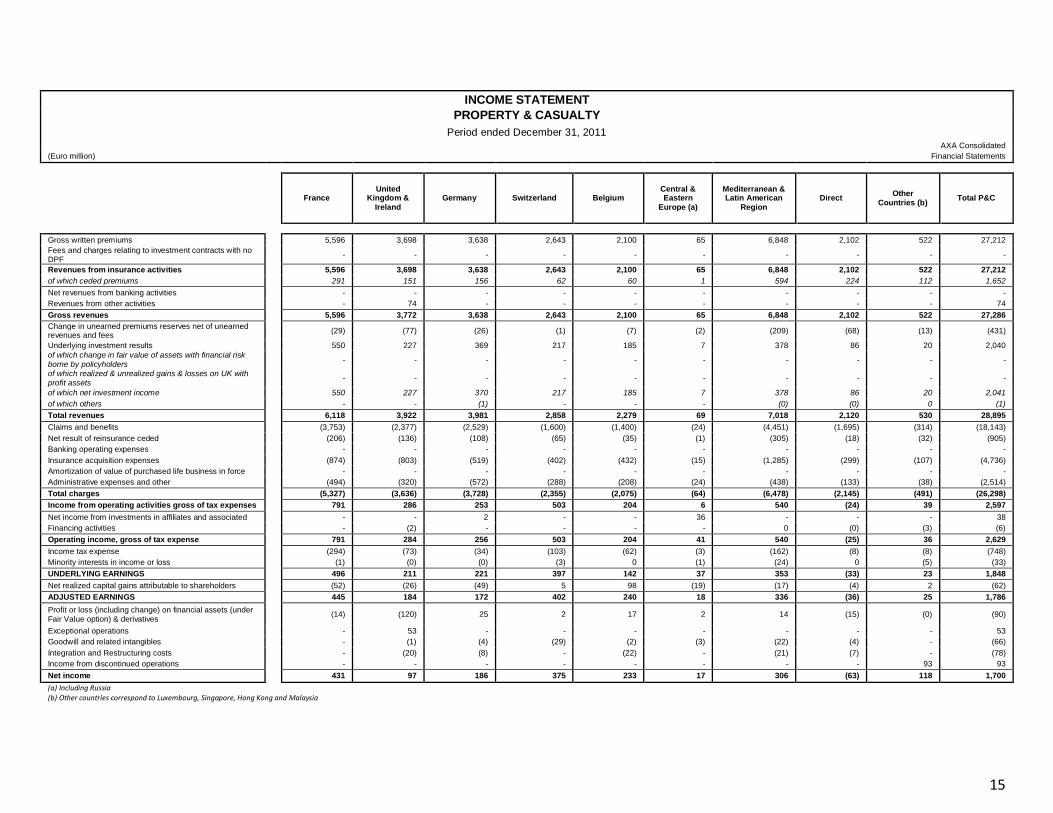
INCOME STATEMENT
PROPERTY & CASUALTY
Period ended December 31, 2011
AXA Consolidated
(Euro million) Financial Statements
France United
Kingdom & Ireland
Germany Switzerland Belgium Central & Eastern
Europe (a)
Mediterranean & Latin American
Region Direct
Other Countries (b)
Total P&C
Gross written premiums 5,596 3,698 3,638 2,643 2,100 65 6,848 2,102 522 27,212
Fees and charges relating to investment contracts with no DPF
- - - - - - - - - -
Revenues from insurance activities 5,596 3,698 3,638 2,643 2,100 65 6,848 2,102 522 27,212
of which ceded premiums 291 151 156 62 60 1 594 224 112 1,652
Net revenues from banking activities - - - - - - - - - -
Revenues from other activities - 74 - - - - - - - 74
Gross revenues 5,596 3,772 3,638 2,643 2,100 65 6,848 2,102 522 27,286
Change in unearned premiums reserves net of unearned revenues and fees
(29) (77) (26) (1) (7) (2) (209) (68) (13) (431)
Underlying investment results 550 227 369 217 185 7 378 86 20 2,040
of which change in fair value of assets with financial risk borne by policyholders
- - - - - - - - - -
of which realized & unrealized gains & losses on UK with profit assets
- - - - - - - - - -
of which net investment income 550 227 370 217 185 7 378 86 20 2,041
of which others - - (1) - - - (0) (0) 0 (1)
Total revenues 6,118 3,922 3,981 2,858 2,279 69 7,018 2,120 530 28,895
Claims and benefits (3,753) (2,377) (2,529) (1,600) (1,400) (24) (4,451) (1,695) (314) (18,143)
Net result of reinsurance ceded (206) (136) (108) (65) (35) (1) (305) (18) (32) (905)
Banking operating expenses - - - - - - - - - -
Insurance acquisition expenses (874) (803) (519) (402) (432) (15) (1,285) (299) (107) (4,736)
Amortization of value of purchased life business in force - - - - - - - - - -
Administrative expenses and other (494) (320) (572) (288) (208) (24) (438) (133) (38) (2,514)
Total charges (5,327) (3,636) (3,728) (2,355) (2,075) (64) (6,478) (2,145) (491) (26,298)
Income from operating activities gross of tax expenses 791 286 253 503 204 6 540 (24) 39 2,597
Net income from investments in affiliates and associated - - 2 - - 36 - - - 38
Financing activities - (2) - - - - 0 (0) (3) (6)
Operating income, gross of tax expense 791 284 256 503 204 41 540 (25) 36 2,629
Income tax expense (294) (73) (34) (103) (62) (3) (162) (8) (8) (748)
Minority interests in income or loss (1) (0) (0) (3) 0 (1) (24) 0 (5) (33)
UNDERLYING EARNINGS 496 211 221 397 142 37 353 (33) 23 1,848
Net realized capital gains attributable to shareholders (52) (26) (49) 5 98 (19) (17) (4) 2 (62)
ADJUSTED EARNINGS 445 184 172 402 240 18 336 (36) 25 1,786
Profit or loss (including change) on financial assets (under Fair Value option) & derivatives
(14) (120) 25 2 17 2 14 (15) (0) (90)
Exceptional operations - 53 - - - - - - - 53
Goodwill and related intangibles - (1) (4) (29) (2) (3) (22) (4) - (66)
Integration and Restructuring costs - (20) (8) - (22) - (21) (7) - (78)
Income from discontinued operations - - - - - - - - 93 93
Net income 431 97 186 375 233 17 306 (63) 118 1,700
(a) Including Russia (b) Other countries correspond to Luxembourg, Singapore, Hong Kong and Malaysia

16
INCOME STATEMENT
PROPERTY & CASUALTY - HIGH GROWTH MARKETS
Period ended December 31, 2010
AXA Consolidated
(Euro million) Financial Statements
Mediterranean & Latin American Region - high growth markets
Asia (a) Central & Eastern Europe
(b) Total high growth markets P&C
Gross written premiums 2,556 379 67 3,001
Fees and charges relating to investment contracts with no DPF - - - -
Revenues from insurance activities 2,556 379 67 3,001
of which ceded premiums 371 67 1 440
Net revenues from banking activities - - - -
Revenues from other activities - - - -
Gross revenues 2,556 379 67 3,001
Change in unearned premiums reserves net of unearned revenues and fees (115) (7) (0) (123)
Underlying investment results 152 12 10 174
of which change in fair value of assets with financial risk borne by policyholders - - - -
of which realized & unrealized gains & losses on UK with profit assets - - - -
of which net investment income 152 12 10 174
of which others - - - -
Total revenues 2,592 384 76 3,052
Claims and benefits (1,608) (257) (32) (1,898)
Net result of reinsurance ceded (192) (17) (0) (209)
Banking operating expenses - - - -
Insurance acquisition expenses (470) (88) (14) (572)
Amortization of value of purchased life business in force - - - -
Administrative expenses and other (137) (18) (25) (181)
Total charges (2,407) (381) (71) (2,859)
Income from operating activities gross of tax expenses 185 3 5 193
Net income from investments in affiliates and associated - - 30 30
Financing activities (1) (2) - (3)
Operating income, gross of tax expense 184 0 35 220
Income tax expense (36) (0) (5) (41)
Minority interests in income or loss (27) (4) (0) (31)
UNDERLYING EARNINGS 121 (4) 30 147
Net realized capital gains attributable to shareholders 24 12 0 37
ADJUSTED EARNINGS 145 8 31 184
Profit or loss (including change) on financial assets (under Fair Value option) & derivatives
(2) (1) (0) (3)
Exceptional operations (1) - - (1)
Goodwill and related intangibles - - - -
Integration and Restructuring costs - - - -
Income from discontinued operations - - - -
Net income 142 8 31 180
(a) Excluding direct operations (b) Including Russia and excluding direct operations
17
INCOME STATEMENT
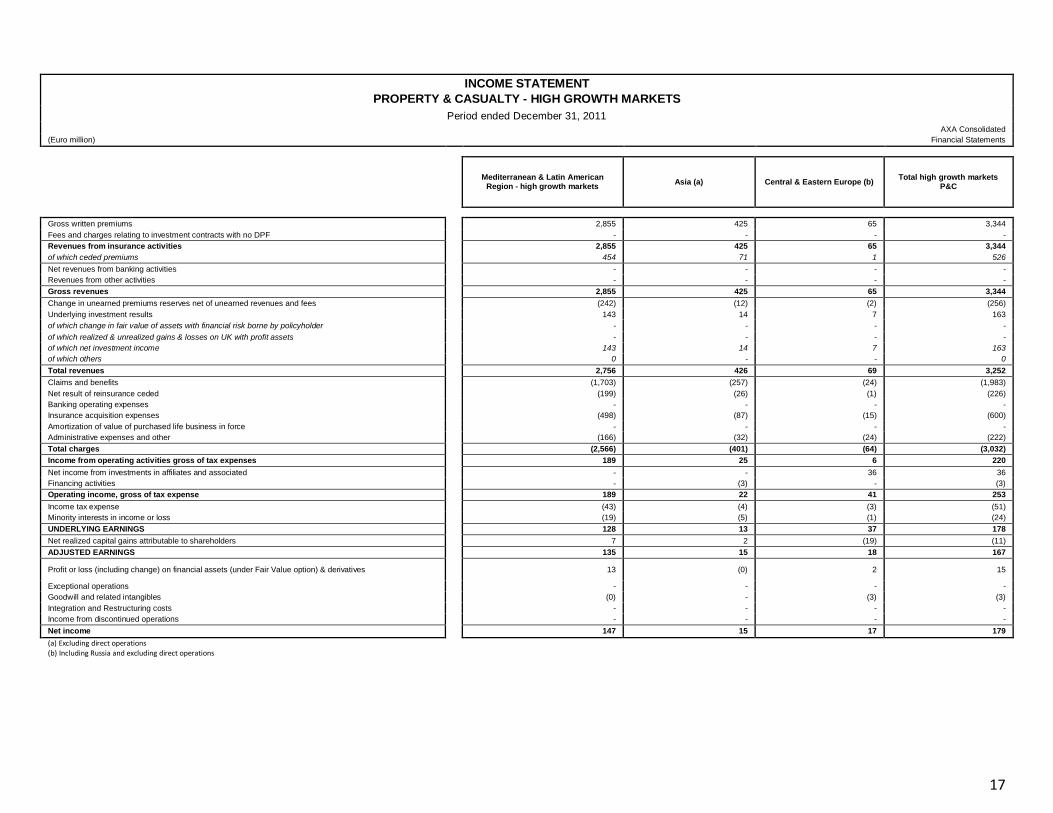
PROPERTY & CASUALTY - HIGH GROWTH MARKETS
Period ended December 31, 2011
AXA Consolidated
(Euro million) Financial Statements
Mediterranean & Latin American Region - high growth markets
Asia (a) Central & Eastern Europe (b) Total high growth markets
P&C
Gross written premiums 2,855 425 65 3,344
Fees and charges relating to investment contracts with no DPF - - - -
Revenues from insurance activities 2,855 425 65 3,344
of which ceded premiums 454 71 1 526
Net revenues from banking activities - - - -
Revenues from other activities - - - -
Gross revenues 2,855 425 65 3,344
Change in unearned premiums reserves net of unearned revenues and fees (242) (12) (2) (256)
Underlying investment results 143 14 7 163
of which change in fair value of assets with financial risk borne by policyholder - - - -
of which realized & unrealized gains & losses on UK with profit assets - - - -
of which net investment income 143 14 7 163
of which others 0 - - 0
Total revenues 2,756 426 69 3,252
Claims and benefits (1,703) (257) (24) (1,983)
Net result of reinsurance ceded (199) (26) (1) (226)
Banking operating expenses - - - -
Insurance acquisition expenses (498) (87) (15) (600)
Amortization of value of purchased life business in force - - - -
Administrative expenses and other (166) (32) (24) (222)
Total charges (2,566) (401) (64) (3,032)
Income from operating activities gross of tax expenses 189 25 6 220
Net income from investments in affiliates and associated - - 36 36
Financing activities - (3) - (3)
Operating income, gross of tax expense 189 22 41 253
Income tax expense (43) (4) (3) (51)
Minority interests in income or loss (19) (5) (1) (24)
UNDERLYING EARNINGS 128 13 37 178
Net realized capital gains attributable to shareholders 7 2 (19) (11)
ADJUSTED EARNINGS 135 15 18 167
Profit or loss (including change) on financial assets (under Fair Value option) & derivatives
13 (0) 2 15
Exceptional operations - - - -
Goodwill and related intangibles (0) - (3) (3)
Integration and Restructuring costs - - - -
Income from discontinued operations - - - -
Net income 147 15 17 179
(a) Excluding direct operations (b) Including Russia and excluding direct operations
18
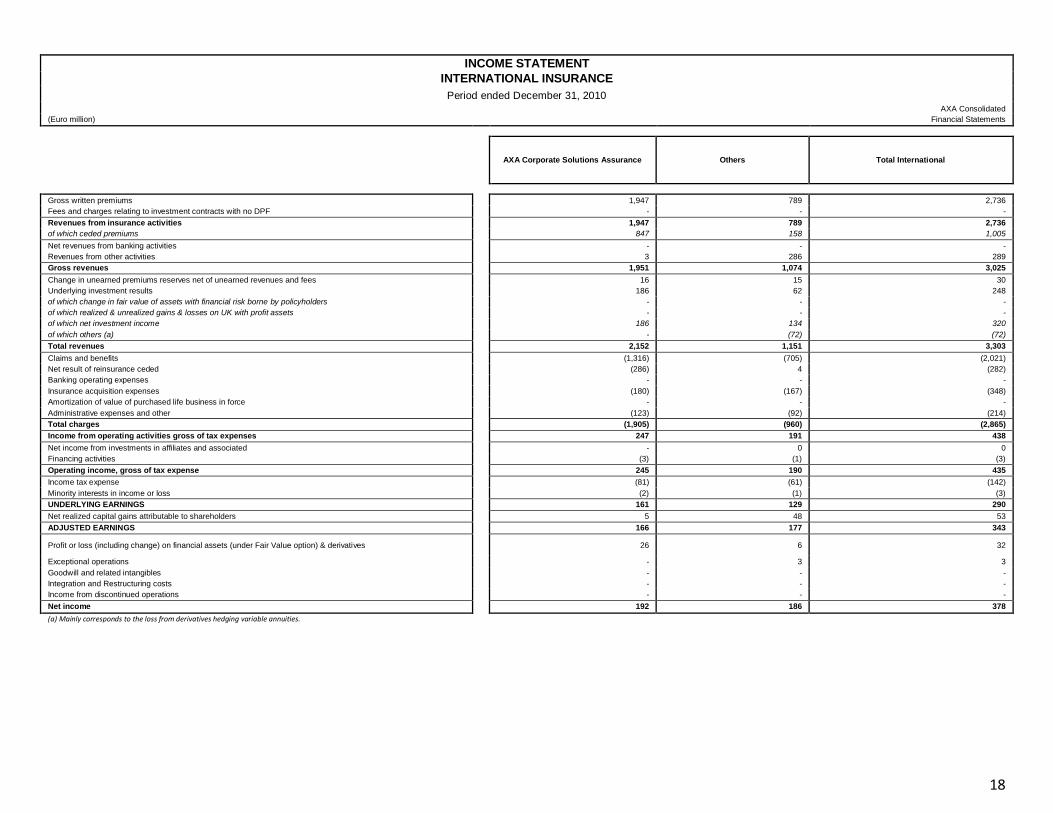
INCOME STATEMENT
INTERNATIONAL INSURANCE
Period ended December 31, 2010
AXA Consolidated
(Euro million) Financial Statements
AXA Corporate Solutions Assurance Others Total International
Gross written premiums 1,947 789 2,736
Fees and charges relating to investment contracts with no DPF - - -
Revenues from insurance activities 1,947 789 2,736
of which ceded premiums 847 158 1,005
Net revenues from banking activities - - -
Revenues from other activities 3 286 289
Gross revenues 1,951 1,074 3,025
Change in unearned premiums reserves net of unearned revenues and fees 16 15 30
Underlying investment results 186 62 248
of which change in fair value of assets with financial risk borne by policyholders - - -
of which realized & unrealized gains & losses on UK with profit assets - - -
of which net investment income 186 134 320
of which others (a) - (72) (72)
Total revenues 2,152 1,151 3,303
Claims and benefits (1,316) (705) (2,021)
Net result of reinsurance ceded (286) 4 (282)
Banking operating expenses - - -
Insurance acquisition expenses (180) (167) (348)
Amortization of value of purchased life business in force - - -
Administrative expenses and other (123) (92) (214)
Total charges (1,905) (960) (2,865)
Income from operating activities gross of tax expenses 247 191 438
Net income from investments in affiliates and associated - 0 0
Financing activities (3) (1) (3)
Operating income, gross of tax expense 245 190 435
Income tax expense (81) (61) (142)
Minority interests in income or loss (2) (1) (3)
UNDERLYING EARNINGS 161 129 290
Net realized capital gains attributable to shareholders 5 48 53
ADJUSTED EARNINGS 166 177 343
Profit or loss (including change) on financial assets (under Fair Value option) & derivatives
26 6 32
Exceptional operations - 3 3
Goodwill and related intangibles - - -
Integration and Restructuring costs - - -
Income from discontinued operations - - -
Net income 192 186 378
(a) Mainly corresponds to the loss from derivatives hedging variable annuities.
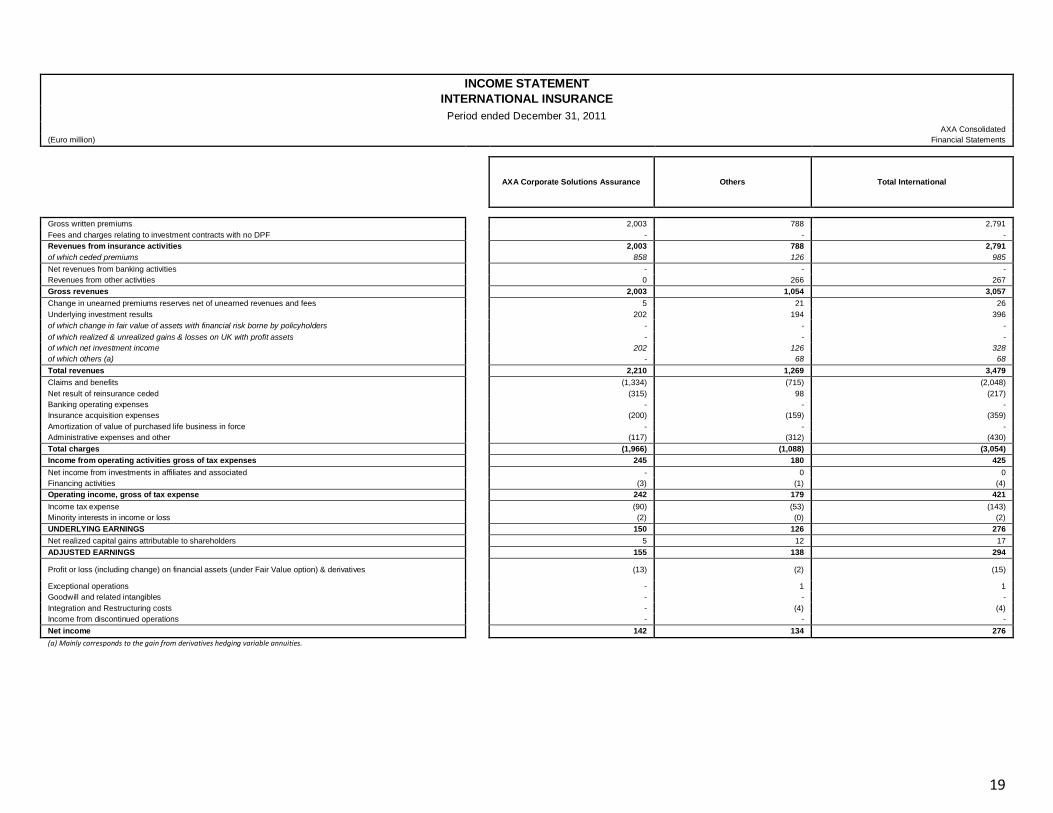
19
INCOME STATEMENT
INTERNATIONAL INSURANCE
Period ended December 31, 2011
AXA Consolidated
(Euro million) Financial Statements
AXA Corporate Solutions Assurance Others Total International
Gross written premiums 2,003 788 2,791
Fees and charges relating to investment contracts with no DPF - - -
Revenues from insurance activities 2,003 788 2,791
of which ceded premiums 858 126 985
Net revenues from banking activities - - -
Revenues from other activities 0 266 267
Gross revenues 2,003 1,054 3,057
Change in unearned premiums reserves net of unearned revenues and fees 5 21 26
Underlying investment results 202 194 396
of which change in fair value of assets with financial risk borne by policyholders - - -
of which realized & unrealized gains & losses on UK with profit assets - - -
of which net investment income 202 126 328
of which others (a) - 68 68
Total revenues 2,210 1,269 3,479
Claims and benefits (1,334) (715) (2,048)
Net result of reinsurance ceded (315) 98 (217)
Banking operating expenses - - -
Insurance acquisition expenses (200) (159) (359)
Amortization of value of purchased life business in force - - -
Administrative expenses and other (117) (312) (430)
Total charges (1,966) (1,088) (3,054)
Income from operating activities gross of tax expenses 245 180 425
Net income from investments in affiliates and associated - 0 0
Financing activities (3) (1) (4)
Operating income, gross of tax expense 242 179 421
Income tax expense (90) (53) (143)
Minority interests in income or loss (2) (0) (2)
UNDERLYING EARNINGS 150 126 276
Net realized capital gains attributable to shareholders 5 12 17
ADJUSTED EARNINGS 155 138 294
Profit or loss (including change) on financial assets (under Fair Value option) & derivatives
(13) (2) (15)
Exceptional operations - 1 1
Goodwill and related intangibles - - -
Integration and Restructuring costs - (4) (4)
Income from discontinued operations - - -
Net income 142 134 276
(a) Mainly corresponds to the gain from derivatives hedging variable annuities.
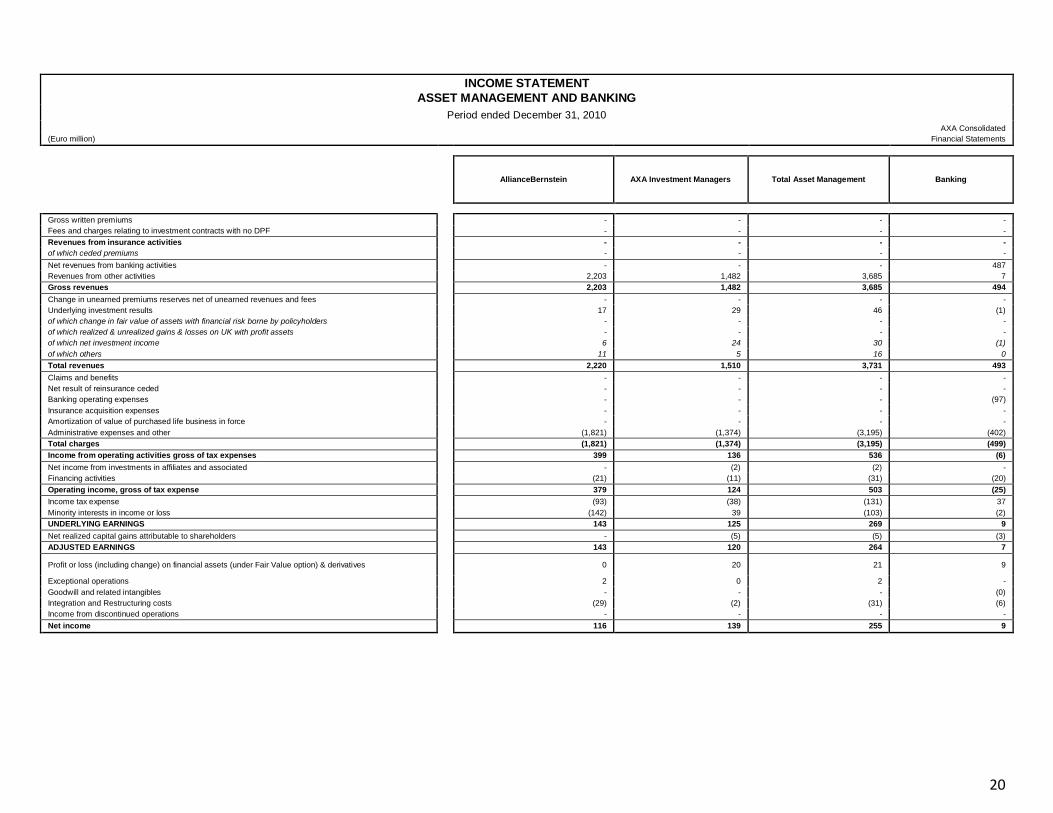
20
INCOME STATEMENT
ASSET MANAGEMENT AND BANKING
Period ended December 31, 2010
AXA Consolidated
(Euro million) Financial Statements
AllianceBernstein AXA Investment Managers Total Asset Management Banking
Gross written premiums - - - -
Fees and charges relating to investment contracts with no DPF - - - -
Revenues from insurance activities - - - -
of which ceded premiums - - - -
Net revenues from banking activities - - - 487
Revenues from other activities 2,203 1,482 3,685 7
Gross revenues 2,203 1,482 3,685 494
Change in unearned premiums reserves net of unearned revenues and fees - - - -
Underlying investment results 17 29 46 (1)
of which change in fair value of assets with financial risk borne by policyholders - - - -
of which realized & unrealized gains & losses on UK with profit assets - - - -
of which net investment income 6 24 30 (1)
of which others 11 5 16 0
Total revenues 2,220 1,510 3,731 493
Claims and benefits - - - -
Net result of reinsurance ceded - - - -
Banking operating expenses - - - (97)
Insurance acquisition expenses - - - -
Amortization of value of purchased life business in force - - - -
Administrative expenses and other (1,821) (1,374) (3,195) (402)
Total charges (1,821) (1,374) (3,195) (499)
Income from operating activities gross of tax expenses 399 136 536 (6)
Net income from investments in affiliates and associated - (2) (2) -
Financing activities (21) (11) (31) (20)
Operating income, gross of tax expense 379 124 503 (25)
Income tax expense (93) (38) (131) 37
Minority interests in income or loss (142) 39 (103) (2)
UNDERLYING EARNINGS 143 125 269 9
Net realized capital gains attributable to shareholders - (5) (5) (3)
ADJUSTED EARNINGS 143 120 264 7
Profit or loss (including change) on financial assets (under Fair Value option) & derivatives
0 20 21 9
Exceptional operations 2 0 2 -
Goodwill and related intangibles - - - (0)
Integration and Restructuring costs (29) (2) (31) (6)
Income from discontinued operations - - - -
Net income 116 139 255 9
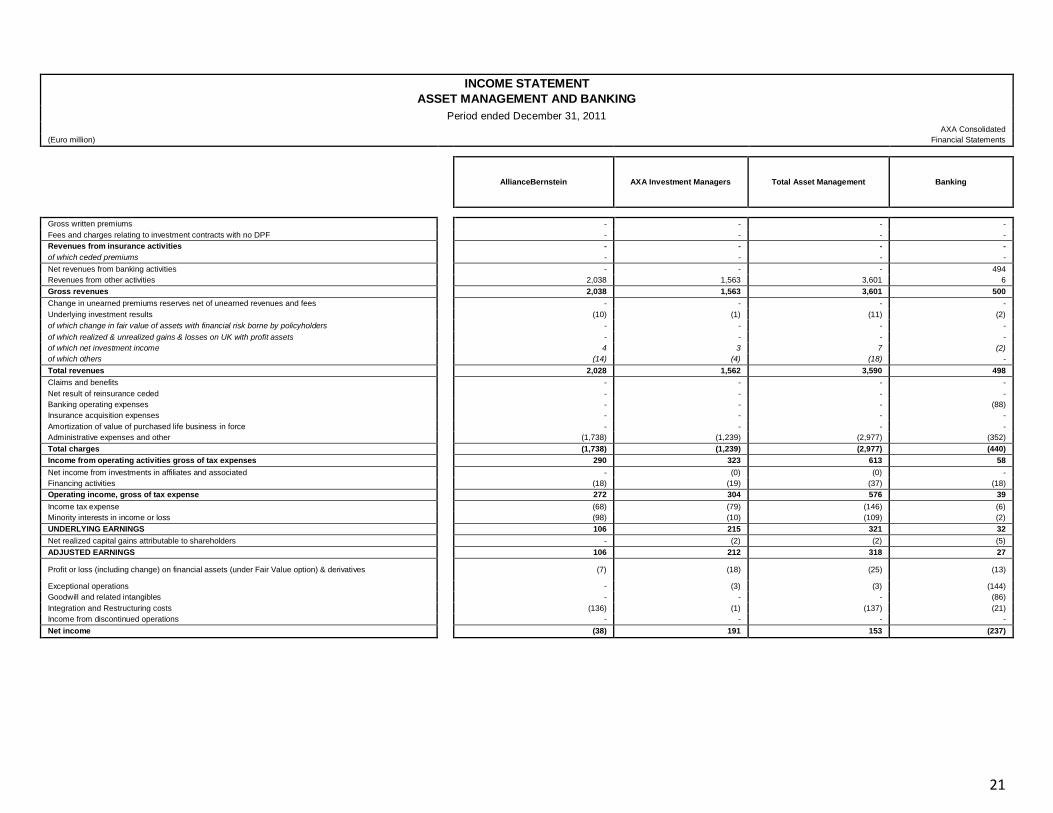
21
INCOME STATEMENT
ASSET MANAGEMENT AND BANKING
Period ended December 31, 2011
AXA Consolidated
(Euro million) Financial Statements
AllianceBernstein AXA Investment Managers Total Asset Management Banking
Gross written premiums - - - -
Fees and charges relating to investment contracts with no DPF - - - -
Revenues from insurance activities - - - -
of which ceded premiums - - - -
Net revenues from banking activities - - - 494
Revenues from other activities 2,038 1,563 3,601 6
Gross revenues 2,038 1,563 3,601 500
Change in unearned premiums reserves net of unearned revenues and fees - - - -
Underlying investment results (10) (1) (11) (2)
of which change in fair value of assets with financial risk borne by policyholders - - - -
of which realized & unrealized gains & losses on UK with profit assets - - - -
of which net investment income 4 3 7 (2)
of which others (14) (4) (18) -
Total revenues 2,028 1,562 3,590 498
Claims and benefits - - - -
Net result of reinsurance ceded - - - -
Banking operating expenses - - - (88)
Insurance acquisition expenses - - - -
Amortization of value of purchased life business in force - - - -
Administrative expenses and other (1,738) (1,239) (2,977) (352)
Total charges (1,738) (1,239) (2,977) (440)
Income from operating activities gross of tax expenses 290 323 613 58
Net income from investments in affiliates and associated - (0) (0) -
Financing activities (18) (19) (37) (18)
Operating income, gross of tax expense 272 304 576 39
Income tax expense (68) (79) (146) (6)
Minority interests in income or loss (98) (10) (109) (2)
UNDERLYING EARNINGS 106 215 321 32
Net realized capital gains attributable to shareholders - (2) (2) (5)
ADJUSTED EARNINGS 106 212 318 27
Profit or loss (including change) on financial assets (under Fair Value option) & derivatives
(7) (18) (25) (13)
Exceptional operations - (3) (3) (144)
Goodwill and related intangibles - - - (86)
Integration and Restructuring costs (136) (1) (137) (21)
Income from discontinued operations - - - -
Net income (38) 191 153 (237)

22
INCOME STATEMENT
HOLDINGS & OTHER COMPANIES
Period ended December 31, 2010
AXA Consolidated
(Euro million) Financial Statements
AXA Other French Holdings Foreign Holdings Other companies Total Holdings & Other Companies
Gross written premiums - - - - -
Fees and charges relating to investment contracts with no DPF - - - - -
Revenues from insurance activities - - - - -
of which ceded premiums - - - - -
Net revenues from banking activities - - - 1 1
Revenues from other activities - - - - -
Gross revenues - - - 1 1
Change in unearned premiums reserves net of unearned revenues and fees - - - - -
Underlying investment results 276 (5) 212 16 499
of which change in fair value of assets with financial risk borne by policyholders - - - - -
of which realized & unrealized gains & losses on UK with profit assets - - - - -
of which net investment income 371 12 216 16 614
of which others (95) (17) (4) (0) (115)
Total revenues 276 (5) 212 16 500
Claims and benefits - - - - -
Net result of reinsurance ceded - - - - -
Banking operating expenses - - - 1 1
Insurance acquisition expenses - - - - -
Amortization of value of purchased life business in force - - - - -
Administrative expenses and other (397) (15) (167) (3) (582)
Total charges (397) (15) (167) (2) (582)
Income from operating activities gross of tax expenses (121) (19) 45 14 (82)
Net income from investments in affiliates and associated - - - - -
Financing activities (696) (17) (462) (0) (1,175)
Operating income, gross of tax expense (817) (36) (417) 14 (1,256)
Income tax expense 264 (5) 147 (5) 401
Minority interests in income or loss - 0 20 0 20
UNDERLYING EARNINGS (553) (40) (251) 9 (836)
Net realized capital gains attributable to shareholders 4 (3) 0 - 2
ADJUSTED EARNINGS (549) (43) (251) 9 (834)
Profit or loss (including change) on financial assets (under Fair Value option) & derivatives
(202) 7 (31) - (226)
Exceptional operations 60 (19) (21) - 20
Goodwill and related intangibles - - - - -
Integration and Restructuring costs - - (0) - (0)
Income from discontinued operations - - - - -
Net income (691) (55) (303) 9 (1,040)

23
INCOME STATEMENT
HOLDINGS & OTHER COMPANIES
Period ended December 31, 2011
AXA Consolidated
(Euro million) Financial Statements
AXA Other French Holdings Foreign Holdings Other companies Total Holdings & Other Companies
Gross written premiums - - - - -
Fees and charges relating to investment contracts with no DPF - - - - -
Revenues from insurance activities - - - - -
of which ceded premiums - - - - -
Net revenues from banking activities - - - 1 1
Revenues from other activities - - - - -
Gross revenues - - - 1 1
Change in unearned premiums reserves net of unearned revenues and fees - - - - -
Underlying investment results 216 (24) 248 9 449
of which change in fair value of assets with financial risk borne by policyholders - - - - -
of which realized & unrealized gains & losses on UK with profit assets - - - - -
of which net investment income 272 (25) 264 9 519
of which others (56) 1 (15) - (70)
Total revenues 216 (24) 248 10 451
Claims and benefits - - - - -
Net result of reinsurance ceded - - - - -
Banking operating expenses - - - 1 1
Insurance acquisition expenses - - - - -
Amortization of value of purchased life business in force - - - - -
Administrative expenses and other (398) 1 (185) (8) (590)
Total charges (398) 1 (185) (7) (589)
Income from operating activities gross of tax expenses (182) (23) 63 4 (138)
Net income from investments in affiliates and associated - - - - -
Financing activities (695) (9) (396) (0) (1,100)
Operating income, gross of tax expense (877) (32) (332) 3 (1,238)
Income tax expense 317 (15) 87 (1) 387
Minority interests in income or loss - (0) 8 - 8
UNDERLYING EARNINGS (561) (47) (238) 2 (843)
Net realized capital gains attributable to shareholders (161) (2) (61) - (224)
ADJUSTED EARNINGS (721) (49) (298) 2 (1,067)
Profit or loss (including change) on financial assets (under Fair Value option) & derivatives
(39) (1) 22 0 (17)
Exceptional operations 1,307 (46) 62 - 1,324
Goodwill and related intangibles - - - - -
Integration and Restructuring costs - - (0) - (0)
Income from discontinued operations - - - - -
Net income 547 (96) (215) 2 240
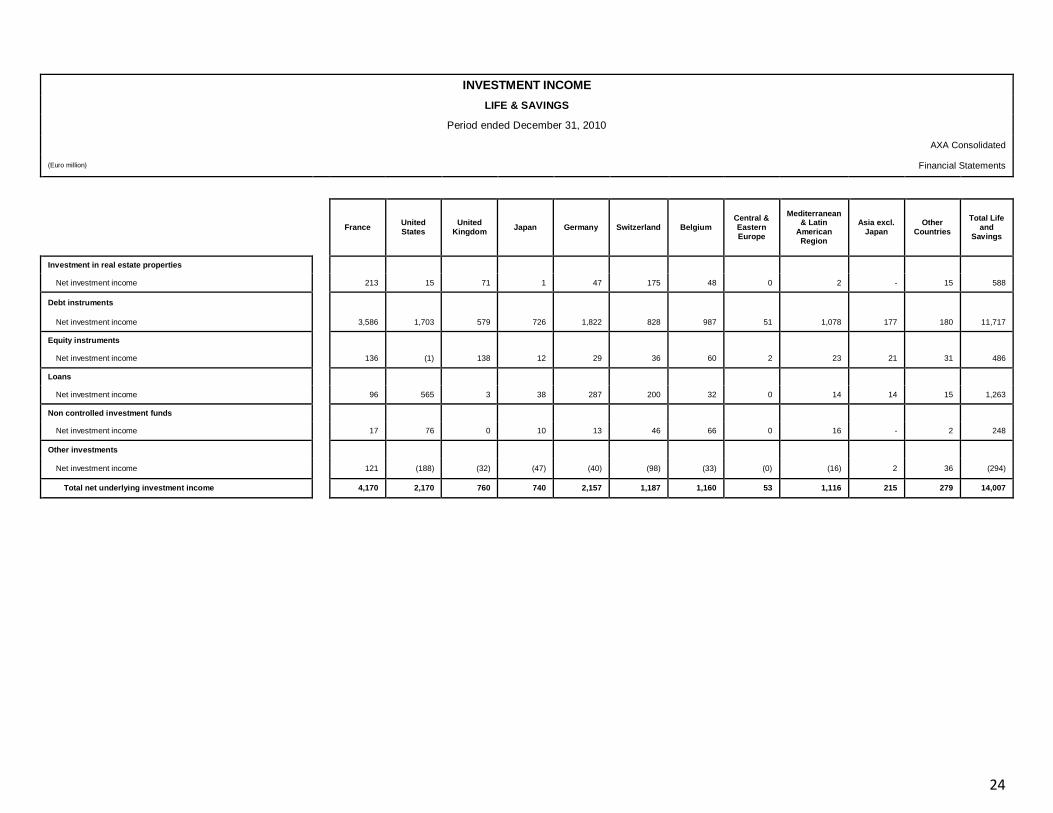
24
INVESTMENT INCOME
LIFE & SAVINGS
Period ended December 31, 2010
AXA Consolidated
(Euro million) Financial Statements
France United States
United Kingdom
Japan Germany Switzerland Belgium Central & Eastern Europe
Mediterranean & Latin
American Region
Asia excl. Japan
Other Countries
Total Life and
Savings
Investment in real estate properties
Net investment income 213 15 71 1 47 175 48 0 2 - 15 588
Debt instruments
Net investment income 3,586 1,703 579 726 1,822 828 987 51 1,078 177 180 11,717
Equity instruments
Net investment income 136 (1) 138 12 29 36 60 2 23 21 31 486
Loans
Net investment income 96 565 3 38 287 200 32 0 14 14 15 1,263
Non controlled investment funds
Net investment income 17 76 0 10 13 46 66 0 16 - 2 248
Other investments
Net investment income 121 (188) (32) (47) (40) (98) (33) (0) (16) 2 36 (294)
Total net underlying investment income 4,170 2,170 760 740 2,157 1,187 1,160 53 1,116 215 279 14,007
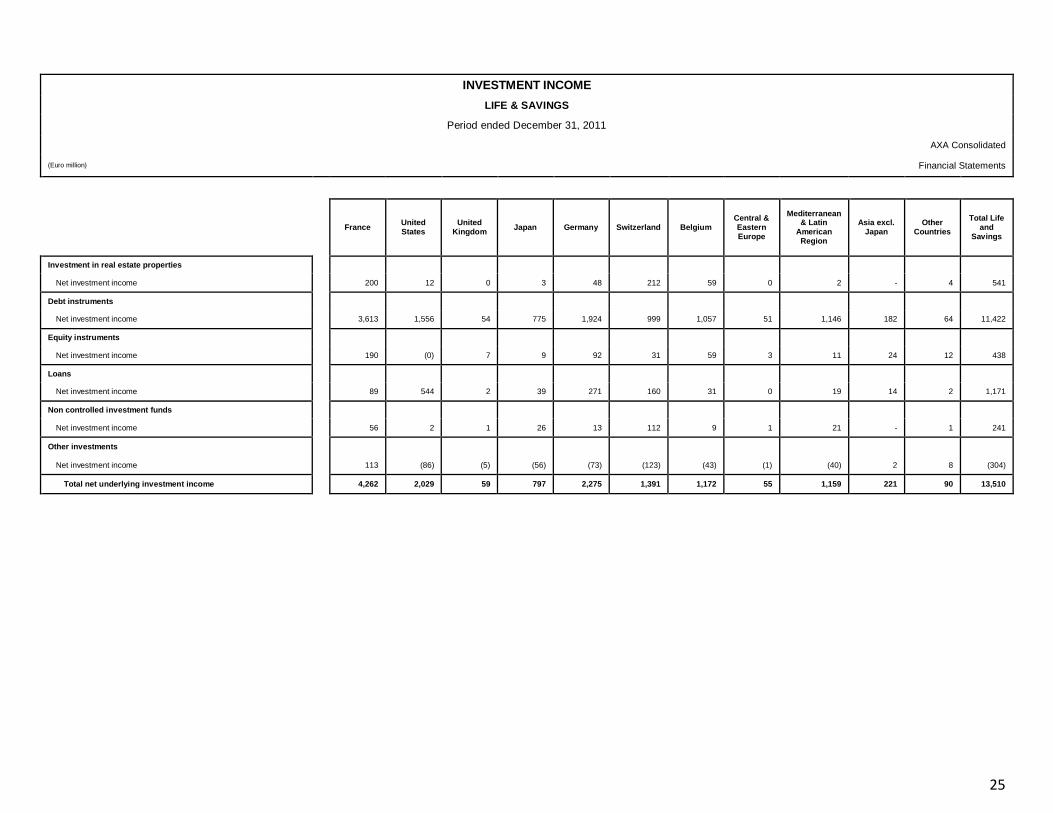
25
INVESTMENT INCOME
LIFE & SAVINGS
Period ended December 31, 2011
AXA Consolidated
(Euro million) Financial Statements
France United States
United Kingdom
Japan Germany Switzerland Belgium Central & Eastern Europe
Mediterranean & Latin
American Region
Asia excl. Japan
Other Countries
Total Life and
Savings
Investment in real estate properties
Net investment income 200 12 0 3 48 212 59 0 2 - 4 541
Debt instruments
Net investment income 3,613 1,556 54 775 1,924 999 1,057 51 1,146 182 64 11,422
Equity instruments
Net investment income 190 (0) 7 9 92 31 59 3 11 24 12 438
Loans
Net investment income 89 544 2 39 271 160 31 0 19 14 2 1,171
Non controlled investment funds
Net investment income 56 2 1 26 13 112 9 1 21 - 1 241
Other investments
Net investment income 113 (86) (5) (56) (73) (123) (43) (1) (40) 2 8 (304)
Total net underlying investment income 4,262 2,029 59 797 2,275 1,391 1,172 55 1,159 221 90 13,510

26
INVESTMENT INCOME
LIFE & SAVINGS - HIGH GROWTH MARKETS
Period ended December 31, 2010
AXA Consolidated
(Euro million) Financial Statements
Hong Kong South-East Asia,
India & China Central & Eastern
Europe
Mediterranean & Latin American
Region - high growth markets
Total high growth markets Life &
Savings
Investment in real estate properties
Net investment income - - 0 0 1
Debt instruments
Net investment income 170 8 51 82 310
Equity instruments
Net investment income 19 2 2 1 24
Loans
Net investment income 13 1 0 5 19
Non controlled investment funds
Net investment income - - 0 12 12
Other investments
Net investment income (13) 16 (0) 4 6
Total net underlying investment income 188 27 53 104 372
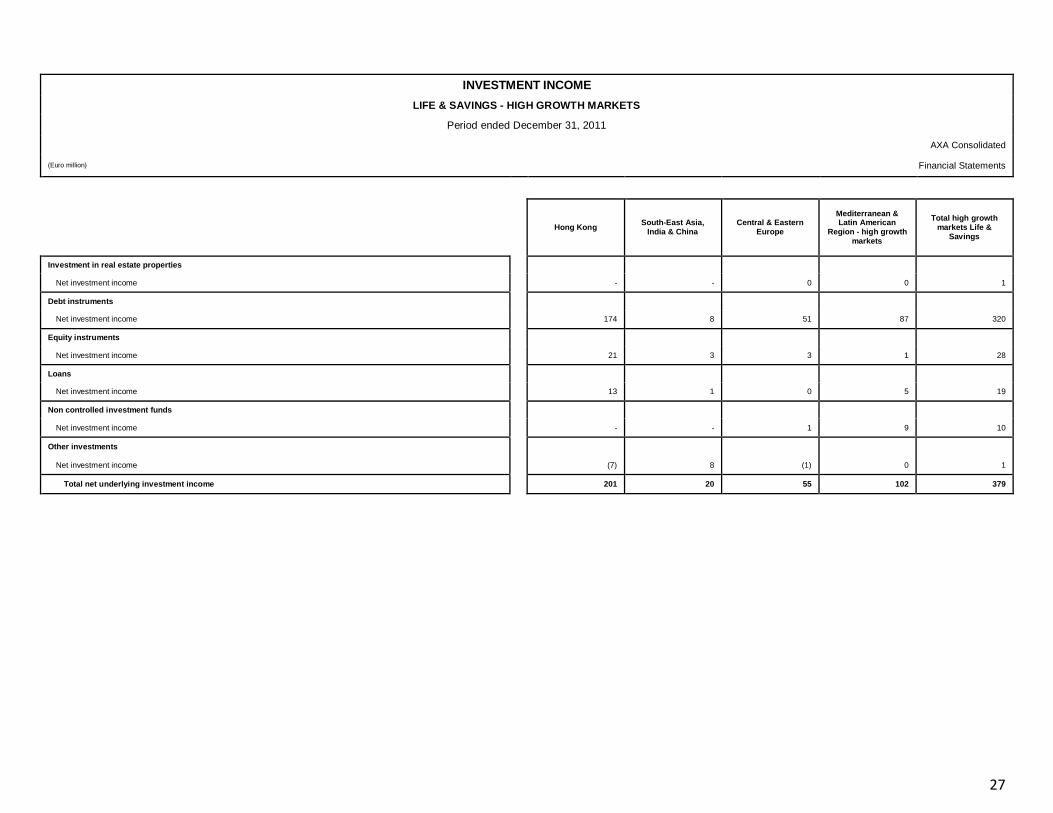
27
INVESTMENT INCOME
LIFE & SAVINGS - HIGH GROWTH MARKETS
Period ended December 31, 2011
AXA Consolidated
(Euro million) Financial Statements
Hong Kong South-East Asia,
India & China Central & Eastern
Europe
Mediterranean & Latin American
Region - high growth markets
Total high growth markets Life &
Savings
Investment in real estate properties
Net investment income - - 0 0 1
Debt instruments
Net investment income 174 8 51 87 320
Equity instruments
Net investment income 21 3 3 1 28
Loans
Net investment income 13 1 0 5 19
Non controlled investment funds
Net investment income - - 1 9 10
Other investments
Net investment income (7) 8 (1) 0 1
Total net underlying investment income 201 20 55 102 379
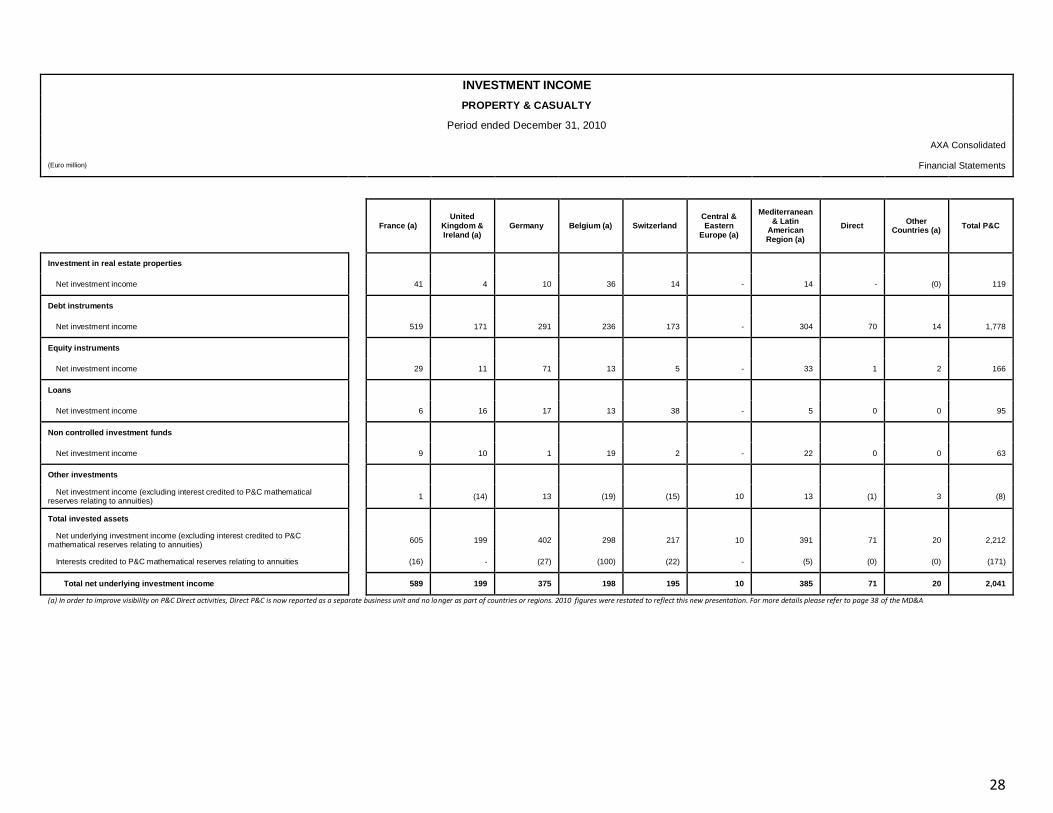
28
INVESTMENT INCOME
PROPERTY & CASUALTY
Period ended December 31, 2010
AXA Consolidated
(Euro million) Financial Statements
France (a) United
Kingdom & Ireland (a)
Germany Belgium (a) Switzerland Central & Eastern
Europe (a)
Mediterranean & Latin
American Region (a)
Direct Other
Countries (a) Total P&C
Investment in real estate properties
Net investment income 41 4 10 36 14 - 14 - (0) 119
Debt instruments
Net investment income 519 171 291 236 173 - 304 70 14 1,778
Equity instruments
Net investment income 29 11 71 13 5 - 33 1 2 166
Loans
Net investment income 6 16 17 13 38 - 5 0 0 95
Non controlled investment funds
Net investment income 9 10 1 19 2 - 22 0 0 63
Other investments
Net investment income (excluding interest credited to P&C mathematical reserves relating to annuities)
1 (14) 13 (19) (15) 10 13 (1) 3 (8)
Total invested assets
Net underlying investment income (excluding interest credited to P&C mathematical reserves relating to annuities)
605 199 402 298 217 10 391 71 20 2,212
Interests credited to P&C mathematical reserves relating to annuities (16) - (27) (100) (22) - (5) (0) (0) (171)
Total net underlying investment income 589 199 375 198 195 10 385 71 20 2,041
(a) In order to improve visibility on P&C Direct activities, Direct P&C is now reported as a separate business unit and no longer as part of countries or regions. 2010 figures were restated to reflect this new presentation. For more details please refer to page 38 of the MD&A

29
INVESTMENT INCOME
PROPERTY & CASUALTY
Period ended December 31, 2011
AXA Consolidated
(Euro million) Financial Statements
France (a) United
Kingdom & Ireland (a)
Germany Belgium (a) Switzerland Central & Eastern
Europe (a)
Mediterranean & Latin
American Region (a)
Direct Other
Countries (a) Total P&C
Investment in real estate properties
Net investment income 47 4 15 38 17 - 15 1 0 137
Debt instruments
Net investment income 484 187 327 235 169 2 303 79 15 1,801
Equity instruments
Net investment income 43 13 62 17 10 - 20 3 2 169
Loans
Net investment income 11 18 14 15 36 - 5 4 0 104
Non controlled investment funds
Net investment income 9 10 1 2 6 - 33 2 0 62
Other investments
Net investment income (excluding interest credited to P&C mathematical reserves relating to annuities)
(27) (6) (20) (21) 2 5 8 (1) 3 (57)
Total invested assets
Net underlying investment income (excluding interest credited to P&C mathematical reserves relating to annuities)
567 227 398 285 240 7 384 87 20 2,216
Interests credited to P&C mathematical reserves relating to annuities (17) - (28) (100) (23) - (6) (0) (0) (175)
Total net underlying investment income 550 227 370 185 217 7 378 86 20 2,041
(a) In order to improve visibility on P&C Direct activities, Direct P&C is now reported as a separate business unit and no longer as part of countries or regions. 2010 figures were restated to reflect this new presentation. For more details please refer to page 38 of the MD&A
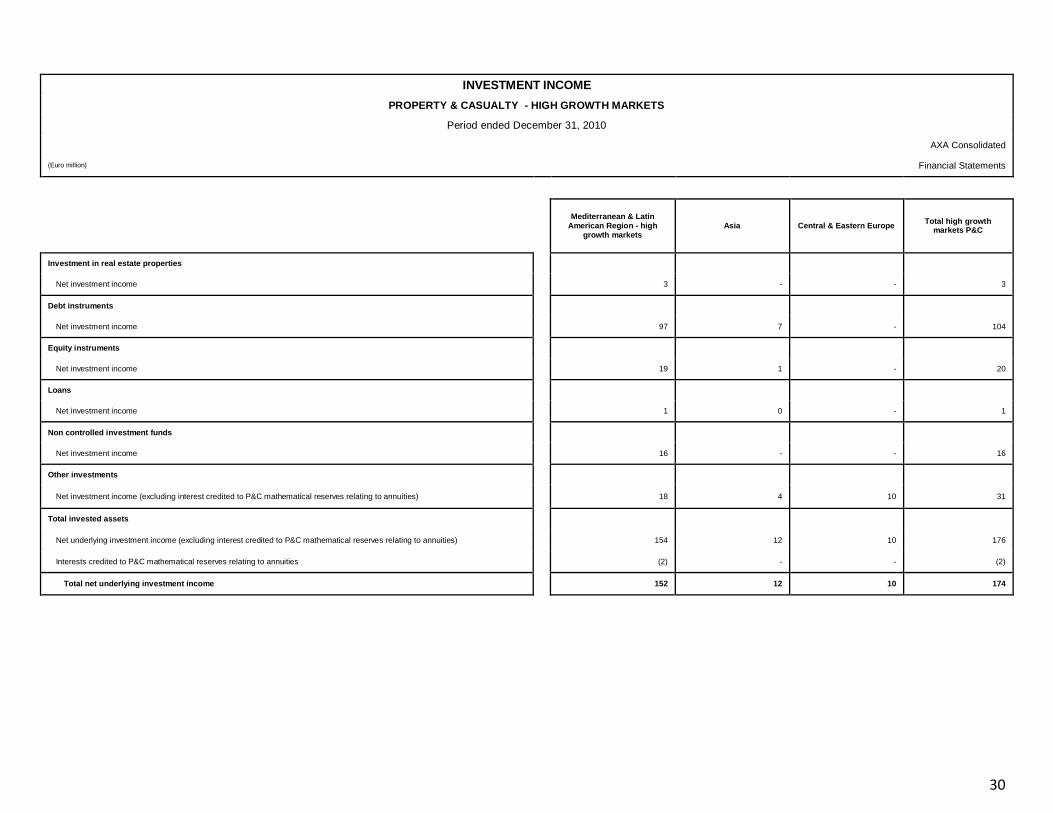
30
INVESTMENT INCOME
PROPERTY & CASUALTY - HIGH GROWTH MARKETS
Period ended December 31, 2010
AXA Consolidated
(Euro million) Financial Statements
Mediterranean & Latin
American Region - high growth markets
Asia Central & Eastern Europe Total high growth
markets P&C
Investment in real estate properties
Net investment income 3 - - 3
Debt instruments
Net investment income 97 7 - 104
Equity instruments
Net investment income 19 1 - 20
Loans
Net investment income 1 0 - 1
Non controlled investment funds
Net investment income 16 - - 16
Other investments
Net investment income (excluding interest credited to P&C mathematical reserves relating to annuities) 18 4 10 31
Total invested assets
Net underlying investment income (excluding interest credited to P&C mathematical reserves relating to annuities) 154 12 10 176
Interests credited to P&C mathematical reserves relating to annuities (2) - - (2)
Total net underlying investment income 152 12 10 174
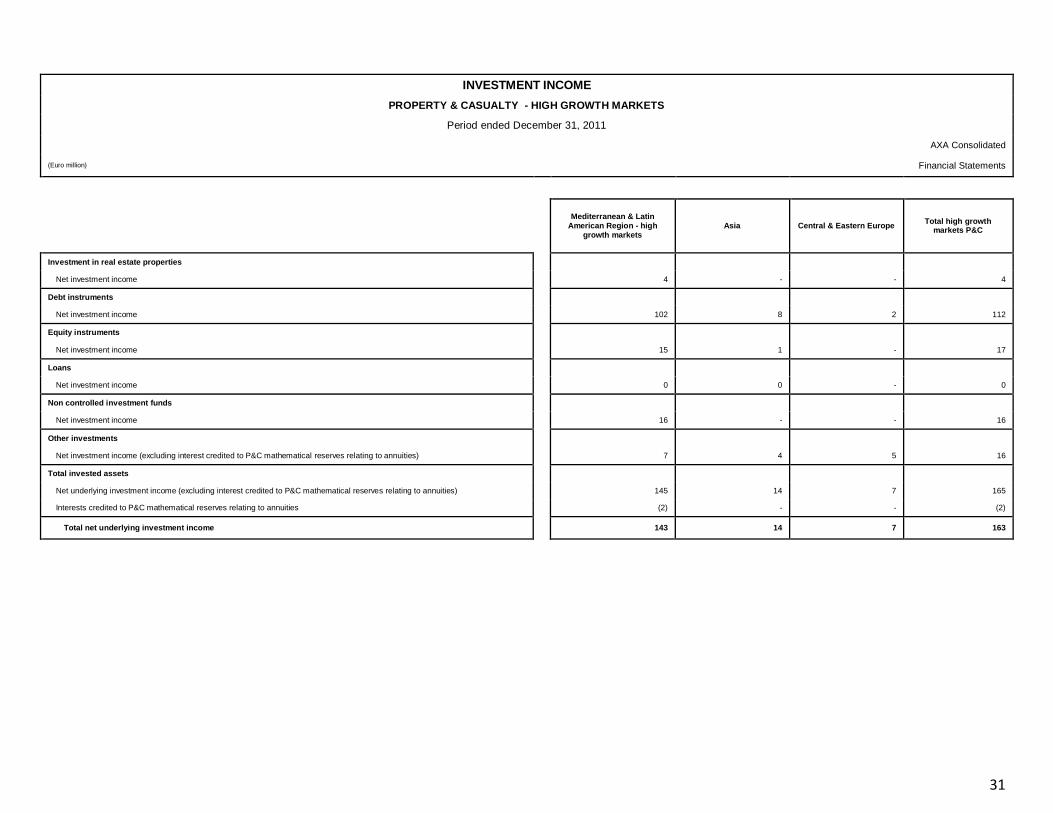
31
INVESTMENT INCOME
PROPERTY & CASUALTY - HIGH GROWTH MARKETS
Period ended December 31, 2011
AXA Consolidated
(Euro million) Financial Statements
Mediterranean & Latin
American Region - high growth markets
Asia Central & Eastern Europe Total high growth
markets P&C
Investment in real estate properties
Net investment income 4 - - 4
Debt instruments
Net investment income 102 8 2 112
Equity instruments
Net investment income 15 1 - 17
Loans
Net investment income 0 0 - 0
Non controlled investment funds
Net investment income 16 - - 16
Other investments
Net investment income (excluding interest credited to P&C mathematical reserves relating to annuities) 7 4 5 16
Total invested assets
Net underlying investment income (excluding interest credited to P&C mathematical reserves relating to annuities) 145 14 7 165
Interests credited to P&C mathematical reserves relating to annuities (2) - - (2)
Total net underlying investment income 143 14 7 163
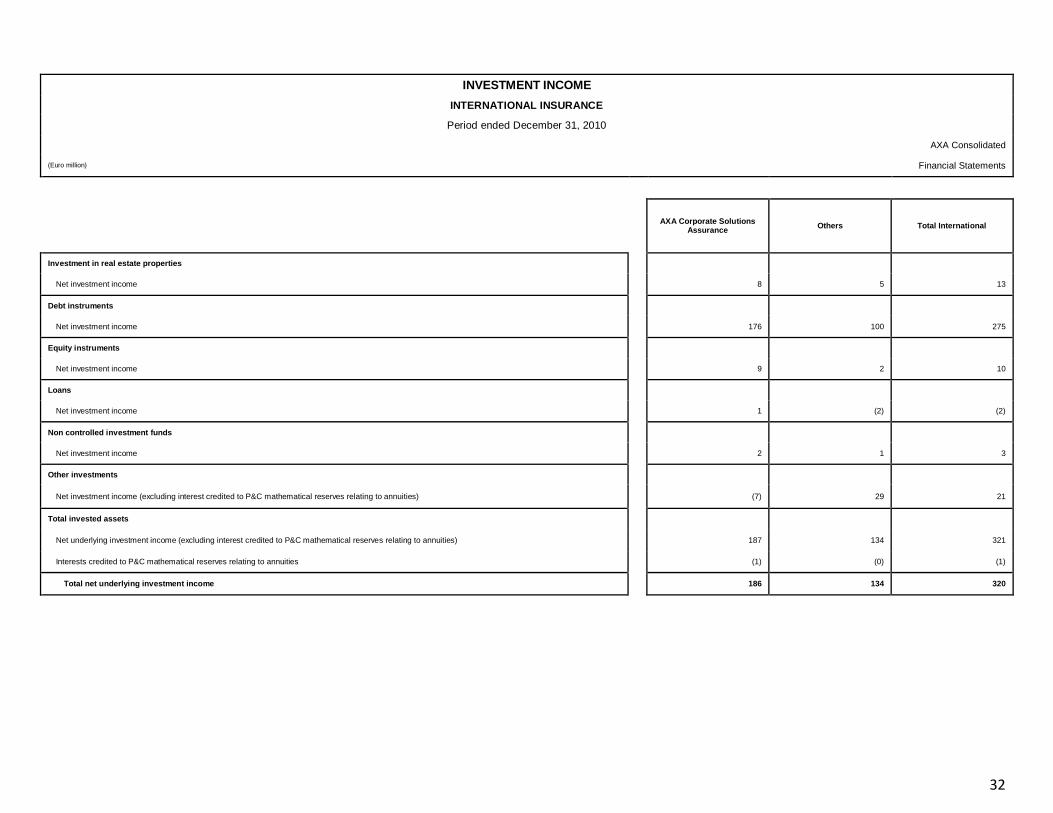
32
INVESTMENT INCOME
INTERNATIONAL INSURANCE
Period ended December 31, 2010
AXA Consolidated
(Euro million) Financial Statements
AXA Corporate Solutions
Assurance Others Total International
Investment in real estate properties
Net investment income 8 5 13
Debt instruments
Net investment income 176 100 275
Equity instruments
Net investment income 9 2 10
Loans
Net investment income 1 (2) (2)
Non controlled investment funds
Net investment income 2 1 3
Other investments
Net investment income (excluding interest credited to P&C mathematical reserves relating to annuities) (7) 29 21
Total invested assets
Net underlying investment income (excluding interest credited to P&C mathematical reserves relating to annuities) 187 134 321
Interests credited to P&C mathematical reserves relating to annuities (1) (0) (1)
Total net underlying investment income 186 134 320

33
INVESTMENT INCOME
INTERNATIONAL INSURANCE
Period ended December 31, 2011
AXA Consolidated
(Euro million) Financial Statements
AXA Corporate Solutions
Assurance Others Total International
Investment in real estate properties
Net investment income 12 6 19
Debt instruments
Net investment income 184 90 274
Equity instruments
Net investment income 10 2 12
Loans
Net investment income 1 11 13
Non controlled investment funds
Net investment income 3 2 5
Other investments
Net investment income (excluding interest credited to P&C mathematical reserves relating to annuities) (8) 15 7
Total invested assets
Net underlying investment income (excluding interest credited to P&C mathematical reserves relating to annuities) 203 126 329
Interests credited to P&C mathematical reserves relating to annuities (1) - (1)
Total net underlying investment income 202 126 328

34
UNDERLYING OPERATING INCOME UNDER MARGIN FORMAT AND EXPENSE RATIOS LIFE & SAVINGS
Period ended December 31, 2010
(Euro million)
Axa Consolidated Financial statements
Margin Analysis France United States
United Kingdom
(1) Japan Germany Switzerland Belgium
Central & Eastern Europe
Mediterranean & Latin
American Region
Asia excl. Japan
Other Countries
(4)
Total Life and Savings
(4)
Underlying Investment Margin
1,105 505 122 (0) 84 113 262 25 253 23 36 2,528
Fees and revenues
1,513 1,804 506 1,356 306 231 153 115 332 405 848 7,569
of which loading on premiums and revenues on mutual funds sales 1,217 290 186 1,318 296 229 139 60 296 344 385 4,761
of which fees on UL account balances 292 1,284 249 38 11 5 15 28 36 55 22 2,033
of which other fees and revenues 3 230 71 - - (3) (2) 28 0 6 441 774
Net technical Margin
561 (426) 65 43 98 169 67 27 108 59 (20) 751
Expenses (net of DAC capitalisation & amortisation)
(2,296) (1,278) (577) (782) (225) (194) (250) (152) (455) (200) (726) (7,136)
Amortisation of Value of Business in Force (gross of tax expense)
(13) (52) (3) (66) (14) (43) (4) (2) (21) (8) (22) (250)
Underlying earnings arising from investment in associates (2)
6 - - - - - - - - 14 - 21
Underlying operating income gross of tax expenses
875 553 113 550 249 275 227 14 217 292 116 3,483
Underlying Cost income ratio
72.7% 70.6% 83.6% 60.6% 49.0% 46.4% 52.8% 91.8% 68.7% 42.9% 86.6% 68.1%
Expense Ratios
% of technical reserves (3)
2.2% 1.7% 1.2% 2.4% 0.6% 0.6% 1.0% 5.3% 1.4% 4.8% 7.6% 1.6%
(1) In the United Kingdom, VBI amortization is presented net of policyholder tax. (2) Also includes underlying operating income for countries for which no margin analysis was performed: South-East Asia, India & China. (3) Excludes all intangibles (VBI and DAC). (4) Excluding Australia/New Zealand

35
UNDERLYING OPERATING INCOME UNDER MARGIN FORMAT AND EXPENSE RATIOS LIFE & SAVINGS
Period ended December 31, 2011
(Euro million)
Axa Consolidated Financial statements
Margin Analysis France United States
United Kingdom
(1) Japan Germany Switzerland Belgium
Central & Eastern Europe
Mediterranean & Latin
American Region
Asia excl. Japan
Other Countries
(4)
Total Life and Savings
(4)
Underlying Investment Margin
1,111 474 15 (0) 113 118 288 29 264 3 14 2,428
Fees and revenues
1,520 1,931 375 1,456 325 265 163 115 320 453 238 7,160
of which loading on premiums and revenues on mutual funds sales 1,208 386 173 1,409 311 264 154 58 280 392 108 4,742
of which fees on UL account balances 320 1,342 133 47 14 5 11 35 38 48 6 1,998
of which other fees and revenues (7) 203 70 - - (5) (2) 22 2 13 124 419
Net technical Margin
449 (1,192) 23 (23) 77 270 34 35 73 52 (4) (205)
Expenses (net of DAC capitalisation & amortisation)
(2,190) (909) (454) (860) (255) (202) (278) (162) (445) (229) (252) (6,236)
Amortisation of Value of Business in Force (gross of tax expense)
(69) (5) (2) (56) (32) (59) (5) (2) (14) 9 (5) (239)
Underlying earnings arising from investment in associates (2)
6 - - - - - - - - 37 - 43
Underlying operating income gross of tax expenses
827 300 (43) 518 228 392 203 15 197 325 (10) 2,951
Underlying Cost income ratio
73.3% 75.3% 110.5% 63.9% 55.8% 40.0% 58.2% 91.7% 69.9% 43.2% 103.8% 69.0%
Expense Ratios
% of technical reserves (3) (4)
2.0% 1.6% 2.2% 2.4% 0.5% 0.5% 1.0% 4.7% 1.4% 5.7% 11.7% 1.6%
(1) In the United Kingdom, VBI amortization is presented net of policyholder tax. (2) Also includes underlying operating income for countries for which no margin analysis was performed: South-East Asia, India & China. (3) Excludes all intangibles (VBI and DAC). (4) Excluding Australia/New Zealand
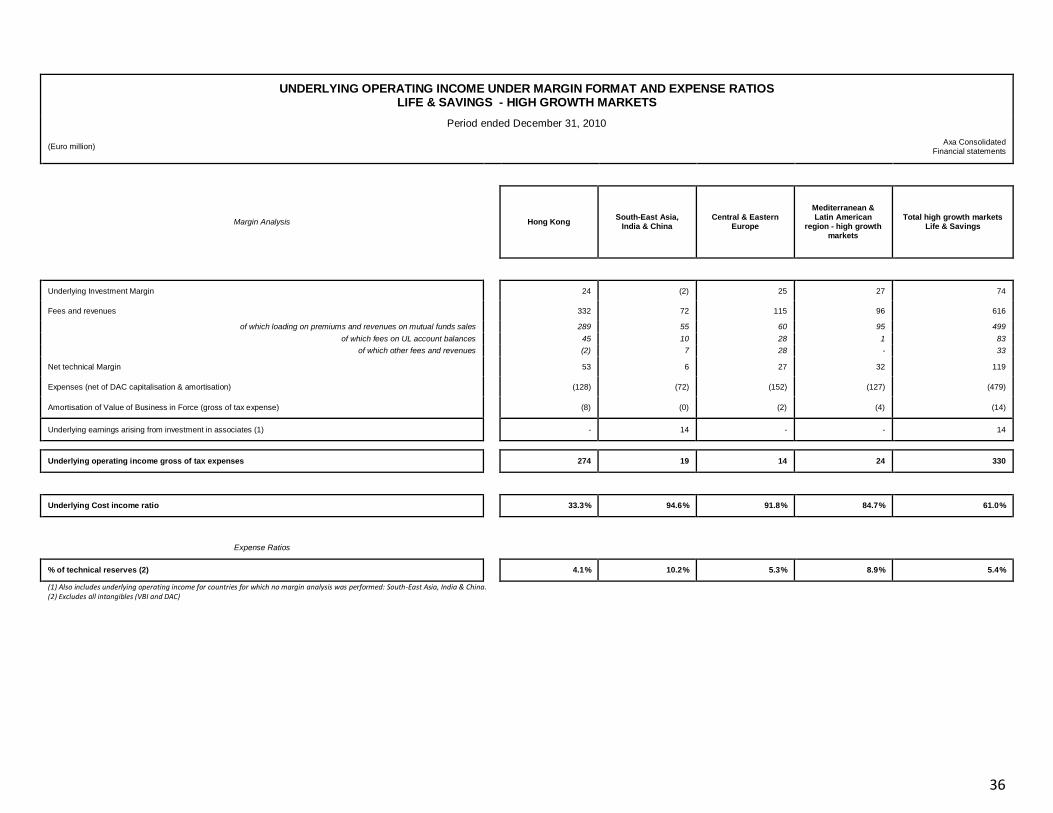
36
UNDERLYING OPERATING INCOME UNDER MARGIN FORMAT AND EXPENSE RATIOS LIFE & SAVINGS - HIGH GROWTH MARKETS
Period ended December 31, 2010
(Euro million)
Axa Consolidated Financial statements
Margin Analysis Hong Kong South-East Asia,
India & China Central & Eastern
Europe
Mediterranean & Latin American
region - high growth markets
Total high growth markets Life & Savings
Underlying Investment Margin
24 (2) 25 27 74
Fees and revenues
332 72 115 96 616
of which loading on premiums and revenues on mutual funds sales 289 55 60 95 499
of which fees on UL account balances 45 10 28 1 83
of which other fees and revenues (2) 7 28 - 33
Net technical Margin
53 6 27 32 119
Expenses (net of DAC capitalisation & amortisation)
(128) (72) (152) (127) (479)
Amortisation of Value of Business in Force (gross of tax expense)
(8) (0) (2) (4) (14)
Underlying earnings arising from investment in associates (1)
- 14 - - 14
Underlying operating income gross of tax expenses
274 19 14 24 330
Underlying Cost income ratio
33.3% 94.6% 91.8% 84.7% 61.0%
Expense Ratios
% of technical reserves (2)
4.1% 10.2% 5.3% 8.9% 5.4%
(1) Also includes underlying operating income for countries for which no margin analysis was performed: South-East Asia, India & China. (2) Excludes all intangibles (VBI and DAC)

37
UNDERLYING OPERATING INCOME UNDER MARGIN FORMAT AND EXPENSE RATIOS LIFE & SAVINGS - HIGH GROWTH MARKETS
Period ended December 31, 2011
(Euro million)
Axa Consolidated Financial statements
Margin Analysis Hong Kong South-East Asia,
India & China Central & Eastern
Europe
Mediterranean & Latin American
region - high growth markets
Total high growth markets Life & Savings
Underlying Investment Margin
4 (2) 29 29 60
Fees and revenues
385 67 115 89 656
of which loading on premiums and revenues on mutual funds sales 340 51 58 88 538
of which fees on UL account balances 38 10 35 1 84
of which other fees and revenues 7 6 22 - 35
Net technical Margin
45 8 35 22 109
Expenses (net of DAC capitalisation & amortisation)
(170) (59) (162) (121) (512)
Amortisation of Value of Business in Force (gross of tax expense)
9 (0) (2) (4) 4
Underlying earnings arising from investment in associates (1)
(7) 44 - - 37
Underlying operating income gross of tax expenses
266 59 15 14 354
Underlying Cost income ratio
37.0% 80.4% 91.7% 89.7% 61.6%
Expense Ratios
% of technical reserves (2)
5.0% 11.3% 4.7% 8.2% 5.6%
(1) Also includes underlying operating income for countries for which no margin analysis was performed: Thailand, Philippines, India, China, partnership with Bank Mandiri in Indonesia. (2) Excludes all intangibles (VBI and DAC).
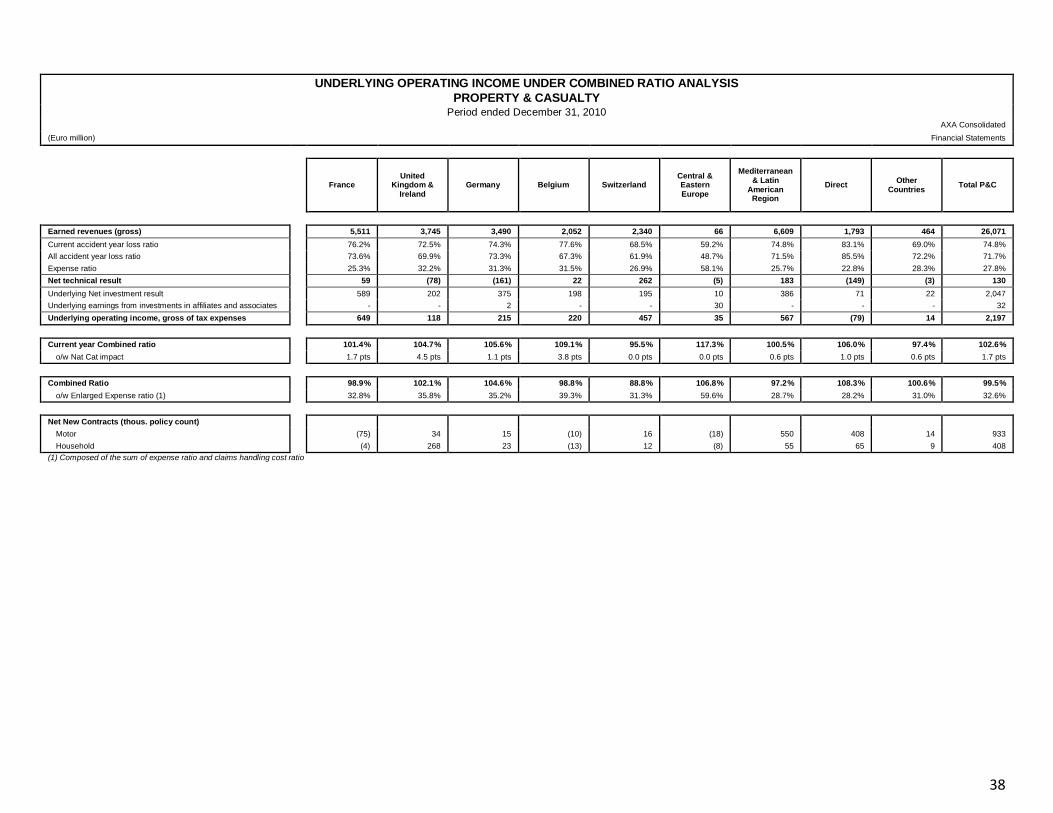
38
UNDERLYING OPERATING INCOME UNDER COMBINED RATIO ANALYSIS
PROPERTY & CASUALTY Period ended December 31, 2010
AXA Consolidated
(Euro million) Financial Statements
France United
Kingdom & Ireland
Germany Belgium Switzerland Central & Eastern Europe
Mediterranean & Latin
American Region
Direct Other
Countries Total P&C
Earned revenues (gross) 5,511 3,745 3,490 2,052 2,340 66 6,609 1,793 464 26,071
Current accident year loss ratio 76.2% 72.5% 74.3% 77.6% 68.5% 59.2% 74.8% 83.1% 69.0% 74.8%
All accident year loss ratio 73.6% 69.9% 73.3% 67.3% 61.9% 48.7% 71.5% 85.5% 72.2% 71.7%
Expense ratio 25.3% 32.2% 31.3% 31.5% 26.9% 58.1% 25.7% 22.8% 28.3% 27.8%
Net technical result 59 (78) (161) 22 262 (5) 183 (149) (3) 130
Underlying Net investment result 589 202 375 198 195 10 386 71 22 2,047
Underlying earnings from investments in affiliates and associates - - 2 - - 30 - - - 32
Underlying operating income, gross of tax expenses 649 118 215 220 457 35 567 (79) 14 2,197
Current year Combined ratio 101.4% 104.7% 105.6% 109.1% 95.5% 117.3% 100.5% 106.0% 97.4% 102.6%
o/w Nat Cat impact 1.7 pts 4.5 pts 1.1 pts 3.8 pts 0.0 pts 0.0 pts 0.6 pts 1.0 pts 0.6 pts 1.7 pts
Combined Ratio 98.9% 102.1% 104.6% 98.8% 88.8% 106.8% 97.2% 108.3% 100.6% 99.5%
o/w Enlarged Expense ratio (1) 32.8% 35.8% 35.2% 39.3% 31.3% 59.6% 28.7% 28.2% 31.0% 32.6%
Net New Contracts (thous. policy count)
Motor (75) 34 15 (10) 16 (18) 550 408 14 933
Household (4) 268 23 (13) 12 (8) 55 65 9 408
(1) Composed of the sum of expense ratio and claims handling cost ratio

39
UNDERLYING OPERATING INCOME UNDER COMBINED RATIO ANALYSIS
PROPERTY & CASUALTY Period ended December 31, 2011
AXA Consolidated
(Euro million) Financial Statements
France United
Kingdom & Ireland
Germany Belgium Switzerland Central & Eastern Europe
Mediterranean & Latin
American Region
Direct Other
Countries Total P&C
Earned revenues (gross) 5,567 3,695 3,612 2,094 2,642 62 6,640 2,034 509 26,855
Current accident year loss ratio 73.5% 67.6% 73.4% 73.6% 68.9% 44.8% 73.4% 80.5% 69.1% 72.6%
All accident year loss ratio 71.1% 68.0% 73.0% 68.5% 63.1% 39.7% 71.6% 84.2% 68.0% 70.9%
Expense ratio 24.6% 30.4% 30.2% 30.6% 26.1% 62.6% 25.9% 21.2% 28.4% 27.0%
Net technical result 240 59 (116) 19 286 (1) 162 (111) 19 557
Underlying Net investment result 550 229 369 185 217 7 378 87 23 2,046
Underlying earnings from investments in affiliates and associates - - 2 - - 36 - - - 38
Underlying operating income, gross of tax expenses 791 284 256 204 503 41 540 (25) 36 2,629
Current year Combined ratio 98.1% 97.9% 103.7% 104.1% 95.1% 107.3% 99.4% 101.7% 97.5% 99.6%
o/w Nat Cat impact 0.3 pts 0.5 pts 0.2 pts 1.8 pts 2.2 pts 0.0 pts 0.7 pts 0.2 pts 0.6 pts 0.7 pts
Combined Ratio 95.7% 98.4% 103.2% 99.1% 89.2% 102.3% 97.6% 105.4% 96.3% 97.9%
o/w Enlarged Expense ratio (1) 32.4% 33.6% 34.0% 37.7% 30.3% 64.2% 29.1% 26.8% 31.2% 31.8%
Net New Contracts (thous. policy count)
Motor (88) 3 196 (17) 18 (9) 870 152 51 1,176
Household (56) 245 27 (21) 17 (7) 26 114 1 347
(1) Composed of the sum of expense ratio and claims handling cost ratio

40
UNDERLYING OPERATING INCOME UNDER COMBINED RATIO ANALYSIS
PROPERTY & CASUALTY - HIGH GROWTH MARKETS Period ended December 31, 2010
AXA Consolidated
(Euro million) Financial Statements
Mediterranean & Latin American Region - high growth markets
Asia Central & Eastern Europe Total high growth markets
P&C
Earned revenues (gross) 2,440 372 66 2,879
Current accident year loss ratio 74.9% 67.6% 59.2% 73.6%
All accident year loss ratio 73.8% 73.9% 48.7% 73.2%
Expense ratio 24.9% 28.7% 58.1% 26.1%
Net technical result 33 (9) (5) 19
Underlying Net investment result 153 14 10 177
Underlying earnings from investments in affiliates and associates - - 30 30
Underlying operating income, gross of tax expenses 184 0 35 220
Current year Combined ratio 99.8% 96.2% 117.3% 99.7%
o/w Nat Cat impact 0.9 pts 0.5 pts 0.0 pts 0.9 pts
Combined Ratio 98.6% 102.5% 106.8% 99.3%
o/w Enlarged Expense ratio (1) 27.8% 31.3% 59.6% 29.0%
Net New Contracts (thous. policy count)
Motor 759 14 (18) 756
Household 78 9 (8) 79
(1) Composed of the sum of expense ratio and claims handling cost ratio

41
UNDERLYING OPERATING INCOME UNDER COMBINED RATIO ANALYSIS
PROPERTY & CASUALTY - HIGH GROWTH MARKETS Period ended December 31, 2011
AXA Consolidated
(Euro million) Financial Statements
Mediterranean & Latin American Region - high growth markets
Asia Central & Eastern Europe Total high growth
markets P&C
Earned revenues (gross) 2,613 413 62 3,088
Current accident year loss ratio 74.8% 68.6% 44.8% 73.4%
All accident year loss ratio 72.8% 68.4% 39.7% 71.5%
Expense ratio 25.4% 28.8% 62.6% 26.6%
Net technical result 47 11 (1) 57
Underlying Net investment result 143 17 7 166
Underlying earnings from investments in affiliates and associates - - 36 36
Underlying operating income, gross of tax expenses 189 22 41 253
Current year Combined ratio 100.3% 97.4% 107.3% 100.0%
o/w Nat Cat impact 0.5 pts 0.8 pts 0.0 pts 0.5 pts
Combined Ratio 98.2% 97.2% 102.3% 98.2%
o/w Enlarged Expense ratio (1) 28.0% 31.8% 64.2% 29.3%
Net New Contracts (thous. policy count)
Motor 820 50 (9) 861
Household 55 0 (7) 48
(1) Composed of the sum of expense ratio and claims handling cost ratio
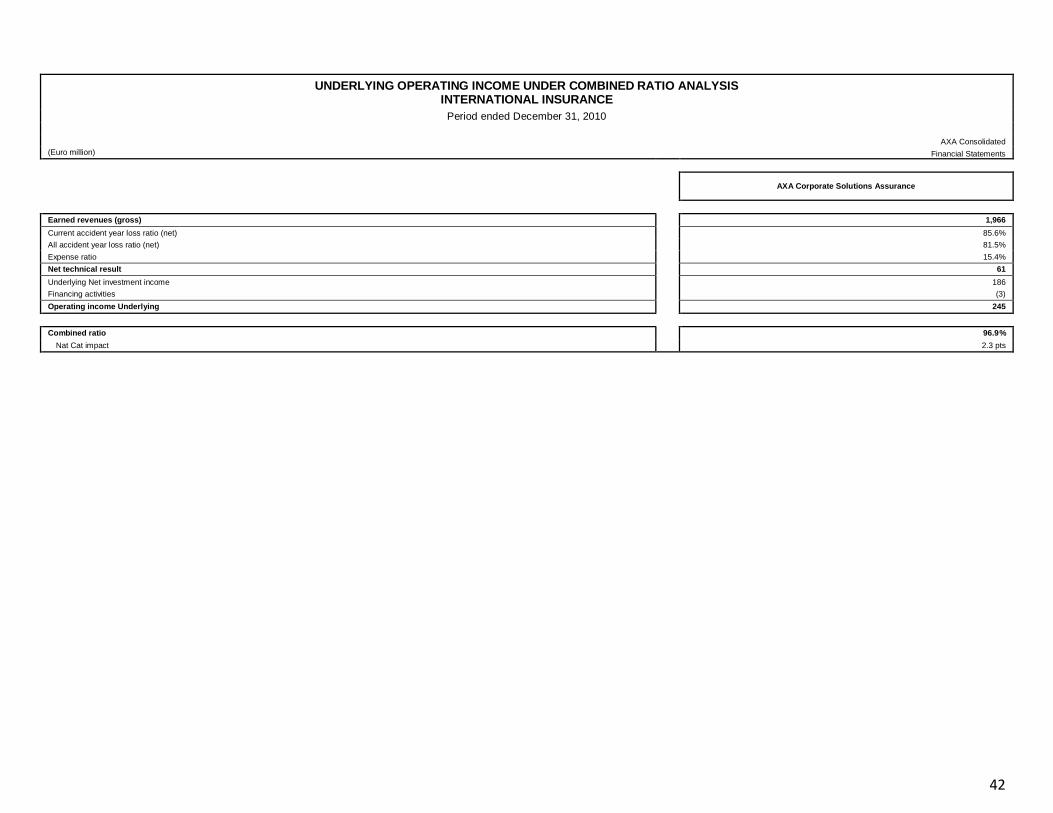
42
UNDERLYING OPERATING INCOME UNDER COMBINED RATIO ANALYSIS INTERNATIONAL INSURANCE
Period ended December 31, 2010
AXA Consolidated
(Euro million) Financial Statements
AXA Corporate Solutions Assurance
Earned revenues (gross) 1,966
Current accident year loss ratio (net) 85.6%
All accident year loss ratio (net) 81.5%
Expense ratio 15.4%
Net technical result 61
Underlying Net investment income 186
Financing activities (3)
Operating income Underlying 245
Combined ratio 96.9%
Nat Cat impact 2.3 pts

43
UNDERLYING OPERATING INCOME UNDER COMBINED RATIO ANALYSIS INTERNATIONAL INSURANCE
Period ended December 31, 2011
AXA Consolidated
(Euro million) Financial Statements
AXA Corporate Solutions Assurance
Earned revenues (gross) 2,008
Current accident year loss ratio (net) 84.7%
All accident year loss ratio (net) 82.1%
Expense ratio 15.8%
Net technical result 43
Underlying Net investment income 202
Financing activities (3)
Operating income Underlying 242
Combined ratio 97.9%
Nat Cat impact 4.1 pts
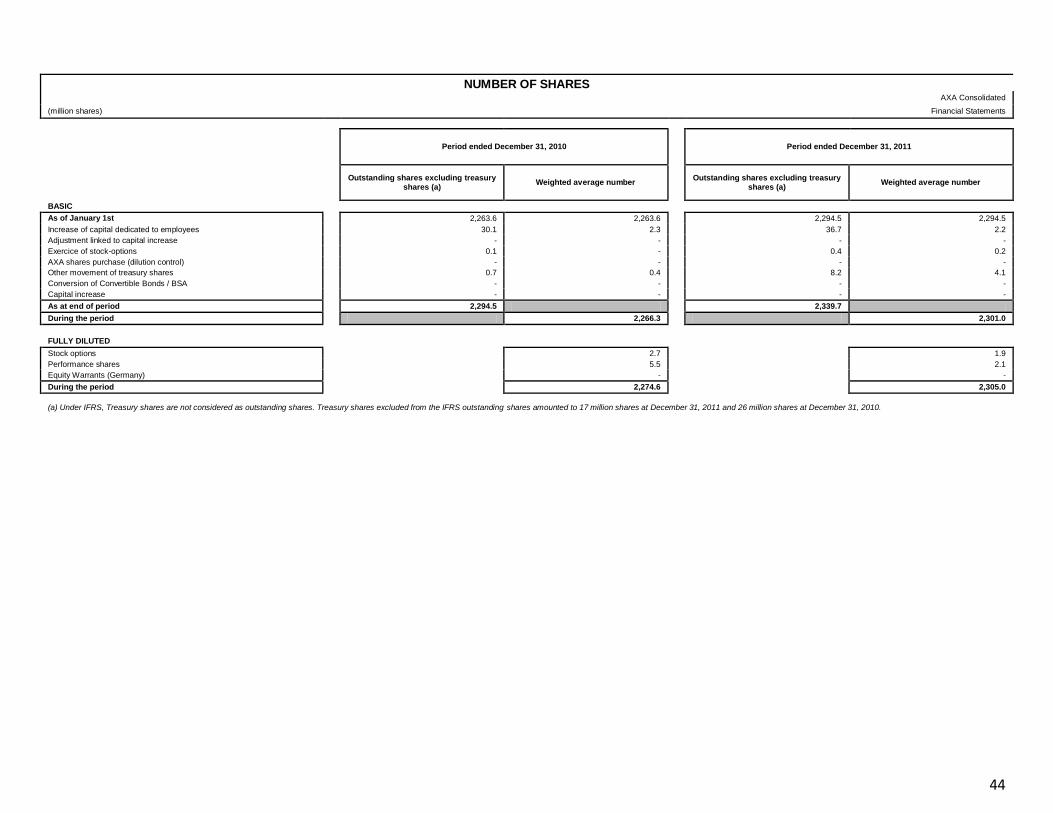
44
NUMBER OF SHARES
AXA Consolidated
(million shares) Financial Statements
Period ended December 31, 2010
Period ended December 31, 2011
Outstanding shares excluding treasury
shares (a) Weighted average number
Outstanding shares excluding treasury shares (a)
Weighted average number
BASIC
As of January 1st 2,263.6 2,263.6 2,294.5 2,294.5
Increase of capital dedicated to employees 30.1 2.3 36.7 2.2
Adjustment linked to capital increase - - - -
Exercice of stock-options 0.1 - 0.4 0.2
AXA shares purchase (dilution control) - - - -
Other movement of treasury shares 0.7 0.4 8.2 4.1
Conversion of Convertible Bonds / BSA - - - -
Capital increase - - - -
As at end of period 2,294.5 2,339.7
During the period 2,266.3 2,301.0
FULLY DILUTED
Stock options 2.7 1.9
Performance shares 5.5 2.1
Equity Warrants (Germany) - -
During the period 2,274.6 2,305.0
(a) Under IFRS, Treasury shares are not considered as outstanding shares. Treasury shares excluded from the IFRS outstanding shares amounted to 17 million shares at December 31, 2011 and 26 million shares at December 31, 2010.

45
EARNINGS PER SHARE
Financial Statements
(Euro million) AXA Consolidated
Period ended December 31, 2010 (a) Period ended December 31, 2011
EARNINGS
Net income 2,749 4,324
Adjusted earnings 4,150 3,589
Underlying earnings 3,731 3,901
IMPACT OF UNDATED SUBORDINATED DEBT ON:
Net income -300 -291
Adjusted earnings -300 -291
Underlying earnings -300 -291
BASIC
Weighted average number of outstanding shares during the period (million shares) 2,266 2,301
Net income 2,449 4,033
EPS (euro per share) 1.08 1.75
Adjusted earnings 3,851 3,298
Adjusted EPS (euro per share) 1.70 1.43
Underlying earnings 3,432 3,610
Underlying EPS (euro per share) 1.51 1.57
DILUTION IMPACTS
On earnings 0.0 0.0
On weighted average number of shares (million shares) 8.3 4.0
FULLY DILUTED
Weighted average number of outstanding shares during the period (million shares) 2,275 2,305
Net income 2,449 4,033
EPS (euro per share) 1.08 1.75
Adjusted earnings 3,851 3,298
Adjusted EPS (euro per share) 1.69 1.43
Underlying earnings 3,432 3,610
Underlying EPS (euro per share) 1.51 1.57
(a) Restatement of Canadian operations, accounted for as discontinued operations.
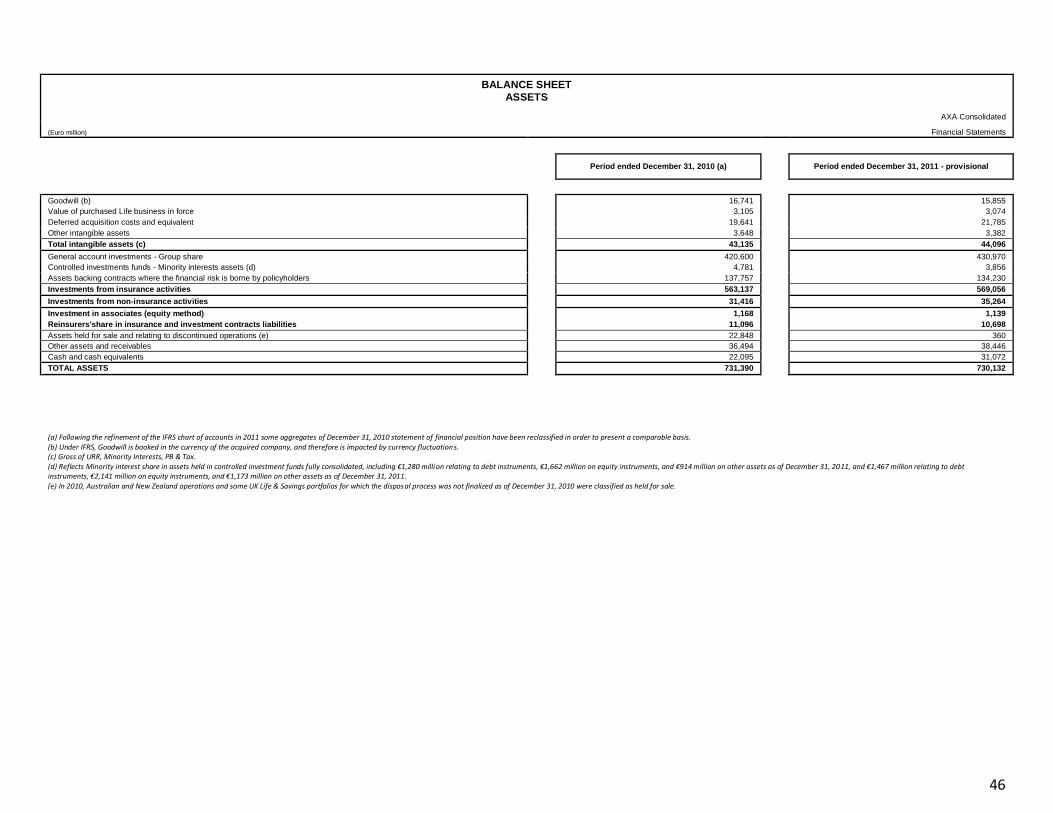
46
BALANCE SHEET
ASSETS
AXA Consolidated
(Euro million) Financial Statements
Period ended December 31, 2010 (a) Period ended December 31, 2011 - provisional
Goodwill (b) 16,741 15,855
Value of purchased Life business in force 3,105 3,074
Deferred acquisition costs and equivalent 19,641 21,785
Other intangible assets 3,648 3,382
Total intangible assets (c) 43,135 44,096
General account investments - Group share 420,600 430,970
Controlled investments funds - Minority interests assets (d) 4,781 3,856
Assets backing contracts where the financial risk is borne by policyholders 137,757 134,230
Investments from insurance activities 563,137 569,056
Investments from non-insurance activities 31,416 35,264
Investment in associates (equity method) 1,168 1,139
Reinsurers'share in insurance and investment contracts liabilities 11,096 10,698
Assets held for sale and relating to discontinued operations (e) 22,848 360
Other assets and receivables 36,494 38,446
Cash and cash equivalents 22,095 31,072
TOTAL ASSETS 731,390 730,132
(a) Following the refinement of the IFRS chart of accounts in 2011 some aggregates of December 31, 2010 statement of financial position have been reclassified in order to present a comparable basis. (b) Under IFRS, Goodwill is booked in the currency of the acquired company, and therefore is impacted by currency fluctuations. (c) Gross of URR, Minority Interests, PB & Tax. (d) Reflects Minority interest share in assets held in controlled investment funds fully consolidated, including €1,280 million relating to debt instruments, €1,662 million on equity instruments, and €914 million on other assets as of December 31, 2011, and €1,467 million relating to debt instruments, €2,141 million on equity instruments, and €1,173 million on other assets as of December 31, 2011. (e) In 2010, Australian and New Zealand operations and some UK Life & Savings portfolios for which the disposal process was not finalized as of December 31, 2010 were classified as held for sale.
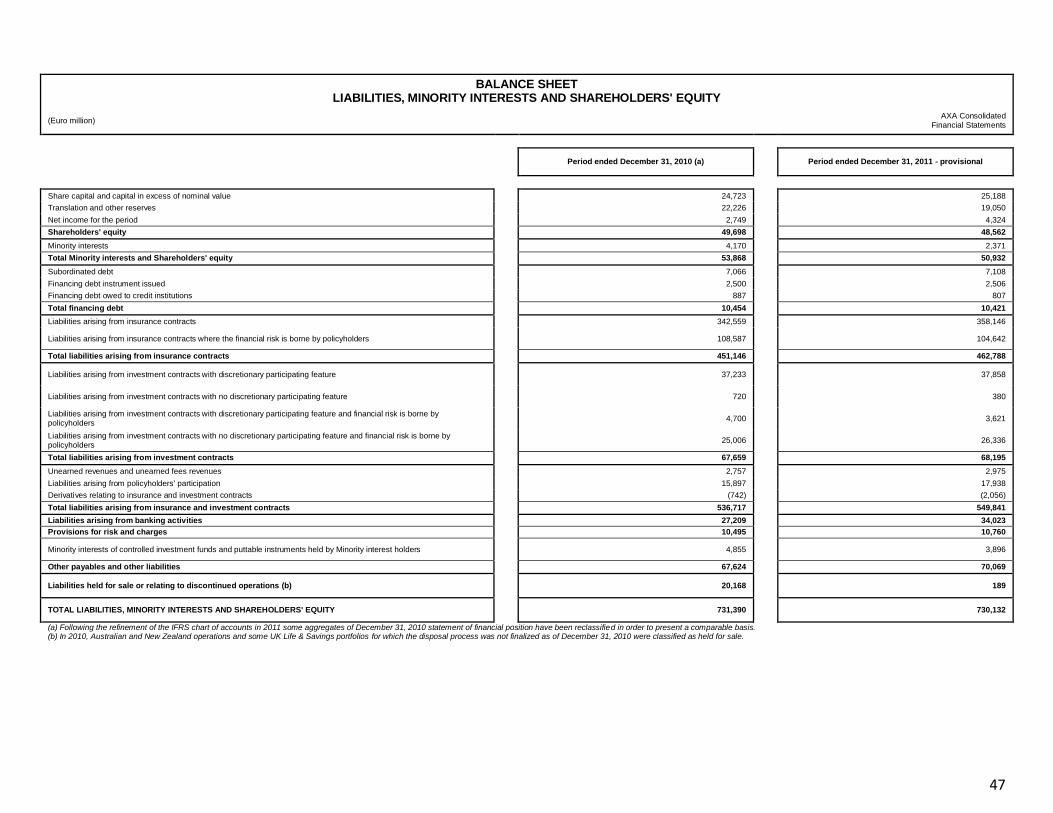
47
BALANCE SHEET
LIABILITIES, MINORITY INTERESTS AND SHAREHOLDERS' EQUITY
(Euro million)
AXA Consolidated Financial Statements
Period ended December 31, 2010 (a) Period ended December 31, 2011 - provisional
Share capital and capital in excess of nominal value 24,723 25,188
Translation and other reserves 22,226 19,050
Net income for the period 2,749 4,324
Shareholders' equity 49,698 48,562
Minority interests 4,170 2,371
Total Minority interests and Shareholders' equity 53,868 50,932
Subordinated debt 7,066 7,108
Financing debt instrument issued 2,500 2,506
Financing debt owed to credit institutions 887 807
Total financing debt 10,454 10,421
Liabilities arising from insurance contracts 342,559 358,146
Liabilities arising from insurance contracts where the financial risk is borne by policyholders 108,587 104,642
Total liabilities arising from insurance contracts 451,146 462,788
Liabilities arising from investment contracts with discretionary participating feature 37,233 37,858
Liabilities arising from investment contracts with no discretionary participating feature 720 380
Liabilities arising from investment contracts with discretionary participating feature and financial risk is borne by policyholders
4,700 3,621
Liabilities arising from investment contracts with no discretionary participating feature and financial risk is borne by policyholders
25,006 26,336
Total liabilities arising from investment contracts 67,659 68,195
Unearned revenues and unearned fees revenues 2,757 2,975
Liabilities arising from policyholders' participation 15,897 17,938
Derivatives relating to insurance and investment contracts (742) (2,056)
Total liabilities arising from insurance and investment contracts 536,717 549,841
Liabilities arising from banking activities 27,209 34,023
Provisions for risk and charges 10,495 10,760
Minority interests of controlled investment funds and puttable instruments held by Minority interest holders 4,855 3,896
Other payables and other liabilities 67,624 70,069
Liabilities held for sale or relating to discontinued operations (b) 20,168 189
TOTAL LIABILITIES, MINORITY INTERESTS AND SHAREHOLDERS' EQUITY 731,390 730,132
(a) Following the refinement of the IFRS chart of accounts in 2011 some aggregates of December 31, 2010 statement of financial position have been reclassified in order to present a comparable basis. (b) In 2010, Australian and New Zealand operations and some UK Life & Savings portfolios for which the disposal process was not finalized as of December 31, 2010 were classified as held for sale.
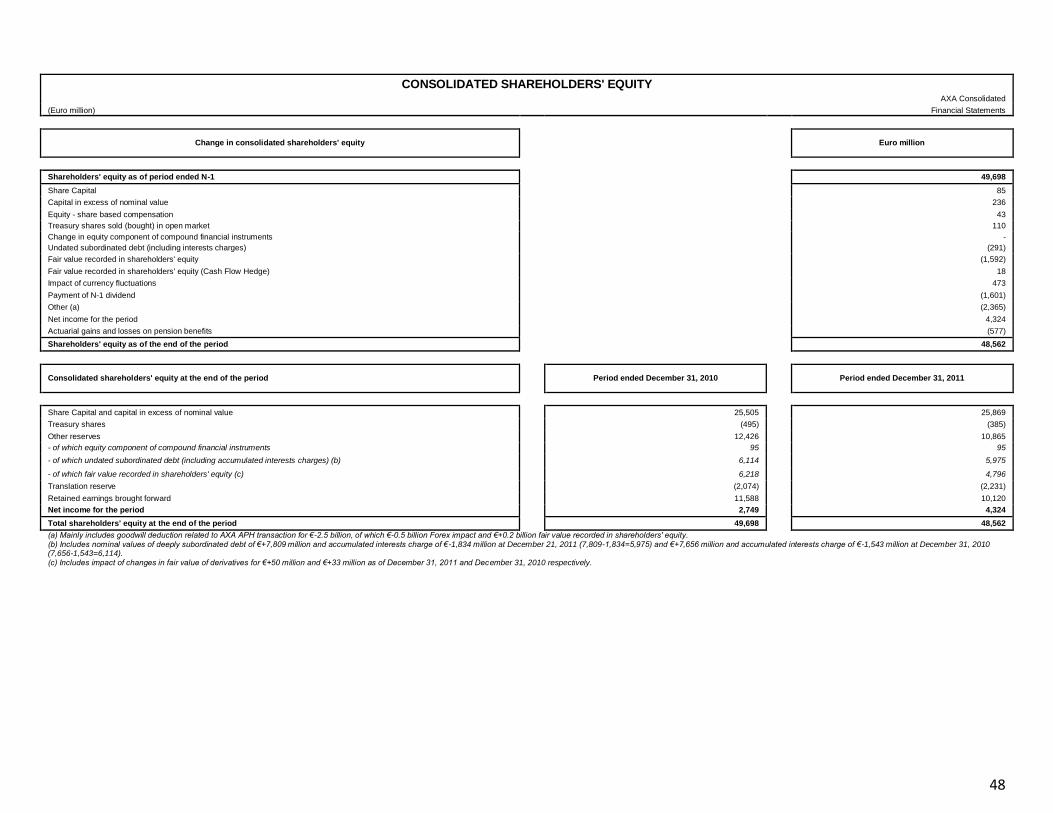
48
CONSOLIDATED SHAREHOLDERS' EQUITY
AXA Consolidated
(Euro million) Financial Statements
Change in consolidated shareholders' equity
Euro million
Shareholders' equity as of period ended N-1 49,698
Share Capital 85
Capital in excess of nominal value 236
Equity - share based compensation 43
Treasury shares sold (bought) in open market 110
Change in equity component of compound financial instruments -
Undated subordinated debt (including interests charges) (291)
Fair value recorded in shareholders' equity (1,592)
Fair value recorded in shareholders' equity (Cash Flow Hedge) 18
Impact of currency fluctuations 473
Payment of N-1 dividend (1,601)
Other (a) (2,365)
Net income for the period 4,324
Actuarial gains and losses on pension benefits (577)
Shareholders' equity as of the end of the period 48,562
Consolidated shareholders' equity at the end of the period
Period ended December 31, 2010
Period ended December 31, 2011
Share Capital and capital in excess of nominal value 25,505 25,869
Treasury shares (495) (385)
Other reserves 12,426 10,865
- of which equity component of compound financial instruments 95 95
- of which undated subordinated debt (including accumulated interests charges) (b) 6,114 5,975
- of which fair value recorded in shareholders' equity (c) 6,218 4,796
Translation reserve (2,074) (2,231)
Retained earnings brought forward 11,588 10,120
Net income for the period 2,749 4,324
Total shareholders' equity at the end of the period 49,698 48,562
(a) Mainly includes goodwill deduction related to AXA APH transaction for €-2.5 billion, of which €-0.5 billion Forex impact and €+0.2 billion fair value recorded in shareholders' equity. (b) Includes nominal values of deeply subordinated debt of €+7,809 million and accumulated interests charge of €-1,834 million at December 21, 2011 (7,809-1,834=5,975) and €+7,656 million and accumulated interests charge of €-1,543 million at December 31, 2010 (7,656-1,543=6,114). (c) Includes impact of changes in fair value of derivatives for €+50 million and €+33 million as of December 31, 2011 and December 31, 2010 respectively.
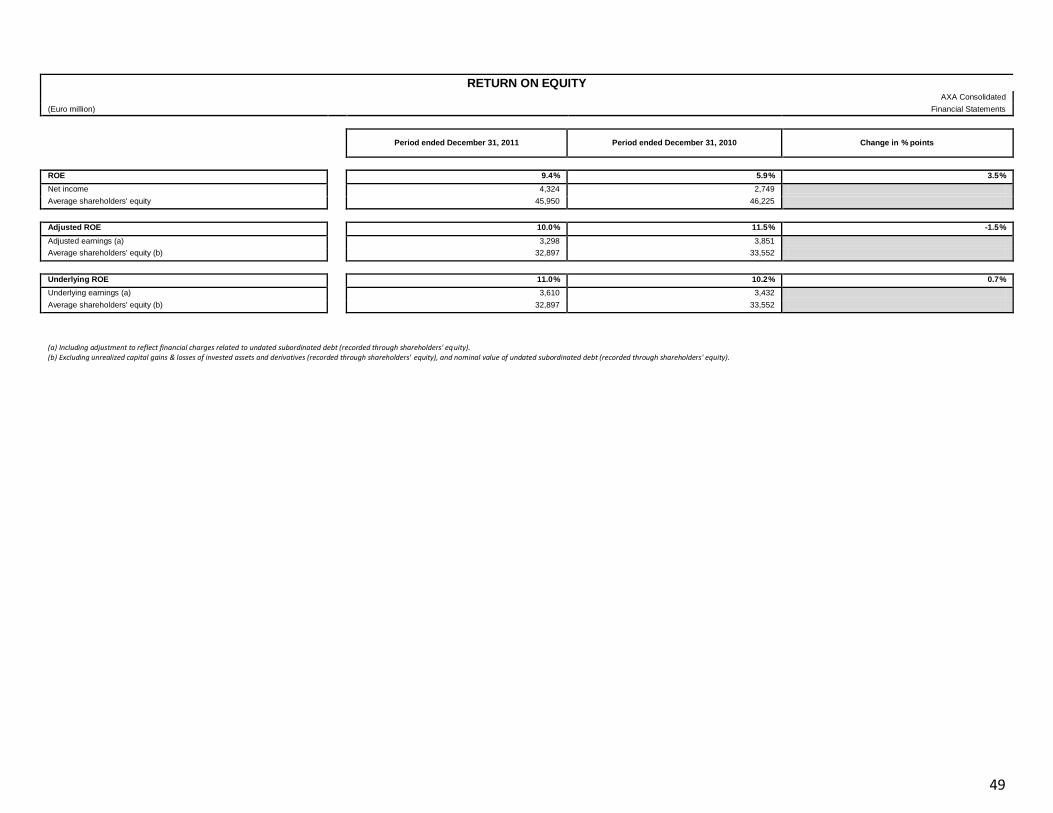
49
RETURN ON EQUITY
AXA Consolidated
(Euro million) Financial Statements
Period ended December 31, 2011 Period ended December 31, 2010 Change in % points
ROE 9.4% 5.9% 3.5%
Net income 4,324 2,749
Average shareholders' equity 45,950 46,225
Adjusted ROE 10.0% 11.5% -1.5%
Adjusted earnings (a) 3,298 3,851
Average shareholders' equity (b) 32,897 33,552
Underlying ROE 11.0% 10.2% 0.7%
Underlying earnings (a) 3,610 3,432
Average shareholders' equity (b) 32,897 33,552
(a) Including adjustment to reflect financial charges related to undated subordinated debt (recorded through shareholders' equity). (b) Excluding unrealized capital gains & losses of invested assets and derivatives (recorded through shareholders' equity), and nominal value of undated subordinated debt (recorded through shareholders' equity).
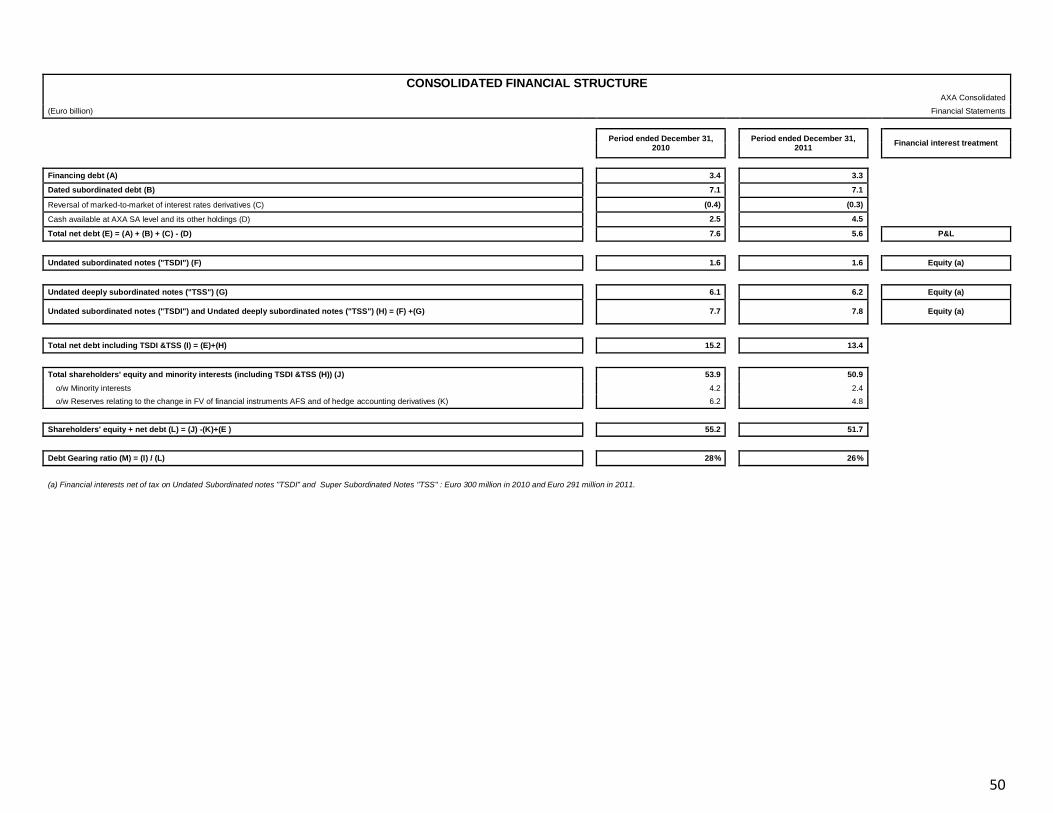
50
CONSOLIDATED FINANCIAL STRUCTURE
AXA Consolidated
(Euro billion) Financial Statements
Period ended December 31,
2010
Period ended December 31, 2011
Financial interest treatment
Financing debt (A) 3.4 3.3
Dated subordinated debt (B) 7.1 7.1
Reversal of marked-to-market of interest rates derivatives (C) (0.4) (0.3)
Cash available at AXA SA level and its other holdings (D) 2.5 4.5
Total net debt (E) = (A) + (B) + (C) - (D) 7.6 5.6
P&L
Undated subordinated notes ("TSDI") (F) 1.6 1.6
Equity (a)
Undated deeply subordinated notes ("TSS") (G) 6.1 6.2
Equity (a)
Undated subordinated notes ("TSDI") and Undated deeply subordinated notes ("TSS") (H) = (F) +(G) 7.7 7.8
Equity (a)
Total net debt including TSDI &TSS (I) = (E)+(H) 15.2 13.4
Total shareholders' equity and minority interests (including TSDI &TSS (H)) (J) 53.9 50.9
o/w Minority interests 4.2 2.4
o/w Reserves relating to the change in FV of financial instruments AFS and of hedge accounting derivatives (K) 6.2 4.8
Shareholders' equity + net debt (L) = (J) -(K)+(E ) 55.2 51.7
Debt Gearing ratio (M) = (I) / (L) 28% 26%
(a) Financial interests net of tax on Undated Subordinated notes "TSDI" and Super Subordinated Notes "TSS" : Euro 300 million in 2010 and Euro 291 million in 2011.
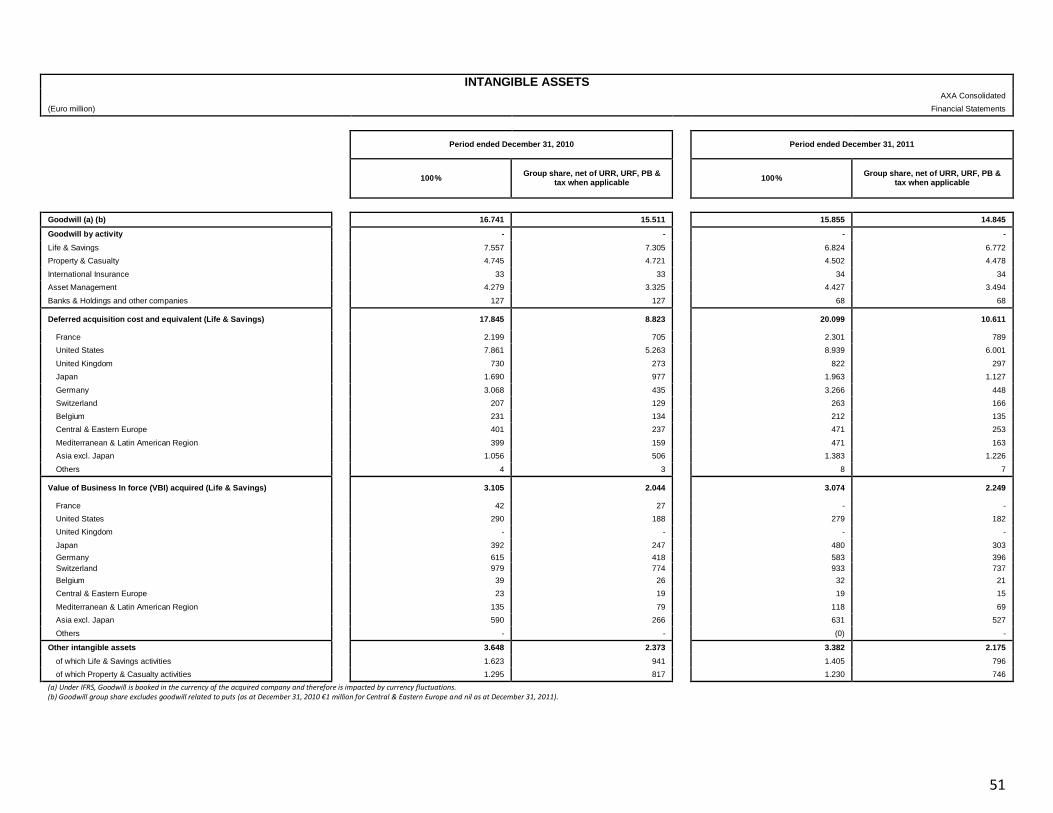
51
INTANGIBLE ASSETS
AXA Consolidated
(Euro million) Financial Statements
Period ended December 31, 2010
Period ended December 31, 2011
100% Group share, net of URR, URF, PB &
tax when applicable
100% Group share, net of URR, URF, PB &
tax when applicable
Goodwill (a) (b) 16.741 15.511 15.855 14.845
Goodwill by activity - - - -
Life & Savings 7.557 7.305 6.824 6.772
Property & Casualty 4.745 4.721 4.502 4.478
International Insurance 33 33 34 34
Asset Management 4.279 3.325 4.427 3.494
Banks & Holdings and other companies 127 127 68 68
Deferred acquisition cost and equivalent (Life & Savings)
17.845 8.823 20.099 10.611
France 2.199 705 2.301 789
United States 7.861 5.263 8.939 6.001
United Kingdom 730 273 822 297
Japan 1.690 977 1.963 1.127
Germany 3.068 435 3.266 448
Switzerland 207 129 263 166
Belgium 231 134 212 135
Central & Eastern Europe 401 237 471 253
Mediterranean & Latin American Region 399 159 471 163
Asia excl. Japan 1.056 506 1.383 1.226
Others 4 3 8 7
Value of Business In force (VBI) acquired (Life & Savings)
3.105 2.044 3.074 2.249
France 42 27 - -
United States 290 188 279 182
United Kingdom - - - -
Japan 392 247 480 303
Germany 615 418 583 396
Switzerland 979 774 933 737
Belgium 39 26 32 21
Central & Eastern Europe 23 19 19 15
Mediterranean & Latin American Region 135 79 118 69
Asia excl. Japan 590 266 631 527
Others - - (0) -
Other intangible assets 3.648 2.373 3.382 2.175
of which Life & Savings activities 1.623 941 1.405 796
of which Property & Casualty activities 1.295 817 1.230 746
(a) Under IFRS, Goodwill is booked in the currency of the acquired company and therefore is impacted by currency fluctuations. (b) Goodwill group share excludes goodwill related to puts (as at December 31, 2010 €1 million for Central & Eastern Europe and nil as at December 31, 2011).

52
DEFERRED ACQUISITION COSTS AND EQUIVALENT LIFE AND SAVINGS (GROSS OF TAXES AND PB)
Period ended December 31, 2010
AXA Consolidated
(Euro million) Financial Statements
Period ended N-1 Capitalization for the
period Amortization for the
period Shadow DAC
Other changes (including currency
changes) Changes in scope (a) Period ended N
Total 17.050 2.502 (1.073) (224) 951 (1.361) 17.845
France 2.084 266 (159) (18) 26 0 2.199
United States 7.043 708 (231) (138) 479 (0) 7.861
United Kingdom 1.899 314 (182) - 60 (1.362) 730
Japan 1.399 312 (236) (75) 290 - 1.690
Germany 2.852 372 (156) - - - 3.068
Switzerland 139 48 (8) (2) 30 - 207
Belgium 211 28 (8) 1 - - 231
Central & Eastern Europe 282 120 (9) - 8 0 401
Mediterranean & Latin American Region 330 116 (59) 10 1 - 399
Asia excl. Japan 809 217 (26) (1) 57 0 1.056
Other Countries 3 2 (0) - (0) - 4
Unearned revenue reserve and Unearned fees reserve (URR & URF)
2.610
2.757
Deferred acquisition costs and equivalent (Net of URR & URF)
14.440
15.090
(a) Of which €-549 million of impairments net of tax following the partial sale of the UK Life operations

53
DEFERRED ACQUISITION COSTS AND EQUIVALENT LIFE AND SAVINGS (GROSS OF TAXES AND PB)
Period ended December 31, 2011
AXA Consolidated
(Euro million) Financial Statements
Period ended N-1 Capitalization for the
period Amortization for the
period Shadow DAC
Other changes (including currency
changes) Changes in scope (a) Period ended N
Total 17.845 2.507 (782) (48) 576 1 20.099
France 2.199 233 (136) 5 - - 2.301
United States 7.861 768 84 (89) 315 - 8.939
United Kingdom 730 136 (67) - 21 1 822
Japan 1.690 324 (251) 35 165 - 1.963
Germany 3.068 402 (205) - - - 3.266
Switzerland 207 59 (7) (2) 7 - 263
Belgium 231 25 (41) (2) - - 212
Central & Eastern Europe 401 126 (23) - (33) - 471
Mediterranean & Latin American Region 399 151 (84) 6 (0) - 471
Asia excl. Japan 1.056 277 (51) (0) 101 (0) 1.383
Other Countries 4 5 (1) - - - 8
Unearned revenue reserve and Unearned fees reserve (URR & URF)
2.757
2.975
Deferred acquisition costs and equivalent (Net of URR & URF)
15.090
17.124
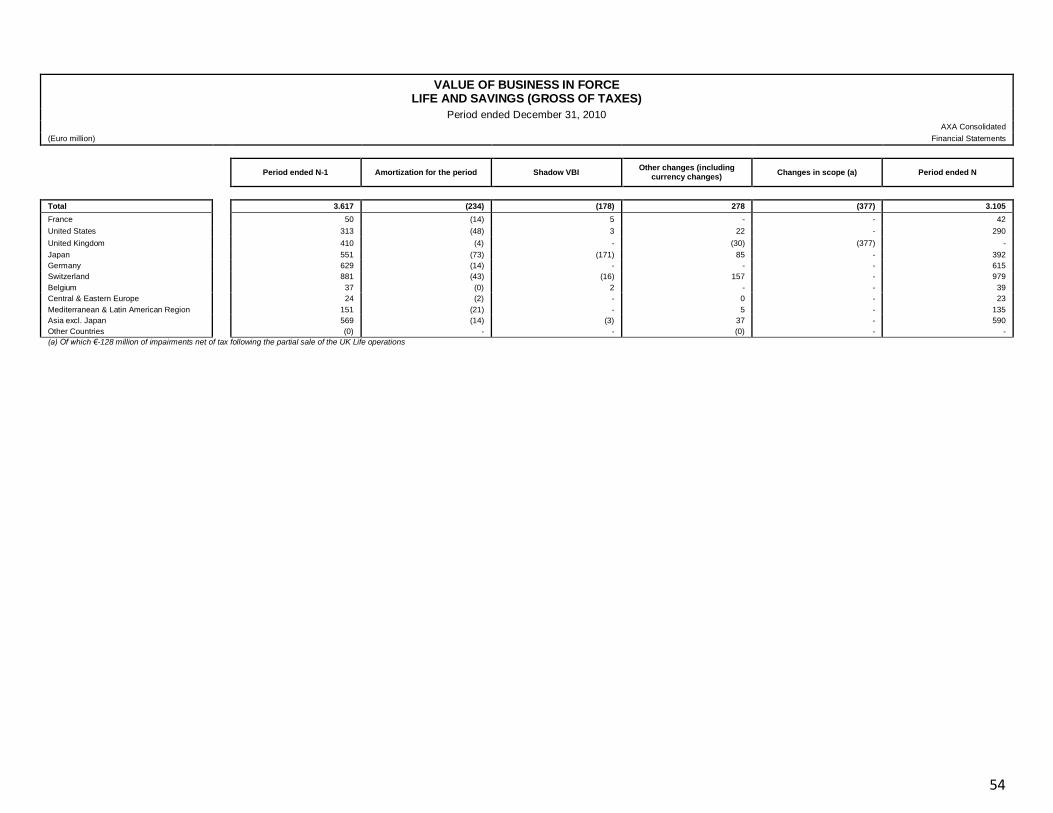
54
VALUE OF BUSINESS IN FORCE
LIFE AND SAVINGS (GROSS OF TAXES)
Period ended December 31, 2010
AXA Consolidated
(Euro million) Financial Statements
Period ended N-1 Amortization for the period Shadow VBI
Other changes (including currency changes)
Changes in scope (a) Period ended N
Total 3.617 (234) (178) 278 (377) 3.105
France 50 (14) 5 - - 42
United States 313 (48) 3 22 - 290
United Kingdom 410 (4) - (30) (377) -
Japan 551 (73) (171) 85 - 392
Germany 629 (14) - - - 615
Switzerland 881 (43) (16) 157 - 979
Belgium 37 (0) 2 - - 39
Central & Eastern Europe 24 (2) - 0 - 23
Mediterranean & Latin American Region 151 (21) - 5 - 135
Asia excl. Japan 569 (14) (3) 37 - 590
Other Countries (0) - - (0) - -
(a) Of which €-128 million of impairments net of tax following the partial sale of the UK Life operations

55
VALUE OF BUSINESS IN FORCE
LIFE AND SAVINGS (GROSS OF TAXES)
Period ended December 31, 2011
AXA Consolidated
(Euro million) Financial Statements
Period ended N-1 Amortization for the period Shadow VBI
Other changes (including currency changes)
Changes in scope (a) Period ended N
Total 3.105 (244) 110 101 3 3.074
France 42 (73) 32 - -
United States 290 (4) (15) 8 - 279
United Kingdom - (3) - - 3 -
Japan 392 (59) 105 41 - 480
Germany 615 (32) - - - 583
Switzerland 979 (59) (16) 28 - 933
Belgium 39 (5) (2) - - 32
Central & Eastern Europe 23 (2) - (2) - 19
Mediterranean & Latin American Region 135 (14) - (3) - 118
Asia excl. Japan 590 7 6 28 (0) 631
Other Countries - - - 0 0 -
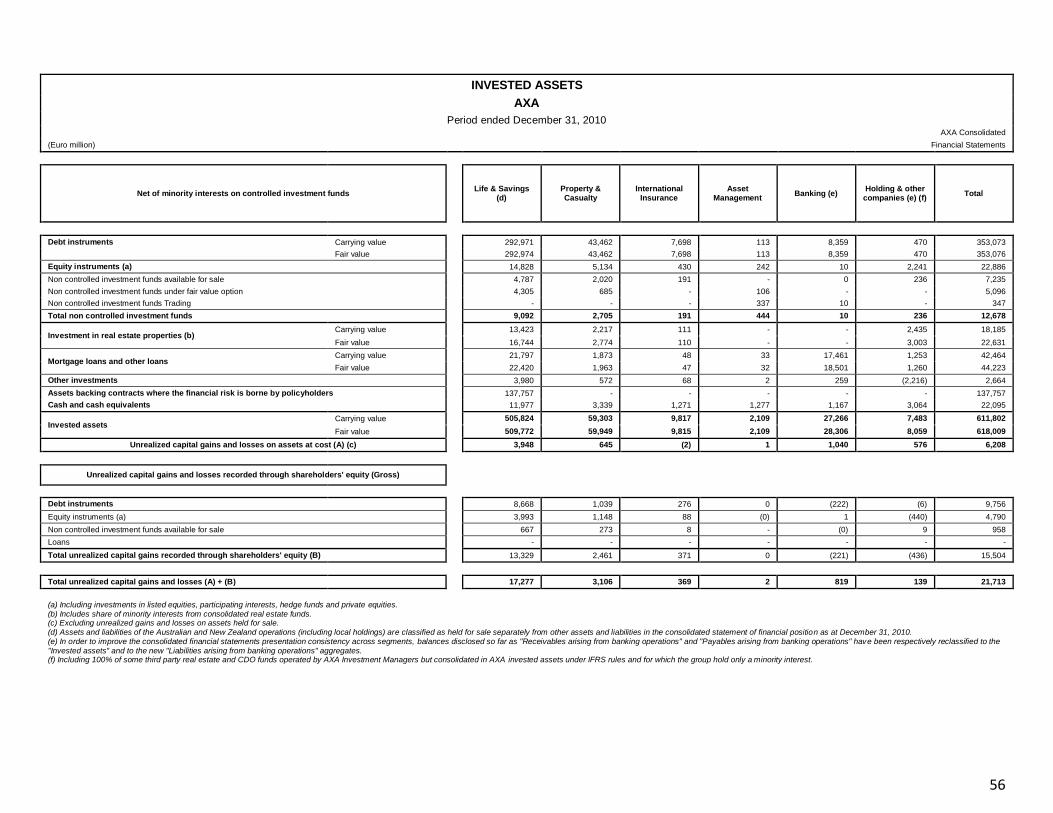
56
INVESTED ASSETS
AXA
Period ended December 31, 2010
AXA Consolidated
(Euro million) Financial Statements
Net of minority interests on controlled investment funds
Life & Savings (d)
Property & Casualty
International Insurance
Asset Management
Banking (e) Holding & other
companies (e) (f) Total
Debt instruments Carrying value 292,971 43,462 7,698 113 8,359 470 353,073
Fair value 292,974 43,462 7,698 113 8,359 470 353,076
Equity instruments (a) 14,828 5,134 430 242 10 2,241 22,886
Non controlled investment funds available for sale 4,787 2,020 191 - 0 236 7,235
Non controlled investment funds under fair value option 4,305 685 - 106 - - 5,096
Non controlled investment funds Trading - - - 337 10 - 347
Total non controlled investment funds 9,092 2,705 191 444 10 236 12,678
Investment in real estate properties (b) Carrying value 13,423 2,217 111 - - 2,435 18,185
Fair value 16,744 2,774 110 - - 3,003 22,631
Mortgage loans and other loans Carrying value 21,797 1,873 48 33 17,461 1,253 42,464
Fair value 22,420 1,963 47 32 18,501 1,260 44,223
Other investments 3,980 572 68 2 259 (2,216) 2,664
Assets backing contracts where the financial risk is borne by policyholders 137,757 - - - - - 137,757
Cash and cash equivalents 11,977 3,339 1,271 1,277 1,167 3,064 22,095
Invested assets Carrying value 505,824 59,303 9,817 2,109 27,266 7,483 611,802
Fair value 509,772 59,949 9,815 2,109 28,306 8,059 618,009
Unrealized capital gains and losses on assets at cost (A) (c) 3,948 645 (2) 1 1,040 576 6,208
Unrealized capital gains and losses recorded through shareholders' equity (Gross)
Debt instruments 8,668 1,039 276 0 (222) (6) 9,756
Equity instruments (a) 3,993 1,148 88 (0) 1 (440) 4,790
Non controlled investment funds available for sale 667 273 8 - (0) 9 958
Loans - - - - - - -
Total unrealized capital gains recorded through shareholders' equity (B) 13,329 2,461 371 0 (221) (436) 15,504
Total unrealized capital gains and losses (A) + (B) 17,277 3,106 369 2 819 139 21,713
(a) Including investments in listed equities, participating interests, hedge funds and private equities. (b) Includes share of minority interests from consolidated real estate funds. (c) Excluding unrealized gains and losses on assets held for sale. (d) Assets and liabilities of the Australian and New Zealand operations (including local holdings) are classified as held for sale separately from other assets and liabilities in the consolidated statement of financial position as at December 31, 2010. (e) In order to improve the consolidated financial statements presentation consistency across segments, balances disclosed so far as "Receivables arising from banking operations" and "Payables arising from banking operations" have been respectively reclassified to the "Invested assets" and to the new "Liabilities arising from banking operations" aggregates. (f) Including 100% of some third party real estate and CDO funds operated by AXA Investment Managers but consolidated in AXA invested assets under IFRS rules and for which the group hold only a minority interest.
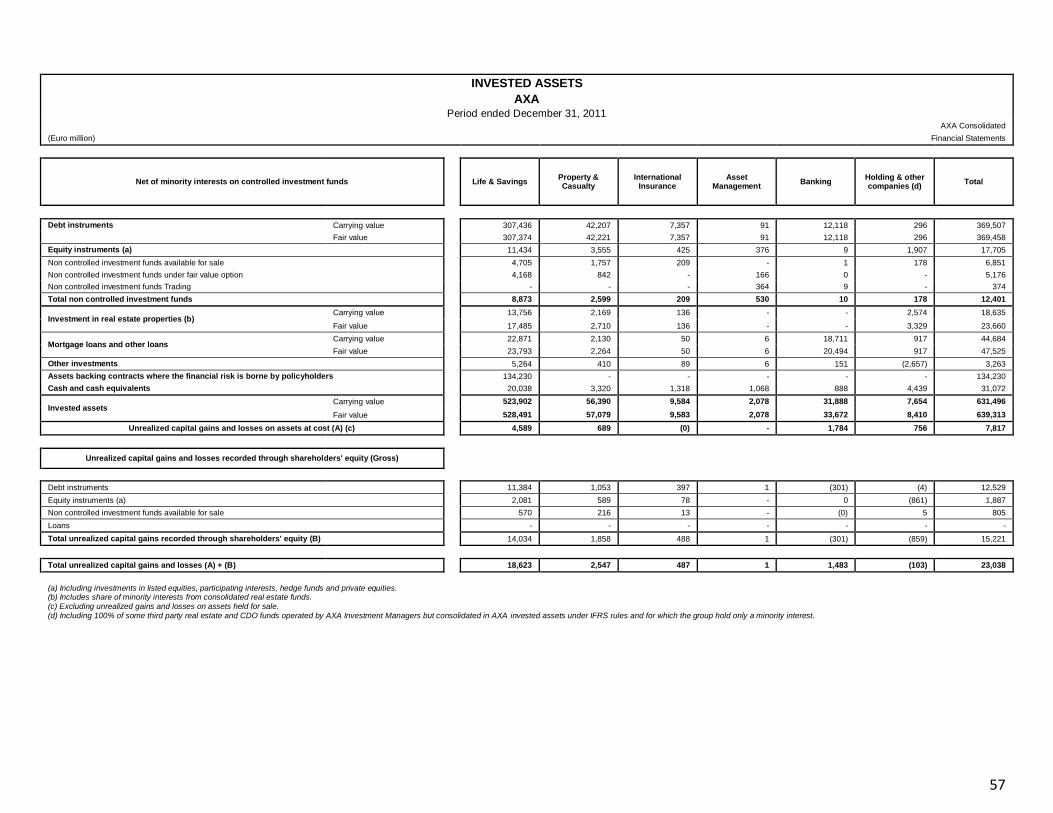
57
INVESTED ASSETS
AXA Period ended December 31, 2011
AXA Consolidated
(Euro million) Financial Statements
Net of minority interests on controlled investment funds
Life & Savings Property & Casualty
International Insurance
Asset Management
Banking Holding & other companies (d)
Total
Debt instruments Carrying value
307,436 42,207 7,357 91 12,118 296 369,507
Fair value
307,374 42,221 7,357 91 12,118 296 369,458
Equity instruments (a)
11,434 3,555 425 376 9 1,907 17,705
Non controlled investment funds available for sale
4,705 1,757 209 - 1 178 6,851
Non controlled investment funds under fair value option
4,168 842 - 166 0 - 5,176
Non controlled investment funds Trading
- - - 364 9 - 374
Total non controlled investment funds
8,873 2,599 209 530 10 178 12,401
Investment in real estate properties (b) Carrying value
13,756 2,169 136 - - 2,574 18,635
Fair value
17,485 2,710 136 - - 3,329 23,660
Mortgage loans and other loans Carrying value
22,871 2,130 50 6 18,711 917 44,684
Fair value
23,793 2,264 50 6 20,494 917 47,525
Other investments
5,264 410 89 6 151 (2,657) 3,263
Assets backing contracts where the financial risk is borne by policyholders
134,230 - - - - - 134,230
Cash and cash equivalents
20,038 3,320 1,318 1,068 888 4,439 31,072
Invested assets Carrying value
523,902 56,390 9,584 2,078 31,888 7,654 631,496
Fair value
528,491 57,079 9,583 2,078 33,672 8,410 639,313
Unrealized capital gains and losses on assets at cost (A) (c)
4,589 689 (0) - 1,784 756 7,817
Unrealized capital gains and losses recorded through shareholders' equity (Gross)
Debt instruments
11,384 1,053 397 1 (301) (4) 12,529
Equity instruments (a)
2,081 589 78 - 0 (861) 1,887
Non controlled investment funds available for sale
570 216 13 - (0) 5 805
Loans
- - - - - - -
Total unrealized capital gains recorded through shareholders' equity (B)
14,034 1,858 488 1 (301) (859) 15,221
Total unrealized capital gains and losses (A) + (B)
18,623 2,547 487 1 1,483 (103) 23,038
(a) Including investments in listed equities, participating interests, hedge funds and private equities. (b) Includes share of minority interests from consolidated real estate funds. (c) Excluding unrealized gains and losses on assets held for sale. (d) Including 100% of some third party real estate and CDO funds operated by AXA Investment Managers but consolidated in AXA invested assets under IFRS rules and for which the group hold only a minority interest.
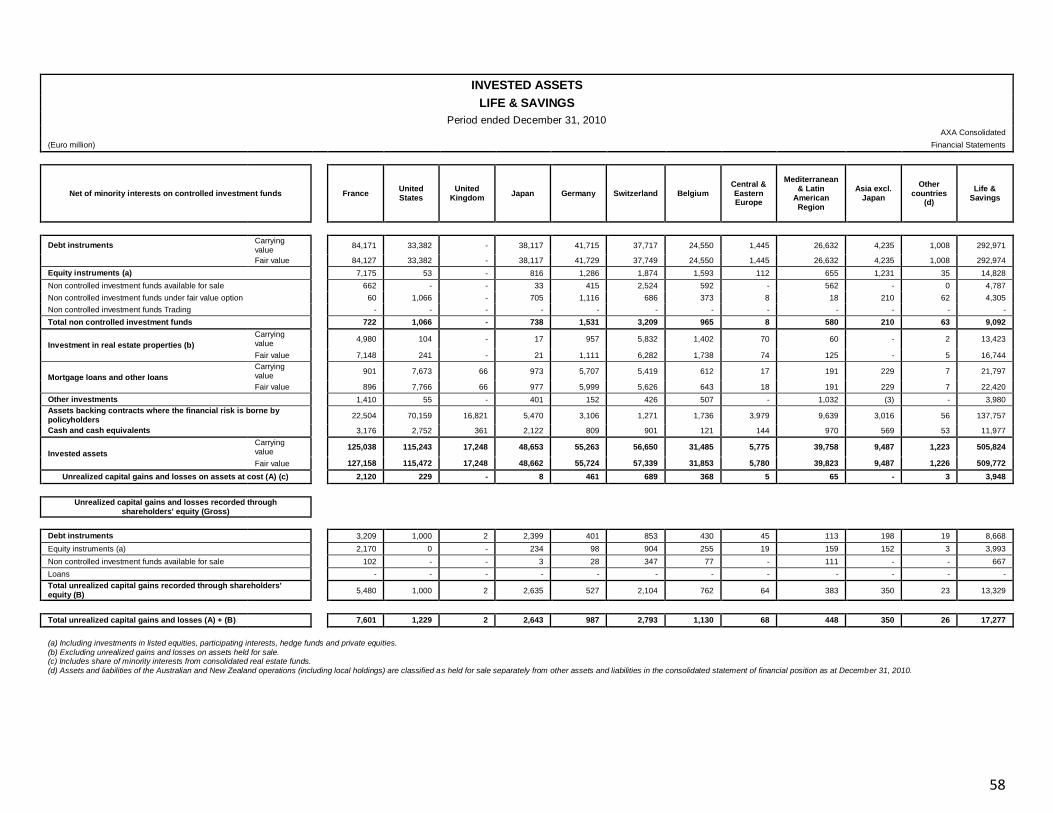
58
INVESTED ASSETS
LIFE & SAVINGS
Period ended December 31, 2010
AXA Consolidated
(Euro million) Financial Statements
Net of minority interests on controlled investment funds
France United States
United Kingdom
Japan Germany Switzerland Belgium Central & Eastern Europe
Mediterranean & Latin
American Region
Asia excl. Japan
Other countries
(d)
Life & Savings
Debt instruments Carrying value
84,171 33,382 - 38,117 41,715 37,717 24,550 1,445 26,632 4,235 1,008 292,971
Fair value 84,127 33,382 - 38,117 41,729 37,749 24,550 1,445 26,632 4,235 1,008 292,974
Equity instruments (a) 7,175 53 - 816 1,286 1,874 1,593 112 655 1,231 35 14,828
Non controlled investment funds available for sale 662 - - 33 415 2,524 592 - 562 - 0 4,787
Non controlled investment funds under fair value option 60 1,066 - 705 1,116 686 373 8 18 210 62 4,305
Non controlled investment funds Trading - - - - - - - - - - - -
Total non controlled investment funds 722 1,066 - 738 1,531 3,209 965 8 580 210 63 9,092
Investment in real estate properties (b)
Carrying value
4,980 104 - 17 957 5,832 1,402 70 60 - 2 13,423
Fair value 7,148 241 - 21 1,111 6,282 1,738 74 125 - 5 16,744
Mortgage loans and other loans
Carrying value
901 7,673 66 973 5,707 5,419 612 17 191 229 7 21,797
Fair value 896 7,766 66 977 5,999 5,626 643 18 191 229 7 22,420
Other investments 1,410 55 - 401 152 426 507 - 1,032 (3) - 3,980
Assets backing contracts where the financial risk is borne by policyholders
22,504 70,159 16,821 5,470 3,106 1,271 1,736 3,979 9,639 3,016 56 137,757
Cash and cash equivalents 3,176 2,752 361 2,122 809 901 121 144 970 569 53 11,977
Invested assets
Carrying value
125,038 115,243 17,248 48,653 55,263 56,650 31,485 5,775 39,758 9,487 1,223 505,824
Fair value 127,158 115,472 17,248 48,662 55,724 57,339 31,853 5,780 39,823 9,487 1,226 509,772
Unrealized capital gains and losses on assets at cost (A) (c) 2,120 229 - 8 461 689 368 5 65 - 3 3,948
Unrealized capital gains and losses recorded through shareholders' equity (Gross)
Debt instruments 3,209 1,000 2 2,399 401 853 430 45 113 198 19 8,668
Equity instruments (a) 2,170 0 - 234 98 904 255 19 159 152 3 3,993
Non controlled investment funds available for sale 102 - - 3 28 347 77 - 111 - - 667
Loans - - - - - - - - - - - -
Total unrealized capital gains recorded through shareholders' equity (B)
5,480 1,000 2 2,635 527 2,104 762 64 383 350 23 13,329
Total unrealized capital gains and losses (A) + (B) 7,601 1,229 2 2,643 987 2,793 1,130 68 448 350 26 17,277
(a) Including investments in listed equities, participating interests, hedge funds and private equities. (b) Excluding unrealized gains and losses on assets held for sale. (c) Includes share of minority interests from consolidated real estate funds. (d) Assets and liabilities of the Australian and New Zealand operations (including local holdings) are classified as held for sale separately from other assets and liabilities in the consolidated statement of financial position as at December 31, 2010.

59
INVESTED ASSETS
LIFE & SAVINGS Period ended December 31, 2011
AXA Consolidated
(Euro million) Financial Statements
Net of minority interests on controlled investment funds
France United States
United Kingdom
Japan Germany Switzerland Belgium Central & Eastern Europe
Mediterranean & Latin
American Region
Asia excl. Japan
Other countries
Life & Savings
Debt instruments
Carrying value
84,394 38,731 10 45,500 44,733 35,970 27,161 1,410 23,935 5,082 510 307,436
Fair value
84,332 38,731 10 45,500 44,746 35,957 27,161 1,410 23,935 5,082 510 307,374
Equity instruments (a)
6,353 54 - 750 1,294 514 821 109 416 1,105 18 11,434
Non controlled investment funds available for sale
437 - - 23 383 2,894 282 - 545 141 1 4,705
Non controlled investment funds under fair value option
64 1,134 - 896 911 670 377 5 6 103 2 4,168
Non controlled investment funds Trading
- - - - - - - - - - - -
Total non controlled investment funds
502 1,134 - 919 1,294 3,564 659 5 551 243 3 8,873
Investment in real estate properties
Carrying value
5,004 79 - 18 1,019 6,128 1,358 67 81 - 2 13,756
Fair value
7,341 265 - 22 1,175 6,730 1,736 72 140 - 4 17,485
Mortgage loans and other loans
Carrying value
1,090 8,155 59 847 5,296 6,077 923 2 175 247 0 22,871
Fair value
1,090 8,296 59 846 5,568 6,559 951 2 175 247 0 23,793
Other investments
2,270 529 1 424 320 363 451 1 916 (11) - 5,264
Assets backing contracts where the financial risk is borne by policyholders
20,486 67,973 18,111 6,442 3,233 1,319 1,557 3,915 9,174 1,970 51 134,230
Cash and cash equivalents
4,290 5,607 290 2,022 889 4,496 134 145 1,395 705 66 20,038
Invested assets
Carrying value
124,390 122,261 18,471 56,921 58,079 58,430 33,063 5,654 36,643 9,341 649 523,902
Fair value
126,663 122,588 18,471 56,924 58,520 59,501 33,470 5,659 36,702 9,341 651 528,491
Unrealized capital gains and losses on assets at cost (A) (b)
2,274 327 - 3 441 1,071 406 5 59 - 2 4,589
Unrealized capital gains and losses recorded through shareholders' equity (Gross)
Debt instruments
3,316 1,984 0 2,030 2,200 1,795 569 59 (1,018) 432 15 11,384
Equity instruments (a)
1,481 0 - 233 47 53 122 9 47 85 2 2,081
Non controlled investment funds available for sale
46 - - 3 16 344 61 - 98 3 - 570
Loans
- - - - - - - - - - - -
Total unrealized capital gains recorded through shareholders' equity (B)
4,843 1,985 0 2,266 2,263 2,193 751 69 (872) 520 17 14,034
Total unrealized capital gains and losses (A) + (B)
7,116 2,312 0 2,269 2,704 3,264 1,158 73 (813) 520 19 18,623
(a) Including investments in listed equities, participating interests, hedge funds and private equities. (b) Excluding unrealized gains and losses on assets held for sale.

60
INVESTED ASSETS
LIFE & SAVINGS - High growth markets
Period ended December 31, 2010
AXA Consolidated
(Euro million) Financial Statements
Net of minority interests on controlled investment funds
Hong Kong South-East Asia,
India & China Central & Eastern
Europe
Mediterranean & Latin American
region - high growth markets
Total high growth markets Life &
Savings
Debt instruments Carrying value 3,845 389 1,445 1,296 6,976
Fair value 3,845 389 1,445 1,296 6,976
Equity instruments (a) 1,100 130 112 20 1,363
Non controlled investment funds available for sale - - - 288 288
Non controlled investment funds under fair value option 210 0 8 - 218
Non controlled investment funds Trading - - - - -
Total non controlled investment funds 210 0 8 288 506
Investment in real estate properties (b) Carrying value - - 70 4 74
Fair value - - 74 7 81
Mortgage loans and other loans Carrying value 213 17 17 101 348
Fair value 213 17 18 101 348
Other investments (3) - - - (3)
Assets backing contracts where the financial risk is borne by policyholders 2,347 669 3,979 51 7,046
Cash and cash equivalents 495 75 144 141 854
Invested assets Carrying value 8,207 1,280 5,775 1,902 17,164
Fair value 8,207 1,280 5,780 1,905 17,172
Unrealized capital gains and losses on assets at cost (A) (c) - - 5 3 7
Unrealized capital gains and losses recorded through shareholders' equity (Gross)
Debt instruments 198 - 45 103 346
Equity instruments (a) 152 - 19 10 181
Non controlled investment funds available for sale - - - 79 79
Loans - - - - -
Total unrealized capital gains recorded through shareholders' equity (B) 350 - 64 193 606
Total unrealized capital gains and losses (A) + (B) 350 - 68 196 614
(a) Including investments in listed equities, participating interests, hedge funds and private equities. (b) Excluding unrealized gains and losses on assets held for sale. (c) Includes share of minority interests from consolidated real estate funds.
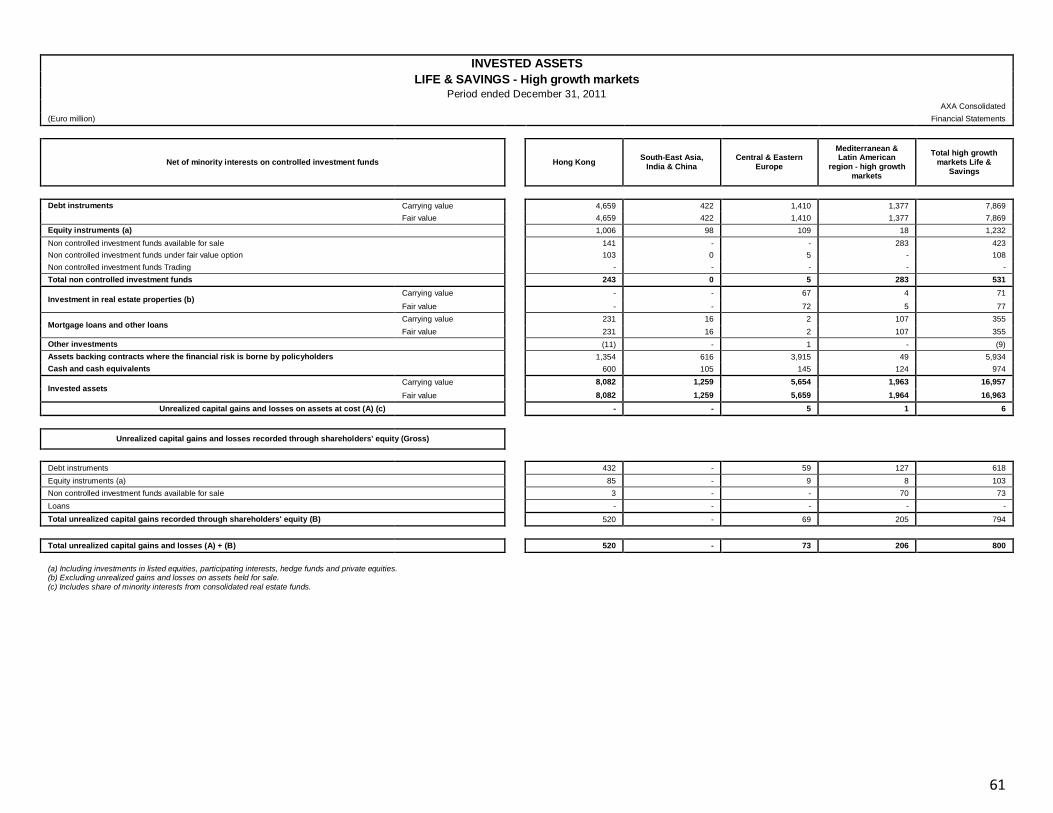
61
INVESTED ASSETS
LIFE & SAVINGS - High growth markets Period ended December 31, 2011
AXA Consolidated
(Euro million) Financial Statements
Net of minority interests on controlled investment funds
Hong Kong South-East Asia,
India & China Central & Eastern
Europe
Mediterranean & Latin American
region - high growth markets
Total high growth markets Life &
Savings
Debt instruments Carrying value
4,659 422 1,410 1,377 7,869
Fair value
4,659 422 1,410 1,377 7,869
Equity instruments (a)
1,006 98 109 18 1,232
Non controlled investment funds available for sale
141 - - 283 423
Non controlled investment funds under fair value option
103 0 5 - 108
Non controlled investment funds Trading
- - - - -
Total non controlled investment funds
243 0 5 283 531
Investment in real estate properties (b) Carrying value
- - 67 4 71
Fair value
- - 72 5 77
Mortgage loans and other loans Carrying value
231 16 2 107 355
Fair value
231 16 2 107 355
Other investments
(11) - 1 - (9)
Assets backing contracts where the financial risk is borne by policyholders
1,354 616 3,915 49 5,934
Cash and cash equivalents
600 105 145 124 974
Invested assets Carrying value
8,082 1,259 5,654 1,963 16,957
Fair value
8,082 1,259 5,659 1,964 16,963
Unrealized capital gains and losses on assets at cost (A) (c)
- - 5 1 6
Unrealized capital gains and losses recorded through shareholders' equity (Gross)
Debt instruments
432 - 59 127 618
Equity instruments (a)
85 - 9 8 103
Non controlled investment funds available for sale
3 - - 70 73
Loans
- - - - -
Total unrealized capital gains recorded through shareholders' equity (B)
520 - 69 205 794
Total unrealized capital gains and losses (A) + (B)
520 - 73 206 800
(a) Including investments in listed equities, participating interests, hedge funds and private equities. (b) Excluding unrealized gains and losses on assets held for sale. (c) Includes share of minority interests from consolidated real estate funds.
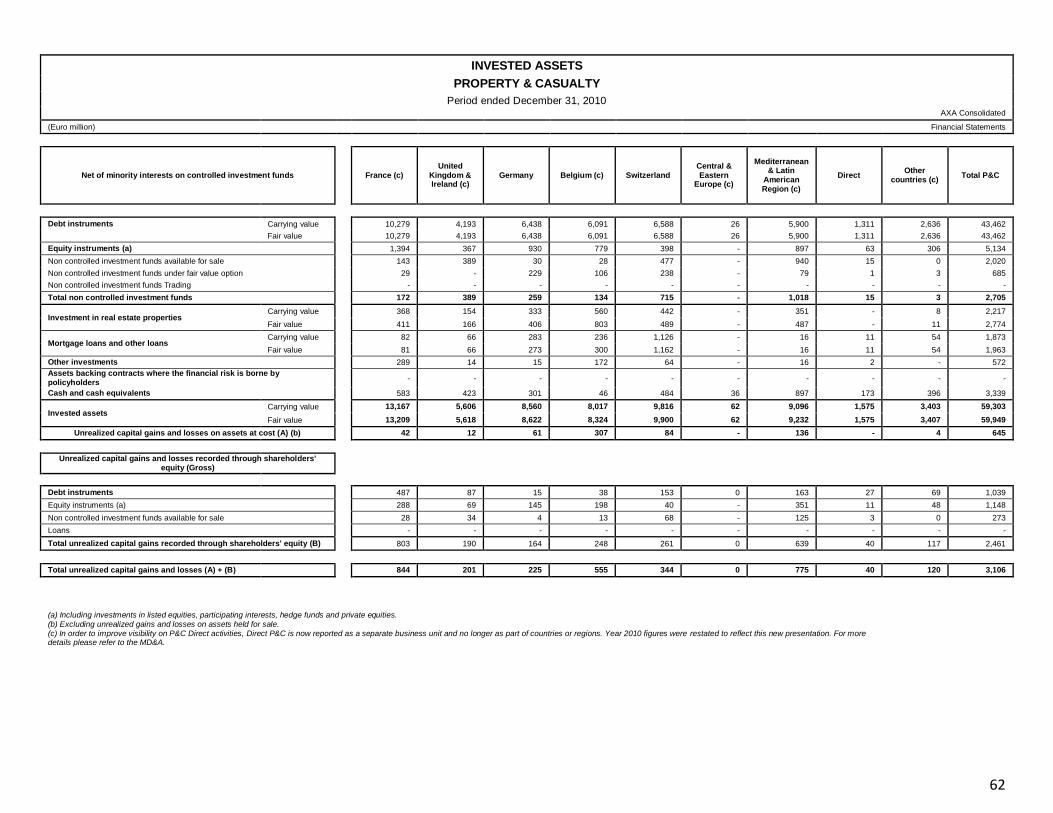
62
INVESTED ASSETS
PROPERTY & CASUALTY
Period ended December 31, 2010
AXA Consolidated
(Euro million) Financial Statements
Net of minority interests on controlled investment funds
France (c) United
Kingdom & Ireland (c)
Germany Belgium (c) Switzerland Central & Eastern
Europe (c)
Mediterranean & Latin
American Region (c)
Direct Other
countries (c) Total P&C
Debt instruments Carrying value 10,279 4,193 6,438 6,091 6,588 26 5,900 1,311 2,636 43,462
Fair value 10,279 4,193 6,438 6,091 6,588 26 5,900 1,311 2,636 43,462
Equity instruments (a) 1,394 367 930 779 398 - 897 63 306 5,134
Non controlled investment funds available for sale 143 389 30 28 477 - 940 15 0 2,020
Non controlled investment funds under fair value option 29 - 229 106 238 - 79 1 3 685
Non controlled investment funds Trading - - - - - - - - - -
Total non controlled investment funds 172 389 259 134 715 - 1,018 15 3 2,705
Investment in real estate properties Carrying value 368 154 333 560 442 - 351 - 8 2,217
Fair value 411 166 406 803 489 - 487 - 11 2,774
Mortgage loans and other loans Carrying value 82 66 283 236 1,126 - 16 11 54 1,873
Fair value 81 66 273 300 1,162 - 16 11 54 1,963
Other investments 289 14 15 172 64 - 16 2 - 572
Assets backing contracts where the financial risk is borne by policyholders
- - - - - - - - - -
Cash and cash equivalents 583 423 301 46 484 36 897 173 396 3,339
Invested assets Carrying value 13,167 5,606 8,560 8,017 9,816 62 9,096 1,575 3,403 59,303
Fair value 13,209 5,618 8,622 8,324 9,900 62 9,232 1,575 3,407 59,949
Unrealized capital gains and losses on assets at cost (A) (b) 42 12 61 307 84 - 136 - 4 645
Unrealized capital gains and losses recorded through shareholders' equity (Gross)
Debt instruments 487 87 15 38 153 0 163 27 69 1,039
Equity instruments (a) 288 69 145 198 40 - 351 11 48 1,148
Non controlled investment funds available for sale 28 34 4 13 68 - 125 3 0 273
Loans - - - - - - - - - -
Total unrealized capital gains recorded through shareholders' equity (B) 803 190 164 248 261 0 639 40 117 2,461
Total unrealized capital gains and losses (A) + (B) 844 201 225 555 344 0 775 40 120 3,106
(a) Including investments in listed equities, participating interests, hedge funds and private equities. (b) Excluding unrealized gains and losses on assets held for sale. (c) In order to improve visibility on P&C Direct activities, Direct P&C is now reported as a separate business unit and no longer as part of countries or regions. Year 2010 figures were restated to reflect this new presentation. For more details please refer to the MD&A.

63
INVESTED ASSETS
PROPERTY & CASUALTY Period ended December 31, 2011
AXA Consolidated
(Euro million) Financial Statements
Net of minority interests on controlled investment funds
France (c) United
Kingdom & Ireland (c)
Germany Belgium (c) Switzerland Central & Eastern
Europe (c)
Mediterranean & Latin
American Region (c)
Direct Other
countries (c) Total P&C
Debt instruments Carrying value
10,453 4,194 7,018 6,133 6,414 33 5,394 2,061 506 42,207
Fair value
10,453 4,194 7,018 6,133 6,428 33 5,394 2,061 506 42,221
Equity instruments (a)
1,352 284 745 268 246 - 553 67 39 3,555
Non controlled investment funds available for sale
103 183 30 58 511 - 841 31 - 1,757
Non controlled investment funds under fair value option
40 - 198 199 299 - 99 4 3 842
Non controlled investment funds Trading
- - - - - - - - - -
Total non controlled investment funds
143 183 227 257 810 - 941 36 3 2,599
Investment in real estate properties Carrying value
321 137 334 540 454 - 351 25 7 2,169
Fair value
335 149 412 782 519 - 476 28 9 2,710
Mortgage loans and other loans Carrying value
198 31 37 568 1,211 - 24 59 1 2,130
Fair value
198 31 39 644 1,267 - 24 59 1 2,264
Other investments
280 (104) 44 128 63 - 6 (6) - 410
Assets backing contracts where the financial risk is borne by policyholders
- - - - - - - - - -
Cash and cash equivalents
748 447 282 15 143 34 973 340 339 3,320
Invested assets Carrying value
13,497 5,172 8,688 7,908 9,340 67 8,241 2,582 896 56,390
Fair value
13,510 5,184 8,768 8,226 9,476 67 8,366 2,585 898 57,079
Unrealized capital gains and losses on assets at cost (A) (b)
13 12 80 319 135 - 125 2 2 689
Unrealized capital gains and losses recorded through shareholders' equity (Gross)
Debt instruments
467 120 67 92 209 1 44 43 10 1,053
Equity instruments (a)
224 46 62 39 18 - 183 10 8 589
Non controlled investment funds available for sale
21 38 4 14 45 - 91 4 - 216
Loans
- - - - - - - - - -
Total unrealized capital gains recorded through shareholders' equity (B)
712 204 134 144 272 1 317 57 18 1,858
Total unrealized capital gains and losses (A) + (B)
726 216 214 463 407 1 442 59 20 2,547
(a) Including investments in listed equities, participating interests, hedge funds and private equities. (b) Excluding unrealized gains and losses on assets held for sale. (c) In order to improve visibility on P&C Direct activities, Direct P&C is now reported as a separate business unit and no longer as part of countries or regions. Year 2010 figures were restated to reflect this new presentation. For more details please refer to the MD&A
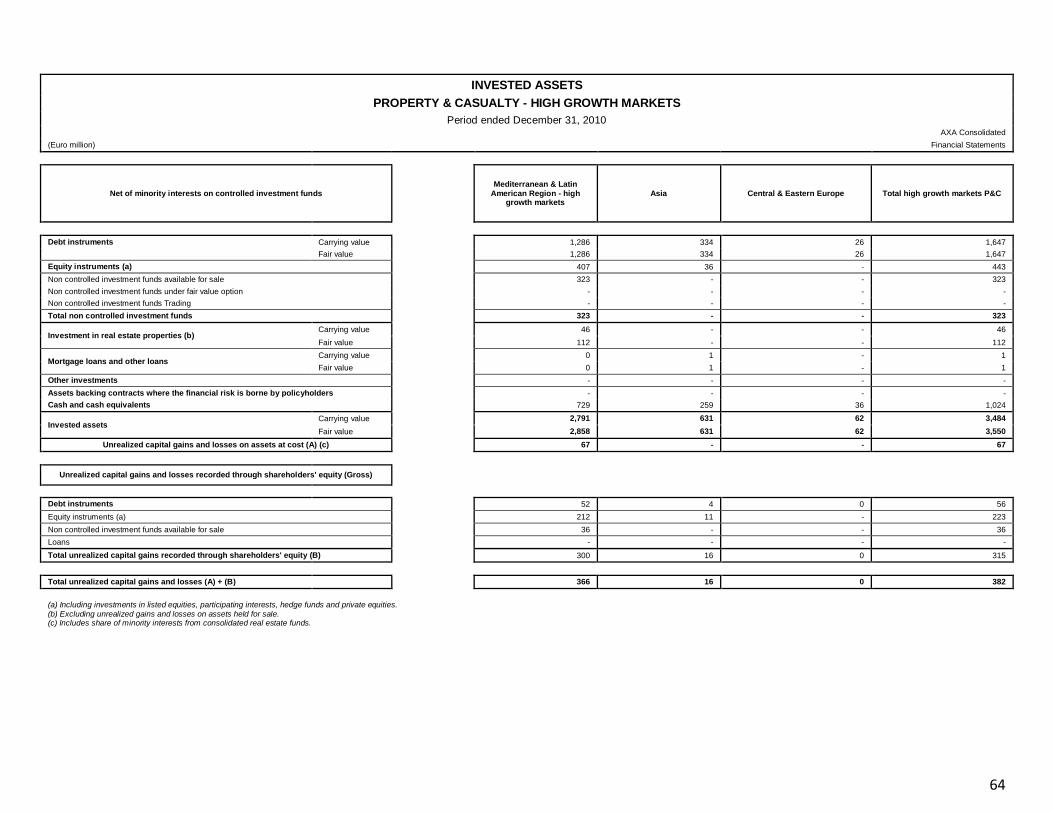
64
INVESTED ASSETS
PROPERTY & CASUALTY - HIGH GROWTH MARKETS
Period ended December 31, 2010
AXA Consolidated
(Euro million) Financial Statements
Net of minority interests on controlled investment funds
Mediterranean & Latin American Region - high
growth markets Asia Central & Eastern Europe Total high growth markets P&C
Debt instruments Carrying value 1,286 334 26 1,647
Fair value 1,286 334 26 1,647
Equity instruments (a) 407 36 - 443
Non controlled investment funds available for sale 323 - - 323
Non controlled investment funds under fair value option - - - -
Non controlled investment funds Trading - - - -
Total non controlled investment funds 323 - - 323
Investment in real estate properties (b) Carrying value 46 - - 46
Fair value 112 - - 112
Mortgage loans and other loans Carrying value 0 1 - 1
Fair value 0 1 - 1
Other investments - - - -
Assets backing contracts where the financial risk is borne by policyholders - - - -
Cash and cash equivalents 729 259 36 1,024
Invested assets Carrying value 2,791 631 62 3,484
Fair value 2,858 631 62 3,550
Unrealized capital gains and losses on assets at cost (A) (c) 67 - - 67
Unrealized capital gains and losses recorded through shareholders' equity (Gross)
Debt instruments 52 4 0 56
Equity instruments (a) 212 11 - 223
Non controlled investment funds available for sale 36 - - 36
Loans - - - -
Total unrealized capital gains recorded through shareholders' equity (B) 300 16 0 315
Total unrealized capital gains and losses (A) + (B) 366 16 0 382
(a) Including investments in listed equities, participating interests, hedge funds and private equities. (b) Excluding unrealized gains and losses on assets held for sale. (c) Includes share of minority interests from consolidated real estate funds.

65
INVESTED ASSETS
PROPERTY & CASUALTY - HIGH GROWTH MARKETS Period ended December 31, 2011
AXA Consolidated
(Euro million) Financial Statements
Net of minority interests on controlled investment funds
Mediterranean & Latin American Region - high
growth markets Asia Central & Eastern Europe Total high growth markets P&C
Debt instruments Carrying value
1,223 370 33 1,627
Fair value
1,223 370 33 1,627
Equity instruments (a)
358 24 - 382
Non controlled investment funds available for sale
301 - - 301
Non controlled investment funds under fair value option
- - - -
Non controlled investment funds Trading
- - - -
Total non controlled investment funds
301 - - 301
Investment in real estate properties (b) Carrying value
58 - - 58
Fair value
112 - - 112
Mortgage loans and other loans Carrying value
1 0 - 1
Fair value
1 0 - 1
Other investments
- - - -
Assets backing contracts where the financial risk is borne by policyholders
- - - -
Cash and cash equivalents
649 333 34 1,015
Invested assets Carrying value
2,589 727 67 3,383
Fair value
2,644 727 67 3,437
Unrealized capital gains and losses on assets at cost (A) (c)
54 - - 54
Unrealized capital gains and losses recorded through shareholders' equity (Gross)
Debt instruments
37 5 1 43
Equity instruments (a)
140 6 - 146
Non controlled investment funds available for sale
18 - - 18
Loans
- - - -
Total unrealized capital gains recorded through shareholders' equity (B)
195 11 1 207
Total unrealized capital gains and losses (A) + (B)
249 11 1 261
(a) Including investments in listed equities, participating interests, hedge funds and private equities. (b) Excluding unrealized gains and losses on assets held for sale. (c) Includes share of minority interests from consolidated real estate funds.
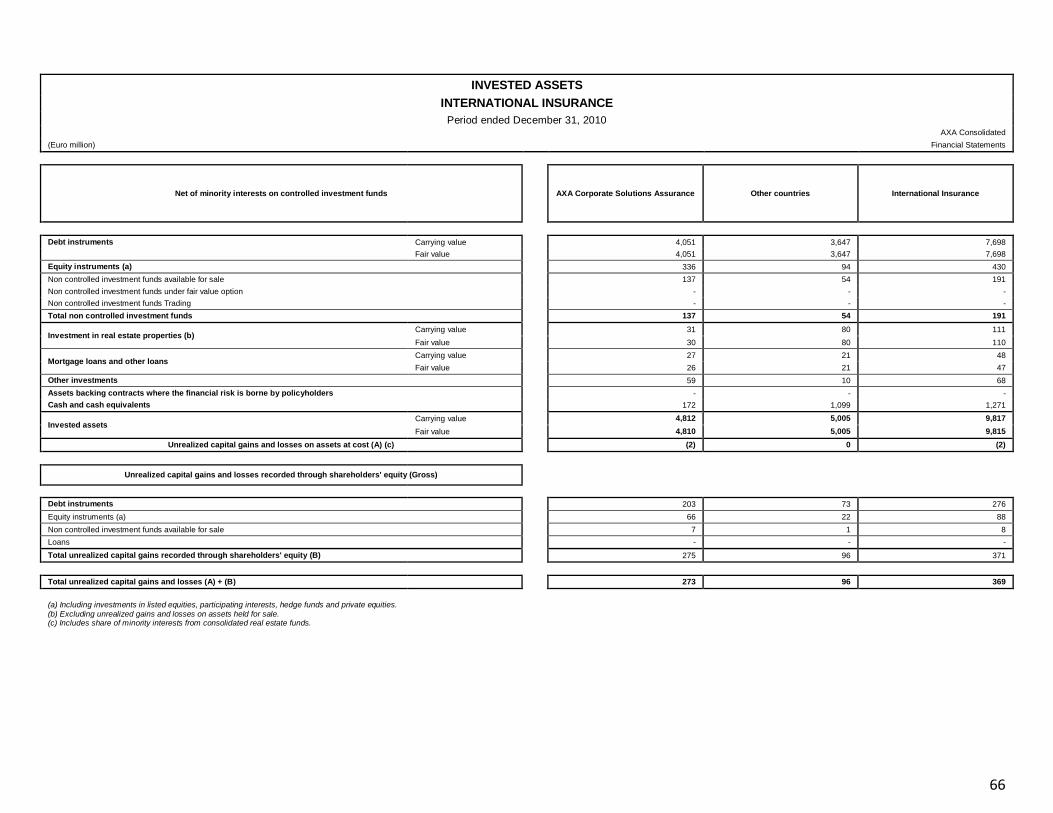
66
INVESTED ASSETS
INTERNATIONAL INSURANCE
Period ended December 31, 2010
AXA Consolidated
(Euro million) Financial Statements
Net of minority interests on controlled investment funds
AXA Corporate Solutions Assurance Other countries International Insurance
Debt instruments Carrying value 4,051 3,647 7,698
Fair value 4,051 3,647 7,698
Equity instruments (a) 336 94 430
Non controlled investment funds available for sale 137 54 191
Non controlled investment funds under fair value option - - -
Non controlled investment funds Trading - - -
Total non controlled investment funds 137 54 191
Investment in real estate properties (b) Carrying value 31 80 111
Fair value 30 80 110
Mortgage loans and other loans Carrying value 27 21 48
Fair value 26 21 47
Other investments 59 10 68
Assets backing contracts where the financial risk is borne by policyholders - - -
Cash and cash equivalents 172 1,099 1,271
Invested assets Carrying value 4,812 5,005 9,817
Fair value 4,810 5,005 9,815
Unrealized capital gains and losses on assets at cost (A) (c) (2) 0 (2)
Unrealized capital gains and losses recorded through shareholders' equity (Gross)
Debt instruments 203 73 276
Equity instruments (a) 66 22 88
Non controlled investment funds available for sale 7 1 8
Loans - - -
Total unrealized capital gains recorded through shareholders' equity (B) 275 96 371
Total unrealized capital gains and losses (A) + (B) 273 96 369
(a) Including investments in listed equities, participating interests, hedge funds and private equities. (b) Excluding unrealized gains and losses on assets held for sale. (c) Includes share of minority interests from consolidated real estate funds.
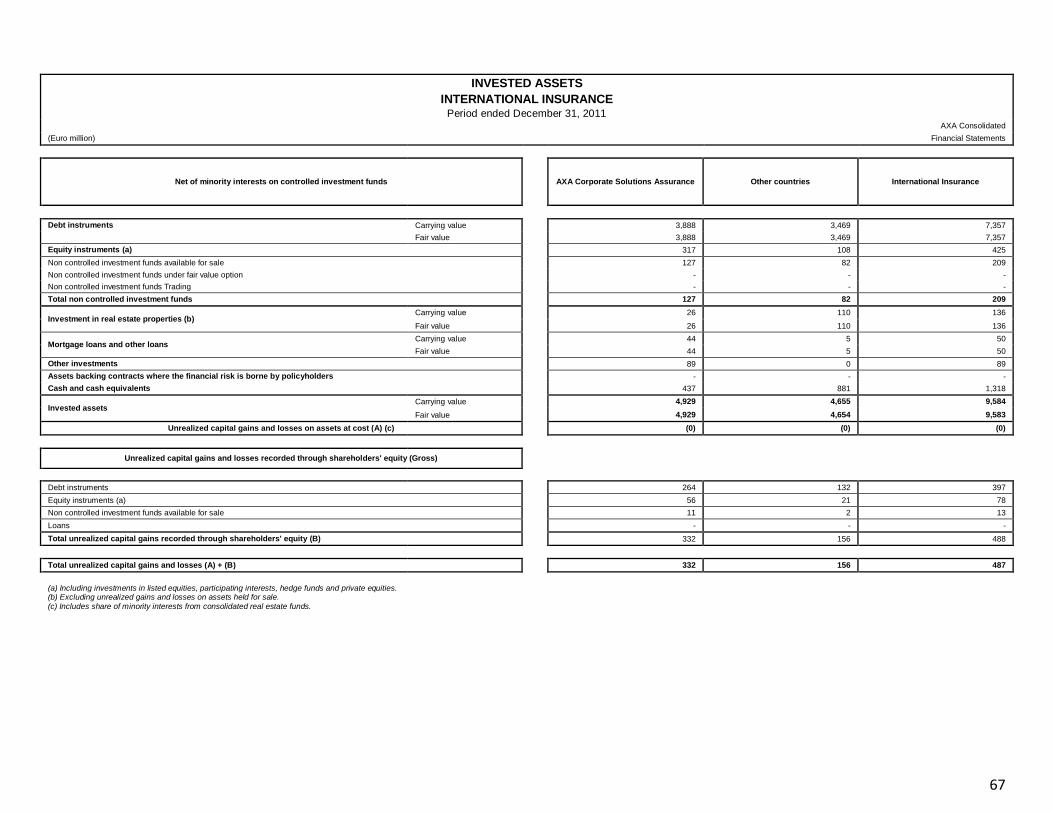
67
INVESTED ASSETS
INTERNATIONAL INSURANCE Period ended December 31, 2011
AXA Consolidated
(Euro million) Financial Statements
Net of minority interests on controlled investment funds
AXA Corporate Solutions Assurance Other countries International Insurance
Debt instruments Carrying value
3,888 3,469 7,357
Fair value
3,888 3,469 7,357
Equity instruments (a)
317 108 425
Non controlled investment funds available for sale
127 82 209
Non controlled investment funds under fair value option
- - -
Non controlled investment funds Trading
- - -
Total non controlled investment funds
127 82 209
Investment in real estate properties (b) Carrying value
26 110 136
Fair value
26 110 136
Mortgage loans and other loans Carrying value
44 5 50
Fair value
44 5 50
Other investments
89 0 89
Assets backing contracts where the financial risk is borne by policyholders
- - -
Cash and cash equivalents
437 881 1,318
Invested assets Carrying value
4,929 4,655 9,584
Fair value
4,929 4,654 9,583
Unrealized capital gains and losses on assets at cost (A) (c)
(0) (0) (0)
Unrealized capital gains and losses recorded through shareholders' equity (Gross)
Debt instruments
264 132 397
Equity instruments (a)
56 21 78
Non controlled investment funds available for sale
11 2 13
Loans
- - -
Total unrealized capital gains recorded through shareholders' equity (B)
332 156 488
Total unrealized capital gains and losses (A) + (B)
332 156 487
(a) Including investments in listed equities, participating interests, hedge funds and private equities. (b) Excluding unrealized gains and losses on assets held for sale. (c) Includes share of minority interests from consolidated real estate funds.
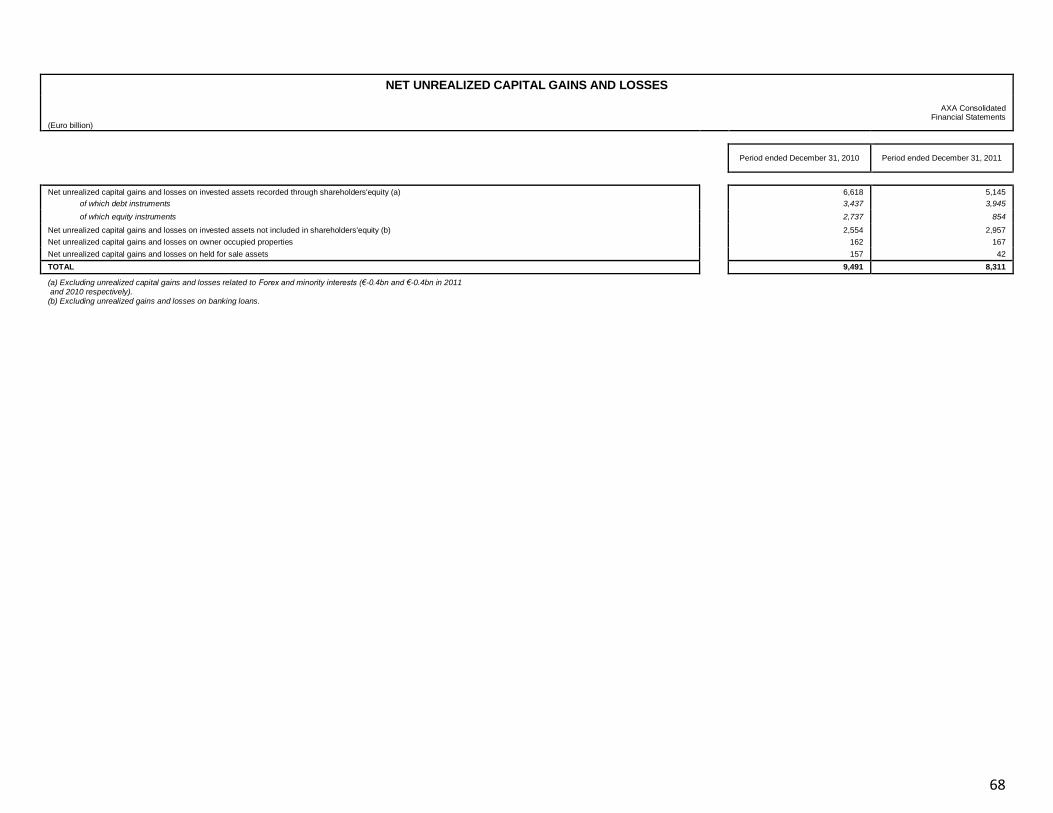
68
NET UNREALIZED CAPITAL GAINS AND LOSSES
(Euro billion)
AXA Consolidated
Financial Statements
Period ended December 31, 2010 Period ended December 31, 2011
Net unrealized capital gains and losses on invested assets recorded through shareholders'equity (a) 6,618 5,145
of which debt instruments 3,437 3,945
of which equity instruments 2,737 854
Net unrealized capital gains and losses on invested assets not included in shareholders'equity (b) 2,554 2,957
Net unrealized capital gains and losses on owner occupied properties 162 167
Net unrealized capital gains and losses on held for sale assets 157 42
TOTAL 9,491 8,311
(a) Excluding unrealized capital gains and losses related to Forex and minority interests (€-0.4bn and €-0.4bn in 2011 and 2010 respectively). (b) Excluding unrealized gains and losses on banking loans.
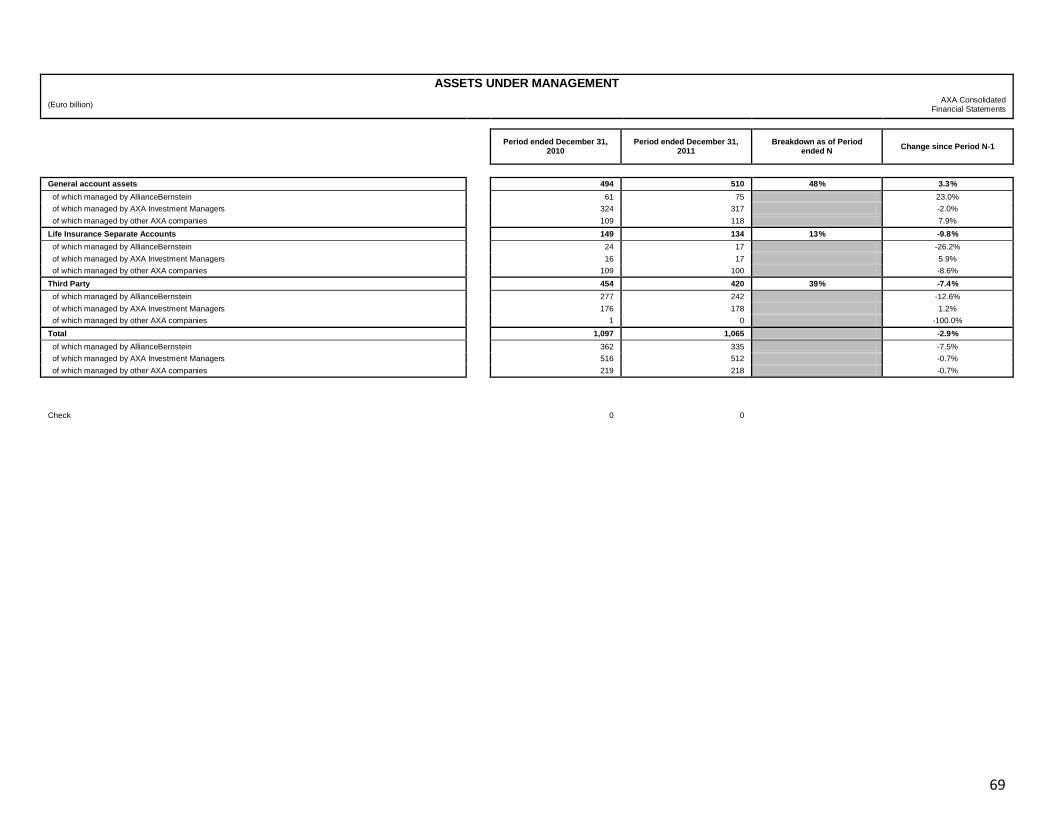
69
ASSETS UNDER MANAGEMENT
(Euro billion) AXA Consolidated
Financial Statements
Period ended December 31,
2010 Period ended December 31,
2011 Breakdown as of Period
ended N Change since Period N-1
General account assets 494 510 48% 3.3%
of which managed by AllianceBernstein 61 75 23.0%
of which managed by AXA Investment Managers 324 317 -2.0%
of which managed by other AXA companies 109 118 7.9%
Life Insurance Separate Accounts 149 134 13% -9.8%
of which managed by AllianceBernstein 24 17 -26.2%
of which managed by AXA Investment Managers 16 17 5.9%
of which managed by other AXA companies 109 100 -8.6%
Third Party 454 420 39% -7.4%
of which managed by AllianceBernstein 277 242 -12.6%
of which managed by AXA Investment Managers 176 178 1.2%
of which managed by other AXA companies 1 0 -100.0%
Total 1,097 1,065 -2.9%
of which managed by AllianceBernstein 362 335 -7.5%
of which managed by AXA Investment Managers 516 512 -0.7%
of which managed by other AXA companies 219 218 -0.7%
Check 0 0
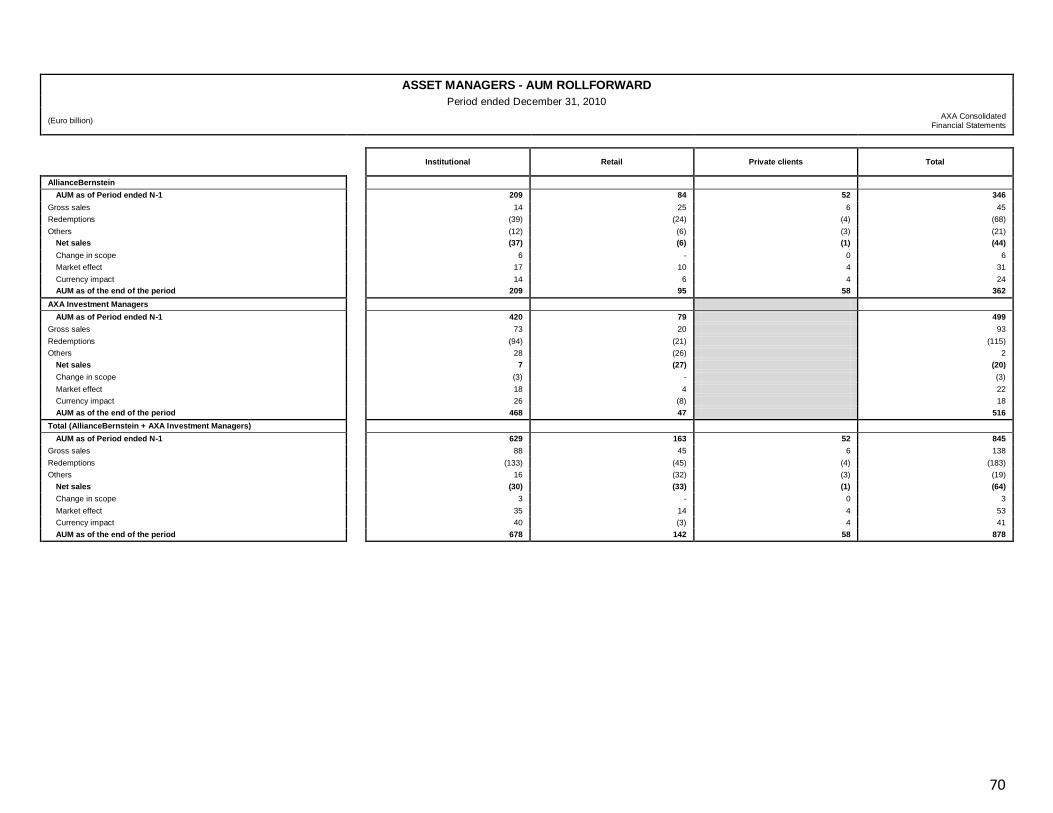
70
ASSET MANAGERS - AUM ROLLFORWARD
Period ended December 31, 2010
(Euro billion) AXA Consolidated
Financial Statements
Institutional Retail Private clients Total
AllianceBernstein
AUM as of Period ended N-1 209 84 52 346
Gross sales 14 25 6 45
Redemptions (39) (24) (4) (68)
Others (12) (6) (3) (21)
Net sales (37) (6) (1) (44)
Change in scope 6 - 0 6
Market effect 17 10 4 31
Currency impact 14 6 4 24
AUM as of the end of the period 209 95 58 362
AXA Investment Managers
AUM as of Period ended N-1 420 79 499
Gross sales 73 20 93
Redemptions (94) (21) (115)
Others 28 (26) 2
Net sales 7 (27) (20)
Change in scope (3) - (3)
Market effect 18 4 22
Currency impact 26 (8) 18
AUM as of the end of the period 468 47 516
Total (AllianceBernstein + AXA Investment Managers)
AUM as of Period ended N-1 629 163 52 845
Gross sales 88 45 6 138
Redemptions (133) (45) (4) (183)
Others 16 (32) (3) (19)
Net sales (30) (33) (1) (64)
Change in scope 3 - 0 3
Market effect 35 14 4 53
Currency impact 40 (3) 4 41
AUM as of the end of the period 678 142 58 878

71
ASSET MANAGERS - AUM ROLLFORWARD
Period ended December 31, 2011
(Euro billion) AXA Consolidated
Financial Statements
Institutional Retail Private clients Total
AllianceBernstein
AUM as of Period ended N-1 209 95 58 362
Gross sales 13 22 5 40
Redemptions (37) (24) (7) (68)
Others 8 (5) (3) (0)
Net sales (16) (7) (5) (28)
Change in scope (1) (1) 0 (2)
Market effect (3) (3) (1) (7)
Currency impact 6 2 2 10
AUM as of the end of the period 195 87 53 335
AXA Investment Managers
AUM as of Period ended N-1 468 47 516
Gross sales 76 18 94
Redemptions (75) (21) (96)
Others (1)
(32) 32 0
Net sales (31) 29 (2)
Change in scope (2)
(3) (1) (4)
Market effect (3) 0 (3)
Currency impact 4 2 5
AUM as of the end of the period 436 77 512
Total (AllianceBernstein + AXA Investment Managers)
AUM as of Period ended N-1 678 142 58 878
Gross sales 89 40 5 134
Redemptions (112) (45) (7) (164)
Others (23) 27 (3) 0
Net sales (47) 21 (5) (30)
Change in scope (2) (4) (2) 0 (5)
Market effect (6) (3) (1) (10)
Currency impact 9 4 2 15
AUM as of the end of the period 631 163 53 847
(1) Following the partial sales of the UK Life operations, Friends Provident AUM were reclassified from Institutional to Retail.
(2) Related to AUM transfered to Friends Provident following the partial sales of the UK Life operations.
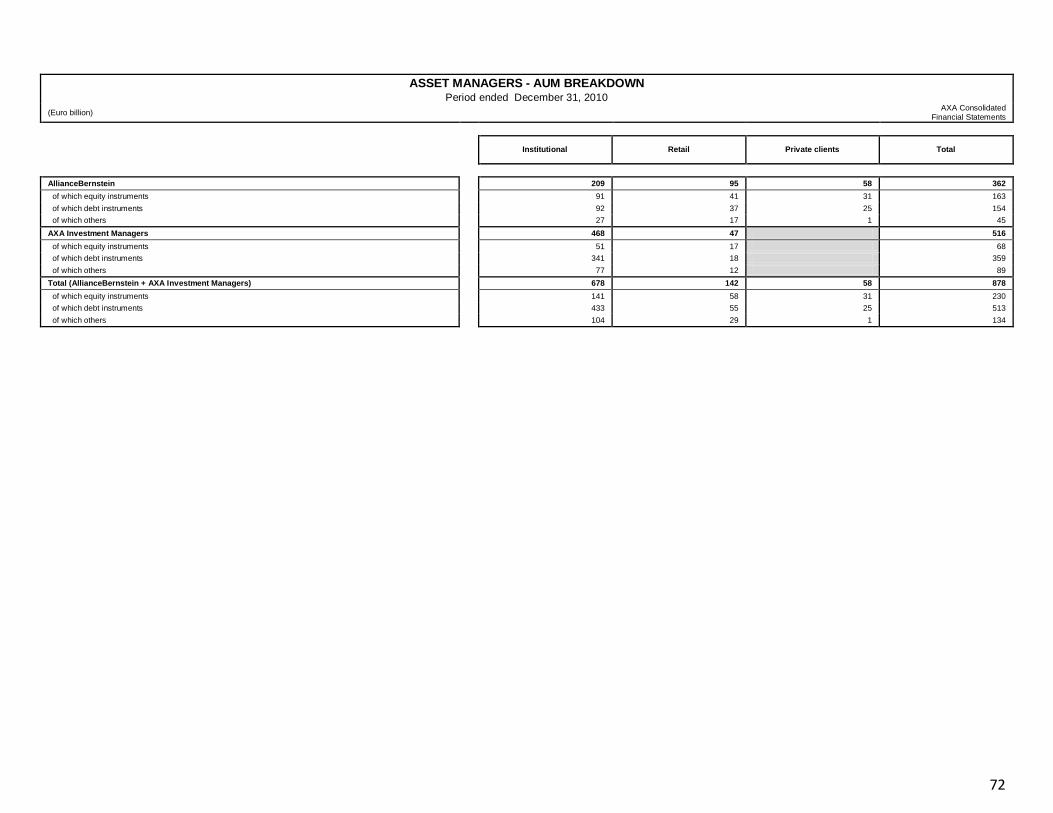
72
ASSET MANAGERS - AUM BREAKDOWN
Period ended December 31, 2010
(Euro billion) AXA Consolidated
Financial Statements
Institutional Retail Private clients Total
AllianceBernstein 209 95 58 362
of which equity instruments 91 41 31 163
of which debt instruments 92 37 25 154
of which others 27 17 1 45
AXA Investment Managers 468 47 516
of which equity instruments 51 17 68
of which debt instruments 341 18 359
of which others 77 12 89
Total (AllianceBernstein + AXA Investment Managers) 678 142 58 878
of which equity instruments 141 58 31 230
of which debt instruments 433 55 25 513
of which others 104 29 1 134

73
ASSET MANAGERS - AUM BREAKDOWN
Period ended December 31, 2011
(Euro billion) AXA Consolidated
Financial Statements
Institutional Retail Private clients Total
AllianceBernstein 195 87 53 335
of which equity instruments 45 28 24 96
of which debt instruments 101 40 27 168
of which others 49 19 3 71
AXA Investment Managers 436 77 512
of which equity instruments 40 21 61
of which debt instruments 306 41 348
of which others 89 14 104
Total (AllianceBernstein + AXA Investment Managers) 631 163 53 847
of which equity instruments 85 48 24 157
of which debt instruments 407 81 27 515
of which others 139 34 3 175

74
LIFE RESERVES ROLLFORWARD
Period ended December 31, 2010 AXA Consolidated
(Euro million) Financial Statements
GROSS OPENING
RESERVES Inflows (3) Outflows (2) (3) Scope impact
Variation of exchange rate
Market appreciation and
other
GROSS CLOSING
RESERVES
REINSURANCE CEDED
RESERVES
NET CLOSING RESERVES
Of which premium reserves
Of which claims reserves
UNIT-LINKED RESERVES
Total Life & Savings 155,818 18,137 (15,624) (37,958) 7,074 10,865 138,311 (263) 138,048
France 21,820 1,443 (1,655) (146) - 1,411 22,873 (13) 22,860
United States 60,100 5,394 (5,363) - 4,078 5,950 70,159 - 70,159
United Kingdom 50,177 5,178 (5,028) (37,812) 1,610 2,899 17,025 (250) 16,775
Japan 3,815 1,235 (251) - 880 (210) 5,470 - 5,470
Germany 2,300 1,040 (195) - - (39) 3,106 - 3,106
Switzerland 1,024 266 (182) - 196 (28) 1,275 - 1,275
Belgium 1,719 192 (242) - - 68 1,736 (0) 1,736
Central & Eastern Europe 2,727 1,110 (217) - 102 253 3,976 - 3,976
Mediterranean & Latin American Region
9,726 1,542 (2,045) (1) 4 406 9,633 - 9,633
Asia excl. Japan 2,353 735 (439) - 203 149 3,002 0 3,002
Other Countries 56 2 (8) (0) 0 5 56 (0) 56
GENERAL ACCOUNT RESERVES
Total Life & Savings 323,831 42,187 (36,059) (23,574) 16,649 6,780 329,814 (5,752) 324,062 309,696 14,366
France 87,291 13,219 (10,159) 172 0 1,620 92,143 (1,133) 91,010 82,561 8,449
United States 38,171 3,256 (4,426) - 2,599 2,345 41,945 (3,599) 38,346 37,958 387
United Kingdom (excluding With Profits)
5,725 344 (157) (6,304) 174 355 138 - 138 138 -
United Kingdom With Profits 17,905 419 (1,305) (17,419) 542 (142) - - - - -
Japan 29,336 4,325 (3,964) - 6,026 (356) 35,367 (77) 35,290 34,900 390
Germany 52,042 5,840 (5,696) (24) 0 1,202 53,365 (592) 52,772 52,043 729
Switzerland 35,914 5,009 (4,471) - 6,691 618 43,761 (32) 43,729 40,067 3,661
Belgium 24,377 2,315 (1,478) 0 0 722 25,936 (1) 25,935 25,669 266
Central & Eastern Europe (1) 1,536 594 (586) - 73 (17) 1,601 (1) 1,600 1,576 24
Mediterranean & Latin American Region
25,317 5,619 (3,223) 1 92 376 28,181 (80) 28,101 27,696 404
Asia excl. Japan 5,215 1,039 (491) - 377 60 6,201 (17) 6,183 6,155 28
Other Countries 1,000 208 (102) (0) 75 (3) 1,177 (219) 958 932 26
(1) Collected premiums from off balance sheet pension are restated in outflows to match with Life & Savings net inflows. (2) Outflows are presented net of policyholders' participation paid during the period. (3) Life & Savings net inflows differs from the reported number (€8,423m) as it excludes Australia/New Zealand's contribution of €-146m in UL and €-71m in GA due to its classification as held for sale operation. In the net inflows of a few countries (mainly the US in FY10), certain products' classification is in line with reporting and differs from accounting classification.
Under review
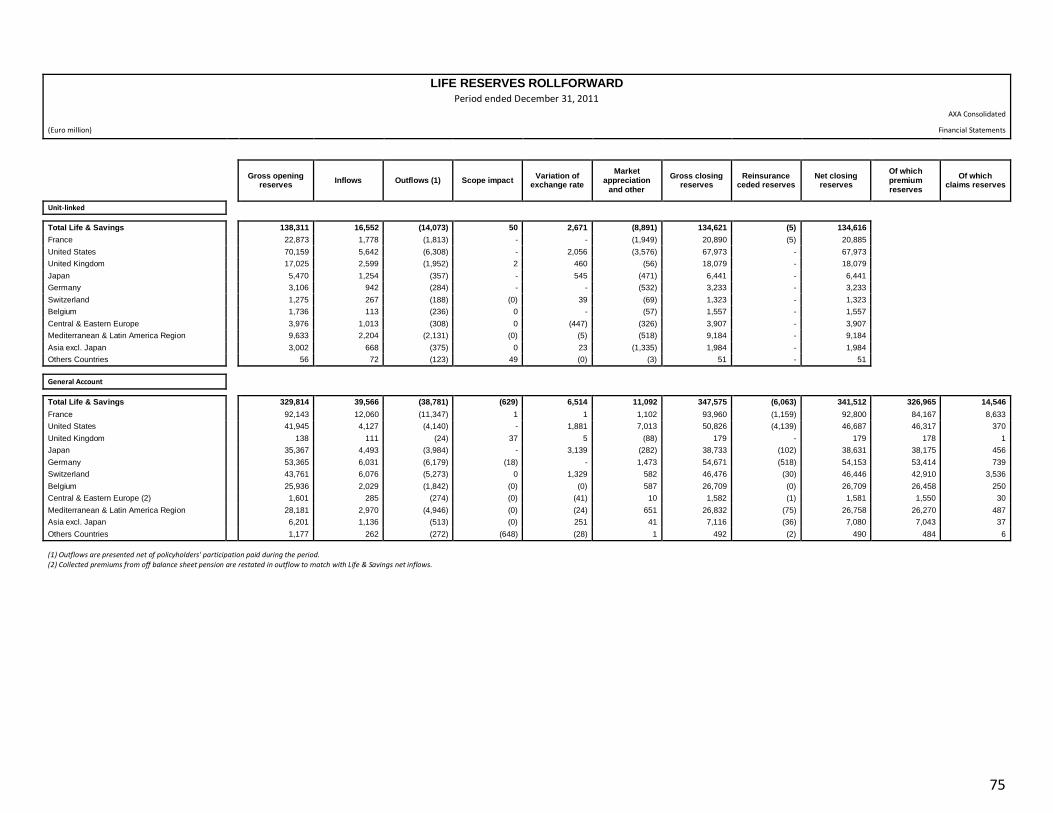
75
LIFE RESERVES ROLLFORWARD
Period ended December 31, 2011
AXA Consolidated
(Euro million) Financial Statements
Gross opening
reserves Inflows Outflows (1) Scope impact
Variation of exchange rate
Market appreciation
and other
Gross closing reserves
Reinsurance ceded reserves
Net closing reserves
Of which premium reserves
Of which claims reserves
Unit-linked
Total Life & Savings
138,311 16,552 (14,073) 50 2,671 (8,891) 134,621 (5) 134,616
France
22,873 1,778 (1,813) - - (1,949) 20,890 (5) 20,885
United States
70,159 5,642 (6,308) - 2,056 (3,576) 67,973 - 67,973
United Kingdom
17,025 2,599 (1,952) 2 460 (56) 18,079 - 18,079
Japan
5,470 1,254 (357) - 545 (471) 6,441 - 6,441
Germany
3,106 942 (284) - - (532) 3,233 - 3,233
Switzerland
1,275 267 (188) (0) 39 (69) 1,323 - 1,323
Belgium
1,736 113 (236) 0 - (57) 1,557 - 1,557
Central & Eastern Europe
3,976 1,013 (308) 0 (447) (326) 3,907 - 3,907
Mediterranean & Latin America Region
9,633 2,204 (2,131) (0) (5) (518) 9,184 - 9,184
Asia excl. Japan
3,002 668 (375) 0 23 (1,335) 1,984 - 1,984
Others Countries
56 72 (123) 49 (0) (3) 51 - 51
General Account
Total Life & Savings
329,814 39,566 (38,781) (629) 6,514 11,092 347,575 (6,063) 341,512 326,965 14,546
France
92,143 12,060 (11,347) 1 1 1,102 93,960 (1,159) 92,800 84,167 8,633
United States
41,945 4,127 (4,140) - 1,881 7,013 50,826 (4,139) 46,687 46,317 370
United Kingdom
138 111 (24) 37 5 (88) 179 - 179 178 1
Japan
35,367 4,493 (3,984) - 3,139 (282) 38,733 (102) 38,631 38,175 456
Germany
53,365 6,031 (6,179) (18) - 1,473 54,671 (518) 54,153 53,414 739
Switzerland
43,761 6,076 (5,273) 0 1,329 582 46,476 (30) 46,446 42,910 3,536
Belgium
25,936 2,029 (1,842) (0) (0) 587 26,709 (0) 26,709 26,458 250
Central & Eastern Europe (2)
1,601 285 (274) (0) (41) 10 1,582 (1) 1,581 1,550 30
Mediterranean & Latin America Region
28,181 2,970 (4,946) (0) (24) 651 26,832 (75) 26,758 26,270 487
Asia excl. Japan
6,201 1,136 (513) (0) 251 41 7,116 (36) 7,080 7,043 37
Others Countries 1,177 262 (272) (648) (28) 1 492 (2) 490 484 6
(1) Outflows are presented net of policyholders' participation paid during the period. (2) Collected premiums from off balance sheet pension are restated in outflow to match with Life & Savings net inflows.
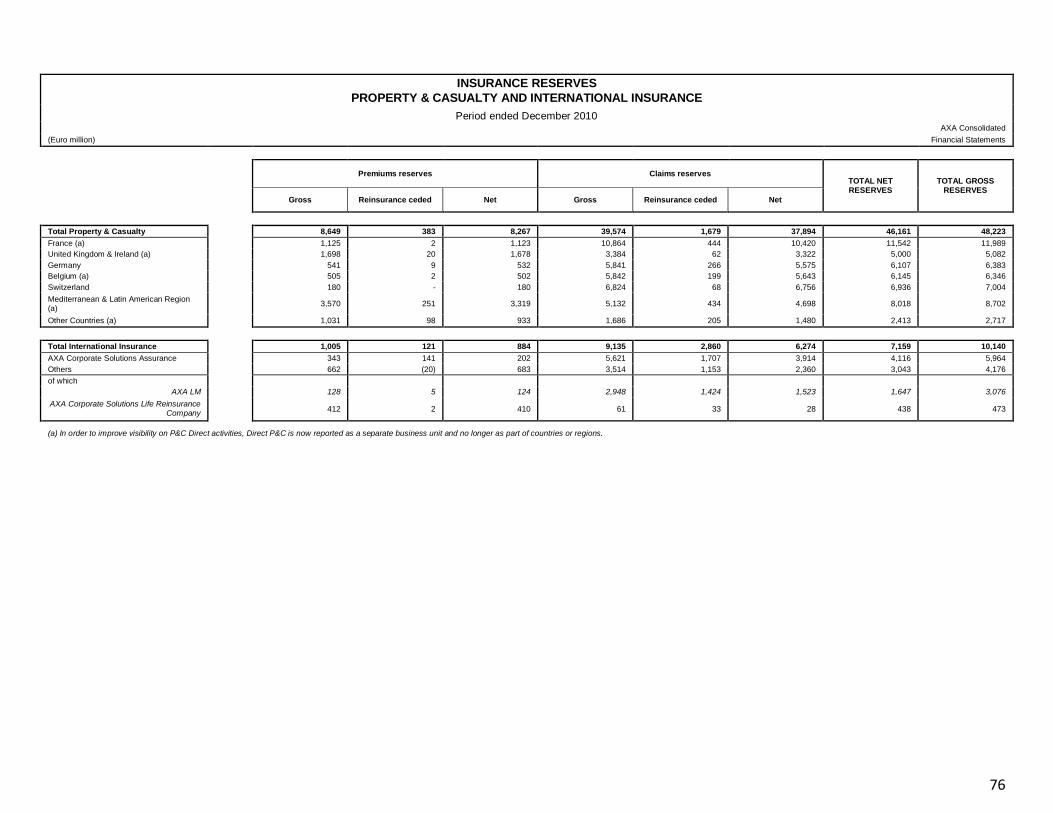
76
INSURANCE RESERVES
PROPERTY & CASUALTY AND INTERNATIONAL INSURANCE
Period ended December 2010
AXA Consolidated
(Euro million) Financial Statements
Premiums reserves Claims reserves
TOTAL NET RESERVES
TOTAL GROSS RESERVES
Gross Reinsurance ceded Net Gross Reinsurance ceded Net
Total Property & Casualty 8,649 383 8,267 39,574 1,679 37,894 46,161 48,223
France (a) 1,125 2 1,123 10,864 444 10,420 11,542 11,989
United Kingdom & Ireland (a) 1,698 20 1,678 3,384 62 3,322 5,000 5,082
Germany 541 9 532 5,841 266 5,575 6,107 6,383
Belgium (a) 505 2 502 5,842 199 5,643 6,145 6,346
Switzerland 180 - 180 6,824 68 6,756 6,936 7,004
Mediterranean & Latin American Region (a)
3,570 251 3,319 5,132 434 4,698 8,018 8,702
Other Countries (a) 1,031 98 933 1,686 205 1,480 2,413 2,717
Total International Insurance 1,005 121 884 9,135 2,860 6,274 7,159 10,140
AXA Corporate Solutions Assurance 343 141 202 5,621 1,707 3,914 4,116 5,964
Others 662 (20) 683 3,514 1,153 2,360 3,043 4,176
of which
AXA LM 128 5 124 2,948 1,424 1,523 1,647 3,076
AXA Corporate Solutions Life Reinsurance Company
412 2 410 61 33 28 438 473
(a) In order to improve visibility on P&C Direct activities, Direct P&C is now reported as a separate business unit and no longer as part of countries or regions.

77
INSURANCE RESERVES
PROPERTY & CASUALTY AND INTERNATIONAL INSURANCE
Period ended December 2011
AXA Consolidated
(Euro million) Financial Statements
Premiums reserves Claims reserves
TOTAL NET RESERVES
TOTAL GROSS RESERVES
Gross Reinsurance ceded Net Gross Reinsurance ceded Net
Total Property & Casualty 9,352 404 8,948 39,856 1,620 38,236 47,185 49,208
France (a) 1,218 2 1,216 11,205 404 10,801 12,017 12,423
United Kingdom & Ireland (a) 1,713 22 1,690 3,141 51 3,090 4,780 4,854
Germany 610 16 594 5,892 267 5,625 6,219 6,502
Belgium (a) 509 2 507 5,729 179 5,550 6,057 6,238
Switzerland 394 - 394 6,796 45 6,750 7,144 7,190
Mediterranean & Latin American Region (a)
3,659 260 3,399 4,883 434 4,449 7,848 8,542
Other countries (a) 1,249 101 1,148 2,211 239 1,972 3,120 3,461
Total International Insurance 1,159 154 1,005 8,442 2,423 6,019 7,024 9,601
AXA Corporate Solutions Assurance 339 158 182 5,504 1,632 3,872 4,054 5,844
Others 820 (3) 823 2,938 791 2,147 2,970 3,758
of which
AXA LM 138 1 137 2,260 921 1,339 1,476 2,398
AXA Corporate Solutions Life Reinsurance Company
574 2 573 63 16 47 620 637
(a) In order to improve visibility on P&C Direct activities, Direct P&C is now reported as a separate business unit and no longer as part of countries or regions.

78
RESERVES RATIOS (a)
PROPERTY & CASUALTY
AXA Consolidated
(Euro million) Financial Statements
Net technical reserves / Net earned premiums
Net claims reserves / Net claims paid (b)
Period ended December 31, 2010 Period ended December 31, 2011 Period ended December 31, 2010 Period ended December 31, 2011
AXA Property & Casualty
186% 187% 236% 241%
France (c ) 222% 229% 364% 395%
United Kingdom & Ireland (c ) 142% 136% 132% 133%
Germany 184% 182% 266% 255%
Belgium (c ) 309% 299% 405% 397%
Switzerland 272% 272% 459% 458%
Mediterranean & Latin American Region (c ) 132% 131% 110% 106%
Other Countries (c ) 114% 132% 113% 137%
(a) Net of reinsurance (b) includes policyholder participation (c ) In order to improve visibility on P&C Direct activities, Direct P&C is now reported as a separate business unit and no longer as part of countries or regions

79
IRR/Payback
Life and Savings
AXA Consolidated
Financial Statements
NB IRR (%) Payback Period (year) New Business Investments (€m) (a)
FY11 FY10 FY11 FY10 FY11 FY10
France
8.7% 8.4% 9 9 (592) (623)
United States
10.7% 9.8% 9 10 (291) (311)
United Kingdom
7.7% 8.4% 10 10 (146) (122)
Japan
11.7% 11.8% 8 9 (242) (199)
Germany
8.3% 8.4% 11 10 (236) (228)
Switzerland
9.4% 8.7% 12 11 (94) (102)
Belgium
7.9% 8.5% 12 12 (87) (96)
Central & Eastern Europe
9.8% 10.9% 9 9 (142) (139)
Mediterranean & Latin American Region
10.6% 9.9% 7 8 (182) (243)
Asia excl. Japan (b)
34.7% 37.3% 3 4 (170) (128)
Mature markets
9.5% 9.6% 11 10 (1,523) (1,958)
High growth markets
22.8% 22.7% 4 4 (659) (233)
Total
11.5% 10.9% 9 9 (2,182) (2,191)
(a) New Business strain + New Business required capital (b) Australia/New Zealand, Hong Kong, South-East Asia, India & China
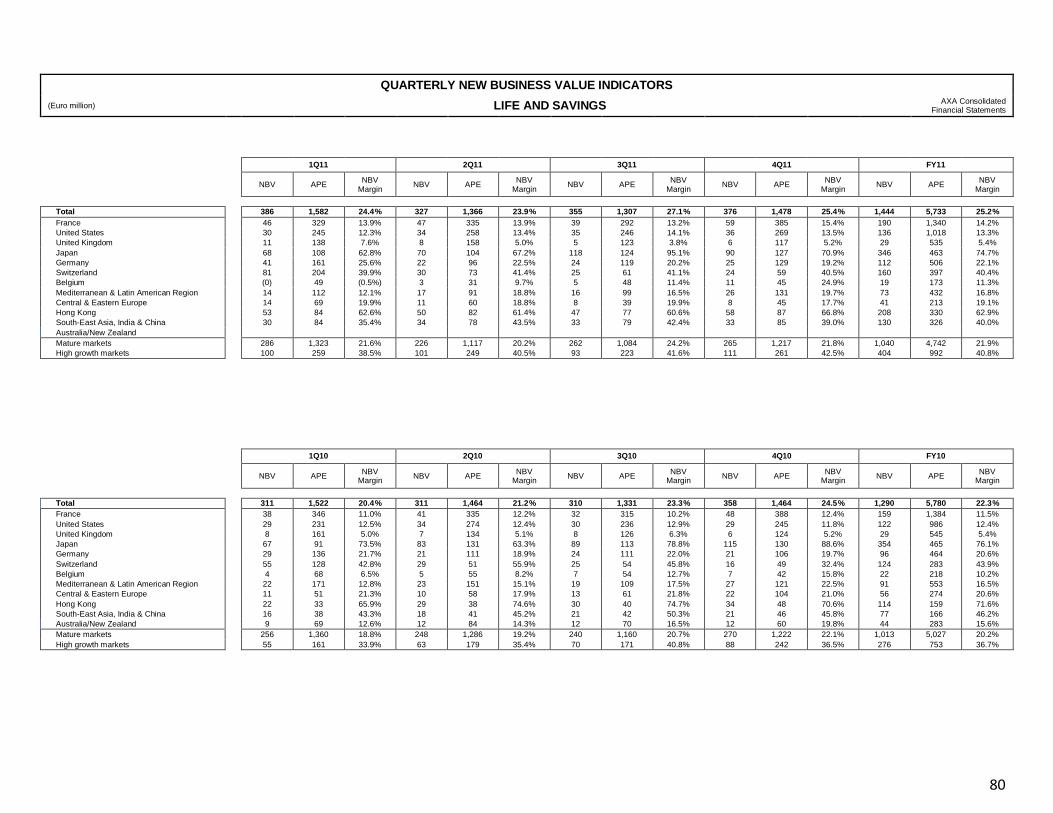
80
QUARTERLY NEW BUSINESS VALUE INDICATORS
(Euro million) LIFE AND SAVINGS AXA Consolidated
Financial Statements
1Q11 2Q11 3Q11 4Q11 FY11
NBV APE NBV
Margin NBV APE
NBV Margin
NBV APE NBV
Margin NBV APE
NBV Margin
NBV APE NBV
Margin
Total 386 1,582 24.4% 327 1,366 23.9% 355 1,307 27.1% 376 1,478 25.4% 1,444 5,733 25.2%
France 46 329 13.9% 47 335 13.9% 39 292 13.2% 59 385 15.4% 190 1,340 14.2%
United States 30 245 12.3% 34 258 13.4% 35 246 14.1% 36 269 13.5% 136 1,018 13.3%
United Kingdom 11 138 7.6% 8 158 5.0% 5 123 3.8% 6 117 5.2% 29 535 5.4%
Japan 68 108 62.8% 70 104 67.2% 118 124 95.1% 90 127 70.9% 346 463 74.7%
Germany 41 161 25.6% 22 96 22.5% 24 119 20.2% 25 129 19.2% 112 506 22.1%
Switzerland 81 204 39.9% 30 73 41.4% 25 61 41.1% 24 59 40.5% 160 397 40.4%
Belgium (0) 49 (0.5%) 3 31 9.7% 5 48 11.4% 11 45 24.9% 19 173 11.3%
Mediterranean & Latin American Region 14 112 12.1% 17 91 18.8% 16 99 16.5% 26 131 19.7% 73 432 16.8%
Central & Eastern Europe 14 69 19.9% 11 60 18.8% 8 39 19.9% 8 45 17.7% 41 213 19.1%
Hong Kong 53 84 62.6% 50 82 61.4% 47 77 60.6% 58 87 66.8% 208 330 62.9%
South-East Asia, India & China 30 84 35.4% 34 78 43.5% 33 79 42.4% 33 85 39.0% 130 326 40.0%
Australia/New Zealand
Mature markets 286 1,323 21.6% 226 1,117 20.2% 262 1,084 24.2% 265 1,217 21.8% 1,040 4,742 21.9%
High growth markets 100 259 38.5% 101 249 40.5% 93 223 41.6% 111 261 42.5% 404 992 40.8%
1Q10 2Q10 3Q10 4Q10 FY10
NBV APE NBV
Margin NBV APE
NBV Margin
NBV APE NBV
Margin NBV APE
NBV Margin
NBV APE NBV
Margin
Total 311 1,522 20.4% 311 1,464 21.2% 310 1,331 23.3% 358 1,464 24.5% 1,290 5,780 22.3%
France 38 346 11.0% 41 335 12.2% 32 315 10.2% 48 388 12.4% 159 1,384 11.5%
United States 29 231 12.5% 34 274 12.4% 30 236 12.9% 29 245 11.8% 122 986 12.4%
United Kingdom 8 161 5.0% 7 134 5.1% 8 126 6.3% 6 124 5.2% 29 545 5.4%
Japan 67 91 73.5% 83 131 63.3% 89 113 78.8% 115 130 88.6% 354 465 76.1%
Germany 29 136 21.7% 21 111 18.9% 24 111 22.0% 21 106 19.7% 96 464 20.6%
Switzerland 55 128 42.8% 29 51 55.9% 25 54 45.8% 16 49 32.4% 124 283 43.9%
Belgium 4 68 6.5% 5 55 8.2% 7 54 12.7% 7 42 15.8% 22 218 10.2%
Mediterranean & Latin American Region 22 171 12.8% 23 151 15.1% 19 109 17.5% 27 121 22.5% 91 553 16.5%
Central & Eastern Europe 11 51 21.3% 10 58 17.9% 13 61 21.8% 22 104 21.0% 56 274 20.6%
Hong Kong 22 33 65.9% 29 38 74.6% 30 40 74.7% 34 48 70.6% 114 159 71.6%
South-East Asia, India & China 16 38 43.3% 18 41 45.2% 21 42 50.3% 21 46 45.8% 77 166 46.2%
Australia/New Zealand 9 69 12.6% 12 84 14.3% 12 70 16.5% 12 60 19.8% 44 283 15.6%
Mature markets 256 1,360 18.8% 248 1,286 19.2% 240 1,160 20.7% 270 1,222 22.1% 1,013 5,027 20.2%
High growth markets 55 161 33.9% 63 179 35.4% 70 171 40.8% 88 242 36.5% 276 753 36.7%

81
APE, NBV AND NBV MARGIN
LIFE & SAVINGS
(Euro million) AXA Consolidated
Financial Statements
Annual Premium Equivalent
FY11
FY10 Change FY11 / FY10
Group share
reported
basis comparable
basis
TOTAL 5,733
5,780
( 0.8%) ( 0.6%)
France 1,340
1,384
( 3.2%) ( 2.7%)
United States 1,018
986
3.2% 7.0%
United Kingdom 535
545
( 1.9%) ( 1.3%)
Japan 463
465
( 0.3%) ( 7.6%)
Germany 506
464
9.1% 9.1%
Switzerland 397
283
40.4% 24.8%
Belgium 173
218
( 20.8%) ( 20.8%)
Mediterranean & Latin American Region 432
553
( 21.8%) ( 21.6%)
Central & Eastern Europe 213
274
( 22.4%) ( 22.6%)
Hong Kong 330
159
107.3% 16.4%
South-East Asia, India & China 326
166
96.3% 15.0%
Australia/New Zealand
283
Mature markets 4,808
5,114
( 6.0%) ( 1.1%)
High growth markets 925
667 38.8% 2.0%
New Business Value (NBV) & NBV Margin FY11
FY10
Change FY11 / FY10
Group share
reported basis comparable basis comparable basis
NBV NBV margin %
NBV NBV margin %
NBV NBV NBV margin %
TOTAL 1,444 25.2%
1,290 22.3%
12.0% 1.1% 0.4 pts
France 190 14.2%
159 11.5%
19.3% 19.3% 2.6 pts
United States 136 13.3%
122 12.4%
10.9% 15.0% 0.9 pts
United Kingdom 29 5.4%
29 5.4%
(1.0%) (0.5%) 0.0 pts
Japan 346 74.7%
354 76.1%
(2.2%) (9.4%) (1.5) pts
Germany 112 22.1%
96 20.6%
16.9% 16.9% 1.5 pts
Switzerland 160 40.4%
124 43.9%
29.2% 14.8% (3.5) pts
Belgium 19 11.3%
22 10.2%
(12.7%) (12.7%) 1.0 pts
Mediterranean & Latin American Region 73 16.8%
91 16.5%
(20.4%) (20.1%) 0.3 pts
Central & Eastern Europe 41 19.1%
56 20.6%
(27.8%) (27.6%) (1.3) pts
Hong Kong 208 62.9%
114 71.6%
82.2% 2.3% (8.7) pts
South-East Asia, India & China 130 40.0%
77 46.2%
69.8% (1.8%) (6.9) pts
Australia / New Zealand 44 15.6%
-
Mature markets 1,059 22.0%
1,035 20.2%
2.3% 2.9% 0.8 pts
High growth markets 386 41.7% 254 38.2%
51.6% (3.2%) (2.3) pts
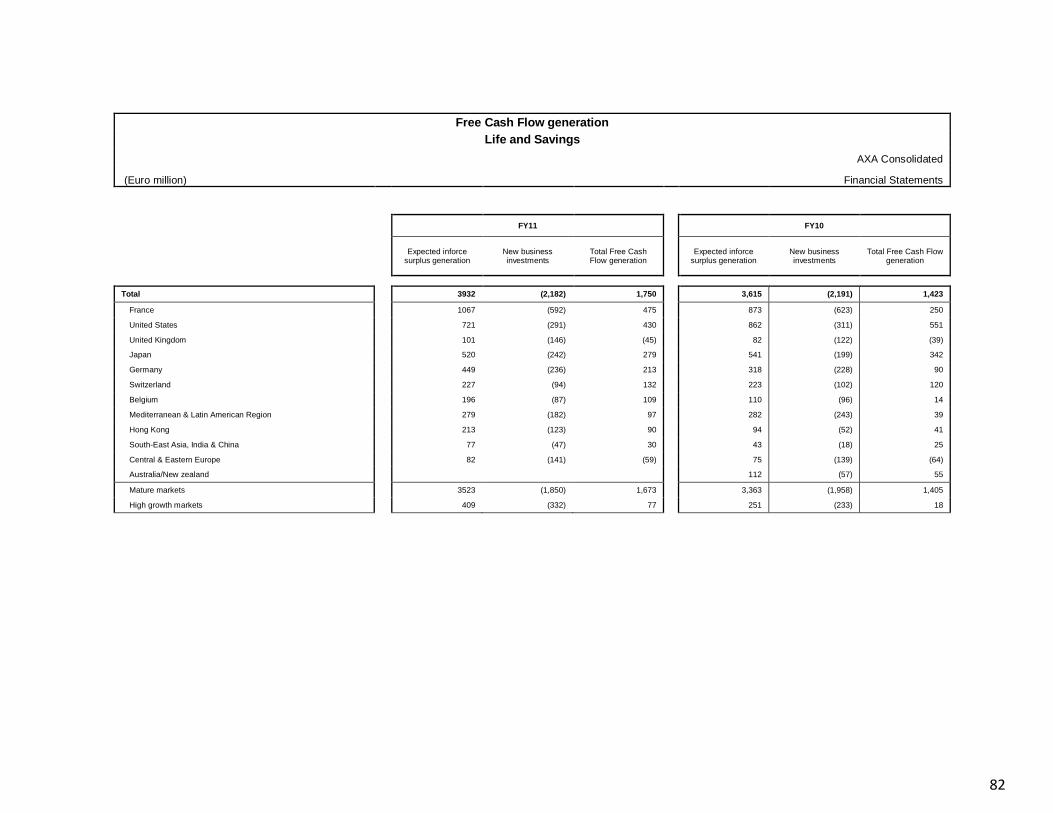
82
Free Cash Flow generation
Life and Savings
AXA Consolidated
(Euro million) Financial Statements
FY11
FY10
Expected inforce
surplus generation New business investments
Total Free Cash Flow generation
Expected inforce surplus generation
New business investments
Total Free Cash Flow generation
Total 3932 (2,182) 1,750
3,615 (2,191) 1,423
France
1067 (592) 475
873 (623) 250
United States
721 (291) 430
862 (311) 551
United Kingdom
101 (146) (45)
82 (122) (39)
Japan
520 (242) 279
541 (199) 342
Germany
449 (236) 213
318 (228) 90
Switzerland
227 (94) 132
223 (102) 120
Belgium
196 (87) 109
110 (96) 14
Mediterranean & Latin American Region
279 (182) 97
282 (243) 39
Hong Kong
213 (123) 90
94 (52) 41
South-East Asia, India & China
77 (47) 30
43 (18) 25
Central & Eastern Europe
82 (141) (59)
75 (139) (64)
Australia/New zealand
112 (57) 55
Mature markets 3523 (1,850) 1,673
3,363 (1,958) 1,405
High growth markets 409 (332) 77
251 (233) 18


![Axa Magnet - Presentasi AXA Magnet [ Maestro Global Network ] Terbaru](https://img.dokumen.tips/doc/110x75/55d2ed27bb61ebdd398b462f/axa-magnet-presentasi-axa-magnet-maestro-global-network-terbaru.jpg)


