Embed Size (px)
Citation preview
FINANCIAL STATEMENTS
SEPTEMBER 30, 2015
WITH
INDEPENDENT AUDITOR'S REPORTS

TABLE OF CONTENTS Independent Auditor's Report............................................................................................................................... 1 Management's Discussion and Analysis (Unaudited) .......................................................................................... 3 Basic Financial Statements:
Statement of Net Position ................................................................................................................................ 9
Statement of Revenues, Expenses and Changes in Net Position .................................................................. 10
Statement of Cash Flows ............................................................................................................................... 11
Notes to Basic Financial Statements ............................................................................................................. 13 Supplemental Information:
Independent Auditor's Report on Supplemental Information ....................................................................... 28
Single Family Mortgage Revenue Bond Programs:
Supplemental Combining Statement of Net Position ................................................................................... 29 Supplemental Combining Statement of Revenues, Expenses and Changes in Net Position .................................................................................................................................. 33
Agency General Fund and Single Family Mortgage Revenue Bond Programs:
Supplemental Combining Statement of Net Position ................................................................................... 37 Supplemental Combining Statement of Revenues, Expenses and Changes in Net Position .......................................................................................................................................... 38
Supplemental Combining Statement of Cash Flows .................................................................................... 39
Other Report:
Report on Internal Control over Financial Reporting and on Compliance and Other Matters Based on an Audit of Financial Statements Performed in Accordance with Government Auditing Standards ........................................................... 41
11600 Broadway Ext., Suite 300, Oklahoma City, OK 73114 P 405.848.2020 F 405.848.7359 www.hogantaylor.com 1
INDEPENDENT AUDITOR'S REPORT To the Board of Trustees Oklahoma Housing Finance Agency Report on the Financial Statements We have audited the accompanying financial statements of Oklahoma Housing Finance Agency (the Agency, or OHFA), a component unit of the State of Oklahoma, as of and for the year ended September 30, 2015, and the related notes to the basic financial statements, which collectively comprise the Agency's basic financial statements as listed in the table of contents. Management's Responsibility for the Financial Statements Management is responsible for the preparation and fair presentation of these financial statements in accordance with accounting principles generally accepted in the United States of America; this includes the design, implementation, and maintenance of internal control relevant to the preparation and fair presentation of financial statements that are free from material misstatement, whether due to fraud or error. Auditor's Responsibility Our responsibility is to express an opinion on these financial statements based on our audit. We conducted our audit in accordance with auditing standards generally accepted in the United States of America and the standards applicable to financial audits contained in Government Auditing Standards, issued by the Comptroller General of the United States. Those standards require that we plan and perform the audit to obtain reasonable assurance about whether the financial statements are free from material misstatement. An audit involves performing procedures to obtain audit evidence about the amounts and disclosures in the financial statements. The procedures selected depend on the auditor's judgment, including the assessment of the risks of material misstatement of the financial statements, whether due to fraud or error. In making those risk assessments, the auditor considers internal control relevant to the entity's preparation and fair presentation of the financial statements in order to design audit procedures that are appropriate in the circumstances, but not for the purpose of expressing an opinion on the effectiveness of the entity's internal control. Accordingly, we express no such opinion. An audit also includes evaluating the appropriateness of accounting policies used and the reasonableness of significant accounting estimates made by management, as well as evaluating the overall presentation of the financial statements. We believe that the audit evidence we have obtained is sufficient and appropriate to provide a basis for our audit opinion.
2
Opinion In our opinion, the financial statements referred to above present fairly, in all material respects, the financial position of the Agency, as of September 30, 2015, and the changes in financial position and cash flows thereof for the year then ended in accordance with accounting principles generally accepted in the United States of America. Emphasis of Matter As discussed in Notes 2, 9 and 12 to the financial statements, the Agency adopted the provisions of GASB Statement No. 68, Accounting and Financial Reporting for Pensions – an Amendment of GASB Statement No. 27, and GASB Statement No. 71, Pension Transition for Contributions Made Subsequent to the Measurement Date – an Amendment of GASB Statement No. 68. Our opinion is not modified with respect to this matter. Other Matters Required Supplemental Information Accounting principles generally accepted in the United States of America require that the management discussion and analysis on pages 3-8 be presented to supplement the basic financial statements. Such information, although not a part of the basic financial statements, is required by the Governmental Accounting Standards Board who considers it to be an essential part of financial reporting for placing the basic financial statements in an appropriate operational, economic, or historical context. We have applied certain limited procedures to the required supplemental information in accordance with auditing standards generally accepted in the United States of America, which consisted of inquiries of management about the methods of preparing the information and comparing the information for consistency with management's responses to our inquiries, the basic financial statements, and other knowledge we obtained during our audit of the basic financial statements. We do not express an opinion or provide any assurance on the information because the limited procedures do not provide us with sufficient evidence to express an opinion or provide any assurance. Other Reporting Required by Government Auditing Standards In accordance with Government Auditing Standards, we have also issued our report dated January 27, 2016, on our consideration of Oklahoma Housing Finance Agency's internal control over financial reporting and on our tests of its compliance with certain provisions of laws, regulations, contracts, and grant agreements and other matters. The purpose of that report is to describe the scope of our testing of internal control over financial reporting and compliance and the results of that testing, and not to provide an opinion on internal control over financial reporting or on compliance. That report is an integral part of an audit performed in accordance with Government Auditing Standards in considering Oklahoma Housing Finance Agency's internal control over financial reporting and compliance.
January 27, 2016
3
OKLAHOMA HOUSING FINANCE AGENCY
MANAGEMENT'S DISCUSSION AND ANALYSIS (unaudited)
September 30, 2015 and 2014
Oklahoma Housing Finance Agency (the Agency, or OHFA) was created in 1975 to provide funds to promote the development of adequate residential housing to families of Oklahoma with low and moderate incomes. OHFA is a self-supporting public trust and follows enterprise fund accounting. As management of OHFA, we offer readers of OHFA's financial statements this narrative overview and analysis of the financial activities for the fiscal years ended September 30, 2015 and 2014. This information is presented to provide additional information regarding the activities of OHFA and to meet the disclosure requirements of Government Accounting Standards Board Statement No. 34, Basic Financial Statements – and Management's Discussion and Analysis – for State and Local Governments. This analysis should be read in conjunction with the basic financial statements, notes to financial statements, and supplemental information. OVERVIEW OF THE FINANCIAL STATEMENTS This financial report of OHFA consists of three sections: management's discussion and analysis, the basic financial statements, and supplemental information. OHFA's basic financial statements include: the Statement of Net Position; the Statement of Revenues, Expenses and Changes in Net Position; the Statement of Cash Flows; and the Notes to the Basic Financial Statements. The Statements of Net Position answers the question, "How is our financial health at the end of the year?" This statement includes all assets, deferred outflows, liabilities and deferred inflows of OHFA, both financial and capital, short term and long term, using the accrual basis of accounting and economic resources measurement focus, which is similar to the accounting used by most private-sector companies. The resulting net position presented in this statement is displayed as restricted and unrestricted. Assets are restricted when their use is subject to external limits such as bond resolutions, legal agreements or statutes. Assets not included in this category are characterized as unrestricted. Over time, changes in net position may serve as a useful indicator of whether the financial position of OHFA is improving or deteriorating. The Statements of Revenues, Expenses and Changes in Net Position measure the activities of OHFA's operations over the past year and present the operating income and change in net position. It can be used to determine whether OHFA has successfully recovered all of its costs through mortgage and loan interest, investment interest, externally funded programs, and other revenue sources. This statement helps answer the question, "Is OHFA as a whole better off or worse off as a result of this year's activities?" The primary purpose of the Statements of Cash Flows is to provide information about the sources and uses of OHFA's cash and the components of the change in cash balance during the reporting period. This statement reports cash receipts, cash payments, and net changes resulting from operating, noncapital financing, capital financing, and investing activities. It provides answers to such questions as "Where did cash come from?" "What was cash used for?" and "What was the change in cash balance during the reporting period?" The Notes to the Basic Financial Statements provide additional information that is essential to a full understanding of the data provided in the financial statements. In addition, this report contains a Supplemental Combining Statement of Net Position for the Single Family Mortgage Revenue Bond Funds as well as a Supplemental Combining Statement of Revenues,

4
Expenses, and Changes in Net Position for the Single Family Mortgage Revenue Bond Programs. These supplemental schedules are presented to provide the reader with information regarding the financial condition of each Single Family Mortgage Revenue Bond Program of the Agency.
FINANCIAL HIGHLIGHTS
Year ended September 30, 2015 • Total assets decreased by $108.5 million. • Total liabilities decreased by $115.3 million. • Net position increased by $8.1 million. • Made 800 single family mortgage loans available to first time homebuyers compared to 669 in
2014. • Provided 121,218 unit months of Section 8 rental assistance in 2015 compared to 121,841 in 2014. • Paid $49.6 million in rental assistance to benefit Section 8 voucher holders compared to $49.0 million
in 2014. • Paid $72.0 million in rental assistance to project based Section 8 properties compared to $70.8
million in 2014.
FINANCIAL HIGHLIGHTS
Year ended September 30, 2014 • Total assets decreased by $75.4 million. • Total liabilities decreased by $78.6 million. • Net position increased by $2.9 million. • Made 669 single family mortgage loans available to first time homebuyers compared to 1,158 in
2013. • Provided 121,841 unit months of Section 8 rental assistance compared to 121,133 in 2013. • Paid $49.0 million in rental assistance to benefit Section 8 voucher holders compared to $49.7 million
in 2013. • Paid $70.8 million in rental assistance to project based Section 8 properties compared to $70.3
million in 2013. The Agency has maintained a General Obligation issuer rating of A1 from Moody's Investors Service since June 2006. This rating reflects OHFA's sound financial condition; a bond program collateralized by highly rated mortgage backed securities, as well as capable and dedicated management. The Section 8 program provides rental assistance to many elderly, single parent, or working families in need of help with their rent payments. The Single Family Loan Program makes affordable home loans available to first time homebuyers through proceeds from mortgage revenue bonds or selling mortgage backed securities in the open market via the "To Be Announced" (TBA) program. The TBA program also provides affordable mortgages with down payment and closing cost assistance to borrowers without the first time home buyer requirement. Housing Tax Credits are provided to developers as an incentive to build new, affordable complexes or rehabilitate complexes in need of repair. As Section 8 Contract Administrator for project-based Section 8 properties located throughout Oklahoma for the Department of Housing and Urban Development (HUD), OHFA's 2015 duties consisted of 187
5
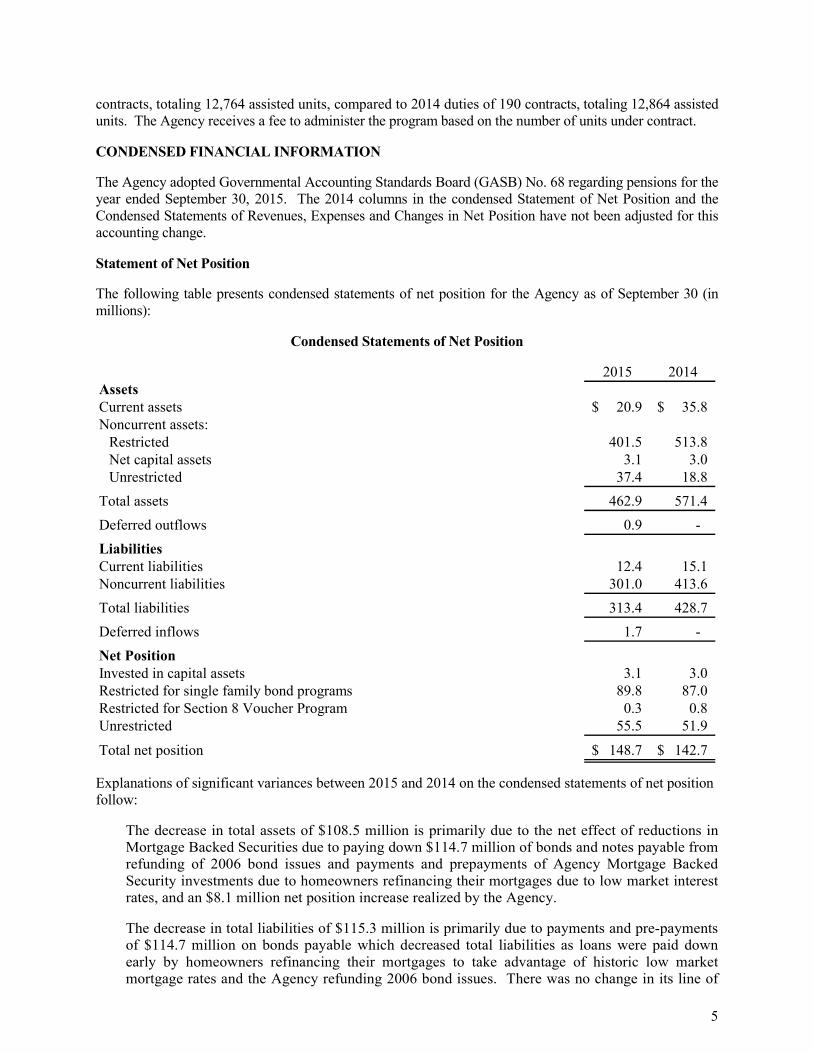
contracts, totaling 12,764 assisted units, compared to 2014 duties of 190 contracts, totaling 12,864 assisted units. The Agency receives a fee to administer the program based on the number of units under contract. CONDENSED FINANCIAL INFORMATION The Agency adopted Governmental Accounting Standards Board (GASB) No. 68 regarding pensions for the year ended September 30, 2015. The 2014 columns in the condensed Statement of Net Position and the Condensed Statements of Revenues, Expenses and Changes in Net Position have not been adjusted for this accounting change. Statement of Net Position The following table presents condensed statements of net position for the Agency as of September 30 (in millions):
Condensed Statements of Net Position
2015 2014AssetsCurrent assets 20.9$ 35.8$ Noncurrent assets:
Restricted 401.5 513.8 Net capital assets 3.1 3.0 Unrestricted 37.4 18.8
Total assets 462.9 571.4 Deferred outflows 0.9 - LiabilitiesCurrent liabilities 12.4 15.1 Noncurrent liabilities 301.0 413.6 Total liabilities 313.4 428.7 Deferred inflows 1.7 - Net PositionInvested in capital assets 3.1 3.0 Restricted for single family bond programs 89.8 87.0 Restricted for Section 8 Voucher Program 0.3 0.8 Unrestricted 55.5 51.9
Total net position 148.7$ 142.7$
Explanations of significant variances between 2015 and 2014 on the condensed statements of net position follow:
The decrease in total assets of $108.5 million is primarily due to the net effect of reductions in Mortgage Backed Securities due to paying down $114.7 million of bonds and notes payable from refunding of 2006 bond issues and payments and prepayments of Agency Mortgage Backed Security investments due to homeowners refinancing their mortgages due to low market interest rates, and an $8.1 million net position increase realized by the Agency.
The decrease in total liabilities of $115.3 million is primarily due to payments and pre-payments of $114.7 million on bonds payable which decreased total liabilities as loans were paid down early by homeowners refinancing their mortgages to take advantage of historic low market mortgage rates and the Agency refunding 2006 bond issues. There was no change in its line of
6
credit with Federal Home Loan Bank of Topeka as there was a zero balance at the end of each year. The line of credit is used to warehouse Mortgage Backed Securities (MBS) on a short term basis until they can be transferred into a future Single Family Bond Program or sold on the open market. The $2.7 million increase in net position restricted for Single Family Bond Programs is a result of $2.8 million of net operating income relating to the bond program.
The Section 8 Voucher Program is included in the Agency General Fund and that program's net position, which is restricted, decreased by $0.5 million due to receiving $0.5 million less in rental assistance payments than program expenditures in the current year. Since 2006, HUD has required agencies to report receipts from HUD in excess of program expenditures as income and to report assistance payments in excess of program receipts as an expense in the current year. These items are reported in net position instead of as a payable or receivable with HUD. These funds are only available to pay Housing Assistance Payments (HAP) under the Section 8 Voucher Program. The Agency had funds restricted for the Section 8 Voucher Program of $0.3 million and $0.8 million, respectively, as of September 30, 2015 and 2014.
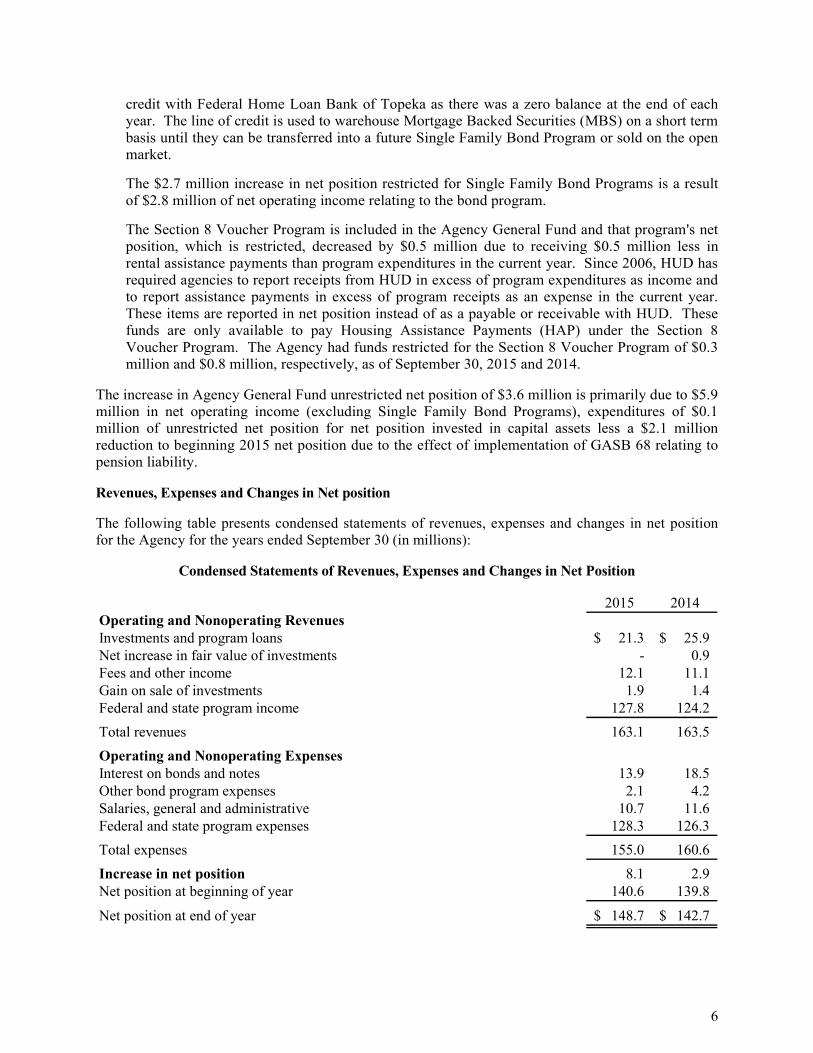
The increase in Agency General Fund unrestricted net position of $3.6 million is primarily due to $5.9 million in net operating income (excluding Single Family Bond Programs), expenditures of $0.1 million of unrestricted net position for net position invested in capital assets less a $2.1 million reduction to beginning 2015 net position due to the effect of implementation of GASB 68 relating to pension liability. Revenues, Expenses and Changes in Net position The following table presents condensed statements of revenues, expenses and changes in net position for the Agency for the years ended September 30 (in millions):
Condensed Statements of Revenues, Expenses and Changes in Net Position
2015 2014Operating and Nonoperating RevenuesInvestments and program loans 21.3$ 25.9$ Net increase in fair value of investments - 0.9 Fees and other income 12.1 11.1 Gain on sale of investments 1.9 1.4 Federal and state program income 127.8 124.2 Total revenues 163.1 163.5 Operating and Nonoperating ExpensesInterest on bonds and notes 13.9 18.5 Other bond program expenses 2.1 4.2 Salaries, general and administrative 10.7 11.6 Federal and state program expenses 128.3 126.3 Total expenses 155.0 160.6 Increase in net position 8.1 2.9 Net position at beginning of year 140.6 139.8
Net position at end of year 148.7$ 142.7$
7
Explanations of significant fluctuations between 2015 and 2014 in revenues, expenses, and changes in net position follow:
The net decrease in interest income from investments and program loans of $4.6 million is primarily due to older, higher interest bond program loan pools being paid down at a faster rate, as consumers refinance their mortgages, than new, lower interest rate bond program loans are added to the portfolio and MBS being sold into the market via the TBA program instead of being placed into a bond issue due to market conditions. Also, due to the current low market interest rate environment, as Agency investments mature, the proceeds are invested at a lower interest rate than the maturing investment.
The net increase in the fair value of investments of $0.9 million for 2014 was due to market interest rates being lower than in the previous year, causing an increase in the value of older, higher yielding interest rate securities. Interest rates remained relatively stable in 2015, causing little change in the fair value of investments in 2015. The market values of fixed interest rate investments typically have an inverse relationship to interest rates.
The increase in the gain on sale of investments of $0.5 million is due to the Agency capitalizing on an opportunity to sell newly pooled Single Family Loan Program MBS at a gain on the open market via the TBA program instead of placing these MBS into a bond issue.
Federal program income increased by $3.6 million due primarily to the net effect of a $1.2 million increase in the Section 8 Contract Administration Program revenue, a $0.4 million increase in the HOME Investment Partnership program revenue, and a $1.2 million increase in the Section 8 Voucher program revenue.
Interest expense on bonds and notes payable decreased by $4.6 million in 2015 from 2014. Bonds and notes payable are $115.5 million less than prior year due to principal payments in excess of new borrowings for lending to first time homebuyers. Also, higher interest rate bonds were paying off faster because borrowers were refinancing their homes due to the low market interest rates. Federal program expenses increased by $2.0 million due primarily to the net effect of a $1.2 million increase in the Section 8 Contract Administration Program expenses, a $0.5 million increase in the HOME Investment Partnership program expenses, and a $0.4 million increase in the Section 8 Voucher program expenses. The increase in net position of $6.0 million from $142.7 million 2014 to $148.7 million in 2015 is primarily due to an operating income of $8.7 million, offset by a $0.5 million decrease in net position due to a $0.5 million nonoperating loss due to OHFA receiving $0.5 million less in federal program revenues than federal program expenses, plus a decrease of $2.1 million to beginning 2015 net position due to the implementation of GASB 68 regarding pensions.
Capital Assets and Long-Term Debt Administration
Capital Assets As of September 30, 2015, the Agency had invested $3.1 million in a broad range of capital assets, including buildings and building improvements, land and furniture and equipment. This amount represents a net change of $0.1 million (including additions and disposals). Long-Term Debt As of September 30, 2015, the Agency had $309.2 million in bonds and notes payable outstanding, which is a decrease of 27.2% from last year's amount of $424.7 million. (More detailed information about the bonds and notes payable is presented in Note 7 to the financial statements.)

8
ECONOMIC FACTORS AND OTHER FINANCIAL INFORMATION OHFA's main sources of revenues include mortgage loan activity, investment interest income, and externally funded grants. Market interest rates have an effect on both the mortgage program and investment income revenues. If interest rates rise, mortgage and investment income should increase as new loans are originated and new investments are purchased at higher rates. If interest rates fall, mortgage and investment income will decrease as new loans are originated and new investments are purchased at the lower rates. Any decrease in interest rates could also cause an increase in prepayments on higher rate mortgages. Administrative fees for administering federal programs continue to be reduced. Large federal deficits or changes in programs or funding levels could have a negative impact on externally funded program revenues. The Agency expects to continue its commitment to its mission of helping to place people in homes while preserving a strong financial position during the coming year. CONTACTING OHFA'S FINANCIAL MANAGEMENT This discussion and analysis is to provide additional information to our stakeholders regarding the activities of the Agency. If you have questions about this report, or need additional financial information, contact the OHFA Finance Team Leader, Eldon Overstreet, JD, CPA, at (405) 419-8209; Oklahoma Housing Finance Agency, P.O. Box 26720, Oklahoma City, Oklahoma 73126-0720; e-mail: [email protected]; or visit our website at www.ohfa.org.

See notes to the basic financial statements. 9
OKLAHOMA HOUSING FINANCE AGENCY
STATEMENT OF NET POSITION
September 30, 2015
AssetsCurrent assets:
Cash and cash equivalents 11,877,708$ Investments 8,041,673 Accounts receivable (net of an allowance for doubtful accounts of $644,346) 101,894 Accounts receivable - U.S. Department of
Housing and Urban Development 448,920 Prepaid expenses 334,105 Interest receivable 122,100
Total current assets 20,926,400
Noncurrent assets:Restricted assets:
Cash and cash equivalents 22,097,271 Investments 376,711,689 Interest receivable 1,307,128 Program loans receivable (net of allowance of $563,395) 1,466,683
Long-term investments 37,381,455 Nondepreciated capital assets 550,000 Capital assets, net 2,502,080
Total noncurrent assets 442,016,306
Total assets 462,942,706
Deferred outflows of resources: Pension 717,333 Accumulated decrease in fair value of hedging derivatives 151,100
Total deferred outflows 868,433
LiabilitiesCurrent liabilities:
Salaries and related expenses 556,729 Accounts payable - vendors and contractors 217,537 Accounts payable - U.S. Department of Housing
and Urban Development 19,745 Accounts payable - Family Self Sufficiency Program 430,550 Accounts payable - other 146,389 Hedging payable 151,100 Unearned revenue 393,330 Compensated absences 807,519 Interest payable 966,672 Current maturities of bonds and notes payable 8,685,296
Total current liabilities 12,374,867
Noncurrent liabilities: Pension liability 467,953 Bonds and notes payable, less current maturities 300,540,210
Total noncurrent liabilities 301,008,163
Total liabilities 313,383,030
Deferred inflows of resources:Pension 1,718,808
Net PositionInvested in capital assets 3,052,080 Restricted for single family bond programs 89,781,003 Restricted for Section 8 Voucher Program 326,277 Unrestricted 55,549,941
Total net position 148,709,301$
See notes to the basic financial statements. 10
OKLAHOMA HOUSING FINANCE AGENCY
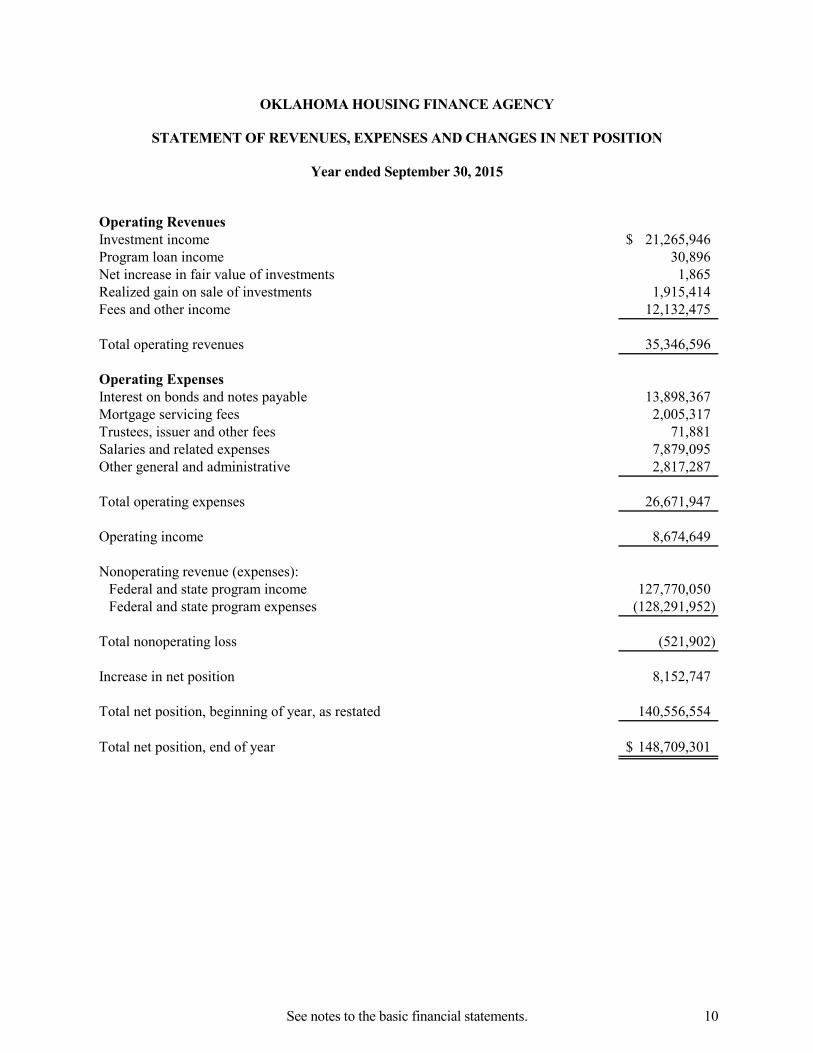
STATEMENT OF REVENUES, EXPENSES AND CHANGES IN NET POSITION
Year ended September 30, 2015
Operating RevenuesInvestment income 21,265,946$ Program loan income 30,896 Net increase in fair value of investments 1,865 Realized gain on sale of investments 1,915,414 Fees and other income 12,132,475
Total operating revenues 35,346,596
Operating ExpensesInterest on bonds and notes payable 13,898,367 Mortgage servicing fees 2,005,317 Trustees, issuer and other fees 71,881 Salaries and related expenses 7,879,095 Other general and administrative 2,817,287
Total operating expenses 26,671,947
Operating income 8,674,649
Nonoperating revenue (expenses):Federal and state program income 127,770,050 Federal and state program expenses (128,291,952)
Total nonoperating loss (521,902)
Increase in net position 8,152,747
Total net position, beginning of year, as restated 140,556,554
Total net position, end of year 148,709,301$
See notes to the basic financial statements. 11
OKLAHOMA HOUSING FINANCE AGENCY
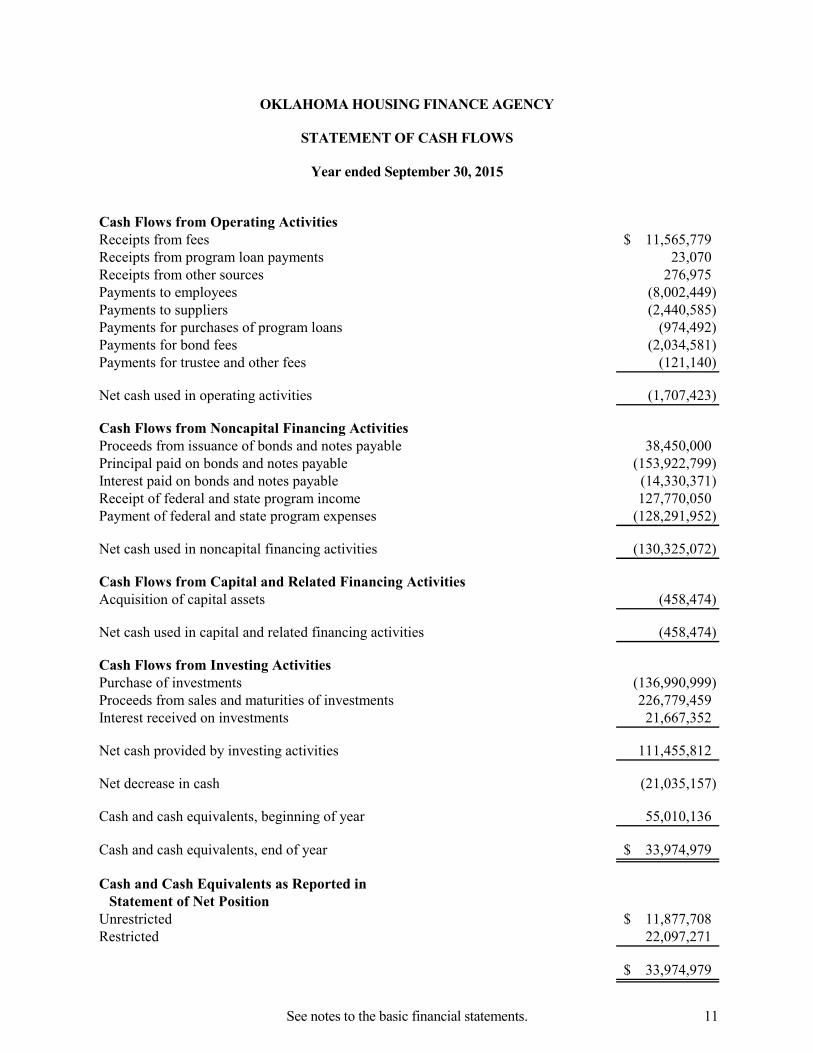
STATEMENT OF CASH FLOWS
Year ended September 30, 2015
Cash Flows from Operating ActivitiesReceipts from fees 11,565,779$ Receipts from program loan payments 23,070 Receipts from other sources 276,975 Payments to employees (8,002,449) Payments to suppliers (2,440,585) Payments for purchases of program loans (974,492) Payments for bond fees (2,034,581) Payments for trustee and other fees (121,140)
Net cash used in operating activities (1,707,423)
Cash Flows from Noncapital Financing ActivitiesProceeds from issuance of bonds and notes payable 38,450,000 Principal paid on bonds and notes payable (153,922,799) Interest paid on bonds and notes payable (14,330,371) Receipt of federal and state program income 127,770,050 Payment of federal and state program expenses (128,291,952)
Net cash used in noncapital financing activities (130,325,072)
Cash Flows from Capital and Related Financing ActivitiesAcquisition of capital assets (458,474)
Net cash used in capital and related financing activities (458,474)
Cash Flows from Investing ActivitiesPurchase of investments (136,990,999) Proceeds from sales and maturities of investments 226,779,459 Interest received on investments 21,667,352
Net cash provided by investing activities 111,455,812
Net decrease in cash (21,035,157)
Cash and cash equivalents, beginning of year 55,010,136
Cash and cash equivalents, end of year 33,974,979$
Cash and Cash Equivalents as Reported in Statement of Net Position
Unrestricted 11,877,708$ Restricted 22,097,271
33,974,979$

See notes to the basic financial statements. 12
OKLAHOMA HOUSING FINANCE AGENCY
STATEMENT OF CASH FLOWS (continued)
Year ended September 30, 2015
Reconciliation of Operating Income to Net CashUsed in Operating Activities
Operating income 8,674,649$ Adjustments to reconcile operating income to net cash
used in operating activities:Depreciation 378,527 Interest from investments (21,273,772) Net increase in fair value of investments (1,865) Realized gain on sale of investments (1,915,414) Interest on bonds and notes payable 13,898,367 Change in operating assets, liabilities, deferred outflows,
and deferred inflows:Accounts receivable 177,553 Prepaid expenses 21,176 Program loans receivable (974,492) Accounts payable and accrued expenses 229,400 Unearned revenue 186,710 Pension payable (2,372,792) Deferred outflows (148,121) Deferred inflows 1,718,808 Compensated absences (306,157)
Net cash used in operating activities (1,707,423)$
13
OKLAHOMA HOUSING FINANCE AGENCY
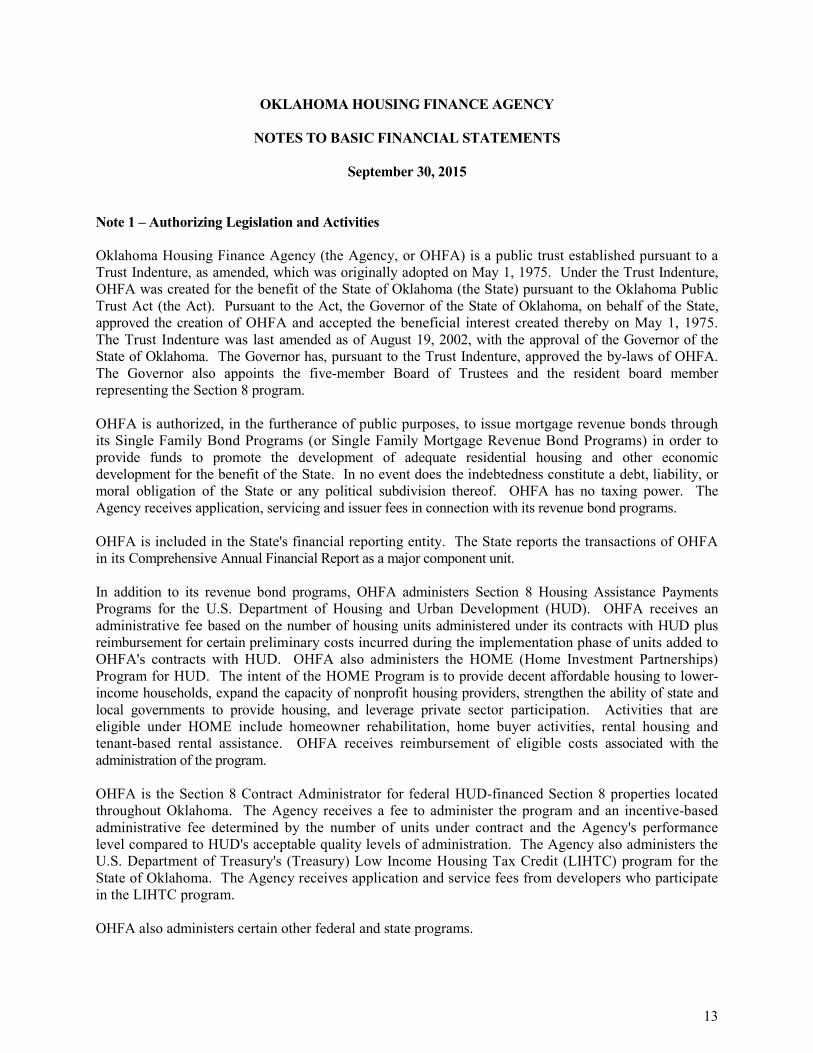
NOTES TO BASIC FINANCIAL STATEMENTS
September 30, 2015 Note 1 – Authorizing Legislation and Activities Oklahoma Housing Finance Agency (the Agency, or OHFA) is a public trust established pursuant to a Trust Indenture, as amended, which was originally adopted on May 1, 1975. Under the Trust Indenture, OHFA was created for the benefit of the State of Oklahoma (the State) pursuant to the Oklahoma Public Trust Act (the Act). Pursuant to the Act, the Governor of the State of Oklahoma, on behalf of the State, approved the creation of OHFA and accepted the beneficial interest created thereby on May 1, 1975. The Trust Indenture was last amended as of August 19, 2002, with the approval of the Governor of the State of Oklahoma. The Governor has, pursuant to the Trust Indenture, approved the by-laws of OHFA. The Governor also appoints the five-member Board of Trustees and the resident board member representing the Section 8 program. OHFA is authorized, in the furtherance of public purposes, to issue mortgage revenue bonds through its Single Family Bond Programs (or Single Family Mortgage Revenue Bond Programs) in order to provide funds to promote the development of adequate residential housing and other economic development for the benefit of the State. In no event does the indebtedness constitute a debt, liability, or moral obligation of the State or any political subdivision thereof. OHFA has no taxing power. The Agency receives application, servicing and issuer fees in connection with its revenue bond programs. OHFA is included in the State's financial reporting entity. The State reports the transactions of OHFA in its Comprehensive Annual Financial Report as a major component unit. In addition to its revenue bond programs, OHFA administers Section 8 Housing Assistance Payments Programs for the U.S. Department of Housing and Urban Development (HUD). OHFA receives an administrative fee based on the number of housing units administered under its contracts with HUD plus reimbursement for certain preliminary costs incurred during the implementation phase of units added to OHFA's contracts with HUD. OHFA also administers the HOME (Home Investment Partnerships) Program for HUD. The intent of the HOME Program is to provide decent affordable housing to lower-income households, expand the capacity of nonprofit housing providers, strengthen the ability of state and local governments to provide housing, and leverage private sector participation. Activities that are eligible under HOME include homeowner rehabilitation, home buyer activities, rental housing and tenant-based rental assistance. OHFA receives reimbursement of eligible costs associated with the administration of the program. OHFA is the Section 8 Contract Administrator for federal HUD-financed Section 8 properties located throughout Oklahoma. The Agency receives a fee to administer the program and an incentive-based administrative fee determined by the number of units under contract and the Agency's performance level compared to HUD's acceptable quality levels of administration. The Agency also administers the U.S. Department of Treasury's (Treasury) Low Income Housing Tax Credit (LIHTC) program for the State of Oklahoma. The Agency receives application and service fees from developers who participate in the LIHTC program. OHFA also administers certain other federal and state programs.
14
Note 2 – Summary of Significant Accounting Policies Financial statement presentation OHFA accounts for revenues and expenses related to temporary funding of certain single family first mortgage loans within its general fund until the loans are sold in specified increments in connection with related bond programs, when required, due to the temporary restrictions associated with bond programs. Intergovernmental grants are also accounted for within the Agency's general fund. Pursuant to OHFA's bond obligation resolutions, separate funds are established by each trustee bank to record all transactions relating to OHFA programs financed under each of the resolutions. Within each fund, there is a group of accounts required by the respective resolutions. The Single Family Bond Program funds and the general fund have been presented on a combined basis because OHFA is considered a single enterprise fund for financial reporting purposes. All interfund balances and transactions have been eliminated in the financial statements. The accompanying financial statements have been prepared in conformity with generally accepted accounting principles as prescribed by the Governmental Accounting Standards Board (GASB). The financial statements are prepared in accordance with GASB Statement No. 34, Basic Financial Statements – and Management's Discussion for State and Local Governments, GASB Statement No. 37, Basic Financial Statements – and Management's Discussion and Analysis – for State and Local Governments: Omnibus, and GASB Statement No. 38, Certain Financial Statement Note Disclosures. Basis of accounting The Agency accounts for its activities within a proprietary fund type. The Agency's activities meet the definition of an enterprise fund because it is the intent of the Agency to recover, primarily through user charges, the cost of providing goods or services to the general public. The proprietary fund type is accounted for on a flow of economic resources measurement focus. With this measurement focus, all assets and all liabilities associated with the operation of this fund are included on the statement of net position. Proprietary fund operating statements present increases (e.g., revenues) and decreases (e.g., expenses) in net position. The accrual basis of accounting is utilized by a proprietary fund. Under this basis of accounting, revenues are recognized when earned and expenses are recognized when the liability is incurred. The GASB is the standard-setting body for governmental accounting and financial reporting. The GASB periodically updates its codification of the existing Governmental Accounting and Financial Reporting Standards, which, along with subsequent GASB pronouncements (Statements and Interpretations), constitutes GAAP for governmental units. Proprietary funds distinguish operating revenues and expenses from nonoperating items. Operating revenues and expenses generally result from providing services in connection with a proprietary fund's principal ongoing operations. Revenues and expenses not meeting this definition are reported as nonoperating revenues and expenses. When the Agency incurs an expense for which it may use either restricted or unrestricted net position, it uses restricted net position first unless unrestricted net position will have to be returned because they were not used. Changes in accounting principle For the year ended September 30, 2015, the Agency adopted the provisions of GASB Statement No. 68, Accounting and Financial Reporting for Pensions (GASB No. 68). GASB No. 68 replaces
15
the requirements of Statement No. 27, Accounting for Pensions by State and Local Governmental Employers, and Statement No. 50, Pension Disclosures – an Amendment of GASB Statements No. 25 and 27, as they relate to governments that provide pensions through pension plans administered as trusts or similar arrangements that meet certain criteria. GASB No. 68 requires governments providing defined benefit pensions to recognize their long term obligation for pension benefits as a liability for the first time and to more comprehensively and comparably measure the annual costs of pension benefits. GASB No. 68 also enhances accountability and transparency through revised and new note disclosures and required supplemental information. The Agency adopted the provisions of GASB issued Statement No. 71, Pension Transition for Contributions Made Subsequent to the Measurement Date – an Amendment of GASB Statement No. 68 (GASB No. 71). GASB No. 71 addresses an issue regarding application of the transition provisions of GASB No. 68. Contributions to a defined benefit pension plan between the measurement date of the reported net pension liability and the end of the reporting period are required to be recognized as deferred outflows of resources. The Agency's adoption of GASB No. 68 and GASB No. 71 required restatement of beginning net position, the recognitions of deferred inflows, deferred outflows and pension liability, as well as additional disclosures in the notes to the financial statements (see Note 12). Cash and cash equivalents For purposes of the statement of cash flows, OHFA's cash equivalents are defined as short-term, highly liquid investments that are readily convertible to cash with an original maturity of 90 days or less. Investments The Agency's investment policy for the general fund is governed by state statute and the Board of Trustees' "Statement of Investment Policy." Permissible investments include direct obligations of the United States Government and Agencies, mortgage-backed securities guaranteed by federal agencies, certificates of deposit, repurchase agreements and savings accounts. Collateral is required for demand deposits and certificates of deposit for all amounts not covered by Federal Deposit Insurance Corporation (FDIC) insurance. Investments are reported at fair value. The short-term investments within the Single Family Bond Programs are generally restricted by the various bond resolutions as to authorized investments. Most are commonly held in guaranteed investment contracts or money market accounts collateralized by government securities. These short-term investments are reported at cost, which approximates their fair values. As required by GASB Statement No. 31, Accounting for and Financial Reporting for Certain Investments and External Investment Pools, U.S. government and agency securities and mortgage-backed securities are reported at fair value as determined by the investment custodians utilizing prices quoted by securities dealers, brokers, investment banks or other services at the valuation date. Mortgage-backed securities reported by the Single Family Bond Programs are pass-through certificates of the Government National Mortgage Association (GNMA) and Federal National Mortgage Association (FNMA), which securitize qualified pools of loans or individual loans under the respective programs. These securities are reported at fair value. Mortgage-backed securities do not have a contractual maturity date, and the Agency may be subject to the risk of prepayment on these mortgage-backed securities. Without consideration of the respective net increase or decrease in the fair value of investments, OHFA's 2015 net operating income would have been $8,672,784.

16
Program loans receivable Program loans receivable primarily consist of Housing Trust Fund loans secured by mortgages. These loans are reported at cost. Based on management's evaluation of program loans receivable, the Agency has recorded an allowance for uncollectible program loans of $563,395 as of September 30, 2015. Capital assets Capital assets are carried at cost. Depreciation and amortization is computed using the straight-line method over the estimated useful lives of the assets, which range from 1 to 40 years. Maintenance and repairs are expensed as incurred. Total depreciation expense for the year ended September 30, 2015, was $378,527 and is included with other general and administrative expense on the Statement of Revenues, Expenses and Changes in Net Position. Unearned revenue Unearned revenue arises when potential revenue does not meet the available criterion for recognition or the resources were received by the Agency before it has a legal claim to the resources. Amounts received under certain intergovernmental grant agreements are recognized only to the extent of allowable expenses. Any amounts received in excess of expenditures incurred are unearned and recorded as a liability. The only exception to this accounting policy is the Section 8 Housing Choice Voucher Program. Per HUD guidance, excess budget authority disbursed to a Public Housing Agency that is not utilized to pay Housing Assistance Payments (HAP) becomes part of the net position – restricted for Section 8 Voucher Program. Bond issue costs Bond issue costs are costs associated with issuing bonds and are expensed in the period incurred. Pensions The fiduciary net position of the Oklahoma Public Employees Retirement System (OPERS) has been determined using the flow of economic resources measurement focus and full accrual basis of accounting. This includes measuring the net pension liability, deferred outflows of resources and deferred inflows of resources related to pensions, pension expense, and information about assets, liabilities and additions to/deductions from OPERS fiduciary net position. Benefit payments (including refunds of employee contributions) are recognized when due and payable in accordance with the benefit terms. Investments are reported at fair value. Restrictions and designations of net position The use of assets of each of the Single Family Bond Program funds is restricted by the related bond resolution. Certain amounts in the program funds are considered subject to the restriction that they may be applied to the financing of housing for the respective program purposes or to the retirement of obligations issued for such purposes. The Agency has designated $8,000,000 of unrestricted net position to provide funds and reserves to purchase single family loans to be acquired from future issuances under the Single Family Mortgage Revenue Bond Programs.
17
Net Position restricted for the Section 8 Voucher Program represent funds received from HUD in excess of HAP expenditures. These funds can only be utilized to make HAP payments for the Section 8 Voucher Program. Future changes in accounting pronouncements GASB Statement No. 72 – Fair Value Measurement and Application, issued February 2015, will be effective for the Agency for its year ending September 30, 2016. This statement addresses accounting and financial reporting issues related to fair value measurements. This statement requires the use of valuation techniques that are appropriate under the circumstances and for which sufficient data are available to measure fair value. This statement also establishes a hierarchy of inputs to valuation techniques used to measure fair value. That hierarchy has three levels. Level 1 inputs are quoted prices (unadjusted) in active markets for identical assets or liabilities. Level 2 inputs are inputs – other than quoted prices – included within Level 1 that are observable for the asset or liability, either directly or indirectly. Finally, Level 3 inputs are unobservable inputs, such as management's assumption of the default rate among underlying mortgages of a mortgage-backed security. GASB Statement No. 76 – The Hierarchy of Generally Accepted Accounting Principles for State and Local Governments, issued in June 2015, will be effective for the Agency for its year ending September 30, 2016. This statement supersedes GASB Statement No. 55 – The Hierarchy of Generally Accepted Accounting Principles for State and Local Governments. The objective of this statement is to identify in the context of the current governmental financial reporting environment the hierarchy of generally accepted accounting principles (GAAP). The "GAAP Hierarchy" consists of the sources of accounting principles used to prepare financial statements of state and local governmental entities in conformity with GAAP and the framework for selecting those principles. This statement reduces the GAAP hierarchy to two categories of authoritative GAAP and addresses the use of authoritative and nonauthoritative literature in the event that the accounting treatment for a transaction or other event is not specified within a source of authoritative GAAP. Management has not yet determined the effect these statements will have on the Agency's financial statements. Note 3 – Cash and Investments Deposit custodial credit risk Custodial credit risk is the risk that in the event of a bank failure, the Agency's deposits may not be returned. The Agency requires that financial institutions pledge collateral securities to secure the deposits of the Agency in each institution for amounts above the FDIC insurance coverage. Current Agency policy for deposits not held by the Single Family Bond Programs requires the lesser of the cost or fair value of the collateral pledged to be 110% of the deposit value. As of September 30, 2015, the Agency was not exposed to custodial credit risk. As of September 30, 2015, $22,158,857 of the total cash consisted primarily of money market accounts held at trustee banks. These funds are classified as investments for the purposes of GASB Statement No. 40 Deposit and Investment Risk Disclosures requirements and therefore are not subject to custodial credit risk. For presentation on the face of the Statement of Net Position, these funds are classified as cash equivalents.
18
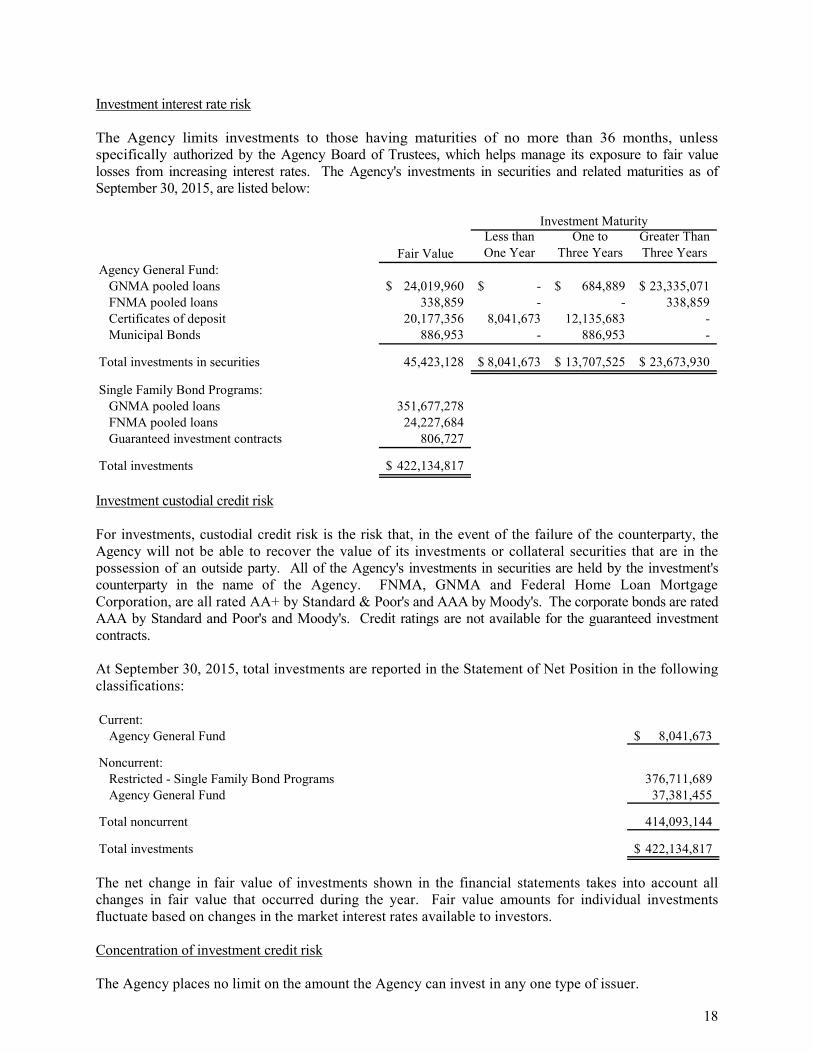
Investment interest rate risk The Agency limits investments to those having maturities of no more than 36 months, unless specifically authorized by the Agency Board of Trustees, which helps manage its exposure to fair value losses from increasing interest rates. The Agency's investments in securities and related maturities as of September 30, 2015, are listed below:
Less than One to Greater ThanFair Value One Year Three Years Three Years
Agency General Fund:GNMA pooled loans 24,019,960$ -$ 684,889$ 23,335,071$ FNMA pooled loans 338,859 - - 338,859 Certificates of deposit 20,177,356 8,041,673 12,135,683 - Municipal Bonds 886,953 - 886,953 -
Total investments in securities 45,423,128 8,041,673$ 13,707,525$ 23,673,930$
Single Family Bond Programs:GNMA pooled loans 351,677,278 FNMA pooled loans 24,227,684 Guaranteed investment contracts 806,727
Total investments 422,134,817$
Investment Maturity
Investment custodial credit risk For investments, custodial credit risk is the risk that, in the event of the failure of the counterparty, the Agency will not be able to recover the value of its investments or collateral securities that are in the possession of an outside party. All of the Agency's investments in securities are held by the investment's counterparty in the name of the Agency. FNMA, GNMA and Federal Home Loan Mortgage Corporation, are all rated AA+ by Standard & Poor's and AAA by Moody's. The corporate bonds are rated AAA by Standard and Poor's and Moody's. Credit ratings are not available for the guaranteed investment contracts. At September 30, 2015, total investments are reported in the Statement of Net Position in the following classifications: Current:
Agency General Fund 8,041,673$
Noncurrent:Restricted - Single Family Bond Programs 376,711,689 Agency General Fund 37,381,455
Total noncurrent 414,093,144
Total investments 422,134,817$
The net change in fair value of investments shown in the financial statements takes into account all changes in fair value that occurred during the year. Fair value amounts for individual investments fluctuate based on changes in the market interest rates available to investors. Concentration of investment credit risk The Agency places no limit on the amount the Agency can invest in any one type of issuer.
19
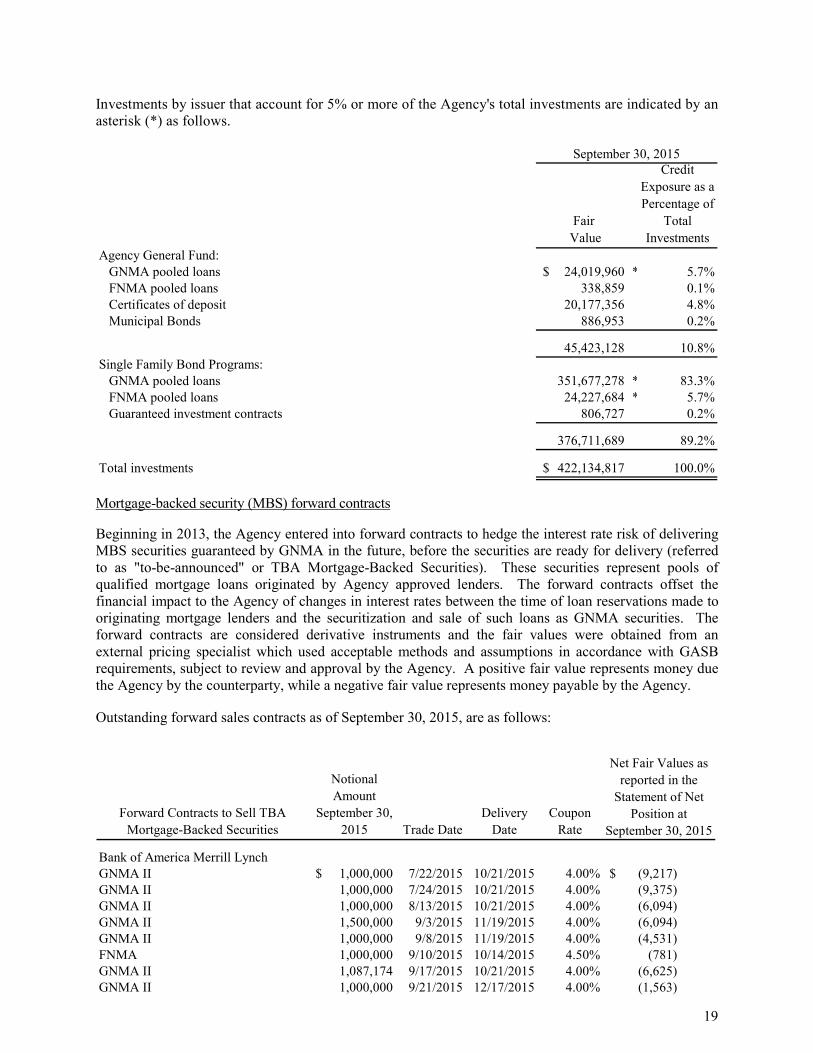
Investments by issuer that account for 5% or more of the Agency's total investments are indicated by an asterisk (*) as follows.
Fair Value
Credit Exposure as a Percentage of
Total Investments
Agency General Fund:GNMA pooled loans 24,019,960$ * 5.7%FNMA pooled loans 338,859 0.1%Certificates of deposit 20,177,356 4.8%Municipal Bonds 886,953 0.2%
45,423,128 10.8%Single Family Bond Programs:
GNMA pooled loans 351,677,278 * 83.3%FNMA pooled loans 24,227,684 * 5.7%Guaranteed investment contracts 806,727 0.2%
376,711,689 89.2%
Total investments 422,134,817$ 100.0%
September 30, 2015
Mortgage-backed security (MBS) forward contracts Beginning in 2013, the Agency entered into forward contracts to hedge the interest rate risk of delivering MBS securities guaranteed by GNMA in the future, before the securities are ready for delivery (referred to as "to-be-announced" or TBA Mortgage-Backed Securities). These securities represent pools of qualified mortgage loans originated by Agency approved lenders. The forward contracts offset the financial impact to the Agency of changes in interest rates between the time of loan reservations made to originating mortgage lenders and the securitization and sale of such loans as GNMA securities. The forward contracts are considered derivative instruments and the fair values were obtained from an external pricing specialist which used acceptable methods and assumptions in accordance with GASB requirements, subject to review and approval by the Agency. A positive fair value represents money due the Agency by the counterparty, while a negative fair value represents money payable by the Agency. Outstanding forward sales contracts as of September 30, 2015, are as follows:
Forward Contracts to Sell TBA Mortgage-Backed Securities
Notional Amount
September 30, 2015 Trade Date
Delivery Date
Coupon Rate
Bank of America Merrill LynchGNMA II 1,000,000$ 7/22/2015 10/21/2015 4.00% (9,217)$ GNMA II 1,000,000 7/24/2015 10/21/2015 4.00% (9,375) GNMA II 1,000,000 8/13/2015 10/21/2015 4.00% (6,094) GNMA II 1,500,000 9/3/2015 11/19/2015 4.00% (6,094) GNMA II 1,000,000 9/8/2015 11/19/2015 4.00% (4,531) FNMA 1,000,000 9/10/2015 10/14/2015 4.50% (781) GNMA II 1,087,174 9/17/2015 10/21/2015 4.00% (6,625) GNMA II 1,000,000 9/21/2015 12/17/2015 4.00% (1,563)
Net Fair Values as reported in the
Statement of Net Position at
September 30, 2015

20
Forward Contracts to Sell TBA Mortgage-Backed Securities
Notional Amount
September 30, 2015 Trade Date
Delivery Date
Coupon Rate
Net Fair Values as reported in the
Statement of Net Position at
September 30, 2015
Bank of New York MellonGNMA II 1,000,000 7/28/2015 10/21/2015 4.00% (8,828) GNMA II 1,000,000 8/3/2015 10/21/2015 4.00% (6,250) FNMA 500,000 8/5/2015 10/14/2015 4.50% (3,203) GNMA II 1,000,000 8/6/2015 10/21/2015 4.00% (8,438) GNMA II 1,000,000 8/10/2015 10/21/2015 4.00% (8,438) GNMA II 1,000,000 8/18/2015 10/21/2015 4.00% (8,125) GNMA II 1,000,000 8/24/2015 11/19/2015 4.00% (3,906) GNMA II 1,000,000 8/25/2015 11/19/2015 4.00% (5,000) GNMA II 1,000,000 8/28/2015 11/19/2015 4.00% (5,313) FNMA 500,000 9/11/2015 11/12/2015 4.50% (547) GNMA II 1,000,000 9/15/2015 11/19/2015 4.00% (5,625) GNMA II 1,000,000 9/17/2015 10/21/2015 3.50% (8,906) GNMA II 2,500,000 9/17/2015 10/21/2015 4.00% (14,844) GNMA II 984,982 9/17/2015 10/21/2015 4.50% (2,001) FNMA 500,000 9/24/2015 12/10/2015 4.50% 156 GNMA II 500,000 9/24/2015 12/17/2015 4.50% - GNMA II 1,000,000 9/25/2015 12/17/2015 4.00% (3,750) FNMA 500,000 9/29/2015 12/10/2015 4.00% (469)
Piper JaffrayGNMA II 500,000 7/24/2015 10/21/2015 4.50% 78 GNMA II 500,000 9/8/2015 11/19/2015 4.50% (547) FNMA 1,000,000 9/10/2015 10/14/2015 4.50% (781) GNMA II 1,906,049 9/17/2015 10/21/2015 4.00% (11,317) GNMA II 377,272 9/17/2015 10/21/2015 4.50% (766)
29,855,477$
Total deferred outflows of resources - accumulated decrease in fair value of hedging derivatives (151,100)$
Note 4 – Program Loans Receivable Program loans receivable consists of the following at September 30, 2015: Single Family Program Funds, Special Securities (1993 A&B), bearing
interest at 8.50% maturing December 2014, AMBAC insured. 8,363$
Housing Trust Fund, Chickasha Housing - Part 1, bearing interest at 5.00%,loan to be repaid out of 75.00% of cash flow from the property, collateralized by mortgages, maturing September 2023. 195,510
Housing Trust Fund, Chickasha Housing - Part 2, bearing interest at 3.90%,219-month term, collateralized by mortgages, maturing September 2023. 234,275

21
Housing Trust Fund, Verde Investments, bearing interest at 1.00%, 18-month term, maturing April 2017. 163,522
Housing Trust Fund, RJCB and OSAF, bearing interest at 1.00%, 18-month term, maturing July 2016. 262,950
Housing Trust Fund, Mu Min, bearing interest at 1.00%, 18-month term, maturing December 2016. 110,425
Housing Trust Fund, City Rescue Mission, bearing interest at 1.00%, 18-month term, maturing February 2016. 500,000
HOME Investment Partnerships Program, ORO Development Corporation, bearing interest at 0.00%, collateralized by a mortgage; no set term ormaturity date. 300,000
HOME Investment Partnerships Program, Delta-Shellibrook Estates, bearing interest at 0.00%, no set term or maturity date. 255,033
Allowance for doubtful accounts (563,395)
1,466,683$
Note 5 – Capital Assets Capital assets activity for the year ended September 30, 2015, was as follows:
Beginning Balance Additions Retirements
Ending Balance
Capital assets not being depreciated:Land 550,000$ -$ -$ 550,000$
Capital assets being depreciated:Furniture and equipment 3,116,560 356,118 (137,836) 3,334,842 Building 2,409,299 - - 2,409,299 Improvements 1,461,411 102,356 - 1,563,767
Total capital assets being depreciated 6,987,270 458,474 (137,836) 7,307,908
Less accumulated depreciation:Furniture and equipment (2,623,700) (249,776) 137,836 (2,735,640) Building (757,103) (60,233) - (817,336) Improvements (1,184,334) (68,518) - (1,252,852)
Total accumulated depreciation (4,565,137) (378,527) 137,836 (4,805,828)
Total capital assets being depreciated 2,422,133 79,947 - 2,502,080
Capital assets, net 2,972,133$ 79,947$ -$ 3,052,080$
Note 6 – Conduit Debt As indicated in Note 1, the Agency has issued multi-family mortgage revenue bonds to promote the development of adequate residential housing and other economic development. The net proceeds of these bonds are used to provide interim and permanent financing for multi-family construction projects, and establish debt-service reserves as required by the various trust indentures. The bonds are secured by
22
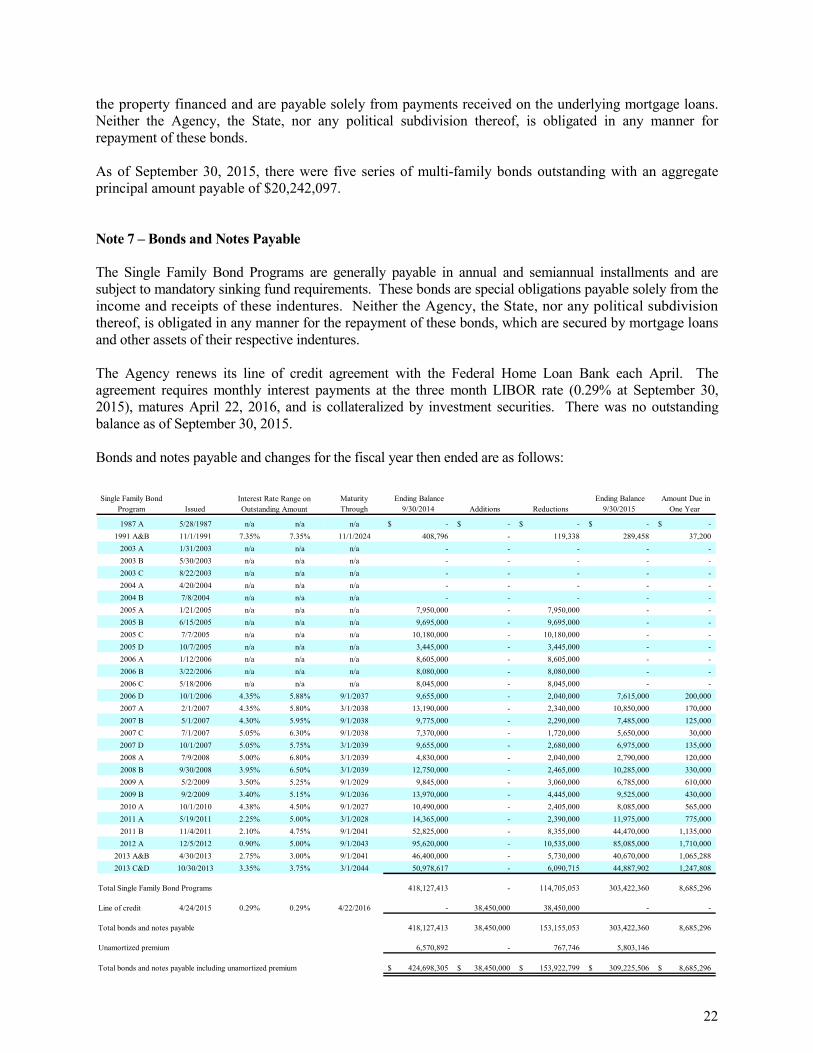
the property financed and are payable solely from payments received on the underlying mortgage loans. Neither the Agency, the State, nor any political subdivision thereof, is obligated in any manner for repayment of these bonds. As of September 30, 2015, there were five series of multi-family bonds outstanding with an aggregate principal amount payable of $20,242,097. Note 7 – Bonds and Notes Payable The Single Family Bond Programs are generally payable in annual and semiannual installments and are subject to mandatory sinking fund requirements. These bonds are special obligations payable solely from the income and receipts of these indentures. Neither the Agency, the State, nor any political subdivision thereof, is obligated in any manner for the repayment of these bonds, which are secured by mortgage loans and other assets of their respective indentures. The Agency renews its line of credit agreement with the Federal Home Loan Bank each April. The agreement requires monthly interest payments at the three month LIBOR rate (0.29% at September 30, 2015), matures April 22, 2016, and is collateralized by investment securities. There was no outstanding balance as of September 30, 2015. Bonds and notes payable and changes for the fiscal year then ended are as follows:
Single Family Bond Program Issued
Maturity Through
Ending Balance 9/30/2014 Additions Reductions
Ending Balance 9/30/2015
Amount Due in One Year
1987 A 5/28/1987 n/a n/a n/a -$ -$ -$ -$ -$ 1991 A&B 11/1/1991 7.35% 7.35% 11/1/2024 408,796 - 119,338 289,458 37,200
2003 A 1/31/2003 n/a n/a n/a - - - - - 2003 B 5/30/2003 n/a n/a n/a - - - - - 2003 C 8/22/2003 n/a n/a n/a - - - - - 2004 A 4/20/2004 n/a n/a n/a - - - - - 2004 B 7/8/2004 n/a n/a n/a - - - - - 2005 A 1/21/2005 n/a n/a n/a 7,950,000 - 7,950,000 - - 2005 B 6/15/2005 n/a n/a n/a 9,695,000 - 9,695,000 - - 2005 C 7/7/2005 n/a n/a n/a 10,180,000 - 10,180,000 - - 2005 D 10/7/2005 n/a n/a n/a 3,445,000 - 3,445,000 - - 2006 A 1/12/2006 n/a n/a n/a 8,605,000 - 8,605,000 - - 2006 B 3/22/2006 n/a n/a n/a 8,080,000 - 8,080,000 - - 2006 C 5/18/2006 n/a n/a n/a 8,045,000 - 8,045,000 - - 2006 D 10/1/2006 4.35% 5.88% 9/1/2037 9,655,000 - 2,040,000 7,615,000 200,000 2007 A 2/1/2007 4.35% 5.80% 3/1/2038 13,190,000 - 2,340,000 10,850,000 170,000 2007 B 5/1/2007 4.30% 5.95% 9/1/2038 9,775,000 - 2,290,000 7,485,000 125,000 2007 C 7/1/2007 5.05% 6.30% 9/1/2038 7,370,000 - 1,720,000 5,650,000 30,000 2007 D 10/1/2007 5.05% 5.75% 3/1/2039 9,655,000 - 2,680,000 6,975,000 135,000 2008 A 7/9/2008 5.00% 6.80% 3/1/2039 4,830,000 - 2,040,000 2,790,000 120,000 2008 B 9/30/2008 3.95% 6.50% 3/1/2039 12,750,000 - 2,465,000 10,285,000 330,000 2009 A 5/2/2009 3.50% 5.25% 9/1/2029 9,845,000 - 3,060,000 6,785,000 610,000 2009 B 9/2/2009 3.40% 5.15% 9/1/2036 13,970,000 - 4,445,000 9,525,000 430,000 2010 A 10/1/2010 4.38% 4.50% 9/1/2027 10,490,000 - 2,405,000 8,085,000 565,000 2011 A 5/19/2011 2.25% 5.00% 3/1/2028 14,365,000 - 2,390,000 11,975,000 775,000 2011 B 11/4/2011 2.10% 4.75% 9/1/2041 52,825,000 - 8,355,000 44,470,000 1,135,000 2012 A 12/5/2012 0.90% 5.00% 9/1/2043 95,620,000 - 10,535,000 85,085,000 1,710,000
2013 A&B 4/30/2013 2.75% 3.00% 9/1/2041 46,400,000 - 5,730,000 40,670,000 1,065,288 2013 C&D 10/30/2013 3.35% 3.75% 3/1/2044 50,978,617 - 6,090,715 44,887,902 1,247,808
Total Single Family Bond Programs 418,127,413 - 114,705,053 303,422,360 8,685,296
Line of credit 4/24/2015 0.29% 0.29% 4/22/2016 - 38,450,000 38,450,000 - -
Total bonds and notes payable 418,127,413 38,450,000 153,155,053 303,422,360 8,685,296
Unamortized premium 6,570,892 - 767,746 5,803,146
Total bonds and notes payable including unamortized premium 424,698,305$ 38,450,000$ 153,922,799$ 309,225,506$ 8,685,296$
Interest Rate Range on Outstanding Amount

23
Debt requirements on bonds and notes payable at September 30, 2015, are as follows (in thousands):
2016 2017 2018 2019 2020 2021-2025 2026-2030 2031-2035 2036-2040 2041+ Total
Principal and interest 20,224$ 20,331$ 20,314$ 20,314$ 20,212$ 99,805$ 91,698$ 83,403$ 65,583$ 22,557$ 464,441$
Less interest 11,539 11,250 10,900 10,530 10,139 44,486 31,377 20,193 9,101 1,503 161,018
Total principal 8,685$ 9,081$ 9,414$ 9,784$ 10,073$ 55,319$ 60,321$ 63,210$ 56,482$ 21,054$ 303,423$
Unamortized premium 5,803
309,226$
Note 8 – Retirement Plans Employees hired prior to July 1, 1997, who elect not to be covered by the Oklahoma Public Employees Retirement Plan (OPERS Plan), are covered by the Oklahoma Housing Finance Agency Retirement Plan (OHFA Plan). The OHFA Plan is a defined contribution plan. No new employees are allowed to join this plan after June 30, 1997. OHFA's contribution amount is at the discretion of the Board of Trustees and does not have any limitations. The Board of Trustees approved a monthly contribution to the OHFA Plan equaling the required contribution for the OPERS plan. The contribution to the OHFA plan was 15.5% of allowable compensation beginning July 1, 2009, and increased to 16.5% of allowable compensation July 1, 2011. All employees hired after June 30, 1997, are required to participate in the OPERS Plan. Note 9 – Defined Benefit Pension Plans Oklahoma Public Employees Retirement System Plan description Oklahoma Housing Finance Agency participates in the Oklahoma Public Employees Retirement System (OPERS), a cost-sharing multiple-employer defined benefit pension for many state employees in Oklahoma. OPERS is a multiple employer, cost sharing public employee retirement plan, which is a defined benefit pension plan. It covers substantially all employees of the State of Oklahoma (the State) except those covered by six other plans sponsored by the State and also covers employees of participating counties and local agencies. The employee and employer contribution rates for each member category are established by the Oklahoma Legislature after recommendation by the OPERS Board of Trustees based on an actuarial calculation which is performed to determine the adequacy of such contribution rates. All OHFA employees hired on or after July 1, 1997, are covered by the system. Pension plan fiduciary net position Detailed information about OPERS fiduciary net position is available in a separately issued Comprehensive Annual Financial Report that includes financial statements and required supplemental information. That report may be obtained on the Internet at http://www.opers.ok.gov/Websites/opers/images/pdfs/CAFR-2014-OPERS.pdf; P.O Box 53007, Oklahoma City, OK 73152-3007; and telephone (800) 733-9008. Benefits provided OPERS provides retirement benefits, to eligible employees (and their beneficiaries) of many state employees in Oklahoma. Members qualify for full retirement benefits at their specified normal retirement age or, depending upon when they became members, when the sum of the member's age and years of credited service equals 80 or 90. Generally, benefits for state, county, and local agency employees are determined at 2% of the average salary, as defined, multiplied by the number of years of credited service. Members may elect to pay an additional contribution rate to receive benefits using a 2.5% factor for each full year the additional contributions are made.

24
Contributions The contribution rates for each member category of the Plan are established by the Oklahoma Legislature after recommendation by the OPERS Board based on an actuarial calculation, which is performed to determine the adequacy of such contribution rates. Each member participates based on their qualifying gross salary earned, excluding overtime. There is no cap on the qualifying gross salary earned, subject to Internal Revenue Service (IRS) limitations on compensation. The following contribution rates were in effect for State, County, and Local Agency Employees: For 2015 and 2014, state agency employers contributed 16.5% on all salary, and state employees contributed 3.5% on all salary. Contractually required contribution 690,554$ Contributions in relation to the contractually required contribution (690,554)
Contribution deficiency (excess) -$
Agency's covered-employee payroll 4,185,176$
Contributions as a percentage of covered-employee payroll 17%
Actuarial methods and assumptions The total pension liability in the June 30, 2014 (OPERS year-end) actuarial valuation prepared as of July 1, 2014, using the following actuarial assumptions:
• Investment return – 7.5% compounded annually for a net investment expense and including inflation
• Salary increases – 4.5% to 7.4% per year including inflation • Mortality rates – active participants and nondisabled pensioners – RP-2000 Mortality Table
projected to 2010 by Scale AA (disable pensioners set forward 15 years) • No annual post-retirement benefit increases • Assumed inflation rate – 3% • Payroll Growth – 4% per year • Actuarial cost method – entry age • Selection period for the termination of employment assumptions – 10 years
The actuarial assumptions used in the July 1, 2014, valuation are based on the results of the most recent actuarial expense study, which cover the three-year period ending June 30, 2013. The experience study report is dated May 9, 2014. The long-term expected rate of return on pension plan investments was determined using a log-normal distribution analysis in which best estimate ranges of expected future real rates of return (expected returns, net of pension plan investment expense and inflation) are developed for each major asset class. These ranges are combined to produce the long-term expected rate of return by weighting the expected future real rates of return by the target asset allocation percentage and by adding expected inflation.
25
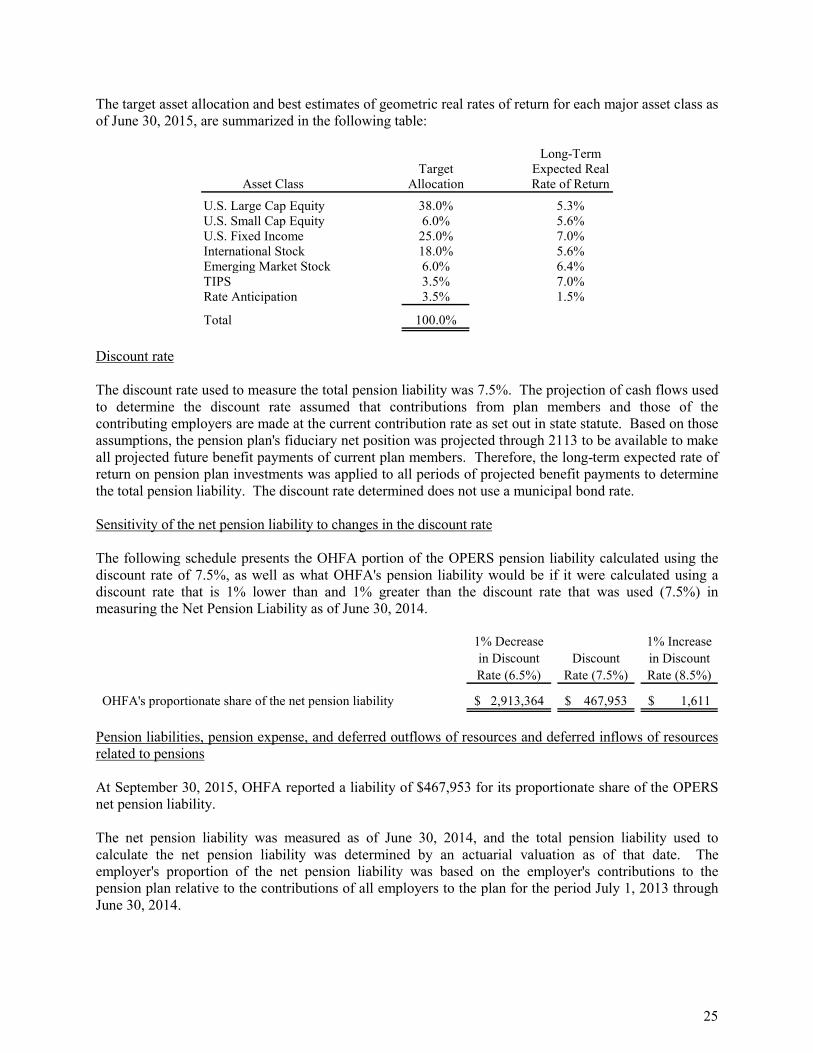
The target asset allocation and best estimates of geometric real rates of return for each major asset class as of June 30, 2015, are summarized in the following table:
Long-TermTarget Expected Real
Asset Class Allocation Rate of Return
U.S. Large Cap Equity 38.0% 5.3%U.S. Small Cap Equity 6.0% 5.6%U.S. Fixed Income 25.0% 7.0%International Stock 18.0% 5.6%Emerging Market Stock 6.0% 6.4%TIPS 3.5% 7.0%Rate Anticipation 3.5% 1.5%
Total 100.0%
Discount rate The discount rate used to measure the total pension liability was 7.5%. The projection of cash flows used to determine the discount rate assumed that contributions from plan members and those of the contributing employers are made at the current contribution rate as set out in state statute. Based on those assumptions, the pension plan's fiduciary net position was projected through 2113 to be available to make all projected future benefit payments of current plan members. Therefore, the long-term expected rate of return on pension plan investments was applied to all periods of projected benefit payments to determine the total pension liability. The discount rate determined does not use a municipal bond rate. Sensitivity of the net pension liability to changes in the discount rate The following schedule presents the OHFA portion of the OPERS pension liability calculated using the discount rate of 7.5%, as well as what OHFA's pension liability would be if it were calculated using a discount rate that is 1% lower than and 1% greater than the discount rate that was used (7.5%) in measuring the Net Pension Liability as of June 30, 2014.
1% Decrease in Discount Rate (6.5%)
Discount Rate (7.5%)
1% Increase in Discount Rate (8.5%)
OHFA's proportionate share of the net pension liability 2,913,364$ 467,953$ 1,611$
Pension liabilities, pension expense, and deferred outflows of resources and deferred inflows of resources related to pensions At September 30, 2015, OHFA reported a liability of $467,953 for its proportionate share of the OPERS net pension liability. The net pension liability was measured as of June 30, 2014, and the total pension liability used to calculate the net pension liability was determined by an actuarial valuation as of that date. The employer's proportion of the net pension liability was based on the employer's contributions to the pension plan relative to the contributions of all employers to the plan for the period July 1, 2013 through June 30, 2014.

26
The amount recognized by the Agency as its proportionate share of the net pension liability and the total portion of the net pension liability that was associated with the Agency were as follows: Agency's proportion of the net pension liability (asset) 0.25%Agency's proportionate share of the net pension liability (asset) 467,953$ Agency's covered-employee payroll 4,185,176$ Agency's proportionate share of the net pension liability (asset) as a percentage of its covered-employee payroll 11.18%Plan fiduciary net position as a percentage of the total pension liability 97.9%
At September 30, 2015, OHFA reported its proportionate share of the OPERS deferred outflows of resources and deferred inflows of resources related to pensions from the following sources:
Deferred Inflows ofResources
Differences between expected and actual economic experience -$ (154,927)$ Changes in actuarial assumptions 26,779 - Difference between projected and actual investment earnings - (1,563,881) Contributions paid to OPERS subsequent to the measurement date 690,554 -
Total 717,333$ (1,718,808)$
Deferred Outflows ofResources
Deferred outflows of resources of $690,554 related to pensions resulting from OHFA contributions subsequent to the measurement date June 30, 2014, will be recognized as a reduction of the net pension liability in the year ended September 30, 2016. Other amounts reported as deferred outflows of resources and deferred inflows of resources related to pensions will be recognized in pension expense as follows:
Year ended PensionSeptember 30 Expense
2016 321,319$ 2017 321,319 2018 321,319 2019 321,319 2020 321,319
Thereafter 85,430 Note 10 – Risk Management OHFA is exposed to various risks of loss related to torts; theft of, damage to, and destruction to assets; errors and omissions; injuries to employees; and natural disasters. OHFA pays an annual premium to a private insurance carrier for its tort liability, property loss, workers' compensation, and general liability insurance coverage. OHFA purchases commercial employee life insurance and pays an annual premium to the Oklahoma State and Education Employers Group Insurance Board for its employee health insurance coverage. There has not been any significant reduction in insurance coverage from the prior year. Settled claims resulting from these risks have not exceeded insurance coverage in any of the past three fiscal years, in the opinion of management. The Agency is not subject to significant risk of loss with respect to the above risks.
27
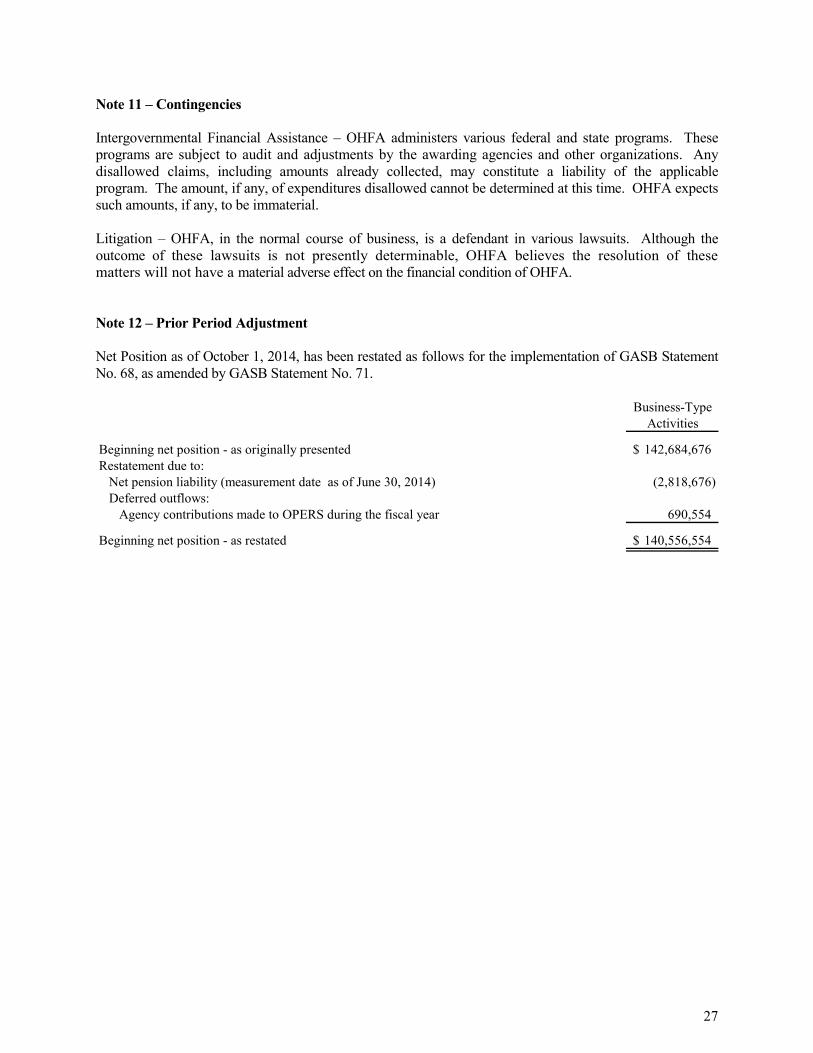
Note 11 – Contingencies Intergovernmental Financial Assistance – OHFA administers various federal and state programs. These programs are subject to audit and adjustments by the awarding agencies and other organizations. Any disallowed claims, including amounts already collected, may constitute a liability of the applicable program. The amount, if any, of expenditures disallowed cannot be determined at this time. OHFA expects such amounts, if any, to be immaterial. Litigation – OHFA, in the normal course of business, is a defendant in various lawsuits. Although the outcome of these lawsuits is not presently determinable, OHFA believes the resolution of these matters will not have a material adverse effect on the financial condition of OHFA. Note 12 – Prior Period Adjustment Net Position as of October 1, 2014, has been restated as follows for the implementation of GASB Statement No. 68, as amended by GASB Statement No. 71.
Business-TypeActivities
Beginning net position - as originally presented 142,684,676$ Restatement due to:
Net pension liability (measurement date as of June 30, 2014) (2,818,676) Deferred outflows:
Agency contributions made to OPERS during the fiscal year 690,554
Beginning net position - as restated 140,556,554$

SUPPLEMENTAL INFORMATION
11600 Broadway Ext., Suite 300, Oklahoma City, OK 73114 P 405.848.2020 F 405.848.7359 www.hogantaylor.com
28
INDEPENDENT AUDITOR'S REPORT ON SUPPLEMENTAL INFORMATION To the Board of Trustees Oklahoma Housing Finance Agency We have audited the financial statements of Oklahoma Housing Finance Agency (the Agency, or OHFA) as of and for the year ended September 30, 2015, and have issued our report thereon, dated January 27, 2016, which expressed an unmodified opinion on those financial statements. Our audit was performed for the purpose of forming an opinion on the financial statements as a whole. We have not performed any procedures with respect to the audited financial statements subsequent to January 27, 2016. The accompanying supplemental information is presented for purposes of additional analysis and is not a required part of the financial statements. Such information is the responsibility of management and was derived from and relates directly to the underlying accounting and other records used to prepare the financial statements. The information has been subjected to the auditing procedures applied in the audit of the financial statements and certain additional procedures, including comparing and reconciling such information directly to the underlying accounting and other records used to prepare the financial statements or to the financial statements themselves, and other additional procedures in accordance with auditing standards generally accepted in the United States of America. In our opinion, the information is fairly stated in all material respects in relation to the financial statements as a whole.
January 27, 2016

See independent auditor's report on supplemental information. 29
OKLAHOMA HOUSING FINANCE AGENCY
SINGLE FAMILY MORTGAGE REVENUE BOND PROGRAMS
SUPPLEMENTAL COMBINING STATEMENT OF NET POSITION
September 30, 2015
1994 MasterIndenture
1991 Accumulation 2005 2005 2005 2005 2006Series A&B Fund Series A Series B Series C Series D Series A
AssetsNoncurrent assets: Cash and cash equivalents 4,905$ 13,683,525$ -$ -$ -$ -$ -$ Investments 298,839 31,989,383 - - - - - Interest receivable 1,788 127,480 - - - - -
Total assets 305,532 45,800,388 - - - - -
LiabilitiesCurrent liabilities: Accounts payable - - - - - - - Interest payable 1,773 - - - - - - Current maturities of bonds payable 37,200 - - - - - -
Total current liabilities 38,973 - - - - - -
Noncurrent liabilities: Bonds payable, less current maturities 252,258 - - - - - -
Total liabilities 291,231 - - - - - -
Net PositionRestricted for single family bond programs 14,301$ 45,800,388$ -$ -$ -$ -$ -$

See independent auditor's report on supplemental information. 30
OKLAHOMA HOUSING FINANCE AGENCY
SINGLE FAMILY MORTGAGE REVENUE BOND PROGRAMS
SUPPLEMENTAL COMBINING STATEMENT OF NET POSITION (continued)
September 30, 2015
2006 2006 2006 2007 2007 2007 2007Series B Series C Series D Series A Series B Series C Series D
AssetsNoncurrent assets: Cash and cash equivalents -$ -$ 252,586$ 607,429$ 225,888$ 207,484$ 400,520$ Investments - - 9,300,879 12,146,653 8,667,718 6,480,929 8,070,613 Interest receivable - - 39,363 51,592 37,112 29,090 35,036
Total assets - - 9,592,828 12,805,674 8,930,718 6,717,503 8,506,169
LiabilitiesCurrent liabilities: Accounts payable - - 1,166 4,130 1,074 786 1,032 Interest payable - - 31,985 45,114 32,353 27,109 31,469 Current maturities of bonds payable - - 200,000 170,000 125,000 30,000 135,000
Total current liabilities - - 233,151 219,244 158,427 57,895 167,501
Noncurrent liabilities: Bonds payable, less current maturities - - 7,415,000 10,680,000 7,360,000 5,620,000 6,840,000
Total liabilities - - 7,648,151 10,899,244 7,518,427 5,677,895 7,007,501
Net PositionRestricted for single family bond programs -$ -$ 1,944,677$ 1,906,430$ 1,412,291$ 1,039,608$ 1,498,668$
See independent auditor's report on supplemental information. 31
OKLAHOMA HOUSING FINANCE AGENCY
SINGLE FAMILY MORTGAGE REVENUE BOND PROGRAMS
SUPPLEMENTAL COMBINING STATEMENT OF NET POSITION (continued)
September 30, 2015
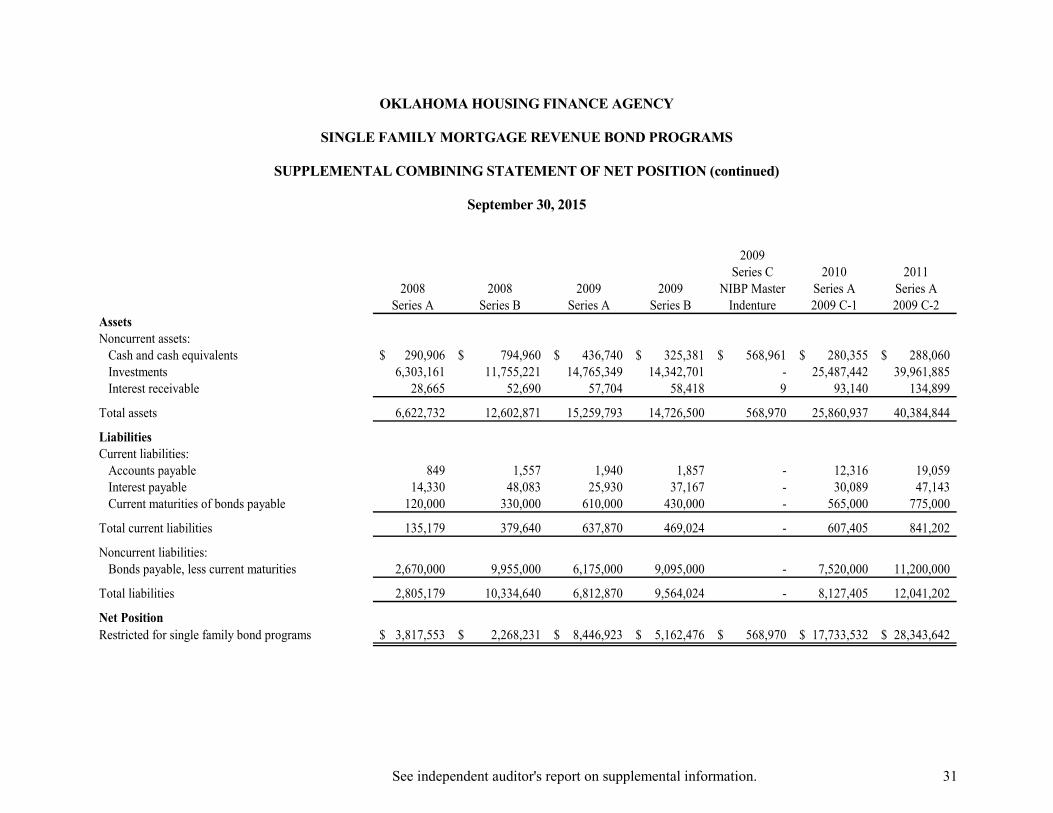
2009Series C 2010 2011
2008 2008 2009 2009 NIBP Master Series A Series ASeries A Series B Series A Series B Indenture 2009 C-1 2009 C-2
AssetsNoncurrent assets: Cash and cash equivalents 290,906$ 794,960$ 436,740$ 325,381$ 568,961$ 280,355$ 288,060$ Investments 6,303,161 11,755,221 14,765,349 14,342,701 - 25,487,442 39,961,885 Interest receivable 28,665 52,690 57,704 58,418 9 93,140 134,899
Total assets 6,622,732 12,602,871 15,259,793 14,726,500 568,970 25,860,937 40,384,844
LiabilitiesCurrent liabilities: Accounts payable 849 1,557 1,940 1,857 - 12,316 19,059 Interest payable 14,330 48,083 25,930 37,167 - 30,089 47,143 Current maturities of bonds payable 120,000 330,000 610,000 430,000 - 565,000 775,000
Total current liabilities 135,179 379,640 637,870 469,024 - 607,405 841,202
Noncurrent liabilities: Bonds payable, less current maturities 2,670,000 9,955,000 6,175,000 9,095,000 - 7,520,000 11,200,000
Total liabilities 2,805,179 10,334,640 6,812,870 9,564,024 - 8,127,405 12,041,202
Net PositionRestricted for single family bond programs 3,817,553$ 2,268,231$ 8,446,923$ 5,162,476$ 568,970$ 17,733,532$ 28,343,642$
See independent auditor's report on supplemental information. 32
OKLAHOMA HOUSING FINANCE AGENCY
SINGLE FAMILY MORTGAGE REVENUE BOND PROGRAMS
SUPPLEMENTAL COMBINING STATEMENT OF NET POSITION (continued)
September 30, 2015
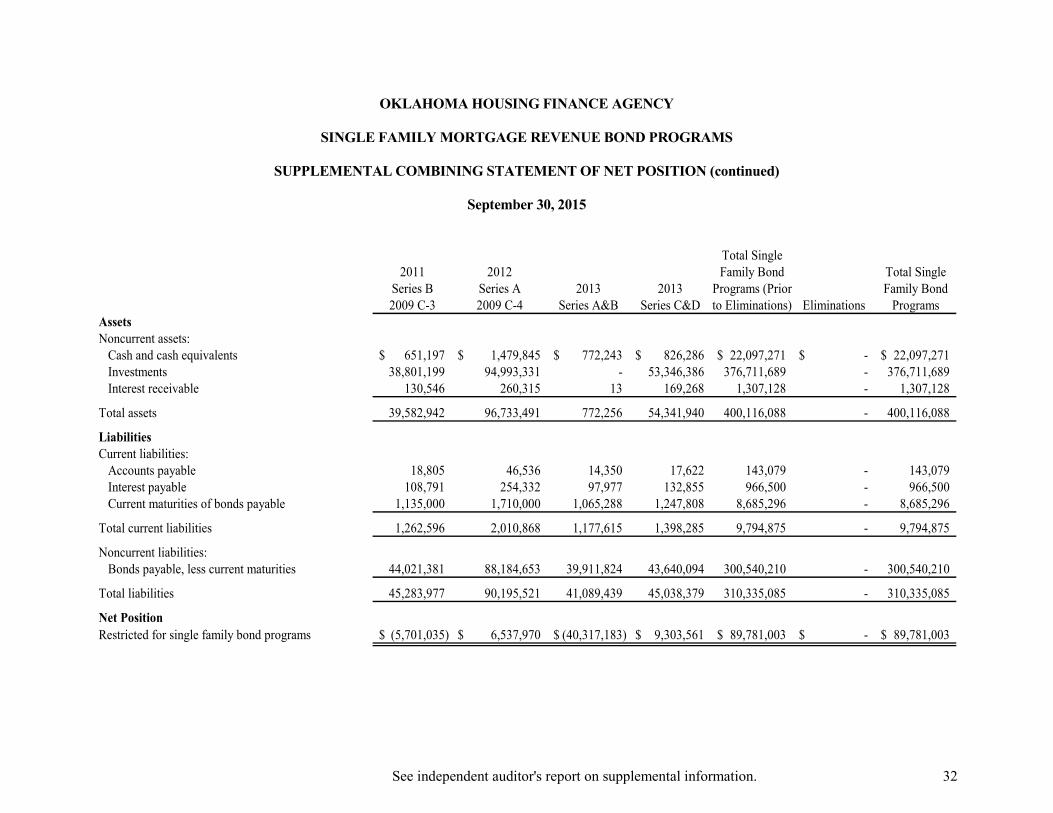
Total Single2011 2012 Family Bond Total Single
Series B Series A 2013 2013 Programs (Prior Family Bond2009 C-3 2009 C-4 Series A&B Series C&D to Eliminations) Eliminations Programs
AssetsNoncurrent assets: Cash and cash equivalents 651,197$ 1,479,845$ 772,243$ 826,286$ 22,097,271$ -$ 22,097,271$ Investments 38,801,199 94,993,331 - 53,346,386 376,711,689 - 376,711,689 Interest receivable 130,546 260,315 13 169,268 1,307,128 - 1,307,128
Total assets 39,582,942 96,733,491 772,256 54,341,940 400,116,088 - 400,116,088
LiabilitiesCurrent liabilities: Accounts payable 18,805 46,536 14,350 17,622 143,079 - 143,079 Interest payable 108,791 254,332 97,977 132,855 966,500 - 966,500 Current maturities of bonds payable 1,135,000 1,710,000 1,065,288 1,247,808 8,685,296 - 8,685,296
Total current liabilities 1,262,596 2,010,868 1,177,615 1,398,285 9,794,875 - 9,794,875
Noncurrent liabilities: Bonds payable, less current maturities 44,021,381 88,184,653 39,911,824 43,640,094 300,540,210 - 300,540,210
Total liabilities 45,283,977 90,195,521 41,089,439 45,038,379 310,335,085 - 310,335,085
Net PositionRestricted for single family bond programs (5,701,035)$ 6,537,970$ (40,317,183)$ 9,303,561$ 89,781,003$ -$ 89,781,003$

See independent auditor's report on supplemental information. 33
OKLAHOMA HOUSING FINANCE AGENCY
SINGLE FAMILY MORTGAGE REVENUE BOND PROGRAMS
SUPPLEMENTAL COMBINING STATEMENT OF REVENUES, EXPENSES AND CHANGES IN NET POSITION
Year ended September 30, 2015
1994 MasterIndenture
1991 Accumulation 2005 2005 2005 2005 2006Series A&B Fund Series A Series B Series C Series D Series A
Operating RevenuesInvestment income 27,419$ 1,092,087$ 173,142$ 233,018$ 200,254$ 73,399$ 410,164$ Program loan income - 7,826 - - - - - Net increase (decrease) in fair value
of investments (18,104) (265,690) - - - - - Gain on sale of investment - - 222,969 288,243 270,539 88,067 (13,857) Other income - 406 - - - - -
Total operating revenues 9,315 834,629 396,111 521,261 470,793 161,466 396,307
Operating ExpensesInterest on bonds payable 25,901 - 161,626 196,344 206,919 74,068 364,204 Mortgage servicing fees 1,763 84,170 16,471 22,080 18,535 6,924 36,695 Trustees, issuer and other fees 511 34,108 4,768 7,531 7,061 1,068 11,538 Homebuyers assistance payments - - - - - - - Bond issue costs - - - - - - - Other general and administrative - - - 24,450 - - 17,300
Total operating expenses 28,175 118,278 182,865 250,405 232,515 82,060 429,737
Operating income (loss) before transfers (18,860) 716,351 213,246 270,856 238,278 79,406 (33,430)
Equity transfers in (out) - 14,715,023 (1,832,284) (3,138,619) (2,179,396) (818,610) (1,750,807) Operating transfers in (out) - - - - - - -
Changes in Net Position (18,860) 15,431,374 (1,619,038) (2,867,763) (1,941,118) (739,204) (1,784,237)
Total net position, beginning of year 33,161 30,369,014 1,619,038 2,867,763 1,941,118 739,204 1,784,237
Total net position, end of year 14,301$ 45,800,388$ -$ -$ -$ -$ -$

See independent auditor's report on supplemental information. 34
OKLAHOMA HOUSING FINANCE AGENCY
SINGLE FAMILY MORTGAGE REVENUE BOND PROGRAMS
SUPPLEMENTAL COMBINING STATEMENT OF REVENUES, EXPENSES AND CHANGES IN NET POSITION (continued)
Year ended September 30, 2015
2006 2006 2006 2007 2007 2007 2007Series B Series C Series D Series A Series B Series C Series D
Operating RevenuesInvestment income 504,063$ 425,206$ 589,142$ 743,764$ 536,672$ 417,116$ 520,188$ Program loan income - - - - - - - Net increase (decrease) in fair value
of investments - - (141,538) (158,839) (133,067) (123,946) (263,724) Gain on sale of investment 78,038 10,586 - - - - - Other income - - - - - - -
Total operating revenues 582,101 435,792 447,604 584,925 403,605 293,170 256,464
Operating ExpensesInterest on bonds payable 353,615 373,788 459,697 626,756 480,360 388,041 466,421 Mortgage servicing fees 41,507 36,155 45,716 60,763 43,552 31,853 41,526 Trustees, issuer and other fees 30,929 14,997 20,421 63,147 19,550 15,227 18,618 Homebuyers assistance payments - - - - - - - Bond issue costs - - - - - - - Other general and administrative - - - - - - -
Total operating expenses 426,051 424,940 525,834 750,666 543,462 435,121 526,565
Operating income (loss) before transfers 156,050 10,852 (78,230) (165,741) (139,857) (141,951) (270,101)
Equity transfers in (out) (3,249,142) (2,142,799) - - - - - Operating transfers in (out) - - - - - - -
Changes in Net Position (3,093,092) (2,131,947) (78,230) (165,741) (139,857) (141,951) (270,101)
Total net position, beginning of year 3,093,092 2,131,947 2,022,907 2,072,171 1,552,148 1,181,559 1,768,769
Total net position, end of year -$ -$ 1,944,677$ 1,906,430$ 1,412,291$ 1,039,608$ 1,498,668$
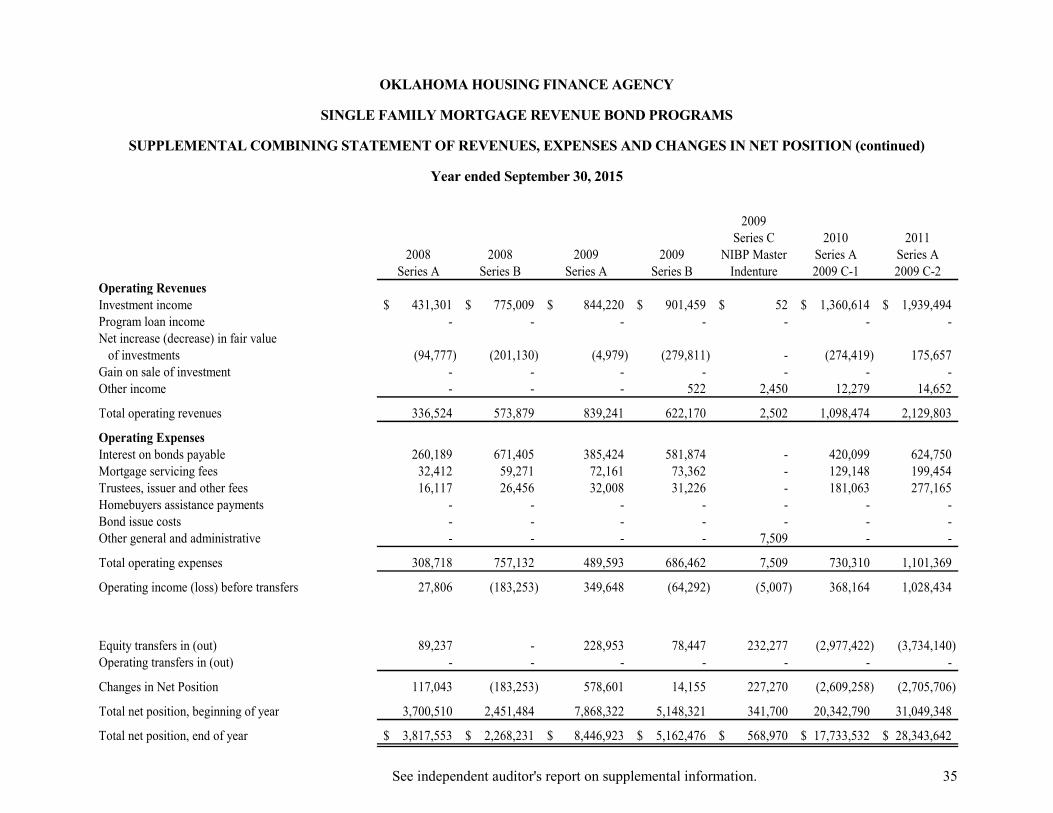
See independent auditor's report on supplemental information. 35
OKLAHOMA HOUSING FINANCE AGENCY
SINGLE FAMILY MORTGAGE REVENUE BOND PROGRAMS
SUPPLEMENTAL COMBINING STATEMENT OF REVENUES, EXPENSES AND CHANGES IN NET POSITION (continued)
Year ended September 30, 2015
2009Series C 2010 2011
2008 2008 2009 2009 NIBP Master Series A Series ASeries A Series B Series A Series B Indenture 2009 C-1 2009 C-2
Operating RevenuesInvestment income 431,301$ 775,009$ 844,220$ 901,459$ 52$ 1,360,614$ 1,939,494$ Program loan income - - - - - - - Net increase (decrease) in fair value
of investments (94,777) (201,130) (4,979) (279,811) - (274,419) 175,657 Gain on sale of investment - - - - - - - Other income - - - 522 2,450 12,279 14,652
Total operating revenues 336,524 573,879 839,241 622,170 2,502 1,098,474 2,129,803
Operating ExpensesInterest on bonds payable 260,189 671,405 385,424 581,874 - 420,099 624,750 Mortgage servicing fees 32,412 59,271 72,161 73,362 - 129,148 199,454 Trustees, issuer and other fees 16,117 26,456 32,008 31,226 - 181,063 277,165 Homebuyers assistance payments - - - - - - - Bond issue costs - - - - - - - Other general and administrative - - - - 7,509 - -
Total operating expenses 308,718 757,132 489,593 686,462 7,509 730,310 1,101,369
Operating income (loss) before transfers 27,806 (183,253) 349,648 (64,292) (5,007) 368,164 1,028,434
Equity transfers in (out) 89,237 - 228,953 78,447 232,277 (2,977,422) (3,734,140) Operating transfers in (out) - - - - - - -
Changes in Net Position 117,043 (183,253) 578,601 14,155 227,270 (2,609,258) (2,705,706)
Total net position, beginning of year 3,700,510 2,451,484 7,868,322 5,148,321 341,700 20,342,790 31,049,348
Total net position, end of year 3,817,553$ 2,268,231$ 8,446,923$ 5,162,476$ 568,970$ 17,733,532$ 28,343,642$
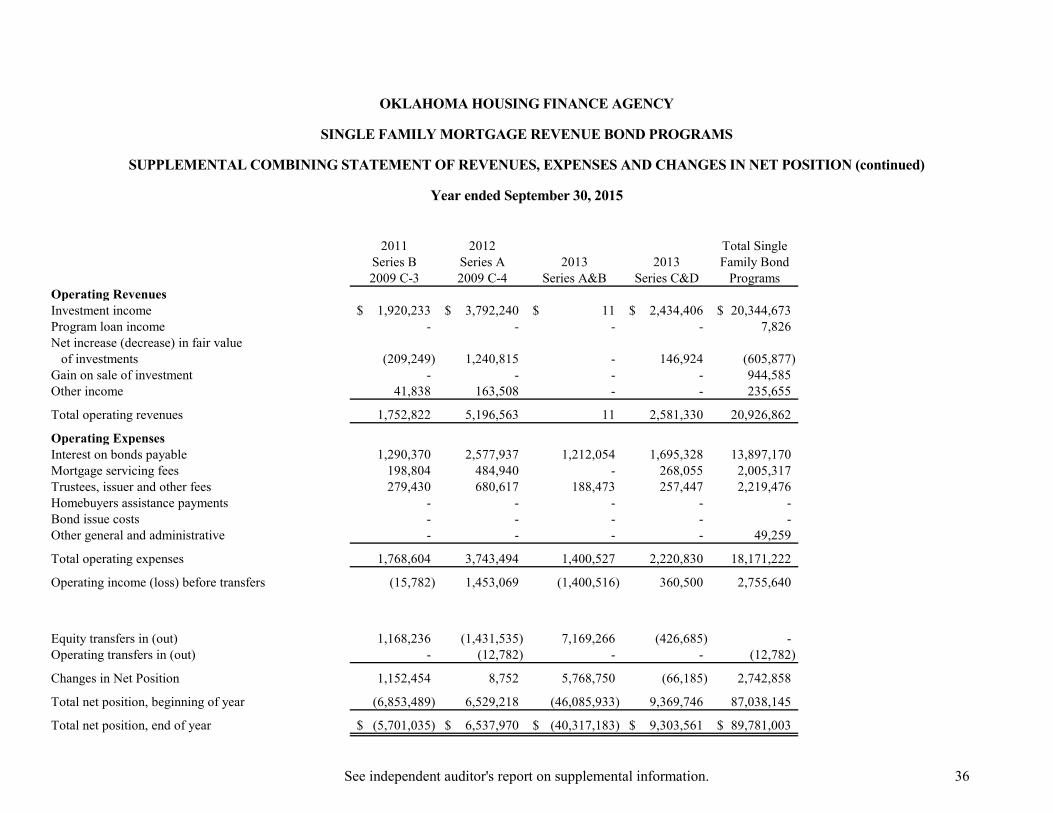
See independent auditor's report on supplemental information. 36
OKLAHOMA HOUSING FINANCE AGENCY
SINGLE FAMILY MORTGAGE REVENUE BOND PROGRAMS
SUPPLEMENTAL COMBINING STATEMENT OF REVENUES, EXPENSES AND CHANGES IN NET POSITION (continued)
Year ended September 30, 2015
2011 2012 Total SingleSeries B Series A 2013 2013 Family Bond2009 C-3 2009 C-4 Series A&B Series C&D Programs
Operating RevenuesInvestment income 1,920,233$ 3,792,240$ 11$ 2,434,406$ 20,344,673$ Program loan income - - - - 7,826 Net increase (decrease) in fair value
of investments (209,249) 1,240,815 - 146,924 (605,877) Gain on sale of investment - - - - 944,585 Other income 41,838 163,508 - - 235,655
Total operating revenues 1,752,822 5,196,563 11 2,581,330 20,926,862
Operating ExpensesInterest on bonds payable 1,290,370 2,577,937 1,212,054 1,695,328 13,897,170 Mortgage servicing fees 198,804 484,940 - 268,055 2,005,317 Trustees, issuer and other fees 279,430 680,617 188,473 257,447 2,219,476 Homebuyers assistance payments - - - - - Bond issue costs - - - - - Other general and administrative - - - - 49,259
Total operating expenses 1,768,604 3,743,494 1,400,527 2,220,830 18,171,222
Operating income (loss) before transfers (15,782) 1,453,069 (1,400,516) 360,500 2,755,640
Equity transfers in (out) 1,168,236 (1,431,535) 7,169,266 (426,685) - Operating transfers in (out) - (12,782) - - (12,782)
Changes in Net Position 1,152,454 8,752 5,768,750 (66,185) 2,742,858
Total net position, beginning of year (6,853,489) 6,529,218 (46,085,933) 9,369,746 87,038,145
Total net position, end of year (5,701,035)$ 6,537,970$ (40,317,183)$ 9,303,561$ 89,781,003$

See independent auditor's report on supplemental information. 37
OKLAHOMA HOUSING FINANCE AGENCY
SUPPLEMENTAL COMBINING STATEMENT OF NET POSITION
September 30, 2015
Single Family AgencyBond General Combined
Programs Fund Eliminations TotalsAssetsCurrent assets:
Cash and cash equivalents -$ 11,877,708$ -$ 11,877,708$ Investments - 8,041,673 - 8,041,673 Accounts receivable (net of an
allowance for doubtful accounts of $644,346 ) - 244,973 (143,079) 101,894
Accounts receivable - U.S. Department of Housingand Urban Development - 448,920 - 448,920
Prepaid expenses - 334,105 - 334,105 Interest receivable - 122,100 - 122,100
Total current assets - 21,069,479 (143,079) 20,926,400
Noncurrent assets:Restricted assets:
Cash and cash equivalents 22,097,271 - - 22,097,271 Investments 376,711,689 - - 376,711,689 Interest receivable 1,307,128 - - 1,307,128 Program loans receivable (net of an allowance of $563,395) - 1,466,683 - 1,466,683
Long-term investments - 37,381,455 - 37,381,455 Nondepreciated capital assets - 550,000 - 550,000 Capital assets, net - 2,502,080 - 2,502,080
Total noncurrent assets 400,116,088 41,900,218 - 442,016,306
Total assets 400,116,088 62,969,697 (143,079) 462,942,706
Deferred outflows of resources: Pension - 717,333 717,333 Accumulated decrease in fair value of hedging derivatives - 151,100 - 151,100
Total deferred outflows of resources - 868,433 - 868,433
LiabilitiesCurrent liabilities:
Salaries and related expenses - 556,729 - 556,729 Accounts payable - vendors and contractors - 217,537 - 217,537 Accounts Payable - U.S. Department of Housing
and Urban Development - 19,745 - 19,745 Accounts payable - Family Self Sufficiency Program - 430,550 - 430,550 Accounts payable - other 143,079 146,389 (143,079) 146,389 Hedging payable - 151,100 - 151,100 Unearned revenue - 393,330 - 393,330 Compensated absences - 807,519 - 807,519 Interest payable 966,500 172 - 966,672 Current maturities of bonds and notes payable 8,685,296 - - 8,685,296
Total current liabilities 9,794,875 2,723,071 (143,079) 12,374,867
Noncurrent liabilities: Pension liability - 467,953 - 467,953
Bonds and notes payable, less current maturities 300,540,210 - - 300,540,210
Total noncurrent liabilities 300,540,210 467,953 - 301,008,163
Total liabilities 310,335,085 3,191,024 (143,079) 313,383,030
Deferred inflows of resources: Pension - 1,718,808 - 1,718,808
Net PositionInvested in capital assets - 3,052,080 - 3,052,080 Restricted for single family bond programs 89,781,003 - - 89,781,003 Restricted for Section 8 Voucher Program - 326,277 - 326,277 Unrestricted - 55,549,941 - 55,549,941
Total net position 89,781,003$ 58,928,298$ -$ 148,709,301$
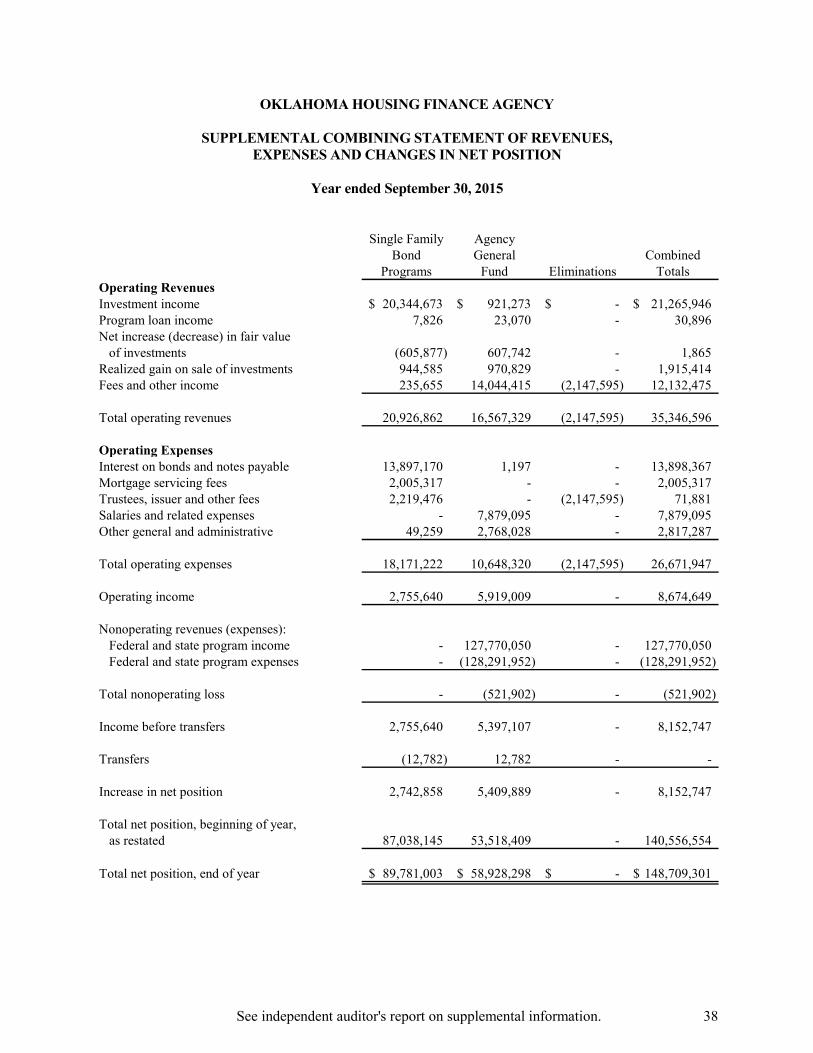
See independent auditor's report on supplemental information. 38
OKLAHOMA HOUSING FINANCE AGENCY
SUPPLEMENTAL COMBINING STATEMENT OF REVENUES, EXPENSES AND CHANGES IN NET POSITION
Year ended September 30, 2015
Single Family AgencyBond General Combined
Programs Fund Eliminations TotalsOperating RevenuesInvestment income 20,344,673$ 921,273$ -$ 21,265,946$ Program loan income 7,826 23,070 - 30,896 Net increase (decrease) in fair value
of investments (605,877) 607,742 - 1,865 Realized gain on sale of investments 944,585 970,829 - 1,915,414 Fees and other income 235,655 14,044,415 (2,147,595) 12,132,475
Total operating revenues 20,926,862 16,567,329 (2,147,595) 35,346,596
Operating ExpensesInterest on bonds and notes payable 13,897,170 1,197 - 13,898,367 Mortgage servicing fees 2,005,317 - - 2,005,317 Trustees, issuer and other fees 2,219,476 - (2,147,595) 71,881 Salaries and related expenses - 7,879,095 - 7,879,095 Other general and administrative 49,259 2,768,028 - 2,817,287
Total operating expenses 18,171,222 10,648,320 (2,147,595) 26,671,947
Operating income 2,755,640 5,919,009 - 8,674,649
Nonoperating revenues (expenses):Federal and state program income - 127,770,050 - 127,770,050 Federal and state program expenses - (128,291,952) - (128,291,952)
Total nonoperating loss - (521,902) - (521,902)
Income before transfers 2,755,640 5,397,107 - 8,152,747
Transfers (12,782) 12,782 - -
Increase in net position 2,742,858 5,409,889 - 8,152,747
Total net position, beginning of year,as restated 87,038,145 53,518,409 - 140,556,554
Total net position, end of year 89,781,003$ 58,928,298$ -$ 148,709,301$

See independent auditor's report on supplemental information. 39
OKLAHOMA HOUSING FINANCE AGENCY
SUPPLEMENTAL COMBINING STATEMENT OF CASH FLOWS
Year ended September 30, 2015 Single Family Agency
Bond General CombinedPrograms Fund Eliminations Totals
Cash Flows from Operating ActivitiesReceipts (payments) from (of) fees 235,655$ 13,477,719$ (2,147,595)$ 11,565,779$ Receipts from program loan payments - 23,070 - 23,070 Receipts from other sources - 276,975 - 276,975 Payments to employees - (8,002,449) - (8,002,449) Payments to suppliers - (2,440,585) - (2,440,585) Payment for purchases of program loans - (974,492) - (974,492) Payments for bond fees (2,034,581) - - (2,034,581) Payments for trustee and other fees (2,268,735) - 2,147,595 (121,140)
Net cash provided by (used in) operating activities (4,067,661) 2,360,238 - (1,707,423)
Cash Flows from Noncapital Financing ActivitiesProceeds from issuance of bonds and notes payable - 38,450,000 - 38,450,000 Principal paid on bonds and notes payable (115,472,799) (38,450,000) - (153,922,799) Interest paid on bonds and notes payable (14,329,346) (1,025) - (14,330,371) Receipt of federal and state program income - 127,770,050 - 127,770,050 Payment of federal and state program expenses - (128,291,952) - (128,291,952) Transfers (12,782) 12,782 - -
Net cash used in noncapital financing activities (129,814,927) (510,145) - (130,325,072)
Cash Flows from Capital and Related Financing ActivitiesAcquisition of capital assets - (458,474) - (458,474)
Net cash used in capital and related financing activities - (458,474) - (458,474)
Cash Flows from Investing ActivitiesPurchase of investments (29,109,096) (107,881,903) - (136,990,999) Proceeds from sales and maturities of investments 138,459,124 88,320,335 - 226,779,459 Interest received on investments 20,805,371 861,981 - 21,667,352
Net cash provided by investing activities 130,155,399 (18,699,587) - 111,455,812
Net decrease in cash (3,727,189) (17,307,968) - (21,035,157)
Cash and cash equivalents, beginning of year 25,824,460 29,185,676 - 55,010,136
Cash and cash equivalents, end of year 22,097,271$ 11,877,708$ -$ 33,974,979$
Cash and Cash Equivalents as Reported inStatement of Net Position
Unrestricted -$ 11,877,708$ -$ 11,877,708$ Restricted 22,097,271 - - 22,097,271
22,097,271$ 11,877,708$ -$ 33,974,979$
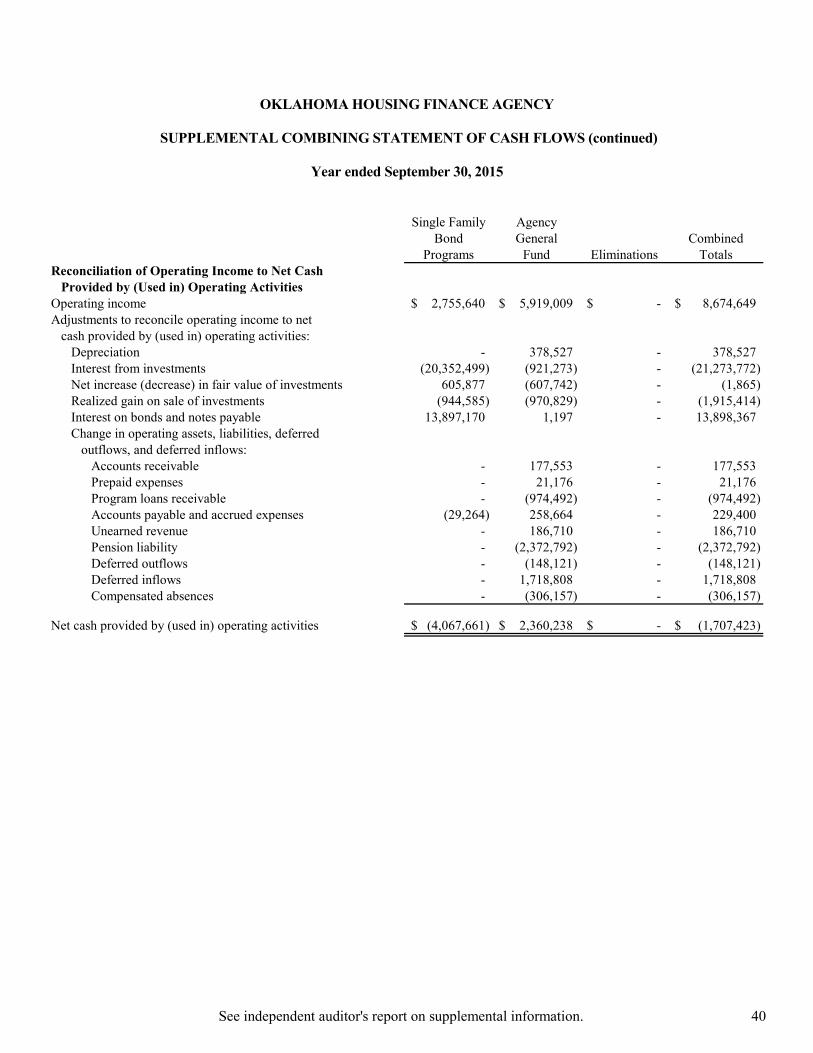
See independent auditor's report on supplemental information. 40
OKLAHOMA HOUSING FINANCE AGENCY
SUPPLEMENTAL COMBINING STATEMENT OF CASH FLOWS (continued)
Year ended September 30, 2015 Single Family Agency
Bond General CombinedPrograms Fund Eliminations Totals
Reconciliation of Operating Income to Net Cash Provided by (Used in) Operating Activities
Operating income 2,755,640$ 5,919,009$ -$ 8,674,649$ Adjustments to reconcile operating income to net
cash provided by (used in) operating activities:Depreciation - 378,527 - 378,527 Interest from investments (20,352,499) (921,273) - (21,273,772) Net increase (decrease) in fair value of investments 605,877 (607,742) - (1,865) Realized gain on sale of investments (944,585) (970,829) - (1,915,414) Interest on bonds and notes payable 13,897,170 1,197 - 13,898,367 Change in operating assets, liabilities, deferred
outflows, and deferred inflows:Accounts receivable - 177,553 - 177,553 Prepaid expenses - 21,176 - 21,176 Program loans receivable - (974,492) - (974,492) Accounts payable and accrued expenses (29,264) 258,664 - 229,400 Unearned revenue - 186,710 - 186,710 Pension liability - (2,372,792) - (2,372,792) Deferred outflows - (148,121) - (148,121) Deferred inflows - 1,718,808 - 1,718,808 Compensated absences - (306,157) - (306,157)
Net cash provided by (used in) operating activities (4,067,661)$ 2,360,238$ -$ (1,707,423)$

OTHER REPORT

11600 Broadway Ext., Suite 300, Oklahoma City, OK 73114 P 405.848.2020 F 405.848.7359 www.hogantaylor.com
41
REPORT ON INTERNAL CONTROL OVER FINANCIAL REPORTING AND ON COMPLIANCE AND OTHER MATTERS BASED ON AN AUDIT OF FINANCIAL STATEMENTS PERFORMED IN ACCORDANCE WITH
GOVERNMENT AUDITING STANDARDS
INDEPENDENT AUDITOR'S REPORT
To the Board of Trustees Oklahoma Housing Finance Agency We have audited, in accordance with the auditing standards generally accepted in the United States of America and the standards applicable to financial audits contained in Government Auditing Standards issued by the Comptroller General of the United States, the financial statements of Oklahoma Housing Finance Agency (the Agency), as of and for the year ended September 30, 2015, and the related notes to the financial statements, and have issued our report thereon dated January 27, 2016. Internal Control over Financial Reporting In planning and performing our audit of the financial statements, we considered the Agency's internal control over financial reporting (internal control) to determine the audit procedures that are appropriate in the circumstances for the purpose of expressing our opinion on the financial statements, but not for the purpose of expressing an opinion on the effectiveness of the Agency's internal control. Accordingly, we do not express an opinion on the effectiveness of the Agency's internal control. A deficiency in internal control exists when the design or operation of a control does not allow management or employees, in the normal course of performing their assigned functions, to prevent, or detect and correct, misstatements on a timely basis. A material weakness is a deficiency, or a combination of deficiencies, in internal control, such that there is a reasonable possibility that a material misstatement of the entity's financial statements will not be prevented, or detected and corrected on a timely basis. A significant deficiency is a deficiency, or a combination of deficiencies, in internal control that is less severe than a material weakness, yet important enough to merit attention by those charged with governance. Our consideration of internal control was for the limited purpose described in the first paragraph of this section and was not designed to identify all deficiencies in internal control that might be material weaknesses or significant deficiencies. Given these limitations, during our audit we did not identify any deficiencies in internal control that we consider to be material weaknesses. However, material weaknesses may exist that have not been identified.

42
Compliance and Other Matters As part of obtaining reasonable assurance about whether the Agency's financial statements are free from material misstatement, we performed tests of its compliance with certain provisions of laws, regulations, contracts, and grant agreements, noncompliance with which could have a direct and material effect on the determination of financial statement amounts. However, providing an opinion on compliance with those provisions was not an objective of our audit, and accordingly, we do not express such an opinion. The results of our tests disclosed no instances of noncompliance or other matters that are required to be reported under Government Auditing Standards. Purpose of this Report The purpose of this report is solely to describe the scope of our testing of internal control and compliance and the results of that testing, and not to provide an opinion on the effectiveness of the entity's internal control or on compliance. This report is an integral part of an audit performed in accordance with Government Auditing Standards in considering the entity's internal control and compliance. Accordingly, this communication is not suitable for any other purpose.
January 27, 2016
SINGLE AUDIT SUPPLEMENT
AND
INDEPENDENT AUDITOR'S REPORTS
ON COMPLIANCE AND INTERNAL CONTROL
SEPTEMBER 30, 2015
CONTENTS Schedule of Expenditures of Federal Awards ...................................................................................................... 1 Notes to Schedule of Expenditures of Federal Awards ....................................................................................... 2 Report on Internal Control over Financial Reporting and on Compliance
and Other Matters Based on an Audit of Financial Statements Performed in Accordance with Government Auditing Standards ................................................................... 3
Report on Compliance with Requirements that Could Have a Direct and
Material Effect on Each Major Program and Internal Control Over Compliance in Accordance with OMB Circular A-133 .......................................................................... 5
Schedule of Findings and Questioned Costs ........................................................................................................ 7 Summary Schedule of Prior Audit Findings ........................................................................................................ 9
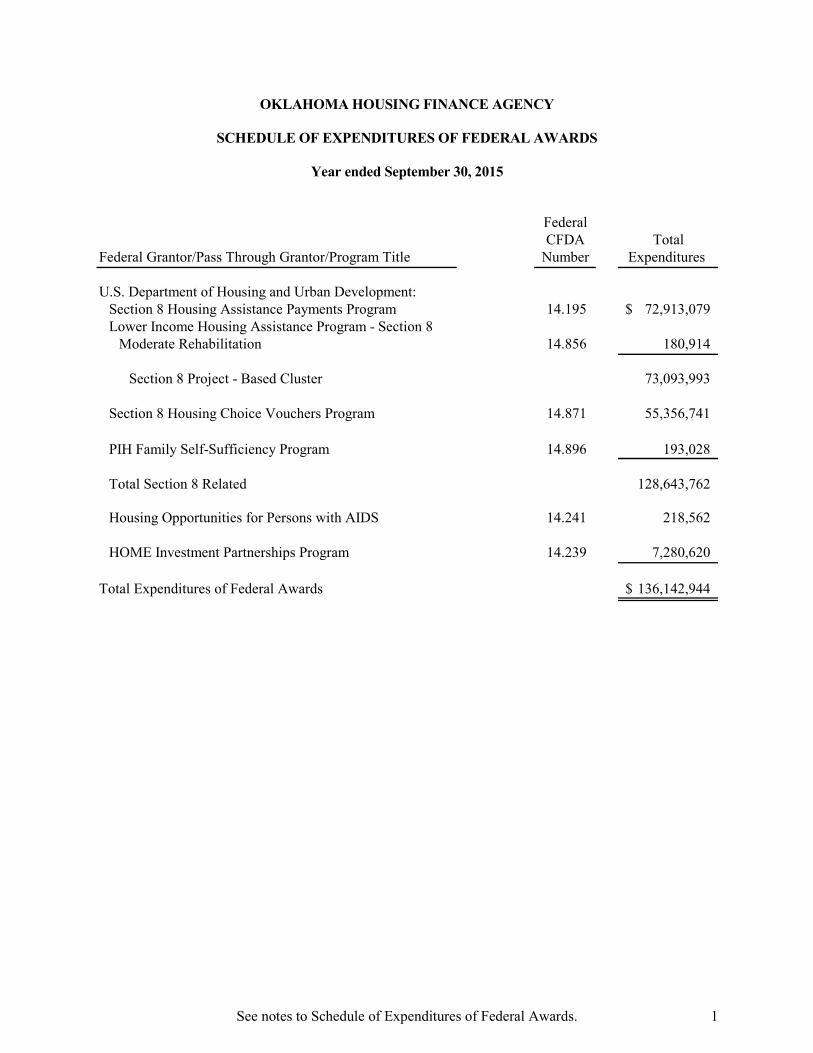
See notes to Schedule of Expenditures of Federal Awards. 1
OKLAHOMA HOUSING FINANCE AGENCY
SCHEDULE OF EXPENDITURES OF FEDERAL AWARDS
Year ended September 30, 2015
FederalCFDA Total
Federal Grantor/Pass Through Grantor/Program Title Number Expenditures
U.S. Department of Housing and Urban Development:Section 8 Housing Assistance Payments Program 14.195 72,913,079$ Lower Income Housing Assistance Program - Section 8
Moderate Rehabilitation 14.856 180,914
Section 8 Project - Based Cluster 73,093,993
Section 8 Housing Choice Vouchers Program 14.871 55,356,741
PIH Family Self-Sufficiency Program 14.896 193,028
Total Section 8 Related 128,643,762
Housing Opportunities for Persons with AIDS 14.241 218,562
HOME Investment Partnerships Program 14.239 7,280,620
Total Expenditures of Federal Awards 136,142,944$
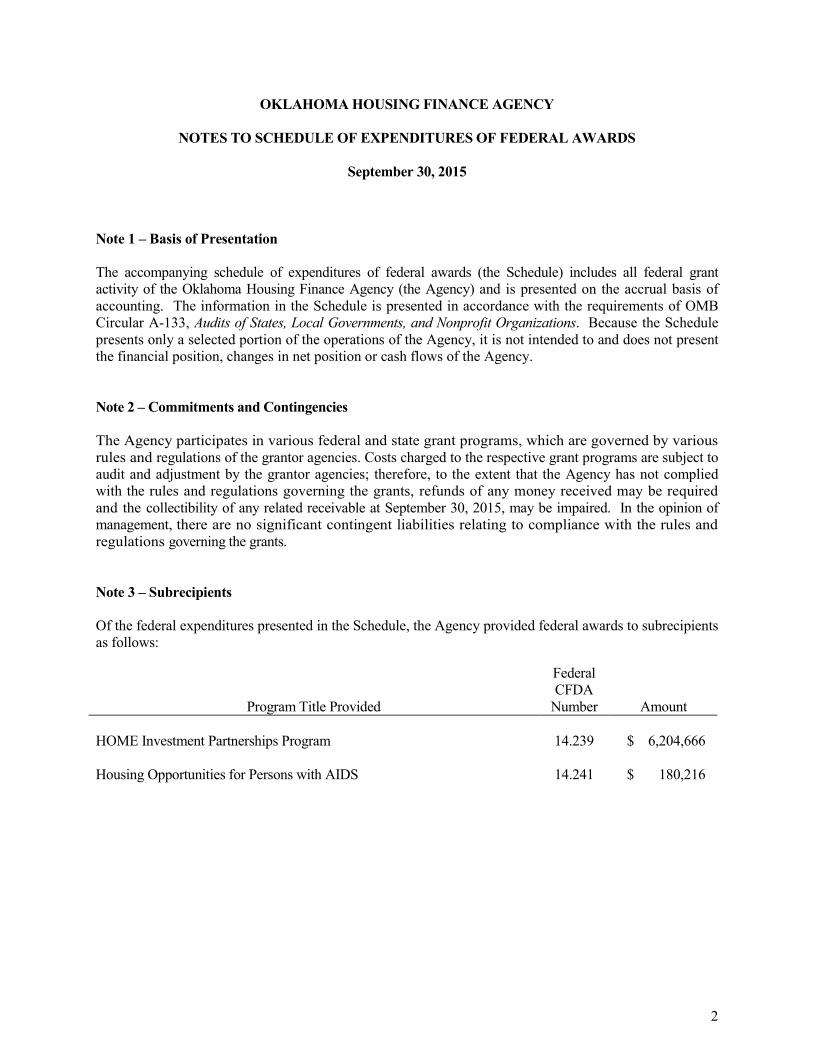
2
OKLAHOMA HOUSING FINANCE AGENCY
NOTES TO SCHEDULE OF EXPENDITURES OF FEDERAL AWARDS
September 30, 2015 Note 1 – Basis of Presentation The accompanying schedule of expenditures of federal awards (the Schedule) includes all federal grant activity of the Oklahoma Housing Finance Agency (the Agency) and is presented on the accrual basis of accounting. The information in the Schedule is presented in accordance with the requirements of OMB Circular A-133, Audits of States, Local Governments, and Nonprofit Organizations. Because the Schedule presents only a selected portion of the operations of the Agency, it is not intended to and does not present the financial position, changes in net position or cash flows of the Agency. Note 2 – Commitments and Contingencies The Agency participates in various federal and state grant programs, which are governed by various rules and regulations of the grantor agencies. Costs charged to the respective grant programs are subject to audit and adjustment by the grantor agencies; therefore, to the extent that the Agency has not complied with the rules and regulations governing the grants, refunds of any money received may be required and the collectibility of any related receivable at September 30, 2015, may be impaired. In the opinion of management, there are no significant contingent liabilities relating to compliance with the rules and regulations governing the grants. Note 3 – Subrecipients Of the federal expenditures presented in the Schedule, the Agency provided federal awards to subrecipients as follows:
Program Title Provided
Federal CFDA
Number Amount HOME Investment Partnerships Program 14.239 $ 6,204,666 Housing Opportunities for Persons with AIDS 14.241 $ 180,216
11600 Broadway Ext., Suite 300, Oklahoma City, OK 73114 P 405.848.2020 F 405.848.7359 www.hogantaylor.com
3
REPORT ON INTERNAL CONTROL OVER FINANCIAL REPORTING AND ON COMPLIANCE AND OTHER MATTERS BASED ON AN AUDIT OF FINANCIAL STATEMENTS PERFORMED IN ACCORDANCE WITH
GOVERNMENT AUDITING STANDARDS
INDEPENDENT AUDITOR'S REPORT To the Board of Trustees Oklahoma Housing Finance Agency We have audited, in accordance with the auditing standards generally accepted in the United States of America and the standards applicable to financial audits contained in Government Auditing Standards issued by the Comptroller General of the United States, the financial statements of Oklahoma Housing Finance Agency (the Agency), as of and for the year ended September 30, 2015, and the related notes to the financial statements, and have issued our report thereon dated January 27, 2016. Internal Control over Financial Reporting In planning and performing our audit of the financial statements, we considered the Agency's internal control over financial reporting (internal control) to determine the audit procedures that are appropriate in the circumstances for the purpose of expressing our opinion on the financial statements, but not for the purpose of expressing an opinion on the effectiveness of the Agency's internal control. Accordingly, we do not express an opinion on the effectiveness of the Agency's internal control. A deficiency in internal control exists when the design or operation of a control does not allow management or employees, in the normal course of performing their assigned functions, to prevent, or detect and correct, misstatements on a timely basis. A material weakness is a deficiency, or a combination of deficiencies, in internal control, such that there is a reasonable possibility that a material misstatement of the entity's financial statements will not be prevented, or detected and corrected on a timely basis. A significant deficiency is a deficiency, or a combination of deficiencies, in internal control that is less severe than a material weakness, yet important enough to merit attention by those charged with governance. Our consideration of internal control was for the limited purpose described in the first paragraph of this section and was not designed to identify all deficiencies in internal control that might be material weaknesses or significant deficiencies. Given these limitations, during our audit we did not identify any deficiencies in internal control that we consider to be material weaknesses. However, material weaknesses may exist that have not been identified. Compliance and Other Matters As part of obtaining reasonable assurance about whether the Agency's financial statements are free from material misstatement, we performed tests of its compliance with certain provisions of laws, regulations, contracts, and grant agreements, noncompliance with which could have a direct and material effect on the determination of financial statement amounts. However, providing an opinion on compliance with those
4
provisions was not an objective of our audit, and accordingly, we do not express such an opinion. The results of our tests disclosed no instances of noncompliance or other matters that are required to be reported under Government Auditing Standards. Purpose of this Report The purpose of this report is solely to describe the scope of our testing of internal control and compliance and the results of that testing, and not to provide an opinion on the effectiveness of the entity's internal control or on compliance. This report is an integral part of an audit performed in accordance with Government Auditing Standards in considering the entity's internal control and compliance. Accordingly, this communication is not suitable for any other purpose. January 27, 2016
11600 Broadway Ext., Suite 300, Oklahoma City, OK 73114 P 405.848.2020 F 405.848.7359 www.hogantaylor.com
5
REPORT ON COMPLIANCE FOR EACH MAJOR FEDERAL PROGRAM; REPORT ON INTERNAL CONTROL OVER COMPLIANCE; AND REPORT ON SCHEDULE OF EXPENDITURES OF FEDERAL AWARDS REQUIRED BY OMB CIRCULAR A-133
INDEPENDENT AUDITOR'S REPORT
To the Board of Trustees Oklahoma Housing Finance Agency Report on Compliance for Each Major Federal Program
We have audited Oklahoma Housing Finance Agency's (the Agency) compliance with the types of compliance requirements described in the OMB Circular A-133 Compliance Supplement that could have a direct and material effect
on each of the Agency's major federal programs for the year ended
September 30, 2015. The Agency's major federal programs are identified in the summary of auditor's results section of the accompanying schedule of findings and questioned costs.
Management's Responsibility
Management is responsible for compliance with the requirements of laws, regulations, contracts, and grants applicable to its federal programs.
Auditor's Responsibility
Our responsibility is to express an opinion on compliance for each of the Agency's major federal programs based on our audit of the types of compliance requirements referred to above. We conducted our audit of compliance in accordance with auditing standards generally accepted in the United States of America; the standards applicable to financial audits contained in Government Auditing Standards, issued by the Comptroller General of the United States; and OMB Circular A-133, Audits of States, Local Governments, and Non-Profit Organizations. Those standards and OMB Circular A-133 require that we plan and perform the audit to obtain reasonable assurance about whether noncompliance with the types of compliance requirements referred to above that could have a direct and material effect on a major federal program occurred. An audit includes examining, on a test basis, evidence about the Agency's compliance with those requirements and performing such other procedures as we considered necessary in the circumstances.
We believe that our audit provides a reasonable basis for our opinion on compliance for each major federal program. However, our audit does not provide a legal determination of the Agency's compliance.
Opinion on Each Major Federal Program
In our opinion, the Agency complied, in all material respects, with the types of compliance requirements referred to above that could have a direct and material effect on each of its major federal programs for the year ended September 30, 2015.
6
Report on Internal Control Over Compliance
Management of the Agency is responsible for establishing and maintaining effective internal control over compliance with the types of compliance requirements referred to above. In planning and performing our audit of compliance, we considered the Agency's internal control over compliance with the types of requirements that could have a direct and material effect on each major federal program to determine the auditing procedures that are appropriate in the circumstances for the purpose of expressing an opinion on compliance for each major federal program and to test and report on internal control over compliance in accordance with OMB Circular A-133, but not for the purpose of expressing an opinion on the effectiveness of internal control over compliance. Accordingly, we do not express an opinion on the effectiveness of the Agency's internal control over compliance.
A deficiency in internal control over compliance exists when the design or operation of a control over compliance does not allow management or employees, in the normal course of performing their assigned functions, to prevent, or detect and correct, noncompliance with a type of compliance requirement of a federal program on a timely basis. A material weakness in internal control over compliance is a deficiency, or combination of deficiencies, in internal control over compliance, such that there is a reasonable possibility that material noncompliance with a type of compliance requirement of a federal program will not be prevented, or detected and corrected, on a timely basis. A significant deficiency in internal control over compliance is a deficiency, or a combination of deficiencies, in internal control over compliance with a type of compliance requirement of a federal program that is less severe than a material weakness in internal control over compliance, yet important enough to merit attention by those charged with governance.
Our consideration of internal control over compliance was for the limited purpose described in the first paragraph of this section and was not designed to identify all deficiencies in internal control over compliance that might be material weaknesses or significant deficiencies. We did not identify any deficiencies in internal control over compliance that we consider to be material weaknesses. However, material weaknesses may exist that have not been identified.
The purpose of this report on internal control over compliance is solely to describe the scope of our testing of internal control over compliance and the results of that testing based on the requirements of OMB Circular A-133. Accordingly, this report is not suitable for any other purpose.
Report on Schedule of Expenditures of Federal Awards Required by OMB Circular A-133
We have audited the financial statements of the Agency as of and for the year ended September 30, 2015, and the related notes to the financial statements, and issued our report thereon dated January 27, 2016 which contained an unmodified opinion on those financial statements. Our audit was conducted for the purpose of forming an opinion on the financial statements as a whole. The accompanying schedule of expenditures of federal awards is presented for purposes of additional analysis as required by OMB Circular A-133 and is not a required part of the basic financial statements. Such information is the responsibility of management and was derived from and relates directly to the underlying accounting and other records used to prepare the basic financial statements. The information has been subjected to the auditing procedures applied in the audit of the financial statements and certain additional procedures, including comparing and reconciling such information directly to the underlying accounting and other records used to prepare the basic financial statements or to the basic financial statements themselves, and other additional procedures in accordance with auditing standards generally accepted in the United States of America. In our opinion, the schedule of expenditure of federal awards is fairly stated in all material respects in relation to the basic financial statements as a whole. January 27, 2016
7
OKLAHOMA HOUSING FINANCE AGENCY
SCHEDULE OF FINDINGS AND QUESTIONED COSTS
Year ended September 30, 2015 Section I – Summary of Auditor's Results Financial Statements Type of auditor's report issued: Unmodified Yes No None Reported Internal control over financial reporting:
Material weakness(es) identified? X Significant deficiency(ies) identified? X
Noncompliance material to financial statements
noted? X Federal Awards Yes No None Reported Internal control over major programs:
Material weakness(es) identified? X Significant deficiency(ies) identified? X
Type of auditor's report issued on compliance
for major programs:
Unmodified
Yes No None Reported Any audit findings disclosed that are required to
be reported in accordance with section 510(a) of Circular A-133? X
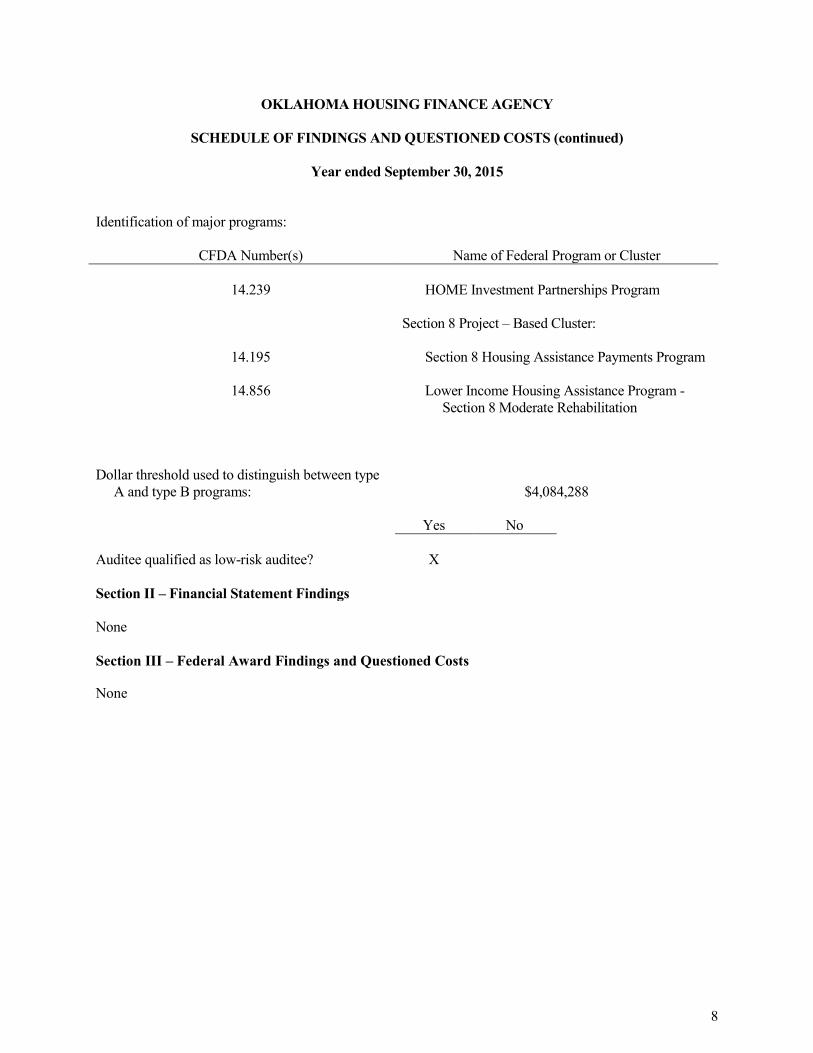
8
OKLAHOMA HOUSING FINANCE AGENCY
SCHEDULE OF FINDINGS AND QUESTIONED COSTS (continued)
Year ended September 30, 2015 Identification of major programs:
CFDA Number(s) Name of Federal Program or Cluster
14.239 HOME Investment Partnerships Program
Section 8 Project – Based Cluster:
14.195 Section 8 Housing Assistance Payments Program
14.856 Lower Income Housing Assistance Program - Section 8 Moderate Rehabilitation
Dollar threshold used to distinguish between type A and type B programs: $4,084,288
Yes No Auditee qualified as low-risk auditee? X Section II – Financial Statement Findings None Section III – Federal Award Findings and Questioned Costs
None

9
OKLAHOMA HOUSING FINANCE AGENCY
SUMMARY SCHEDULE OF PRIOR AUDIT FINDINGS
Year ended September 30, 2015 There were no prior year findings or questioned costs.