Embed Size (px)
Citation preview

Budget Paper 4 | Volume 4
Agency Statem
ents 2012–13
2012–13 Budget Paper 4
Agency Statements | Volume 4www.statebudget.sa.gov.au

www.statebudget.sa.gov.au
Department of Treasury and Finance State Administration Centre 200 Victoria Square, Adelaide, South Australia, 5000
GPO Box 1045, Adelaide, South Australia, 5001 Telephone: +61 (08) 8226 9500 Web: www.treasury.sa.gov.au
Budget Paper 1 Budget OverviewBudget Paper 2 Budget SpeechBudget Paper 3 Budget StatementBudget Paper 4 Agency Statements – Volumes 1, 2, 3, 4Budget Paper 5 Capital Investment StatementBudget Paper 6 Budget Measures Statement
Acknowledgements
2012–13 Budget Papers
This publication is printed on FSC certified paper.
Content from this publication may be reproduced with appropriate acknowledgement, as permitted under the Copyright Act. © Government of South Australia 2012
Published May 2012 ISSN 1440-8589

Agency statements by volume
Volume 1
Attorney-General Auditor-General Communities and Social Inclusion Correctional Services CourtsDefenceEducation and Child Development
Volume 2
Electoral Commission Emergency Services — CFS Emergency Services — MFS Emergency Services — SAFECOM Emergency Services — SES Environment and Natural Resources Environment Protection Authority Further Education, Employment, Science and Technology
Volume 3
HealthManufacturing, Innovation, Trade, Resources and Energy Planning, Transport and Infrastructure Police
Volume 4
Premier and Cabinet Primary Industries and Regions TourismTreasury and Finance WaterZero Waste


Volume 4 contents
2012–13 Agency Statements — Volume 4 12

2 2012–13 Agency Statements — Volume 4

Introduction
The 2012 13 Agency Statements outline financial and non-financial information about the services each agency provides to, and on behalf of, the South Australian community.
To assist readers who may not be familiar with official agency names, the agency statements are presented in alphabetical order as indicated in the list below. There has been a number of machinery of government changes made throughout the year that have altered the agency structure from the 2011–12 Budget.
The Department of Environment and Natural Resources and the Department for Water are presented separately in these statements. As announced in this budget these entities will merge during 2012–13.
Alphabetical list order Agency name Abbreviation
Attorney-General Attorney-General’s Department AGD
Auditor-General Auditor-General’s Department
Communities and Social Inclusion Department for Communities and Social Inclusion DCSI
Correctional Services Department f Correctional Services DCS
Courts Courts Administration Authority CAA
Defence SA Defence SA
Education and Child Development Department for Education and Child Development DECD
Electoral Commission Electoral Commission of South Australia ECSA
Emergency Services CFS South Australian Country Fire Service CFS
Emergency Services MFS South Australian Metropolitan Fire Service MFS
Emergency Services SAFECOM South Australian Fire and Emergency Services Commission
SAFECOM
Emergency Services SES South Australian State Emergency Service SES
Environment and Natural Resources Department of Environment and Natural Resources DENR
Environment Protection Authority Environment Protection Authority EPA
Further Education, Employment, Science and Technology
Department of Further Education, Employment, Science and Technology
DFEEST
Health and Ageing Department for Health and Ageing DHA
Manufacturing, Innovation, Trade, Resources and Energy
Department for Manufacturing, Innovation, Trade, Resources and Energy
DMITRE
Planning, Transport and Infrastructure Department of Planning, Transport and Infrastructure DPTI
Police South Australia Police SAPOL
Premier and Cabinet Department of the Premier and Cabinet DPC
Primary Industries and Regions Department of Primary Industries and Regions PIRSA
Tourism South Australian Tourism Commission SATC
Treasury and Finance Department of Treasury and Finance DTF
Water Department for Water DFW
Zero Waste Zero Waste SA ZWSA
2012–13 Agency Statements — Volume 4 3

Definitions
Agency
An agency is an administrative unit created under the Public Sector Act 2009 or a statutory authority that is accountable for the delivery of programs on behalf of the government.
Programs and sub-programs
A program is a group of related activities that contribute to achieving one of an agency’s and, in turn, the government’s objectives. Many programs are further divided into sub-programs with more specific objectives.
Overview
The agency statements outline projected agency activity and performance for 2012–13. Each agency statement conforms to the following standard presentation structure:
Objective — outlines the agency’s objectives
Ministerial responsibilities — identifies the minister responsible for each program/sub-program and identifies any items administered by the agency on behalf of the minister(s)
Ministerial office resources — details the resources provided to ministerial office(s)
Workforce summary — summarises the agency’s workforce
Program net cost of services summary — summarises the net cost of agency programs
Investing expenditure summary — summarises investing expenditure for the agency
Program/sub-program information — for each agency program/sub-program, provides a description/objective, program summary (expenses, income and full-time equivalents), financial commentary, highlights and targets, performance and activity indicators
Financial statements — budgeted financial statements for controlled and administered items
Summary of major variations — commentary on variances and trends in the financial statements.
Presentation of changes in program structures
Where a program or function is transferred between agencies, program information for previous years is reflected in the current program structure of the receiving agency.
In contrast, the agency financial statements line ‘net cost of providing services’ in the statement of comprehensive income is based on the actual program structure for the agency as it operated or is expected to operate in each year. This distinction in treatment is drawn so that financial statements accurately reflect events while, at the same time, program information is comparable and not duplicated.
Reconciliation of the financial statements to the current program structure is contained in the program net cost of services summary located at the beginning of each relevant agency section.
Introduction
4 2012–13 Agency Statements — Volume 4

Financial statements
The estimated financial statements included in the 2012 13 Agency Statements are special purpose financial statements and include, for each agency, a statement of comprehensive income, a statement of financial position and a statement of cash flows.
The format of these estimated financial statements is consistent with the model financial statements (prepared by the Department of Treasury and Finance for statutory reporting requirements) and is consistent with the requirements of AASB 101 Presentation of Financial Statements and AASB 107 Statement of Cash Flows.
Estimates in these financial statements have been prepared:
on a basis that is consistent with Australian Accounting Standards (Australian Accounting Standards and/or interpretations that have been issued or amended but are not yet effective have not been adopted early)
on an accrual basis, except for the statement of cash flows which has been derived from the statement of comprehensive income and statement of financial position to reflect cash payments and receipts
using historical cost convention, except for certain assets and liabilities that are valued in accordance with the valuation policy applicable.
Consistent with Australian Accounting Standards, estimated transactions and balances that are controlled are budgeted for, and reported on, separately to estimated transactions and balances which are administered but not controlled by the agency.
Introduction
2012–13 Agency Statements — Volume 4 5

Ministerial responsibilities
The ministerial responsibilities summary table following provides a comprehensive list of the agencies and programs which fall under the responsibility of each minister and is presented in Ministerial Order of Precedence.
Minister Agency Programs
1. Cabinet Office
2. State Development
3. Integrated Design Commission
4. Capital City
5. Agent-General’s Office
The Hon. JW Weatherill Premier Minister for State Development
Department of the Premier and Cabinet
6. Support Services and Community Programs
1. Legal and Justice Services
2. Legislation and Policy Services
3. Consumer and Business Services
4. Consumer and Business Services – Liquor Regulatory Services
5. Consumer and Business Services – Gambling Regulatory Services
6. Advocacy and Guardianship Services
7. Equal Opportunity
8. Police Complaints Authority
Attorney-General’s Department
9. Ombudsman Services
1. Court and Tribunal Case Resolution Services
2. Alternative Dispute Resolution Services
Courts Administration Authority
3. Penalty Management Services
Electoral Commission of South Australia
1. Electoral Services
Department of Planning, Transport and Infrastructure
1. Urban Development and Planning
The Hon. JR Rau Deputy Premier Attorney-General Minister for Planning Minister for Business Services and Consumers
Department of Treasury and Finance
1. Gambling Policy
1. Agriculture, Food and Fisheries 2. Forestry Policy
Department of Primary Industries and Regions
3. Regional Development 1. Destination Development
2. Tourism Events
South Australian Tourism Commission
3. Tourism Marketing
The Hon. GE Gago Minister for Agriculture, Food and Fisheries Minister for Forests Minister for Regional Development Minister for Tourism Minister for the Status of Women Department for Communities and
Social Inclusion 1. Status of Women
Introduction
6 2012–13 Agency Statements — Volume 4

Minister Agency Programs
2. Policy and Planning
3. Transport Infrastructure Services
4. Transport Safety
5. State Infrastructure Facilitation
6. Building Management
The Hon. PF Conlon Minister for Transport and Infrastructure Minister for Housing and Urban Development
Department of Planning, Transport and Infrastructure
7. Land Services
2. Accountability for Public Sector Resources
3. Treasury Services
Department of Treasury and Finance
4. Support Services
Attorney-General’s Department 10. Workers Rehabilitation
1. Defence Industry Development
The Hon. JJ Snelling Treasurer Minister for Workers Rehabilitation Minister for Veterans’ Affairs Minister for Defence Industries
Defence SA
2. Techport Australia
1. Policy, Clinical Services and Administration
Department for Health and Ageing
2. Health Services
7. Library and Information Services
8. Access to Art, Museum and Heritage Services and Preservation of State Collections
The Hon. JD Hill Minister for Health and Ageing Minister for Mental Health and Substance Abuse Minister for the Arts
Department of the Premier and Cabinet
9. Arts Industry Development and Access to Artistic Product
1. Public Safety
2. Crime Prevention and Criminal Justice Services
South Australia Police
3. Road Safety
1. Rehabilitation and Reparation
2. Custodial Services
Department for Correctional Services
3. Community Based Services
South Australian Country Fire Service
1. Country Fire Service
South Australian Metropolitan Fire Service
1. South Australian Metropolitan Fire Service
South Australian Fire and Emergency Services Commission
1. Fire and Emergency Services Strategic Services and Business Support
South Australian State Emergency Service
1. State Emergency Service
Department of Planning, Transport and Infrastructure
8. Road Safety Management
The Hon. JM Rankine Minister for Police Minister for Correctional Services Minister for Emergency Services Minister for Road Safety Minister for Multicultural Affairs
Department for Communities and Social Inclusion
2. Multicultural Services
Introduction
2012–13 Agency Statements — Volume 4 7

Minister Agency Programs
1. Natural Resource Stewardship
2. Strategy, Climate Change and Sustainability
Department of Environment and Natural Resources
3. Botanic Gardens
Environment Protection Authority 1. Environment and Radiation Protection
Zero Waste SA 1. Waste Reduction and Resource Recovery
1. Water Planning and Management
2. Operations and Major Programs
3. Policy and Strategy
Department for Water
4. Science, Monitoring and Information
The Hon. P Caica Minister for Sustainability, Environment and Conservation Minister for Water and the River Murray Minister for Aboriginal Affairs and Reconciliation
Department of the Premier and Cabinet
10. Aboriginal Affairs and Reconciliation
1. Manufacturing and Innovation
2. Globally Integrating the SA Economy
3. Mineral Resources and Energy
The Hon. T Koutsantonis Minister for Manufacturing, Innovation and Trade Minister for Mineral Resources and Energy Minister for Small Business
Department for Manufacturing, Innovation, Trade, Resources and Energy
4. Opportunities for Small Business
11. Shared Services
12. Community and Government Services
Department of the Premier and Cabinet
13. Public Sector Performance
The Hon. MF O’Brien Minister for Finance Minister for the Public Sector
Department of Treasury and Finance
5. Financial Services Provision
1. Early Childhood Development
2. School Education The Hon. G Portolesi Minister for Education and Child Development
Department for Education and Child Development
3. Care and Protection
1. Employment and Skills Formation Department of Further Education, Employment, Science and Technology 2. Science, Technology and
Information Economy
The Hon. TR Kenyon Minister for Employment, Higher Education and Skills Minister for Science and Information Economy Minister for Recreation and Sport
Department of Planning, Transport and Infrastructure
9. Recreation, Sport and Racing
14. Industrial Relations Department of the Premier and Cabinet 15. State/Local Government Relations
The Hon. RP Wortley Minister for Industrial Relations Minister for State/Local Government Relations Attorney-General’s Department 11. Employee Advocacy
10. Public Transport Services The Hon. CC Fox Minister for Transport Services
Department of Planning, Transport and Infrastructure 11. Driver Licensing and Vehicle
Registrations, Standards and Inspections
3. Social Housing
4. Community and Home Support
5. Communities and Partners
The Hon. IK Hunter Minister for Communities and Social Inclusion Minister for Social Housing Minister for Disabilities Minister for Youth Minister for Volunteers
Department for Communities and Social Inclusion
6. Organisational Capability
Introduction
8 2012–13 Agency Statements — Volume 4

Agency: Department of the Premier and Cabinet
Premier Minister for State Development Minister for the Arts Minister for Aboriginal Affairs and Reconciliation Minister for Finance Minister for the Public Sector Minister for Industrial Relations Minister for State/Local Government Relations
2012–13 Agency Statements — Volume 4 9

Premier and Cabinet
10 2012–13 Agency Statements — Volume 4

Contents
Objective....................................................................................................................................... 12 Ministerial responsibilities............................................................................................................. 13 Ministerial office resources ........................................................................................................... 14 Workforce summary ..................................................................................................................... 15 Program net cost of services summary ........................................................................................ 16 Investing expenditure summary.................................................................................................... 17 Program 1: Cabinet Office ......................................................................................................... 19 Program 2: State Development ................................................................................................. 23 Program 3: Integrated Design Commission............................................................................... 31 Program 4: Capital City ............................................................................................................. 33 Program 5: Agent-General’s Office............................................................................................ 35 Program 6: Support Services and Community Programs .......................................................... 37 Program 7: Library and Information Services ............................................................................ 39 Program 8: Access to Art, Museum and Heritage Services and Preservation
of State Collections ................................................................................................. 43 Program 9: Arts Industry Development and Access to Artistic Product ..................................... 46 Program 10: Aboriginal Affairs and Reconciliation....................................................................... 49 Program 11: Shared Services .................................................................................................... 52 Program 12: Community and Government Services ...................................................................54 Program 13: Public Sector Performance ..................................................................................... 62 Program 14: Industrial Relations ................................................................................................. 66 Program 15: State/Local Government Relations .........................................................................70 Financial statements..................................................................................................................... 72 Summary of major variations ........................................................................................................ 79 Additional information for administered items............................................................................... 81
Premier and Cabinet
2012–13 Agency Statements — Volume 4 11

Objective
•
•
•
•
•
•
•
Premier and Cabinet
12 2012–13 Agency Statements — Volume 4

Ministerial responsibilities
Minister Programs Sub-programs
1. Cabinet Office 1.1 Cabinet Coordination Services 1.2 Whole of Government Strategic
Policy 1.3 National Reform
2. State Development 2.1 Office of International Coordination
2.2 Population and Migration Policy 2.3 Protocol 2.4 Economic Policy 2.5 Office of the Economic
Development Board 2.6 Adelaide Thinkers in Residence
3. Integrated Design Commission Nil
4. Capital City Nil
5. Agent-General’s Office Nil
The Hon. JW Weatherill Premier Minister for State Development
6. Support Services and Community Programs
Nil
7. Library and Information Services
7.1 State Library and Statewide Information Services
7.2 Support to Public Libraries and Community Information Services
8. Access to Art, Museum and Heritage Services and Preservation of State Collections
Nil
The Hon. JD Hill Minister for the Arts
9. Arts Industry Development and Access to Artistic Product
Nil
The Hon. P Caica Minister for Aboriginal Affairs and Reconciliation
10. Aboriginal Affairs and Reconciliation
Nil
11. Shared Services Nil
12. Community and Government Services
12.1 Information and Communication Technology Services
12.2 Service SA 12.3 Archives and Records
Management 12.4 Government Publishing
The Hon. MF O’Brien Minister for Finance Minister for the Public Sector
13. Public Sector Performance 13.1 Office of Public Employment and Review
13.2 Public Sector Management Division
14. Industrial Relations 14.1 SafeWork SA 14.2 Public Sector Workforce
The Hon. RP Wortley Minister for Industrial Relations Minister for State/Local Government Relations
15. State/Local Government Relations
Nil
Note: Some program numbers have changed due to changes in ministerial responsibilities.
Premier and Cabinet
2012–13 Agency Statements — Volume 4 13

Administered items
•
•
•
•
•
•
•
•
•
•
•
•
•
•
Statutes
Ministerial office resources
2012–13 Budget
Cost of provision
Minister $000 FTE
The Hon. JW Weatherill.......................................................................... 6 277 39.0
Premier and Cabinet
14 2012–13 Agency Statements — Volume 4

Workforce summary
FTEs as at 30 June
Agency 2012–13
Budget(a)
2011–12 Estimated
Result(a) 2010–11
Actual
Department of the Premier and Cabinet ............................................. 2 054.8 2 129.5 2 068.2
Administered items for the Department of the Premier and Cabinet ........................................................................................ 14.7 14.7 12.4
Total 2 069.5 2 144.2 2 080.6
Add: FTEs transferred out:
The Social Inclusion function transferred to the Department for Communities and Social Inclusion ................................................................................................ 13.0Renewables SA transferred to the Department for Manufacturing, Innovation, Trade and Resources................................................................................................. 1.0The Sustainability and Climate Change Division transferred to the Department for Environment and Natural Resources ............................................................. 16.2
Less: FTEs transferred in: The economic policy and population and migration functions transferred from the Department for Manufacturing, Innovation, Trade, Resources and Energy ...................................................................................................... 9.0Shared Services SA transferred from the Department of Treasury and Finance ................................................................................................................... 775.8Service SA transferred from the Department of Planning, Transport and Infrastructure ......................................................................................................... 335.7Information and Communication Technology Services transferred from the Department of Planning, Transport and Infrastructure.......................................................................................................................... 140.1State/Local Government Relations transferred from the Department of Planning and Local Government ........................................................................... 26.2
Equals: Data published by the Office of Public Employment and Review (Department of the Premier and Cabinet) 824.0
(a) The 2012–13 Budget and 2011 12 Estimated Result reflect the established FTE caps.
Premier and Cabinet
2012–13 Agency Statements — Volume 4 15

Program net cost of services summary(a)
Net cost of services
2012–13Budget
2011–12Estimated
Result2011–12 Budget
2010–11Actual
Program $000 $000 $000 $000
1. Cabinet Office ..................................................... 8 896 9 703 8 603 9 670
2. State Development.............................................. 11 845 14 840 10 839 12 929
3. Integrated Design Commission ........................... 2 459 3 277 3 114 2 818
4. Capital City.......................................................... 389 388 401 395
5. Agent-General’s Office........................................ 1 748 1 885 1 869 2 016
6. Support Services and Community Programs ...... 10 408 10 154 11 168 13 635
7. Library and Information Services......................... 33 098 32 609 32 944 31 883
8. Access to Art, Museum and Heritage Services and Preservation of State Collections ................. 27 810 30 126 29 288 27 668
9. Arts Industry Development and Access to Artistic Product .................................................... 64 086 62 579 62 126 57 919
10. Aboriginal Affairs and Reconciliation................... 14 141 14 860 22 970 21 098
11. Shared Services.................................................. 8 524 9 144 15 884 10 487
12. Community and Government Services................ 15 735 27 276 36 838 42 796
13. Public Sector Performance ................................. 4 886 5 158 2 290 3 929
14. Industrial Relations.............................................. 28 967 31 020 31 701 32 230
15. State/Local Government Relations...................... 2 435 2 637 1 825 2 042
Total 235 427 255 656 271 860 271 515
Reconciliation to agency net cost of providing services(b)
Add: Net costs transferred out:
Social inclusion function to the Department for Communities and Social Inclusion on 1 December 2011 .................................................. — 3 021 5 497 6 909
Renewables SA to the Department for Manufacturing, Innovation, Trade and Resources and Energy on 1 January 2012.............................. — 1 753 13 150 2 911
Sustainability and Climate Change Division to the Department for Environment and Natural Resources on 1 January 2012 ............................... — 877 3 456 4 428
Less: Net costs transferred in:
Economic policy and population and migration functions from the Department for Manufacturing, Innovation, Trade, Resources and Energy on 1 January 2012(c) ................................................... — 557 1 161 3 149
Shared Services SA from the Department of Treasury and Finance on 1 February 2012............ — 3 957 15 884 10 487
Service SA from the Department of Planning, Transport and Infrastructure on 1 January 2012.... — 11 927 23 115 28 215
Information and Communication Technology Services from the Department of Planning, Transport and Infrastructure on 1 January 2012 ...................................................... — 797 5 275 6 609
Premier and Cabinet
16 2012–13 Agency Statements — Volume 4

Net cost of services
2012–13Budget
2011–12Estimated
Result2011–12 Budget
2010–11Actual
$000 $000 $000 $000
State/Local Government Relations from the Department of Planning and Local Government on 1 February 2012................................................ — 1 249 1 825 2 042
Equals: Net cost of providing services (as per agency statement of comprehensive income) 235 427 242 820 246 703 235 261
(a) Corporate services revenues and expenses were previously included in a separate program. For the 2012 13 Agency Statements corporate services revenue and expenses have been allocated across the department’s programs.
(b) The net cost of services for individual programs are shown on a full-year basis, whereas the agency financial statements reflect revenues and expenses from the effective date of the transfer of some programs. This reconciliation shows the difference between the program notes and the financial statements.
(c) The 2010–11 Actual also includes residual costs incurred by the Department for Manufacturing, Innovation, Trade, Resources and Energy on behalf of the Office of the Economic Development Board which transferred to the Department of the Premier and Cabinet on 1 July 2010.
Investing expenditure summary
2012–13Budget
2011–12Estimated
Result2011–12 Budget
2010–11Actual
Investments $000 $000 $000 $000
New projects Her Majesty’s Theatre and Adelaide Festival Centre Sustainment ............................................... 2 640 — — —
Total new projects 2 640 — — —
Existing projects Adelaide Festival Centre Upgrade ......................... — 740 200 1 052Adelaide Studios .................................................... — 5 216 4 330 30 951Central Government Network Infrastructure(a)........ 235 915 919 2 004Customer Service Centre Upgrade — Tranmere(a) — 1 038 1 038 50Government Information and Communication Technology Services(a)........................................... 4 162 3 064 3 003 310Government Telecommunications Equipment Upgrade(a) ............................................ 285 605 424 1 155Grant Management System ................................... — 350 — —Lion Arts Centre Upgrade ...................................... — — — 28Remote Service Delivery — Staff Accommodation ..................................................... — 1 756 500 644SafeWork SA — Office Relocation to World Park 1 .......................................................... — 939 — 6 444Security System Upgrade — North Terrace Precinct.................................................................. 228 552 552 —Shared Services SA e-Procurement System(b) ...... 311 — 311 —Staff Accommodation — APY Lands ..................... — 142 — 158StateNet Infrastructure Service Continuity(a) .......... 483 454 250 858Storage of Official Government Records(a) ............ — 1 956 1 596 55
Total existing projects 5 704 17 727 13 123 43 709
Premier and Cabinet
2012–13 Agency Statements — Volume 4 17

2012–13Budget
2011–12Estimated
Result2011–12 Budget
2010–11Actual
Investments $000 $000 $000 $000
Annual programs Capital Investment Program — Arts SA................. 44 149 193 363Minor Capital Works and Equipment...................... 1 294 420 956 1 172Office of the Chief Information Officer(a) ................. 569 620 555 501Purchase of Handsets(a)......................................... 573 566 566 555Service SA(a) .......................................................... 569 539 555 910Shared Services SA(b) ............................................ 1 736 701 1 651 1 599
Total annual programs 4 785 2 995 4 476 5 100
Total investing expenditure 13 129 20 722 17 591 48 809
(a) Transferred from the Department of Planning, Transport and Infrastructure effective 1 January 2012.
(b) Transferred from the Department of Treasury and Finance effective 1 February 2012.
Premier and Cabinet
18 2012–13 Agency Statements — Volume 4

Program 1: Cabinet Office
Description/objective
Sub-programs
Program summary expenses, income and FTEs
2012–13Budget
2011–12Estimated
Result2011–12 Budget
2010–11Actual
$000 $000 $000 $000
Expenses Employee benefit expenses ......................................... 6 486 6 721 6 453 7 056Supplies and services................................................... 2 274 2 422 2 074 2 617Depreciation and amortisation expenses...................... 49 99 54 201Grants and subsidies.................................................... 414 435 — 7Other expenses ............................................................ 107 106 114 20
Total expenses 9 330 9 783 8 695 9 901
Income Grants and subsidies.................................................... — — — 22Fees, fines and penalties.............................................. 33 33 37 84Sales of goods and services......................................... 46 47 55 96Other income................................................................ 355 — — 29
Total income 434 80 92 231
Net cost of providing services 8 896 9 703 8 603 9 670
FTEs as at 30 June (No.) 56.1 58.5 60.5 59.2
Premier and Cabinet
2012–13 Agency Statements — Volume 4 19

Sub-program 1.1: Cabinet Coordination Services
Description/objective
2012–13Budget
2011–12Estimated
Result2011–12 Budget
2010–11Actual
$000 $000 $000 $000Expenses...................................................................... 1 065 1 243 1 184 1 309Income.......................................................................... 10 9 12 24
Net cost of sub-program 1 055 1 234 1 172 1 285
FTEs as at 30 June (No.) 7.0 7.0 8.0 8.0
Financial commentary
2012–13 Budget/2011–12 Estimated Result
•
•
2011–12 Estimated Result/2011–12 Budget
2011–12 Estimated Result/2010–11 Actual
Highlights 2011–12
•
Targets 2012–13
•
Sub-program 1.2: Whole of Government Strategic Policy
Description/objective
Premier and Cabinet
20 2012–13 Agency Statements — Volume 4

2012–13Budget
2011–12Estimated
Result2011–12 Budget
2010–11Actual
$000 $000 $000 $000
Expenses...................................................................... 5 830 7 939 7 511 8 592
Income.......................................................................... 50 68 80 207
Net cost of sub-program 5 780 7 871 7 431 8 385
FTEs as at 30 June (No.) 35.1 49.5 52.5 51.2
Financial commentary
2012–13 Budget/2011–12 Estimated Result
•
•
2011–12 Estimated Result/2011–12 Budget
2011–12 Estimated Result/2010–11 Actual
Highlights 2011–12
•
•
•
•
Targets 2012–13
•
•
•
Sub-program 1.3: National Reform
Description/objective
Premier and Cabinet
2012–13 Agency Statements — Volume 4 21

2012–13Budget
2011–12Estimated
Result2011–12 Budget
2010–11Actual
$000 $000 $000 $000
Expenses...................................................................... 2 435 601 — —
Income.......................................................................... 374 3 — —
Net cost of sub-program 2 061 598 — —
FTEs as at 30 June (No.) 14.0 2.0 — —
Financial commentary
2012–13 Budget/2011–12 Estimated Result
•
•
2011–12 Estimated Result/2011–12 Budget
•
•
2011–12 Estimated Result/2010–11 Actual
•
•
Highlights 2011–12
•
Targets 2012–13
•
•
Premier and Cabinet
22 2012–13 Agency Statements — Volume 4

Program 2: State Development
Description/objective
Sub-programs
Program summary — expenses, income and FTEs
2012–13Budget
2011–12Estimated
Result2011–12 Budget
2010–11Actual
$000 $000 $000 $000
Expenses Employee benefit expenses ......................................... 5 703 5 617 4 920 7 531Supplies and services................................................... 4 366 6 039 4 242 5 210Depreciation and amortisation expenses...................... 31 18 31 21Grants and subsidies.................................................... 1 822 4 052 1 728 1 927Other expenses ............................................................ 67 63 64 11
Total expenses 11 989 15 789 10 985 14 700
Income Commonwealth revenues............................................. — 288 — 745Grants and subsidies.................................................... 70 590 70 715Fees, fines and penalties.............................................. 46 44 45 26Sales of goods and services......................................... 28 27 31 268Other income................................................................ — — — 17
Total income 144 949 146 1 771
Net cost of providing services 11 845 14 840 10 839 12 929
FTEs as at 30 June (No.) 47.2 47.8 45.1 41.8
Sub-program 2.1: Office of International Coordination
Description/objective
Premier and Cabinet
2012–13 Agency Statements — Volume 4 23

2012–13Budget
2011–12Estimated
Result2011–12 Budget
2010–11Actual
$000 $000 $000 $000
Expenses...................................................................... 6 272 9 311 4 686 5 334
Income.......................................................................... 21 307 18 989
Net cost of sub-program 6 251 9 004 4 668 4 345
FTEs as at 30 June (No.) 14.8 14.8 11.9 9.6
Financial commentary
2012–13 Budget/2011–12 Estimated Result
•
•
•
•
2011–12 Estimated Result/2011–12 Budget
•
•
•
2011–12 Estimated Result/2010–11 Actual
•
Premier and Cabinet
24 2012–13 Agency Statements — Volume 4

•
Highlights 2011–12
•
•
•
Targets 2012–13
•
•
•
Sub-program 2.2: Population and Migration Policy
Description/objective
2012–13Budget
2011–12Estimated
Result2011–12 Budget
2010–11Actual
$000 $000 $000 $000
Expenses...................................................................... 496 496 512 547
Income.......................................................................... — — — —
Net cost of sub-program 496 496 512 547
FTEs as at 30 June (No.) 3.9 4.0 4.0 4.6
Financial commentary
2012–13 Budget/2011–12 Estimated Result
2011–12 Estimated Result/2011–12 Budget
Premier and Cabinet
2012–13 Agency Statements — Volume 4 25

2011–12 Estimated Result/2010–11 Actual
Highlights 2011–12
•
•
Targets 2012–13
•
•
Sub-program 2.3: Protocol
Description/objective
2012–13Budget
2011–12Estimated
Result2011–12 Budget
2010–11Actual
$000 $000 $000 $000
Expenses...................................................................... 1 215 1 259 1 672 2 250
Income.......................................................................... 103 103 106 29
Net cost of sub-program 1 112 1 156 1 566 2 221
FTEs as at 30 June (No.) 6.6 6.7 8.0 6.6
Financial commentary
2012–13 Budget/2011–12 Estimated Result
2011–12 Estimated Result/2011–12 Budget
2011–12 Estimated Result/2010–11 Actual
•
•
Premier and Cabinet
26 2012–13 Agency Statements — Volume 4

Highlights 2011–12
•
•
Targets 2012–13
•
Sub-program 2.4: Economic Policy
Description/objective
2012–13Budget
2011–12Estimated
Result2011–12 Budget
2010–11Actual
$000 $000 $000 $000
Expenses...................................................................... 1 187 691 649 2 608
Income.......................................................................... — — — —
Net cost of sub-program 1 187 691 649 2 608
FTEs as at 30 June (No.) 7.7 7.8 6.0 4.4
Financial commentary
2012–13 Budget/2011–12 Estimated Result
•
•
2011–12 Estimated Result/2011–12 Budget
2011–12 Estimated Result/2010–11 Actual
•
•
Premier and Cabinet
2012–13 Agency Statements — Volume 4 27

Highlights 2011–12
•
•
Targets 2012–13
•
•
Sub-program 2.5: Office of the Economic Development Board
Description/objective
2012–13Budget
2011–12Estimated
Result2011–12 Budget
2010–11Actual
$000 $000 $000 $000
Expenses...................................................................... 1 964 2 180 2 376 2 265
Income.......................................................................... 9 9 10 32
Net cost of sub-program 1 955 2 171 2 366 2 233
FTEs as at 30 June (No.) 6.4 6.6 7.0 8.6
Financial commentary
2012–13 Budget/2011–12 Estimated Result
2011–12 Estimated Result/2011–12 Budget
2011–12 Estimated Result/2010–11 Actual
Highlights 2011–12
•
Premier and Cabinet
28 2012–13 Agency Statements — Volume 4

•
•
Targets 2012–13
•
Sub-program 2.6: Adelaide Thinkers in Residence
Description/objective
2012–13Budget
2011–12Estimated
Result2011–12 Budget
2010–11Actual
$000 $000 $000 $000
Expenses...................................................................... 855 1 852 1 090 1 696
Income.......................................................................... 11 530 12 721
Net cost of sub-program(a) 844 1 322 1 078 975
FTEs as at 30 June (No.) 7.8 7.9 8.2 8.0
(a) The Adelaide Thinkers in Residence program is not funded beyond 2012-13.
Financial commentary
2012–13 Budget/2011–12 Estimated Result
•
•
2011–12 Estimated Result/2011–12 Budget
2011–12 Estimated Result/2010–11 Actual
Premier and Cabinet
2012–13 Agency Statements — Volume 4 29

Highlights 2011–12
•
•
•
Targets 2012–13
•
•
Premier and Cabinet
30 2012–13 Agency Statements — Volume 4

Program 3: Integrated Design Commission
Description/objective
Program summary expenses, income and FTEs
2012–13Budget
2011–12Estimated
Result2011–12 Budget
2010–11Actual
$000 $000 $000 $000
Expenses Employee benefit expenses ......................................... 1 546 1 808 1 675 1 189Supplies and services................................................... 812 2 696 2 093 1 337Depreciation and amortisation expenses...................... 89 80 86 15Grants and subsidies.................................................... — 9 — 410Other expenses ............................................................ 31 36 23 6
Total expenses 2 478 4 629 3 877 2 957
Income Grants and subsidies.................................................... — 1 330 750 96Fees, fines and penalties.............................................. 8 9 5 8Sales of goods and services......................................... 11 13 8 27Other income................................................................ — — — 8
Total income 19 1 352 763 139
Net cost of providing services 2 459 3 277 3 114 2 818
FTEs as at 30 June (No.) 12.5 16.8 9.0 16.4
Financial commentary
2012–13 Budget/2011–12 Estimated Result
•
•
2011–12 Estimated Result/2011–12 Budget
Premier and Cabinet
2012–13 Agency Statements — Volume 4 31

2011–12 Estimated Result/2010–11 Actual
•
•
Highlights 2011–12
•
•
•
•
Targets 2012–13
•
•
•
Premier and Cabinet
32 2012–13 Agency Statements — Volume 4

Program 4: Capital City
Description/objective
Program summary expenses, income and FTEs
2012–13Budget
2011–12Estimated
Result2011–12 Budget
2010–11Actual
$000 $000 $000 $000
Expenses Employee benefit expenses ......................................... 435 440 434 466Supplies and services................................................... 205 196 220 244Depreciation and amortisation expenses...................... 4 1 4 4Grants and subsidies.................................................... 11 13 11 -18Other expenses ............................................................ 9 8 8 2
Total expenses 664 658 677 698
Income Grants and subsidies.................................................... 268 263 269 264Fees, fines and penalties.............................................. 3 3 3 3Sales of goods and services......................................... 4 4 4 9Other income................................................................ — — — 27
Total income 275 270 276 303
Net cost of providing services 389 388 401 395
FTEs as at 30 June (No.) 5.0 4.0 4.0 6.0
Financial commentary
2012–13 Budget/2011–12 Estimated Result
2011–12 Estimated Result/2011–12 Budget
2011–12 Estimated Result/2010–11 Actual
Highlights 2011–12
•
•
•
Premier and Cabinet
2012–13 Agency Statements — Volume 4 33

Targets 2012–13
•
•
Premier and Cabinet
34 2012–13 Agency Statements — Volume 4

Program 5: Agent-General’s Office
Description/objective
Program summary expenses, income and FTEs
2012–13Budget
2011–12Estimated
Result2011–12 Budget
2010–11Actual
$000 $000 $000 $000
Expenses Employee benefit expenses ......................................... 851 866 857 750Supplies and services................................................... 887 880 1 003 1 141Depreciation and amortisation expenses...................... 6 131 7 150Grants and subsidies.................................................... — 4 — —Other expenses ............................................................ 116 116 116 155
Total expenses 1 860 1 997 1 983 2 196
Income Grants and subsidies.................................................... — — — 3Fees, fines and penalties.............................................. 4 4 5 160Sales of goods and services......................................... 6 6 7 13Other income................................................................ 102 102 102 4
Total income 112 112 114 180
Net cost of providing services 1 748 1 885 1 869 2 016
FTEs as at 30 June (No.) 7.4 7.9 8.0 8.0
Financial commentary
2012–13 Budget/2011–12 Estimated Result
2011–12 Estimated Result/2011–12 Budget
2011–12 Estimated Result/2010–11 Actual
•
•
Premier and Cabinet
2012–13 Agency Statements — Volume 4 35

Highlights 2011–12
•
•
•
Targets 2012–13
•
•
Premier and Cabinet
36 2012–13 Agency Statements — Volume 4

Program 6: Support Services and Community Programs
Description/objective
Program summary expenses, income and FTEs
2012–13Budget
2011–12Estimated
Result2011–12 Budget
2010–11Actual
$000 $000 $000 $000
Expenses Employee benefit expenses ......................................... 6 575 6 774 7 373 7 590Supplies and services................................................... 2 718 2 226 2 664 2 884Depreciation and amortisation expenses...................... 41 9 41 34Grants and subsidies.................................................... 1 049 1 098 1 071 3 315Other expenses ............................................................ 92 89 89 16
Total expenses 10 475 10 221 11 238 13 839
Income Grants and subsidies.................................................... — — — 18Fees, fines and penalties.............................................. 28 28 28 60Sales of goods and services......................................... 39 39 42 102Other income................................................................ — — — 24
Total income 67 67 70 204
Net cost of providing services 10 408 10 154 11 168 13 635
FTEs as at 30 June (No.) 47.9 48.2 56.0 58.9
Financial commentary
2012–13 Budget/2011–12 Estimated Result
2011–12 Estimated Result/2011–12 Budget
2011–12 Estimated Result/2010–11 Actual
•
•
•
Premier and Cabinet
2012–13 Agency Statements — Volume 4 37

Highlights 2011–12
•
•
Targets 2012–13
•
Premier and Cabinet
38 2012–13 Agency Statements — Volume 4

Program 7: Library and Information Services
Description/objective
Sub-programs
Program summary expenses, income and FTEs
2012–13Budget
2011–12Estimated
Result2011–12 Budget
2010–11Actual
$000 $000 $000 $000
Expenses Employee benefit expenses ......................................... 547 559 559 480Supplies and services................................................... 845 860 1 336 670Depreciation and amortisation expenses...................... 121 98 102 3Grants and subsidies.................................................... 31 582 31 088 30 945 30 848Other expenses ............................................................ 11 11 11 2
Total expenses 33 106 32 616 32 953 32 003
Income Grants and subsidies.................................................... — — — 2Fees, fines and penalties.............................................. 4 3 4 3Sales of goods and services......................................... 4 4 5 10Other income................................................................ — — — 105
Total income 8 7 9 120
Net cost of providing services 33 098 32 609 32 944 31 883
FTEs as at 30 June (No.) 6.1 5.2 5.3 5.7
Premier and Cabinet
2012–13 Agency Statements — Volume 4 39

Sub-program 7.1: State Library and Statewide Information Services
Description/objective
2012–13Budget
2011–12Estimated
Result2011–12 Budget
2010–11Actual
$000 $000 $000 $000Expenses...................................................................... 14 717 14 598 14 915 14 643Income.......................................................................... 6 5 7 120
Net cost of sub-program 14 711 14 593 14 908 14 523
FTEs as at 30 June (No.) 4.7 3.8 3.9 4.2
Financial commentary
2012–13 Budget/2011–12 Estimated Result
2011–12 Estimated Result/2011–12 Budget
2011–12 Estimated Result/2010–11 Actual
Highlights 2011–12
•
Targets 2012–13
•
Performance indicators
2012 13
Target
2011 12Estimated
Result2011 12
Target 2010 11
Actual
% of library reference enquires resolved within customer agreed timeframe
98% 90% 98% 90%
Premier and Cabinet
40 2012–13 Agency Statements — Volume 4

Activity indicators
2012 13
Projection
2011 12Estimated
Result2011 12
Projection 2010 11
Actual
No. of State Library visitors The 2011–12 Projection has been adjusted compared to the projection included in the 2011–12 Budget.
610 000 610 000 600 000 597 000
No. of State Library website visitors The variation between the 2011–12 Estimated Result and 2011–12 Projection can be attributed to a change in measurement of online hits to more accurately reflect activity within the library website.
1 310 000 1 752 000 2 800 000 2 712 000
Amount of external revenue received $1.470m $1.467m $1.400m $1.565mExternal revenue received as a % of total revenue 10% 9.8% 9.8% 10.7%
Sub-program 7.2: Support to Public Libraries and Community Information Services
Description/objective
2012–13Budget
2011–12Estimated
Result2011–12 Budget
2010–11Actual
$000 $000 $000 $000Expenses...................................................................... 18 389 18 018 18 038 17 360Income.......................................................................... 2 2 2 —
Net cost of sub-program 18 387 18 016 18 036 17 360
FTEs as at 30 June (No.) 1.4 1.4 1.5 1.5
Financial commentary
2012–13 Budget/2011–12 Estimated Result
2011–12 Estimated Result/2011–12 Budget
2011–12 Estimated Result/2010–11 Actual
Highlights 2011–12
•
•
Premier and Cabinet
2012–13 Agency Statements — Volume 4 41

Targets 2012–13
•
Performance indicators
2012 13
Target
2011 12Estimated
Result2011 12
Target 2010 11
Actual
Average time taken to resolve helpdesk enquiries (minutes) 20 20 20 20% of helpdesk enquires resolved or passed to Telstra Support on the first call
98% 98% 98% 98%
Activity indicators
2012 13
Projection
2011 12Estimated
Result2011 12
Projection 2010 11
Actual
No. of items purchased and catalogued 285 000 285 000 260 000 284 275
Premier and Cabinet
42 2012–13 Agency Statements — Volume 4

Program 8: Access to Art, Museum and Heritage Services and Preservation of State Collections
Description/objective
Program summary expenses, income and FTEs
2012–13Budget
2011–12Estimated
Result2011–12 Budget
2010–11Actual
$000 $000 $000 $000
Expenses Employee benefit expenses ......................................... 3 681 3 740 3 500 3 446Supplies and services................................................... 1 968 1 893 2 639 1 774Depreciation and amortisation expenses...................... 122 42 69 44Grants and subsidies.................................................... 22 783 27 543 23 806 23 430Other expenses ............................................................ 74 71 69 13
Total expenses 28 628 33 289 30 083 28 707
Income Grants and subsidies.................................................... — 124 — 15Fees, fines and penalties.............................................. 23 22 22 20Sales of goods and services......................................... 795 771 773 926Resources received free of charge............................... — 2 246 — 5Other income................................................................ — — — 75
Total income 818 3 163 795 1 039
Net cost of providing services 27 810 30 126 29 288 27 668
FTEs as at 30 June (No.) 38.9 39.0 36.3 39.3
Financial commentary
2012–13 Budget/2011–12 Estimated Result
•
•
2011–12 Estimated Result/2011–12 Budget
•
•
Premier and Cabinet
2012–13 Agency Statements — Volume 4 43

•
2011–12 Estimated Result/2010–11 Actual
•
•
Highlights 2011–12
•
•
•
Targets 2012–13
•
•
•
Performance Indicators
2012 13
Target
2011 12Estimated
Result2011 12
Target 2010 11
Actual
Amount of external revenue received (and % of total revenue):
• Art Gallery of South Australia The 2010–11 Actual includes additional once-off cash/bequest donations and donated heritage assets.
$5.500m(41%)
$6.154m(48%)
$5.100m (35%)
$10.559m(55%)
• SA Museum The 2010–11 Actual includes a significant once-off donation.
$3.000m(25%)
$3.200m(25%)
$3.000m (25%)
$4.200m(32%)
• Carrick Hill $0.378m(36%)
$0.345m(36%)
$0.345m (36%)
$0.379m(35%)
• History SA The 2010–11 Actual and the 2011–12 Estimated Result include revenue received from special projects, which is not included in the targets, as such projects are not known until closer to the beginning of the financial year.
$1.090m(19%)
$1.711m(27%)
$1.088m (19%)
$2.144m(31%)
• Artlab The 2011–12 Estimated Result is lower than expected due to temporary reduced staff resources.
$0.900m35%
$0.687m30%
$0.900m 35%
$0.764m30%
No. of scientific peer review publications (SA Museum) 200 200 200 183
Premier and Cabinet
44 2012–13 Agency Statements — Volume 4

Activity indicators
2012 13
Projection
2011 12Estimated
Result2011 12
Projection 2010 11
Actual
No. of items treated by Artlab: • cost under $1000 1 200 1 000 1 200 1 046• cost $1001 $2000 250 180 250 229• cost $2001 $6000 180 165 180 202• cost above $6001 The 2011–12 Estimated Result is lower than expected due to temporary reduced staff resources.
80 82 80 87
No. of visitors to the: • Art Gallery of South Australia: 550 000 530 000 550 000 531 564• SA Museum 750 000 750 000 700 000 692 488• Carrick Hill 60 000 61 000 60 000 62 931• History SA 290 000 300 000 290 000 296 714
Premier and Cabinet
2012–13 Agency Statements — Volume 4 45

Program 9: Arts Industry Development and Access to Artistic Product
Description/objective
Program summary — expenses, income and FTEs
2012–13Budget
2011–12Estimated
Result2011–12 Budget
2010–11Actual
$000 $000 $000 $000
Expenses Employee benefit expenses ......................................... 2 879 2 885 3 035 2 811Supplies and services................................................... 2 911 3 501 3 161 1 895Depreciation and amortisation expenses...................... 5 251 5 115 5 139 4 551Grants and subsidies.................................................... 58 264 57 226 56 386 55 284Other expenses ............................................................ 159 155 159 361
Total expenses 69 464 68 882 67 880 64 902
Income Commonwealth revenues............................................. — 450 250 709Grants and subsidies.................................................... 900 1 256 900 912Fees, fines and penalties.............................................. 18 17 19 16Sales of goods and services......................................... 4 433 4 328 4 333 5 102Other income................................................................ 27 252 252 244
Total income 5 378 6 303 5 754 6 983
Net cost of providing services 64 086 62 579 62 126 57 919
FTEs as at 30 June (No.) 30.5 30.0 31.9 32.0
Financial commentary
2012–13 Budget/2011–12 Estimated Result
•
•
2011–12 Estimated Result/2011–12 Budget
•
•
•
Premier and Cabinet
46 2012–13 Agency Statements — Volume 4

2011–12 Estimated Result/2010–11 Actual
Highlights 2011–12
•
•
Targets 2012–13
•
•
•
•
Performance indicators
2012 13
Target
2011 12Estimated
Result2011 12
Target 2010 11
Actual
Level of customer satisfaction: attendees at the Adelaide Festival Centre
88% 89% 88% 90%
Theatre utilisation achieved by the Adelaide Festival Centre >75% 75% >75% 76%Amount of external revenue received (and % of total revenue):
• Country Arts SA The 2011–12 Estimated Result includes National Tours income that was not included in the calculation of the 2011–12 Target.
$4.813m(49%)
$5.253m(44%)
$4.660m (45%)
$4.313m(40%)
• State Opera $3.795m(71%)
$3.570m(70%)
$3.510m (70%)
$3.945m(73%)
• State Theatre $2.422m(50%)
$2.394m(50%)
$2.687m (53%)
$2.772m(54%)
• Adelaide Festival Centre A different revenue base was used to calculate the percentage of external revenue received to total revenue for the 2011–12 target.
$21.300m(59%)
$20.134m(58%)
$18.310m (65%)
$20.896m(58%)
Maintain artistic standards: • State Opera
– assessment by external independent panel each session
Positive Positive Positive Positive
– survey audience for response (% positive) 75% 75% 75% n/a• State Theatre
– external review / peer panel review (% positive) 80% 80% 80% n/a– survey audience for response (% positive) 80% 80% 80% n/a
Premier and Cabinet
2012–13 Agency Statements — Volume 4 47

Activity indicators
2012 13
Projection
2011 12Estimated
Result2011 12
Projection 2010 11
Actual
No. of Independent Makers and Presenters grant applications
300 299 263 275
No. of Independent Makers and Presenters grant applications approved
123 127 139 132
Average size of an Independent Makers and Presenters grant
$9 870 $10 299 $9 199 $9 967
Total no. of attendances achieved by: • Country Arts SA
– paid seats at performances and exhibition/gallery attendances
110 000 105 000 83 000 99 038
– unpaid attendances The decrease in the 2012–13 projection reflects the lower attendances expected at unpaid exhibition events due to Country Arts SA not being successful in securing Commonwealth Government funding for the Visual Arts Touring program. The 2010–11 Actual reflects lower attendances at regional galleries and the impact of the closure of the Riddoch Art Gallery for redevelopment for most of that year.
70 000 102 000 102 000 79 984
• State Opera – paid seats at performances 23 300 22 650 20 100 21 797– unpaid attendances 2 000 5 250 2 000 1 557
• State Theatre – paid seats at performances 32 000 31 025 34 960 39 905– unpaid attendances The State Theatre presented seven productions in 2010–11 compared to six in 2011–12. Six productions have been projected for 2012–13.
6 850 5 802 6 500 8 599
• Adelaide Festival Centre 810 000 825 000 800 000 838 131
Premier and Cabinet
48 2012–13 Agency Statements — Volume 4
Program 10: Aboriginal Affairs and Reconciliation
Description/objective
Program summary expenses, income and FTEs
2012–13Budget
2011–12Estimated
Result2011–12 Budget
2010–11Actual
$000 $000 $000 $000
Expenses Employee benefit expenses ......................................... 6 338 7 819 8 056 9 267Supplies and services................................................... 3 905 5 077 17 119 14 463Depreciation and amortisation expenses...................... 217 134 114 147Grants and subsidies.................................................... 4 443 3 558 3 481 3 550Other expenses ............................................................ 111 128 143 32
Total expenses 15 014 16 716 28 913 27 459
Income Commonwealth revenues............................................. — 173 205 167Grants and subsidies.................................................... 790 1 587 2 338 2 655Fees, fines and penalties.............................................. 35 40 1 982 3 334Sales of goods and services......................................... 48 56 69 129Interest revenue............................................................ — — — 31Net gain or loss from disposal of assets ....................... — — — -4Other income................................................................ — — 1 349 49
Total income 873 1 856 5 943 6 361
Net cost of providing services 14 141 14 860 22 970 21 098
FTEs as at 30 June (No.) 57.7 71.2 75.0 78.1
Financial commentary
2012–13 Budget/2011–12 Estimated Result
•
•
•
•
Premier and Cabinet
2012–13 Agency Statements — Volume 4 49

•
•
•
2011–12 Estimated Result/2011–12 Budget
•
•
•
•
2011–12 Estimated Result/2010–11 Actual
•
•
•
•
Highlights 2011–12
•
•
Premier and Cabinet
50 2012–13 Agency Statements — Volume 4

Targets 2012–13
•
•
•
•
•
•
Premier and Cabinet
2012–13 Agency Statements — Volume 4 51

Program 11: Shared Services
Description/objective
Program summary — expenses, income and FTEs
2012–13Budget
2011–12Estimated
Result2011–12 Budget
2010–11Actual
$000 $000 $000 $000
Expenses Employee benefit expenses ......................................... 64 316 64 675 61 437 57 677Supplies and services................................................... 40 431 37 152 45 068 43 930Depreciation and amortisation expenses...................... 3 576 3 743 3 568 2 950Other expenses ............................................................ 35 28 1 303 383
Total expenses 108 358 105 598 111 376 104 940
Income Sales of goods and services......................................... 99 034 95 651 94 593 92 935Interest revenue............................................................ 800 800 800 1 229Other income................................................................ — 3 99 289
Total income 99 834 96 454 95 492 94 453
Net cost of providing services 8 524 9 144 15 884 10 487
FTEs as at 30 June (No.) 794.2 824.8 850.5 775.8
Financial commentary
2012–13 Budget/2011–12 Estimated Result
2011–12 Estimated Result/2011–12 Budget
•
•
•
•
•
Premier and Cabinet
52 2012–13 Agency Statements — Volume 4

2011–12 Estimated Result/2010–11 Actual
Highlights 2011–12
•
•
•
Targets 2012–13
•
•
Performance indicators
2012 13
Target
2011 12Estimated
Result2011 12
Target 2010 11
Actual
% of accounts payable invoices accurately processed 99.9% 99.9% 99.9% 99.9%% of accounts receivable invoices raised within 3 days 95.0% 98.9% 95.0% 99.3%% of employee pays without underpayment or overpayment due to Shared Services SA error
99.5% 99.9% 99.5% 99.9%
% of base pays remitted on time 99.9% 99.5% 99.9% 99.5%% of bank reconciliations completed within agreed timeframes
90.0% 94.6% 90.0% 95.3%
% of activity statements lodged with ATO by the due date 99.0% 100% 99.0% 98.6%
Activity indicators
2012 13
Projection
2011 12Estimated
Result2011 12
Projection 2010 11
Actual
No. of accounts payable transactions per annum 2 553 017 2 558 856 2 532 901 2 544 679 No. of accounts receivable transactions per annum 1 445 894 1 446 828 1 373 239 1 396 639No. of employees paid or on payroll database 102 749 103 255 101 648 102 664No. of general ledger transactions 18 681 674 18 988 032 17 288 149 16 619 880No. of contracts managed 10 10 12 11Annual value of contracts managed $310m $296m $287m $285mManagement cost per annual dollar value of contract
The value of contracts managed is reported as the annualised value of all contracts. In previous years the cumulative total value of all contracts was shown.
$0.008 $0.007 $0.008 $0.006
Premier and Cabinet
2012–13 Agency Statements — Volume 4 53

Program 12: Community and Government Services
Description/objective
Sub-programs
Program summary — expenses, income and FTEs
2012–13Budget
2011–12Estimated
Result2011–12 Budget
2010–11Actual
$000 $000 $000 $000
Expenses Employee benefit expenses ......................................... 38 933 33 358 33 146 38 683Supplies and services................................................... 47 771 45 540 46 411 54 939Depreciation and amortisation expenses...................... 8 012 6 997 5 551 5 748Grants and subsidies.................................................... 364 230 — 176Other expenses ............................................................ 541 6 602 6 607 1 037
Total expenses 95 621 92 727 91 715 100 583
Income Grants and subsidies.................................................... 22 669 10 770 114 25Fees, fines and penalties.............................................. 467 455 456 546Sales of goods and services......................................... 56 750 54 226 47 688 54 422Interest revenue............................................................ — — — 70Net gain or loss from disposal of assets ....................... — — — 3Other income................................................................ — — 6 619 2 721
Total income 79 886 65 451 54 877 57 787
Net cost of providing services 15 735 27 276 36 838 42 796
FTEs as at 30 June (No.) 539.5 552.5 554.8 540.2
Premier and Cabinet
54 2012–13 Agency Statements — Volume 4
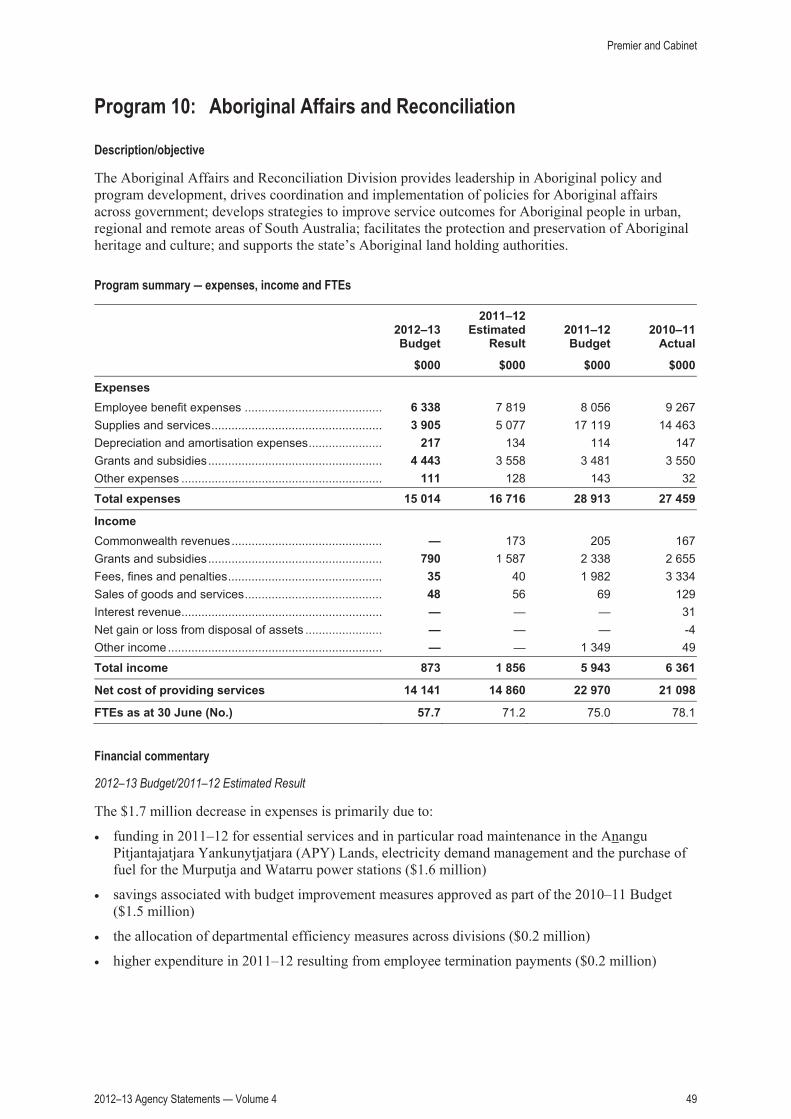
Sub-program 12.1: Information and Communication Technology Services
Description/objective
2012–13Budget
2011–12Estimated
Result2011–12 Budget
2010–11Actual
$000 $000 $000 $000
Expenses...................................................................... 44 974 42 333 40 937 46 381
Income.......................................................................... 38 121 35 585 35 662 39 772
Net cost of sub-program 6 853 6 748 5 275 6 609
FTEs as at 30 June (No.) 145.8 149.5 152.7 140.1
Financial commentary
2012–13 Budget/2011–12 Estimated Result
•
•
2011–12 Estimated Result/2011–12 Budget
2011–12 Estimated Result/2010–11 Actual
•
•
•
Premier and Cabinet
2012–13 Agency Statements — Volume 4 55

Highlights 2011–12
•
•
•
•
•
Targets 2012–13
•
•
•
•
•
•
•
Performance indicators
2012 13
Target
2011 12Estimated
Result2011 12
Target 2010 11
Actual
% of availability of central ICT infrastructure: • central data network 95.0% 99.9% 95.0% 99.9%• internet 99.0% 99.9% 99.0% 99.9%• email mailbox service 100.0% 99.8% 100.0% 99.8%% of agency ICT Cabinet submissions assessed within five business days
95.0% 98.0% 95.0% 95.6%
Activity indicators
2012 13
Projection
2011 12Estimated
Result2011 12
Projection 2010 11
Actual
Internet volumes — terabytes of data through the central data network
500 470 450 380
Outgoing phone call volumes 13.0m 13.2m 15.0m 14.4mEmail volumes: • legitimate incoming emails 30m 31m 30m 29m• blocked spam emails 200m 260m 330m 331mNo. of ICT assessments of agency Cabinet submissions and budget bids
175 195 175 175
56 2012–13 Agency Statements — Volume 4

Sub-program 12.2: Service SA
Description/objective
2012–13Budget
2011–12Estimated
Result2011–12 Budget
2010–11Actual
$000 $000 $000 $000
Expenses...................................................................... 39 681 39 600 39 539 43 563
Income.......................................................................... 38 936 27 111 16 424 15 348
Net cost of sub-program 745 12 489 23 115 28 215
FTEs as at 30 June (No.) 326.5 338.9 338.5 335.7
Financial commentary
2012–13 Budget/2011–12 Estimated Result
2011–12 Estimated Result/2011–12 Budget
2011–12 Estimated Result/2010–11 Actual
•
•
Highlights 2011–12
•
•
•
Premier and Cabinet
2012–13 Agency Statements — Volume 4 57

•
•
•
•
Targets 2012–13
•
•
•
•
Performance indicators
2012 13
Target
2011 12Estimated
Result2011 12
Target 2010 11
Actual
% growth in vehicle registration and licensing completed online
10% 22% 10% 20%
Average queue waiting time in face to face channel (minutes) <10:00 13:08 <10:00 12:04Average waiting time for an answer in the customer contact centre (minutes)
<5:00 4:26 <5:00 3:54
% of calls answered >85% 75% >85% 77%Cost per financial transaction $6.92 $6.96 $7.06 $7.94Customer satisfaction level >85% 65% >85% 79%
Activity indicators
2012 13
Projection
2011 12Estimated
Result2011 12
Projection 2010 11
Actual
No. of financial transactions processed 5.75m 5.69m 5.60m 5.49mNo. of inbound calls to customer contact centre 1.47m 1.42m 1.40m 1.33m
Premier and Cabinet
58 2012–13 Agency Statements — Volume 4

Sub-program 12.3: Archives and Records Management
Description/objective
2012–13Budget
2011–12Estimated
Result2011–12 Budget
2010–11Actual
$000 $000 $000 $000
Expenses...................................................................... 8 724 8 526 8 887 8 394
Income.......................................................................... 698 676 706 590
Net cost of sub-program 8 026 7 850 8 181 7 804
FTEs as at 30 June (No.) 53.2 51.2 47.6 52.4
Financial commentary
2012–13 Budget/2011–12 Estimated Result
2011–12 Estimated Result/2011–12 Budget
2011–12 Estimated Result/2010–11 Actual
Highlights 2011–12
•
Targets 2012–13
•
Premier and Cabinet
2012–13 Agency Statements — Volume 4 59

Activity indicators
2012 13
Projection
2011 12Estimated
Result2011 12
Projection 2010 11
Actual
No. of visitors to: • Leigh Street research centre 1 425 1 532 1 400 1 364• Gepps Cross research centre The 2012–13 Projection reduction reflects a move to online enquiries by email rather than visits.
1 400 1 500 1 660 1 646
No. of archived items retrieved: • Leigh Street research centre
Includes viewing of archived records that have been copied to microfiche/microfilm for preservation purposes
5 000 4 978 4 300 3 844
• Gepps Cross research centre Includes viewing of archived records that have been copied to microfiche/microfilm for preservation purposes. Includes records retrieved by state and local government for viewing off site. The 2011–12 Projection figure has been adjusted in comparison with that published in the 2011–12 Budget. .
17 400 17 326 17 000 17 114
No. of new public registered users 1 300 1 176 1 300 1 243
Sub-program 12.4: Government Publishing
Description/objective
2012–13Budget
2011–12Estimated
Result2011–12 Budget
2010–11Actual
$000 $000 $000 $000
Expenses...................................................................... 2 242 2 268 2 352 2 245
Income.......................................................................... 2 131 2 079 2 085 2 077
Net cost of sub-program 111 189 267 168
FTEs as at 30 June (No.) 14.0 13.0 16.0 12.0
Financial commentary
2012–13 Budget/2011–12 Estimated Result
2011–12 Estimated Result/2011–12 Budget
2011–12 Estimated Result/2010–11 Actual
Premier and Cabinet
60 2012–13 Agency Statements — Volume 4

Highlights 2011–12
•
•
Targets 2012–13
•
•
Performance indicators
2012 13
Target
2011 12Estimated
Result2011 12
Target 2010 11
Actual
Cost per impression $0.10 $0.12 $0.09 $0.10Total impressions produced per FTE 1.50m 1.27m 1.54m 1.35mSales per FTE $167 000 $155 000 $160 000 $151 000
Activity indicators
2012 13
Projection
2011 12Estimated
Result2011 12
Projection 2010 11
Actual
Impressions produced internally Production volume is subject to the level of parliamentary activity and the consequent demand for print production services. Demand over 2010–11 and 2011–12 has been relatively low.
18.0m 14.0m 20.0m 15.4m
No. of government gazette pages published 5 500 4 700 5 400 5 382
Premier and Cabinet
2012–13 Agency Statements — Volume 4 61

Program 13: Public Sector Performance
Description/objective
Sub-programs
Program summary expenses, income and FTEs
2012–13Budget
2011–12Estimated
Result2011–12 Budget
2010–11Actual
$000 $000 $000 $000
Expenses Employee benefit expenses ......................................... 3 455 3 636 1 711 3 176Supplies and services................................................... 2 066 2 145 1 175 1 506Depreciation and amortisation expenses...................... 34 11 12 25Grants and subsidies.................................................... — 21 — —Other expenses ............................................................ 74 68 27 10
Total expenses 5 629 5 881 2 925 4 717
Income Grants and subsidies.................................................... — — — 10Fees, fines and penalties.............................................. 23 22 8 43Sales of goods and services......................................... 720 701 627 702Other income................................................................ — — — 33
Total income 743 723 635 788
Net cost of providing services 4 886 5 158 2 290 3 929
FTEs as at 30 June (No.) 38.8 37.8 13.9 27.8
Sub-program 13.1: Office of Public Employment and Review
Description/objective
Premier and Cabinet
62 2012–13 Agency Statements — Volume 4

2012–13Budget
2011–12Estimated
Result2011–12 Budget
2010–11Actual
$000 $000 $000 $000
Expenses...................................................................... 2 804 3 085 2 925 3 424
Income.......................................................................... 712 694 635 723
Net cost of sub-program 2 092 2 391 2 290 2 701
FTEs as at 30 June (No.) 17.0 17.0 13.9 19.0
Financial commentary
2012–13 Budget/2011–12 Estimated Result
•
•
2011–12 Estimated Result/2011–12 Budget
2011–12 Estimated Result/2010–11 Actual
Highlights 2011–12
•
•
•
•
•
Targets 2012–13
•
•
•
•
Premier and Cabinet
2012–13 Agency Statements — Volume 4 63

Sub-program 13.2: Public Sector Management Division
Description/objective
2012–13Budget
2011–12Estimated
Result2011–12 Budget
2010–11Actual
$000 $000 $000 $000
Expenses...................................................................... 2 825 2 796 — 1 293
Income.......................................................................... 31 29 — 65
Net cost of sub-program 2 794 2 767 — 1 228
FTEs as at 30 June (No.) 21.8 20.8 — 8.8
Financial commentary
2012–13 Budget/2011–12 Estimated Result
2011–12 Estimated Result/2011–12 Budget
2011–12 Estimated Result/2010–11 Actual
•
•
Highlights 2011–12
•
•
•
•
•
•
•
Premier and Cabinet
64 2012–13 Agency Statements — Volume 4

Targets 2012–13
•
•
•
Premier and Cabinet
2012–13 Agency Statements — Volume 4 65

Program 14: Industrial Relations
Description/objective
Sub-programs
Program summary expenses, income and FTEs
2012–13Budget
2011–12Estimated
Result2011–12 Budget
2010–11Actual
$000
Expenses Employee benefit expenses ......................................... 34 361 35 739 35 461 35 426Supplies and services................................................... 17 400 17 783 18 697 19 603Depreciation and amortisation expenses...................... 1 202 950 1 206 467Grants and subsidies.................................................... 3 697 4 182 3 982 4 115Other expenses ............................................................ 694 658 680 124
Total expenses 57 354 59 312 60 026 59 735
Income Commonwealth revenues............................................. 2 200 2 400 2 400 3 003Grants and subsidies.................................................... 10 627 10 210 10 205 9 853Fees, fines and penalties.............................................. 13 644 13 426 13 429 13 173Sales of goods and services......................................... 432 808 843 597Net gain or loss from disposal of assets ....................... — — — -661Resources received free of charge............................... 1 428 1 393 1 393 1 359Other income................................................................ 56 55 55 181
Total income 28 387 28 292 28 325 27 505
Net cost of providing services 28 967 31 020 31 701 32 230
FTEs as at 30 June (No.) 353.3 366.2 357.0 361.1
Premier and Cabinet
66 2012–13 Agency Statements — Volume 4

Sub-program 14.1: SafeWork SA
Description/objective
2012–13Budget
2011–12Estimated
Result2011–12 Budget
2010–11Actual
$000 $000 $000 $000Expenses...................................................................... 47 582 49 490 50 310 50 952Income.......................................................................... 25 786 25 733 25 766 25 020
Net cost of sub-program 21 796 23 757 24 544 25 932
FTEs as at 30 June (No.) 292.9 300.8 295.0 298.8
Financial commentary
2012–13 Budget/2011–12 Estimated Result
•
•
2011–12 Estimated Result/2011–12 Budget
2011–12 Estimated Result/2010–11 Actual
•
•
Highlights 2011–12
•
•
•
•
•
•
•
Premier and Cabinet
2012–13 Agency Statements — Volume 4 67

Targets 2012–13
•
•
•
•
•
Performance indicators
2012 13
Target
2011 12Estimated
Result2011 12
Target 2010 11
Actual
South Australia’s Strategic Plan target T21 ‘Greater safety at work’ achieved
50% reduction in injury (2012–22)
Achieved 40% reduction (2002–2012)
Achieve 40% reduction (2002–2012)
Achieved 40% reduction (2002–2012)
% of advisory service telephone calls responded to in less than three minutes
90% 70% 90% 79%
Quality Adjusted Performance Indicator of Investigations (QAPI) — occupational work health, safety and welfare
100% 100% 100% 100%
Quality Adjusted Performance Indicator of Investigations (QAPI) — industrial relations
100% 80% 100% 81%
Activity indicators
2012 13
Projection
2011 12Estimated
Result2011 12
Projection 2010 11
Actual
No. of occupational work, health, safety and welfare workplace intervention activities
30 000 31 909 27 000 31 964
No. of occupational work health, safety and welfare investigations finalised Reduced amount in 2012–13 expected due to redefining of data from 1 July 2012 due to nationally harmonised work health and safety legislation.
3 000 5 893 3 000 4 449
No. of prevention initiatives delivered 300 320 300 334No. of industrial relations investigations finalised 300 213 300 347
Sub-program 14.2: Public Sector Workforce
Description/objective
•
•
•
Premier and Cabinet
68 2012–13 Agency Statements — Volume 4

2012–13Budget
2011–12Estimated
Result2011–12 Budget
2010–11Actual
$000 $000 $000 $000
Expenses...................................................................... 9 772 9 822 9 716 8 783
Income.......................................................................... 2 601 2 559 2 559 2 485
Net cost of sub-program 7 171 7 263 7 157 6 298
FTEs as at 30 June (No.) 60.4 65.4 62.0 62.9
Financial commentary
2012–13 Budget/2011–12 Estimated Result
2011–12 Estimated Result/2011–12 Budget
2011–12 Estimated Result/2010–11 Actual
•
•
Highlights 2011–12
•
•
•
•
•
•
Targets 2012–13
•
•
•
Premier and Cabinet
2012–13 Agency Statements — Volume 4 69

Program 15: State/Local Government Relations
Description/objective
•
•
•
Program summary expenses, income and FTEs
2012–13Budget
2011–12Estimated
Result2011–12 Budget
2010–11Actual
$000 $000 $000 $000
Expenses Employee benefit expenses ......................................... 2 015 2 020 1 577 1 832Supplies and services................................................... 350 547 178 187Grants and subsidies.................................................... 70 235 70 1 508
Total expenses 2 435 2 802 1 825 3 527
Income Grants and subsidies.................................................... — 165 — 1 485
Total income — 165 — 1 485
Net cost of providing services 2 435 2 637 1 825 2 042
FTEs as at 30 June (No.) 19.6 19.6 16.4 16.4
Financial commentary
2012–13 Budget/2011–12 Estimated Result
•
•
2011–12 Estimated Result/2011–12 Budget
•
•
•
Premier and Cabinet
70 2012–13 Agency Statements — Volume 4

2011–12 Estimated Result/2010–11 Actual
The $0.7 million decrease in expenses is primarily due to:
decreased funding in 2011–12 from the Local Government Reform Fund associated with improving asset and financial management practices within local government ($1.3 million)
partially offset by
a transfer of funding from other programs to reinstate corporate and departmental expense budgets that were held centrally within the former Department of Planning and Local Government ($0.6 million).
The $1.3 million decrease in income is due to decreased funding in 2011–12 from the Local Government Reform Fund associated with improving asset and financial management practices within local government.
Highlights 2011–12
Released a discussion paper, Local Government in SA — Improving Governance, for public consultation.
Progressed the development of codes and guidelines required under the accountability framework legislation.
Supported the Outback Communities Authority in the development of a framework for a community contribution levy and strategies to address growth pressures in outback communities.
Produced a new State/Local Government Relations Agreement and schedule that aligns local government programs with the government’s strategic priorities.
Targets 2012–13
Establish a framework for engagement and collaboration with the local government sector on South Australia’s seven strategic priorities.
Develop legislation to implement improved governance measures and support the implementation of the government’s public integrity and anti-corruption framework with regard to local government.
Implement a program to support small rural councils with financial sustainability and legislative compliance.
Premier and Cabinet
2012–13 Agency Statements — Volume 4 71

Premier and CabinetStatement of comprehensive income___________________________________________________________________________________________________________________________________________________________________________________________________________
2012–13Budget
$000
2011–12Estimated
Result
$000
2011–12Budget
$000
2010–11Actual
$000ExpensesEmployee benefit expenses Salaries, wages, annual and sick leave ............................ 146 792 107 065 66 688 65 646 Long service leave ............................................................ 5 301 3 013 2 506 2 667 Payroll tax ......................................................................... 7 949 5 781 3 340 3 908 Superannuation ................................................................ 16 072 12 415 8 032 7 996 Other ................................................................................. 2 064 3 048 1 821 6 468Supplies and services General supplies and services .......................................... 126 331 82 851 60 087 58 734 Consultancy expenses ...................................................... 2 509 2 255 2 023 1 935Depreciation and amortisation expenses .............................. 18 755 12 914 7 016 6 001Borrowing costs .................................................................... 12 12 12 — Grants and subsidies ............................................................ 34 881 38 737 48 836 38 797Intra-government transfers ................................................... 89 618 95 088 90 815 91 531Other expenses .................................................................... 2 121 1 970 1 624 945
Total expenses 452 405 365 149 292 800 284 628
IncomeCommonwealth revenues ..................................................... 2 200 3 726 3 239 5 124Intra-government transfers ................................................... 33 516 24 300 13 005 13 990Other grants .......................................................................... 1 808 1 807 1 615 864Fees, fines and penalties ...................................................... 9 152 8 955 10 892 12 014Sales of goods and services ................................................. 167 534 79 208 14 195 15 650Interest revenues .................................................................. 800 282 — 31Net gain or loss from disposal of assets ............................... — — — -665Resources received free of charge ....................................... 1 428 3 639 1 393 1 364Other income ........................................................................ 540 412 1 758 995
Total income 216 978 122 329 46 097 49 367
Net cost of providing services 235 427 242 820 246 703 235 261
Income from/expenses to state governmentIncome Appropriation .................................................................... 236 786 238 459 246 703 238 668 Other income .................................................................... — 3 675 — 2 818Expenses Cash alignment ................................................................. — 14 320 — —
Net income from/expenses to state government 236 786 227 814 246 703 241 486
Net result 1 359 -15 006 — 6 225
Other comprehensive incomeChanges in property, plant and equipment assetrevaluation surplus ................................................................ -1 600 1 600 — —
Total comprehensive result -241 -13 406 — 6 225
Premier and Cabinet
72 2012–13 Agency Statements — Volume 4

Premier and CabinetStatement of financial position___________________________________________________________________________________________________________________________________________________________________________________________________________
2012–13Budget
$000
2011–12Estimated
Result
$000
2011–12Budget
$000
2010–11Actual
$000AssetsCurrent assetsCash and cash equivalents ................................................... 44 920 36 005 11 706 34 833Receivables .......................................................................... 40 940 25 652 8 315 10 009Inventories ............................................................................ 24 24 18 24Other current assets ............................................................. 360 204 75 439
Total current assets 86 244 61 885 20 114 45 305
Non current assetsLand and improvements ....................................................... 157 121 162 117 155 315 151 030Plant and equipment ............................................................. 26 269 26 789 6 453 4 274Heritage assets ..................................................................... 4 698 4 698 4 698 4 698Intangible assets ................................................................... 5 182 2 360 258 195Other non-current assets ...................................................... 150 150 225 150
Total non-current assets 193 420 196 114 166 949 160 347
Total assets 279 664 257 999 187 063 205 652
LiabilitiesCurrent liabilitiesPayables ............................................................................... 38 214 34 880 14 455 28 571Employee benefits Salaries and wages .......................................................... 72 72 — 72 Annual leave ..................................................................... 10 871 7 673 5 259 5 286 Long service leave ............................................................ 4 276 3 543 2 774 2 891Short-term provisions ............................................................ 1 022 910 861 908Other current liabilities .......................................................... 1 280 251 214 251
Total current liabilities 55 735 47 329 23 563 37 979
Non current liabilitiesLong-term employee benefits Long service leave ............................................................ 31 451 21 015 14 654 12 711Long-term provisions ............................................................ 4 301 3 776 3 113 3 060Other non-current liabilities ................................................... 1 475 — — —
Total non-current liabilities 37 227 24 791 17 767 15 771
Total liabilities 92 962 72 120 41 330 53 750
Net assets 186 702 185 879 145 733 151 902
EquityContributed capital ................................................................ 45 221 45 221 45 221 45 221Retained earnings ................................................................. 126 937 124 514 85 094 92 137Asset revaluation reserve ..................................................... 14 544 16 144 15 418 14 544
Total equity 186 702 185 879 145 733 151 902
Balances as at 30 June end of period.
Premier and Cabinet
2012–13 Agency Statements — Volume 4 73

Premier and CabinetStatement of cash flows___________________________________________________________________________________________________________________________________________________________________________________________________________
2012–13Budget
$000
2011–12Estimated
Result
$000
2011–12Budget
$000
2010–11Actual
$000
Operating activitiesCash outflowsEmployee benefit payments ................................................. 177 258 130 466 81 243 89 436Payments for supplies and services ..................................... 126 524 83 519 60 523 58 353Interest paid .......................................................................... 12 12 12 — Grants and subsidies ............................................................ 34 881 38 737 48 836 38 005GST paid ............................................................................... — — — 19 957Intra-government transfers ................................................... 89 618 95 088 90 815 91 531Other payments .................................................................... 1 964 1 799 1 473 424
Cash used in operations 430 257 349 621 282 902 297 706
Cash inflowsIntra-government transfers ................................................... 33 516 24 300 13 005 13 990Commonwealth receipts ....................................................... 2 200 3 726 3 239 5 124Other grants .......................................................................... 1 808 1 807 1 615 2 926Fees, fines and penalties ...................................................... 9 152 8 955 10 892 12 649Sales of goods and services ................................................. 167 533 79 207 14 194 13 249Interest received ................................................................... 800 282 — 31GST received ........................................................................ — — — 19 155Other receipts ....................................................................... 506 412 1 758 1 037
Cash generated from operations 215 515 118 689 44 703 68 161
State governmentAppropriation ........................................................................ 236 786 238 459 246 703 238 668Other receipts ....................................................................... — 3 675 — 2 818Payments Cash alignment ................................................................. — 14 320 — —
Net cash provided by state government 236 786 227 814 246 703 241 486
Net cash provided by (+)/used in (-) operating activities 22 044 -3 118 8 504 11 941
Investing activitiesCash outflowsPurchase of property, plant and equipment .......................... 13 129 19 427 8 327 30 710Purchase of intangibles ........................................................ — 350 — —
Cash used in investing activities 13 129 19 777 8 327 30 710
Net cash provided by (+)/used in (-) investing activities -13 129 -19 777 -8 327 -30 710
Premier and Cabinet
74 2012–13 Agency Statements — Volume 4

Premier and CabinetStatement of cash flows___________________________________________________________________________________________________________________________________________________________________________________________________________
2012–13Budget
$000
2011–12Estimated
Result
$000
2011–12Budget
$000
2010–11Actual
$000
Financing activitiesCash inflowsCapital contributions from state government ........................ — — — 19 322Proceeds from restructuring activities ................................... — 24 067 — —
Cash generated from financing activities — 24 067 — 19 322
Net cash provided by (+)/used in (-) financing activities — 24 067 — 19 322
Net increase (+)/decrease (-) in cash equivalents 8 915 1 172 177 553
Cash and cash equivalents at the start of the period 36 005 34 833 11 529 34 280
Cash and cash equivalents at the end of the period 44 920 36 005 11 706 34 833
Non cash transactionsAssets received (+) / donated (-) free of charge ................... — 2 246 — —
Premier and Cabinet
2012–13 Agency Statements — Volume 4 75

Administered items for the Department of the Premier and CabinetStatement of comprehensive income___________________________________________________________________________________________________________________________________________________________________________________________________________
2012–13Budget
$000
2011–12Estimated
Result
$000
2011–12Budget
$000
2010–11Actual
$000ExpensesEmployee benefit expenses Salaries, wages, annual and sick leave ............................ 1 386 1 068 852 639 Long service leave ............................................................ 7 — — — Payroll tax ......................................................................... 33 17 8 — Superannuation ................................................................ 78 46 29 — Other ................................................................................. 46 23 — 1 583Supplies and services General supplies and services .......................................... 1 292 5 031 450 495 Consultancy expenses ...................................................... 16 8 — 91Depreciation and amortisation expenses .............................. 350 225 225 — Grants and subsidies ............................................................ 93 857 137 186 425 964Intra-government transfers ................................................... 705 829 336 535 6 710 6 750Other expenses .................................................................... 620 991 274 421 1 958 768
Total expenses 1 423 885 754 560 10 657 11 290
IncomeTaxation ................................................................................ 32 300 15 456 — — Commonwealth revenues ..................................................... 92 295 135 526 — 432Intra-government transfers ................................................... 654 166 307 612 100 100Other grants .......................................................................... 2 025 1 361 — — Fees, fines and penalties ...................................................... 244 162 — — Sales of goods and services ................................................. 35 — — — Interest revenues .................................................................. 104 9 4 1 386Other income ........................................................................ 618 857 278 363 — 1 652
Total income 1 400 026 738 489 104 3 570
Income from/expenses to state governmentIncome Appropriation .................................................................... 20 972 15 567 10 622 12 047
Net income from/expenses to state government 20 972 15 567 10 622 12 047
Total comprehensive result -2 887 -504 69 4 327
Premier and Cabinet
76 2012–13 Agency Statements — Volume 4

Administered items for the Department of the Premier and CabinetStatement of financial position___________________________________________________________________________________________________________________________________________________________________________________________________________
2012–13Budget
$000
2011–12Estimated
Result
$000
2011–12Budget
$000
2010–11Actual
$000AssetsCurrent assetsCash and cash equivalents ................................................... 32 775 36 221 36 061 44 526Receivables .......................................................................... 2 331 2 331 92 1 197Other current assets ............................................................. 3 3 — —
Total current assets 35 109 38 555 36 153 45 723
Non current assetsLand and improvements ....................................................... 3 136 2 510 4 050 — Plant and equipment ............................................................. 2 367 2 468 — —
Total non-current assets 5 503 4 978 4 050 —
Total assets 40 612 43 533 40 203 45 723
LiabilitiesCurrent liabilitiesPayables ............................................................................... 5 105 5 105 5 491 3 003Employee benefits Salaries and wages .......................................................... — — 94 — Annual leave ..................................................................... 60 60 105 — Long service leave ............................................................ 5 5 25 — Short-term provisions ............................................................ 25 31 1 517 1 161
Total current liabilities 5 195 5 201 7 232 4 164
Non current liabilitiesLong-term employee benefits Long service leave ............................................................ 201 201 121 — Long-term provisions ............................................................ 85 113 4 883 6 272
Total non-current liabilities 286 314 5 004 6 272
Total liabilities 5 481 5 515 12 236 10 436
Net assets 35 131 38 018 27 967 35 287
EquityRetained earnings ................................................................. 33 695 36 582 27 967 35 287Asset revaluation reserve ..................................................... 1 436 1 436 — —
Total equity 35 131 38 018 27 967 35 287
Balances as at 30 June end of period.
Premier and Cabinet
2012–13 Agency Statements — Volume 4 77

Administered items for the Department of the Premier and CabinetStatement of cash flows___________________________________________________________________________________________________________________________________________________________________________________________________________
2012–13Budget
$000
2011–12Estimated
Result
$000
2011–12Budget
$000
2010–11Actual
$000
Operating activitiesCash outflowsEmployee benefit payments ................................................. 1 780 8 700 2 715 2 607Payments for supplies and services ..................................... 1 308 5 039 450 3 460Grants and subsidies ............................................................ 93 857 137 186 425 964Intra-government transfers ................................................... 705 829 336 535 6 710 6 750Other payments .................................................................... 620 795 274 168 1 705 2 647
Cash used in operations 1 423 569 761 628 12 005 16 428
Cash inflowsTaxation ................................................................................ 32 300 15 456 — — Intra-government transfers ................................................... 654 166 307 612 100 100Commonwealth receipts ....................................................... 92 295 135 526 — 432Other grants .......................................................................... 2 025 1 361 — — Fees, fines and penalties ...................................................... 244 162 — — Sales of goods and services ................................................. 35 — — — Interest received ................................................................... 104 9 4 1 386Other receipts ....................................................................... 618 857 278 363 — 548
Cash generated from operations 1 400 026 738 489 104 2 466
State governmentAppropriation ........................................................................ 20 972 15 567 10 622 12 047
Net cash provided by state government 20 972 15 567 10 622 12 047
Net cash provided by (+)/used in (-) operating activities -2 571 -7 572 -1 279 -1 915
Investing activitiesCash outflowsPurchase of property, plant and equipment .......................... 875 947 — —
Cash used in investing activities 875 947 — —
Net cash provided by (+)/used in (-) investing activities -875 -947 — —
Financing activitiesCash inflowsProceeds from restructuring activities ................................... — 214 — 304
Cash generated from financing activities — 214 — 304
Net cash provided by (+)/used in (-) financing activities — 214 — 304
Net increase (+)/decrease (-) in cash equivalents -3 446 -8 305 -1 279 -1 611
Cash and cash equivalents at the start of the period 36 221 44 526 37 340 46 137
Cash and cash equivalents at the end of the period 32 775 36 221 36 061 44 526
Premier and Cabinet
78 2012–13 Agency Statements — Volume 4

Summary of major variations
Statement of comprehensive income — controlled
Expenses
•
•
•
•
•
Income
•
•
Statement of financial position — controlled
Premier and Cabinet
2012–13 Agency Statements — Volume 4 79

Statement of cash flows — controlled
Statement of comprehensive income — administered items
Expenses
Income
Statement of financial position — administered items
Statement of cash flows — administered items
Additional information for administered items
Premier and Cabinet
80 2012–13 Agency Statements — Volume 4

Additional information for administered items for the Department of the Premier and Cabinet Statement of cash flows
2012–13Budget
2011–12Estimated
Result2011–12 Budget
2010–11Actual
$000 $000 $000 $000
Operating activities
Cash outflows
Employee benefit payments Agent-General .................................................................. 111 106 325 120ANZAC Day Commemoration Fund.................................. — 3Government Workers Rehabilitation and Compensation Fund.......................................................... 230 7 546 1 826 1 570Local Government Grant Commission .............................. 359 352 352 221Outback Communities Authority........................................ 770 755 755 683Parliamentary salaries and electorate and expenses allowances........................................................ 310 383 564 549
Payments for supplies and services ANZAC Day Commemoration Fund.................................. 10 10 10 16APY Lands — additional services..................................... 88 85 85 717Commonwealth Essential Service Capital Works Fund .... — 1 951 — 2 562Government Workers Rehabilitation and Compensation Fund.......................................................... 364 355 355 134Local Government Grant Commission .............................. 180 400 177 239Outback Communities Authority........................................ 666 2 804 658 2 895
Grants and subsidies ANZAC Day Commemoration Fund.................................. 90 112 90 64APY Lands — additional services..................................... 346 335 335 165Local Government Grant Commission .............................. 90 910 200 279 158 254 161 961Local Government Tax Equivalent Regime....................... 2 060 2 085 2 085 —Outback Communities Authority........................................ 451 578 440 560Promotion of the state....................................................... — — — 720Other................................................................................. — — — 15
Intra-government transfers ANZAC Day Commemoration Fund.................................. — — — 5APY Lands — additional services..................................... 8 542 7 918 5 310 6 745Commonwealth Essential Service Capital Works Fund .... — 155 1 400 —Court Administration Authority .......................................... 1 255 1 255 1 255 401Emergency services levy .................................................. 43 170 42 585 43 344 42 137Hospital Fund — contribution............................................ 67 681 65 623 65 623 63 835Local Government Grant Commission .............................. 1 385 1 029 1 351 1 340Motor vehicle registration.................................................. 413 977 200 469 — —South Australia Police — expiation notices....................... 17 897 16 643 16 643 46 059South Australia Police — firearms .................................... 3 142 3 142 3 142 2 561State Taxation Office — stamp duties............................... 148 729 148 729 148 729 143 556Outback Communities Authority........................................ 2 2 2 —Promotion of the state....................................................... — 395 — —Other................................................................................. 49 32 — —
Premier and Cabinet
2012–13 Agency Statements — Volume 4 81

2012–13Budget
2011–12Estimated
Result2011–12 Budget
2010–11Actual
$000 $000 $000 $000
Other payments ANZAC Day Commemoration Fund.................................. — — — 5APY Lands — additional services..................................... — — — 3 303Local Government Grant Commission .............................. 8 8 8 —Motor Accident Commission ............................................. 595 422 577 520 577 520 586 203Outback Communities Authority........................................ 113 110 110 84Promotion of the state....................................................... 1 748 1 310 1 705 -661Other................................................................................. 23 504 22 607 22 607 22 125
Cash used in operations 1 423 569 1 307 668 1 055 060 1 090 892
Cash inflows
Taxation Emergency services levy .................................................. 32 300 31 800 32 209 31 267
Intra-government transfers ANZAC Day Commemoration Fund.................................. 100 100 100 100Court Administration Authority .......................................... 1 255 1 255 1 255 401Hospital Fund — contribution............................................ 67 681 65 623 65 623 63 835Motor vehicle registration.................................................. 413 977 200 469 — —Outback Communities Authority........................................ 1 385 1 203 1 351 2 542South Australia Police — expiation notices....................... 17 897 16 643 16 643 46 059South Australia Police — firearms .................................... 3 142 3 142 3 142 2 561State Taxation Office — stamp duties............................... 148 729 148 729 148 729 143 556Other................................................................................. — -46 — —
Commonwealth receipts Commonwealth Essential Service Capital Works Fund .... — 431 — 432Local Government Grant Commission .............................. 92 295 200 280 159 605 163 296Outback Communities Authority........................................ — 1 037 — 747
Other grants Local Government Tax Equivalent Regime....................... 2 025 2 050 2 050 1 749Outback Communities Authority........................................ — — — -15
Fees, fines and penalties Other................................................................................. 244 20 20 —
Sales of goods and services Local Government Grant Commission .............................. 29 28 28 27Outback Communities Authority........................................ 6 6 6 —
Interest received ANZAC Day Commemoration Fund.................................. — — — 2APY Lands — additional services..................................... — — — 1 380Local Government Tax Equivalent Regime....................... 35 35 35 45Local Government Grant Commission .............................. 33 33 33 98Outback Communities Authority........................................ 32 32 32 63Other................................................................................. 4 4 4 4
Premier and Cabinet
82 2012–13 Agency Statements — Volume 4

2012–13Budget
2011–12Estimated
Result2011–12 Budget
2010–11Actual
$000 $000 $000 $000
Other receipts Commonwealth Essential Service Capital Works Fund .... — — — 456Government Workers Rehabilitation and Compensation Fund.......................................................... — 5 720 — —Motor Accident Commission ............................................. 595 422 577 520 577 520 586 203Outback Communities Authority........................................ 126 153 125 168Other................................................................................. 23 309 20 853 20 807 22 125
Cash generated from operations 1 400 026 1 277 120 1 029 317 1 067 101
State government
Appropriation .......................................................................... 20 972 15 567 10 622 12 047
Net cash provided by state government 20 972 15 567 10 622 12 047
Net cash provided by (+)/used in (-) operating activities -2 571 -14 981 -15 121 -11 744
Investing activities
Cash outflows
Purchase of property, plant and equipment APY Lands — additional services..................................... 717 947 — —Outback Communities Authority........................................ 158 — — —
Cash used in investing activities 875 947 —
Net cash provided by (+)/used in (-) investing activities -875 -947 — —
Financing activities
Cash inflows
Proceeds from restructuring activities Other................................................................................. — 214 — 304
Cash generated from financing activities — 214 — 304
Net cash provided by (+)/used in (-) financing activities — 214 — 304
Net increase (+)/decrease (-) in cash equivalents -3 446 -15 714 -15 121 -11 440
Cash and cash equivalents at the start of the financial year (as at 1 July) 36 221 44 526 37 340 46 137
Cash and cash equivalents at the end of the financial year (as at 30 June)(a) 32 775 28 812 22 219 34 697
(a) Totals may vary from the statement of cash flows as a result of machinery of government changes.
Premier and Cabinet
2012–13 Agency Statements — Volume 4 83

Additional information for administered items for the Department of the Premier and Cabinet Reconciliation to statement of cash flows
2012–13Budget
2011–12Estimated
Result2011–12 Budget
2010–11Actual
$000 $000 $000 $000
Reconciliation to operating receipts Operating receipts(as per additional information for administered items) ............ 1 400 026 1 277 120 1 029 317 1 067 101Add: Costs transferred out
Attorney-General’s Department ........................................ — — — 92Less: Costs transferred in
Department of Planning and Local Government ............... — 67 718 163 265 168 720Department of Planning, Transport and Infrastructure ...... — 470 913 865 948 896 007
Equals: Operating receipts (as per administered items statement of cash flows) 1 400 026 738 489 104 2 466
Reconciliation to operating payments
Operating payments(as per additional information for administered items) ............ 1 423 569 1 307 668 1 055 060 1 090 892Add: Costs transferred out
Attorney-General’s Department ........................................ — — — 396Less: Costs transferred in
Department of Planning and Local Government ............... — 67 727 164 192 167 983Department of Planning, Transport and Infrastructure ...... — 478 313 878 863 906 877
Equals: Operating payments (as per administered items statement of cash flows) 1 423 569 761 628 12 005 16 428
Premier and Cabinet
84 2012–13 Agency Statements — Volume 4

Agency: Department of Primary Industries and Regions
Minister for Agriculture, Food and Fisheries Minister for Forests Minister for Regional Development
2012–13 Agency Statements — Volume 4 85

Primary Industries and Regions
86 2012–13 Agency Statements — Volume 4

Contents
Objective....................................................................................................................................... 88 Ministerial responsibilities............................................................................................................. 88 Ministerial office resources ........................................................................................................... 89 Workforce summary ..................................................................................................................... 90 Program net cost of services summary ........................................................................................ 91 Investing expenditure summary.................................................................................................... 91 Program 1: Agriculture, Food and Fisheries .............................................................................. 92 Program 2: Forestry Policy ...................................................................................................... 105 Program 3: Regional Development.......................................................................................... 107 Financial statements................................................................................................................... 109 Summary of major variations ...................................................................................................... 117 Additional information for administered items............................................................................. 120
Primary Industries and Regions
2012–13 Agency Statements — Volume 4 87

Objective
The Department of Primary Industries and Regions (PIRSA) mission of growing sustainable, competitive regions is reflected in targets in South Australia’s Strategic Plan. These targets include growing the contribution made by the South Australian food industry to $20.0 billion by 2020 and increasing regional populations outside Greater Adelaide to 320 000 or more by 2020. PIRSA also has a leading role implementing and coordinating the government’s strategic priority of ‘clean, green food as our competitive edge’.
To assist in achieving South Australia’s Strategic Plan targets PIRSA has the additional objectives of:
• securing sustainable access to resources such as land, water and stock
• enhancing and growing the efficiency and value of production
• ensuring and expanding access to markets
• working with South Australia’s regional communities to enhance sustainable economic prosperity.
Following the machinery of government changes in October 2011, the Department of Primary Industries and Regions SA has been reformed as the new ‘PIRSA’. With the transfer of the Minerals and Energy Division responsibilities to the Department for Manufacturing, Innovation, Trade, Resources and Energy, and the inclusion of Regional Development within the new PIRSA structure, the agency is positioned to capitalise on the close relationship between the agribusiness and seafood industries and the viability of our regions. These connections are further strengthened by the realignment of ministerial portfolios to create a link between PIRSA and the South Australian Tourism Commission, providing opportunities for integrated regional food, wine and tourism initiatives, and are in addition to PIRSA’s traditional responsibilities around policy development, research, biosecurity and integrated solutions for agriculture, seafood, forestry, fibre, wine and food.
Ministerial responsibilities
Minister Programs Sub-programs 1. Agriculture, Food and Fisheries 1.1 Agriculture, Food and Wine
1.2 Aquaculture 1.3 Fisheries 1.4 South Australian Research and
Development Institute (SARDI) 1.5 Rural Services 1.6 Biosecurity
2. Forestry Policy Nil
The Hon. GE Gago Minister for Agriculture, Food and Fisheries Minister for Forests Minister for Regional Development
3. Regional Development(a) Nil
(a) The administrative responsibility for Regional Development transferred to PIRSA during 2011–12. This was previously reflected in the former Department of Trade and Economic Development, Program 2 ‘Thriving Regions’.
Primary Industries and Regions
88 2012–13 Agency Statements — Volume 4

Administered items
In addition to the above responsibilities, the agency administers the following items on behalf of the minister:
• Adelaide Hills Wine Industry Fund
• Apiary Industry Fund
• Aquaculture Lease Rehabilitation Fund
• Aquaculture Resource Management Fund
• Barossa Wine Industry Fund
• Cattle Industry Fund
• Citrus Growers Fund
• Clare Valley Wine Industry Fund
• Deer Industry Fund
• Dog Fence Board
• Egg Industry Deregulation Fund
• Eyre Peninsula Grain Grower’s Rail Fund
• Fisheries Research and Development Fund
• ForestrySA community service obligation
• Grains industry levy
• Langhorne Creek Wine Industry Fund
• McLaren Vale Wine Industry Fund
• Olive Industry Fund
• Pig Industry Fund
• Riverland Wine Industry Fund
• Rock Lobster Fishing Industry Fund
• SA Grape Growers Industry Fund
• Samcor Funds Administration
• Seed Levies Fund
• Sheep Industry Fund.
Statutes
The Department of the Premier and Cabinet maintains a list of statutes applicable to ministers.
Ministerial office resources
2012–13 Budget
Cost of provision
Minister $000 FTE
The Hon. GE Gago................................................................................. 1 798 11.0
Primary Industries and Regions
2012–13 Agency Statements — Volume 4 89

Workforce summary
FTEs as at 30 June
Agency
2012–13Budget(a)
2011–12Estimated
Result(a)
2010–11Actual
Department of Primary Industries and Regions.................................. 1 035.5 1 074.5 1 000.9Administered items for the Department of Primary Industries and Regions(b) .................................................................................... 1.0 1.0 3.5
Total 1 036.5 1 075.5 1 004.4
Add: FTEs transferred out:Minerals and Energy Resources Division and the Olympic Dam Taskforce together with the Investment and Strategic Projects Unit and parts of the Policy and Planning Unit and Industry Regional and Community Engagement Unit to the Department for Manufacturing, Innovation, Trade, Resources and Energy ................................................................................................................. 225.8
Less: FTEs transferred in:Regional Development from the Department for Manufacturing, Innovation, Trade, Resources and Energy ........................................................... 8.5
Equals: Data published by the Office of Public Employment and Review (Department of the Premier and Cabinet) 1 221.7
(a) The 2012–13 Budget and 2011 12 Estimated Result reflect the established FTE caps.
(b) Administered items FTEs are not included in the agency program information.
Primary Industries and Regions
90 2012–13 Agency Statements — Volume 4

Program net cost of services summary
Net cost of services
2012–13Budget
2011–12Estimated
Result2011–12 Budget
2010–11Actual
Program $000 $000 $000 $000
1. Agriculture, Food and Fisheries .......................... 73 998 84 912 81 760 106 988
2. Forestry Policy .................................................... 1 678 2 025 2 053 2 011
3. Regional Development........................................ 14 605 11 923 11 418 5 578
Total 90 281 98 860 95 231 114 577
Reconciliation to agency net cost of providing services
Less: Net costs transferred in:
Regional Development from the Department for Manufacturing, Innovation, Trade, Resources and Energy on 1 January 2012.............................. — 3 570 11 418 5 578
Add: Net costs transferred out:
Minerals and Energy Resources Division and the Olympic Dam Taskforce together with the Investment and Strategic Projects Unit and parts of the Policy and Planning Unit and Industry Regional and Community Engagement Unit to the Department for Manufacturing, Innovation, Trade, Resources and Energy............. — 11 655 30 082 22 805
Equals: Net cost of providing services (as per agency statement of comprehensive income) 90 281 106 945 113 895 131 804
Investing expenditure summary
2012–13Budget
2011–12Estimated
Result2011–12 Budget
2010–11Actual
Investments $000 $000 $000 $000
Existing projects National Collaborative Research Infrastructure Strategy — Integrated Marine Observation System (IMOS) ...................................................... — — — 63National Collaborative Research Infrastructure Strategy — Photobioreactor................................... — 1 134 34 585PIRSA Fisheries Accommodation .......................... — — — 1 853
Total existing projects — 1 134 34 2 501
Annual programs Minor Capital Works and Equipment...................... 5 014 5 146 4 967 4 443
Total annual programs 5 014 5 146 4 967 4 443
Total investing expenditure 5 014 6 280 5 001 6 944
Primary Industries and Regions
2012–13 Agency Statements — Volume 4 91

Program 1: Agriculture, Food and Fisheries
Description/objective
Leading in the development and delivery of the government’s key priority of ‘clean, green food as our competitive edge’ to drive growth and sustainable development of the state’s primary industry resources.
Sub-programs
1.1 Agriculture, Food and Wine
1.2 Aquaculture
1.3 Fisheries
1.4 South Australian Research and Development Institute (SARDI)
1.5 Rural Services
1.6 Biosecurity
Program summary — expenses, income and FTEs
2012–13Budget
2011–12Estimated
Result2011–12 Budget
2010–11Actual
$000 $000 $000 $000
Expenses Employee benefit expenses ......................................... 83 803 89 112 86 459 96 942Supplies and services................................................... 57 619 63 446 58 232 63 268Depreciation and amortisation expenses...................... 6 035 6 296 6 421 5 674Borrowing costs ............................................................ 1 124 326 142 59Grants and subsidies.................................................... 8 895 21 551 25 015 35 279Intra-government transfers ........................................... 582 675 1 718 2 511Other expenses ............................................................ 832 1 427 1 858 2 652
Total expenses 158 890 182 833 179 845 206 385
Income Commonwealth revenues............................................. 3 597 15 774 16 768 24 748Intra-government transfers ........................................... 16 432 17 474 17 830 19 208Other grants.................................................................. 28 482 32 164 29 563 22 932Fees, fines and penalties.............................................. 3 240 2 262 2 342 2 091Sales of goods and services......................................... 26 199 24 229 26 083 24 362Interest revenue............................................................ 3 895 2 817 2 494 2 391Net gain or loss from disposal of assets ....................... — 224 — -95Other income................................................................ 3 047 2 977 3 005 3 760
Total income 84 892 97 921 98 085 99 397
Net cost of providing services 73 998 84 912 81 760 106 988
FTEs as at June (No.) 1 015.1 1 052.0 1 051.2 978.0
Primary Industries and Regions
92 2012–13 Agency Statements — Volume 4

Sub-program 1.1: Agriculture, Food and Wine
Description/objective
Leading the increase in agriculture, food and wine sectors’ contribution to South Australia’s economy through the ‘clean, green food as our competitive edge’ government priority.
2012–13Budget
2011–12Estimated
Result2011–12 Budget
2010–11Actual
$000 $000 $000 $000
Expenses...................................................................... 16 221 28 975 31 447 41 466
Income.......................................................................... 4 972 14 418 16 281 24 156
Net cost of sub-program 11 249 14 557 15 166 17 310
FTEs as at June (No.) 57.5 61.0 73.4 59.3
Financial commentary
2012–13 Budget/2011–12 Estimated Result
The $12.8 million decrease in expenses is primarily due to:
• reduced expenditure for the Exceptional Circumstances Interest Rate Subsidy program in 2012–13 due to reduction in declared areas ($11.8 million)
• reduction in administrative resources as a result of the reduced Exceptional Circumstances Interest Rate Subsidy program in 2012–13 ($1.0 million)
• reduction in service delivery to meet budget savings targets in 2012–13 ($0.7 million)
partially offset by
• increase in budgeted borrowing costs associated with increased lending under the Loans to Cooperatives scheme in 2012–13 ($0.8 million).
The $9.4 million decrease in income is primarily due to:
• lower Commonwealth funding for Exceptional Circumstances Interest Rate Subsidy program in line with a reduced program in 2012–13 ($10.6 million)
partially offset by
• increase in budgeted interest earnings largely as a result of increased lending under the Loans to Cooperatives scheme ($0.8 million).
2011–12 Estimated Result/2011–12 Budget
The $2.5 million decrease in expenses is primarily due to:
• lower than budgeted expenditure for Exceptional Circumstances Interest Rate Subsidies in line with demand in 2011–12 ($1.6 million)
• budget transfers to Sub-program 1.4 ‘South Australian Research and Development Institute’ to deliver on the Graduate Access Program and the Food Technology Program in 2011–12 ($0.5 million).
The $1.9 million decrease in income is primarily due to:
• reduced intra-government transfer revenue following changed functional responsibility for Branched Broomrape ($0.6 million)
Primary Industries and Regions
2012–13 Agency Statements — Volume 4 93

• lower Commonwealth funding for Exceptional Circumstances Interest Rate Subsidy program in line with a reduced program in 2011–12 ($1.4 million).
2011–12 Estimated Result/2010–11 Actual
The $12.5 million decrease in expenses is primarily due to:
• reduced expenditure for Exceptional Circumstances Interest Rate Subsidy program in 2011–12 due to reduction in declared areas ($10.9 million)
• completion of the State Drought Response program in 2010–11 ($4.3 million)
partially offset by
• once-off rationalisation of service delivery as part of budget savings measures in 2010–11 ($2.5 million).
The $9.7 million decrease in income is primarily due to:
• lower Commonwealth funding for Exceptional Circumstances Interest Rate Subsidy program in line with a reduced program in 2011–12 ($9.8 million)
• reduced intra-government transfer revenue following changed functional responsibility for Branched Broomrape ($0.6 million)
partially offset by
• increase in budgeted interest earnings largely as a result of increased lending under the Loans to Cooperatives scheme ($0.4 million).
Highlights 2011–12
• Coordinated the whole of government response to the National Food Plan including a state government understanding of food security and implications for cross-government policy.
• South Australian seafood, meat and forestry market overview reports were released in 2011–12. Priority project plans from the seafood and grains market overview are currently being implemented in the tuna and oats industries.
• Promoted the findings of the National Lamb Value Chain project through national and state governments and the South Australian food industry.
• Implemented the recommendations of Professor Fearne’s Thinker in Residence report titled Sustainable Food and Wine Value Chains including the ‘clean, green food as our competitive edge’ government initiative.
• Ensured all seven wine industry fund bodies completed their consultations on the renewal of the funds within the time stipulated.
• Development approval was granted for the development of a multi-species processing facility near Port Pirie.
Targets 2012–13
• Drive the ‘clean green food as our competitive edge’ government priority theme across PIRSA and other government agencies.
• Partner with industry to develop and commence implementation of the regional food wine and tourism framework to re-energise South Australian regions to take responsibility for their regional branding, developing appellation timing and security required for global brand recognition.
• Lead the implementation of the carbon farming initiative in South Australia.
• Prepare state and regional scorecards in line with government priorities.
• Continue to drive South Australia’s contribution to the next stage of the National Food Plan.
Primary Industries and Regions
94 2012–13 Agency Statements — Volume 4

Sub-program 1.2: Aquaculture
Description/objective
Ensuring the sustainable development of South Australia’s aquaculture industry, with a statutory and regulatory responsibility for the planning and management of aquaculture in South Australia. These responsibilities are met through the zoning, granting and renewal of licences and leases under the
.
Through ensuring the ecologically sustainable development of the state’s aquatic resources, aquaculture will be a key contributor to the government’s strategic priority of ‘clean green food as our competitive edge’, securing production and economic opportunities for the future.
2012–13Budget
2011–12Estimated
Result2011–12 Budget
2010–11Actual
$000 $000 $000 $000
Expenses...................................................................... 3 162 2 530 2 877 2 803
Income.......................................................................... 2 128 1 924 1 709 1 248
Net cost of sub-program 1 034 606 1 168 1 555
FTEs as at June (No.) 22.8 18.5 22.2 17.9
Financial commentary
2012–13 Budget/2011–12 Estimated Result
The $0.6 million increase in expenses is primarily due to:
• reinstatement of the expenditure base in 2012–13 as a result of once-off reduced lease and licence fees revenue in 2011–12 ($0.3 million)
• increased expenditure in 2012–13 for South Australia to host the 2014 World Aquaculture Symposium ($0.1 million).
The $0.2 million increase in income is primarily due to:
• increased cost recovery from industry in 2012–13 ($0.4 million)
• reinstatement of the revenue base in 2012–13 following a once-off reduction in lease and licence fees revenue in 2011–12 ($0.3 million)
partially offset by
• once-off revenue in 2011–12 from the Fisheries Research and Development Corporation for specific projects largely delivered by SARDI ($0.3 million)
• once-off revenue in 2011–12 from gain on sale of surplus land at Torrens Island ($0.2 million).
2011–12 Estimated Result/2011–12 Budget
The $0.3 million decrease in expenses is primarily due to a reduction in the 2011–12 lease and licence fees revenue.
The $0.2 million increase in income is primarily due to:
• once-off revenue primarily from the Fisheries Research and Development Corporation for specific projects largely delivered by SARDI ($0.3 million)
• once-off revenue in 2011–12 from gain on sale of surplus land at Torrens Island ($0.2 million)
Primary Industries and Regions
2012–13 Agency Statements — Volume 4 95

partially offset by
• reduction in 2011–12 lease and licence fees revenue ($0.3 million).
2011–12 Estimated Result/2010–11 Actual
The $0.3 million decrease in expenses flows from a reduction in lease and licence fees revenue in 2011–12.
The $0.7 million increase in income is primarily due to:
• increased cost recovery from industry for resources applied by government which are of benefit to industry in 2011–12 ($0.4 million)
• once-off revenue from the Fisheries Research and Development Corporation for specific projects largely delivered by SARDI in 2011–12 ($0.3 million)
• once-off revenue in 2011–12 from gain on sale of surplus land at Torrens Island ($0.2 million)
partially offset by
• once-off reduction in 2011–12 lease and licence fees revenue ($0.3 million).
Highlights 2011–12
• Successfully trialled a new approach to aquaculture compliance with the oyster sector.
• Established a framework to address concerns of aquaculture derived marine debris through a coordinated initiative between the aquaculture industry and the state government.
• Reviewed transaction procedures to create further efficiencies and consistent processes for licence and lease assessments, responses to industry on aquatic animal health issues and reportable events under regulation.
• Amended the (the first of its kind in Australia) to streamline processes.
Targets 2012–13
• Extend new aquaculture compliance approach to the landbased and tuna sectors to address the key environmental, regulatory compliance and aquatic animal health risks they pose.
• Monitor the implementation of the Adopt a Beach program established for the aquaculture and fisheries industries in the Port Lincoln area to address marine debris issues and community concerns. PIRSA will evaluate the effectiveness of this program in consultation with industry.
• Progress work on a memorandum of administrative agreements with relevant government agencies involved in the aquaculture zoning, licensing and leasing assessment process as a red tape reduction initiative.
• Establish policy positions that allow for continued and innovative development within the industry to realise the industry’s full potential (for example renewal policy, and broodstock and seedstock policy).
• Initiate zone policies for the Ceduna and Franklin Harbour areas.
• Commence review of the Aquaculture Regulations 2005.
Sub-program 1.3: Fisheries
Description/objective
PIRSA manages the ecologically sustainable development of the state’s aquatic resources with a focus on the importance of fishing to regional areas. The management and administration of the living
Primary Industries and Regions
96 2012–13 Agency Statements — Volume 4

marine and freshwater resources of South Australia, is required under the . This includes the development and implementation of appropriate management plans for the
commercial fishing, recreational and Aboriginal traditional fishing sectors; development of government policy for sustainable resource access and allocation; and the administration of licensing and compliance services.
Fisheries management enables several production and economic opportunities that can contribute to the government’s priority of clean, green food bowl.
2012–13Budget
2011–12Estimated
Result2011–12 Budget
2010–11Actual
$000 $000 $000 $000
Expenses...................................................................... 14 318 14 605 14 127 15 799
Income.......................................................................... 7 411 8 031 8 081 7 446
Net cost of sub-program 6 907 6 574 6 046 8 353
FTEs as at June (No.) 94.4 95.2 89.8 93.6
Financial commentary
2012–13 Budget/2011–12 Estimated Result
The $0.3 million decrease in expenses is due to:
• once-off project expenditure for sardine fishery and other research projects undertaken in 2011–12 ($0.4 million)
• targeted voluntary separation package payments in 2011–12 ($0.1 million)
partially offset by
• restoration of expenditure budget in 2012–13 following once-off reclassification to investing expenditure in 2011–12 for a fisheries vessel and other equipment purchases ($0.1 million).
The $0.6 million decrease in income is primarily due to:
• once-off external funding for project expenditure for sardine fishery and other research projects undertaken in 2011–12 ($0.4 million)
• once-off revenue in 2011–12 initially budgeted for under Sub-program 1.6 ‘Biosecurity’ in 2011–12 ($0.2 million).
2011–12 Estimated Result/2011–12 Budget
The $0.5 million increase in expenses is primarily due to:
• once-off project expenditure for sardine fishery and other research projects undertaken in 2011–12 ($0.4 million)
• targeted voluntary separation package payments in 2011–12 ($0.1 million)
partially offset by
• lower than budgeted program expenditure to offset reduced income following commercial license fee setting process with industry for 2011–12 ($0.2 million).
Primary Industries and Regions
2012–13 Agency Statements — Volume 4 97

2011–12 Estimated Result/2010–11 Actual
The $1.2 million decrease in expenses is primarily due to:
• once-off establishment costs of new fisheries accommodation at Largs North in 2010–11 ($0.4 million)
• reduction in targeted voluntary separation package payments in 2011–12 ($0.2 million)
• lower than initially budgeted program expenditure to offset reduced income following commercial license fee setting process with industry for 2011–12 ($0.2 million)
• reduction in externally funded project expenditure in 2011–12 ($0.1 million)
• once-off expenditure reclassification from operating to investing in 2011–12 to meet a fisheries vessel and other equipment purchases in 2011–12 ($0.1 million).
The $0.6 million increase in income is primarily due to:
• increased cost recovery from industry for resources applied by government which are of benefit to industry in 2011–12 ($0.5 million)
• once-off revenue in 2011–12 initially budgeted under Sub-program 1.6 ‘Biosecurity’ in 2011–12 ($0.2 million)
partially offset by
• lower than budgeted revenue following commercial license fee setting process with industry for 2011–12 ($0.2 million)
• reduction in external funding for specific projects in 2011–12 ($0.1 million).
Highlights 2011–12
• Implemented fisheries management measures for King George whiting to enable the fishery to be declared stable and sustainably fished.
• Completed an independent review of the Gulf St Vincent prawn fishery’s harvest strategy and stock assessment.
• Developed and implemented new management arrangements to increase industry flexibility, improve economic performance and enhance sustainability outcomes in the Gulf St Vincent prawn fishery.
• Implemented management plans for the charter boat fishery, the commercial blue crab fishery and Pelican Lagoon aquatic reserve.
• Released a draft management plan for the Lake Eyre Basin fishery.
Targets 2012–13
• Progress the development of management plans for the southern and northern zone rock lobster fisheries.
• Implement a management strategy to recover the garfish fishery.
• Implement new management arrangements for the snapper fishery, following the review process.
Primary Industries and Regions
98 2012–13 Agency Statements — Volume 4

Sub-program 1.4: South Australian Research and Development Institute
Description/objective
South Australia’s principal provider of primary industries natural resources and biosciences research and development, working in collaboration with state, national and international collaborators and investors. SARDI’s strategic, applied and adaptive research provides the innovation needed to underpin the competitive advantage achieved through the production of clean and green food through secure and sustainable production systems.
2012–13Budget
2011–12Estimated
Result2011–12 Budget
2010–11Actual
$000 $000 $000 $000
Expenses...................................................................... 76 971 77 900 76 234 77 525
Income.......................................................................... 46 004 46 428 45 429 41 390
Net cost of sub-program 30 967 31 472 30 805 36 135
FTEs as at June (No.) 508.6 510.1 510.4 452.5
Financial commentary
2012–13 Budget/2011–12 Estimated Result
The $0.9 million decrease in expenses is primarily due to:
• a reduction in research and development activity and service delivery to meet budget savings targets in 2012–13 ($1.0 million)
• targeted voluntary separation package payments in 2011–12 ($0.9 million)
• expenditure related to the National Collaboration Research Infrastructure Strategy Photobioreactor project in 2011–12 ($0.5 million)
• expenditure related to the Graduate Access Program and Food Technology Program transferred from Sub-Program 1.1 ‘Agriculture, Food and Wine’ in 2011–12 ($0.5 million)
partially offset by
• annual indexation and enterprise bargaining agreement adjustments ($1.9 million).
The $0.4 million decrease in income is primarily due to:
• funding for the National Collaboration Research Infrastructure Strategy Photobioreactor project in 2011–12 ($1.6 million)
partially offset by
• annual indexation on fees and charges ($1.1 million).
2011–12 Estimated Result/2011–12 Budget
The $1.7 million increase in expenses is primarily due to:
• targeted voluntary separation package payments in 2011–12 ($0.9 million)
• increased expenditure for the National Collaboration Research Infrastructure Strategy Photobioreactor project ($0.5 million)
• increased expenditure for the Graduate Access Program and Food Technology Program transferred from Sub-Program 1.1 ‘Agriculture, Food and Wine’ ($0.5 million).
Primary Industries and Regions
2012–13 Agency Statements — Volume 4 99

The $1.0 million increase in income is primarily due to increased funding for the National Collaboration Research Infrastructure Strategy Photobioreactor project ($1.6 million).
2011–12 Estimated Result/2010–11 Actual
The $0.4 million increase in expenses is primarily due to:
• reinstatement of expenditure base in 2011–12 following lower than expected externally funded projects undertaken and project lags in 2010–11 ($4.4 million)
partially offset by
• a reduction in research and development activity and service delivery to meet budget savings targets in 2011–12 ($2.7 million)
• a write-off of assets in 2010–11 ($0.7 million)
• higher expenditure for the National Collaboration Research Infrastructure Strategy Photobioreactor project in 2010–11 ($0.5 million).
The $5.0 million increase in income is primarily due to lower than expected externally funded projects undertaken and project lags in 2010–11.
Highlights 2011–12
• Climate change impacts on plant growth models in Mount Lofty Ranges:
– SARDI has modelled the impact of climate change projections on plant growth and water resources in the Onkaparinga catchment
– SARDI contributed to the validation of catchment hydrological models. This information contributed to the scientific basis of the long-term water allocation plans for the Mount Lofty Ranges.
• Food Innovation/Food SA Graduate Access Program:
– 15 graduates from a range of food technology, science engineering and management and marketing courses were placed in the food industry. The program facilitated mentoring, professional support and industry networking opportunities for recent graduates.
• New value-added product delivery for the abalone and sardine industries:
– optimised post-harvest value-added processes from raw material supply of sardines and abalone to final receipt of product by the customer
– SARDI developed and evaluated a range of new sardine products for human consumption from concept to test market and a range of new Australian wild caught abalone products for direct supply to China.
• Perennial forage species:
– delivered to market a new pest and disease resistant lucerne variety bred to withstand heavy grazing pressure to fill a gap in the availability of varieties for the cropping areas. The new variety benefits both livestock producers and grain growers by providing additional feed sources in cropping areas as well as providing rotational benefits of increased soil nitrogen, improved soil structure and a reduction of cereal root diseases.
Targets 2012–13
• Development of a seafood compositional profile across the broad range of seafood product.
• Modelling climate change heat stress impacts on wine grapes.
Primary Industries and Regions
100 2012–13 Agency Statements — Volume 4

• Sustainability of long-term future of marine species of the Murray-Darling Basin leveraged off ongoing implementation of the native fish strategy.
Sub-program 1.5: Rural Services
Description/objective
Rural Solutions SA is a primary industries and natural resources consultancy business competing both locally and globally whilst retaining valuable technical skills for the benefit of the state’s regions. Rural Solutions SA’s high calibre consultants deliver practical solutions to their customers by utilising their knowledge and understanding of regional communities, industries and businesses and environments and providing high quality, value for money outcomes. Customers include government agencies, natural resource management bodies, agricultural industry development organisations, food, wine, forestry and resources companies, regional bodies, primary producers and community groups.
2012–13Budget
2011–12Estimated
Result2011–12 Budget
2010–11Actual
$000 $000 $000 $000
Expenses...................................................................... 20 315 22 234 20 957 24 518
Income.......................................................................... 16 105 15 234 15 404 15 079
Net cost of sub-program 4 210 7 000 5 553 9 439
FTEs as at June (No.) 153.7 157.3 154.3 150.4
Financial commentary
2012–13 Budget/2011–12 Estimated Result
The $1.9 million decrease in expenses is primarily due to:
• targeted voluntary separation package payments in 2011–12 ($1.5 million)
• decreased expenditure in Rural Solutions SA resulting from efficiency measures, workforce adjustments and rationalisation of services in 2012–13 ($0.6 million).
The $0.9 million increase in income is primarily due to the move to full cost recovery.
2011–12 Estimated Result/2011–12 Budget
The $1.3 million increase in expenses is primarily due to targeted voluntary separation package payments in 2011–12 ($1.5 million).
2011–12 Estimated Result/2010–11 Actual
The $2.3 million decrease in expenses is primarily due to:
• decreased expenditure in Rural Solutions SA to meet savings measures in 2011–12 ($1.6 million)
• once-off expenditure for a component of the Plague Locust Emergency Response program in 2010–11 ($1.2 million)
partially offset by
• higher targeted voluntary separation package payments in 2011–12 ($0.3 million).
Primary Industries and Regions
2012–13 Agency Statements — Volume 4 101

Highlights 2011–12
• Delivered the South Australian component of the National Soil Carbon Research Program for the CSIRO which involved assessing the influence of farming systems and soil types on the amount and type of soil carbon.
• Supported industry development of South Australian king prawns through an innovative value chain project that resulted in a 15 to 20 per cent increase in the pre-Christmas sales of South Australian king prawns through Drakes foodstores.
• Delivered numerous biosecurity projects including a major project to assist with the control the weed branched broomrape, and contributed to South Australia’s response to feral camel management in support of Biosecurity SA.
• Delivered a range of carbon sequestration and community engagement projects and worked with farmer and industry groups to deliver a range of sustainable agricultural projects including an AusAid sponsored Iraq short course training program in dry land farming systems and the Sheep Connect program across South Australia.
• Won an Australian Safer Communities Award for the Firey Women program developed for the South Australian Country Fire Service on empowering women about their role in minimising harm from bushfires.
Targets 2012–13
• Deliver projects in primary industries and natural resources management which enhance the quality of life and capacity of current and future regional communities including:
– advancing agricultural production into the future through assisting land owners, industry and government in innovation and technology adoption
– advancing wool production into the future through projects such as the Australian Wool Industry’s SmartWool project
– considering social, economic and environmental dimensions in primary production including running a pilot program to develop social indicators with PIRSA fisheries and aquaculture
– delivering a range of pest management projects with natural resource management boards
– managing major biosecurity projects for Defence SA
– working with mining companies to meet new environmental protection and rehabilitation regulations and community engagement
– identifying and promoting carbon offsetting opportunities for industry and Aboriginal land managers across South Australia
– specialised soil science work across the state, including carbon farming initiatives
– certifying and testing pasture seed from across South Australia.
Sub-program 1.6: Biosecurity
Description/objective
Develop and implement policies, legislation, regulatory frameworks, surveillance, preparedness and response programs that protect the economy, environment, communities and human health from the negative impacts associated with the entry, establishment or spread of pests, diseases and contaminants in the areas of animal health, aquatic animal health, marine pests, vertebrate pests, weeds, plant health, food borne pathogens from primary industries and chemical residues.
Primary Industries and Regions
102 2012–13 Agency Statements — Volume 4

The programs delivered by Biosecurity SA underpin market access, maintain disease freedom and control, and are a key component in South Australia’s ability for having a competitive edge for clean, green food.
2012–13Budget
2011–12Estimated
Result2011–12 Budget
2010–11Actual
$000 $000 $000 $000
Expenses...................................................................... 27 903 36 589 34 203 44 274
Income.......................................................................... 8 272 11 886 11 181 10 078
Net cost of sub-program 19 631 24 703 23 022 34 196
FTEs as at June (No.) 178.1 209.9 201.1 204.3
Financial commentary
2012–13 Budget/2011–12 Estimated Result
The $8.7 million decrease in expenses is primarily due to:
• winding up of the Branched Broomrape Eradication program as agreed by the Branched Broomrape National Management Group in 2012–13 ($4.8 million)
• once-off externally funded expenditure in 2011–12 for a variety of project expenditures including feral camels, rabbit control, sheep industry and grains industry ($1.5 million)
• completion of the National Feral Camel Action Plan in Aboriginal lands and rangelands funded under the State Natural Resources Management program in 2011–12 ($1.1 million)
• completion of the two year initiative for South Australia's commitment to national eradication programs managed by the Primary Industries and Natural Resources Management Ministerial Council in 2011–12 ($0.6 million)
• expenditure reductions relating to program efficiencies in 2012–13 ($0.8 million).
The $3.6 million decrease in income is primarily due to:
• cessation of revenue from the Commonwealth Government and other states due to the winding up of the Branched Broomrape Eradication program, as agreed by the Branched Broomrape National Management Group in 2012–13 ($2.4 million)
• once-off external funding received in 2011–12 for a variety of project expenditures including feral camels, rabbit control, sheep industry and grains industry ($1.5 million)
• completion of the National Feral Camel Action Plan in Aboriginal lands and rangelands funded under the State Natural Resources Management program in 2011–12 ($1.1 million)
partially offset by
• an intended increase for animal health cost recovery in 2012–13 ($0.9 million)
• once-off revenue reflected under Sub-program 1.3 ‘Fisheries’ in 2011–12 ($0.2 million).
2011–12 Estimated Result/2011–12 Budget
The $2.4 million increase in expenses is primarily due to:
• increase in once-off externally funded projects in 2011–12 for a variety of project expenditures including feral camels, rabbit control, sheep industry and grains industry ($1.5 million)
• inclusion of Dog Fence Board employee budgets previously reflected under PIRSA's administered items ($0.2 million).
Primary Industries and Regions
2012–13 Agency Statements — Volume 4 103

The $0.7 million increase in income is primarily due to:
• increase in once-off external funding for a variety of project expenditures in 2011–12 relating to feral camels, rabbit control, sheep industry and grains industry ($1.5 million)
• transfer of funds from PIRSA’s administered items for Dog Fence Board employee expenses previously reflected under PIRSA's administered items ($0.2 million)
partially offset by • delay in implementation of animal health cost recovery pending independent review ($0.7 million) • once-off revenue in 2011–12 reflected under Sub-program 1.3 ‘Fisheries in’ 2011–12 Estimated
Result ($0.2 million).
2011–12 Estimated Result/2010–11 Actual
The $7.7 million decrease in expenses is primarily due to: • once-off expenditure for delivery of the Plague Locust Emergency Response program in 2010–11
($10.3 million) partially offset by
• increase in once-off externally funded projects in 2011–12 for a variety of project expenditures including feral camels, rabbit control, sheep industry and grains industry ($1.5 million)
• lower than budgeted expenditure in relation to fruit fly eradication responses in 2010–11 ($0.4 million)
• inclusion of Dog Fence Board employee budgets previously reflected under PIRSA's administered items in 2011–12 ($0.2 million).
The $1.8 million increase in income is primarily due to:
• increase in once-off external funding for a variety of project expenditures in 2011–12 relating to feral camels, rabbit control, sheep industry and grains industry ($1.5 million)
• increase for animal health cost recovery in 2011–12 ($0.4 million) • transfer of funds from PIRSA administered items for Dog Fence Board employee expenses
previously reflected under PIRSA's administered items in 2011–12 ($0.2 million).
Highlights 2011–12
• Conducted gap analysis on Biosecurity SA surveillance programs for high priority threats. • Implemented national food safety scheme for poultry and eggs. • Implemented new national Bovine Johne’s Disease control arrangements. • Finalised a nationally endorsed plan for transition of branched broomrape program from
eradication to management. • Implemented National Feral Camel Action Plan within South Australia. • Successfully eradicated three incursions of Mediterranean Fruit Fly from Adelaide.
Targets 2012–13
• Develop better partnerships to educate the community on exotic pests and disease. • Finalise review of plant declarations under the • Assess the efficacy of importing sterile fruit flies from overseas to combat fruit fly outbreaks. • Finalise a state biosecurity policy for South Australia. • Partner with the National Biosecurity Committee to implement improved preparedness and
response for animal or plant biosecurity emergencies.
Primary Industries and Regions
104 2012–13 Agency Statements — Volume 4

Program 2: Forestry Policy
Description/objective
Support the sustainable development of an internationally competitive forest industry. Encourage and support regional development and the provision of services from state government forest reserves.
Program summary — expenses, income and FTEs
2012–13Budget
2011–12Estimated
Result2011–12 Budget
2010–11Actual
$000 $000 $000 $000
Expenses Employee benefit expenses ......................................... 1 208 1 369 1 365 1 592Supplies and services................................................... 466 652 664 418Depreciation and amortisation expenses...................... — — — —Grants and subsidies.................................................... 4 4 24 —Other expenses ............................................................ — — — 1
Total expenses 1 678 2 025 2 053 2 011
Total income — — — —
Net cost of providing services 1 678 2 025 2 053 2 011
FTEs as at June (No.) 12.0 14.0 14.0 14.4
Financial commentary
2012–13 Budget/2011–12 Estimated Result
The $0.3 million decrease in expenses is primarily due to a rationalisation of service delivery as part of budget savings measures.
2011–12 Estimated Result/2011–12 Budget
No major variations.
2011–12 Estimated Result/2010–11 Actual
No major variations.
Highlights 2011–12
• Reviewed PIRSA’s Guidelines for Plantation Forestry in South Australia (2009) by including forest biomass harvesting.
• Initiated implementation of the South Australian Forest Industry Strategy through engagement with forest industry stakeholders.
• Contributed to the international AUSTimber 2012 conference in regional South Australia.
Primary Industries and Regions
2012–13 Agency Statements — Volume 4 105

Targets 2012–13
• Articulate the clean and green attributes of South Australia’s plantation grown timber to ensure recognition of industry contributions to natural resource management outcomes and emerging biofuels markets.
• Lead the development of the government’s forest industry policy position to increase investor confidence and enable the industry to innovate, adapt and compete.
• Lead a forest industry market development program to explore value-adding along the whole forest industry chain and encourage the development of existing, new and diversified business activities.
Primary Industries and Regions
106 2012–13 Agency Statements — Volume 4

Program 3: Regional Development
Description/objective
Engages with South Australia’s regional communities to increase economic opportunity in these regions to maximise their contribution to the state’s economy. Assists to build social capital, promote economic development initiatives and priorities and contribute to the funding of regional economic infrastructure.
Regional Development’s key outcome is to facilitate strong, self-reliant and economically viable regional communities which aligns with several of the government’s priority areas including maximising the opportunities from ‘clean green food as our competitive edge’, realising the benefits of the mining boom for all and advanced manufacturing.
Program summary — expenses, income and FTEs
2012–13Budget
2011–12Estimated
Result2011–12 Budget
2010–11Actual
$000 $000 $000 $000
Expenses Employee benefit expenses ......................................... 952 957 951 1 342Supplies and services................................................... 580 707 581 500Grants and subsidies.................................................... 13 073 10 292 9 886 3 890
Total expenses 14 605 11 956 11 418 5 732
Income Commonwealth revenues............................................. — 33 — 79Other income................................................................ — — — 75
Total income — 33 — 154
Net cost of providing services 14 605 11 923 11 418 5 578
FTEs as at 30 June (No.) 8.4 8.5 8.5 8.5
Financial commentary
2012–13 Budget/2011–12 Estimated Result
The $2.6 million increase in expenses is primarily due to:
• carryover of funds relating to the Riverland Sustainable Futures Fund from 2010–11 to 2012–13 ($2.2 million)
• carryover of funds relating to the Enterprise Zone Fund for the Upper Spencer Gulf and Outback from 2010–11 to 2012–13 ($0.5 million).
2011–12 Estimated Result/2011–12 Budget
The $0.5 million increase in expenses is primarily due to the carryover of funds relating to the Riverland Sustainable Futures Fund from 2010–11 ($0.4 million).
2011–12 Estimated Result/2010–11 Actual
The $6.2 million increase in expenses is primarily due to:
• carryover of funds to future years relating to the Riverland Sustainable Futures Fund ($5.4 million)
Primary Industries and Regions
2012–13 Agency Statements — Volume 4 107

• carryover of funds to future years relating to the Enterprise Zone Fund for the Upper Spencer Gulf and Outback in ($1.0 million).
The $0.1 million decrease in income is primarily due to once-off recovery of unspent grant monies in 2010–11.
Highlights 2011–12
• Approved grants for regional South Australia from the Regional Development Infrastructure Fund, the Riverland Sustainable Futures Fund and the Enterprise Zone Fund for the Upper Spencer Gulf and Outback.
• Facilitated consideration by the Commonwealth Government of applications from South Australia for Regional Development Australia funding which resulted in six South Australian applicants being awarded $15.9 million from a total fund of $150.0 million.
• Worked towards the completion of the feasibility study into an Upper Spencer Gulf heavy industry hub.
• Facilitated four regional consultation visits by the Regional Communities Consultative Council and supported its work program that focused on identifying opportunities from the seven state government priorities.
• Completed the machinery of government changes for the transition of the Regional Development Portfolio function into the new Department of Primary Industries and Regions.
Targets 2012–13
• Support regional economic development throughout South Australia through regional funding programs including the Regional Development Infrastructure Fund, the Riverland Sustainable Futures Fund and the Enterprise Zone Fund for the Upper Spencer Gulf and Outback.
• Continue to work with regions to finalise a statement that outlines the role of regions in delivering on the state government seven priorities.
• Facilitate consideration of project proposals from South Australia for funding by the Commonwealth Government, including through the Regional Development Australia Fund.
• Facilitate the Regional Communities Consultative Council’s engagement with regional communities on key issues and opportunities to maximise regional South Australia’s competitive advantage.
Primary Industries and Regions
108 2012–13 Agency Statements — Volume 4

Primary Industries and RegionsStatement of comprehensive income___________________________________________________________________________________________________________________________________________________________________________________________________________
2012–13Budget
$000
2011–12Estimated
Result
$000
2011–12Budget
$000
2010–11Actual
$000ExpensesEmployee benefit expenses Salaries, wages, annual and sick leave ............................ 66 017 78 455 87 976 94 075 Long service leave ............................................................ 3 656 3 784 4 047 5 057 Payroll tax ......................................................................... 5 345 5 858 6 370 5 584 Superannuation ................................................................ 10 813 11 526 12 717 9 944 Other ................................................................................. 132 3 650 211 5 952Supplies and services General supplies and services .......................................... 58 075 69 034 71 820 73 142 Consultancy expenses ...................................................... 590 546 1 734 787Depreciation and amortisation expenses .............................. 6 035 6 848 7 515 6 827Borrowing costs .................................................................... 1 124 326 142 59Grants and subsidies ............................................................ 21 972 29 079 28 350 37 556Intra-government transfers ................................................... 582 863 2 239 3 080Other expenses .................................................................... 832 1 436 1 892 2 691
Total expenses 175 173 211 405 225 013 244 754
IncomeCommonwealth revenues ..................................................... 3 597 15 774 16 768 24 748Intra-government transfers ................................................... 16 432 17 474 17 830 20 561Other grants .......................................................................... 28 482 32 164 29 563 22 932Fees, fines and penalties ...................................................... 3 240 8 604 14 636 13 572Sales of goods and services ................................................. 26 199 24 307 26 280 24 789Interest revenues .................................................................. 3 895 2 817 2 494 2 391Net gain or loss from disposal of assets ............................... — 224 — -95Other income ........................................................................ 3 047 3 096 3 547 4 052
Total income 84 892 104 460 111 118 112 950
Net cost of providing services 90 281 106 945 113 895 131 804
Income from/expenses to state governmentIncome Appropriation .................................................................... 88 658 103 685 112 648 129 684 Other income .................................................................... — 4 784 — 3 118Expenses Cash alignment ................................................................. — 6 865 — 4 690
Net income from/expenses to state government 88 658 101 604 112 648 128 112
Total comprehensive result -1 623 -5 341 -1 247 -3 692
Primary Industries and Regions
2012–13 Agency Statements — Volume 4 109

Primary Industries and RegionsStatement of financial position___________________________________________________________________________________________________________________________________________________________________________________________________________
2012–13Budget
$000
2011–12Estimated
Result
$000
2011–12Budget
$000
2010–11Actual
$000AssetsCurrent assetsCash and cash equivalents ................................................... 85 692 85 270 70 405 98 198Receivables .......................................................................... 27 602 29 275 31 150 17 572Inventories ............................................................................ 56 56 501 83Other current assets ............................................................. 632 632 288 1 032Non-current assets held for sale ........................................... 198 198 74 198
Total current assets 114 180 115 431 102 418 117 083
Non current assetsFinancial assets .................................................................... 4 501 4 501 4 503 4 501Land and improvements ....................................................... 84 934 87 613 102 182 106 358Plant and equipment ............................................................. 19 705 17 930 27 749 20 268Heritage assets ..................................................................... 49 49 102 102Intangible assets ................................................................... 3 487 3 456 3 558 4 463Biological assets - other ........................................................ 2 269 2 269 1 402 2 269Other non-current assets ...................................................... 45 45 55 52
Total non-current assets 114 990 115 863 139 551 138 013
Total assets 229 170 231 294 241 969 255 096
LiabilitiesCurrent liabilitiesPayables ............................................................................... 16 897 16 897 11 870 18 411Short-term borrowings .......................................................... 13 828 15 501 4 234 1 795Employee benefits Salaries and wages .......................................................... 20 20 — 20 Annual leave ..................................................................... 6 308 6 009 7 805 7 065 Long service leave ............................................................ 2 521 2 384 2 976 2 783Short-term provisions ............................................................ 478 470 503 528Other current liabilities .......................................................... 8 308 8 308 12 640 16 798
Total current liabilities 48 360 49 589 40 028 47 400
Non current liabilitiesLong-term borrowings ........................................................... 2 790 2 790 — 2 790Long-term employee benefits Long service leave ............................................................ 21 068 20 291 24 711 25 445Long-term provisions ............................................................ 1 706 1 629 1 729 1 780Other non-current liabilities ................................................... 874 1 148 1 095 1 422
Total non-current liabilities 26 438 25 858 27 535 31 437
Total liabilities 74 798 75 447 67 563 78 837
Net assets 154 372 155 847 174 406 176 259
Primary Industries and Regions
110 2012–13 Agency Statements — Volume 4

Primary Industries and RegionsStatement of financial position___________________________________________________________________________________________________________________________________________________________________________________________________________
2012–13Budget
$000
2011–12Estimated
Result
$000
2011–12Budget
$000
2010–11Actual
$000
EquityRetained earnings ................................................................. 104 568 106 043 117 099 126 455Asset revaluation reserve ..................................................... 49 288 49 288 49 288 49 288Other reserves ...................................................................... 516 516 8 019 516
Total equity 154 372 155 847 174 406 176 259
Balances as at 30 June end of period.
Primary Industries and Regions
2012–13 Agency Statements — Volume 4 111

Primary Industries and RegionsStatement of cash flows___________________________________________________________________________________________________________________________________________________________________________________________________________
2012–13Budget
$000
2011–12Estimated
Result
$000
2011–12Budget
$000
2010–11Actual
$000
Operating activitiesCash outflowsEmployee benefit payments ................................................. 84 754 103 821 110 295 123 714Payments for supplies and services ..................................... 58 939 69 854 73 828 69 295Interest paid .......................................................................... 1 124 326 142 70Grants and subsidies ............................................................ 21 972 29 079 28 350 36 069GST paid ............................................................................... — — — 12 554Intra-government transfers ................................................... 582 863 2 239 3 080Other payments .................................................................... 743 1 349 1 805 2 922
Cash used in operations 168 114 205 292 216 659 247 704
Cash inflowsIntra-government transfers ................................................... 16 432 17 474 17 830 20 561Commonwealth receipts ....................................................... 3 597 15 774 16 768 32 044Other grants .......................................................................... 28 482 31 914 29 563 30 417Fees, fines and penalties ...................................................... 3 240 8 604 14 636 13 746Sales of goods and services ................................................. 26 199 24 308 26 280 28 020Interest received ................................................................... 3 895 2 817 2 494 2 234GST received ........................................................................ — — — 12 664Other receipts ....................................................................... 3 047 3 096 3 547 4 477
Cash generated from operations 84 892 103 987 111 118 144 163
State governmentAppropriation ........................................................................ 88 658 103 685 112 648 129 684Other receipts ....................................................................... — 4 784 — 3 118Payments Cash alignment ................................................................. — 6 865 — 4 690
Net cash provided by state government 88 658 101 604 112 648 128 112
Net cash provided by (+)/used in (-) operating activities 5 436 299 7 107 24 571
Investing activitiesCash outflowsPurchase of property, plant and equipment .......................... 5 014 6 130 5 001 5 210Purchase of intangibles ........................................................ — 150 — 306Advances paid ...................................................................... 2 360 15 700 1 300 4 612
Cash used in investing activities 7 374 21 980 6 301 10 128
Cash inflowsProceeds from sale of property, plant and equipment .......... — 447 — 287Repayment of advances ....................................................... 4 033 1 994 1 994 1 616Other receipts ....................................................................... — — — 1
Cash generated from investing activities 4 033 2 441 1 994 1 904
Net cash provided by (+)/used in (-) investing activities -3 341 -19 539 -4 307 -8 224
Primary Industries and Regions
112 2012–13 Agency Statements — Volume 4

Primary Industries and RegionsStatement of cash flows___________________________________________________________________________________________________________________________________________________________________________________________________________
2012–13Budget
$000
2011–12Estimated
Result
$000
2011–12Budget
$000
2010–11Actual
$000
Financing activitiesCash outflowsRepayment of borrowings ..................................................... 3 733 1 694 1 694 1 420
Cash used in financing activities 3 733 1 694 1 694 1 420
Cash inflowsProceeds from borrowings .................................................... 2 060 15 400 1 000 4 534Proceeds from restructuring activities ................................... — -7 394 — 1 001
Cash generated from financing activities 2 060 8 006 1 000 5 535
Net cash provided by (+)/used in (-) financing activities -1 673 6 312 -694 4 115
Net increase (+)/decrease (-) in cash equivalents 422 -12 928 2 106 20 462
Cash and cash equivalents at the start of the period 85 270 98 198 68 299 77 736
Cash and cash equivalents at the end of the period 85 692 85 270 70 405 98 198
Primary Industries and Regions
2012–13 Agency Statements — Volume 4 113

Administered items for the Department of Primary Industries and RegionsStatement of comprehensive income___________________________________________________________________________________________________________________________________________________________________________________________________________
2012–13Budget
$000
2011–12Estimated
Result
$000
2011–12Budget
$000
2010–11Actual
$000ExpensesEmployee benefit expenses Salaries, wages, annual and sick leave ............................ 291 361 671 682 Long service leave ............................................................ — — 4 1 Payroll tax ......................................................................... 1 1 8 9 Superannuation ................................................................ 1 1 13 15 Other ................................................................................. 43 41 28 47Supplies and services General supplies and services .......................................... 2 155 2 279 2 008 1 276Depreciation and amortisation expenses .............................. — — — 8Grants and subsidies ............................................................ 11 165 13 071 10 588 11 652Intra-government transfers ................................................... 16 634 16 464 16 254 15 481Other expenses .................................................................... 81 83 749 204 335 157 742
Total expenses 30 371 115 967 233 909 186 913
IncomeCommonwealth revenues ..................................................... — — — 48Intra-government transfers ................................................... 714 699 491 817Other grants .......................................................................... — — — 41Fees, fines and penalties ...................................................... 15 692 14 946 15 726 14 382Sales of goods and services ................................................. 759 756 739 262Interest revenues .................................................................. 832 821 535 770Other income ........................................................................ 9 006 93 899 212 888 167 903
Total income 27 003 111 121 230 379 184 223
Income from/expenses to state governmentIncome Appropriation .................................................................... 3 760 3 710 4 113 3 888
Net income from/expenses to state government 3 760 3 710 4 113 3 888
Total comprehensive result 392 -1 136 583 1 198
Primary Industries and Regions
114 2012–13 Agency Statements — Volume 4

Administered items for the Department of Primary Industries and RegionsStatement of financial position___________________________________________________________________________________________________________________________________________________________________________________________________________
2012–13Budget
$000
2011–12Estimated
Result
$000
2011–12Budget
$000
2010–11Actual
$000AssetsCurrent assetsCash and cash equivalents ................................................... 29 538 29 148 30 951 50 395Receivables .......................................................................... 571 571 713 571Inventories ............................................................................ 209 209 220 209Other current assets ............................................................. — — 50 —
Total current assets 30 318 29 928 31 934 51 175
Non current assetsLand and improvements ....................................................... 29 29 36 29Plant and equipment ............................................................. — — 15 —
Total non-current assets 29 29 51 29
Total assets 30 347 29 957 31 985 51 204
LiabilitiesCurrent liabilitiesPayables ............................................................................... 9 337 9 339 11 589 29 450Employee benefits Salaries and wages .......................................................... 12 12 12 12 Annual leave ..................................................................... 10 10 12 10 Long service leave ............................................................ 5 5 7 5Other current liabilities .......................................................... 2 617 2 617 2 612 2 617
Total current liabilities 11 981 11 983 14 232 32 094
Non current liabilitiesLong-term employee benefits Long service leave ............................................................ 47 47 39 47
Total non-current liabilities 47 47 39 47
Total liabilities 12 028 12 030 14 271 32 141
Net assets 18 319 17 927 17 714 19 063
EquityRetained earnings ................................................................. 18 319 17 927 17 714 19 063
Total equity 18 319 17 927 17 714 19 063
Balances as at 30 June end of period.
Primary Industries and Regions
2012–13 Agency Statements — Volume 4 115

Administered items for the Department of Primary Industries and RegionsStatement of cash flows___________________________________________________________________________________________________________________________________________________________________________________________________________
2012–13Budget
$000
2011–12Estimated
Result
$000
2011–12Budget
$000
2010–11Actual
$000
Operating activitiesCash outflowsEmployee benefit payments ................................................. 338 556 876 687Payments for supplies and services ..................................... 2 155 2 279 2 008 1 132Grants and subsidies ............................................................ 11 165 13 071 10 588 11 652Intra-government transfers ................................................... 16 634 16 464 16 254 15 481Other payments .................................................................... 81 83 749 204 335 139 954
Cash used in operations 30 373 116 119 234 061 168 906
Cash inflowsIntra-government transfers ................................................... 714 699 491 817Commonwealth receipts ....................................................... — — — 48Fees, fines and penalties ...................................................... 15 692 14 946 15 726 14 502Sales of goods and services ................................................. 759 756 739 689Interest received ................................................................... 832 821 535 752Other receipts ....................................................................... 9 006 93 899 212 888 167 484
Cash generated from operations 27 003 111 121 230 379 184 292
State governmentAppropriation ........................................................................ 3 760 3 710 4 113 3 888
Net cash provided by state government 3 760 3 710 4 113 3 888
Net cash provided by (+)/used in (-) operating activities 390 -1 288 431 19 274
Financing activitiesCash inflowsProceeds from restructuring activities ................................... — -19 959 — 119
Cash generated from financing activities — -19 959 — 119
Net cash provided by (+)/used in (-) financing activities — -19 959 — 119
Net increase (+)/decrease (-) in cash equivalents 390 -21 247 431 19 393
Cash and cash equivalents at the start of the period 29 148 50 395 30 520 31 002
Cash and cash equivalents at the end of the period 29 538 29 148 30 951 50 395
Primary Industries and Regions
116 2012–13 Agency Statements — Volume 4

Summary of major variations
The following commentary relates to variations between the 2012 13 Budget and the 2011 12 Estimated Result.
Statement of comprehensive income controlled
Expenses
The $36.2 million decrease in expenses is primarily due to:
• the machinery of government transfer to the Department for Manufacturing, Innovation, Trade, Resources and Energy of expenditure in relation to
– mining, petroleum and the Olympic Dam Taskforce ($16.6 million)
– investment, strategy and projects ($0.7 million)
– strategy and policy ($0.3 million)
• lower expenditure in 2012–13 on Exceptional Circumstances Interest Rate Subsidy ($11.8 million)
• expenditure reductions associated with savings initiatives ($6.0 million)
• once-off employee benefit payments made during 2011–12 in relation to targeted voluntary separation packages ($3.5 million)
• once-off expenditure in 2011–12 state natural resources management expenditure for the National Feral Camel Action Plan in Aboriginal lands and rangelands ($1.1 million)
• winding up of the Branched Broomrape Eradication program as agreed by the Branched Broomrape National Management Group in 2012–13 ($4.8 million)
partially offset by
• the machinery of government transfer from the Department for Manufacturing, Innovation, Trade, Resources and Energy of expenditure in relation to Regional Development ($6.2 million)
• carryover of funds from 2010–11 to 2012–13 relating to
– the Riverland Sustainable Futures Fund ($2.2 million)
– the Enterprise Zone Fund for the Upper Spencer Gulf and Outback ($0.5 million)
• increased borrowing costs associated with increased lending under the Loans to Cooperatives Scheme ($0.8 million).
Income
The $19.6 million decrease in income is primarily due to:
• lower commonwealth revenue for the Exceptional Circumstances Interest Rate Subsidy program ($10.6 million)
• the machinery of government transfer to the Department for Manufacturing, Innovation, Trade, Resources and Energy of mining, petroleum and Olympic Dam Taskforce revenue ($6.3 million)
• reductions in
– branched broomrape ($2.4 million)
– marine and biosecurity projects ($0.8 million)
– state natural resources management funding for the National Feral Camel Action Plan in Aboriginal lands and rangelands ($1.1 million)
Primary Industries and Regions
2012–13 Agency Statements — Volume 4 117

• once-off Commonwealth funding for the National Collaborative Research Infrastructure Strategy initiatives in 2011–12 ($1.6 million)
partially offset by
• additional interest received from loans made to cooperatives ($1.0 million)
• indexation on fees and charges ($1.9 million).
Statement of financial position controlled
The $2.1 million decrease in total assets is primarily due to:
• continuing depreciation and amortisation charges on the department’s asset base ($5.9 million)
• reduction in amounts advanced under the Loans to Cooperatives scheme ($1.7 million)
partially offset by
• minor works during 2012–13 ($5.0 million)
• increased interest earnings ($0.2 million).
The $0.6 million decrease in total liabilities is primarily due to:
• a reduction in the loan portfolio ($1.7 million)
• ongoing amortisation of accommodation lease incentives ($0.2 million)
partially offset by
• inflationary increases in the provisions for employee benefits ($1.2 million).
Statement of cash flows controlled
The $5.1 million increase in net operating cash flows is primarily due to:
• movements discussed above under the net cost of providing services in the statement of comprehensive income ($16.7 million)
• reduction in the amount returned under the cash alignment policy ($6.9 million)
partially offset by
• reduction in 2012-13 appropriation and other receipts ($19.8 million).
The $16.2 million increase in net investing cash flows is primarily due to:
• reduction in the amount advanced under the Loans to Cooperative scheme ($13.3 million)
• additional revenue repayments from clients of advances from loans made in earlier years ($2.0 million)
• non-recurring expenditure on capital projects in 2011–12 related to projects under the National Collaborative Research Infrastructure Strategy ($1.1 million)
partially offset by
• a reduction in the annual minor works program in relation to the Department for Manufacturing, Innovation, Trade, Resources and Energy of the Minerals and Resources Development and Olympic Dam Taskforce programs ($0.2 million).
The $8.0 million decrease in net financing cash flows is primarily due to:
• reduced borrowings following the once-off advance made under the Loans to Cooperative scheme in 2011–12 ($13.3 million)
Primary Industries and Regions
118 2012–13 Agency Statements — Volume 4

• additional repayments to the Department of Treasury and Finance from borrowings made in earlier years ($2.0 million)
partially offset by
• once-off restructuring payments to the Department for Manufacturing, Innovation, Trade, Resources and Energy in relation to the transfer of the Minerals and Resources Development and Olympic Dam Taskforce programs ($7.3 million).
Statement of comprehensive income administered items
The $85.6 million decrease in expenses is primarily due to a machinery of government transfer to the Department for Manufacturing, Innovation, Trade, Resources and Energy of:
• mining and petroleum royalties ($82.9 million)
• native title royalties ($0.8 million).
The $84.1 million decrease in income is primarily due to a machinery of government transfer to the Department for Manufacturing, Innovation, Trade, Resources and Energy of:
• mining and petroleum royalties ($82.9 million)
• native title royalties ($0.9 million).
Statement of financial position administered items
The $0.4 million increase in total assets is primarily due to the indexation of fees and charges and the movement in industry levy rates.
Statement of cash flows administered items
The movement in operating cash flows is consistent with the changes discussed above under the statement of comprehensive income.
The $20.0 million increase in net financing cash flows is primarily due to once-off restructuring payments to the Department for Manufacturing, Innovation, Trade, Resources and Energy that were recognised in 2011–12 for the transfer of:
• mining and petroleum royalties ($19.8 million)
• native title royalties ($0.2 million).
Additional information for administered items
Additional information on administered items is included in the following table.
Primary Industries and Regions
2012–13 Agency Statements — Volume 4 119

Additional information for administered items for the Department of Primary Industries and Regions Statement of cash flows
2012–13Budget
2011–12Estimated
Result2011–12 Budget
2010–11Actual
$000 $000 $000 $000
Operating activities
Cash outflows
Employee benefit payments Parliamentary salaries and electorate expense allowances ........................................................................ 289 357 524 525Various industry funds ...................................................... 49 199 352 162
Payments for supplies and services Various industry funds ...................................................... 2 155 2 279 2 008 1 132
Grants and subsidies Regulatory fees paid from Fisheries Research and Development Fund............................................................ 751 644 724 710Regulatory fees paid from Aquaculture Resource Management Fund............................................................ 298 963 300 1 228Forestry community service obligation payment ............... 3 063 2 992 3 004 2 941Various industry funds ...................................................... 7 053 8 472 6 560 6 773
Intra-government transfers Regulatory fees transferred from Fisheries Research and Development Fund..................................................... 12 089 12 100 12 213 11 324Regulatory fees transferred from Aquaculture Resource Management Fund ........................................... 2 069 1 310 1 609 962EP Grain Rail Infrastructure Fund..................................... — — — 600Forestry community service obligation payment ............... 390 376 380 364Various industry funds ...................................................... 2 086 2 678 2 052 2 231
Other payments Various industry funds ...................................................... 81 81 69 59
Cash used in operations 30 373 32 451 29 795 29 011
Cash inflows
Intra-government transfers Various industry funds ...................................................... 714 699 491 817
Commonwealth receipts Various industry funds ...................................................... — — — 48
Fees, fines and penalties Fisheries licence fees ....................................................... 13 615 13 368 13 937 12 901Aquaculture licence fees................................................... 1 697 999 1 252 912Various industry funds ...................................................... 380 579 537 569
Sales of goods and services Various industry funds ...................................................... 759 756 739 689
Interest received Various industry funds ...................................................... 832 821 535 752
Primary Industries and Regions
120 2012–13 Agency Statements — Volume 4

2012–13Budget
2011–12Estimated
Result2011–12 Budget
2010–11Actual
$000 $000 $000 $000
Other receipts EP Grain Rail Infrastructure Fund..................................... — — — 684Various industry funds ...................................................... 9 006 10 175 8 634 9 273
Cash generated from operations 27 003 27 397 26 125 26 645
State government Appropriation
Parliamentary salaries and electorate expense allowances ........................................................................ 289 357 524 539Forestry community service obligation payment ............... 3 471 3 353 3 589 3 349
Net cash provided by state government 3 760 3 710 4 113 3 888
Net cash provided by (+)/used in (-) operating activities 390 -1 344 443 1 522
Financing activities
Cash inflows
Proceeds from restructuring activities Transfer of the Dog Fence Board from the former Department of Water, Land and Biodiversity Conservation..................................................................... — — — 119Transfer of mining and petroleum royalties to the Department for Manufacturing, Innovation, Trade, Resources and Energy ..................................................... — -19 763 — —Transfer of native title royalties to the Department for Manufacturing, Innovation, Trade, Resources and Energy ....................................................................... — -196 — —
Cash generated from financing activities — -19 959 — 119
Net cash provided by (+)/used in (-) financing activities — -19 959 — 119
Net increase (+)/decrease (-) in cash equivalents 390 -21 303 443 1 641
Cash and cash equivalents at the start of the financial year (as at 1 July) 29 148 50 395 30 520 31 002
Cash and cash equivalents at the end of the financial year (as at 30 June) 29 538 29 092 30 963 32 643
Primary Industries and Regions
2012–13 Agency Statements — Volume 4 121

Additional information for administered items for the Department of Primary Industries and Regions Reconciliation to statement of cash flows
2012–13Budget
2011–12Estimated
Result2011–12 Budget
2010–11Actual
$000 $000 $000 $000
Reconciliation to operating payments Operating payments (as per additional information for administered items) ................................................................ 30 373 32 451 29 795 29 011Add: Costs transferred out:
Transfer of mining and petroleum royalties to the Department for Manufacturing, Innovation, Trade, Resources and Energy ..................................................... — 82 867 202 748 138 365Transfer of native title royalties to the Department for Manufacturing, Innovation, Trade, Resources and Energy ....................................................................... — 801 1 518 1 530
Equals: Operating payments (as per administered items statement of cash flows) 30 373 116 119 234 061 168 906
Reconciliation to operating receipts
Operating receipts (as per additional information for administered items) ................................................................ 27 003 27 397 26 125 26 645Add: Costs transferred out:
Transfer of mining and petroleum royalties to the Department for Manufacturing, Innovation, Trade, Resources and Energy ..................................................... — 82 867 202 748 155 915Transfer of native title royalties to the Department for Manufacturing, Innovation, Trade, Resources and Energy ....................................................................... — 857 1 506 1 732
Equals: Operating receipts (as per administered items statement of cash flows) 27 003 111 121 230 379 184 292
Reconciliation of closing cash balance (to administered items statement of cash flows)
Cash and cash equivalents at the end of the financial year (as at 30 June)(as per additional information for administered items) 29 538 29 092 30 963 32 643Add: Cash balances of activities transferred out
Transfer of mining and petroleum royalties to the Department for Manufacturing, Innovation, Trade, Resources and Energy ..................................................... — — — 17 550Transfer of native title royalties to the Department for Manufacturing, Innovation, Trade, Resources and Energy .......................................................................
— 56 -12 202
Equals: Closing cash balance (as per administered items statement of cash flows) 29 538 29 148 30 951 50 395
Primary Industries and Regions
122 2012–13 Agency Statements — Volume 4

Agency: South Australian Tourism Commission
Minister for Tourism
2012–13 Agency Statements — Volume 4 123

Tourism
124 2012–13 Agency Statements — Volume 4

Contents
Objective..................................................................................................................................... 126 Ministerial responsibilities........................................................................................................... 126 Workforce summary ................................................................................................................... 126 Program net cost of services summary ...................................................................................... 127 Investing expenditure summary..................................................................................................127Program 1: Destination Development...................................................................................... 128 Program 2: Tourism Events..................................................................................................... 132Program 3: Tourism Marketing ................................................................................................ 134Financial statements................................................................................................................... 138 Summary of major variations ...................................................................................................... 142
Tourism
2012–13 Agency Statements — Volume 4 125

Objective
Ministerial responsibilities
Minister Programs Sub-programs
The Hon. GE Gago
Statutes
Workforce summary
FTEs as at 30 June
Agency 2012–13
Budget(a)
2011–12Estimated
Result(a)2010–11Actual(b)
121.6
Total 121.6 130.0 141.6
Tourism
126 2012–13 Agency Statements — Volume 4

Program net cost of services summary
Net cost of services
2012–13Budget
2011–12Estimated
Result2011–12 Budget
2010–11Actual
Program $000 $000 $000 $000
7 157
11 887
30 471
Total 49 515 55 198 53 013 56 002
Investing expenditure summary
2012–13Budget
2011–12Estimated
Result2011–12 Budget
2010–11Actual
Investments $000 $000 $000 $000
Annual programs
137Total annual programs 137 134 134 183
Total investing expenditure 137 134 134 183
Tourism
2012–13 Agency Statements — Volume 4 127

Program 1: Destination Development
Description/objective
Sub-programs
Program summary — expenses, income and FTEs
2012–13Budget
2011–12Estimated
Result2011–12 Budget
2010–11Actual
$000 $000 $000 $000
Expenses 2 5171 369
873 325
—22
Total expenses 7 320 7 992 12 356 12 973
Income—
163Total income 163 137 2 076 3 232
Net cost of providing services 7 157 7 855 10 280 9 741
FTEs as at 30 June (No.) 27.3
Tourism
128 2012–13 Agency Statements — Volume 4

Sub-program 1.1: Tourism Development
Description/objective
2012–13Budget
2011–12Estimated
Result2011–12 Budget
2010–11Actual
$000 $000 $000 $000
5 052
160
Net cost of sub-program 4 892 5 646 8 567 8 167
FTEs as at 30 June (No.) 20.0
Financial commentary
2012–13 Budget/2011–12 Estimated Result
2011–12 Estimated Result/2011–12 Budget
•
•
•
•
2011–12 Estimated Result/2010–11 Actual
•
Tourism
2012–13 Agency Statements — Volume 4 129

•
•
•
•
Highlights 2011–12
•
•
•
•
Targets 2012–13
•
•
Sub-program 1.2: Strategy and Policy
Description/objective
Tourism
130 2012–13 Agency Statements — Volume 4

2012–13Budget
2011–12Estimated
Result2011–12 Budget
2010–11Actual
$000 $000 $000 $000
2 268
3
Net cost of sub-program 2 265 2 209 1 713 1 574
FTEs as at 30 June (No.) 7.3
Financial commentary
2012–13 Budget/2011–12 Estimated Result
2011–12 Estimated Result/2011–12 Budget
2011–12 Estimated Result/2010–11 Actual
Highlights 2011–12
•
•
•
Targets 2012–13
•
Tourism
2012–13 Agency Statements — Volume 4 131

Program 2: Tourism Events
Description/objective
Program summary — expenses, income and FTEs
2012–13Budget
2011–12Estimated
Result2011–12 Budget
2010–11Actual
$000 $000 $000 $000
Expenses 2 039
12 753178
3 717—22
Total expenses 18 709 20 232 18 789 21 711
Income6 822
Total income 6 822 6 006 7 036 7 342
Net cost of providing services 11 887 14 226 11 753 14 369
FTEs as at 30 June (No.) 22.2
Financial commentary
2012–13 Budget/2011–12 Estimated Result
•
•
2011–12 Estimated Result/2011–12 Budget
Tourism
132 2012–13 Agency Statements — Volume 4

2011–12 Estimated Result/2010–11 Actual
•
•
•
•
Highlights 2011–12
•
•
•
•
•
•
Targets 2012–13
•
•
•
•
•
Tourism
2012–13 Agency Statements — Volume 4 133

Program 3: Tourism Marketing
Description/objective
Sub-programs
Program summary — expenses, income and FTEs
2012–13Budget
2011–12Estimated
Result2011–12 Budget
2010–11Actual
$000 $000 $000 $000
Expenses 6 094
24 905229875
—58
Total expenses 32 161 34 363 32 127 33 816
Income1 690
Total income 1 690 1 246 1 147 1 924
Net cost of providing services 30 471 33 117 30 980 31 892
FTEs as at 30 June (No.) 72.1
Tourism
134 2012–13 Agency Statements — Volume 4

Sub-program 3.1: Domestic Marketing
Description/objective
To develop and implement national marketing campaigns to maintain and grow awareness of the state’s tourism experiences and as a result to increase visitation to and within South Australia.
2012–13Budget
2011–12Estimated
Result2011–12 Budget
2010–11Actual
$000 $000 $000 $000
Expenses...................................................................... 19 083 20 499 18 292 19 155
Income.......................................................................... 1 083 652 665 645
Net cost of sub-program 18 000 19 847 17 627 18 510
FTEs as at 30 June (No.) 37.3 39.4 40.5 35.9
Financial commentary
2012–13 Budget/2011–12 Estimated Result
The $1.4 million decrease in expenses is primarily due to:
a reduction in costs associated with the redevelopment of the SATC’s consumer website and associated international consumer websites ($1.0 million)
additional expenditure in 2011–12 relating to production and advertising costs associated with the Best Backyard intrastate campaign and the Kangaroo Island interstate campaign ($1.0 million)
the implementation of savings initiatives ($0.4 million)
partially offset by
additional expenditure on direct to consumer marketing activities ($1.0 million).
The $0.4 million increase in income is primarily due to revenue generated from the newly redeveloped tourism consumer website.
2011–12 Estimated Result/2011–12 Budget
The $2.2 million increase in expenses is primarily due to a reclassification of regional grant funding from Sub-program 1.1 ‘Tourism Development’ to regional marketing activities and operating costs under Sub-program 3.1 ‘Domestic Marketing’, in line with the Regional Growth Plan ($1.9 million).
2011–12 Estimated Result/2010–11 Actual
The $1.3 million increase in expenses is primarily due to:
a reclassification of regional grant funding from Sub-program 1.1 ‘Tourism Development’ to regional marketing activities and operating costs under Sub-program 3.1 ‘Domestic Marketing’, in line with the Regional Growth Plan ($1.9 million)
partially offset by
a reduction in expenses due to the implementation of savings initiatives ($0.5 million).
Highlights 2011–12
Developed and launched the domestic marketing campaign Let Yourself Go featuring Kangaroo Island, targeting the key interstate markets of Sydney and Melbourne. Campaign elements include television, cinema, newspaper and online.
Tourism
2012–13 Agency Statements — Volume 4 135

•
•
•
•
Targets 2012–13
•
•
•
•
Sub-program 3.2: International and Trade Marketing
Description/objective
2012–13Budget
2011–12Estimated
Result2011–12 Budget
2010–11Actual
$000 $000 $000 $000
13 078
607
Net cost of sub-program 12 471 13 270 13 353 13 382
FTEs as at 30 June (No.) 34.8Financial commentary
2012–13 Budget/2011–12 Estimated Result
2011–12 Estimated Result/2011–12 Budget
Tourism
136 2012–13 Agency Statements — Volume 4

2011–12 Estimated Result/2010–11 Actual
•
•
Highlights 2011–12
•
•
•
•
•
Targets 2012–13
•
•
•
•
•
•
Tourism
2012–13 Agency Statements — Volume 4 137

South Australian Tourism CommissionStatement of comprehensive income___________________________________________________________________________________________________________________________________________________________________________________________________________
2012–13Budget
$000
2011–12Estimated
Result
$000
2011–12Budget
$000
2010–11Actual
$000ExpensesEmployee benefit expenses Salaries, wages, annual and sick leave ............................ 8 621 9 059 9 869 10 575 Long service leave ............................................................ 485 325 481 253 Payroll tax ......................................................................... 502 490 531 585 Superannuation ................................................................ 867 836 921 995 Other ................................................................................. 175 895 184 429Supplies and services General supplies and services .......................................... 38 995 41 269 40 570 42 777 Consultancy expenses ...................................................... 32 31 31 8Depreciation and amortisation expenses .............................. 494 494 494 538Borrowing costs .................................................................... — — — 1Grants and subsidies ............................................................ 7 917 8 540 9 290 11 359Intra-government transfers ................................................... — 550 800 454Other expenses .................................................................... 102 98 101 526
Total expenses 58 190 62 587 63 272 68 500
IncomeIntra-government transfers ................................................... — — — 800Sales of goods and services ................................................. 8 675 7 389 10 259 11 706Net gain or loss from disposal of assets ............................... — — — -8
Total income 8 675 7 389 10 259 12 498
Net cost of providing services 49 515 55 198 53 013 56 002
Income from/expenses to state governmentIncome Appropriation .................................................................... 49 080 53 937 53 238 54 640 Other income .................................................................... — 1 484 — 1 295
Net income from/expenses to state government 49 080 55 421 53 238 55 935
Total comprehensive result -435 223 225 -67
Tourism
138 2012–13 Agency Statements — Volume 4

South Australian Tourism CommissionStatement of financial position___________________________________________________________________________________________________________________________________________________________________________________________________________
2012–13Budget
$000
2011–12Estimated
Result
$000
2011–12Budget
$000
2010–11Actual
$000AssetsCurrent assetsCash and cash equivalents ................................................... 2 489 2 899 3 895 2 795Receivables .......................................................................... 1 568 1 679 1 734 1 837Other current assets ............................................................. 40 39 70 76
Total current assets 4 097 4 617 5 699 4 708
Non current assetsFinancial assets .................................................................... 400 400 400 400Plant and equipment ............................................................. 2 304 2 661 2 663 3 021
Total non-current assets 2 704 3 061 3 063 3 421
Total assets 6 801 7 678 8 762 8 129
LiabilitiesCurrent liabilitiesPayables ............................................................................... 3 434 3 864 4 391 4 349Employee benefits Salaries and wages .......................................................... 90 90 — 90 Annual leave ..................................................................... 745 756 823 794 Long service leave ............................................................ 254 254 247 254Short-term provisions ............................................................ — 1 — — Other current liabilities .......................................................... 185 185 180 185
Total current liabilities 4 708 5 150 5 641 5 672
Non current liabilitiesLong-term employee benefits Long service leave ............................................................ 997 997 1 161 1 150Long-term provisions ............................................................ 1 1 — — Other non-current liabilities ................................................... 938 938 1 092 938
Total non-current liabilities 1 936 1 936 2 253 2 088
Total liabilities 6 644 7 086 7 894 7 760
Net assets 157 592 868 369
EquityContributed capital ................................................................ 64 64 64 64Retained earnings ................................................................. 93 528 804 305
Total equity 157 592 868 369
Balances as at 30 June end of period.
Tourism
2012–13 Agency Statements — Volume 4 139

South Australian Tourism CommissionStatement of cash flows___________________________________________________________________________________________________________________________________________________________________________________________________________
2012–13Budget
$000
2011–12Estimated
Result
$000
2011–12Budget
$000
2010–11Actual
$000
Operating activitiesCash outflowsEmployee benefit payments ................................................. 10 662 11 811 11 959 13 220Payments for supplies and services ..................................... 39 181 41 454 40 755 41 378Interest paid .......................................................................... — — — 1Grants and subsidies ............................................................ 7 917 8 540 9 290 11 359GST paid ............................................................................... — — — 4 692Intra-government transfers ................................................... — 550 800 454Other payments .................................................................... 379 375 378 2 922
Cash used in operations 58 139 62 730 63 182 74 026
Cash inflowsIntra-government transfers ................................................... — — — 800Sales of goods and services ................................................. 8 786 7 500 10 370 11 740GST received ........................................................................ — — — 4 777Other receipts ....................................................................... — 47 — 3
Cash generated from operations 8 786 7 547 10 370 17 320
State governmentAppropriation ........................................................................ 49 080 53 937 53 238 54 640Other receipts ....................................................................... — 1 484 — 1 295
Net cash provided by state government 49 080 55 421 53 238 55 935
Net cash provided by (+)/used in (-) operating activities -273 238 426 -771
Investing activitiesCash outflowsPurchase of property, plant and equipment .......................... 137 134 134 183
Cash used in investing activities 137 134 134 183
Cash inflowsProceeds from sale of property, plant and equipment .......... — — — 2
Cash generated from investing activities — — — 2
Net cash provided by (+)/used in (-) investing activities -137 -134 -134 -181
Tourism
140 2012–13 Agency Statements — Volume 4

South Australian Tourism CommissionStatement of cash flows___________________________________________________________________________________________________________________________________________________________________________________________________________
2012–13Budget
$000
2011–12Estimated
Result
$000
2011–12Budget
$000
2010–11Actual
$000
Financing activitiesCash outflowsRepayment of borrowings ..................................................... — — — 50
Cash used in financing activities — — — 50
Net cash provided by (+)/used in (-) financing activities — — — -50
Net increase (+)/decrease (-) in cash equivalents -410 104 292 -1 002
Cash and cash equivalents at the start of the period 2 899 2 795 3 603 3 797
Cash and cash equivalents at the end of the period 2 489 2 899 3 895 2 795
Tourism
2012–13 Agency Statements — Volume 4 141

Summary of major variations
Statement of comprehensive income controlled
Expenses
•
•
•
Income
•
•
Statement of financial position controlled
Statement of cash flows controlled
Tourism
142 2012–13 Agency Statements — Volume 4

Agency: Department of Treasury and Finance
Minister for Business Services and Consumers Treasurer Minister for Veterans’ Affairs Minister for Finance
2012–13 Agency Statements — Volume 4 143

Treasury and Finance
144 2012–13 Agency Statements — Volume 4

Contents
Objective..................................................................................................................................... 146 Ministerial responsibilities........................................................................................................... 146 Ministerial office resources ......................................................................................................... 147 Workforce summary ................................................................................................................... 147 Program net cost of services summary ...................................................................................... 148 Investing expenditure summary..................................................................................................148 Program 1: Gambling Policy.................................................................................................... 149 Program 2: Accountability for Public Sector Resources .......................................................... 151 Program 3: Treasury Services ................................................................................................. 155 Program 4: Support Services................................................................................................... 156 Program 5: Financial Services Provision ................................................................................. 160 Financial statements................................................................................................................... 16 Summary of major variations ...................................................................................................... 183
Treasury and Finance
2012–13 Agency Statements — Volume 4 145

Objective
To ensure that the South Australian public sector is accountable in both policy and financial terms to the government of the day. To provide economic and financial services to, and on behalf of, the Government of South Australia.
Ministerial responsibilities
Minister Programs Sub-programs
The Hon. JR Rau Minister for Business Services and Consumers
1. Gambling Policy Nil
2. Accountability for Public Sector Resources
2.1 Policy Analysis and Advice 2.2 Budget Financial Management
3. Treasury Services Nil
The Hon. JJ Snelling
Treasurer
Minister for Veterans’ Affairs 4. Support Services 4.1 Vehicles for Ministers, Leader
of the Opposition, MPs and VIPs
4.2 Ministerial Support Services — Treasurer
4.3 Veterans SA
The Hon. MF O’Brien
Minister for Finance
5. Financial Services Provision 5.1 Revenue Collection and Management
5.2 Insurance Services and Fleet SA
5.3 Superannuation Services 5.4 Procurement Policy and
Governance 5.5 Ministerial Support Services —
Minister for Finance
Note: Some program numbers have changed due to changes in ministerial responsibilities.
Administered items
In addition to the above responsibilities, the agency administers the following items on behalf of the Treasurer:
• Assets and liabilities held on behalf of the state by the Treasurer
• Consolidated Account items
• Special deposit accounts.
Statutes
The Department of the Premier and Cabinet maintains a list of statutes applicable to ministers.
146 2012–13 Agency Statements — Volume 4

Ministerial office resources
2012 13 Budget
Cost of provision
Minister $000 FTE
The Hon. JJ Snelling .............................................................................. 1 636 11.0
The Hon. MF O’Brien.............................................................................. 1 501 9.0
Workforce summary
FTEs as at 30 June
Agency 2012–13
Budget(a)
2011–12 Estimated
Result(a) 2010–11Actual(b)
Department of Treasury and Finance ................................................. 755.3 784.9 714.7
Administered items for the Department of Treasury and Finance....... 215.7 215.7 197.8
Total 971.0 1000.6 912.5
Add: FTEs transferred out:
Shared Services SA to the Department of the Premier and Cabinet .................................................................................................................................. 775.8
Less: FTEs transferred in: Veterans SA from the Department of Planning and Local Government......................................................................................................................... 3.0
Equals: Data published by the Office of Public Employment and Review (Department of the Premier and Cabinet)(b) 1685.3
(a) The 2012–13 Budget and 2011 12 Estimated Result reflect the established FTE caps.
(b) Data published by the Office of Public Employment and Review (Department of the Premier and Cabinet). Published figures do not include administered items for the Department of Treasury and Finance.
Treasury and Finance
2012–13 Agency Statements — Volume 4 147

Program net cost of services summary
Net cost of services
2012–13Budget
2011–12Estimated
Result2011–12 Budget
2010–11Actual
Program $000 $000 $000 $000
1. Gambling Policy .................................................. 367 453 341 356
2. Accountability for Public Sector Resources......... 18 491 21 088 19 707 20 960
3. Treasury Services ............................................... 951 939 1 253 1 031
4. Support Services................................................. 9 364 9 336 8 623 10 461
5. Financial Services Provision ............................... 39 781 42 034 34 811 32 822
Total 68 954 73 850 64 735 65 630
Reconciliation to agency net cost of providing services
Add: Net costs transferred out:
Shared Services SA to the Department of the Premier and Cabinet on 1 February 2012.............. — 3 957 15 884 10 487
Less: Net costs transferred in:
Veterans SA from the Department of Planning and Local Government on 21 October 2011 .......... — 199 583 565
Equals: Net cost of providing services (as per agency statement of comprehensive income) 68 954 77 608 80 036 75 552
Investing expenditure summary
2012–13Budget
2011–12Estimated
Result2011–12 Budget
2010–11Actual
Investments $000 $000 $000 $000
Existing projects Taxation Revenue Management System (RISTEC) ............................................................... 5 179 5 888 8 785 5 895
Total existing projects 5 179 5 888 8 785 5 895
Annual programs Minor Capital Works and Equipment...................... 2 047 550 1 320 394
Total annual programs 2 047 550 1 320 394
Total investing expenditure 7 226 6 438 10 105 6 289
Note: Shared Services SA transferred to the Department of the Premier and Cabinet effective 1 February 2012
Treasury and Finance
148 2012–13 Agency Statements — Volume 4

Program 1: Gambling Policy
Description/objective
Treasury and Finance provides policy advice to the government on economic, social and regulatory issues associated with gambling.
Program summary expenses, income and FTEs
2012–13Budget
2011–12Estimated
Result2011–12 Budget
2010–11Actual
$000 $000 $000 $000
Expenses Employee benefit expenses ......................................... 302 329 282 345Supplies and services................................................... 60 134 61 31Depreciation and amortisation expenses...................... 8 4 6 3Other expenses ............................................................ 8 3 3 —Intra-agency.................................................................. — — 3 6
Total expenses 378 470 355 385
Income Sales of goods and services......................................... 11 13 13 26Other income................................................................ — 4 1 3
Total income 11 17 14 29
Net cost of providing services 367 453 341 356
FTEs as at 30 June (No.) 2.4 2.4 2.4 2.7
Financial commentary
2012–13 Budget/2011–12 Estimated Result
The $0.1 million decrease in expenses is primarily due to additional work on the Casino Taskforce in 2011–12 ($0.1 million).
2011–12 Estimated Result/2011–12 Budget
The $0.1 million increase in expenses is primarily due to additional work on the Casino Taskforce in 2011-12 ($0.1 million).
2011–12 Estimated Result/2010–11 Actual
No major variations.
Highlights 2011–12
• Completed three trials of methods that facilitate a gambler setting and keeping to a budget.
• Supported the Responsible Gambling Working Party’s preparation of its fifth progress report.
• Coordinated whole of government responses to the Commonwealth’s consultation on proposed reforms to the not-for-profit sector.
• Developed rules for the new Approved Trading System for Gaming Machine Entitlements and assisted Consumer and Business Services with the first trading round.
Treasury and Finance
2012–13 Agency Statements — Volume 4 149

• Published a policy position paper to reduce red tape in the regulation of bookmakers under the Authorised Betting Operations Act 2000.
• Prepared draft regulations for the prohibition of gaming machines and gaming machine like devices under the Lottery and Gaming Act 1936.
Targets 2012–13
• Prepare for the implementation of budgeting tools for gamblers (pre-commitment) in South Australia.
• Provide secretariat support to the Casino Taskforce in finalising advice to the government on the long-term operating arrangements that should apply to the Adelaide Casino beyond the exclusivity period which expires on 30 June 2015.
• Coordinate implementation of reforms arising from the Commonwealth’s consultation on proposed reforms to the not-for-profit sector.
• Consult and implement regulations for the prohibition of gaming machines and gaming machine like devices under the Lottery and Gaming Act 1936.
Treasury and Finance
150 2012–13 Agency Statements — Volume 4

Program 2: Accountability for Public Sector Resources
Description/objective
Treasury and Finance has the role of ensuring accountability for public sector resources through providing policy, economic and financial advice to the government and coordinating resource allocations for government programs and priorities at the whole of government level.
Sub-programs
2.1 Policy Analysis and Advice
2.2 Budget Financial Management
Program summary expenses, income and FTEs
2012–13Budget
2011–12Estimated
Result2011–12 Budget
2010–11Actual(a)
$000 $000 $000 $000
Expenses Employee benefit expenses ......................................... 13 163 15 921 15 039 17 072Supplies and services................................................... 5 459 6 231 5 170 5 654Depreciation and amortisation expenses...................... 496 242 426 201Other expenses ............................................................ 420 218 223 20Grants and Subsidies ................................................... 28 — — —Intra-agency.................................................................. — — 190 321
Total expenses 19 566 22 612 21 048 23 268
Income Sales of goods and services......................................... 1 057 1 299 1 262 2 022Interest revenue............................................................ — — — 28Other income................................................................ 18 225 79 258
Total income 1 075 1 524 1 341 2 308
Net cost of providing services 18 491 21 088 19 707 20 960
FTEs as at 30 June (No.) 130.9 148.0 160.7 134.5
(a) Actual costs relating to the Sustainable Budget Commission (sub-program 2.3 in the 2011–12 Agency Statements) are included with Sub-program 2.2 ‘Budget Financial Management’ due to the Sustainable Budget Commission ceasing in 2010–11.
Treasury and Finance
2012–13 Agency Statements — Volume 4 151

Sub-program 2.1: Policy Analysis and Advice
Description/objective
Provide policy advice on a range of issues including state revenue, Commonwealth-state relations, Council of Australian Governments matters, economic analysis, National Competition Policy, microeconomic policy and economic conditions.
2012–13Budget
2011–12Estimated
Result2011–12 Budget
2010–11Actual
$000 $000 $000 $000
Expenses...................................................................... 2 668 3 027 2 368 3 160
Income.......................................................................... 386 431 408 337
Net cost of sub-program 2 282 2 596 1 960 2 823
FTEs as at 30 June (No.) 15.7 17.3 18.7 15.9
Financial commentary
2012–13 Budget/2011–12 Estimated Result
No major variations.
2011–12 Estimated Result/2011–12 Budget
The $0.7 million increase in expenses is primarily due to:
• additional work carried out in relation to horizontal fiscal equalisation ($0.2 million).
• additional work carried out in relation to intergovernmental financial relations matters ($0.2 million).
2011–12 Estimated Result/2010–11 Actual
No major variations.
Highlights 2011–12
• Developed a green paper, with assistance from the Motor Accident Commission, on potential changes to the Compulsory Third Party Insurance Scheme to improve scheme fairness, outcomes and affordability and assisted in a public consultation process.
• Prepared advice on 2012–13 water and sewerage prices and rates for the Treasurer and the Minister for Water.
• Transitioned price regulation and reporting on water and sewerage services from the government to the Essential Services Commission of South Australia.
• Lodged three submissions to the Commonwealth Government’s GST Distribution Review Panel and provided advice on issues considered in the review.
• Participated in the review of the performance framework of a number of national agreements and other reforms to support the implementation of the recommendations from the Heads of Treasuries Review of National Agreements, National Partnerships and Implementation Plans.
Treasury and Finance
152 2012–13 Agency Statements — Volume 4

Targets 2012–13
• Provide advice on issues considered in the Commonwealth Government’s review of horizontal fiscal equalisation.
• Provide advice on reform of the Compulsory Third Party Insurance Scheme in response to the government’s green paper.
• Prepare and consult on a framework for access to water and sewerage infrastructure services in South Australia.
• Provide support and advice on intergovernmental matters and reform proposals including those developed by the Council of Australian Governments, the Standing Council for Federal Financial Relations and Heads of Treasuries.
Sub-program 2.2: Budget Financial Management
Description/objective
The objectives of this sub-program include management of the state budget process incorporating:
• the production of the state budget papers
• provision of policy advice to government on whole of government budgetary and financial issues including financial risk management
• monitoring and reporting of financial performance including monitoring the implementation of approved savings measures
• provision of advice to government on its consolidated financial position, on budgetary and structural reform
• facilitation of best practice financial management reforms
• provision of whole of government strategic oversight and governance support for the state’s public private partnership projects with an emphasis on financial risk management.
2012–13Budget
2011–12Estimated
Result2011–12 Budget
2010–11Actual(a)
$000 $000 $000 $000
Expenses...................................................................... 16 898 19 585 18 680 20 108
Income.......................................................................... 689 1 093 933 1 971
Net cost of sub-program 16 209 18 492 17 747 18 137
FTEs as at 30 June (No.) 115.2 130.7 141.9 118.6
(a) Actual costs relating to the Sustainable Budget Commission (sub-program 2.3 in the 2011–12 Agency Statements) are included with Sub-program 2.2 ‘Budget Financial Management’ due to the program ceasing in 2010–11.
Financial commentary
2012–13 Budget/2011–12 Estimated Result
The $2.7 million decrease in expenses is primarily due to a reduction in allocated overheads ($1.3 million).
Treasury and Finance
2012–13 Agency Statements — Volume 4 153

2011–12 Estimated Result/2011–12 Budget
The $0.9 million increase in expenses is primarily due to:
• an increase in allocated overheads following the transition of Shared Services SA to the Department of the Premier and Cabinet ($2.1 million)
partially offset by
• implementation of savings measures ($1.0 million)
• a transfer of funding to Sub-program 2.1 ‘Policy Analysis and Advice’ for work carried out on intergovernmental financial relations matters ($0.2 million).
2011–12 Estimated Result/2010–11 Actual
The $0.9 million decrease in income is primarily due to:
• a reduction in the allocation of corporate overhead income ($0.4 million)
• the cessation of the Sustainable Budget Commission in 2010–11 ($0.3 million).
Highlights 2011–12
• Completed the production of the consolidated Government of South Australia financial statements for 2010–11 and 2012–13 Budget.
• Progressed implementation of the revised policy arrangements for employee residential housing.
• Issued the expression of interest and information memorandum for the ForestrySA divestment.
• Assisted in the establishment of the new Urban Renewal Authority, including the dissolution and transfer of the Land Management Corporation to the Urban Renewal Authority.
• Implemented improvements to the ownership framework, governance and financial reporting of public non-financial corporations and public financial corporations, including a review of major projects and capital programs.
Targets 2012–13
• Progress proposals for realising value from some of the state’s assets.
• Implement further improvements to governance arrangements, financial management and reporting policy for public non-financial corporations and public financial corporations, including review of government employee representation on boards and committees of government enterprises.
• Produce the consolidated Government of South Australia financial statements for 2011–12 and the 2013–14 Budget.
Treasury and Finance
154 2012–13 Agency Statements — Volume 4

Program 3: Treasury Services
Description/objective
Management of the government’s financial assets and liabilities and provision of certainty of funding to the state.
2012–13Budget
2011–12Estimated
Result2011–12 Budget
2010–11Actual
$000 $000 $000 $000
Expenses Employee benefit expenses ......................................... 4 606 4 700 4 896 4 617Supplies and services................................................... 1 853 1 632 1 693 1 326Depreciation and amortisation expenses...................... 44 43 54 51Other expenses ............................................................ 96 74 57 —Intra-agency.................................................................. — — 63 101
Total expenses 6 599 6 449 6 763 6 095
Income Sales of goods and services......................................... 5 648 5 510 5 510 5 064
Total income 5 648 5 510 5 510 5 064
Net cost of providing services 951 939 1 253 1 031
FTEs as at 30 June (No.) 52.1 52.6 53.9 50.8
Financial commentary
2012–13 Budget/2011–12 Estimated Result
No major variations.
2011–12 Estimated Result/2011–12 Budget
No major variations.
2011–12 Estimated Result/2010–11 Actual
No major variations.
Performance indicators
2012 13
Target
2011 12Estimated
Result2011 12
Target 2010 11
Actual
% of debt financing demands of the state and its instrumentalities met during year
100% 100% 100% 100%
% of clients satisfied with the South Australian Government Financing Authority’s services — assessed on timeliness, cost effectiveness and flexibility in service delivery
90% 95% 90% 95%
Treasury and Finance
2012–13 Agency Statements — Volume 4 155

Program 4: Support Services
Description/objective
Treasury and Finance provides vehicles for ministers, Leader of the Opposition, members of parliament and VIPs and supports the Treasurer’s Office and Veterans SA.
Sub-programs
4.1 Vehicles for ministers, Leader of the Opposition, MPs and VIPs
4.2 Ministerial Support Services — Treasurer
4.3 Veterans SA
Program summary expenses, income and FTEs
2012–13Budget
2011–12Estimated
Result2011–12 Budget
2010–11Actual
$000 $000 $000 $000
Expenses Employee benefit expenses ......................................... 5 789 6 716 5 191 8 225Supplies and services................................................... 3 722 3 112 3 691 2 881Depreciation and amortisation expenses...................... 180 80 133 52Other expenses ............................................................ 190 94 85 1Grants and subsidies.................................................... 200 200 203 195Intra-agency.................................................................. — — 82 98
Total expenses 10 081 10 202 9 385 11 452
Income Sales of goods and services......................................... 709 786 736 932Interest revenue............................................................ — — — 9Other income................................................................ 8 80 26 50
Total income 717 866 762 991
Net cost of providing services 9 364 9 336 8 623 10 461
FTEs as at 30 June (No.) 51.7 53.2 53.8 48.0
Treasury and Finance
156 2012–13 Agency Statements — Volume 4

Sub-program 4.1: Vehicles for Ministers, Leader of the Opposition, MPs and VIPs
Description/objective
Provision of a motor vehicle service to ministers, Leader of the Opposition and VIP dignitaries on official state government business, together with the provision of parliamentary remuneration vehicles to members of parliament.
2012–13Budget
2011–12Estimated
Result2011–12 Budget
2010–11Actual
$000 $000 $000 $000
Expenses...................................................................... 7 105 7 056 6 686 8 331
Income.......................................................................... 580 664 622 758
Net cost of sub-program 6 525 6 392 6 064 7 573
FTEs as at 30 June (No.) 31.9 32.2 33.0 32.5
Financial commentary
2012–13 Budget/2011–12 Estimated Result
No major variations.
2011–12 Estimated Result/2011–12 Budget
No major variations.
2011–12 Estimated Result/2010–11 Actual
The decrease in expenses of $1.3 million is primarily due to the implementation of savings strategies in 2011–12.
Activity indicators
2012 13
Projection
2011 12Estimated
Result2011 12
Projection 2010 11
Actual
No. of motor vehicles providedThe number of vehicles reflects both the ministerial chauffeured fleet and the take-up of private plated vehicles by members of parliament. A total of 60 out of 69 members of parliament have elected to utilise a private plated vehicle.
86 86 85 86
Treasury and Finance
2012–13 Agency Statements — Volume 4 157

Sub-program 4.2: Ministerial Support Services — Treasurer
Description/objective
Operation of the Treasurer’s Office including departmental support.
2012–13Budget
2011–12Estimated
Result2011–12 Budget
2010–11Actual
$000 $000 $000 $000
Expenses...................................................................... 2 265 2 436 2 115 2 556
Income.......................................................................... 120 176 139 233
Net cost of sub-program 2 145 2 260 1 976 2 323
FTEs as at 30 June (No.) 16.3 17.4 17.1 15.5
Financial commentary
2012–13 Budget/2011–12 Estimated Result
No major variations.
2011–12 Estimated Result/2011–12 Budget
No major variations.
2011–12 Estimated Result/2010–11 Actual
No major variations.
Sub-program 4.3: Veterans SA
Description/objective
Veterans’ Affairs (Veterans SA) provides assistance to our ex-servicemen and women and those who support them by providing a central contact point for information about the state government’s services to veterans across departments, including health, transport, disability and mental health.
Veterans SA provides administrative support to the Veterans’ Advisory Council to ensure veterans receive a voice at the highest levels of government and helps to raise public awareness about the sacrifices made by South Australia’s veterans.
2012–13Budget
2011–12Estimated
Result (a)2011–12 Budget
2010–11Actual
$000 $000 $000 $000
Expenses...................................................................... 711 710 584 565
Income.......................................................................... 17 26 1 0
Net cost of sub-program 694 684 583 565
FTEs as at 30 June (No.) 3.5 3.6 3.7 3.0
(a) Veterans SA transferred to Department of Treasury and Finance on 21 October 2011.
Treasury and Finance
158 2012–13 Agency Statements — Volume 4

Financial commentary
2012–13 Budget/2011–12 Estimated Result
No major variations.
2011–12 Estimated Result/2011–12 Budget
The $0.1 million increase in expenses is primarily due to the allocation of corporate overheads to Veterans’ Affairs following the transition of the program to the Department of Treasury and Finance.
2011–12 Estimated Result/2010–11 Actual
No major variations.
Highlights 2011–12
• Partnered with the Veterans’ Health Advisory Council on the Framework for Veterans’ Health Care (2012–2016).
• Continued the development of a veterans’ charter.
• Expanded the ANZAC Sporting Medals Program.
• Launched the Bravest of the Brave travelling exhibition about South Australia’s World War One Victoria Cross recipients.
Targets 2012–13
• Complete a veterans’ charter.
• Continue preparation for the Centenary of ANZAC Commemorative Program.
• Complete the Aboriginal and Torres Strait Islander War Memorial.
• Progress the development of a South Australian virtual war memorial.
Treasury and Finance
2012–13 Agency Statements — Volume 4 159

Program 5: Financial Services Provision
Description/objective
Treasury and Finance has the role of providing a range of whole of government services including liability management, collection of taxes, insurance, superannuation and fleet administration.
Sub-programs
5.1 Revenue Collection and Management
5.2 Insurance Services and Fleet SA
5.3 Superannuation Services
5.4 Procurement Policy and Governance
5.5 Ministerial Support Services — Minister for Finance
Program summary expenses, income and FTEs
2012–13Budget
2011–12Estimated
Result2011–12 Budget
2010–11Actual
$000 $000 $000 $000
Expenses Employee benefit expenses ......................................... 36 858 42 643 37 380 39 313Supplies and services................................................... 31 756 27 395 26 489 24 287Depreciation and amortisation expenses...................... 3 705 1 249 3 477 1 153Other expenses ............................................................ 1 585 975 892 9Intra-agency.................................................................. — — 640 1 045
Total expenses 73 904 72 262 68 878 65 807
Income Fees, fines and penalties.............................................. 428 356 1 104 —Sales of goods and services......................................... 33 651 29 395 32 803 31 619Investment revenue ...................................................... — — — 52Other income................................................................ 44 477 160 1 314
Total income 34 123 30 228 34 067 32 985
Net cost of providing services 39 781 42 034 34 811 32 822
FTEs as at 30 June (No.) 518.2 528.7 534.1 475.7
Treasury and Finance
160 2012–13 Agency Statements — Volume 4

Sub-program 5.1: Revenue Collection and Management
Description/objective
Management of taxation legislation, revenue systems and compliance systems to enable the government to raise revenue using its taxation powers and the provision of policy advice on taxation issues. Management of various grants and subsidy schemes for the government.
2012–13Budget
2011–12Estimated
Result2011–12 Budget
2010–11Actual
$000 $000 $000 $000
Expenses...................................................................... 42 825 41 830 39 823 39 536
Income.......................................................................... 7 650 4 022 7 871 9 691
Net cost of sub-program 35 175 37 808 31 952 29 845
FTEs as at 30 June (No.) 275.1 283.1 286.0 278.3
Financial commentary
2012–13 Budget/2011–12 Estimated Result
The $1.0 million increase in expenses is primarily due to the impact of indexation.
The $3.6 million increase in income is primarily due to a once-off reduction in 2011–12 in cost recovery revenue from the Community Emergency Services Fund ($4.1 million).
2011–12 Estimated Result/2011–12 Budget
The $2.0 million increase in expenses is primarily due to:
• an increase in allocated overheads following the transition of Shared Services SA to the Department of the Premier and Cabinet ($3.5 million)
partially offset by
• a once-off reduction in depreciation ($1.6 million).
The $3.8 million decrease in income is primarily due to a once-off reduction in 2011–12 in cost recovery revenue from the Community Emergency Services Fund ($4.1 million).
2011–12 Estimated Result/2010–11 Actual
• The $2.3 million increase in expenses is primarily due to an increase in allocated overheads following the transition of Shared Services SA to the Department of the Premier and Cabinet ($3.5 million).
The $5.7 million decrease in income is primarily due to:
• a once-off reduction in 2011–12 in cost recovery revenue from the Community Emergency Services Fund ($4.1 million).
• finalisation of Commonwealth funding for the Standard Business Reporting project ($0.8 million).
Treasury and Finance
2012–13 Agency Statements — Volume 4 161

Highlights 2011–12
• Reviewed and maintained harmonised payroll tax legislation and administrative practices, providing significant administrative cost savings for businesses that employ workers in more than one jurisdiction.
Targets 2012–13
• Administer the state’s taxation system efficiently and effectively.
Performance indicators
2012 13
Target
2011 12Estimated
Result2011 12
Target 2010 11
Actual
$ increase in revenue resulting from compliance initiatives The 2011–12 Estimated Result is below target due to weaker economic conditions and its consequential effect on taxation revenue.
$66mcollected
$66m collected
$70m collected
$70.5mcollected
% of revenue banked on day of receipt The 2011–12 Estimated Result includes a significant government payment received and receipted after the bank’s closing time. If the payment was able to be banked on the same day, the indicator for percentage of revenue banked on day of receipt would have increased to 98.4 per cent.
>97% 89.4% >97% 97.7%
Cost for collection of $100 tax (on a cash basis) <75 cents 69 cents <75 cents 69 cents
Activity indicators
2012 13
Projection
2011 12Estimated
Result2011 12
Projection 2010 11
Actual
Taxation revenue collected by RevenueSA $3.2b $3.1b $3.2b $3.1b
Sub-program 5.2: Insurance Services and Fleet SA
Description/objective
The objectives of this sub-program include:
• provision of insurance cover to government agencies through the insurance and reinsurance of government risks
• provision of advice to the government on issues relating to the insurance and management of those risks
• provision of fleet management services to agencies and vehicle disposal.
2012–13Budget
2011–12Estimated
Result2011–12 Budget
2010–11Actual
$000 $000 $000 $000
Expenses...................................................................... 9 793 9 892 10 112 9 262
Income.......................................................................... 9 767 9 853 9 879 8 990
Net cost of sub-program 26 39 233 272
FTEs as at 30 June (No.) 77.1 77.9 79.5 69.6
Treasury and Finance
162 2012–13 Agency Statements — Volume 4

Financial commentary
2012–13 Budget/2011–12 Estimated Result
No major variations.
2011–12 Estimated Result/2011–12 Budget
No major variations.
2011–12 Estimated Result/2010–11 Actual
The $0.6 million increase in expenses is primarily due to lower costs incurred on behalf of Insurance Services and Fleet SA in 2010–11 in relation to:
• general administration ($0.3 million)
• staff vacancies ($0.2 million).
The $0.9 million increase in income is primarily due to additional cost recovery revenue from Insurance Services and Fleet SA in 2011–12.
Highlights 2011–12
• Completed a review of the government’s catastrophe reinsurance program.
• Submitted a report to the Commonwealth on the state’s insurance arrangements as required under the Natural Disaster Relief and Recovery arrangements.
• Completed the Alternative Fleet Management Arrangements review.
Targets 2012–13
• Renew the government’s catastrophe reinsurance program at competitive market prices.
• Implement outcomes of the Alternative Fleet Management Arrangements review.
Performance indicators
2012 13
Target
2011 12Estimated
Result2011 12
Target 2010 11
Actual
No. of clients issued with agency agreements 100% of eligible clients
100% of eligible clients
100% of eligible clients
100% of eligible clients
Comprehensive government catastrophe reinsurance program at a competitive market price
Selected catastrophic risks covered at competitive market prices
Reinsurance program fully placed at competitive market prices
Selected catastrophic risks covered at competitive market prices
Reinsurance program fully placed at competitive market prices
% of clients provided with agency agreements/renewal certificates and invoices by 31 July
80% 85% 80% 85%
Operating expense per $100 premium revenue <$5.00 $4.76 <$5.00 $4.23
Treasury and Finance
2012–13 Agency Statements — Volume 4 163

Activity indicators
2012 13
Projection
2011 12Estimated
Result2011 12
Projection 2010 11
Actual
No. of new vehicles purchased 3 200 3 000 3 150 2 861No. of vehicles disposed 3 300 3 200 3 300 3 036
Sub-program 5.3: Superannuation Services
Description/objective
The objective of this program is to:
• administrate the various public sector superannuation schemes for the Superannuation Board, as well as the superannuation arrangements for parliamentarians, judges and the Governor
• provide superannuation policy and legislative advice to the Superannuation Board, the Under Treasurer and the Treasurer.
2012–13Budget
2011–12Estimated
Result2011–12 Budget
2010–11Actual
$000 $000 $000 $000
Expenses...................................................................... 16 426 16 227 16 516 14 803
Income.......................................................................... 16 565 16 131 16 217 14 156
Net cost of sub-program -139 96 299 647
FTEs as at 30 June (No.) 135.7 137.0 151.9 113.1
Financial commentary
2012–13 Budget/2011–12 Estimated Result
No major variations.
2011–12 Estimated Result/2011–12 Budget
No major variations.
2011–12 Estimated Result/2010–11 Actual
The $1.4 million increase in expenses is primarily due to lower costs incurred on behalf of the Superannuation Funds Management Corporation of South Australia in 2010–11 due to:
• staff vacancies ($0.9 million)
• contractors ($0.4 million).
The $2.0 million increase in income is primarily due to lower cost recovery revenue from the Superannuation Funds Management Corporation of South Australia in 2010–11.
Treasury and Finance
164 2012–13 Agency Statements — Volume 4

Performance indicators
2012 13
Target
2011 12Estimated
Result2011 12
Target 2010 11
Actual
% achievement of service level standards agreed with Super SA Board by 30 June each year
95% 90% 95% 88%
Issue of member statements by 31 August 98% 99% 98% 99%No. of days to issue Superannuant payment summaries from 1 July
14 14 14 7
Benchmarking of administrative costs with industry standards
Continue to remain in the most cost efficient quartile of industry standards while providing additional services to members
Continued to remain in the most cost efficient quartile of industry standards while providing additional services to members
Continue to remain in the most cost efficient quartile of industry standards while providing additional services to members
Remained in the most cost efficient quartile of industry standards while providing additional services to members
Activity indicators
2012 13
Projection
2011 12Estimated
Result2011 12
Projection 2010 11
Actual
No. of contributors/members in state schemes (activity level indicator):
• members 187 000 187 000 185 000 186 900• Triple S Scheme active contributors 33 000 31 100 33 000 31 444
Sub-program 5.4: Procurement Policy and Governance
Description/objective
Support the State Procurement Board in the delivery of its key objectives and in setting the strategic direction of procurement operations across government, focusing on policy and guidelines development, capability development, and facilitating procurement across government.
2012–13Budget
2011–12Estimated
Result2011–12 Budget
2010–11Actual
$000 $000 $000 $000
Expenses...................................................................... 2 626 2 613 2 427 2 206
Income.......................................................................... 75 118 100 148
Net cost of sub-program 2 551 2 495 2 327 2 058
FTEs as at 30 June (No.) 16.1 16.2 16.6 14.6
Financial commentary
2012–13 Budget/2011–12 Estimated Result
No major variations.
Treasury and Finance
2012–13 Agency Statements — Volume 4 165

2011–12 Estimated Result/2011–12 Budget
The $0.2 million increase in expenses is primarily due to an increase in departmental allocated overheads following the transition of Shared Services SA to the Department of the Premier and Cabinet.
2011–12 Estimated Result/2010–11 Actual
The $0.4 million increase in expenses is primarily due to an increase in departmental allocated overheads following the transition of Shared Services SA to the Department of the Premier and Cabinet.
Highlights 2011–12
• Awarded an additional four part-scholarships to government employees undertaking the Master of Management (Strategic Procurement) qualification at the University of South Australia (with eight students now receiving financial support).
• Continued to manage funding from the Commonwealth Government’s Productivity Placements Program to train 101 staff across government in vocational education training (VET) sector procurement certificate IV and diploma qualifications.
• Developed and implemented seven new targeted training courses — scheduled 55 workshops for the year (with 656 attendees in the 42 sessions delivered to March 2012).
• Completed seven agency reviews.
• Completed an independent review of the procurement compliance program and accreditation program.
• Achieved an updated and improved three yearly procurement compliance program, approved by the State Procurement Board for trialling and implementation in 2012–13.
• Developed an updated procurement authority program.
Targets 2012–13
• Develop procurement capability in agencies through delivery of targeted training and facilitation/promotion of VET and post graduate qualifications and related funding opportunities.
• Implement the updated three-year procurement compliance program.
• Conduct a revalidation of agency procurement authorities (over a three-year cycle).
Treasury and Finance
166 2012–13 Agency Statements — Volume 4

Sub-program 5.5: Ministerial Support Services — Minister for Finance
Description/objective
Operation of the Minister for Finance’s Office.
2012–13Budget
2011–12Estimated
Result2011–12
Budget(a) 2010–11Actual(a)
$000 $000 $000 $000
Expenses...................................................................... 2 234 1 700 n.a. n.a.
Income.......................................................................... 66 104 n.a. n.a.
Net cost of sub-program 2 168 1 596 n.a. n.a.
FTEs as at 30 June (No.) 14.2 14.3 n.a. n.a.
(a) The Minister for Finance was appointed on 21 October 2011 as disclosed in the South Australian Government Gazette.
Financial commentary
2012–13 Budget/2011–12 Estimated Result
The $0.5 million increase in expenses reflects the full-year operation of the Minister for Finance’s Office in 2012–13.
2011–12 Estimated Result/2011–12 Budget
Due to the role of Minister for Finance being created in October 2011, there is no applicable comparison for the 2011–12 Budget.
2011–12 Estimated Result/2010–11 Actual
Due to the role of Minister for Finance being created in October 2011, there is no applicable comparison for the 2010–11 Actual.
Treasury and Finance
2012–13 Agency Statements — Volume 4 167

Treasury and FinanceStatement of comprehensive income___________________________________________________________________________________________________________________________________________________________________________________________________________
2012–13Budget
$000
2011–12Estimated
Result
$000
2011–12Budget
$000
2010–11Actual
$000ExpensesEmployee benefit expenses Salaries, wages, annual and sick leave ............................ 48 651 79 435 102 013 100 098 Long service leave ............................................................ 1 496 3 127 2 914 3 284 Payroll tax ......................................................................... 2 506 4 305 5 438 5 589 Superannuation ................................................................ 5 914 8 816 11 239 11 217 Other ................................................................................. 2 151 2 945 2 284 6 720Supplies and services General supplies and services .......................................... 41 529 62 549 79 456 75 101 Consultancy expenses ...................................................... 1 521 1 926 2 671 1 461Depreciation and amortisation expenses .............................. 4 433 3 407 7 665 4 409Borrowing costs .................................................................... 404 404 404 — Grants and subsidies ............................................................ 228 172 — 1 186Intra-government transfers ................................................... — — — 48Other expenses .................................................................... 1 695 1 390 1 559 414
Total expenses 110 528 168 476 215 643 209 527
IncomeCommonwealth revenues ..................................................... — — — 850Intra-government transfers ................................................... — 250 — — Fees, fines and penalties ...................................................... 428 356 1 104 423Sales of goods and services ................................................. 41 076 89 725 133 340 130 320Interest revenues .................................................................. — 518 800 1 317Other income ........................................................................ 70 19 363 1 065
Total income 41 574 90 868 135 607 133 975
Net cost of providing services 68 954 77 608 80 036 75 552
Income from/expenses to state governmentIncome Appropriation .................................................................... 67 538 65 509 78 634 74 622 Other income .................................................................... — 1 200 — 2 700
Net income from/expenses to state government 67 538 66 709 78 634 77 322
Total comprehensive result -1 416 -10 899 -1 402 1 770
Treasury and Finance
168 2012–13 Agency Statements — Volume 4

Treasury and FinanceStatement of financial position___________________________________________________________________________________________________________________________________________________________________________________________________________
2012–13Budget
$000
2011–12Estimated
Result
$000
2011–12Budget
$000
2010–11Actual
$000AssetsCurrent assetsCash and cash equivalents ................................................... 13 642 17 136 50 682 50 879Receivables .......................................................................... 4 872 20 076 18 462 23 866Other current assets ............................................................. 253 409 — 409
Total current assets 18 767 37 621 69 144 75 154
Non current assetsLand and improvements ....................................................... 389 562 1 208 2 028Plant and equipment ............................................................. 6 582 906 18 973 3 426Intangible assets ................................................................... 19 365 26 641 14 692 23 824Other non-current assets ...................................................... — — 824 —
Total non-current assets 26 336 28 109 35 697 29 278
Total assets 45 103 65 730 104 841 104 432
LiabilitiesCurrent liabilitiesPayables ............................................................................... 10 168 13 203 13 252 10 929Employee benefits Salaries and wages .......................................................... 345 345 2 219 — Annual leave ..................................................................... 4 439 7 536 8 624 8 095 Long service leave ............................................................ 2 187 2 856 2 135 3 104Short-term provisions ............................................................ 189 293 220 284Other current liabilities .......................................................... 84 933 670 753
Total current liabilities 17 412 25 166 27 120 23 165
Non current liabilitiesLong-term employee benefits Long service leave ............................................................ 13 004 22 050 25 170 23 056Long-term provisions ............................................................ 634 986 720 959Other non-current liabilities ................................................... 49 1 044 1 004 384
Total non-current liabilities 13 687 24 080 26 894 24 399
Total liabilities 31 099 49 246 54 014 47 564
Net assets 14 004 16 484 50 827 56 868
EquityContributed capital ................................................................ 547 547 547 547Retained earnings ................................................................. 13 349 15 829 50 172 56 213Asset revaluation reserve ..................................................... 108 108 108 108
Total equity 14 004 16 484 50 827 56 868
Balances as at 30 June end of period.
Treasury and Finance
2012–13 Agency Statements — Volume 4 169

Treasury and FinanceStatement of cash flows___________________________________________________________________________________________________________________________________________________________________________________________________________
2012–13Budget
$000
2011–12Estimated
Result
$000
2011–12Budget
$000
2010–11Actual
$000
Operating activitiesCash outflowsEmployee benefit payments ................................................. 59 980 97 671 122 812 131 107Payments for supplies and services ..................................... 43 050 61 135 82 127 75 103Interest paid .......................................................................... 404 404 404 — Grants and subsidies ............................................................ 228 172 — 1 186GST paid ............................................................................... — — — 23 782Other payments .................................................................... 1 580 1 294 1 443 2 318
Cash used in operations 105 242 160 676 206 786 233 496
Cash inflowsIntra-government transfers ................................................... — 250 — — Commonwealth receipts ....................................................... — — — 850Fees, fines and penalties ...................................................... 428 356 1 104 423Sales of goods and services ................................................. 41 008 89 586 133 340 125 802Interest received ................................................................... — 518 800 1 326GST received ........................................................................ — — — 22 894Other receipts ....................................................................... — 19 224 1 065
Cash generated from operations 41 436 90 729 135 468 152 360
State governmentAppropriation ........................................................................ 67 538 65 509 78 634 74 622Other receipts ....................................................................... — 1 200 — 2 700Payments
Net cash provided by state government 67 538 66 709 78 634 77 322
Net cash provided by (+)/used in (-) operating activities 3 732 -3 238 7 316 -3 814
Investing activitiesCash outflowsPurchase of property, plant and equipment .......................... 7 226 609 12 067 1 239Purchase of intangibles ........................................................ — 5 829 — 10 096
Cash used in investing activities 7 226 6 438 12 067 11 335
Net cash provided by (+)/used in (-) investing activities -7 226 -6 438 -12 067 -11 335
Proceeds from restructuring activities ................................... — -24 067 — —
Cash generated from financing activities — -24 067 — —
Net cash provided by (+)/used in (-) financing activities — -24 067 — —
Net increase (+)/decrease (-) in cash equivalents -3 494 -33 743 -4 751 -15 149
Cash and cash equivalents at the start of the period 17 136 50 879 55 433 66 028
Cash and cash equivalents at the end of the period 13 642 17 136 50 682 50 879
Treasury and Finance
170 2012–13 Agency Statements — Volume 4

Administered items for the Department of Treasury and Finance Statement of comprehensive income(a)
2012–13Budget
2011–12Estimated
Result2011–12 Budget
2010–11Actual
$000 $000 $000 $000Expenses Employee benefit expenses
Salaries, wages, annual and sick leave ...................... 541 449 263 281Superannuation(b)........................................................ 10 337 2 813 454 4 558 -402 354
Supplies and services General supplies and services.................................... 49 910 50 610 51 737 49 936
Borrowing costs(c) ............................................................. 750 510 774 087 812 007 760 212Grants and subsidies........................................................ 2 488 816 1353 104 1 517 798 2 030 060Intra-government transfers ............................................... 561 098 707 022 818 902 392 009Other expenses ................................................................ 8 042 601 9 830 922 9 791 965 9 940 080
Total expenses 11 903 813 15 529 648 12 997 230 12 770 224
Income Taxation............................................................................ 3 318 536 3 199 350 3 419 927 3 198 646Tax equivalent revenues .................................................. 121 053 146 362 116 505 138 581Commonwealth revenues................................................. 5 079 111 5 790 440 6 049 557 5 859 850Intra-government transfers ............................................... 10 753 11 590 10 590 6 078Fees, fines and penalties.................................................. 80 216 75 673 89 238 63 601Sales of goods and services............................................. 175 170 170 406Interest revenues.............................................................. 136 301 145 194 134 232 144 579Dividend income............................................................... 234 731 326 418 261 460 272 059Other income(d) ................................................................. 33 836 380 921 34 548 125 353
Total income 9 014 712 10 076 118 10 116 227 9 809 153
State government Income
Appropriation .............................................................. 1 852 115 2 091 483 1 986 613 1 778 431Expenses
Cash alignment ........................................................... — 244 925 — 62 707
Net income from/expenses to state government 1 852 115 1 846 558 1 986 613 1 715 724
Net result -1 036 986 -3 606 972 -894 390 -1 245 347
(a) This statement reflects the aggregated transactions of the Department of Treasury and Finance Consolidated Account items and the Treasury and Finance Administered Items Account.
(b) The 2010–11 year includes a reduction to superannuation expenses mainly due to the use of a higher discount rate to value the unfunded superannuation liability in accordance with Australian Accounting Standards and higher than expected returns achieved by Funds SA. These changes did not have any impact on the cash payments in 2010–11 for past service superannuation.
(c) Borrowing costs include nominal interest on the unfunded superannuation liability.
(d) Budget figures do not include the return of surplus cash held by agencies at 30 June to the Consolidated Account in accordance with the cash alignment policy.
Treasury and Finance
2012–13 Agency Statements — Volume 4 171

Administered items for the Department of Treasury and Finance Statement of financial position(a)
2012–13Budget
2011–12Estimated
Result2011–12 Budget
2010–11Actual
$000 $000 $000 $000Assets Current assets
Cash and cash equivalents .............................................. 149 910 149 910 242 100 2 917 957Receivables ...................................................................... 781 112 738 504 375 893 855 366
Total current assets 931 022 888 414 617 993 3 773 323
Non-current assets
Financial assets................................................................ 4 695 899 3 586 103 3 671 505 2 851 175
Total non-current assets 4 695 899 3 586 103 3 671 505 2 851 175
Total assets 5 626 921 4 474 517 4 289 498 6 624 498
Liabilities Current liabilities
Payables........................................................................... 42 748 42 748 14 440 42 748Short-term borrowings ...................................................... 3 998 853 2 857 187 3 204 478 2 663 340Employee benefits
Superannuation........................................................... 455 100 437 600 424 790 408 500Other current liabilities...................................................... 30 500 30 500 28 778 —
Total current liabilities 4 527 201 3 368 035 3 672 486 3 114 588
Non current liabilities
Long-term borrowings....................................................... 6 365 694 5 231 170 4 788 072 6 810 826Long-term employee benefits
Superannuation........................................................... 11 365 900 11 470 200 8 317 358 8 687 000Long-term provisions ........................................................ 16 300 16 300 6 800 16 300
Total non-current liabilities 17 747 894 16 717 670 13 112 230 15 514 126
Total liabilities 22 275 095 20 085 705 16 784 716 18 628 714
Net assets -16 648 174 -15 611 188 -12 495 218 -12 004 216
Equity Retained earnings ............................................................ -16 648 174 -15 611 188 -12 495 218 -12 004 216
Total equity -16 648 174 -15 611 188 -12 495 218 -12 004 216
(a) This statement reflects the aggregated transactions of the Department of Treasury and Finance Consolidated Account items and the Treasury and Finance Administered Items Account. The balances are reported as at 30 June end of period.
Treasury and Finance
172 2012–13 Agency Statements — Volume 4

Administered items for the Department of Treasury and Finance Consolidated Account items Statement of cash flows
2012–13Budget
2011–12Estimated
Result2011–12 Budget
2010–11Actual
$000 $000 $000 $000Operating activities Cash inflows
Taxation Contribution from Lotteries Commission of South Australia........................................................... 111 592 83 741 80 181 85 231Land tax ......................................................................... 585 800 588 199 598 407 595 885Commonwealth places mirror land tax(a) ........................ 1 500 1 500 1 700 1 397Other taxes on property ................................................. 10 10 10 67Payroll tax ...................................................................... 1 298 600 1 199 500 1 236 500 1 145 678Commonwealth places mirror payroll tax(a) .................... 22 200 21 000 21 600 20 043Save the River Murray Levy........................................... 25 400 26 200 25 900 25 036Stamp duties .................................................................. 1 275 709 1 291 566 1 448 735 1 321 103Commonwealth places mirror stamp duties(a) ................ 300 300 300 363
Commonwealth receipts Commonwealth general purpose grants
GST revenue grants ................................................. 4 511 800 4 279 700 4 492 600 4 251 512Commonwealth specific purpose grants
Council of Australian Governments funding arrangements(b) ........................................... 567 261 1 548 218 1 556 944 1 523 285Natural disaster relief and recovery arrangements ........................................................... 50 3 022 13 —
Interest receipts
Interest on investments.................................................. 109 671 118 084 116 281 113 349Interest recoveries ......................................................... 26 630 27 110 17 951 29 963
Dividends and distributions Arrangements with private electricity entities
Local government rate equivalent ............................ 228 221 220 214Austraining Pty Ltd
Dividend ................................................................... — — — 285Income tax equivalent ............................................. — — — 281
Defence SA Local government rate equivalent ............................ — — 213 3
Department of Planning, Transport and Infrastructure(c)
Income tax equivalent .............................................. 2 641 2 645 3 002 3 454Local government rate equivalent ............................ 1 318 1 289 972 1 165
Flinders Ports Payment in lieu of other taxes .................................. — — — 2 170
ForestrySA Dividend ................................................................... 656 15 571 28 431 26 516Income tax equivalent .............................................. 4 727 6 314 13 116 13 155
Funds SA Local government rate equivalent ............................ 196 191 191 186
Treasury and Finance
2012–13 Agency Statements — Volume 4 173

2012–13Budget
2011–12Estimated
Result2011–12 Budget
2010–11Actual
$000 $000 $000 $000HomeStart Finance
Dividend ................................................................... 6 195 6 244 4 786 7 329Income tax equivalent .............................................. 4 425 4 315 2 564 4 665
Land Management Corporation(d) Dividend ................................................................... — — 58 685 12 757Income tax equivalent .............................................. — 1 273 14 169 11 261Local government rate equivalent ............................ — 441 657 744
Lotteries Commission of South Australia Income tax equivalent .............................................. 8 439 8 204 7 060 8 899Local government rate equivalent ............................ 5 5 5 6
Public Trustee Office Dividend ................................................................... 1 370 1 363 1 363 —Income tax equivalent .............................................. 675 721 721 775
RESI Corporation Dividend ................................................................... — 4 500 — —
SA Water Corporation Dividend ................................................................... 209 211 223 229 138 189 169 006Income tax equivalent ............................................. 100 276 93 812 91 220 78 691Local government rate equivalent ............................ 1 473 1 437 1 437 1 372
South Australian Asset Management Corporation Dividend ................................................................... — 20 187 20 100 4 000
South Australian Government Employee Residential Properties
Dividend ................................................................... 1 706 1 706 1 706 1 706Income tax equivalent .............................................. 351 295 295 2
South Australian Government Financing Authority Dividend ................................................................... 8 230 — 8 200 50 000Income tax equivalent .............................................. 4 470 16 230 4 100 18 100
South Australian Housing Trust Income tax equivalent .............................................. — — — 21 414
TransAdelaide Local government rate equivalent ............................ — — — 558
Urban Renewal Authority(d) Dividend ................................................................... 7 363 — — —Income tax equivalent .............................................. 954 708 — —Local government rate equivalent ............................ 682 221 — —
West Beach Trust Income tax equivalent .............................................. 226 387 437 347
Other receipts Department of Planning, Transport and Infrastructure(c) ........................................................ 4 279 4 175 4 175 552Essential Services Commission of South Australia........ 6 467 6 408 6 408 5 526Guarantee fees .............................................................. 80 216 75 673 89 238 63 601Independent Gaming Corporation contribution to Gamblers Rehabilitation Fund ....................................... 2 000 2 000 2 000 2 000Industry Financial Assistance Deposit Account ............. — 1 616 616 950Metropolitan Drainage Fund .......................................... 7 7 7 —National Tax Equivalent Program .................................. 50 50 50 9Return of cash to Consolidated Account cash alignment ....................................................................... — 346 523 — 96 556
Treasury and Finance
174 2012–13 Agency Statements — Volume 4

2012–13Budget
2011–12Estimated
Result2011–12 Budget
2010–11Actual
$000 $000 $000 $000Return of deposit account balances............................... — — — 2 071Return of deposit account balances — superannuation .......................................... 30 000 30 000 30 000 9 500South Australian Housing Trust return of equity ............ — 53 821 — —Sundry fees.................................................................... 33 32 32 9Sundry recoupment........................................................ 142 138 138 397Unclaimed monies ......................................................... 1 786 1 732 1 882 2 411
Total receipts for Consolidated Account 9 027 320 10 121 834 10 133 507 9 735 555
Cash outflows
Employee benefit payments Minister's salary, electorate and expense allowance ..... 541 449 263 281
Grants, subsidies and transfers First Home Owner Grants .............................................. 52 507 48 500 53 662 45 861Payments to fund Consolidated Account ....................... 2 277 631 1 138 453 1 306 604 1 779 419
Total payments appropriated under various acts 53 048 48 949 53 925 46 142
Total payments funded by borrowings 2 277 631 1 138 453 1 306 604 1 779 419
Investing activities Cash inflows Repayment of advances
Administered items for the Department of Planning, Transport and Infrastructure(c)........................................ 209 209 209 —Department of Health and Ageing(c) ............................... 19 059 1 140 1 140 661Department of Primary Industries and Regions(c) .......... 3 733 1 694 1 694 700Minister for Education and Child Development(c) ........... — — — 1 500Renmark Irrigation Trust ................................................ 121 — — 116Royal Zoological Society of South Australia .................. 229 111 — —South Australian Cricket Association ............................. — 85 000 85 000 —South Australian Housing Trust ..................................... 49 714 84 841 295 498 65 212South Australian Tourism Commission .......................... — — — 50West Beach Trust .......................................................... — — — 2 716Other recoveries ............................................................ 6 — 6 6
Return of capital Adelaide Convention Centre .......................................... 45 500 38 000 — —Defence SA.................................................................... — 184 853 6 593 1 955Department of Planning, Transport and Infrastructure(c) ............................................................... — — — 15 770South Australian Asset Management Corporation ......... — 716 716 —Urban Renewal Authority(d) ............................................ 1 971 — — —
Total receipts for Consolidated Account 120 542 396 564 390 856 88 686
Financing activities Cash inflows Borrowings
Borrowings to fund Consolidated Account ..................... 2 277 631 1 138 453 1 306 604 1 779 419
Treasury and Finance
2012–13 Agency Statements — Volume 4 175

2012–13Budget
2011–12Estimated
Result2011–12 Budget
2010–11Actual
$000 $000 $000 $000Other
Deposits with Treasurer ................................................. 1 141 330 — 1 365 285 152 194
Total borrowings 2 277 631 1 138 453 1 306 604 1 779 419
Total receipts re cash and deposits 1 141 330 — 1 365 285 152 194
Cash outflows
Other payments Deposits with South Australian Government Financing Authority ........................................................ 1 141 330 2 566 522 719 972 152 194Deposits with Treasurer ................................................. — 201 525 645 313 —
Total payments re cash and deposits 1 141 330 2 768 047 1 365 285 152 194
Net impact on Consolidated Account 9 094 814 10 469 449 10 470 438 9 778 099
Net impact on cash and deposits — -2 768 047 — —
(a) Taxes akin to state taxes are levied on activities conducted on Commonwealth places under authority of Commonwealth mirror tax legislation. Revenue is retained by the state.
(b) Under the national health reform arrangements, the National Healthcare Specific Purpose grant will be replaced by national health reform funding from 1 July 2012. Funding contributions from the Commonwealth and the states will be paid into the state account in the National Health Funding Pool which will be administered by the administrator of the National Health Funding Body. Funds will be identified in state accounts within the national funding body and transferred directly to local health and hospital networks (five in South Australia) and state managed funds. As a result this revenue is now reflected in the Department for Health and Ageing.
(c) Name changes since the 2011–12 Budget as a result of the machinery of government restructure. Refer to Appendix D for details.
(d) In February 2012, Cabinet approved regulations to create the Urban Renewal Authority and dissolved the Land Management Corporation and transferred its assets, operations, rights and liabilities to the Urban Renewal Authority, which commenced its operations on 1 March 2012.
Treasury and Finance
176 2012–13 Agency Statements — Volume 4

Administered items for the Department of Treasury and Finance Treasury and Finance Administered Items Account Statement of cash flows
2012–13Budget
2011–12Estimated
Result2011–12 Budget
2010–11Actual
$000 $000 $000 $000Operating activities Cash outflows
Employee benefit payments Past service superannuation payments ......................... 437 600 408 500 408 500 406 600Police superannuation, guaranteed minimum retirement benefit ........................................................... 1 000 1 000 1 000 246
Payments for supplies and services Administration of banking facilities and other services ................................................................ — — 527 —National Tax Equivalent Program .................................. 60 60 60 11Repayment of unclaimed monies................................... 350 650 350 476State share of GST administration costs........................ 49 500 49 900 50 800 49 449
Interest paid Interest paid on deposit accounts and other monies...... 40 348 40 778 47 985 44 935Interest on borrowings ................................................... 369 699 325 963 352 322 345 200
Grants, subsidies and transfers Adelaide Convention Centre .......................................... 5 882 — — —Adelaide Oval Redevelopment ...................................... — 143 021 85 000 506Charitable and Social Welfare Fund .............................. 4 000 4 000 4 000 4 000Community Development Fund...................................... 20 000 20 000 20 000 20 000Community Wastewater Management Schemes (benefits to households in goods and services) ............. 3 718 3 627 3 627 3 539Contingency provisions — employee entitlements ........ 150 791 218 371 160 670 129 816Contingency provisions — investing contingencies ....... 86 608 72 497 130 670 35 001Contingency provisions — supplies and services .......... 159 514 101 713 279 043 57 675Department for Communities and Social Inclusion(a) ..... 3 845 3 845 3 845 3 845Department for Manufacturing, Innovation, Trade, Resources and Energy(a)(b)............................................. 6 277 3 118 — —Department of Planning, Transport and Infrastructure(a)(b) ............................................................ — 3 100 6 218 5 526Donation to Pakistan Flood Relief.................................. — — — 350Donation to Penola Storm Relief.................................... — — — 350Donation to Queensland Flood Appeal .......................... — — — 1 000Donation to SA Tall Ships .............................................. — — — 150Electricity Operating Account — RESI Corporation ....... — — 2 260 —Emergency services levy — land and business regulations ...................................................... 246 240 240 233Emergency services levy remissions ............................. 82 096 75 290 74 917 74 925Essential Services Commission of South Australia........ 1 003 550 671 1 412Fire damage and insurance costs (SAICORP Fund No. 2) .................................................................... 7 000 7 000 7 000 —First Home Owners Bonus............................................. 10 500 10 200 11 400 12 500First Home Owners Boost(c) ........................................... — 655 655 8 564Gamblers Rehabilitation Fund ....................................... 2 000 2 000 2 000 2 000HomeStart Finance ........................................................ 1 007 1 020 — —Industry Financial Assistance Fund ............................... 7 815 23 217 22 098 22 144
Treasury and Finance
2012–13 Agency Statements — Volume 4 177

2012–13Budget
2011–12Estimated
Result2011–12 Budget
2010–11Actual
$000 $000 $000 $000Land Management Corporation(d) .................................. — 770 1 155 890Metropolitan drainage systems maintenance................. 1 450 1 050 1 250 1 623Ministerial council on gambling ...................................... 50 50 50 50Petrol subsidies.............................................................. — — — 8 573Residual electricity entities............................................. 500 500 500 500SA Water Corporation.................................................... 137 840 140 490 140 490 168 307South Australian Motor Sport Board .............................. 3 181 8 976 2 416 5 936Sport and Recreation Fund............................................ 3 500 3 500 3 500 3 500State Procurement Board .............................................. 408 399 399 390Support services to parliamentarians............................. 20 920 20 560 19 028 19 693Unclaimed estate — payment to the Public Trustee ...... — 3 531 — —Unclaimed superannuation benefits............................... 300 — — —Urban Renewal Authority(d) ............................................ 6 625 6 673 — —Venture Capital Fund ..................................................... — 210 210 —
Other payments Other payments ............................................................. 50 50 50 171Payments to the South Australian Superannuation Fund .................................................... 30 000 30 000 30 000 9 500Refunds and remissions ................................................ 10 784 40 872 13 142 36 644
Cash used in operations 1 666 467 1 777 946 1 888 048 1 486 230
State government Appropriation
Appropriation ................................................................. 1 799 067 2 042 534 1 932 688 1 732 289Payments
Cash alignment .............................................................. — 244 925 — 62 707
Net cash provided by state government 1 799 067 1 797 609 1 932 688 1 669 582
Net cash provided by (+)/used in (-) operating activities 132 600 19 663 44 640 183 352
Investing activities Cash outflows Other payments
Advances granted Adelaide Convention Centre .................................... 126 227 — — —Department of Primary Industries and Regions(a)..... 1 060 14 400 — 3 814Flinders Medical Centre Foundation......................... — — — 5 000Royal Zoological Society of South Australia............. — 2 600 — —South Australian Cricket Association........................ — 55 000 — 30 000
Equity capital contributions Adelaide Convention Centre .................................... — 78 500 43 500 5 500Urban Renewal Authority(d) ...................................... 3 872 112 948 — —
Cash used in investing activities 131 159 263 448 43 500 44 314
Net cash provided by (+)/used in (-) investing activities -131 159 -263 448 -43 500 -44 314
Treasury and Finance
178 2012–13 Agency Statements — Volume 4

2012–13Budget
2011–12Estimated
Result2011–12 Budget
2010–11Actual
$000 $000 $000 $000
Financing activities
Cash outflows
Repayment of borrowings South Australian Government Financing Authority ........ 1 441 11 288 1 140 1 978
Cash used in financing activities 1 441 11 288 1 140 1 978
Net cash provided by (+)/used in (-) financing activities -1 441 -11 288 -1 140 -1 978
Net increase(+)/decrease (-) in cash equivalents — -255 073 — 137 060
Cash and cash equivalents at the start of the financial year (as at 1 July) — 255 073 — 118 013
Cash and cash equivalents at the end of the financial year (as at 30 June) — — — 255 073
(a) Name changes since the 2011–12 Budget as a result of the machinery of government restructure. Refer to Appendix D for details.
(b) The Energy Division was transferred from the Department of Planning, Transport and Infrastructure to the Department for Manufacturing, Innovation, Trade, Resources and Energy on 1 January 2012. As a result the grant for the Office of the Technical Regulator previously paid to the Department of Planning, Transport and Infrastructure in now paid to the Department for Manufacturing, Innovation, Trade, Resources and Energy.
(c) On 14 October 2008, the Commonwealth Government increased assistance for first home buyers through the introduction of the First Home Owners Boost scheme. This assistance is in addition to the state funded First Home Owners Bonus Scheme introduced in the 2008–09 Budget. The First Home Owners Boost scheme ceased from 31 December 2009 — estimated payments for 2011–12 reflect the 12 month application period and the timeframes allowed for the construction of new homes.
(d) In February 2012, Cabinet approved regulations to create the Urban Renewal Authority, and dissolved the Land Management Corporation and transferred its assets, operations, rights and liabilities to the Urban Renewal Authority, which commenced its operations on 1 March 2012.
Treasury and Finance
2012–13 Agency Statements — Volume 4 179

Administered items for the Department of Treasury and Finance Other Accounts Statement of cash flows
2012–13Budget
2011–12Estimated
Result2011–12 Budget
2010–11Actual
$000 $000 $000 $000Operating activities Receipts
Taxation Emergency services levy — state government .............. 2 917 2 867 2 752 2 965Emergency services levy — other.................................. 101 630 101 563 101 861 98 750
Sales of goods and services Essential Services Commission of South Australia........ 454 44 44 339Gaming Machines Operations Deposit Account ............ 31 387 30 622 30 622 15 919Housing Loans Redemption Fund.................................. 2 2 2 —Independent Gambling Authority.................................... — — — 107South Australian Motor Sport Board .............................. 21 966 21 412 23 871 21 208State Procurement Board .............................................. 120 60 60 137
Interest received Country Price Equalisation Scheme............................... — — — 683Housing Loans Redemption Fund.................................. 552 552 552 478Independent Gambling Authority.................................... — — — 118Industry Financial Assistance Deposit Account ............. — 56 56 10Local Government Disaster Fund .................................. 2 892 2 560 2 560 2 035South Australian Motor Sport Board .............................. 415 414 339 458
Intra-government transfers Community Development Fund...................................... 20 000 20 000 20 000 20 000Community Emergency Services Fund — state government ............................................. 3 419 3 139 2 946 3 165Community Emergency Services Fund — other ............ 78 677 72 151 71 971 71 760Essential Services Commission of South Australia........ 1 003 550 671 1 412Independent Gambling Authority.................................... 107 122 122 —Industry Financial Assistance Deposit Account ............. 7 815 23 217 22 148 29 209South Australian Motor Sport Board .............................. 3 181 9 221 2 616 5 586State Procurement Board .............................................. 408 399 399 390Support services to parliamentarians............................. 20 920 20 560 19 028 21 686
Receipts from government Independent Gambling Authority.................................... 1 657 1 623 1 623 1 592Sustainable Budget Commission ................................... — — — 997
Grants and subsidies Intergovernmental Federal Financial Relations.............. 1 493 921 2 420 660 2 003 031 1 902 280Local government concessions...................................... 9 008 8 417 8 417 2 437
Other receipts Community Emergency Services Fund.......................... 406 410 300 662Essential Services Commission of South Australia........ 12 128 11 853 12 378 4 098Industry Financial Assistance Deposit Account ............. 100 1 200 200 7 273South Australian Motor Sport Board .............................. — — — 947Support services to parliamentarians............................. — — — 8
Total receipts 1 815 085 2 753 674 2 328 569 2 216 709
Treasury and Finance
180 2012–13 Agency Statements — Volume 4

2012–13Budget
2011–12Estimated
Result2011–12 Budget
2010–11Actual
$000 $000 $000 $000
Payments
Employee benefit payments Essential Services Commission of South Australia........ 3 263 3 500 4 569 3 197Independent Gambling Authority.................................... 1 005 1 010 985 986South Australian Motor Sport Board .............................. 1 444 1 415 1 346 1 412State Procurement Board .............................................. 37 36 36 70Support services to parliamentarians............................. 14 485 14 134 12 724 14 209
Payments for supplies and services Essential Services Commission of South Australia........ 2 574 2 528 2 520 2 370Gaming Machines Operations Deposit Account ............ 31 391 30 626 30 626 15 732Housing Loans Redemption Fund.................................. 22 22 22 0Independent Gambling Authority.................................... 751 819 752 562Local Government Disaster Fund .................................. 40 40 40 40South Australian Motor Sport Board .............................. 25 104 26 839 25 023 25 703State Procurement Board .............................................. 485 417 417 401Support services to parliamentarians............................. 6 436 6 757 6 361 5 566Sustainable Budget Commission ................................... — — — 918Treasurer’s Interest in National Wine Centre ................. 38 38 38 31
Intra-government transfers Community Development Fund...................................... 20 000 20 000 20 000 20 000Community Emergency Services Fund.......................... 187 049 180 131 179 829 177 303Essential Services Commission of South Australia........ 6 516 6 408 6 408 5 526Industry Financial Assistance Deposit Account ............. — 2 540 — —Intergovernmental Federal Financial Relations.............. 1 492 233 2 325 673 1 899 409 1 950 483
Grants and subsidies Independent Gambling Authority.................................... — — — 10Industry Financial Assistance Deposit Account ............. 12 430 23 480 23 038 44 288Local government concessions...................................... 9 008 8 417 8 417 2 238Local Government Disaster Fund .................................. 8 717 12 522 1 352 1 057
Payments to government Industry Financial Assistance Deposit Account ............. — 900 900 —Intergovernmental Federal Financial Relations.............. 64 333 75 761 44 176 —
Other payments Essential Services Commission of South Australia........ 7 7 7 —Independent Gambling Authority.................................... 8 8 8 —Industry Financial Assistance Deposit Account ............. — 616 616 7 159Local Government Disaster Fund .................................. 138 138 138 0South Australian Motor Sport Board .............................. 35 34 30 718State Procurement Board .............................................. 6 6 6 —Support services to parliamentarians............................. 19 22 4 713
Total payments 1 887 574 2 744 844 2 269 797 2 280 692
Net cash provided by operating activities -72 489 8 830 58 772 -63 983
Treasury and Finance
2012–13 Agency Statements — Volume 4 181

2012–13Budget
2011–12Estimated
Result2011–12 Budget
2010–11Actual
$000 $000 $000 $000
Investing activities
Receipts
Proceeds from other financial assets Industry Financial Assistance Deposit Account ............. — 1 460 1 460 4 088South Australian Motor Sport Board .............................. — — — 350
Total receipts — 1 460 1 460 4 438
Payments
Purchase of plant and equipment Essential Services Commission of South Australia........ 845 119 119 101South Australian Motor Sport Board .............................. 1 312 1 210 452 346Support services to parliamentarians............................. 450 789 380 142
Granted other financial assets Industry Financial Assistance Deposit Account ............. 1 500 — — 560
Total payments 4 107 2 118 951 1 149
Net cash provided by investing activities -4 107 -658 509 3 289
Net increase (+)/decrease (-) in cash held -76 596 8 172 59 281 -60 694
Treasury and Finance
182 2012–13 Agency Statements — Volume 4

Summary of major variations
The following commentary relates to variations between the 2012–13 Budget and the 2011–12 Estimated Result.
Controlled items
Statement of comprehensive income controlled
Expenses
The $58.0 million decrease in expenses is primarily due to the transition of Shared Services SA from the Department of Treasury and Finance to the Department of the Premier and Cabinet on 1 February 2012 ($60.6 million).
Income
The $49.3 million decrease in income is primarily due to:
• the transition of Shared Services SA from the Department of Treasury and Finance to the Department of the Premier and Cabinet on 1 February 2012 ($56.6 million)
partially offset by
• a once-off reduction in cost recovery revenue from the Community Emergency Services Fund in 2011–12 ($4.1 million).
Statement of financial position controlled
The $2.5 million decrease in total net assets is primarily due to the transfer of Shared Services SA to the Department of the Premier and Cabinet.
Statement of cash flows controlled
The movements in cash outflows and inflows are generally consistent with the changes discussed above under the statement of comprehensive income and the statement of financial position.
Administered items
The administered items for the Department of Treasury and Finance include Consolidated Account items, special deposit accounts and the assets and liabilities held on behalf of the state by the Treasurer. The more significant assets and liabilities include cash and deposits at call, loans made to other government entities, past superannuation liabilities and borrowings. For presentation purposes, three cash flow statements have been prepared: Consolidated Account items, Treasury and Finance Administered Items Account, and Other Accounts. This format has been used to provide clarity given the volume of items administered by the department.
The Consolidated Account items cash flow statement presents administered receipts collected on behalf of the government and paid to the Consolidated Account. The statement also includes administered payments that are funded by specific appropriation authorised in various Acts.
The Treasury and Finance Administered Items Account cash flow statement presents payments administered on behalf of the government and funded by appropriation authorised in the annual Appropriation Act.
The Other Accounts cash flow statement presents the receipts and payments for the remaining special deposit accounts administered by the department.
Treasury and Finance
2012–13 Agency Statements — Volume 4 183

Statement of cash flows Consolidated Account items
The decrease in receipts is primarily due to:
• lower stamp duty receipts in 2012–13 mainly reflecting that in 2011–12, receipts for stamp duty on motor vehicle registrations and transfers and the $60 stamp duty fee on compulsory third party renewal certificates are inclusive of 13 months worth of payments — the final payment for 2010–11 was made at the start of 2011–12, rather than the end of 2010–11
• a significant reduction in Commonwealth specific purpose grants which reflects the changes to healthcare funding arrangements under the joint Commonwealth-State National Health Reform Agreement. As of 1 July 2012 the National Healthcare Specific Purpose Payment will be replaced by national health reform funding. As a result this revenue is now reflected in the Department for Health and Ageing
• lower distributions from ForestrySA in 2012–13 reflecting the planned forward sale of forest rotations in the South East
• a once-off dividend from RESI Corporation in 2011–12. RESI Corporation will be wound up on 30 June 2012 and its residual functions, assets and liabilities will be transferred to the Department of Treasury and Finance and the South Australian Government Financing Authority
• lower distributions from SA Water in 2012–13 reflecting increased operating expenses and borrowing costs associated with major infrastructure projects and water security initiatives
• a final dividend from the South Australian Asset Management Corporation in 2011–12
• the return of surplus cash held by agencies at 30 June 2011 to the Consolidated Account in 2011–12 in accordance with the cash alignment policy
• South Australian Housing Trust return of equity in 2011–12 related to the return of proceeds on the sale of buildings to the Urban Renewal Authority
• higher repayment of advances by the South Australian Housing Trust in 2011–12
• Defence SA repayment of contributed capital in 2011–12 relating to the return of proceeds on the sale of buildings to the Urban Renewal Authority
partially offset by
• higher contributions from Lotteries Commission of South Australia in 2012–13 reflecting a once-off dividend associated with the creation of a new lotteries licence
Statement of cash flows Treasury and Finance Administered Items Account
The decrease in payments is primarily due to:
• lower refunds and remission payments in 2012–13 mainly due to a number of large once-off corporate reconstruction payments in 2011–12
• lower grants to the Industry Financial Assistance Fund in 2012–13 reflecting that funding for Holden’s Small Car Project ended in 2011–12, and a number of industry assistance programs had budgeted funds until 30 June 2012
• cash alignment payments in 2011–12 to return surplus cash held at 30 June 2011 to the Consolidated Account
• higher equity contributions to the Urban Renewal Authority in 2011–12 for purchase of property from Defence SA
Treasury and Finance
184 2012–13 Agency Statements — Volume 4

partially offset by
• higher interest payments on the Treasurer’s debt in 2012–13 arising from the Consolidated Account borrowings in 2011–12
• higher investing payments to the Adelaide Convention Centre in 2012–13 relating to the redevelopment program.
Statement of cash flows Other Accounts
The decrease in operating payments is primarily due to an $844.6 million reduction in payments under the Intergovernmental Agreement on Federal Financial Relations reflecting the timing of programmed capital expenditure on:
• road and rail infrastructure under the Nation Building program and Building Australia Fund
• the Adelaide Desalination Plant
• Remote Indigenous Housing National Partnership and Nation Building — Economic Stimulus Plan programs
partially offset by
• increased payments associated with the Health Infrastructure and the Improving Public Hospital Services National Partnership agreements.
The decrease in operating receipts is primarily due to a $926.7 million reduction in Commonwealth grants under the Intergovernmental Agreement on Federal Financial Relations including:
• the timing of programmed capital expenditure for the Nation Building program and Building Australia Fund, the Adelaide Desalination Plant, the Remote Indigenous Housing National Partnership and the Nation Building — Economic Stimulus Plan
• the timing of expenditure for the Productivity Places Program.
Treasury and Finance
2012–13 Agency Statements — Volume 4 185

Treasury and Finance
186 2012–13 Agency Statements — Volume 4

Agency: Department for Water
Minister for Water and the River Murray
1872012–13 Agency Statements — Volume 4

Water
188 2012–13 Agency Statements — Volume 4

Contents
Objective..................................................................................................................................... 190 Ministerial responsibilities........................................................................................................... 190 Workforce summary ................................................................................................................... 190 Program net cost of services summary ...................................................................................... 191 Investing expenditure summary..................................................................................................191 Program 1: Water Planning and Management ........................................................................ 192 Program 2: Operations and Major Programs........................................................................... 198 Program 3: Policy and Strategy ............................................................................................... 204 Program 4: Science, Monitoring and Information..................................................................... 210 Financial statements................................................................................................................... 216 Summary of major variations ...................................................................................................... 222 Additional information for administered items............................................................................. 224
Water
1892012–13 Agency Statements — Volume 4

Objective
The Department for Water’s objective is to ensure that there are always sufficient and sustainable water resources in South Australia for our health, our economy, our environment and our lifestyle.
Ministerial responsibilities
Minister Programs Sub-programs
1. Water Planning and Management
1.1 Water Allocation Planning 1.2 Licensing and Compliance
2. Operations and Major Programs
2.1 River Murray Management and Operations
2.2 Major Programs
3. Policy and Strategy 3.1 Murray-Darling Basin Policy and Planning
3.2 Water Policy 3.3 Urban Water
The Hon. P Caica Minister for Water and the River Murray
4. Science, Monitoring and Information
4.1 Water Science 4.2 Monitoring and Information
Administered items
In addition to the above responsibilities, the agency administers the following items on behalf of the minister:
• Excess water (fines and penalties)
• Natural Resources Management Levy
• Qualco Sunlands Ground Water Control Trust
• South Eastern Water Conservation and Drainage Board
• Stormwater Management Authority.
Statutes
The Department of the Premier and Cabinet maintains a list of statutes applicable to ministers.
Workforce summary
FTEs as at 30 June
Agency 2012–13
Budget(a)
2011–12Estimated
Result(a)2010–11Actual(b)
Department for Water .......................................................................... 341.2 354.3 367.0
Total 341.2 354.3 367.0
(a) The 2012–13 Budget and 2011 12 Estimated Result reflect the established FTE caps.
(b) Data published by the Office of Public Employment and Review (Department of the Premier and Cabinet).
Water
190 2012–13 Agency Statements — Volume 4

Program net cost of services summary
Net cost of services
2012–13Budget
2011–12Estimated
Result2011–12 Budget
2010–11Actual
Program $000 $000 $000 $000
1. Water Planning and Management....................... -5 556 4 576 3 032 13 999
2. Operations and Major Programs ......................... 29 638 30 957 20 715 27 936
3. Policy and Strategy ............................................. 38 112 46 021 52 393 46 846
4. Science, Monitoring and Information................... 13 815 17 023 13 781 21 052
Total 76 009 98 577 89 921 109 833
Investing expenditure summary
2012–13Budget
2011–12Estimated
Result2011–12 Budget
2010–11Actual
Investments $000 $000 $000 $000
Existing projects Budget Management Information System.............. — — — 13Patawalonga Lake System — Repair and Upgrade .......................................................... 3 300 320 320 —River Murray Waste Disposal Stations................... — — 398 656Riverine Recovery.................................................. 16 962 627 — —
Total existing projects 20 262 947 718 669
Annual programs Minor Capital Works and Equipment...................... 1 151 2 438 805 1 951South East Drainage System................................. 1 522 — 1 485 —Water Monitoring Equipment ................................. 2 883 2 195 2 984 3 826
Total annual programs 5 556 4 633 5 274 5 777
Total investing expenditure 25 818 5 580 5 992 6 446
Water
1912012–13 Agency Statements — Volume 4

Program 1: Water Planning and Management
Description/objective
To assist the minister and the natural resources management (NRM) boards in managing the 29 prescribed water resources areas in South Australia through the provision of planning and management advice and regulatory services.
Sub-programs
1.1 Water Allocation Planning
1.2 Licensing and Compliance
Program summary expenses and income
2012–13Budget
2011–12Estimated
Result2011–12 Budget
2010–11Actual
$000 $000 $000 $000
Expenses Employee benefit expenses ......................................... 7 868 9 242 8 871 9 713Supplies and services................................................... 5 372 7 915 4 974 5 281Depreciation and amortisation expenses...................... 1 402 1 423 1 398 1 211Grants and subsidies.................................................... — 93 — 7Intra-government expenses.......................................... 3 39 3 10Other expenses ............................................................ 118 119 137 108
Total expenses 14 763 18 831 15 383 16 330
Income Commonwealth revenues............................................. 1 507 3 741 1 350 1 045Intra-government transfers ........................................... — — — 48Other grants.................................................................. — — 20 —Fees, fines and penalties.............................................. 1 367 1 209 1 797 1 140Sales of goods and services......................................... 16 445 8 305 8 119 67Interest revenue............................................................ — — — 3Other income................................................................ 1 000 1 000 1 065 28
Total income 20 319 14 255 12 351 2 331
Net cost of providing services -5 556 4 576 3 032 13 999
FTEs as at 30 June (No.) 96.8 97.7 100.4 97.3
Water
192 2012–13 Agency Statements — Volume 4

Sub-program 1.1: Water Allocation Planning
Description/objective
To provide co-ordinated policy, scientific and technical advice to the NRM boards and to work in partnership with the boards to develop, review and implement water allocation plans.
To assess the impact to the state’s water resources of development applications statutorily referred to the minister responsible for the administration of the River Murray Act 2003 and the administration of the Natural Resources Management Act 2004.
2012–13Budget
2011–12Estimated
Result2011–12 Budget
2010–11Actual
$000 $000 $000 $000
Expenses...................................................................... 1 814 4 104 1 947 3 296
Income.......................................................................... 186 1 557 122 552
Net cost of sub-program 1 628 2 547 1 825 2 744
FTEs as at 30 June (No.) 14.9 14.2 14.1 11.3
Financial commentary
2012–13 Budget/2011–12 Estimated Result
The $0.9 million decrease in net cost is primarily due to:
• a decrease in expenses due to a reduction in salary related expenses resulting from targeted voluntary separation packages paid in 2011–12 ($0.3 million)
• a decrease in expenses due to the sub-program’s contribution to departmental savings measures ($0.6 million).
There is also a $1.3 million decrease in expenses and income due to the common registry system project.
2011–12 Estimated Result/2011–12 Budget
The $0.7 million increase in net cost is primarily due to an increase in salary related expenses resulting from targeted voluntary separation packages paid in 2011–12 ($0.3 million).
There is also a $1.3 million increase in expenses and income due to the common registry system project.
2011–12 Estimated Result/2010–11 Actual
The $0.2 million decrease in net cost is primarily due to a decrease in expenses relating to the completion of the centralised accounts receivable system implementation ($0.5 million)
There is also a $1.0 million increase in expenses and income due to the common registry system project.
Water
1932012–13 Agency Statements — Volume 4

Highlights 2011–12
• Supported NRM boards to submit draft water allocation plans to the minister to consider for adoption for the following areas:
– Mallee Prescribed Wells Area
– Tintinara-Coonalpyn Prescribed Wells Area
– Western Mount Lofty Ranges Prescribed Water Resources Area.
Targets 2012–13
• Support NRM boards to develop water allocation plans to submit to the minister to consider adopting for the following areas:
– Eastern Mount Lofty Ranges Prescribed Area
– Baroota Prescribed Wells Area
– Southern Basins and Musgrave Prescribed Wells Areas
– Lower Limestone Coast Prescribed Wells Areas.
Performance indicators
2012 13
Target
2011 12Estimated
Result2011 12
Target 2010 11
Actual
% of development applications processed within statutory timeframes
100% 95% 100% 99.9%
Activity indicators
2012 13
Projection
2011 12Estimated
Result2011 12
Projection 2010 11
Actual
No. of Development Act 1993 application referrals processedDevelopment application referrals are higher than anticipated due to the whole of government referral reduction program not being completed within the anticipated timeframe. This program is expected to be completed in 2012–13 and should result in a reduced number of referrals.
400 420 306 414
No. of Development Act 1993 policy referrals processed 60 60 70 64
Water
194 2012–13 Agency Statements — Volume 4

Sub-program 1.2: Licensing and Compliance
Description/objective
To promote sustainable water resource management through the implementation of water allocation plans. The implementation of these plans include the administration of water licences, permits and trade, along with investigation and compliance activities including the collection and management of water meter data.
2012–13Budget
2011–12Estimated
Result2011–12 Budget
2010–11Actual
$000 $000 $000 $000
Expenses...................................................................... 12 949 14 727 13 436 13 034
Income.......................................................................... 20 133 12 698 12 229 1 779
Net cost of sub-program -7 184 2 029 1 207 11 255
FTEs as at 30 June (No.) 81.9 83.5 86.3 86.0
Financial commentary
2012–13 Budget/2011–12 Estimated Result
The $9.2 million decrease in net cost is primarily due to:
• an increase in income as a result of cost recovery for water planning and management ($7.9 million)
• a decrease in salary related expenses resulting from targeted voluntary separation packages paid in 2011–12 ($0.7 million)
• a decrease in expenses due to the National Water Initiative Mount Lofty Ranges Prescription Agreement ($0.6 million).
2011–12 Estimated Result/2011–12 Budget
The $0.8 million increase in net cost is primarily due to an increase in salary related expenses resulting from targeted voluntary separation packages paid in 2011–12 ($0.7 million).
2011–12 Estimated Result/2010–11 Actual
The $9.2 million decrease in net cost is primarily due to:
• an increase in income as a result of cost recovery for water planning and management ($7.5 million)
• an increase in income as a result of charging for the sale of water ($1.0 million).
Highlights 2011–12
• Worked with the Commonwealth Government and other jurisdictions to progress the common registry system to deliver a national water licensing and trading system.
• Progressed the National Framework for Compliance and Enforcement project through the documentation of business processes and regional stakeholder risk profiles.
• Met with the Council of Australian Governments and agreed on the trade service standards for the South Australian Murray-Darling Basin.
• Conducted a volumetric conversion of area-based licences in the Barossa Prescribed Water Resources Area.
Water
1952012–13 Agency Statements — Volume 4

• Issued water licences to existing users in the Far North Prescribed Wells Area, enabling better management of the groundwater resources of the Great Artesian Basin.
• Undertook a compliance and audit program in the Northern Adelaide Plains Prescribed Wells Area to assess the volume of water taken and associated compliance with metering requirements.
• Implemented an online well construction permit application function to improve service for stakeholders.
Targets 2012–13
• Work with the Commonwealth Government and other jurisdictions to progress the common registry system.
• Develop and implement a community engagement strategy to promote education and compliance across a range of water users to encourage extraction of water within sustainable limits and in accordance with licence conditions.
• Review existing meter reading programs with a view to establishing a statewide management program to better target compliance and monitoring activities to priority water resource areas.
• Finalise volumetric conversion of area-based water licences in the Mallee Prescribed Wells Area.
• Issue existing user licences in the following areas:
– Eastern Mount Lofty Ranges Prescribed Water Resources Area
– Western Mount Lofty Ranges Prescribed Water Resources Area
– Baroota Prescribed Water Resources Area
– Kangaroo Flat Prescribed Well Area.
Performance indicators(a)
2012 13
Target
2011 12Estimated
Result(b)2011 12
Target 2010 11
Actual
% of trades processed within 20 business days — interstate trade
90% 100% 90% 100%
% of trades processed within 10 business days — intrastate trade
90% 96% 90% 98%
% of trades approved within 20 business days 90% 98% 90% 99%% of trades registered within 10 business days 90% 100% 90% 100%
(a) Measures relate to trades in line with Commonwealth standards (National Water Initiative). This service standard applies within the River Murray prescribed watercourse only.
(b) Estimated result is the actual performance up to and including 31 March 2012.
Water
196 2012–13 Agency Statements — Volume 4

Activity indicators
2012 13
Projection
2011 12Estimated
Result2011 12
Projection 2010 11
Actual
No. of meter reads Previously targets not set for number of meter reads. Some meters read more than once. Numbers include monthly reads along the River Murray as part of the Drought program — now only quarterly reads along the River Murray.
24 100 21 700 21 700 36 742
No. of well drilling permits On line forms introduced in December 2011 to address red tape reduction for customers.
3 050 3 200 3 050 3 318
No. of water licensing applications processed Variances between the 2011–12 Projection and the 2010–11 Actual is due a large number (2904) of ‘no fee data maintenance’ applications processed in the 2010–11 year. The majority of these applications were associated with discrete projects to update property and source details on water licences. The variance in projected numbers for 2012–13 from those represented in 2011–12 is based on projected issues of 2600 licences in the Eastern and Western Mount Lofty Ranges prescribed water resources areas in 2012–13.
5 360 2 760 3 400 6 077
No. of water trade applications determined Water Trade applications determined reflect the number of applications where the decision has been finalised.
900 889 1 090 1 184
No. of water permits issued 3 050 3 050 3 000 3 077No. of water authorisations issued 300 300 300 284
Water
1972012–13 Agency Statements — Volume 4

Program 2: Operations and Major Programs
Description/objective
To develop and implement plans and programs to manage the operations of the River Murray, initiate and deliver major infrastructure programs, and fulfil the requirements of the state hazard leader for flood and riverbank collapse.
Sub-programs
2.1 River Murray Management and Operations
2.2 Major Programs
Program summary expenses and income
2012–13Budget
2011–12Estimated
Result2011–12 Budget
2010–11Actual
$000 $000 $000 $000
Expenses Employee benefit expenses ......................................... 7 472 7 422 5 205 7 360Supplies and services................................................... 17 871 25 684 29 473 21 411Depreciation and amortisation expenses...................... 1 611 1 541 1 599 2 540Grants and subsidies.................................................... 455 1 379 675 1 475Intra-government expenses.......................................... 4 618 5 548 2 49Other expenses ............................................................ 138 119 80 8 695
Total expenses 32 165 41 693 37 034 41 530
Income Taxation........................................................................ — 789 740 734Commonwealth revenues............................................. 420 6 118 — 3 321Intra-government transfers ........................................... — 1 827 — 7 825Other grants.................................................................. — 100 6 512 537Fees, fines and penalties.............................................. — — — 1Sales of goods and services......................................... 2 107 1 902 8 465 1 296Interest revenue............................................................ — — 25 14Net gain or loss from disposal of assets ....................... — — — -157Other income................................................................ — — 577 23
Total income 2 527 10 736 16 319 13 594
Net cost of providing services 29 638 30 957 20 715 27 936
FTEs as at 30 June (No.) 80.4 83.1 60.8 74.0
Water
198 2012–13 Agency Statements — Volume 4

Sub-program 2.1: River Murray Management and Operations
Description/objective
To coordinate and implement River Murray water sharing and river operation objectives to achieve multiple outcomes including water security, productive irrigated agriculture, salinity management and environmental management. To deliver The Living Murray program and other programs to achieve ecological outcomes for icon sites and the River Murray.
2012–13Budget
2011–12Estimated
Result2011–12 Budget
2010–11Actual
$000 $000 $000 $000
Expenses...................................................................... 3 935 16 858 17 466 24 637
Income.......................................................................... 560 6 058 11 615 8 960
Net cost of sub-program 3 375 10 800 5 851 15 677
FTEs as at 30 June (No.) 14.2 24.6 14.7 33.0
Financial commentary
2012–13 Budget/2011–12 Estimated Result
The $7.4 million decrease in net cost is primarily due to:
• a decrease in Murray Futures program expenses relating to the removal of the Goolwa Channel regulators in 2011–12 ($3.8 million)
• a decrease in Murray Futures program expenses relating to the removal of the Narrung Bund in 2011–12 ($1.0 million)
• a decrease in expenses for Murray-Darling Basin Authority environmental water management projects ($3.1 million)
• a decrease in expenses due to the sub-program’s contribution to the department’s savings measures ($1.5 million)
partially offset by
• a decrease in income from the Murray-Darling Basin Authority for environmental water management projects ($2.8 million).
There is also a $1.9 million decrease in expenses and income which is primarily due to the Murray-Darling Basin Authority contribution to the removal of the Goolwa Channel regulators.
2011–12 Estimated Result/2011–12 Budget
The $4.9 million increase in net cost is primarily due to a decrease in income due to the completion of the National Action Plan for Salinity and Water Quality for the Upper South East and Salt Interception Scheme programs ($5.5 million).
2011–12 Estimated Result/2010–11 Actual
The $4.9 million decrease in net cost is primarily due to:
• a decrease in expenses due to the impairment recognition (a reduced asset value) for the Goolwa Channel regulators in 2010–11 ($8.4 million)
Water
1992012–13 Agency Statements — Volume 4

• a decrease in expenses due to the reduction in depreciation for the Goolwa Channel regulators following impairment ($1.0 million)
• a decrease in expenses due to the completion of the National Action Plan for Salinity and Water Quality for the Upper South East and Salt Interception Scheme programs ($3.3 million)
partially offset by
• a decrease in income due to completion of the National Action Plan for Salinity and Water Quality for the Upper South East and Salt Interception Scheme programs ($5.1 million)
• an increase in Murray Futures program expenses relating to the removal of the Goolwa Channel regulators ($3.6 million).
Highlights 2011–12
• Developed the River Murray Operating Strategy.
• Developed and implemented the 2011–12 South Australian River Murray Operating Plan.
• Optimised delivery of environmental water, including water recovered under The Living Murray program, to key River Murray sites in South Australia.
• Completed investigations and monitoring activities at the icon sites to support environmental water delivery and management.
• Constructed and commissioned the Murtho Salt Interception Scheme.
• Completed the full removal of the Narrung Bund phase 1 and undertook phase 1 and 2 of the full removal of the Goolwa Channel regulator at Clayton along with the completion of all planning activities for the full removal of the Currency Creek regulator.
• Developed the long-term carryover policy for unused private water allocations.
Targets 2012–13
• Manage infrastructure to deliver ecological benefits and achieve environmental water savings.
• Complete all elements of the Environmental Works and Measures Feasibility Program.
• Implement the 2012–13 River Murray Operating Plan.
• Complete the Chowilla Regulator Operational Plan.
• Coordinate delivery of environmental water from The Living Murray and Commonwealth Environmental Water Holder.
• Complete final remediation activities and return of bathymetry to as near as practicable at the Narrung and Clayton regulator sites.
Performance indicators
2012 13
Target
2011 12Estimated
Result2011 12
Target 2010 11
Actual
Condition Monitoring Program implemented The program ensures monitoring has been undertaken at all sites where the department has provided water for environmental purposes associated with The Living Murray program.
100% 100% 100% 100%
Water
200 2012–13 Agency Statements — Volume 4

Activity indicators
2012 13
Projection
2011 12Estimated
Result2011 12
Projection 2010 11
Actual
No. of priority sites watered During the drought a number of smaller sites were watered in 2010–11 and with the high flows a smaller number of larger sites have been watered.
2 5 5 19
No. of weekly flow reports provided The River Murray Weekly Flow Report was initiated during 2010–11 following major rainfall events in the basin. Previous to the high rainfall events, fortnightly River Murray flow advice was provided.
52 52 52 35
Water entitlement 1850 gigalitres is South Australia’s entitlement flow which is the actual amount the state receives.
1 850 GL 1 850 GL 1 850 GL 1 850 GL
No. of icon site communication and engagement plans implemented
2 2 2 2
No. of updates provided on water resource availability Monthly water resources updates provided as a guide to water availability along the River Murray.
12 12 12 12
Sub-program 2.2: Major Programs
Description/objective
To develop and deliver major infrastructure programs to achieve multiple environmental and production benefits, undertake investigations and business case preparations for future management of water resources and infrastructure including the Riverine Recovery project and South East Drainage and Wetland Management Program.
To undertake the role and associated functions of Hazard Leader, as defined under the State Emergency Management Plan, for flood and riverbank collapse. This includes support for the South Eastern Water Conservation and Drainage Board.
2012–13Budget
2011–12Estimated
Result2011–12 Budget
2010–11Actual
$000 $000 $000 $000
Expenses 28 230 24 835 19 568 16 893
Income 1 967 4 678 4 704 4 634
Net cost of sub-program 26 263 20 157 14 864 12 259
FTEs as at 30 June (No.) 66.2 58.5 46.1 41.0
Financial commentary
2012–13 Budget/2011–12 Estimated Result
The $6.1 million increase in net cost is primarily due to:
• a decrease in income for the Upper South East Levy program ($0.8 million)
• an increase in expenses due to delivery of the Riverine Recovery project ($5.8 million).
There is also a $1.8 million decrease in expenses and income due to the South East Flows project.
Water
2012012–13 Agency Statements — Volume 4

2011–12 Estimated Result/2011–12 Budget
The $5.3 million increase in expenses is primarily due to:
• an increase in expenses due to delivery of the Riverine Recovery project ($3.5 million)
• an increase in expenses for the operations and maintenance of the South East Drainage System ($1.2 million).
2011–12 Estimated Result/2010–11 Actual
The $7.9 million increase in expenses is primarily due to:
• an increase in expenses due to delivery of the Riverine Recovery project ($11.1 million)
• an increase in expenses for the operations and maintenance of the South East Drainage System ($4.6 million)
partially offset by
• a decrease in expenses due to the substantial National Water Initiative Reflows Agreement ($6.7 million).
Highlights 2011–12
• Established arrangements for the rehabilitation of the Glenelg and northern gates of the Patawalonga Lake system.
• Supported successful passage of the amendment of the Natural Resources Management Act 2004to address commercial forestry.
• Established an integrated operations and maintenance program for both the Upper South East and Lower South East drainage programs.
• Provided 25 gigalitres of water to the Coorong through the Upper South East and Reflows drainage and floodway network.
• Continued investigations and commenced community consultation to establish a floodway to transport drainage water from the Lower South East to the Coorong and enhance wetlands along the route.
• Completed the Lower Limestone Coast Water Allocation Plan policy issues discussion paper.
• Provided funds to the South Eastern Water Conservation and Drainage Board to purchase a long arm hydraulic excavator and a 33 tonne class hydraulic excavator and also to refurbish 20 bridges.
• Commenced delivery of environmental improvement and water savings measures under the Riverine Recovery project.
• Completed the River Murray Flood review.
• Coordinated the Flood Inquiries Taskforce and its assessment of the Queensland and Victorian commissions of inquiry into flooding.
• Completed state level risk assessments for riverbank collapse hazard and flood hazard.
• Completed site stability assessments for high risk riverbank collapse sites.
Targets 2012–13
• Refurbish the Glenelg gates on the Patawalonga Lake system.
• Prepare a business case for sediment management in Patawalonga Lake system.
• Support the introduction of the South East Drainage System Operation and Management Bill into parliament.
Water
202 2012–13 Agency Statements — Volume 4

• Maintain the Upper South East and Reflows drainage and floodway network and provide a base flow of 25 gigalitres to the Coorong.
• Continue delivery of the Riverine Recovery project.
• Complete all zone risk assessments for riverbank collapse and flood hazard.
• Review and update state level risk assessments for riverbank collapse and flood hazard.
Performance indicators
2012 13
Target
2011 12Estimated
Result2011 12
Target 2010 11
Actual
Provide Water to Coorong 25 GL 25 GL 25 GL 28.2 GL
Activity indicators
2012 13
Projection
2011 12Estimated
Result2011 12
Projection 2010 11
Actual
No. of zone catchment risk assessments 11 4 4 n.a.No. of managed sites for ecological benefit and/or water savings 2011–12 Estimated Result is lower than the projection due to high flows impeding construction activities. Investment in these sites commenced in 2011–12 with funding from the Commonwealth Government under the Riverine Recovery project.
36 26 31 —
No. of implemented long-term management plans for high risk sites of riverbank collapse
Following the return to normal to high flows and increased stability of the riverbank there has been a change in focus from mitigation to longer-term management of sites where high risk of collapse remains.
10 8 8 n.a.
No. of reports of riverbank collapse events to respond to
A hotline is operated to enable the general public to report possible riverbank collapse events or indicators of a possible event. With the return to normal to high river levels there has been an increase in the stability of the riverbank and hence the number of reports has declined.
10 20 20 110
No. of high flow/flood events to respond to 3 3 3 2
Water
2032012–13 Agency Statements — Volume 4

Program 3: Policy and Strategy
Description/objective
To provide coordinated policy direction for the planning and management of the state’s water resources to support communities, industry and ecosystems. This enables a healthy, functioning River Murray, as well as a consistent policy framework for the management of water resources.
To provide policy capacity in economics and urban water and contribute to the development of water reform activities.
Sub-programs
3.1 Murray-Darling Basin Policy and Planning
3.2 Water Policy
3.3 Urban Water
Program summary expenses and income
2012–13Budget
2011–12Estimated
Result2011–12 Budget
2010–11Actual
$000 $000 $000 $000
Expenses Employee benefit expenses ......................................... 5 314 6 458 5 230 6 960Supplies and services................................................... 4 339 10 708 13 144 3 345Depreciation and amortisation expenses...................... 191 213 303 192Grants and subsidies.................................................... 54 742 66 232 60 256 37 770Intra-government expenses.......................................... 1 545 23 359 23 359 18 489Other expenses ............................................................ 9 624 9 356 4 581 13 238
Total expenses 75 755 116 326 106 873 79 994
Income Commonwealth revenues............................................. 35 650 66 116 50 779 31 814Intra-government transfers ........................................... 1 190 2 694 2 694 511Other grants.................................................................. — 350 362 —Fees, fines and penalties.............................................. — — — 1Sales of goods and services......................................... 803 1 145 607 311Interest revenue............................................................ — — — 505Other income................................................................ — — 38 6
Total income 37 643 70 305 54 480 33 148
Net cost of providing services 38 112 46 021 52 393 46 846
FTEs as at 30 June (No.) 52.6 53.8 51.1 67.2
Water
204 2012–13 Agency Statements — Volume 4

Sub-program 3.1: Murray-Darling Basin Policy and Planning
Description/objective
To develop policy solutions, strategies and plans for the sustainable management of South Australian Murray-Darling Basin water resources.
2012–13Budget
2011–12Estimated
Result2011–12 Budget
2010–11Actual
$000 $000 $000 $000
Expenses 45 757 46 167 44 556 48 518
Income 690 812 265 159
Net cost of sub-program 45 067 45 355 44 291 48 359
FTEs as at 30 June (No.) 33.4 34.0 33.4 38.0
Financial commentary
2012–13 Budget/2011–12 Estimated Result
No major variations.
2011–12 Estimated Result/2011–12 Budget
The $1.6 million increase in expenses is primarily due to programs under the River Murray Improvement Program — this includes legal fees relating to challenging the Murray-Darling Basin Plan and payments to Goulburn Murray Water ($0.9 million).
2011–12 Estimated Result/2010–11 Actual
The $2.4 million decrease in expenses is primarily due to the purchase of water under The Living Murray program in 2010–11 ($2.6 million).
Highlights 2011–12
• Developed a comprehensive, strategic Government of South Australia response to the proposed basin plan.
• Represented South Australia’s interests in progressing negotiations to reform the Murray-Darling Basin Agreement.
• Developed an annual environmental watering plan for allocation of environmental water from the Commonwealth Environmental Water Holder and The Living Murray program for South Australian River Murray priority sites.
• Completed an annual environmental watering report for environmental watering in 2010–2011.
• Continued to implement strategies and actions to maintain a positive balance on the Murray-Darling Basin Authority Basin Salinity Management Strategy salinity register.
• Completed the review of the River Murray Act 2003 and developed a new implementation strategy.
• Developed a state policy for the implementation of unbundled water rights.
• Developed a long-term carryover policy for River Murray irrigation based on improvements to South Australia’s storage rights under the Murray-Darling Basin Agreement.
Water
2052012–13 Agency Statements — Volume 4

Targets 2012–13
• Represent South Australia’s interests in progressing negotiations to reform the Murray-Darling Basin Agreement and related instruments.
• Implement the requirements of the basin plan and progress any required negotiations.
• Complete the strategic environmental water management framework.
• Develop a long-term environmental watering plan for the River Murray.
• Develop the 2013–14 annual environmental watering priorities.
• Develop the River Murray Act 2003 implementation strategy.
Sub-program 3.2: Water Policy
Description/objective
To provide oversight of the implementation of Water for Good as well as state and national water reform, demand and supply planning, water pricing, water economics, water conservation measures, the Murray Futures program and stormwater policy.
To provide policy advice and development for, and on behalf of, the minister on the management of water resources across the state as well as the development, monitoring and review of legislation.
2012–13Budget
2011–12Estimated
Result2011–12 Budget
2010–11Actual
$000 $000 $000 $000
Expenses...................................................................... 2 521 23 891 16 797 17 616
Income.......................................................................... 16 930 33 088 18 348 22 554
Net cost of sub-program -14 409 -9 197 -1 551 -4 938
FTEs as at 30 June (No.) 16.9 16.4 15.4 24.8
Financial commentary
2012–13 Budget/2011–12 Estimated Result
The $5.2 million decrease in net cost is primarily due to:
• a decrease in the Murray Futures program expenses relating to
– adaptive management of the Coorong, Lower Lakes and Murray Mouth ($9.9 million)
– irrigation pipelines ($4.7 million)
• a decrease in salary related expenses resulting from targeted voluntary separation packages paid in 2011–12 ($0.5 million)
• a decrease in expenses due to the Port Pirie Stormwater project ($0.5 million)
• an increase in Murray Futures program income for the Riverine Recovery project ($1.6 million).
partially offset by
• a decrease in Murray Futures program income relating to
– adaptive management of the Coorong, Lower Lakes and Murray Mouth ($8.5 million)
– completion of the removal of the Goolwa Channel regulators ($3.5 million)
– completion of the removal of the Narrung Bund ($0.9 million).
Water
206 2012–13 Agency Statements — Volume 4

There is also a $4.8 million decrease in expenses and income due to the Water and Wastewater in Remote Communities project.
2011–12 Estimated Result/2011–12 Budget
The $7.6 million decrease in net cost is primarily due to:
• an increase in the Murray Futures program income relating to
– the Riverine Recovery project ($11.0 million)
– the removal of the Goolwa channel ($3.5 million)
partially offset by
• an increase in Murray Futures program expenses relating to
– irrigation pipelines ($4.7 million)
– adaptive management of the Coorong, Lower Lakes and Murray Mouth ($0.4 million)
• an increase in salary related expenses resulting from targeted voluntary separation packages paid in 2011–12 ($0.5 million)
• an increase in expenses due to the Port Pirie Stormwater project ($0.5 million).
2011–12 Estimated Result/2010–11 Actual
The $4.3 million decrease in net cost is primarily due to:
• an increase in the Murray Futures program income relating to
– the Riverine Recovery project ($6.0 million)
– the removal of the Goolwa Channel regulators ($4.2 million)
• an increase in income relating to Water and Wastewater in Remote Communities project ($4.8 million)
• a decrease in Murray Futures program expenses relating to adaptive management of the Coorong, Lower Lakes and Murray Mouth ($3.9 million).
partially offset by
• a decrease in Murray Futures program income relating to adaptive management of the Coorong, Lower Lakes and Murray Mouth ($4.2 million)
• an increase in expenses relating to the Water and Wastewater in Remote Communities project ($5.2 million)
• an increase in Murray Futures program expenses relating to irrigation pipelines ($4.6 million).
Highlights 2011–12
• Participated in the Council of Australian Governments’ review of the National Water Initiative and National Water Commission and progressed agreed water reform actions.
• Released the Northern and Yorke regional demand and supply statements. • Undertook a 12 month review of the Eyre Peninsula Demand and Supply Statement. • Supported the successful passage of the Water Industry Bill 2010 through parliament. • Commenced implementation of water conservation projects in Amata and Mimili remote
communities. • Developed a risk management framework for water planning and management. • Contributed to the review of the State Natural Resources Management Plan. • Produced the second Water for Good annual statement.
Water
2072012–13 Agency Statements — Volume 4

Targets 2012–13
• Develop a policy for the management of diverse water sources.
• Develop a mine dewatering policy.
• Develop a South Australian position paper for national water reform priorities.
• Complete demand and supply statements for the Alinytjara Wilurara and South Australian Arid Lands natural resources management regions.
• Undertake the 12 month review of the Eyre Peninsula and Northern and Yorke regional demand and supply statements.
• Undertake the third annual review of Water for Good.
Sub-program 3.3: Urban Water
Description/objective
To facilitate and oversee the implementation of key stormwater and urban water infrastructure projects in South Australia including stormwater harvest and reuse schemes, stormwater mapping and stormwater flood mitigation, including coordination with the Commonwealth and local government.
2012–13Budget
2011–12Estimated
Result2011–12 Budget
2010–11Actual
$000 $000 $000 $000
Expenses...................................................................... 27 477 46 268 45 520 13 860
Income.......................................................................... 20 023 36 405 35 867 10 435
Net cost of sub-program 7 454 9 863 9 653 3 425
FTEs as at 30 June (No.) 2.3 3.4 2.3 4.4
Financial commentary
2012–13 Budget/2011–12 Estimated Result
The $18.8 million decrease in expenses is primarily due to the delivery of the Stormwater Management program.
The $16.4 million decrease in income is primarily due to a decrease in revenue from the Commonwealth for the Stormwater Management program.
2011–12 Estimated Result/2011–12 Budget
No major variations.
2011–12 Estimated Result/2010–11 Actual
The $32.4 million increase in expenses is primarily due to delays in 2010–11 in commencing the Stormwater Management program.
The $26.0 million increase in income is primarily due to an increase in revenue from the Commonwealth for the Stormwater Management program.
Water
208 2012–13 Agency Statements — Volume 4

Highlights 2011–12
• Released an updated Stormwater Management Agreement for consultation.
• Commenced implementation of the Stormwater Strategy and development of a stormwater master plan.
• Oversaw the design and initial works for the eight stormwater harvesting and reuse projects across Adelaide.
• Released the Water Sensitive Urban Design Consultation Statement.
• Progressed work to improve the water efficiency of public and commercial buildings, linking with other sustainability initiatives as appropriate.
Targets 2012–13
• Finalise state and local government Stormwater Management Agreement.
• Oversee completion of eight stormwater harvesting and reuse schemes across Greater Adelaide.
• Initiate consultation and research for the blueprint for urban water.
• Introduce a state government policy for water sensitive urban design including targets and detailing how such approaches will be mandated and linked to the planning system.
Water
2092012–13 Agency Statements — Volume 4

Program 4: Science, Monitoring and Information
Description/objective
To provide scientific expertise and the application of knowledge for effective management of the state’s water resources.
To provide leadership in science with a primary focus on analysing water resource data, supporting sustainable economic development, undertaking scientific investigations to expand the government’s knowledge base, promoting collaborative research alliances, improving policy and providing input to strategies aimed at sustainable management and use of the state’s water resources.
Sub-programs
4.1 Water Science
4.2 Monitoring and Information
Program summary expenses and, income
2012–13Budget
2011–12Estimated
Result2011–12 Budget
2010–11Actual
$000 $000 $000 $000
Expenses Employee benefit expenses ......................................... 10 303 11 922 9 779 11 027Supplies and services................................................... 6 658 13 078 6 807 8 845Depreciation and amortisation expenses...................... 2 947 2 950 3 544 2 772Grants and subsidies.................................................... 5 365 5 525 5 341 5 306Intra-government expenses.......................................... 3 3 3 232Other expenses ............................................................ 155 153 151 70
Total expenses 25 431 33 631 25 625 28 252
Income Commonwealth revenues............................................. — 2 322 74 2 249Intra-government transfers ........................................... — 256 114 1 769Other grants.................................................................. — — 47 —Fees, fines and penalties.............................................. — — — 2Sales of goods and services......................................... 11 616 14 030 11 538 3 142Interest revenue............................................................ — — — 20Other income................................................................ — — 71 18
Total income 11 616 16 608 11 844 7 200
Net cost of providing services 13 815 17 023 13 781 21 052
FTEs as at 30 June (No.) 111.4 119.7 108.9 128.5
Water
210 2012–13 Agency Statements — Volume 4
Sub-program 4.1: Water Science
Description/objective
To provide expert science and knowledge for effective water resource management.
To provide leadership in science with a primary focus on analysing natural resource data and undertaking scientific investigations to expand the government’s knowledge base, promoting collaborative research alliances, improving policy and developing innovative management strategies.
2012–13Budget
2011–12Estimated
Result2011–12 Budget
2010–11Actual
$000 $000 $000 $000
Expenses 14 214 18 032 14 183 16 187
Income 3 189 5 450 3 218 2 814
Net cost of sub-program 11 025 12 582 10 965 13 373
FTEs as at 30 June (No.) 59.5 61.5 59.0 63.2
Financial commentary
2012–13 Budget/2011–12 Estimated Result
The $1.6 million decrease in net cost is primarily due to:
• a decrease in expenses due to the delivery of the Riverine Recovery project ($0.8 million)
• a decrease in expenses for projects funded by the National Water Commission ($0.4 million)
• a decrease in expenses as a result of the allocating water and maintaining springs in the Great Artesian Basin ($0.4 million)
• a decrease in expenses as a result of Murray-Darling Basin Authority funded projects ($0.4 million)
partially offset by
• a decrease in income for projects funded by the National Water Commission ($0.6 million)
• a decrease in income for the allocating water and maintaining springs in the Great Artesian Basin ($0.2 million).
There is also a $1.3 million decrease in expenses and income due to the New Town Water Supply Bores projects.
2011–12 Estimated Result/2011–12 Budget
The $1.6 million increase in net cost is primarily due to:
• an increase in expenses due to the delivery of the Riverine Recovery project ($0.8 million)
• an increase in expenses as a result of projects funded by the National Water Commission ($0.4 million)
• an increase in expenses as a result of the allocating water and maintaining springs in the Great Artesian Basin ($0.3 million)
• an increase in expenses as a result of Murray-Darling Basin Authority funded projects ($0.3 million)
Water
2112012–13 Agency Statements — Volume 4

partially offset by
• an increase in income as a result of additional projects funded by the National Water Commission ($0.5 million).
There is also a $1.3 million increase in expenses and income due to the New Town Water Supply Bores projects.
2011–12 Estimated Result/2010–11 Actual
The $0.8 million decrease in net cost is primarily due to:
• an increase in income as a result of cost recovery for water planning and management ($2.5 million)
partially offset by
• an increase in expenses due to delivery of Riverine Recovery project ($0.8 million)
• an increase in expenses due to delivery of the Groundwater program ($0.9 million).
Highlights 2011–12
• Contributed to the review of the environmental impact statement for the proposed Olympic Dam expansion and the subsequent renegotiation of the Roxby Downs Indenture Ratification Act 1982.
• Undertook a hydro-ecological analysis of the proposed Murray-Darling Basin Plan to inform the Government of South Australia response.
• Published impacts of climate change on water resources reports for the Northern and Yorke, Eyre Peninsula and Alinytjara Wilurara natural resources management regions, as well as a statewide first order assessment and prioritisation of water dependent ecosystems from a climate change impact perspective.
• Published phase 1 non-prescribed groundwater resources assessment reports for the Eyre Peninsula, Alinytjara Wilurara, Northern and Yorke, Kangaroo Island and South Australian Arid Lands natural resources management regions.
• Published 15 reports on the status of regional groundwater resources. • Provided technical input to community consultation for the water allocation plans for the Eastern
and Western Mount Lofty Ranges prescribed areas. • Completed town water supply drilling programs in conjunction with SA Water for two wells at
Kingston in the South East and one well at Naracoorte for SA Water. • Provided funding to the Goyder Institute to support government policy making with scientific
research. In 2011–12 this included the publication of an expert panel review of the Government of South Australia’s technical analysis of the proposed Murray-Darling Basin Plan, development of water sensitive urban design targets for consultation and progression of major projects related to climate change and finding new water for mining.
Targets 2012–13
• Undertake annual updates for published groundwater status reports. • Undertake water related assessments as part of informing the government approval process for the
proposed Olympic Dam expansion. • Undertake hydro-ecological related assessments to support the Government of South Australia in
the negotiation of the Murray-Darling Basin Plan. • Secure Commonwealth investment to have a bioregional assessment of the Arckaringa Basin
undertaken as part of the National Partnership Agreement for Coal Seam Gas and Large Coal Developments.
Water
212 2012–13 Agency Statements — Volume 4

• Complete impact of climate change on water resources assessment for the South Australian Arid Lands natural resources management region and commence an assessment for the Adelaide and Mount Lofty Ranges Natural Resources Management region.
• Commence more detailed investigations into groundwater resource availability in priority non-prescribed areas to support the expansion of the resources sector and local communities.
• Develop a program for implementation by the Goyder Institute for Water Research to support economic development and water for remote communities in South Australia, supporting the Finding Long-Term Outback Water Solutions Phase 2 project.
• Undertake analysis to support strategic placement of low flow releases for the Mount Lofty Ranges.
Sub-program 4.2: Monitoring and Information
Description/objective
The provision of leadership in the collection, storage and communication of water resource data and information, the management and maintenance of the state’s water resource monitoring assets and the management of the department’s information infrastructure and capability. A range of operational support services are also provided to support water resource development in the state.
2012–13Budget
2011–12Estimated
Result2011–12 Budget
2010–11Actual
$000 $000 $000 $000
Expenses...................................................................... 11 217 15 599 11 442 12 065
Income.......................................................................... 8 427 11 158 8 626 4 386
Net cost of sub-program 2 790 4 441 2 816 7 679
FTEs as at 30 June (No.) 51.9 58.2 49.9 65.3
Financial commentary
2012–13 Budget/2011–12 Estimated Result
The $1.7 million decrease in net cost is primarily due to:
• a decrease in expenses due to reduced expenditure on the Riverine Recovery project ($0.6 million)
• a decrease in expenses for the operations and maintenance of the South East Drainage System ($0.2 million)
• a decrease in salary related expenses resulting from targeted voluntary separation packages paid in 2011–12 ($0.6 million).
There is also a $2.5 million decrease in expenses and income due to:
• the completion of Bureau of Meteorology projects ($1.0 million)
• the Supervisory Control and Data Acquisition Implementation Systems project ($0.5 million)
• a reduction in fee for service for science based services due to market conditions ($1.0 million).
2011–12 Estimated Result/2011–12 Budget
The $1.6 million increase in net cost is primarily due to:
• an increase in expenses due to delivery of the Riverine Recovery project ($0.6 million)
Water
2132012–13 Agency Statements — Volume 4

• an increase in expenses for the operations and maintenance of the South East Drainage System ($0.2 million)
• an increase in salary related expenses resulting from targeted voluntary separation packages paid in 2011–12 ($0.6 million).
There is also a $2.1 million increase in expenses and income due to:
• the completion of Bureau of Meteorology projects ($1.0 million)
• the Supervisory Control and Data Acquisition Implementation Systems project ($0.5 million)
• The Great Artesian Basin Sustainability Initiative project ($0.6 million).
2011–12 Estimated Result/2010–11 Actual
The $3.2 million decrease in net cost is primarily due to:
• an increase in income as a result of cost recovery for water planning and management ($5.9 million)
partially offset by
• an increase in expenses due to delivery of the Groundwater Program ($1.3 million)
• an increase in expenses due to delivery of the Riverine Recovery project ($0.6 million)
• an increase in salary related expenses resulting from targeted voluntary separation packages paid in 2011–12 ($0.6 million)
• an increase in expenses for the operations and maintenance of the South East Drainage System ($0.2 million).
There is also a $0.5 million increase in expenses and income due to the Supervisory Control and Data Acquisition Implementation Systems project.
Highlights 2011–12
• Decommissioned 11 uncontrolled flowing wells, including the iconic Big Blyth, and drilled three replacement wells as part of the Great Artesian Basin Sustainability Initiative Phase 3 program.
• Continued to monitor South Australia’s water resources for water level and salinity in the state’s 146 groundwater monitoring networks (5421 monitoring wells) with flow, water quality and metrological monitoring of data at 220 surface water monitoring stations being collected to assist water resource management and policy setting.
• Commissioned a new suite of hot water geophysical logging tools to enable deep geophysical logging in the Great Artesian Basin.
• Undertook comprehensive asset monitoring, maintenance and improvement.
• Installed 10 new groundwater monitoring stations across the region to improve water resource management data capture in conjunction with the Adelaide and Mount Lofty Ranges Natural Resources Management Board.
• Installed three new water distribution process control systems in the Anangu Pitjantjatjara Yankunytjatjara Lands at Amata, Mimili and Pipalyatjara Kalka, and a further system at Nepabunna, in conjunction with SA Water.
• Expanded the access to the state’s water information and data on WaterConnect to include:
– water quality (EPA Aquatic Ecosystem Condition) information
– River Murray inundation mapping (90 000ML/d and 60 000ML/d flows)
Water
214 2012–13 Agency Statements — Volume 4

– River Murray infrastructure data
– levee profile mapping
– additional groundwater status reports.
Targets 2012–13
• Complete the installation of water distribution process control systems in the Alinytjara Wilurara Natural Resources Management region.
• Install two new monitoring wells and rehabilitate an additional six wells in the Bramfield Basin to monitor water security issues for Elliston town water supply.
• Commence the replacement of a number of existing monitoring wells in the south east of the state.
• Deliver and commission a new geophysical logging management system to streamline data collection during the logging process.
• Monitor the state’s water resources to ensure water security.
• Continue to work through the programmed well rehabilitation works in the Great Artesian Basin Sustainability Initiative Phase 3 program to ensure that resource wastage is prevented and the benefits of joint state and the Commonwealth Government investment are realised.
• Deploy new water data delivery functionality to provide access to groundwater well information.
• Expand WaterConnect coverage of water data and information from other custodians to provide a single access point for water data in the state.
Activity indicators
2012 13
Projection
2011 12Estimated
Result2011 12
Projection 2010 11
Actual
No. of water resource monitoring stations currently being monitored by the department in South Australia at least annually for water level and/or salinity and/or meteorology:
• groundwater 5 241 5 241 5 241 4 075• surface water 220 220 220 175No. of visits to the WaterConnect website The higher number of visits to WaterConnect in 2010–11 was due to the launch of the new website. It is a normal event for a spike in interest at the time of launch of a new site
19 500 18 720 18 720 31 243
Water
2152012–13 Agency Statements — Volume 4

Department for WaterStatement of comprehensive income___________________________________________________________________________________________________________________________________________________________________________________________________________
2012–13Budget
$000
2011–12Estimated
Result
$000
2011–12Budget
$000
2010–11Actual
$000ExpensesEmployee benefit expenses Salaries, wages, annual and sick leave ............................ 25 833 26 577 24 184 29 248 Long service leave ............................................................ 1 098 1 169 1 090 998 Payroll tax ......................................................................... 1 288 1 389 1 214 1 647 Superannuation ................................................................ 2 672 2 741 2 534 3 091 Other ................................................................................. 66 3 168 63 76Supplies and services General supplies and services .......................................... 34 137 56 706 54 298 38 144 Consultancy expenses ...................................................... 103 679 100 738Depreciation and amortisation expenses .............................. 6 151 6 127 6 844 6 715Grants and subsidies ............................................................ 60 562 73 229 66 272 44 558Intra-government transfers ................................................... 6 169 28 949 23 367 18 780Other expenses .................................................................... 10 035 9 747 4 949 22 111
Total expenses 148 114 210 481 184 915 166 106
IncomeTaxation ................................................................................ — 789 740 734Commonwealth revenues ..................................................... 37 577 78 297 52 203 38 429Intra-government transfers ................................................... 1 190 4 777 2 808 10 153Other grants .......................................................................... — 450 6 941 537Fees, fines and penalties ...................................................... 1 367 1 209 1 797 1 144Sales of goods and services ................................................. 30 971 25 382 28 729 4 816Interest revenues .................................................................. — — 25 542Net gain or loss from disposal of assets ............................... — — — -157Other income ........................................................................ 1 000 1 000 1 751 75
Total income 72 105 111 904 94 994 56 273
Net cost of providing services 76 009 98 577 89 921 109 833
Income from/expenses to state governmentIncome Appropriation .................................................................... 76 009 83 425 79 488 97 744 Other income .................................................................... — 4 980 — 5 372
Net income from/expenses to state government 76 009 88 405 79 488 103 116
Total comprehensive result — -10 172 -10 433 -6 717
Water
216 2012–13 Agency Statements — Volume 4

Department for WaterStatement of financial position___________________________________________________________________________________________________________________________________________________________________________________________________________
2012–13Budget
$000
2011–12Estimated
Result
$000
2011–12Budget
$000
2010–11Actual
$000AssetsCurrent assetsCash and cash equivalents ................................................... 6 190 14 057 2 915 27 341Receivables .......................................................................... 14 941 14 832 17 046 11 532Inventories ............................................................................ — — 132 — Other current assets ............................................................. — — — 105
Total current assets 21 131 28 889 20 093 38 978
Non current assetsLand and improvements ....................................................... 3 400 3 418 3 617 3 436Plant and equipment ............................................................. 109 835 86 996 86 756 83 912Intangible assets ................................................................... 5 528 8 682 8 640 12 295
Total non-current assets 118 763 99 096 99 013 99 643
Total assets 139 894 127 985 119 106 138 621
LiabilitiesCurrent liabilitiesPayables ............................................................................... 12 616 12 651 19 316 12 718Employee benefits Salaries and wages .......................................................... 54 27 503 — Annual leave ..................................................................... 2 060 2 047 2 220 2 100 Long service leave ............................................................ 520 544 554 568Short-term provisions ............................................................ 123 118 156 113
Total current liabilities 15 373 15 387 22 749 15 499
Non current liabilitiesLong-term employee benefits Long service leave ............................................................ 7 131 6 949 8 603 7 322Long-term provisions ............................................................ 424 402 514 381
Total non-current liabilities 7 555 7 351 9 117 7 703
Total liabilities 22 928 22 738 31 866 23 202
Net assets 116 966 105 247 87 240 115 419
EquityContributed capital ................................................................ 22 612 10 893 10 893 10 893Retained earnings ................................................................. 44 261 44 261 26 151 54 433Asset revaluation reserve ..................................................... 50 093 50 093 50 196 50 093
Total equity 116 966 105 247 87 240 115 419
Balances as at 30 June end of period.
Water
2172012–13 Agency Statements — Volume 4

Department for WaterStatement of cash flows___________________________________________________________________________________________________________________________________________________________________________________________________________
2012–13Budget
$000
2011–12Estimated
Result
$000
2011–12Budget
$000
2010–11Actual
$000
Operating activitiesCash outflowsEmployee benefit payments ................................................. 30 760 35 393 28 724 36 298Payments for supplies and services ..................................... 34 275 57 420 54 433 47 508Grants and subsidies ............................................................ 60 562 73 229 66 272 51 354Intra-government transfers ................................................... 6 169 28 949 23 367 17 815Other payments .................................................................... 10 007 9 722 4 924 13 465
Cash used in operations 141 773 204 713 177 720 166 440
Cash inflowsTaxation ................................................................................ — 789 740 793Intra-government transfers ................................................... 1 190 4 777 2 808 11 988Commonwealth receipts ....................................................... 37 577 78 297 52 203 43 451Other grants .......................................................................... — 450 6 941 306Fees, fines and penalties ...................................................... 1 367 1 209 1 797 1 356Sales of goods and services ................................................. 31 126 22 432 18 729 3 826Interest received ................................................................... — — 25 569GST received ........................................................................ — — — 6 069Other receipts ....................................................................... 736 650 1 401 83
Cash generated from operations 71 996 108 604 84 644 68 441
State governmentAppropriation ........................................................................ 76 009 83 425 79 488 97 744Other receipts ....................................................................... — 4 980 — 5 372
Net cash provided by state government 76 009 88 405 79 488 103 116
Net cash provided by (+)/used in (-) operating activities 6 232 -7 704 -13 588 5 117
Investing activitiesCash outflowsPurchase of property, plant and equipment .......................... 25 818 5 580 5 992 5 723Purchase of intangibles ........................................................ — — — 723
Cash used in investing activities 25 818 5 580 5 992 6 446
Net cash provided by (+)/used in (-) investing activities -25 818 -5 580 -5 992 -6 446
Financing activitiesCash inflowsCapital contributions from state government ........................ 11 719 — — — Proceeds from restructuring activities ................................... — — — -229
Cash generated from financing activities 11 719 — — -229
Net cash provided by (+)/used in (-) financing activities 11 719 — — -229
Net increase (+)/decrease (-) in cash equivalents -7 867 -13 284 -19 580 -1 558
Cash and cash equivalents at the start of the period 14 057 27 341 22 495 28 899
Cash and cash equivalents at the end of the period 6 190 14 057 2 915 27 341
Water
218 2012–13 Agency Statements — Volume 4

Administered items for the Department for WaterStatement of comprehensive income___________________________________________________________________________________________________________________________________________________________________________________________________________
2012–13Budget
$000
2011–12Estimated
Result
$000
2011–12Budget
$000
2010–11Actual
$000ExpensesEmployee benefit expenses Other ................................................................................. 17 17 17 54Supplies and services General supplies and services .......................................... 1 632 3 843 1 593 1 759 Consultancy expenses ...................................................... — — — 21Depreciation and amortisation expenses .............................. 1 423 1 360 1 360 3 613Grants and subsidies ............................................................ 4 888 4 775 4 775 6 346Intra-government transfers ................................................... 12 189 11 835 11 194 12 042Other expenses .................................................................... 271 269 269 331
Total expenses 20 420 22 099 19 208 24 166
IncomeTaxation ................................................................................ 10 068 9 766 9 125 8 038Commonwealth revenues ..................................................... — — — 1 931Intra-government transfers ................................................... 2 121 5 369 2 069 2 018Fees, fines and penalties ...................................................... — — — 878Sales of goods and services ................................................. — — — 154Other income ........................................................................ 250 250 250 —
Total income 12 439 15 385 11 444 13 019
Income from/expenses to state governmentIncome Appropriation .................................................................... 7 009 6 844 6 844 7 569
Net income from/expenses to state government 7 009 6 844 6 844 7 569
Net result -972 130 -920 -3 578
Other comprehensive incomeChanges in property, plant and equipment assetrevaluation surplus ................................................................ — — — -7 946
Total comprehensive result -972 130 -920 -11 524
Water
2192012–13 Agency Statements — Volume 4

Administered items for the Department for WaterStatement of financial position___________________________________________________________________________________________________________________________________________________________________________________________________________
2012–13Budget
$000
2011–12Estimated
Result
$000
2011–12Budget
$000
2010–11Actual
$000AssetsCurrent assetsCash and cash equivalents ................................................... 5 243 5 287 6 127 5 287Receivables .......................................................................... 5 174 5 130 8 008 5 130Inventories ............................................................................ 36 36 43 36
Total current assets 10 453 10 453 14 178 10 453
Non current assetsInterests in joint ventures ...................................................... 710 113 710 113 718 059 710 113Land and improvements ....................................................... 129 129 129 129Plant and equipment ............................................................. 54 465 55 437 56 670 55 307
Total non-current assets 764 707 765 679 774 858 765 549
Total assets 775 160 776 132 789 036 776 002
LiabilitiesCurrent liabilitiesPayables ............................................................................... 4 417 4 417 4 755 4 417Employee benefits Salaries and wages .......................................................... — — 18 — Annual leave ..................................................................... 72 72 70 72 Long service leave ............................................................ 21 21 20 21 Other ................................................................................. 14 14 15 14
Total current liabilities 4 524 4 524 4 878 4 524
Non current liabilitiesLong-term employee benefits Long service leave ............................................................ — — 16 —
Total non-current liabilities — — 16 —
Total liabilities 4 524 4 524 4 894 4 524
Net assets 770 636 771 608 784 142 771 478
EquityRetained earnings ................................................................. 499 117 500 089 504 640 499 959Asset revaluation reserve ..................................................... 271 519 271 519 279 502 271 519
Total equity 770 636 771 608 784 142 771 478
Balances as at 30 June end of period.
Water
220 2012–13 Agency Statements — Volume 4

Administered items for the Department for WaterStatement of cash flows___________________________________________________________________________________________________________________________________________________________________________________________________________
2012–13Budget
$000
2011–12Estimated
Result
$000
2011–12Budget
$000
2010–11Actual
$000
Operating activitiesCash outflowsEmployee benefit payments ................................................. 17 17 17 18Payments for supplies and services ..................................... 1 632 3 843 1 593 1 773Grants and subsidies ............................................................ 4 888 4 775 4 775 6 346GST paid ............................................................................... — — — 424Intra-government transfers ................................................... 12 189 11 835 11 194 12 098Other payments .................................................................... 271 269 269 272
Cash used in operations 18 997 20 739 17 848 20 931
Cash inflowsTaxation ................................................................................ 9 997 9 733 9 054 8 847Intra-government transfers ................................................... 2 121 5 369 2 069 2 018Commonwealth receipts ....................................................... — — — 1 931Fees, fines and penalties ...................................................... 27 33 27 308Sales of goods and services ................................................. — — — 269GST received ........................................................................ — — — 381Other receipts ....................................................................... 250 250 250 —
Cash generated from operations 12 395 15 385 11 400 13 754
State governmentAppropriation ........................................................................ 7 009 6 844 6 844 7 569
Net cash provided by state government 7 009 6 844 6 844 7 569
Net cash provided by (+)/used in (-) operating activities 407 1 490 396 392
Investing activitiesCash outflowsPurchase of property, plant and equipment .......................... 451 1 490 440 435
Cash used in investing activities 451 1 490 440 435
Net cash provided by (+)/used in (-) investing activities -451 -1 490 -440 -435
Financing activitiesCash inflowsProceeds from restructuring activities ................................... — — — -11 290
Cash generated from financing activities — — — -11 290
Net cash provided by (+)/used in (-) financing activities — — — -11 290
Net increase (+)/decrease (-) in cash equivalents -44 — -44 -11 333
Cash and cash equivalents at the start of the period 5 287 5 287 6 171 16 620
Cash and cash equivalents at the end of the period 5 243 5 287 6 127 5 287
Water
2212012–13 Agency Statements — Volume 4

Summary of major variations
The following commentary relates to variations between the 2012–13 Budget and the 2011–12 Estimated Result.
The administered items include the income, expenses, assets, liabilities and cash flows pertaining to the South Eastern Water Conservation and Drainage Board. This differs from the Department for Water general purpose financial reports, which do not recognise this reporting entity as administered.
Statement of comprehensive income controlled
Expenses
The $62.4 million decrease in expenses is primarily due to a reduction in:
• payments related to the Stormwater Management program ($18.2 million)
• Murray Futures program expenses following the substantial completion of projects relating to
– adaptive management of the Coorong, Lower Lakes and Murray Mouth ($9.9 million)
– irrigation pipelines ($4.7 million)
– removal of the Goolwa Channel regulators ($3.8 million)
– removal of the Narrung Bund ($1.0 million)
• payments for the Water and Wastewater in Remote Communities project ($4.8 million)
• payments for Murray-Darling Basin Authority funded environmental water management projects ($3.5 million)
• payments for the Murray-Darling Basin Authority contribution to removal of the Goolwa Channel regulators ($1.9 million)
• salary related expenses resulting from targeted voluntary separation packages paid in 2011–12 ($3.1 million)
• payments related to revised estimates for the Save the River Murray Fund ($1.7 million)
• payments related to the South East Flows project ($1.8 million)
• payments related to the Common Registry System project ($1.3 million)
• payments related to the New Town Water Supply Bores projects ($1.3 million)
• payments related to the completion of Bureau of Meteorology projects ($1.0 million)
• Commonwealth funding due to the completion of the National Water Initiative agreements for
– Mount Lofty Ranges Prescription ($0.6 million)
– Reflows ($0.6 million)
partially offset by
• an increase in expenses for the Murray Futures Riverine Recovery project ($4.4 million).
Water
222 2012–13 Agency Statements — Volume 4

Income
The $39.8 million decrease in income is primarily due to a reduction in:
• Commonwealth funding for the Stormwater Management program ($16.0 million)
• Commonwealth funding due to the substantial completion of Murray Futures program projects relating to
– adaptive management of the Coorong, Lower Lakes and Murray Mouth ($8.5 million)
– removal of the Goolwa Channel regulators ($3.5 million)
– removal of the Narrung Bund ($0.9 million)
• Commonwealth funding for the Water and Wastewater in Remote Communities project ($4.8 million)
• funding from the Murray-Darling Basin Authority for environmental water management projects ($2.8 million)
• funding from the Murray-Darling Basin Authority for removal of the Goolwa Channel regulators ($1.9 million)
• Commonwealth funding due to the completion of the National Water Initiative agreements for
– Mount Lofty Ranges Prescription ($1.0 million)
– Reflows ($0.6 million)
• income for the South East Flows ($1.8 million)
• Commonwealth funding for the Common Registry System project ($1.3 million)
• income for the New Town Water Supply Bores projects ($1.3 million)
• income due to completion of Bureau of Meteorology projects ($1.0 million)
• income due to completion of the Upper South East levy program ($0.8 million)
partially offset by
• an increase in income for
– cost recovery for water planning and management ($7.9 million)
– the Murray Futures Riverine Recovery project ($1.6 million).
Statement of financial position controlled
The $11.9 million increase in net assets is primarily due to investing activities related to:
• the Murray Futures Riverine Recovery project ($17.0 million)
• the Patawalonga Lake system ($3.3 million)
partially offset by
• a reduction in cash related to delayed payments primarily related to the Riverine Recovery project ($7.0 million).
Statement of cash flows controlled
The movements in cash outflows and inflows are generally consistent with the changes discussed above under the statement of comprehensive income and the statement of financial position.
Water
2232012–13 Agency Statements — Volume 4
Statement of comprehensive income administered items
Expenses
The $1.7 million decrease in expenses is primarily due to additional maintenance expenditure by the South Eastern Water Conservation and Drainage Board in 2011–12.
Income
The $2.9 million decrease in income is primarily due to additional grants for maintenance and investing expenditure received by the South Eastern Water Conservation and Drainage Board in 2011–12.
Statement of financial position administered items
The $1.0 million decrease in net assets is primarily due to:
• depreciation expense ($1.4 million)
partially offset by
• plant and equipment acquisitions for the South Eastern Water Conservation and Drainage Board ($0.4 million).
Statement of cash flows administered items
The movements in cash outflows and inflows are generally consistent with the changes discussed above under the statement of comprehensive income and the statement of financial position.
Additional information for administered items
Additional information on administered items is included in the following table.
Water
224 2012–13 Agency Statements — Volume 4

Additional information for administered items for the Department for Water Statement of cash flows
2012–13Budget
2011–12Estimated
Result2011–12 Budget
2010–11Actual
$000 $000 $000 $000
Operating activities
Cash outflows
Employee benefit payments South Eastern Water Conservation and Drainage Board................................................................. 17 17 17 18
Payments for supplies and services South Eastern Water Conservation and Drainage Board................................................................. 1 632 3 843 1 593 1 767NRM Levy ......................................................................... — — — 6
Grants and subsidies Qualco Sunlands............................................................... 250 250 250 —Stormwater Management Authority Grant......................... 4 638 4 525 4 525 6 346
GST paid Net GST paid .................................................................... — — — 424
Intra-government transfers NRM Levy ......................................................................... 10 068 9 766 9 125 10 080South Eastern Water Conservation and Drainage Board................................................................. 2 121 2 069 2 069 2 018
Other payments Qualco Sunlands — payments to Consolidated Account ....................................................... 250 250 250 250South Eastern Water Conservation and Drainage Board................................................................. 21 19 19 22
Cash used in operations 18 997 20 739 17 848 20 931
Cash inflows
Taxation NRM Levy ......................................................................... 9 997 9 733 9 054 8 847
Intra-government transfers South Eastern Water Conservation and Drainage Board................................................................. 2 121 5 369 2 069 2 018
Commonwealth receipts Stormwater Management Authority Grant......................... — — — 1 931
Fees, fines and penalties NRM Levy ......................................................................... 27 33 27 306South Eastern Water Conservation and DrainageBoard.................................................................. — — — 2
Sales of goods and services South Eastern Water Conservation and Drainage Board................................................................. — — — 269
GST received.......................................................................... — — — 381Other receipts ......................................................................... 250 250 250 —
Cash generated from operations 12 395 15 385 11 400 13 754
Water
2252012–13 Agency Statements — Volume 4

2012–13Budget
2011–12Estimated
Result2011–12 Budget
2010–11Actual
$000 $000 $000 $000
State government
Appropriation NRM Levy ......................................................................... — — — 886Qualco Sunlands............................................................... 250 250 250 250Stormwater Management Authority Grant......................... 4 638 4 525 4 525 4 415South Eastern Water Conservation and Drainage Board................................................................. 2 121 2 069 2 069 2 018
Net cash provided by state government 7 009 6 844 6 844 7 569
Net cash provided by (+)/used in (-) operating activities 407 1 490 396 392
Investing activities
Cash outflows
Purchase of property, plant and equipment South Eastern Water Conservation and Drainage Board................................................................. 451 1 490 440 435
Cash used in investing activities 451 1 490 440 435
Net cash provided by (+)/used in (-) investing activities -451 -1 490 -440 -435
Financing activities
Cash inflows
Proceeds from restructuring activities South Eastern Water Conservation and Drainage Board................................................................. — — — -11 290
Cash generated from financing activities — — — -11 290
Net cash provided by (+)/used in (-) financing activities — — — -11 290
Net increase (+)/decrease (-) in cash equivalents -44 — -44 -11 333
Cash and cash equivalents at the start of the financial year (as at 1 July) 5 287 5 287 6 171 16 620
Cash and cash equivalents at the end of the financial year (as at 30 June) 5 243 5 287 6 127 5 287
Water
226 2012–13 Agency Statements — Volume 4

Agency: Zero Waste SA
Minister for Sustainability, Environment and Conservation
2272012–13 Agency Statements — Volume 4

Zero Waste
228 2012–13 Agency Statements — Volume 4

Contents
Zero Waste
2292012–13 Agency Statements — Volume 4

Objective
To eliminate waste or its consignment to landfill and advance the development of resource recovery and recycling based on an integrated strategy for the state.
Ministerial responsibilities
Minister Programs Sub-programs
The Hon. P Caica
Statutes
The Department of the Premier and Cabinet maintains a list of statutes applicable to ministers.
Workforce summary
FTEs as at 30 June
Agency 2012–13
Budget(a)
2011–12Estimated
Result(a)2010–11Actual(b)
22.0
Total 22.0 22.0 23.1
Program net cost of services summary
Net cost of services
2012–13Budget
2011–12Estimated
Result2011–12 Budget
2010–11Actual
Program $000
-9 738
Total -9 738 -9 102 -7 379 -4 867
Zero Waste
230 2012–13 Agency Statements — Volume 4

Investing expenditure summary
2012–13Budget
2011–12Estimated
Result2011–12 Budget
2010–11Actual
Investments $000 $000 $000 $000
Existing projects
—Total existing projects — — — 313
Total investing expenditure — — — 313
Zero Waste
2312012–13 Agency Statements — Volume 4

Program 1: Waste Reduction and Resource Recovery
Description/objective
To eliminate waste or its consignment to landfill and advance the development of resource recovery and recycling based on an integrated strategy for the state.
Program summary expenses, income and FTEs
2012–13Budget
2011–12Estimated
Result2011–12 Budget
2010–11Actual
$000 $000 $000 $000
Expenses 2 3242 784
—3 327
712
Total expenses 8 454 8 500 8 423 9 155
Income 16 992
—1 200
Total income 18 192 17 602 15 802 14 022
Net cost of providing services -9 738 -9 102 -7 379 -4 867
FTEs as at 30 June (No.) 22.0
Financial commentary
2012–13 Budget/2011–12 Estimated Result
Refer to summary of major variations.
2011–12 Estimated Result/2011–12 Budget
No major variations.
2011–12 Estimated Result/2010–11 Actual
No major variations.
Highlights 2011–12
• South Australia’s Waste Strategy 2011–15 was endorsed by Cabinet in December 2011.
• Provided infrastructure grant funding of $1.5 million to 13 regional councils and one not-for-profit organisation, to enhance recycling and resource recovery of materials in country South Australia.
• Provided infrastructure grant funding of $1.7 million to five businesses and one waste management authority in Adelaide, to increase recycling and resource recovery of materials and reduce the amount of waste sent to landfill.
Zero Waste
232 2012–13 Agency Statements — Volume 4

• Provided financial incentives of $638 000 to two metropolitan and two non-metropolitan councils to implement household food waste recycling as part of council kerbside green organics collection services.
• Undertook household hazardous waste and farm chemicals collection services to five metropolitan and 13 non-metropolitan council areas in South Australia.
• Provided assistance to 26 companies operating across 81 sites throughout metropolitan Adelaide and regional South Australia to implement resource efficiency initiatives focussing on reducing the amount of waste to landfill by minimising resource use, including energy and water.
• Completed the review of the solid waste levy.
Targets 2012–13
• Continue to provide financial support to metropolitan and non-metropolitan councils for the implementation of household food waste recycling as part of council kerbside green organics collection services.
• Review regional waste management plans across South Australia.
• Continue to provide financial support to the metropolitan recycling and reuse infrastructure investment program, to increase the recovery of waste materials and reduce waste sent to landfill.
• Develop a contaminated soil strategy by March 2013 that will encourage the onsite and offsite treatment of contaminated soils for reuse consistent with Environment Protection Authority requirements and reduce the amount of waste sent to landfill.
• Continue with the household hazardous waste and farm chemicals collection services across council areas in South Australia.
• Develop a revised waste to energy policy by March 2013 that will provide a better understanding of the opportunities and priority areas associated with recovering energy from waste.
Performance indicators
2012 13
Target
2011 12Estimated
Result2011 12
Target 2010 11
Actual
The 2012–13 Target reflects the anticipated reduction of waste to landfill compared to the previous year’s reduced number of tonnes to landfill. The increase in tonnes reduction from the 2011–12 Target to the 2011–12 Estimated Result reflects a slowing economy resulting in less waste generated by businesses and the community and concurrently a higher rate of recycling of waste materials, as further waste materials are prohibited from being disposed to landfill as a result of the Environment Protection (Waste to Resources) Policy 2010. Note that tonnes shown excludes disposal of contaminated soil to landfill which is reported separately in the agency annual report.
Zero Waste
2332012–13 Agency Statements — Volume 4

Zero Waste SAStatement of comprehensive income___________________________________________________________________________________________________________________________________________________________________________________________________________
2012–13Budget
$000
2011–12Estimated
Result
$000
2011–12Budget
$000
2010–11Actual
$000ExpensesEmployee benefit expenses Salaries, wages, annual and sick leave ............................ 1 953 1 910 1 909 1 850 Long service leave ............................................................ 47 45 45 106 Payroll tax ......................................................................... 105 103 103 113 Superannuation ................................................................ 203 199 199 218 Other ................................................................................. 16 15 15 100Supplies and services General supplies and services .......................................... 2 656 2 605 2 588 3 110 Consultancy expenses ...................................................... 128 126 126 56Depreciation and amortisation expenses .............................. — — — 48Grants and subsidies ............................................................ 3 327 3 448 3 426 3 491Intra-government transfers ................................................... 7 37 — 50Other expenses .................................................................... 12 12 12 13
Total expenses 8 454 8 500 8 423 9 155
IncomeIntra-government transfers ................................................... 16 992 16 225 15 087 12 646Other grants .......................................................................... — 177 160 407Interest revenues .................................................................. 1 200 1 200 555 969
Total income 18 192 17 602 15 802 14 022
Net cost of providing services -9 738 -9 102 -7 379 -4 867
Total comprehensive result 9 738 9 102 7 379 4 867
Zero Waste
234 2012–13 Agency Statements — Volume 4

Zero Waste SAStatement of financial position___________________________________________________________________________________________________________________________________________________________________________________________________________
2012–13Budget
$000
2011–12Estimated
Result
$000
2011–12Budget
$000
2010–11Actual
$000AssetsCurrent assetsCash and cash equivalents ................................................... 42 377 32 627 28 913 23 513Receivables .......................................................................... 114 114 64 114Other current assets ............................................................. 9 9 — 9
Total current assets 42 500 32 750 28 977 23 636
Non current assetsPlant and equipment ............................................................. 523 523 288 523
Total non-current assets 523 523 288 523
Total assets 43 023 33 273 29 265 24 159
LiabilitiesCurrent liabilitiesPayables ............................................................................... 1 827 1 814 1 587 1 801Employee benefits Salaries and wages .......................................................... — — 15 — Annual leave ..................................................................... 225 225 118 225 Long service leave ............................................................ 27 28 76 29Short-term provisions ............................................................ 1 1 — 1Other current liabilities .......................................................... 26 26 8 26
Total current liabilities 2 106 2 094 1 804 2 082
Non current liabilitiesLong-term employee benefits Long service leave ............................................................ 677 677 547 677
Total non-current liabilities 677 677 547 677
Total liabilities 2 783 2 771 2 351 2 759
Net assets 40 240 30 502 26 914 21 400
EquityRetained earnings ................................................................. 40 240 30 502 26 914 21 400
Total equity 40 240 30 502 26 914 21 400
Balances as at 30 June end of period.
Zero Waste
2352012–13 Agency Statements — Volume 4

Zero Waste SAStatement of cash flows___________________________________________________________________________________________________________________________________________________________________________________________________________
2012–13Budget
$000
2011–12Estimated
Result
$000
2011–12Budget
$000
2010–11Actual
$000
Operating activitiesCash outflowsEmployee benefit payments ................................................. 2 325 2 273 2 259 2 240Payments for supplies and services ..................................... 2 771 2 718 2 714 2 965Grants and subsidies ............................................................ 3 327 3 448 3 426 3 491Intra-government transfers ................................................... 7 37 — 50Other payments .................................................................... 12 12 12 15
Cash used in operations 8 442 8 488 8 411 8 761
Cash inflowsIntra-government transfers ................................................... 16 992 16 225 15 087 12 646Other grants .......................................................................... — 177 160 382Interest received ................................................................... 1 200 1 200 555 944
Cash generated from operations 18 192 17 602 15 802 13 972
Net cash provided by (+)/used in (-) operating activities 9 750 9 114 7 391 5 211
Investing activitiesCash outflowsPurchase of property, plant and equipment .......................... — — — 313
Cash used in investing activities — — — 313
Net cash provided by (+)/used in (-) investing activities — — — -313
Net increase (+)/decrease (-) in cash equivalents 9 750 9 114 7 391 4 898
Cash and cash equivalents at the start of the period 32 627 23 513 21 522 18 615
Cash and cash equivalents at the end of the period 42 377 32 627 28 913 23 513
Zero Waste
236 2012–13 Agency Statements — Volume 4

Summary of major variations
The following commentary relates to variations between the 2012–13 Budget and the 2011–12 Estimated Result.
Statement of comprehensive income controlled
Expenses
No major variations.
Income
The $0.6 million increase in income is primarily due to:
• an increase in revenue from intra-government transfers from the Environment Protection Authority for solid waste levy receipts ($0.8 million)
partially offset by
• a decrease in revenue from other grants for the Recycling at Work grant program ($0.2 million).
Statement of financial position controlled
The $9.7 million increase in total net assets is primarily due to the increase in deposits of cash and cash equivalents in the Waste to Resources Fund.
Statement of cash flows controlled
The movements in cash outflows and inflows are generally consistent with the changes discussed above under the statement of comprehensive income and the statement of financial position.
Zero Waste
2372012–13 Agency Statements — Volume 4

Zero Waste
238 2012–13 Agency Statements — Volume 4

Accounting standards
The financial statements included in the 2012–13 Agency Statements are special purpose financial statements.
Estimates in these financial statements have been prepared on a basis consistent with:
Australian Accounting Standards, except where these notes indicate otherwise
accounting policies expected to be used in preparing historically orientated general purpose financial statements for that year, and the same accounting policies have been used for the subsequent forecast years (forward estimates).
Reporting entities
The financial statements include all estimated assets, liabilities, incomes and expenses of individual agencies.
Consistent with Australian Accounting Standards, estimated transactions and balances that are controlled are budgeted for, and reported on, separately to estimated transactions and balances which are administered but not controlled by the agency.
Activities that are ‘controlled’ are those where the agency delivers services and governs the financial and operating policies so as to obtain benefits from these activities and assets in the pursuit of its objectives.
Generally, activities that are ‘administered’ on behalf of the government exist where an agency has no discretion to alter the resources provided or determine how they are spent.
Basis of accounting and measurement
The estimated financial statements include a statement of comprehensive income, statement of financial position and a statement of cash flows.
The format of these estimated financial statements is consistent with the model financial statements (prepared by the Department of Treasury and Finance for statutory reporting requirements) and is consistent with the requirements of AASB 101 Presentation of Financial Statements and AASB 107 Statement of Cash Flows.
The accrual basis of accounting has been applied in the preparation of the estimated financial statements whereby estimated assets, liabilities, equity, incomes and expenses are recognised in the reporting period to which they relate, regardless of when cash is received or paid.
2392012–13 Agency Statements — Volume 4

Assets Most government assets are valued at their written-down current cost. Otherwise agencies adopt one of the following measurement bases:
market/fair value — the amount for which an asset could be exchanged between a knowledgeable, willing buyer and a knowledgeable, willing seller in an arm’s length transaction (in many cases agencies use written-down current cost as a proxy for fair value) net market value — the market value after deducting costs expected to be incurred were the asset to be exchanged current cost — the lowest cost at which the gross service potential of that asset could currently be obtained in the normal course of operations.
All non-current tangible assets, with a cost of acquisition greater than $1.0 million and a useful life of more than three years, are required to be valued at fair value unless excluded from the scope of Australian Accounting Standard AASB 116 Property, Plant and Equipment and/or an alternative valuation is specified by another accounting standard.
All intangible assets are measured at cost.
Depreciation and amortisation
All non-current assets having limited useful lives are systematically depreciated/amortised over their useful lives in a manner that reflects the consumption of their service potential. The most common method used for calculating depreciation expense is the straight line method.
Certain heritage assets have very long and indeterminate useful lives. Their service potential has not, in any material sense, been consumed during the reporting period. As such, no amount for depreciation has been recognised in respect of those assets.
Assets acquired under finance leases are amortised over the period during which the government is expected to benefit from use of the leased asset.
Employee benefits Employee benefits (including salaries and wages, annual leave, long service leave, sick leave and superannuation benefits) reflect those benefits accrued as a result of services provided by employees up to the reporting date.
Short-term employee benefits (due to be settled within 12 months after the end of the reporting period in which the employee rendered the services) are measured at a nominal amount based on the remuneration rates an agency expects to pay. Examples of short-term employee benefits include salaries and wages and annual leave.
Long-term employee benefits (not due to be settled within 12 months after the end of the period in which the employee rendered the service) are measured at the present value of estimated future cash flows. An example of a long-term employee benefit is long service leave.
Sick leave
For the majority of agencies, no liability will be recognised for sick leave.
There is no liability for non-vesting sick leave (a non-vesting entitlement is that which does not constitute a legal obligation of the employing agency until a valid claim is made by an employee or an event has occurred) if, on average, sick leave taken is less than total entitlements accruing.
Vesting sick leave entitlements are rare for state government employees.
Accounting standards
240 2012–13 Agency Statements — Volume 4

Superannuation
For most state government controlled agencies, the Treasurer assumes the accrued superannuation liability in return for periodic payments from agencies. Therefore, unless there are contributions due but not yet paid at the reporting date, there is no superannuation liability recorded for the agency.
Two types of superannuation plans are in operation currently in the public sector: defined benefit plans and defined contribution plans. In a defined benefit plan, a member’s entitlement is determined by reference to a formula based on years of membership and/or salary levels. In a defined contribution plan, a member’s entitlement is determined by reference to accumulated contributions made to the plan together with investment earnings thereon.
Under existing arrangements, the Treasurer is liable for any net deficiency in assets for the defined benefits plans. Deficits in defined benefit superannuation plans are recognised as liabilities in the statement of financial position for the Treasurer. The deficits are measured as the excess of employees’ accrued benefits resulting from services up to the reporting date over the net market value of the plan’s assets as at the reporting date.
Income recognition
Wherever possible, income is recognised when the transaction or event giving rise to the income occurs. As a result, all items of income are normally reported in the statement of comprehensive income when an agency obtains control over the respective amounts. In circumstances where it is not possible to determine objectively when control over the asset passes to the agency, the amounts are recognised upon receipt.
Appropriation
The investment program requirements for agencies included in the agency statements may be funded through operating appropriation, operating receipts, the proceeds of asset sales, grants and through Commonwealth payments. Where the investment requirements of an agency are not funded from these sources, the state government funding of an agency’s investment program will generally be treated as an equity contribution from the government, as representative owner. These contributions are treated as contributions to equity rather than income in an agency.
Funds appropriated, but not required to meet current year cash outflows will be deposited with the Treasurer and will show as an asset in the agency’s statement of financial position.
Cash alignment policy
Where agencies have returned excess cash held to the Treasurer in accordance with the cash alignment policy, the payment is generally recorded as a ‘payment to government’ in the statement of comprehensive income. Some agencies have elected to repay debt or return contributed capital with excess cash balances. These transactions will be reflected in the statement of financial position.
Rounding
All estimated amounts in the financial statements have been rounded to the nearest thousand dollars, unless otherwise indicated.
Due to rounding, there may be instances where estimated financial statements and tables do not add correctly.
Accounting standards
2412012–13 Agency Statements — Volume 4


www.statebudget.sa.gov.au
Department of Treasury and Finance State Administration Centre 200 Victoria Square, Adelaide, South Australia, 5000
GPO Box 1045, Adelaide, South Australia, 5001 Telephone: +61 (08) 8226 9500 Web: www.treasury.sa.gov.au
Budget Paper 1 Budget OverviewBudget Paper 2 Budget SpeechBudget Paper 3 Budget StatementBudget Paper 4 Agency Statements – Volumes 1, 2, 3, 4Budget Paper 5 Capital Investment StatementBudget Paper 6 Budget Measures Statement
Acknowledgements
2012–13 Budget Papers
This publication is printed on FSC certified paper.
Content from this publication may be reproduced with appropriate acknowledgement, as permitted under the Copyright Act. © Government of South Australia 2012
Published May 2012 ISSN 1440-8589

Budget Paper 4 | Volume 4
Agency Statem
ents 2012–13
2012–13 Budget Paper 4
Agency Statements | Volume 4www.statebudget.sa.gov.au