Embed Size (px)
Citation preview

FINANCIAL STABILITY REPORT
11/2007


FINANCIAL STABILITY REPORT NOVEMBER 2007


FINANCIAL STABILITY REPORT NOVEMBER 2007

Reproduction for educational and non-commercial purposes is permitted
provided that the source is acknowledged.
© Banco de España, Madrid, 2007
ISSN: 1696-2621 (print)
ISSN: 1696-3520 (online)
Depósito legal: M. 52740-2002
Printed in Spain by Artes Gráficas Coyve, S. A.

ABBREVIATIONS*
€ Euro
ABCP Asset-backed commercial paper
AIAF Asociación de Intermediarios de Activos Financieros (Association of Securities Dealers)
ATA Average total assets
BCBS Basel Committee on Banking Supervision
BIS Bank for International Settlements
bn Billions
bp Basis points
CBE Banco de España Circular
CBSO Banco de España Central Balance Sheet Data Office
CCR Banco de España Central Credit Register
CDOs Collateralised debt obligations
CDS Credit default swaps
CEIOPS Committee of European Insurance and Occupational Pensions Supervisors
CIs Credit institutions
CNMV Comisión Nacional del Mercado de Valores (National Securities Market Commission)
CPSS Basel Committee on Payment and Settlement Systems
DGSyFP Directorate General of Insurance and Pension Funds
DIs Deposit institutions
ECB European Central Bank
EMU Economic and Monetary Union
EU European Union
FSA Financial Services Authority
FSAP Financial System Assessment Program
FSR Financial Stability Report
FVCs Financial Vehicle Corporations
GDI Gross disposable income
GDP Gross domestic product
GI Gross income
GVA Gross value added
GVAmp Gross value added at market prices
IAS International Accounting Standards
ICO Instituto Oficial de Crédito (Official Credit Institute)
ID Data obtained from individual financial statements
IFRSs International Financial Reporting Standards
IMF International Monetary Fund
INE National Statistics Institute
IOSCO International Organization of Securities Commissions
LGD Loss given default
m Millions
MEFF Mercado Español de Futuros y Opciones (Spanish Financial Futures and Options Market)
MiFID Markets in Financial Instruments Directive
MMFs Money market funds
NOI Net operating income
NPISHs Non-profit institutions serving households
PD Probability of default
PER Price-earnings ratio
pp Percentage points
ROA Return on assets
ROE Return on equity
RWA Risk-weighted assets
SCIs Specialised credit institutions
SMEs Small and medium-sized enterprises
SPV Special-purpose vehicle
TA Total assets
VaR Value at risk
WTO World Trade Organisation
* The latest version of the explanatory notes and of the glossary can be found in the November 2006 edition of the
Financial Stability Report.


CONTENTS
1 MACROECONOMIC RISKS
AND FINANCIAL
MARKETS 15
2 DEPOSIT INSTITUTIONS AND
OTHER FINANCIAL MARKET
PARTICIPANTS 21
2.1 Deposit institutions 21
2.1.1 Banking risks 21
2.1.2 Profitability 34
2.1.3 Solvency 39
2.2 Other financial market participants 43
2.2.1 Insurance companies 43
2.2.2 Other financial market participants 45
3 STRUCTURAL ELEMENTS OF
THE FINANCIAL SYSTEM 47
3.1 Institutions’ collateral policy 47
3.2 Changes in the taxation of financial products 49
OVERVIEW 11


BANCO DE ESPAÑA 11 FINANCIAL STABILITY REPORT, NOVEMBER 2007
Overview
Since the publication of the last Financial Stability Report (FSR), and particularly since the sum-
mer this year, new factors of risk and uncertainty have arisen in the international financial sec-
tor. There has been considerable turbulence on financial markets, the source of which lies in
the increase in defaults on US sub-prime mortgages. Although the size of this business seg-
ment is small (it accounts for 5.3% of banking assets in the United States, with defaults affect-
ing less than 1% of such assets), the financing of this type of mortgage through complex
structured products, which diversify risk among many agents but make the valuation thereof
very complicated, has led the episode to spread to other financial markets and take on an in-
ternational dimension, essentially affecting other, similarly developed countries. As a result, li-
quidity has contracted strongly on the markets, leading to the need for intervention by various
central banks. And, at the same time, there has been a reappraisal of risk and less appetite to
bear it on certain markets, a matter which might continue affecting confidence about the
above-mentioned markets in the coming months.
Admittedly, this bout of turbulence may contribute to a normalisation of the low risk premia
prevailing until recently. But it also entails greater uncertainty as regards world economic
growth, especially if the US mortgage market crisis ultimately affects the US economy ad-
versely or if the extension over time of financial turbulence alters the cost and availability of
private sector financing. These risk factors compound those already mentioned in previous
FSRs, and in particular those relating to global imbalances and to the rise in oil and com-
modities prices.
In any event, the current financial turbulence has come about at a time of strong world eco-
nomic growth in which households, companies and financial institutions are generally display-
ing a sound financial position. There are essentially two channels through which the Spanish
economy might be affected by this bout of instability: that relating to the external sector, inso-
far as our export markets may be affected; and that linked to financing conditions in the private
sector. As regards the latter, it should be stressed that the financial position of Spanish de-
posit institutions is sound, and that should contribute to mitigating potentially adverse fac-
tors.
Over the course of recent years, the growth rate of financing granted to the private sector by
Spanish deposit institutions has been strong. Recent trends, however, confirm what was re-
ported in the previous FSR, namely that there has been a slowdown in credit to the resident
private sector. The growth rate of credit to households has eased, as has, for the first time in
recent years, credit to corporations. The slowdown in corporate credit is concentrated in the
construction and property development sectors. Accordingly, although the growth rate of
credit to the real estate sector remains high, changes are beginning to be perceptible at de-
posit institutions in the form of a greater diversification of their credit portfolios, with a signifi-
cant increase in credit to industrial and services corporations not linked to the real estate
sector.
In line with what was highlighted in the previous FSR, the normalisation of doubtful assets
continues, moving towards the levels of doubtful assets ratios observed in other developed
countries. However, this is largely in response to the strong growth of credit in recent years,
given that there is a natural lag between credit expansion and the emergence of default prob-
lems. Further, the changes to accounting rules have also had a bearing on the higher growth

BANCO DE ESPAÑA 12 FINANCIAL STABILITY REPORT, NOVEMBER 2007
of doubtful assets, inasmuch as the latter have to be recognised much earlier and in a higher
proportion. In any event, current doubtful assets ratios are very low, both when observed from
a historical perspective and when compared with those in other developed countries. It should
not be surprising, then, if further increases in doubtful assets ratios continue to be seen in the
coming months.
In Spain there is no mortgage market segment comparable to the US sub-prime sector. What
is more, Spanish institutions have virtually no direct exposure to the sub-prime market in the
United States, and nor do they have any other type of investment tied to this business seg-
ment which, indirectly, might adversely affect them. The doubtful assets ratio for the US sub-
prime segment currently stands at around 15%. Comparatively, at the height of the last reces-
sion in the Spanish economy 14 years back, characterised by a very high unemployment rate,
a high budget deficit and a negative GDP growth rate (all of which circumstances are far re-
moved not only from the current conditions in the Spanish economy but also from the worst
conceivable scenario at present), defaults on individual mortgage loans did not exceed 4%;
indeed, the attendant ratio in June 2007 stood at 0.5%.
The sharp growth in credit recorded in Spain in recent years has not been accompanied by a
commensurate increase in deposits raised from customers, which is why Spanish institutions
have resorted to the wholesale markets to raise financing. Asset securitisation has been one
of the mechanisms used in this connection. Asset securitisation processes in Spain differ to a
large extent from those pursued by entities in other countries, and there are several reasons
for this. First, Spanish institutions have developed relatively simple securitisation structures;
they have not seen securitisation as a business in itself but as an opportunity to obtain addi-
tional liquidity, and there are no incentives to grant credit on less exacting terms. Further, the
quality of mortgage-backed assets is very high (low mortgage default, even in highly unfavour-
able economic circumstances, very low levels of actual losses in the event of default, substan-
tial credit enhancements, etc.).
The policy of resorting to wholesale markets in search of financing, a matter identified in previ-
ous FSRs as a factor requiring proper management by Spanish institutions, may be on the
wane insofar as credit is perceptibly slowing and the raising of deposits is more buoyant than
in previous years. Institutions’ liquidity position is thus trending favourably, while their short
interbank position has diminished. Furthermore, the banking model in Spain, predominantly
one of traditional retail banks with an extensive branch network, in which contact with custom-
ers is very close, may contribute to bringing about a replacement of financing from wholesale
markets with customer deposits.
Despite a more uncertain international environment and the current circumstances on financial
markets, Spanish deposit institutions are favourably placed to address the situation appropri-
ately. This is thanks both to their business model, which depends less on obtaining revenue
via the financial markets and which is unconnected to the risks arising from the US sub-prime
mortgage market, and to their financial strength.
This financial strength can primarily be seen in the income statement, the first line of defence
against potential difficulties. The favourable trend of the various operating margins and of effi-
ciency is perceptible in a generalised improvement in returns, both on assets and on equity, to
June 2007. Secondly, the solvency of Spanish deposit institutions stands comfortably above
the regulatory minimum levels, in terms both of the total solvency ratio and the tier 1 ratio. Fi-
nally, Spanish regulations on coverage of doubtful assets with provisions for bad debts offer
further, counter-cyclical factors of strength.

BANCO DE ESPAÑA 13 FINANCIAL STABILITY REPORT, NOVEMBER 2007
Insurance companies, which are less exposed to the current financial difficulties, are also dem-
onstrating notable soundness, along with a favourable business performance. That does not
mean that, as with other financial market participants such as pension and mutual funds, they
are exempt from risks that will need to be properly managed. Such risks include longevity,
without ruling out — especially for pension and mutual funds — risks related to the very course
financial markets take. In this respect, private equity activities, which have expanded strongly
in recent times, may be adversely affected owing to existing liquidity pressures and to a reap-
praisal of the level of risk incurred by investors in such activities.
Finally, and in the light of the recent bouts of financial turbulence, this FSR analyses the impor-
tance of central banks’ collateral policy. It argues that an effectively and constantly extensive
system offers advantages over a more restrictive one, these advantages being particularly tell-
ing in situations of tight liquidity on interbank markets.

BANCO DE ESPAÑA 15 FINANCIAL STABILITY REPORT, NOVEMBER 2007
1 Macroeconomic risks and financial markets
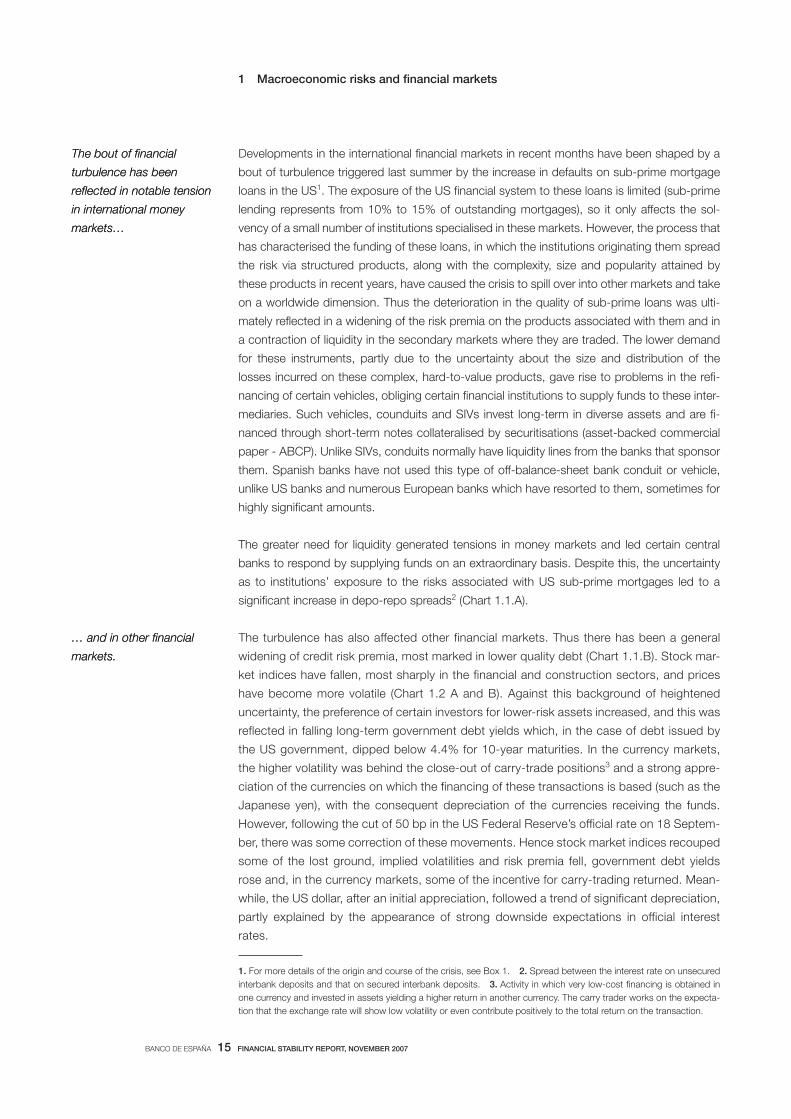
Developments in the international financial markets in recent months have been shaped by a
bout of turbulence triggered last summer by the increase in defaults on sub-prime mortgage
loans in the US1. The exposure of the US financial system to these loans is limited (sub-prime
lending represents from 10% to 15% of outstanding mortgages), so it only affects the sol-
vency of a small number of institutions specialised in these markets. However, the process that
has characterised the funding of these loans, in which the institutions originating them spread
the risk via structured products, along with the complexity, size and popularity attained by
these products in recent years, have caused the crisis to spill over into other markets and take
on a worldwide dimension. Thus the deterioration in the quality of sub-prime loans was ulti-
mately reflected in a widening of the risk premia on the products associated with them and in
a contraction of liquidity in the secondary markets where they are traded. The lower demand
for these instruments, partly due to the uncertainty about the size and distribution of the
losses incurred on these complex, hard-to-value products, gave rise to problems in the refi-
nancing of certain vehicles, obliging certain financial institutions to supply funds to these inter-
mediaries. Such vehicles, counduits and SIVs invest long-term in diverse assets and are fi-
nanced through short-term notes collateralised by securitisations (asset-backed commercial
paper - ABCP). Unlike SIVs, conduits normally have liquidity lines from the banks that sponsor
them. Spanish banks have not used this type of off-balance-sheet bank conduit or vehicle,
unlike US banks and numerous European banks which have resorted to them, sometimes for
highly significant amounts.
The greater need for liquidity generated tensions in money markets and led certain central
banks to respond by supplying funds on an extraordinary basis. Despite this, the uncertainty
as to institutions’ exposure to the risks associated with US sub-prime mortgages led to a
significant increase in depo-repo spreads2 (Chart 1.1.A).
The turbulence has also affected other financial markets. Thus there has been a general
widening of credit risk premia, most marked in lower quality debt (Chart 1.1.B). Stock mar-
ket indices have fallen, most sharply in the financial and construction sectors, and prices
have become more volatile (Chart 1.2 A and B). Against this background of heightened
uncertainty, the preference of certain investors for lower-risk assets increased, and this was
reflected in falling long-term government debt yields which, in the case of debt issued by
the US government, dipped below 4.4% for 10-year maturities. In the currency markets,
the higher volatility was behind the close-out of carry-trade positions3 and a strong appre-
ciation of the currencies on which the financing of these transactions is based (such as the
Japanese yen), with the consequent depreciation of the currencies receiving the funds.
However, following the cut of 50 bp in the US Federal Reserve’s official rate on 18 Septem-
ber, there was some correction of these movements. Hence stock market indices recouped
some of the lost ground, implied volatilities and risk premia fell, government debt yields
rose and, in the currency markets, some of the incentive for carry-trading returned. Mean-
while, the US dollar, after an initial appreciation, followed a trend of significant depreciation,
partly explained by the appearance of strong downside expectations in official interest
rates.
The bout of financial
turbulence has been
reflected in notable tension
in international money
markets…
The bout of financial
turbulence has been
reflected in notable tension
in international money
markets…
… and in other financial
markets.
… and in other financial
markets.
1. For more details of the origin and course of the crisis, see Box 1. 2. Spread between the interest rate on unsecured
interbank deposits and that on secured interbank deposits. 3. Activity in which very low-cost financing is obtained in
one currency and invested in assets yielding a higher return in another currency. The carry trader works on the expecta-
tion that the exchange rate will show low volatility or even contribute positively to the total return on the transaction.

BANCO DE ESPAÑA 16 FINANCIAL STABILITY REPORT, NOVEMBER 2007
Although there is no exact definition of sub-prime mortgages in the
United States, this type of loan is generally characterised by the fact
that it is extended to households with a non-existent or incomplete
credit record, and with a high risk profile. This market segment grew
notably between 2003 and 2005 against a background marked by
strong real estate price rises and by very benign borrowing condi-
tions. A substantial portion of these loans were securitised, meaning
the attendant risks were distributed to other national and interna-
tional investors, thereby contributing to the expansion of this activity.
From mid-2005, the default ratio for this type of mortgage began to
move on a rising course, which worsened as from 2006 (see panel A).
While the rise in defaults recently is similar to that witnessed between
2000 and 2002, there are differentiating factors between that period
and the present one. The aforementioned securitisation of these
loans has come about under a framework (originate-to-distribute
model) which has, first, led the loan originator to tend to uncouple it-
self from the financial situation of the borrower. Further, the originate-
to-distribute model has prompted a situation whereby risks are dis-
tributed among a broad set of domestic and international institutions
in a relatively opaque fashion, partly due to the complexity of the
process involving the use of sophisticated structured products. From
the demand standpoint, it should not be forgotten that investors have
pursued a search-for-yield process during these years, which has
increased the attractiveness of these products. Finally, and largely as
a result of the foregoing developments, the volume of the sub-prime
segment has grown significantly in recent years.
Since early 2007, the deterioration in the quality of these assets has
been reflected in an increase in the risk premiums on the lowest-rated
tranches of the securitisations of these loans (see panel B). But, sub-
sequently, negative sentiment spread to the other bonds linked to US
sub-prime mortgages. This was especially the case when, in mid-
June, Moody’s downgraded the credit ratings of structured products
that invest in these assets. In early July Standard & Poor’s took similar
action, which also spread to transactions with CDOs backed by
these securities. In July and August, news emerged on the first inter-
mediaries affected by the deterioration in this type of loan both in the
United States and in other areas. The investment bank Bear Stearns
duly informed its customers on 18 July of the sizeable losses incurred
in two of the hedge funds managed by it. On 24 July Countrywide
Financial Corp, one of the main private mortgage securitisation insti-
tutions in the United States, announced the difficulties it was facing
owing to the decline in its profits, linked to the US real estate crisis.
And on 30 July, the German investment bank IKB disclosed heavy
losses linked to these products and announced that its main share-
holder (the entity KfW) was assuming the obligations to supply liquid-
ity to a securitisation vehicle exposed to the US sub-prime mortgage
market. These developments ultimately affected the demand for as-
set-backed bonds, which appreciably reduced their liquidity. On 9
August, BNP Paribas temporarily froze redemptions in three invest-
ment funds owing to its difficulties in valuing its portfolio.
The refinancing problems facing certain investment vehicles with ex-
posures to the sub-prime market, which were being funded by
short-term financing, generated tensions on international money
markets. That led the ECB to make an exceptional injection of funds
into the financial system on 9 August, a measure that was also fol-
lowed by other central banks. In the following days, there were fur-
ther interventions aimed at normalising conditions on money mar-
kets. In the case of the US Federal Reserve, the injection was
accompanied by a 50 bp cut in its discount rate. On 14 September
the Bank of England extended emergency funding to Northern Rock
in the light of the liquidity problems facing this entity. Although
Northern Rock had no risks in the sub-prime segment, its difficulties
stemmed, at a time of financial market turbulence, from its financing
structure, in which a very high proportion of funds were from the
wholesale markets. The following week (18 September) the US Fed-
eral Reserve cut its federal funds target rate and its discount rate by
50 bp.
In sum, the sub-prime mortgage crisis evidences idiosyncratic fea-
tures that distinguish it from previous episodes. These include most
notably the slowness with which it has come to light and the fact that
its has been centred on the industrialised countries’ markets.
LANDMARKS IN THE ORIGIN AND DEVELOPMENT OF THE US SUB-PRIME MORTGAGE CRISIS BOX 1.1
0
2
4
6
8
10
12
14
16
1998 1999 2000 2001 2002 2003 2004 2005 2006 2007
PRIME MORTGAGE DEFAULT RATE
SUB-PRIME MORTGAGE DEFAULT RATE
%
A. DEFAULT RATES IN THE US MORTGAGE MARKET
0
50
100
150
200
250
300
350
400
450
Jan-07 Feb-07 Mar-07 May-07 Jun-07 Jul-07 Sep-07
0
500
1000
1500
2000
2500
3000
3500
4000
4500
5000
AAA
BBB (right-hand scale)
bpbp
B. US RMBS SPREADS (ABX INDEX) (a)
SOURCES: Datastream and JP Morgan.
a. These correspond to the JP Morgan Chase ABX.HE 2007-1 RMBS index.

BANCO DE ESPAÑA 17 FINANCIAL STABILITY REPORT, NOVEMBER 2007
Although the reassessment of risk on credit markets accompanying this bout of turbulence
calls into play certain positive factors for long-term financial stability, insofar as it involves the
normalisation of excessively low risk premia and thus raises borrowing costs somewhat, it
cannot be ruled out that some cost may have to be paid in terms of short- and medium-term
world economic growth. In any event, it is still too soon to assess the impact of this turbulence,
since there are not yet any significant data on how the international economy has performed
after the turbulence. That said, the impact will depend primarily on the final extent of the real
estate crisis in the US. The forecasts of international organisations are for US GDP to grow in
2008 at a moderately lower rate than that expected some months ago, although the downside
risks seem to have risen. Naturally, if these risks were to materialise, the global macroeco-
nomic scene would be seriously affected. Other factors that will shape the behaviour of world
output are the depth and duration of the financial market turbulence, since these can affect the
cost and availability of financing to the private sector.
In any event, this episode has occurred at a time when the world economy is growing rapidly
and, in addition, is characterised by the robustness of the financial position of households,
firms and financial intermediaries in the major areas, which are factors that strengthen the re-
silience to these shocks. In particular, the high levels of capitalisation of the systemically impor-
tant international financial institutions seem to be sufficient to absorb any losses stemming
from market developments. Moreover, the buoyancy of the emerging markets, which have
generally been little affected by this episode, would tend to mitigate the impact of the turbu-
lence. The relatively sound behaviour of the main stock market indices and the high oil and
commodities prices are consistent with this diagnosis.
In short, all these considerations suggest that in the upcoming quarters the pattern of world
output should remain buoyant (albeit at a more moderate pace), although the uncertainty sur-
rounding this behaviour has increased and, at the same time, the downside risks have risen.
The risks stemming from market instability come on top of those already noted in the last FSR,
such as the persistence of a high external deficit in the US the financing of which requires a
considerable volume of funds. Although the lower economic buoyancy of the US will help to
correct this imbalance, the rise in risk premiums will make it more costly to finance. Moreover,
these factors could weigh on the performance of the US dollar.
The turbulence entails risks
for world economic
growth…
The turbulence entails risks
for world economic
growth…
… although some factors
tend to mitigate that risk.
… although some factors
tend to mitigate that risk.
These risks come on top of
others such as those
stemming from external
imbalances and higher oil
and raw material prices.
These risks come on top of
others such as those
stemming from external
imbalances and higher oil
and raw material prices.
100
200
300
400
500
600
700
Jan-05 Jul-05 Jan-06 Jul-06 Jan-07 Jul-07
20
30
40
50
60
70
80
90
DJ CDX NA XO USA 5 years
ITRAXX EUROPE XO 5 years
DJ CDX NA IG USA 5 years (right-hand scale)
ITRAXX EUROPE IG 5 years (right-hand scale)
bpbp
B. CREDIT RISK INDICES
-0.2
0
0.2
0.4
0.6
0.8
1
1.2
1.4
1.6
1.8
Jan-05 Jul-05 Jan-06 Jul-06 Jan-07 Jul-07
UNITED STATES
EURO AREA
pp
A. EURO AREA AND US SPREADS.
INTERBANK RATE – THREE-MONTH REPOS
EURO AREA AND US INTEREST RATE SPREADS AND CREDIT RISK CHART 1.1
SOURCE: Datastream.

BANCO DE ESPAÑA 18 FINANCIAL STABILITY REPORT, NOVEMBER 2007
The rise in oil and commodities prices also constitutes a risk factor for international economic
and financial performance, insofar as it may feed through to heightened inflationary pressure,
since, in this case, it will reduce the room for manoeuvre of monetary authorities to accom-
modate monetary policy to developments in risks to economic growth.
The Spanish financial system is in a sound financial position to face the turbulence in the
international financial markets and is underpinned by high profitability, comfortable sol-
vency levels clearly above the minimum regulatory requirements and ample coverage of
doubtful loans by the provisions accumulated during recent years. Furthermore, the Span-
ish mortgage market lacks the sub-prime segment seen in the US. Hence the credit qual-
The Spanish financial
system is in a sound
financial position to face the
bout of turbulence,
The Spanish financial
system is in a sound
financial position to face the
bout of turbulence,
0
1
2
3
4
5
2004 2005 2006 2007
QUARTER-ON-QUARTER
YEAR-ON-YEAR
%
A. REAL GDP GROWTH RATES
-3
-2
-1
0
1
2
3
4
5
6
7
2004 2005 2006 2007
EXTERNAL SECTOR
GROSS CAPITAL FORMATION
GOVERNMENT CONSUMPTION
HOUSEHOLD CONSUMPTION
%
B. CONTRIBUTIONS TO GDP GROWTH
SPAIN. GDP GROWTH RATE AND CONTRIBUTIONS THERETO CHART 1.3
SOURCES: Instituto Nacional de Estadística and Banco de España.
80
100
120
140
160
180
200
Jan-05 Jul-05 Jan-06 Jul-06 Jan-07 Jul-07
IGBM
EURO STOXX
S&P 500
31.12.2004 = 100
A. STOCK INDICES
0
5
10
15
20
25
30
Jan-05 Jul-05 Jan-06 Jul-06 Jan-07 Jul-07
IBEX 35
EURO STOXX 50
S&P 500
%
B. IMPLIED VOLATILITIES (a)
STOCK EXCHANGE INDICES AND IMPLIED VOLATILITIES CHART 1.2
SOURCES: Datastream and Bloomberg.
a. Five-day moving averages.

BANCO DE ESPAÑA 19 FINANCIAL STABILITY REPORT, NOVEMBER 2007
ity of Spanish assets is high, as evidenced by the low doubtful assets ratios and the moder-
ate loan-to-value (LTV) ratios. In addition, the assets linked to US sub-prime mortgages
have an extremely marginal weight in the balance sheets of these institutions and their
exposure via possible lines of credit to other financial intermediaries that invest in such in-
struments is nil. Moreover, the scant financial liquidity on the money market has had a more
moderate impact in Spain than in other countries because in recent years the institutions
have been covering most of their funding needs through the issuance of medium- and
long-term debt.
These developments have come at a time when the Spanish economy continues to exhibit
considerable buoyancy. Thus in the first half GDP grew at a rate of around or slightly above 4%
(Chart 1.3.A), with a composition in which the lesser thrust of domestic spending is being
offset by an improvement in net external demand (Chart 1.3.B). Against this background, one
of the channels through which the recent turbulence could impact growth prospects is through
its effect on Spain’s export markets. Another way is through financing conditions for the private
sector. In this respect, the strong financial position of institutions is a factor that will tend to
mitigate the impact of the turbulence and so reduce the likelihood of it extending beyond a
healthy normalisation of risk premia that were at very low levels. The resilience of the Spanish
economy to this turbulence is also based on the financial soundness of households and firms,
which is underpinned by high household wealth and the favourable performance of corporate
profits.
In short, both the Spanish economy and the Spanish financial system are in a favourable posi-
tion to cope with these shocks. However, it is still early to gauge the true intensity and duration
of this market turbulence and it will be necessary to wait until fuller information is available to
obtain a more accurate picture. Naturally, if the turbulence ends up substantially affecting the
US economy, Spain’s main export markets or the international capital markets, it is unlikely that
the buoyancy of the Spanish economy will be unaffected.
which, along with the
buoyancy of the Spanish
economy, provides leeway
for absorbing the shocks,
which, along with the
buoyancy of the Spanish
economy, provides leeway
for absorbing the shocks,
although it is still very early
to gauge the true extent of
this episode.
although it is still very early
to gauge the true extent of
this episode.


BANCO DE ESPAÑA 21 FINANCIAL STABILITY REPORT, NOVEMBER 2007
2 Deposit institutions and other financial market participants
Chapter 1 noted the favourable performance of the world economy and, in particular, that of
Spain, although the turbulence in international financial markets engendered new uncertainties
while at the same time confirming some of the risks identified in the last FSR (excess liquidity
and overly low risk premiums). Despite this, the data for the first half of 2007, which are the
latest available at the time of this report going to press, confirm the strength of Spanish de-
posit institutions. This chapter analyses those points of strength and identifies certain risks that
will have to be managed appropriately by institutions.
The consolidated balance sheets of Spanish deposit institutions (Table 2.1) show a brisk pace
of activity in the first half of 2007, with total assets up by 18%. This buoyancy is apparent in
both business in Spain (20%) and, albeit to a lesser extent, abroad (10.9%). However, it should
be kept in mind that business abroad was affected by the depreciation against the euro of
certain currencies of the countries in which Spanish banks have their highest exposures.
The buoyancy of bank balance sheets is largely explained by the behaviour of lending to the
private sector, which grew somewhat faster than total assets (20.5%). However, credit to the
private sector shows signs of slowing as rates fall from nearly 25% in June 2006 to slightly
above 20% in the first half of 2007. This slowdown is concentrated in secured credit (down
from 27% to 20%).
Against this background of growth in activity, the growth rate of doubtful assets has acceler-
ated from 7.4% in June 2006 to 22.9% in the same period of 2007. This acceleration is shared
by both business in Spain and that abroad. In any event, the pass-through to the doubtful as-
sets ratio is very limited (increase of 3 bp with respect to the previous year) and, for total busi-
ness, this ratio remained very low (0.65%). Moreover, provisions cover more than twice the
current volume of doubtful assets and this coverage is even higher in individual balance sheets
(business in Spain).
Private-sector deposits taken by Spanish institutions have grown (15%) more strongly than in
the previous year. Nevertheless, their growth rate is slower than that of lending, so Spanish
institutions have had to raise funds on the wholesale markets, although to a lesser extent than
in the same period of the previous year. Also, own funds, which held at a relative weight of
around 5% in bank balance sheets, were expansionary (17.7%), and this strengthened the
solvency of institutions.
The pick-up in deposits, particularly time deposits, and the slowdown in lending to the private
sector help to mitigate the loss of relative importance of traditional bank funding. Moreover,
Spanish institutions, which are highly specialised in retail business and have an extensive
branch network ensuring a close relationship with customers in both lending and deposit ac-
tivity, depend on the securities market for funding to a similar extent to that observed in sev-
eral other EU countries, such as the United Kingdom, Germany and Italy, and appreciably less
so than in others like the Netherlands, Italy, Ireland and Denmark (Chart 2.1.A)1.
2.1 Deposit institutions
2.1.1 BANKING RISKS
2.1 Deposit institutions
2.1.1 BANKING RISKS
The pace of activity is high,
although secured lending is
slowing.
The pace of activity is high,
although secured lending is
slowing.
Doubtful assets continue to
rise, but their effect on
doubtful assets ratios is very
moderate.
Doubtful assets continue to
rise, but their effect on
doubtful assets ratios is very
moderate.
Deposits are growing more
rapidly than in the previous
year…
Deposits are growing more
rapidly than in the previous
year…
1. The data were drawn from the ECB publication EU Banking Structures (2005) and used to calculate the ratio of total
deposits taken from customers other than credit institutions to loans granted to customers other than credit institutions.
The information is only publicly available for 2005, but the trends observed for 2006 do not show significant changes.
Individual data.

BANCO DE ESPAÑA 22 FINANCIAL STABILITY REPORT, NOVEMBER 2007
The slower growth of assets abroad as compared with the greater buoyancy of business in
Spain means that the weight of the former in total business has decreased slightly, by 1.3 pp
to 21.2%. In any event, as noted in previous FSRs, the foreign assets of Spanish deposit insti-
tutions present low levels of risk (Chart 2.1.B).
Since the last FSR, credit to the resident private sector in Spain (Chart 2.2.A) has slowed
(growth of 25.8% in December 2006, against 22.6% in June 2007) due to the trend in mort-
gage lending (to both households and firms), which had been growing less quickly since
mid-2006 (27.7% in June 2006, 24.7% in December 2006 and 20.2% in June 2007). In
terms of net flows (new loans granted less repayments on that already granted), the picture
… while no significant risks
associated with the assets
abroad are discernible.
… while no significant risks
associated with the assets
abroad are discernible.
Lending growth has
slowed…
Lending growth has
slowed…
ASSETS JUN-07
(% CHANGE)
JUN-07/
JUN-06
RELATIVE
WEIGHT
JUN-06
RELATIVE
WEIGHT
JUN-07
(€m) (%) (%) (%)
Cash and balances with central banks 57,800 35.0 1.6 1.8
Loans and advances to credit institutions 280,365 20.5 8.7 8.9
General government 50,035 -1.1 1.9 1.6
Other private sectors 2,085,933 21.0 64.7 66.3
Debt securities 329,633 -1.7 12.6 10.5
Other equity instruments 113,490 35.2 3.1 3.6
Investments 31,651 -0.7 1.2 1.0
Derivatives 87,147 34.9 2.4 2.8
Tangible assets 34,782 -0.8 1.3 1.1
Other (a) 73,488 15.1 2.4 2.3
TOTAL ASSETS 3,144,324 18.0 100 100
Memorandum Items:
Financing to private sector 2,186,524 20.5 68.1 69.5
Financing to general government 200,684 -6.7 8.1 6.4
Total doubtful assets 17,817 22.9 0.5 0.6
Total doubtful assets ratio 0.65
Provisions for bad debts and country risk 38,855 18.5 1.2 1.2
LIABILITIES AND EQUITY JUN-07
(% CHANGE)
JUN-07/
JUN-06
RELATIVE
WEIGHT
JUN-06
RELATIVE
WEIGHT
JUN-07
(€m) (%) (%) (%)
Balances from central banks 40,596 -32.3 2.3 1.3
Deposits from credit institutions 466,906 8.5 16.1 14.8
General government 83,236 33.3 2.3 2.6
Other private sectors 1,385,401 15.0 45.2 44.1
Marketable debt securities 643,364 38.2 17.5 20.5
Derivatives 105,435 49.5 2.6 3.4
Subordinated debt 76,178 12.5 2.5 2.4
Provisions 34,858 -2.0 1.3 1.1
Other (a) 124,649 8.5 4.3 4.0
TOTAL LIABILITIES 2,960,623 17.9 94.3 94.2
Minority interests 5,864 -2.5 0.2 0.2
Valuation adjustments relating to total equity 22,390 48.4 0.6 0.7
Own funds 155,446 17.7 5.0 4.9
TOTAL EQUITY 183,700 20.0 5.7 5.8
TOTAL LIABILITIES AND EQUITY 3,144,324 18.0 100 100
CONSOLIDATED BALANCE SHEET
Deposit Institutions
TABLE 2.1
SOURCE: Banco de España.
a. The remaining assets and liabilities entries not explicitly considered, including
valuation adjustments, are included in "Other".

BANCO DE ESPAÑA 23 FINANCIAL STABILITY REPORT, NOVEMBER 2007
in the first half of 2007 is very similar to that in the same period of the previous year, with net
lending at around €141,000 million and €145,000 million, respectively. In the second half of
2006, the lending flow decreased by €11,000 million, the fall being sharper in mortgage lend-
ing.
The slowdown in total lending was seen both in firms and in households (Chart 2.2.A). The
growth of bank lending to households moderated both in the house purchase segment and in
the others (basically lending for the purchase of current consumption goods and consumer
durables). This moderation had already become apparent at the end of the past year. By con-
trast, the slowdown in bank credit to firms is new and attributable in its entirety to the signifi-
cant decrease in the growth rate of credit to construction and property development (from
43.9% in December 2006 to 35.5% in June 2007). Lending to property developers has slowed
more rapidly than that to construction companies, although both business segments still show
brisk growth (42% and 24.4%, respectively), in line with the trend in real estate sector activity.
Mention should also be made of the acceleration in credit to other firms, in a trend that has
prevailed uninterruptedly since December 2005. While in terms of rates of change these are
still well behind construction and property development companies, in terms of net flows the
distance has narrowed considerably (Chart 2.2.B).
Although as yet modestly, Spanish deposit institutions have begun to diversify their loan port-
folio once again, increasing the relative weight of lending to the industrial and services sectors.
This process drives and, in turn, is a result of, the shift taking place in the growth pattern of the
Spanish economy, against a background in which firms are showing substantial financial
strength (high returns and growing cash flows). Thus in June 2007 the relative weight of cred-
it to other firms became significantly more telling in explaining the behaviour of total lending
(Chart 2.2.C). Also, the increase in the still-high relative weight of credit to property developers
in total credit to firms has almost completely halted (Chart 2.2.D), helping to reduce the con-
centration of institutions’ loan portfolios.
… both in households and
in construction and property
development…
… both in households and
in construction and property
development…
… and the relative weight of
the real estate sector in
bank balance sheets has
begun to lessen.
… and the relative weight of
the real estate sector in
bank balance sheets has
begun to lessen.
0
20
40
60
80
100
120
140
BE GR UK DE ES FR PT AT FI NL IR IT SE DK
%
A. DEPOSITS FROM CUSTOMERS (EXCLUDING
CIs) AS A PERCENTAGE OF LOANS
TO CUSTOMERS (EXCLUDING CIs ). 2005. ID
0
2
4
6
8
10
12
Jun-00 Jun-02 Jun-04 Jun-06
SOVEREIGN DEBT
OTHER SECTORS
TOTAL
%
B. RISK PROFILE OF FINANCIAL ASSETS
ABROAD (a)
DEPOSITS AS A PERCENTAGE OF LOANS AND RISK PROFILE
OF FINANCIAL ASSETS ABROAD
Deposit institutions
CHART 2.1
SOURCES: European Central Bank and Banco de España.
a. Weighted average of default probabilities.

BANCO DE ESPAÑA 24 FINANCIAL STABILITY REPORT, NOVEMBER 2007
As was to be expected, doubtful assets have continued to rise, their year-on-year growth rate
accelerating to 24% (Chart 2.3.A). This initiated a process of normalisation taking Spanish
banks towards the higher doubtful assets levels shown by the banks of other European coun-
tries. It should be kept in mind that the doubtful assets ratios of Spanish institutions are around
one-third of the EU average. Also, as pointed out in the last FSR, this behaviour is due to the
lag between the growth of loans and that of doubtful assets, and to the new accounting regu-
lations which require the full amount of a loan to be classified as doubtful three months after
the failure to pay only one instalment2. The increase in doubtful assets is closely related to past
lending growth, so it is not surprising that credit to households for house purchases, which is
a credit segment that has shown high rates of expansion in this decade until very recently, is
that which now exhibits the highest increase in doubtful assets, followed by other credit to
households. In addition to the accounting regulations and the strong credit growth in the past,
Following the high buoyancy
of activity and the
accounting changes,
doubtful assets are growing
more quickly,
Following the high buoyancy
of activity and the
accounting changes,
doubtful assets are growing
more quickly,
0
10
20
30
40
50
60
70
80
90
100
Jun-01 Jun-02 Jun-03 Jun-04 Jun-05 Jun-06 Jun-07
NON-FINANCIAL CORPORATIONS
CONSTRUCTION AND PROPERTY DEVELOPMENT
OTHER NON-FINANCIAL CORPORATIONS
HOUSEHOLDS
€ bn
B. HALF-YEARLY ABSOLUTE CHANGES
BY BUSINESS SEGMENT
0
5
10
15
20
25
30
35
40
45
50
Dec-01 Dec-03 Dec-05
PRODUCTIVE ACTIVITIES
CONSTR. + PROPERTY DEVELOPMENT
HOUSEHOLDS
HOUSING
HOUSEHOLDS - HOUSING
PROD. ACTIVITIES – (CONSTR. + PROP. DEVELOP.)
TOTAL CREDIT
%
A. YEAR-ON-YEAR RATE OF CHANGE
OF CREDIT BY BUSINESS SEGMENT
0
10
20
30
40
50
60
70
80
90
100
Dec-01 Dec-03 Dec-05
OTHER
PROPERTY DEVELOPMENT
CONSTRUCTION
%
D. PRODUCTIVE ACTIVITIES. STRUCTURE
OF CREDIT TO NON-FINANCIAL CORPORATIONS
BY PURPOSE
0
10
20
30
40
50
60
70
80
90
100
Dec-01 Dec-03 Dec-05
OTHER HOUSEHOLDS
OTHER FIRMS
HOUSING
PROPERTY DEVELOPMENT
CONSTRUCTION
%
C. STRUCTURE OF YEAR-ON-YEAR CHANGE
IN TOTAL CREDIT BY PURPOSE
CREDIT
Deposit Institutions. ID
CHART 2.2
SOURCE: Banco de España.
2. For more details, see Box 2.1 of the May 2007 FSR.

BANCO DE ESPAÑA 25 FINANCIAL STABILITY REPORT, NOVEMBER 2007
the substantial rise in interest rates in the euro area from end-2005 (the rate on ECB main re-
financing operations has doubled) also helps to explain the higher doubtful assets. Further-
more, although the doubtful assets on loans to non-financial corporations have accelerated
since the last FSR, they are rising more moderately, which reflects the strength of the Spanish
corporate sector. Once again, the business segments that grew most in the past (construction
and property development) are those with the highest growth of doubtful assets, although their
doubtful assets ratios are very low (0.49% and 0.32%, respectively).
These developments in doubtful assets translate into a slight rise in the relative weight of
lower-risk assets (linked to mortgage credit), with the resulting relative decrease in doubtful
assets linked to corporate credit (Chart 2.3.B).
-20
-10
0
10
20
30
40
Jun-01 Jun-02 Jun-03 Jun-04 Jun-05 Jun-06 Jun-07
OTHER
GENERAL GOVERNMENT
NON-RESIDENT CREDIT INSTITUTIONS
OTHER NON-RESIDENT SECTORS
OTHER RESIDENT SECTORS
%
A. CONTRIBUTION TO THE RATE OF CHANGE
OF TOTAL DOUBTFUL ASSETS
0
0.5
1
1.5
2
2.5
3
3.5
4
4.5
Jun-89 Jun-93 Jun-97 Jun-01 Jun-05
%
D. DOUBTFUL ASSETS RATIO
FOR MORTGAGES TO INDIVIDUALS (a)
0
0.5
1
1.5
2
2.5
Dec-01 Dec-03 Dec-05
TOTAL CREDIT
PRODUCTIVE ACTIVITIES
HOUSING
CONSUMPTION
HOUSEHOLDS
%
C. DOUBTFUL ASSETS RATIO
0
10
20
30
40
50
60
70
80
90
100
Jun-05 Dec-05 Jun-06 Dec-06 Jun-07
HIGH RISK
MEDIUM TO HIGH RISK
MEDIUM RISK
MEDIUM TO LOW RISK
LOW RISK
INAPPRECIABLE RISK
%
B. COMPOSITION OF DOUBTFUL ASSETS
BY RISK BUCKET
DOUBTFUL ASSETS
Deposit institutions. ID
CHART 2.3
SOURCE: Banco de España.
a. Mortgages are collateralised loans with a maturity longer than five years granted
to individuals, including both households and individual entrepreneurs.
(Information from the CCR).

BANCO DE ESPAÑA 26 FINANCIAL STABILITY REPORT, NOVEMBER 2007
Despite the growth in doubtful assets, the doubtful assets ratios remain, except in consumer
credit, at very low levels (Chart 2.3.C). Thus that for house purchase credit to households is at
0.49%, with a slight increase in this half, while that for consumer credit has continued growing
to 2.32%. This explains why the household doubtful assets ratio is 0.76%, against 0.64% in
December 2006. By contrast, in the corporate segment the doubtful assets ratio continues to
fall (0.58% in June 2007).
Accordingly, doubtful assets ratios are still very low, although in the coming months they can
be expected to keep rising as a result of the aforementioned lag between lending and de-
faults, the accounting change and the impact of interest rates. An assessment of their long-
term path has to take into account their past behaviour (Chart 2.3.D). Thus, for example, the
current doubtful assets levels in house purchase loans to individuals are well below those
around 1993 during the last economic recession in Spain. In this respect, three observations
can be made. First, the state of the Spanish economy at that time (negative GDP growth ex-
ceeding 1 pp, high budget deficit and unemployment rates above 20%) differs considerably
from today’s worst-case scenario. Second, credit institutions have made significant progress
in risk monitoring methods and control. Third, despite the foregoing, it cannot be ignored that
in 1993 the doubtful assets ratio of house purchase loans to individuals, although high, did not
rise above 4%, with an increase of 1.5 pp relative to the average level in the previous upturn.
In addition, the effective loss for institutions was considerably less in that they managed to
recover a large part of the amount owed to them by selling the property used as loan collat-
eral.
The detailed information in the CCR can be used to supplement the aforementioned informa-
tion on the doubtful assets ratio. Since the origination date of a loan, and the date when it
became past-due, if at all, are known, curves can be constructed of the default rate over time
for the loans granted on a particular date3. A sharp increase in one of these curves indicates
that the loans granted on that date were particularly risky (for example, because the institu-
tions significantly relaxed their credit approval policies, as seen in US sub-prime mortgages
in recent curves). By contrast, a general increase in all curves indicates a general worsening
of doubtful assets ratios attributable to the macroeconomic setting (higher interest rates) and
not to a specific deterioration in credit policy or to a phenomenon of one-off adverse selec-
tion.
Since 2003 the picture shown by default rate curves (Chart 2.4.A) has worsened slightly, al-
though the 2005 curve practically coincides with that for 2002. More recently (loans granted in
2006), the slope of the curve is somewhat steeper, although the level reached continues to be
very low. Indeed, the most significant feature of these curves is their low level: one year after
loan origination, the default rate is around 0.20%. The data for the volume of doubtful assets
are very similar. Comparison with the US sub-prime market curves (Chart 2.4.B) clearly shows
the enormous differences in terms of default level and approval policy standards, particularly if
recent dates are analysed. What is more, in the Spanish case, if the high recorded in the 2006
curve is compared with the lowest default rate attained after the same lapse of time from
… although doubtful assets
ratios continue at very low
levels, with slight rises in
households….
… although doubtful assets
ratios continue at very low
levels, with slight rises in
households….
… and decreases in firms.… and decreases in firms.
The default rate curves are
consistent with a slight
general deterioration in
doubtful assets ratios…
The default rate curves are
consistent with a slight
general deterioration in
doubtful assets ratios…
3. To construct default rate curves, for each quarter the loans originated in the previous three months are monitored.
Specifically, for a portfolio of loans granted at time t, their default rate k quarters later is calculated as the number of
doubtful loans at the future time t+k divided by the original number of loans. The x-axis indicates the quarter after loan
origination, such that a value of 1 denotes the first quarter after the loan was originated. When the curves are annual, they
represent the average default rate calculated for each portfolio of new loans originated in the first, second, third and
fourth quarters of the year in question. Since the CCR does not contain express information on house purchase mort-
gages, the measurement used to proxy them was all financial credit granted to households for amounts exceeding
€60,000, maturity exceeding five years, fully collateralised and arranged by fewer than four participants.

BANCO DE ESPAÑA 27 FINANCIAL STABILITY REPORT, NOVEMBER 2007
origination in any other year (in this case, the 2003 curve), the increase found in the default rate
is only 0.11 pp. However, if this analysis is performed on US sub-prime mortgages, the in-
crease is 10 pp. Therefore, Spain does not have adverse selection or relaxation of risk control
criteria in loan origination in recent years.
Analysis of the last few years (Chart 2.4.C) shows a progressive deterioration in default rate
curves. This deterioration is general, so, rather than a problem in lending conditions in a given
period, it reflects a general worsening in doubtful assets ratios (as mentioned above). The in-
terest rate trend in the past year probably explains the steeper slope of the curves. In any
event, the most noteworthy feature is again the fact that, despite the slight deterioration, the
level of default rates in mortgage lending is very low, evidencing the high quality of these as-
sets. This is in line with their traditional behaviour in Spain, since house purchase mortgage
lending has always been the least risky business segment.
… which, however, are
notable for their low level…
… which, however, are
notable for their low level…
0
0.05
0.1
0.15
0.2
0.25
0.3
0 1 2 3 4 5 6 7 8 9
Mar-05 Jun-05
Sep-05 Dec-05
Mar-06 Jun-06
Sep-06 Dec-06
Mar-07
%
C. ALL HOUSEHOLDS. QUARTERLY DATA.
SPAIN
0
0.05
0.1
0.15
0.2
0.25
0.3
0.35
0 1 2 3 4 5 6 7 8 9
Mar-05 Jun-05
Sep-05 Dec-05
Mar-06 Jun-06
Sep-06 Dec-06
Mar-07
%
D. COASTAL PROVINCES. ALL HOUSEHOLDS.
QUARTERLY DATA. SPAIN
0
2
4
6
8
10
12
14
16
0 6 12 18 24 30 36 42 48 54 60 66 72 78
2000 2001
2002 2003
2004 2005
2006 2007
%
B. US SUB-PRIME MORTGAGES
0
0.05
0.1
0.15
0.2
0.25
0.3
0 2 4 6 8 10 12 14 16 18 20
2002 2003
2004 2005
2006 2007
%
A. ALL HOUSEHOLDS. ANNUAL DATA,
QUARTERLY AVERAGES. SPAIN
DEFAULT RATE CURVES
Mortgages to households. Credit Institutions (a)
CHART 2.4
SOURCES: Banco de España, Merrill Lynch and Intex.
a. X-axis: number of quarters since loan origination date, except in the US chart,
where the x-axis shows the number of months since origination.

BANCO DE ESPAÑA 28 FINANCIAL STABILITY REPORT, NOVEMBER 2007
The CCR data do not distinguish whether the mortgage is for a first or second home, or
whether the borrower intends to use the house or sell it (investment motive). However, the
results of the above-mentioned default analysis, when limited to mortgage loans to house-
holds in the coastal Mediterranean and island provinces, where the percentage of second
homes (Chart 2.4.D) is higher, do not show a noticeably different profile from that of total
mortgages, the default level being only slightly higher (5 bp). Nor are significant differences
found when analysis focuses only on the provinces that are most active in property develop-
ment4.
The only segment of the mortgage business identifiable as having higher default rates is that
of mortgage lending to foreign residents, be they from other EU countries or from the rest of
the world. However, this behaviour is not recent but of a structural nature. Thus the default rate
curve for 2003, the lowest year, is more than double for foreign residents than for households
as a whole. In any event, the relative weight of this business segment in household mortgages,
although growing in recent years, is only 7.2% of the total.
Default rate curves for corporate loans can also be constructed. These curves for the con-
struction and property development sector (Chart 2.5.A) show some deterioration dating from
2003 but, once again, the rates are very low. Very similar, albeit somewhat lower, levels
(Chart 2.5.B) are found for other firms.
The exposure to the US sub-prime market is the cause of the turbulence affecting the inter-
national financial markets in recent months. Transparency regarding such exposure is one of
the factors that should help the markets to recoup a greater level of normality and, in addi-
tion, enable greater discrimination between institutions via price. The doubtful assets ratios
… even in the second-home
segment…
… even in the second-home
segment…
… and in firms, including
construction companies and
property developers.
… and in firms, including
construction companies and
property developers.
In Spain there is no
sub-prime mortgage
market.
In Spain there is no
sub-prime mortgage
market.
0
0.02
0.04
0.06
0.08
0.1
0.12
0.14
0.16
0.18
0.2
0 1 2 3 4 5 6 7 8 9
Mar-05 Jun-05
Sep-05 Dec-05
Mar-06 Jun-06
Sep-06 Dec-06
Mar-07
%
B. OTHER FIRMS.
QUARTERLY DATA
0
0.02
0.04
0.06
0.08
0.1
0.12
0.14
0.16
0.18
0.2
0 1 2 3 4 5 6 7 8 9
Mar-05 Jun-05
Sep-05 Dec-05
Mar-06 Jun-06
Sep-06 Dec-06
Mar-07
%
A. CONSTRUCTION AND PROPERTY
DEVELOPMENT FIRMS. QUARTERLY DATA
DEFAULT RATE CURVES
Firms. Credit institutions (a)
CHART 2.5
SOURCE: Banco de España.
a. X-axis: number of quarters since loan origination date.
4. Note that, in any event, this is an approximation not exempt from limitations because in the coastal provinces it does
not distinguish between first and second homes, nor does it include mortgages taken out in other Spanish provinces to
acquire second homes on the Mediterranean coast. However, it seems a reasonable first approximation.

BANCO DE ESPAÑA 29 FINANCIAL STABILITY REPORT, NOVEMBER 2007
and default rate curves, even in the highest-risk segments, are clearly lower than those in the
US sub-prime market (Chart 2.4), showing that these two credit markets are not related in
any way, whether in terms of definition, of the credit policy practised by institutions or of the
level of risk assumed. Even in a scenario with a very low probability such as that of 1993
(recession, high budget deficit and very high unemployment rates), the doubtful assets ratios
in mortgage lending to households in Spain are much better than those of the sub-prime
segment.
As part of the Banco de España’s customary monitoring of the risks incurred by Spanish de-
posit institutions, a study was made of those to which they may be exposed in the US sub-
prime market. This study focused on obtaining information on the following direct and indirect
risks: i) risks due to granting of sub-prime mortgages directly or through subsidiaries; ii) lines
of credit granted and any other commitment to institutions involved in transactions with sub-
prime exposures; and iii) risks arising from other types of investments related to sub-prime
mortgages in the US, such as the first-loss tranche of asset-backed bonds known as collater-
alised debt obligations (CDOs)5, the underlying assets of which are related to these mortgages.
The study found that the risks to which the analysed Spanish institutions were exposed in this
connection in June 2007 represent 0.03% of their assets and 0.68% of their tier 1 capital.
Therefore, the exposure of Spanish banks to the US sub-prime market is completely marginal
in terms of its potential impact on both profitability and solvency.
Asset securitisation has developed strongly at international level in recent years, enabling insti-
tutions to raise funds and re-allocate risk more efficiently. Spanish institutions have participated
actively in this process, as might be expected in view of their management capabilities, level
of development and recent expansion. However, it should be noted that securitisation transac-
tions are not as complex in Spain as in other banking systems.
As explained in Chapter 1, part of the turbulence assailing the international financial system is
due to uncertainty about the level of risk associated with certain complex products (CDOs,
CLOs, etc.) through which some underlying assets could be linked to the US sub-prime seg-
ment. Moreover, numerous banks involved in this process have engaged in the practice of
originating sub-prime mortgages, granting the loan and immediately distributing (i.e. securitis-
ing) it to rid themselves of the risk and obtain additional liquidity with which to originate fresh
loans. This securitisation business model differs substantially from that followed by the more
traditional banks (like those in Spain). Under this traditional model, the risk, or a good part of
it, remains on the balance sheet, meaning the bank has an adequate incentive to keep pursu-
ing a rigorous loan approval policy. The Spanish securitisation model does not separate origi-
nation from risk management and the incentives of the loan originator are well aligned with
those of the investors that acquire the securitised loan. In short, risk transmission is limited and
the incentive to select borrowers adequately has not been weakened as in the originate-to
distribute model applied by numerous US institutions.
Detailed study of the securitisation transactions of the last two years has demonstrated the
high quality of the underlying assets. Underlying asset quality is a key factor in determining the
risk of this product for investors and, therefore, the cost of the funding obtained by the bank.
The information in the CCR shows that the securitised assets of households (the vast bulk of
which are mortgage loans) have a lower doubtful assets ratio than those not securitised (40 bp
Asset securitisation in Spain
involves less complex
processes than in other
countries,…
Asset securitisation in Spain
involves less complex
processes than in other
countries,…
… differs from the originate-
to-distribute model,…
… differs from the originate-
to-distribute model,…
… and is characterised by
high-quality underlying
assets.
… and is characterised by
high-quality underlying
assets.
5. A CDO (collateralised debt obligation) is a securitisation structure in which the securitised asset portfolio is consider-
ably more heterogeneous than in traditional securitisation. These structures may include different types of bonds and
loans (collateralised loan obligation or CLO), including those from other securitisations.

BANCO DE ESPAÑA 30 FINANCIAL STABILITY REPORT, NOVEMBER 2007
less in June 2007), evidencing the higher quality of securitised loans6. Securitised mortgages
have an average LTV (loan amount divided by the appraised value of the property used as col-
lateral for the transaction) of around 70%, with a slight tendency to move upwards in recent
times (Chart 2.6.A). Note that this LTV is that calculated at the origination date and that, with
the passage of time, the mere process of repaying the loan continuously reduces the LTV7. The
geographical concentration indices of the securitised mortgage loan portfolio are low (Herfin-
dahl index of around 0.3, which coincides with that of the credit portfolio). Also contributing to
the geographical diversification is the practice by which various institutions pool their portfolios
for joint securitisation.
Finally, around 94% of asset-backed bonds are triple A, i.e. they have the maximum credit
quality rating awarded by rating agencies (Chart 2.6.B). Hence the lower-rated tranches, in-
cluding the reserve fund set aside to be used first to absorb losses, represent around 6% of
securitisations, based on assets (mortgage loans for house purchase) whose doubtful assets
ratio is currently around 0.5% and, as stated above, failed to reach 4% at the height of the
last Spanish recession (Chart 2.3.D). Moreover, the realisation of assets subsequently ena-
bled a good part of the outstanding loan amount to be recovered in many cases, that is to
say, the loss in cases of default on these assets has historically been very low. Hence it is
difficult to conceive a scenario in which the losses would extend to the higher-rated tranches.
This would only be possible if the default rates were very high (for example, 12%) and if the
loss given default reflected very low foreclosure values (for example, 50% of the residual
value of the loan). These situations are highly unlikely taken separately and much more so
taken together.
50
55
60
65
70
75
80
85
90
Q1 Q2 Q3 Q4 Q1 Q2 Q3
2006 2007
AVERAGE WEIGHTED BY VOLUME
SIMPLE AVERAGE
%
A. LTV OF SECURITISED MORTGAGES
0
1
2
3
4
5
6
7
8
9
Q1 Q2 Q3 Q4 Q1 Q2 Q3
2006 2007
TRANCHES "AA+" TO "A–"
TRANCHES "BBB+" TO "B–"
TRANCHES "CC+" TO "CCC–"
RESERVE FUNDS
%
B. DISTRIBUTION OF TRANCHES OTHER
THAN 'AAA' (a)
MORTGAGE SECURITISATION. ISSUES SINCE 2006
Deposit institutions
CHART 2.6
SOURCES: Comisión Nacional del Mercado de Valores and Banco de España.
a. The remaining proportion up to 100% corresponds to the relative weight
of the AAA tranche.
6. In June 2007 the securitised assets of firms (largely loans to SMEs) represented around 20% of total securitised
credit, and their doubtful assets ratio was also lower than that of on-balance-sheet loans to firms. 7. Naturally, the in-
crease in house market value further reduces this LTV. For example, not counting repayments, a LTV of 80% (100%) in
2003 becomes 53.7% (67.2%) in 2007.

BANCO DE ESPAÑA 31 FINANCIAL STABILITY REPORT, NOVEMBER 2007
Recently, coinciding with the turbulence in international financial markets, the spreads in the
secondary market in which Spanish asset-backed bonds and covered bonds are traded have
widened. This widening of spreads, also seen in other market segments, largely reflects the
process of reassessment of risk levels and the consequent adjustment of risk premiums in
progress since last summer. However, given the high quality of Spanish underlying assets, it
seems that the widening of spreads may also reflect certain tensions in the investors holding
these products which, in turn, are a reflection of the liquidity difficulties besetting them be-
cause they cannot roll over the commercial paper used to finance these assets. It is estimated
that around two-thirds of the total amount securitised in Spain could be in the hands of wide-
ly diverse foreign investors. These include, on the one hand, investors such as insurance
companies and investment and pension funds and, on the other, investors with a more varia-
ble time horizon, high gearing and a greater dependence on short-term financing, whether
from banks or from others. The marking-to-market of these assets, together with secondary-
market movements, may give rise to significant losses in some of these investors dependent
on short-term funding, because of a significant increase in the liquidity premium8. However, as
the financial turbulence subsides and market liquidity returns, these spreads will gradually nar-
row, given the high quality of the underlying assets and the credit enhancements included in
securitisations in Spain (Chart 2.6.B).
The slowdown in credit to the private sector in business in Spain and the good progress of
deposits taken from Spanish households and firms, against a background of sustained eco-
nomic expansion and sound performance of employment and of business activity have meant
that in the past year, and particularly in the last half, the difference between the two growth
rates has decreased (Chart 2.7.A). The continuation of this trend in the near future, as the
lending growth rate adjusts to a normalising real estate market and financial institutions in-
crease the amount of new saving captured, competing with other financial intermediaries, will
reduce the pressure to resort to the wholesale market to finance lending activity.
The observed increase in
the cost of Spanish asset-
backed bonds and of
covered bonds is due more
to market conditions than to
the quality of the securities
issued.
The observed increase in
the cost of Spanish asset-
backed bonds and of
covered bonds is due more
to market conditions than to
the quality of the securities
issued.
The recent slowdown in
lending and pick-up in
deposit growth suggest that
the need for borrowing in
wholesale markets will
decrease…
The recent slowdown in
lending and pick-up in
deposit growth suggest that
the need for borrowing in
wholesale markets will
decrease…
60
70
80
90
100
110
120
Jun-01 Jun-03 Jun-05 Jun-07
RESID. PRIV. SECTOR
RESID. AND NON-RESIDENT PRIV. SECTOR
RESID. AND NON-RESID. PRIV. SECTOR AND GEN. GOVT.
%
B. DEPOSITS AS A PERCENTAGE OF LOANS
-5
0
5
10
15
20
25
30
Jun-01 Jun-02 Jun-03 Jun-04 Jun-05 Jun-06 Jun-07
DIFFERENCE
LOANS TO OTHER RESIDENT SECTORS
DEPOSITS FROM OTHER RESIDENT SECTORS
%
A. YEAR-ON-YEAR RATES OF CHANGE
COMPARISON OF LOANS AND DEPOSITS
Deposit Institutions. ID
CHART 2.7
SOURCE: Banco de España.
8. Box 2.1 comments on the different types of valuation of financial assets and, in particular, on the conditions necessary
for applying them.

BANCO DE ESPAÑA 32 FINANCIAL STABILITY REPORT, NOVEMBER 2007
For this reason, the relative weight of deposits from the resident private sector with respect to
credit to this sector will foreseeably increase. This ratio has decreased significantly over the
past decade (Chart 2.7.B) and in June 2007 was 76.2% (131.3% if the ratio is credit to depos-
its)9. This business structure clearly reflects the predominance of the traditional retail banking
model in Spain10, although without spurning the possibilities offered by markets and new fi-
nancial instruments (securitisation), particularly if they involve simple operating procedures and
high-quality underlying assets. It should be noted that the extensive branch network, the con-
siderable relative weight that deposit institutions have in the distribution of other products
designed to channel saving (investment and pension funds, insurance policies, etc.) and the
close contact maintained with bank customers may enable Spanish institutions, in the event
… in a banking system in
which traditional retail
banking predominates…
… which makes it easier to
replace wholesale funding, if
necessary, with customer
deposits.
… in a banking system in
which traditional retail
banking predominates…
… which makes it easier to
replace wholesale funding, if
necessary, with customer
deposits.
Heightening uncertainty as a result of the increased volatility of inter-
est and exchange rates and of commodities prices in the late 70s
prompted the use of financial derivatives as a means both of mitigat-
ing risks and of operating with them as a new source of business. In
turn, there was a significant qualitative leap in academic research
from 1973 with the papers by Fischer Black, Myron Scholes and
Robert C. Merton on rational option valuation.
Given that the cost of most derivatives is zero, these were initially re-
corded as off-balance sheet transactions due to the difficulties of
valuing them at cost. The existence of more or less liquid markets
together with the development of accepted valuation methodologies
used by financial market participants to set their price diminished the
credibility of information based on historical cost. Accordingly, the
principal accounting regulators (IASB and FASB) called for the disclo-
sure of information on fair value in the notes to financial statements.
Subsequently, consensus was reached in the late 90s over the fact
that fair value was the only relevant measure for investors in respect
of financial instruments, and most particularly of derivatives.
Fair value is a rational price which is either obtained directly from real
transactions in an active market or from a valuation model that seeks
to reproduce the price which, under normal business conditions, the
entity would receive if it were to sell the asset or the amount it would
need to deliver to acquire its liabilities. Accounting standards set a
series of criteria to be met by any model: i) it should be commonly
used by market participants and incorporate all the factors that a par-
ticipant would consider on setting the price; ii) it should be consistent
with the principles of financial theory; iii) it should use the time value of
money, volatility, risk premiums, liquidity, and other relevant variables;
and iv) it should be regularly calibrated against real transactions.
As regards credit risk, fair value estimation models face the difficulties
proper to the modelling of this risk: the estimation of probability of
default, recovery rates and correlations between defaults. Most credit
instruments, as is the case with securitisations, do not have an active
market, and the model is therefore not derived from a statistical analy-
sis of prices based on their historical experience, and nor is there in-
formation on defaults of each instrument. As an example of a struc-
tured product, CDOs have as their underlying portfolio loans transferred
to a vehicle which issues bonds with different ratings (senior, mezza-
nine, equity) that reflect seniority in regard of the absorption of losses.
The rating agencies play an important role as they are responsible for
assigning a rating to the different tranches of the vehicles.
Entities should disclose information of help for evaluating the uncer-
tainty of the estimates. They should inform as to whether the fair value
is obtained from an observable price or from a valuation model. They
should further offer information on the model used and the most rele-
vant hypotheses employed, and on the effect on fair value of the range
of potential alternative assumptions, if a change in any of the latter
should result in a significantly different valuation (stress testing). The in-
formation on fair value should be complemented with sensitivity meas-
ures (such as VaR), consistency analysis (such as back testing) and test
methods (excess frequency testing). As regards credit risk, an analysis
of the entity’s exposure thereto should be included, using external or
internal ratings, along with information on historical default rates.
The paradigm change from historical cost to fair value involves the
provision of information that is useful for investors, but not exempt
from new risks. Mark-to-model valuation (i.e. using a model) gives
rise to model risk, since fair value in the case of instruments without
an active market is an estimate about the future on the basis of past
and present information, and the model is based on past relation-
ships that have to hold in the future for the estimate to be correct. The
estimation models are rather market agreements, and not so much
scientific laws. Accordingly, their reliability is based on the consensus
of market agents as they use them for price formation.
FAIR VALUE BOX 2.1
9. If both residents and non-residents are counted, the ratio of deposits to credit increases to nearly four-fifths (78% in
June 2007). If, furthermore, credit to and deposits from general government are included, this ratio rises, in June 2007,
to 80.3%. 10. In Spain there is a close relationship between banks and their assets-side customers and, as a result, the
average number of banking relationships is very low, as shown in the study by G. Jiménez, J. Saurina and R. Townsend
entitled “Análisis del número de relaciones bancarias en España”, Estabilidad Financiera, forthcoming November 2007.
This close relationship of firms and households with their banks in the credit market extends to the deposit market, sup-
ported by an extensive branch network which enables banking to be finely attuned to customers and their needs, with
benefits on both sides.

BANCO DE ESPAÑA 33 FINANCIAL STABILITY REPORT, NOVEMBER 2007
that the international financial market turbulence persists, to replace some of the funds raised
on wholesale markets with different types of bank deposits from their retail customers, pro-
vided that attractive yields are offered.
As regards the term structure of the liquidity position11 reflected in bank balance sheets,
the latest available information up to June 2007 shows a favourable performance, with a
significant decrease in the short position up to one month (from 8% of assets in June 2006
to 5% in June 2007) and a lengthening between 1 and 12 months (Chart 2.8.A). Of the
institutions operating in Spain, it is the subsidiaries and branches of foreign banks which,
at aggregate level, have the most marked short position (around 15% of assets) in maturi-
ties up to one month. In any event, the liquidity position of Spanish deposit institutions re-
flects the traditional transformation of maturities and the customary operating practices
used in banking.
The recent changes in the term structure of Spanish deposit institutions partly reflects the
decrease in the interbank short position, down from a high of 7% of total assets in December
2005 to a low of 4.5% in June 2007. This short interbank position basically reflects the rela-
tionship of foreign subsidiaries and branches that operate in Spain with their own financial
group (Chart 2.8.B), while Spanish banks have a much more balanced and slightly long posi-
tion (net lenders).
During the period of turbulence, Spanish institutions exhibited a comfortable liquidity posi-
tion, largely because many of them had brought forward their programmes to obtain liquidity
for the whole of the year and completed them before the summer to take advantage of the
The liquidity position has
performed favourably…
The liquidity position has
performed favourably…
… and the interbank short
position has been reduced.
… and the interbank short
position has been reduced.
-140
-120
-100
-80
-60
-40
-20
0
20
40
60
Jun-06 Sep-06 Dec-06 Mar-07 Jun-07
TOTAL DEPOSIT INSTITUTIONS
SPANISH DEPOSIT INSTITUTIONS
FOREIGN DEPOSIT INSTITUTIONS
€ bn
B. INTERBANK POSITION
-10
-5
0
5
10
15
2005 2007 2005 2007 2005 2007 2005 2007
UP TO 1 MONTH
1-12 MONTHS
1-5 YEARS
OVER 5 YEARS AND UNDETERMINED
%
A. LIQUIDITY GAPS BY MATURITY AS
A PERCENTAGE OF TOTAL ASSETS
LIQUIDITY AND INTERBANK POSITIONS (a)
Deposit institutions. ID
CHART 2.8
SOURCE: Banco de España.
a. A negative (positive) value indicates net borrowing (lending).
11. Assets up to one month include, in addition to items maturing in this period, total cash and balances with central
banks, debt securities, equity instruments included in financial assets held for trading, other financial assets at fair value
through profit or loss, and quoted available-for-sale financial assets. Liabilities up to one month include total deposits
from central banks and, as an assumption, 25% of sight deposits. The other 75% is classified as undefined maturity, due
to the stability of these deposits.

BANCO DE ESPAÑA 34 FINANCIAL STABILITY REPORT, NOVEMBER 2007
favourable financial market conditions in the first half of the year (abundant liquidity and very
low risk premiums). Although some wholesale markets were still not showing clear signs of
recovery at the end of September 2007, others were functioning without excessive friction.
Thus Spanish institutions are not finding it difficult to issue in the international short-term note
market.
In line with the trends noted in previous FSRs, the income statement of Spanish deposit insti-
tutions disclosed a sound position in the first half of the current year. This soundness was evi-
denced in the notable increase in group net income, which grew by 25.6% (Table 2.2). As a
result, the return on assets (ROA) before (after) tax stood at 1.46% (1.11%), rising in both
cases by 9 bp with respect to the same period of 2006. The return on equity (ROE), also im-
proved on the previous year, moving up from 19.8% to 21.4% in June 2007, well above the
return on Spanish long-term debt. This favourable performance of ROE was widespread
(Chart 2.9.A). The improved ROE performance of Spanish deposit institutions was based,
above all, on their greater operating efficiency (Chart 2.9.B)12.
The strength of the income statement was evident in the behaviour of the three main operating
margins, which showed a positive dynamic not only in their rates of change, but also in terms
of average total assets (Chart 2.10.A). Thus net interest income posted an increase of 20.2%,
rising by 7 bp relative to average total assets from June 2006 (to 1.83%). The favourable per-
formance of net interest income is driven by the strong behaviour of financial revenue and, in
particular, against a background of lending growth, of that from customer lending. The rise in
financial revenue offset the increase in financial costs, which was sharpest in trading securities
and also in customer deposits, the latter as a result of the effort made by institutions to step
up their funding from this type of product. In a setting of growing interest rates, the spread
between marginal lending and deposit rates remained practically unchanged, so the addi-
tional pressure on the funding side was able to be offset by similar increases on the lending
side (Chart 2.10.B).
The buoyancy of net interest income passed through to gross income, which grew by 19%
(to 3.16% of ATA, up 9 bp on June 2006). The most buoyant component of gross income
was gains and losses on financial assets and liabilities, the growth of which is explained by
the improved behaviour of gains on trading book securities and by the sale of holdings by
certain institutions. The growth of net gains on financial assets and liabilities offset the less
vigorous behaviour by the share of profit or loss of investees and by commissions, the latter
growing by 13.4%, nearly 3 pp less than in the previous year. In fact, compared with the
growth of activity, that of commissions was down by 1 bp. The lesser buoyancy of commis-
sions was attributable to those for collection and payment services, which posted growth
of 6.5%. This moderation in the growth of such commissions, which was more marked in
business in Spain, is related to the more intense competition between institutions. Mean-
while, commissions from the provision of securities services and from the marketing of
non-bank financial products were somewhat more buoyant, growing by 14% against a
background of favourable financial market performance, at least in the first half of the
year.
Operating expenses held on the moderating growth trend observed in previous FSRs. This
moderation in their growth (7.6%, nearly 2 pp less than in June 2006) accounts for the drop in
terms of average total assets. By component, staff costs increased somewhat less than over-
heads (7.4% against 8%). In any event, the effort to keep operating expenses at moderate
2.1.2 PROFITABILITY
Deposit institutions reported
higher profitability…
2.1.2 PROFITABILITY
Deposit institutions reported
higher profitability…
… based on the strong
performance of all their
operating margins…
… based on the strong
performance of all their
operating margins…
… and on efficiency gains…… and on efficiency gains…
12. See Box II.1 of the May 2004 FSR for a detailed explanation of the breakdown of ROE.

BANCO DE ESPAÑA 35 FINANCIAL STABILITY REPORT, NOVEMBER 2007
levels of growth, along with the favourable performance of gross income, enabled the effi-
ciency ratio to improve further from 49.4% in June 2006 to 44.7% in 2007. This improvement
was across-the-board in all institutions (Chart 2.11.A). As noted in previous FSRs, a part of the
efficiency gains derives from the expansionary behaviour of activity, so a slowdown in activity
JUN-07 JUN-06 JUN-07
€m
(% CHANGE)
JUN. 07-
JUN. 06
% ATA % ATA
Financial revenue 67,639 35.4 4.13 4.82
Financial costs 42,015 46.7 2.37 3.00
Net interest income 25,624 20.2 1.76 1.83
Share of profit or loss of entities accounted
for using the equity method
2,132 3.4 0.17 0.15
Net commissions 11,034 13.4 0.80 0.79
Gains and losses on financial assets and liabilities 5,542 33.5 0.34 0.40
Gross income 44,332 19.0 3.07 3.16
Operating expenses 19,793 7.6 1.52 1.41
Other operating income 682 -14.3 0.07 0.05
Net operating income 25,221 28.3 1.62 1.80
Asset impairment losses 5,198 34.9 0.32 0.37
Provisioning expense (net) 1,046 26.8 0.07 0.07
Other income (net) 1,454 -4.3 0.13 0.11
Profit before tax 20,431 23.8 1.36 1.46
Net income 16,184 23.3 1.09 1.15
Memorandum item:
Group net income 15,529 25.6 1.02 1.11
INCOME STATEMENT
Deposit Institutions
TABLE 2.2
SOURCE: Banco de España.
-6
-4
-2
0
2
4
6
8
10
12
14
JUN-07
RISK PROFILE
PRODUCTIVITY OF RISK-ADJUSTED ASSETS
COMPOSITION OF REGULATORY CAPITAL
LEVERAGE
EFFICIENCY
PROVISIONS AND OTHER
%
B. BREAKDOWN OF THE RATE OF CHANGE
OF ROE
-4 0 4 9 13 17 21 25 29 33 37 41
JUNE 2006
JUNE 2007
A. DISTRIBUTION OF NUMBER
OF INSTITUTIONS BY THEIR ROE
DISTRIBUTION BY ROE AND FACTORS INVOLVED IN ITS RATE OF CHANGE
Deposit institutions
CHART 2.9
SOURCE: Banco de España.

BANCO DE ESPAÑA 36 FINANCIAL STABILITY REPORT, NOVEMBER 2007
could adversely affect this indicator. Institutions should be prepared for this eventuality and
take into account that they may have to tighten their cost control.
Accordingly, the strong performance of gross income, along with the moderate increase in
operating expenses, gave rise to growth in net operating income of 28.3%, an improvement of
18 bp in terms of average total assets. The contribution to the growth of net operating income
(Chart 2.11.B) is basically thanks to the favourable performance of net interest income and to
the containment of the growth of operating expenses, the relative weight of which has been
declining over time. The former evidences the continuing significant role of traditional retail
banking in the business of Spanish deposit institutions, as a result of which their ability to
generate recurring income is not so closely linked to financial market operations more typical
of investment banking.
Asset impairment losses, substantially all of which can be attributed to lending, grew by 35%
with respect to the previous year, partly due to increased doubtful assets and, to a greater
extent, due to the still-high buoyancy of lending, which led to increases in general provisions
because the system of recognising asset impairment losses in Spain is counter-cyclical. This,
together with an increase in provisioning expenses, which grew by 26.8%, resulted in net
operating income being reduced by 24.8%, which was a similar proportion to that in June
2006. Finally, despite other profit figures falling slightly, the profit before tax showed notable
growth, both in absolute terms (23.8%) and in relative terms (9 bp, to 1.46% of average total
assets).
If financial market turbulence were prolonged in time and wholesale markets were only willing
to purchase bank instruments (particularly asset-backed bonds and covered bonds) with a
significantly higher spread, or if institutions decided to compete more intensely to attract tradi-
… the ability to generate
recurring income being
closely linked to retail
banking activity.
… the ability to generate
recurring income being
closely linked to retail
banking activity.
The resilience of the income
statement to persistent
financial market turbulence
is high.
The resilience of the income
statement to persistent
financial market turbulence
is high.
0
1
2
3
4
5
6
Jan-03 Jan-04 Jan-05 Jan-06 Jan-07
ASSETS
LIABILITIES
SPREAD
OVERNIGHT INTERBANK
%
B. WEIGHTED MARGINAL INTEREST RATES (a)
0
0.5
1
1.5
2
2.5
3
3.5
Jun-05 Dec-05 Jun-06 Dec-06 Jun-07
NET INTEREST INCOME
GROSS INCOME
NET OPERATING INCOME
%
A. OPERATING INCOME ITEMS
AS A PERCENTAGE OF ATA
OPERATING INCOME ITEMS AS A PERCENTAGE
OF ATA AND MARGINAL INTEREST RATES
Deposit Institutions
CHART 2.10
SOURCE: Banco de España.
a. These rates are those established in transactions initiated or renewed during
the month prior to that of reference, such transactions being weighted by their volume.
The asset-weighted marginal rates include, inter alia, those applied to house
and consumer finance and credit to non-financial corporations, while the liabilities
ones include, inter alia, fixed-term deposits and repos.
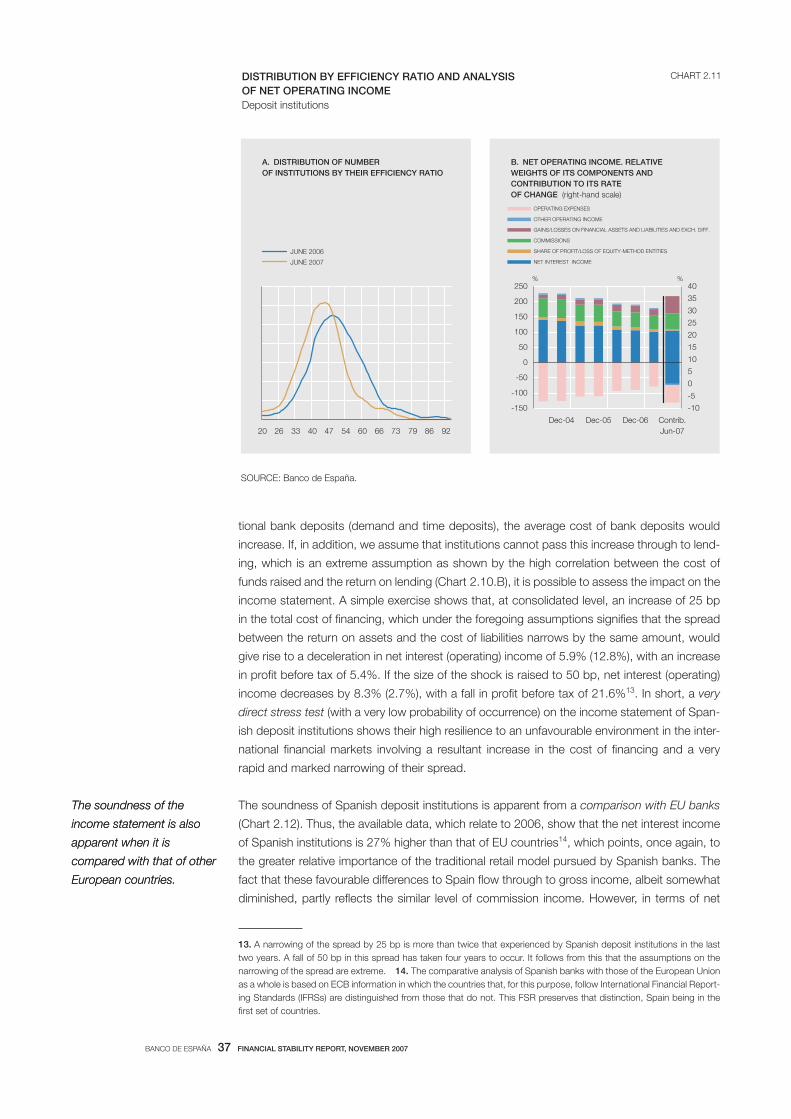
BANCO DE ESPAÑA 37 FINANCIAL STABILITY REPORT, NOVEMBER 2007
tional bank deposits (demand and time deposits), the average cost of bank deposits would
increase. If, in addition, we assume that institutions cannot pass this increase through to lend-
ing, which is an extreme assumption as shown by the high correlation between the cost of
funds raised and the return on lending (Chart 2.10.B), it is possible to assess the impact on the
income statement. A simple exercise shows that, at consolidated level, an increase of 25 bp
in the total cost of financing, which under the foregoing assumptions signifies that the spread
between the return on assets and the cost of liabilities narrows by the same amount, would
give rise to a deceleration in net interest (operating) income of 5.9% (12.8%), with an increase
in profit before tax of 5.4%. If the size of the shock is raised to 50 bp, net interest (operating)
income decreases by 8.3% (2.7%), with a fall in profit before tax of 21.6%13. In short, a very
direct stress test (with a very low probability of occurrence) on the income statement of Span-
ish deposit institutions shows their high resilience to an unfavourable environment in the inter-
national financial markets involving a resultant increase in the cost of financing and a very
rapid and marked narrowing of their spread.
The soundness of Spanish deposit institutions is apparent from a comparison with EU banks
(Chart 2.12). Thus, the available data, which relate to 2006, show that the net interest income
of Spanish institutions is 27% higher than that of EU countries14, which points, once again, to
the greater relative importance of the traditional retail model pursued by Spanish banks. The
fact that these favourable differences to Spain flow through to gross income, albeit somewhat
diminished, partly reflects the similar level of commission income. However, in terms of net
The soundness of the
income statement is also
apparent when it is
compared with that of other
European countries.
The soundness of the
income statement is also
apparent when it is
compared with that of other
European countries.
20 26 33 40 47 54 60 66 73 79 86 92
JUNE 2006
JUNE 2007
A. DISTRIBUTION OF NUMBER
OF INSTITUTIONS BY THEIR EFFICIENCY RATIO
-150
-100
-50
0
50
100
150
200
250
Contrib.
Jun-07
Dec-06Dec-05Dec-04
-10
-5
0
5
10
15
20
25
30
35
40
OPERATING EXPENSES
OTHER OPERATING INCOME
GAINS/LOSSES ON FINANCIAL ASSETS AND LIABILITIES AND EXCH. DIFF.
COMMISSIONS
SHARE OF PROFIT/LOSS OF EQUITY-METHOD ENTITIES
NET INTEREST INCOME
%%
B. NET OPERATING INCOME. RELATIVE
WEIGHTS OF ITS COMPONENTS AND
CONTRIBUTION TO ITS RATE
OF CHANGE (right-hand scale)
DISTRIBUTION BY EFFICIENCY RATIO AND ANALYSIS
OF NET OPERATING INCOME
Deposit institutions
CHART 2.11
SOURCE: Banco de España.
13. A narrowing of the spread by 25 bp is more than twice that experienced by Spanish deposit institutions in the last
two years. A fall of 50 bp in this spread has taken four years to occur. It follows from this that the assumptions on the
narrowing of the spread are extreme. 14. The comparative analysis of Spanish banks with those of the European Union
as a whole is based on ECB information in which the countries that, for this purpose, follow International Financial Report-
ing Standards (IFRSs) are distinguished from those that do not. This FSR preserves that distinction, Spain being in the
first set of countries.
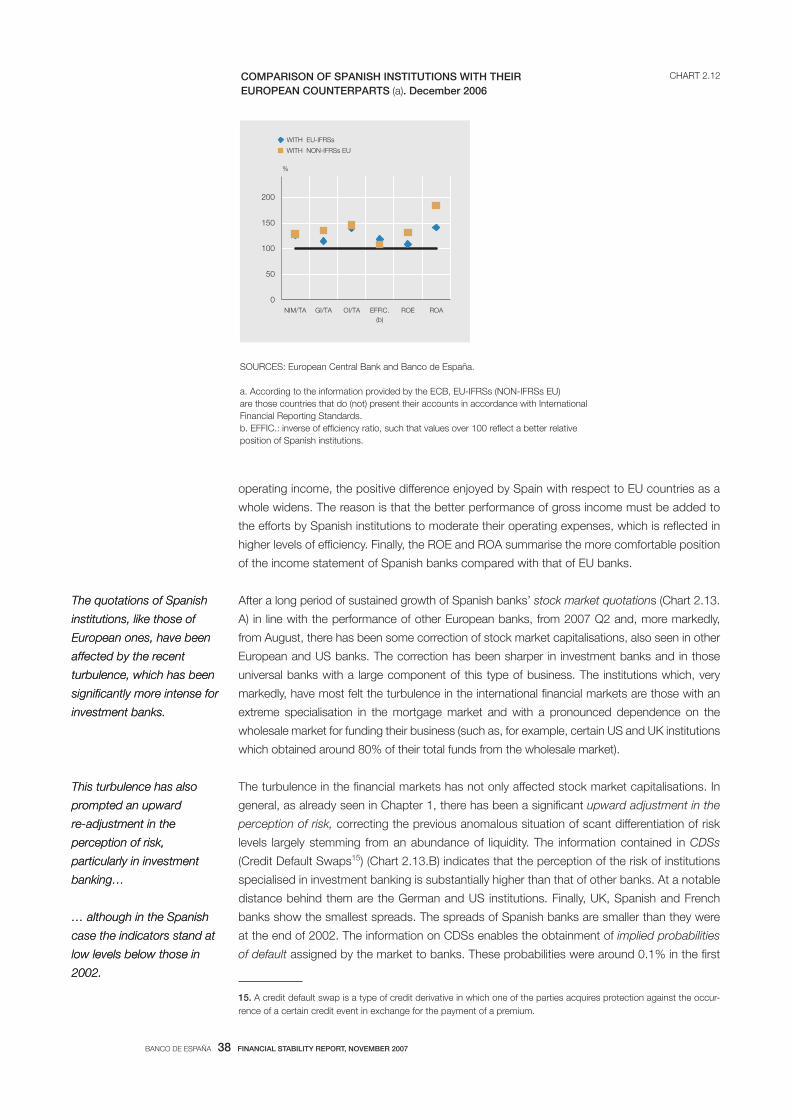
BANCO DE ESPAÑA 38 FINANCIAL STABILITY REPORT, NOVEMBER 2007
operating income, the positive difference enjoyed by Spain with respect to EU countries as a
whole widens. The reason is that the better performance of gross income must be added to
the efforts by Spanish institutions to moderate their operating expenses, which is reflected in
higher levels of efficiency. Finally, the ROE and ROA summarise the more comfortable position
of the income statement of Spanish banks compared with that of EU banks.
After a long period of sustained growth of Spanish banks’ stock market quotations (Chart 2.13.
A) in line with the performance of other European banks, from 2007 Q2 and, more markedly,
from August, there has been some correction of stock market capitalisations, also seen in other
European and US banks. The correction has been sharper in investment banks and in those
universal banks with a large component of this type of business. The institutions which, very
markedly, have most felt the turbulence in the international financial markets are those with an
extreme specialisation in the mortgage market and with a pronounced dependence on the
wholesale market for funding their business (such as, for example, certain US and UK institutions
which obtained around 80% of their total funds from the wholesale market).
The turbulence in the financial markets has not only affected stock market capitalisations. In
general, as already seen in Chapter 1, there has been a significant upward adjustment in the
perception of risk, correcting the previous anomalous situation of scant differentiation of risk
levels largely stemming from an abundance of liquidity. The information contained in CDSs
(Credit Default Swaps15) (Chart 2.13.B) indicates that the perception of the risk of institutions
specialised in investment banking is substantially higher than that of other banks. At a notable
distance behind them are the German and US institutions. Finally, UK, Spanish and French
banks show the smallest spreads. The spreads of Spanish banks are smaller than they were
at the end of 2002. The information on CDSs enables the obtainment of implied probabilities
of default assigned by the market to banks. These probabilities were around 0.1% in the first
The quotations of Spanish
institutions, like those of
European ones, have been
affected by the recent
turbulence, which has been
significantly more intense for
investment banks.
The quotations of Spanish
institutions, like those of
European ones, have been
affected by the recent
turbulence, which has been
significantly more intense for
investment banks.
This turbulence has also
prompted an upward
re-adjustment in the
perception of risk,
particularly in investment
banking…
… although in the Spanish
case the indicators stand at
low levels below those in
2002.
This turbulence has also
prompted an upward
re-adjustment in the
perception of risk,
particularly in investment
banking…
… although in the Spanish
case the indicators stand at
low levels below those in
2002.
0
50
100
150
200
NIM/TA GI/TA OI/TA EFFIC.
(b)
ROE ROA
WITH EU-IFRSs
WITH NON-IFRSs EU
%
COMPARISON OF SPANISH INSTITUTIONS WITH THEIR
EUROPEAN COUNTERPARTS (a). December 2006
CHART 2.12
SOURCES: European Central Bank and Banco de España.
a. According to the information provided by the ECB, EU-IFRSs (NON-IFRSs EU)
are those countries that do (not) present their accounts in accordance with International
Financial Reporting Standards.
b. EFFIC.: inverse of efficiency ratio, such that values over 100 reflect a better relative
position of Spanish institutions.
15. A credit default swap is a type of credit derivative in which one of the parties acquires protection against the occur-
rence of a certain credit event in exchange for the payment of a premium.

BANCO DE ESPAÑA 39 FINANCIAL STABILITY REPORT, NOVEMBER 2007
half of 2007 for the large European and US banks and, when the uncertainty and lack of mar-
ket confidence were precipitated at the beginning of August, they rose significantly (to around
0.4%), and even more so in investment banks (to somewhat above 1%).
As regards the other market indicators for the large Spanish banks, the implied volatilities have
increased, although the levels reached are well below the highs of 2002. The beta, a measure
of non-diversifiable risk, is around 1.3, i.e. an intermediate level, whereas the ratio of market
value to book value (Tobin’s q ratio) continues to be among the highest (in June 2007 it was
2.5).
During the first half of 2007 Spanish deposit institutions maintained a high level of own funds
that enabled them comfortably to exceed the regulatory requirements under both Spanish and
Basel rules. The solvency ratio, calculated on the basis of Spanish requirements, is very sound,
standing for the third year running at 10.6% (Chart 2.14.A). The decline in the tier 1 ratio has
been checked, having fallen by only 2 bp, whereby it accounts for 6.9% of risk-weighted as-
sets. The solvency ratio calculated under the Basel rules has declined by 21 bp to 11.8%, i.e.
almost 50% above the minimum required level.
The favourable course of the economy during the first half of 2007, at both the domestic and
international levels, explains the 17.2% growth in risk-weighted assets. Compared with the
dynamism shown by this figure, the comparison with the previous year shows a slowdown of
3 pp. In particular, credit has continued to be the driving force behind the banking business,
although the slowdown in house mortgage loans and the growth of exposure to sectors with
a lower weighting have prompted a 42 bp reduction in the risk profile of deposit institutions
(the ratio of risk-weighted assets to total assets) to 66.1%, following several years of continu-
ous increases (Chart 2.14.B).
Total capital has run parallel to requirements. Thus, although they continue to grow at a sound
pace (17.7%), they have slowed by 2.6 pp. The strong acceleration in tier 1 capital, which has
posted an increase of 16.8%, and a considerable slowdown in tier 2 capital (61 pp) account
2.1.3 SOLVENCY
Solvency levels remain
comfortably above the
regulatory minimum
requirements.
2.1.3 SOLVENCY
Solvency levels remain
comfortably above the
regulatory minimum
requirements.
In line with the increase in
activity, requirements are
growing although the risk
profile of institutions has
lessened.
In line with the increase in
activity, requirements are
growing although the risk
profile of institutions has
lessened.
Own funds, principally
driven by tier 1 capital, are
growing in line with
requirements...
Own funds, principally
driven by tier 1 capital, are
growing in line with
requirements...
0.0
0.2
0.4
0.6
0.8
1.0
1.2
1.4
1.6
Jan-07 Mar-07 May-07 Jul-07 Sep-07
GERMANY
UNITED STATES
FRANCE
UNITED KINGDOM
INVESTMENT BANKS
SPAIN
%
B. CREDIT DEFAULT SWAPS
50
100
150
200
250
300
Jan-03 Jan-04 Jan-05 Jan-06 Jan-07
SPAIN-DS BANKS
DJ EURO STOXX BANKS
S&P 500 BANKS
1.1.2003 = 100
A. STOCK EXCHANGE INDICES OF BANKS
STOCK EXCHANGE INDICES OF BANKS AND CREDIT DEFAULT SWAPS CHART 2.13
SOURCES: Datastream and Banco de España.

BANCO DE ESPAÑA 40 FINANCIAL STABILITY REPORT, NOVEMBER 2007
for this behaviour. Lower deductions have also contributed positively to the change in own
funds.
The acceleration in tier 1 capital by over 7 pp was prompted by the growth in reserves (21.3%).
The sound banking performance during the first half of the year, along with the growth of pref-
erence shares (22.2%), which account for 14% of reserves, lie behind this (Chart 2.15.A).
Goodwill increased by 16.5%, while losses in consolidated firms rose, although their weight
continues to be very low.
Tier 2 capital grew by only 9.8%, following its strong increase in 2006. Its main component,
subordinated debt, slowed by somewhat more than 11 pp, posting growth of 5.7%. Gains on
investments in shares meant that asset revaluation reserves grew by 8.5%. The increase in
general provisions as a result of the growth in credit and of low default rates has provided for
a bigger increase in own funds (Chart 2.15.B).
Finally, and in line with the last FSR, deductions from own funds fell by 26.9%, driven by divest-
ments of insurance companies.
The solvency levels of Spanish deposit institutions are similar to those of the EU16 countries as
a whole. This is the case both for the total solvency ratio and the tier 1 ratio (Chart 2.16.A).
Although the data revealed that solvency levels tend to be slightly below the EU average, it
should be borne in mind that in Spain, in recent years, activity has been most buoyant and has
pushed capital requirements up. Further, the solvency levels of Spanish institutions are com-
Solvency ratios stand at the
average EU level, while
doubtful assets ratios in
Spain are significantly
lower…
Solvency ratios stand at the
average EU level, while
doubtful assets ratios in
Spain are significantly
lower…
0
10
20
30
40
50
60
70
Jun-04 Jun-05 Jun-06 Jun-07
100%
50%
20%
10%
0%
%
B. CONTRIBUTION TO THE RISK PROFILE
OF THE ASSETS UNDER RISK-BASED
CAPITAL REQUIREMENTS (a)
6
7
8
9
10
11
12
13
14
Jun-02 Jun-03 Jun-04 Jun-05 Jun-06 Jun-07
SPANISH SOLVENCY RATIO
SPANISH TIER 1 RATIO
BIS SOLVENCY RATIO
%
A. SOLVENCY RATIOS UNDER SPANISH
AND BASEL RULES
AGGREGATE SOLVENCY RATIOS AND RISK PROFILE
Deposit institutions
CHART 2.14
SOURCE: Banco de España.
a. The risk profile is the ratio of risk-weighted assets to total assets.
16. As earlier indicated in the section analysing the profitability of Spanish deposit institutions, the data used for interna-
tional comparison are from the ECB, and a distinction is drawn between countries that follow IFRSs and those that do
not. It should be recalled that the latest data available refer to 2006.

BANCO DE ESPAÑA 41 FINANCIAL STABILITY REPORT, NOVEMBER 2007
fortably above the regulatory requirements. Finally, the doubtful assets ratio for the Spanish
banking system is very low, clearly below the EU average.
In Spain, prudential regulations place particular emphasis on the need for institutions to make
proper provision for credit risk, both that incurred and individually identified in specific transac-
tions (specific provisions) and that incurred but not yet identified (general provisions). The conflu-
ence of credit risk over the course of the cycle with this prudential approach make for ample
coverage of doubtful assets through existing loan loss provisions. Drawing on data from institu-
tions’ individual financial statements, such provisioning is somewhat more than 2.5 times the
amount of doubtful assets in June 2007 or, expressed otherwise, even if defaults were to double,
institutions have, at the aggregate level, provisions set aside to cover this increase, without any
additional impact on earnings for the year (Chart 2.16.B). What is more, specific provisions as at
June 2007 alone covered almost half of the total of doubtful assets. At the consolidated level,
provisioning is also high (212% in June 2007), with a very similar breakdown between specific
and general provisions17. Finally, the Spanish experience has highlighted the fact that loss given
default (LGD) in the segment of credit to households for house purchases is very low. Institutions,
through the execution and subsequent sale of the guarantee (the house being financed) gener-
ally recoup a very high portion of the amount owed. Accordingly, a specific provision for, say, half
of the doubtful amount affords a very high degree of protection to institutions. That is to say, cur-
rent provisioning levels could absorb at least fivefold growth in the present default levels.
Drawing on CCR figures, a model has been constructed to estimate the distribution of Spanish
deposit institutions’ credit risk losses on the basis of historical data on loans granted by these
institutions in the past two decades. By means of this model, an analysis has been made of
… and the provisioning for
doubtful assets is very high.
… and the provisioning for
doubtful assets is very high.
Stress tests show the
considerable capacity of
Spanish institutions to
withstand adverse scenarios
through their provisions and
their own funds…
Stress tests show the
considerable capacity of
Spanish institutions to
withstand adverse scenarios
through their provisions and
their own funds…
-30
-20
-10
0
10
20
30
40
50
Jun-05 Jun-06 Jun-07
-40
-20
0
20
40
60
80
100
120
140
OTHER
LOSSES AT CCs
GOODWILL AND OTHER INTANGIBLE ASSETS
RESERVES AT CCs
RESERVES AND PREF. SHARES
CAPITAL
RATE OF CHANGE
%%
A. CONTRIBUTION TO RATE OF CHANGE
AND COMPOSITION (right-hand scale)
OF TIER 1 CAPITAL
COMPOSITION
Jun-07
-10
0
10
20
30
40
50
60
70
80
Jun-05 Jun-06 Jun-07
-15
0
15
30
45
60
75
90
105
120
OTHER
EXCESS OVER 50%
DEDUCTIONS
GENERAL CREDIT LOSS PROVISION
SUB. DEBT AND NON-VOTING CAPITAL STOCK
WELFARE FUNDS
REVALUATION RESERVES
RATE OF CHANGE
%%
B. CONTRIBUTION TO RATE OF CHANGE
AND COMPOSITION (right-hand scale)
OF TIER 2 CAPITAL
COMPOSITION
Jun-07
CAPITAL
Deposit institutions
CHART 2.15
SOURCE: Banco de España.
17. Logically, insofar as general provisions are progressively used, these will cease to qualify as tier 2 capital. In any event,
there is currently a surplus of general provisions not eligible as tier 2 capital of 29%. The sum of this non-eligible surplus
and cumulative specific provisions cover 94% of doubtful assets as at June 2007.
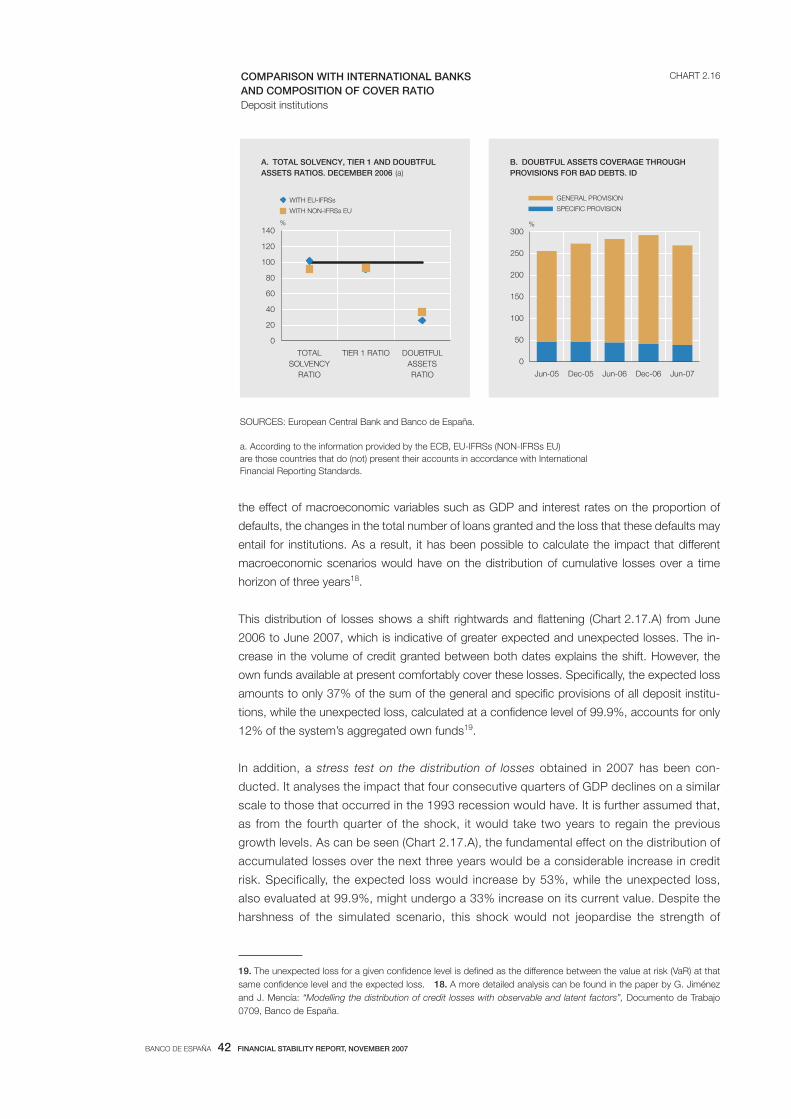
BANCO DE ESPAÑA 42 FINANCIAL STABILITY REPORT, NOVEMBER 2007
the effect of macroeconomic variables such as GDP and interest rates on the proportion of
defaults, the changes in the total number of loans granted and the loss that these defaults may
entail for institutions. As a result, it has been possible to calculate the impact that different
macroeconomic scenarios would have on the distribution of cumulative losses over a time
horizon of three years18.
This distribution of losses shows a shift rightwards and flattening (Chart 2.17.A) from June
2006 to June 2007, which is indicative of greater expected and unexpected losses. The in-
crease in the volume of credit granted between both dates explains the shift. However, the
own funds available at present comfortably cover these losses. Specifically, the expected loss
amounts to only 37% of the sum of the general and specific provisions of all deposit institu-
tions, while the unexpected loss, calculated at a confidence level of 99.9%, accounts for only
12% of the system’s aggregated own funds19.
In addition, a stress test on the distribution of losses obtained in 2007 has been con-
ducted. It analyses the impact that four consecutive quarters of GDP declines on a similar
scale to those that occurred in the 1993 recession would have. It is further assumed that,
as from the fourth quarter of the shock, it would take two years to regain the previous
growth levels. As can be seen (Chart 2.17.A), the fundamental effect on the distribution of
accumulated losses over the next three years would be a considerable increase in credit
risk. Specifically, the expected loss would increase by 53%, while the unexpected loss,
also evaluated at 99.9%, might undergo a 33% increase on its current value. Despite the
harshness of the simulated scenario, this shock would not jeopardise the strength of
0
20
40
60
80
100
120
140
TOTAL
SOLVENCY
RATIO
TIER 1 RATIO DOUBTFUL
ASSETS
RATIO
WITH EU-IFRSs
WITH NON-IFRSs EU
%
A. TOTAL SOLVENCY, TIER 1 AND DOUBTFUL
ASSETS RATIOS. DECEMBER 2006 (a)
0
50
100
150
200
250
300
Jun-05 Dec-05 Jun-06 Dec-06 Jun-07
GENERAL PROVISION
SPECIFIC PROVISION
%
B. DOUBTFUL ASSETS COVERAGE THROUGH
PROVISIONS FOR BAD DEBTS. ID
COMPARISON WITH INTERNATIONAL BANKS
AND COMPOSITION OF COVER RATIO
Deposit institutions
CHART 2.16
SOURCES: European Central Bank and Banco de España.
a. According to the information provided by the ECB, EU-IFRSs (NON-IFRSs EU)
are those countries that do (not) present their accounts in accordance with International
Financial Reporting Standards.
19. The unexpected loss for a given confidence level is defined as the difference between the value at risk (VaR) at that
same confidence level and the expected loss. 18. A more detailed analysis can be found in the paper by G. Jiménez
and J. Mencía: “Modelling the distribution of credit losses with observable and latent factors”, Documento de Trabajo
0709, Banco de España.

BANCO DE ESPAÑA 43 FINANCIAL STABILITY REPORT, NOVEMBER 2007
Spanish institutions, since the own funds they have accumulated would be capable of
comfortably absorbing the increase in credit risk losses in the business in Spain. In par-
ticular, the expected loss in this stress test scenario would only amount to 57% of the sum
of the general and specific provisions, while the unexpected loss would only be 16% of
own funds.
The combination of exposure to the external sector, in terms of financial assets located outside
Spain (chiefly loans and fixed-income securities, both to the private and public sectors), with
the attendant default probability allows a ceiling to be obtained for expected losses in business
abroad. These foreign assets of Spanish deposit institutions have scarcely changed in the past
year. The favourable performance of the world economy and, in particular, of those regions in
which Spanish banks operate (Latin America, Western Europe, Eastern Europe and the United
States) means that it has been possible to maintain very low default probabilities for foreign
assets (close to zero for public debt and below 2% in financing to the private sector). As a
result of this, risk exposure (maximum expected loss on foreign assets, without including pos-
sible recoveries) stood in June 2007 at 4.23% of own funds, the lowest level this decade
(Chart 2.17.B).
Despite the high relative weight of credit institutions in the Spanish financial system
(Chart 2.18.A), the monitoring of other financial intermediaries is needed to complete the
analysis of financial stability. The total assets of Spanish insurance companies grew by
7.2% in 2006 to €206 billion. As mentioned in the previous FSR, the balance-sheet struc-
ture of Spanish insurance companies shows a high proportion (slightly over 50%) of their
assets to be in fixed-income investments, while equities account for a relatively very low
weight (around 5%). Unit-linked policies, in which the policyholder assumes the risk of the
investment, grew by 17.5%, representing somewhat more than 5% of the sector’s total
assets.
… while expected losses on
foreign financial assets are
at minimum levels.
… while expected losses on
foreign financial assets are
at minimum levels.
2.2 Other financial
market participants
2.2.1 INSURANCE COMPANIES
2.2 Other financial
market participants
2.2.1 INSURANCE COMPANIES
0
5
10
15
20
25
30
Jun-00 Jun-02 Jun-04 Jun-06
LATIN AMERICA
UNITED KINGDOM
OTHER EU-15 COUNTRIES
OTHER COUNTRIES
UNITED STATES
%
B. RATIO OF RISK EXPOSURE OF FINANCIAL
ASSETS ABROAD TO OWN FUNDS (b)
0 10,000 20,000 30,000 40,000 50,000
JUNE 2006
JUNE 2007
JUNE 2007 STRESS TEST
€m
A. LOSS DISTRIBUTION (a)
EL (2006)
EL (2007)
EL (2007)
STRESS
VaR (2006)
VaR (2007) VaR (2007)
STRESS
RESILIENCE OF BANKING INSTITUTIONS
Deposit institutions
CHART 2.17
SOURCE: Banco de España.
a. EL: expected loss; VaR: value at risk.
b. Risk exposure: maximum expected loss when recoveries are not considered.
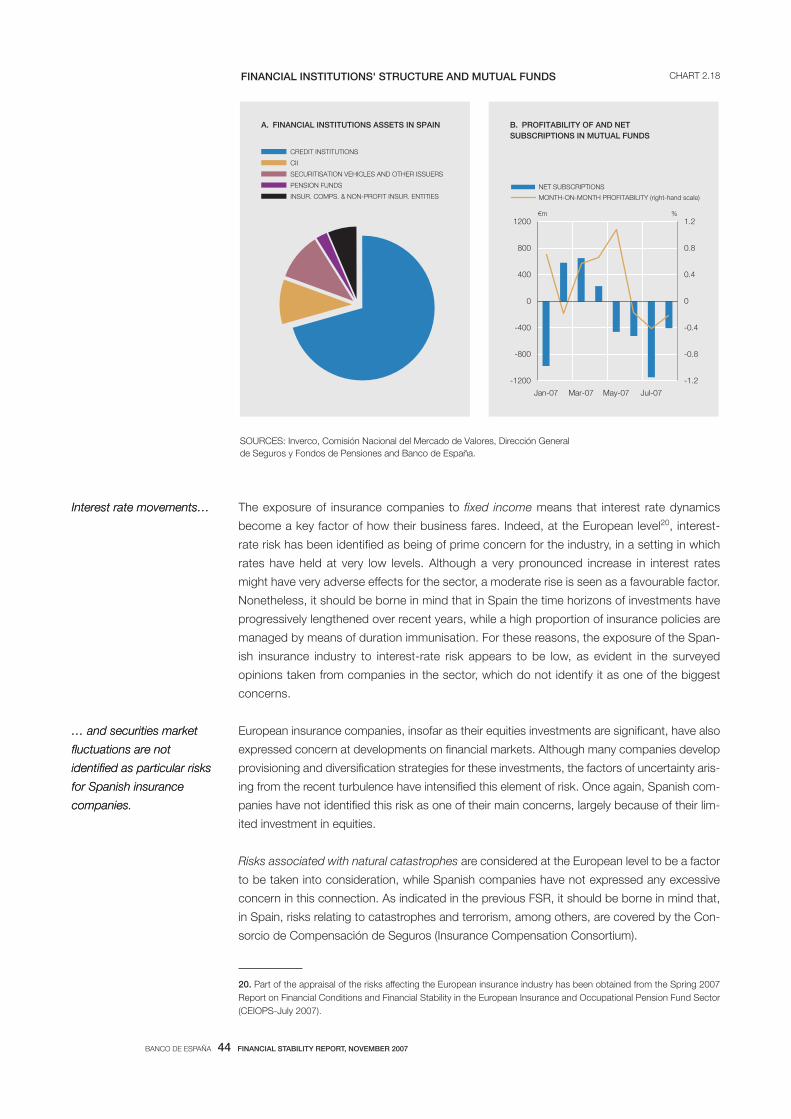
BANCO DE ESPAÑA 44 FINANCIAL STABILITY REPORT, NOVEMBER 2007
The exposure of insurance companies to fixed income means that interest rate dynamics
become a key factor of how their business fares. Indeed, at the European level20, interest-
rate risk has been identified as being of prime concern for the industry, in a setting in which
rates have held at very low levels. Although a very pronounced increase in interest rates
might have very adverse effects for the sector, a moderate rise is seen as a favourable factor.
Nonetheless, it should be borne in mind that in Spain the time horizons of investments have
progressively lengthened over recent years, while a high proportion of insurance policies are
managed by means of duration immunisation. For these reasons, the exposure of the Span-
ish insurance industry to interest-rate risk appears to be low, as evident in the surveyed
opinions taken from companies in the sector, which do not identify it as one of the biggest
concerns.
European insurance companies, insofar as their equities investments are significant, have also
expressed concern at developments on financial markets. Although many companies develop
provisioning and diversification strategies for these investments, the factors of uncertainty aris-
ing from the recent turbulence have intensified this element of risk. Once again, Spanish com-
panies have not identified this risk as one of their main concerns, largely because of their lim-
ited investment in equities.
Risks associated with natural catastrophes are considered at the European level to be a factor
to be taken into consideration, while Spanish companies have not expressed any excessive
concern in this connection. As indicated in the previous FSR, it should be borne in mind that,
in Spain, risks relating to catastrophes and terrorism, among others, are covered by the Con-
sorcio de Compensación de Seguros (Insurance Compensation Consortium).
Interest rate movements…Interest rate movements…
… and securities market
fluctuations are not
identified as particular risks
for Spanish insurance
companies.
… and securities market
fluctuations are not
identified as particular risks
for Spanish insurance
companies.
CREDIT INSTITUTIONS
CII
SECURITISATION VEHICLES AND OTHER ISSUERS
PENSION FUNDS
INSUR. COMPS. & NON-PROFIT INSUR. ENTITIES
A. FINANCIAL INSTITUTIONS ASSETS IN SPAIN
-1200
-800
-400
0
400
800
1200
Jan-07 Mar-07 May-07 Jul-07
-1.2
-0.8
-0.4
0
0.4
0.8
1.2
NET SUBSCRIPTIONS
MONTH-ON-MONTH PROFITABILITY (right-hand scale)
%€m
B. PROFITABILITY OF AND NET
SUBSCRIPTIONS IN MUTUAL FUNDS
FINANCIAL INSTITUTIONS' STRUCTURE AND MUTUAL FUNDS CHART 2.18
SOURCES: Inverco, Comisión Nacional del Mercado de Valores, Dirección General
de Seguros y Fondos de Pensiones and Banco de España.
20. Part of the appraisal of the risks affecting the European insurance industry has been obtained from the Spring 2007
Report on Financial Conditions and Financial Stability in the European Insurance and Occupational Pension Fund Sector
(CEIOPS-July 2007).

BANCO DE ESPAÑA 45 FINANCIAL STABILITY REPORT, NOVEMBER 2007
Common ground on the challenges and concerns facing the Spanish and European insurance
industries has been found mainly in four areas. First, the risk of longevity, inasmuch as this may
be increasing at a greater-than-expected pace, and underwriting risk, insofar as premiums are
not properly valued to cover all necessary contingencies. Further, the challenges entailed by
changes in the tax and regulatory framework are highlighted. Thus, from the tax standpoint,
some Spanish companies have stated that these changes might act in favour of deposit insti-
tutions, thereby stepping up the competition to capture savings. Finally, the regulatory chang-
es to which institutions are already adapting (IFRSs and Solvency II) also represent significant
challenges.
Spanish insurance companies have been evidencing robustness in their financial position and
their business in recent years. As regards the coverage of the solvency margin, the estimates
available for 2006 in the previous FSR appear to have been confirmed, standing at 189% for
life assurance and at 370% for the non-life branch.
Forecasts for the industry as regards business in 2007 indicate that this will be a good year.
This is suggested by the data available on premiums at the time of this FSR going to press. In
the first half of 2007, premiums in the life branch were estimated to have grown by 18.9%
year-on-year, while the related rate in the non-life branch was 5.8%. In the non-life segment,
the growth rates of premiums remained high in health and multi-risk insurance (9.3% and
9.1%, respectively). However, the multi-risk branch might feel the effects of its links to new
mortgage loans. Car insurance, where premiums in the first half of the year accounted for 40%
of the non-life branch, grew at a rate of 3.6% owing to the heightened competition in the sec-
tor. Nonetheless, one factor which might be bearing favourably on this business is the reduc-
tion in claims.
Since January 2007, the total assets of collective investment institutions (CIIs) have increased
by €5,898 million (1.75%) to €342,909 million. Within CIIs, the assets of mutual funds, which
account for 74.7% of the total, have increased by 0.69%. In the first eight months of the year,
the return on funds stood at 2.02%, with equity and balanced equity funds to the fore. As to
net share subscriptions, the result for the year to date is negative, especially in the last four
months, during which net redemptions of over €2,500 million have been recorded (Chart 2.18 B).
While it is probably still too early to assess the impact of the recent turbulence on interna-
tional financial markets, returns on mutual funds in July and August were negative, with net
redemptions of around €1,600 million.
Pension funds grew by 2.94% in the first six months of the year (13.7% year-on-year), exceed-
ing €83 billion. Association pension plans posted the highest growth (4.54%). Returns over the
past 12 months stand at over 8%.
Admittedly, net subscriptions to mutual funds in recent months have not been particularly
significant when viewed over a broad timespan; but they do highlight the challenges this type
of institution must face, in a setting in which deposit institutions will foreseeably step up com-
petition to capture household and corporate saving. Such competition is more readily provided
for by the personal income tax reform undertaken21, which has brought the taxes on these
types of products into line. This competition may be broadened if uncertainty persists on finan-
cial markets and if current and potential shareholders prefer saving strategies less tied to
market fluctuations. Moreover, it should be recalled that around 80% of the assets of mutual
Challenges arising from the
risk of longevity and of
underwriting have however
been identified…
… as have those relating to
tax and regulatory changes.
Challenges arising from the
risk of longevity and of
underwriting have however
been identified…
… as have those relating to
tax and regulatory changes.
Nonetheless, Spanish
companies have been
evidencing robustness …
Nonetheless, Spanish
companies have been
evidencing robustness …
… and the forecasts for the
industry this year are
favourable.
… and the forecasts for the
industry this year are
favourable.
2.2.2 OTHER FINANCIAL
MARKET PARTICIPANTS
Mutual fund assets have
increased slightly in the year
to date, with net
subscriptions declining…
2.2.2 OTHER FINANCIAL
MARKET PARTICIPANTS
Mutual fund assets have
increased slightly in the year
to date, with net
subscriptions declining…
… set against current
market conditions and
competition in the banking
sector to capture
customers.
… set against current
market conditions and
competition in the banking
sector to capture
customers.
21. The following Chapter explains this reform in greater detail.

BANCO DE ESPAÑA 46 FINANCIAL STABILITY REPORT, NOVEMBER 2007
funds in Spain and 50% of those of pension funds are managed by institutions linked to bank-
ing groups.
As regards private equity activities and, in particular, leveraged buy-outs (LBOs), one of the
financial market segments that had been most influenced by the abundance of liquidity22,
market sentiment has changed drastically compared with that noted in the previous FSR. The
turbulence unleashed during the summer has meant that much of the activity in this market
has diminished. Firstly, the availability of funds to finance this type of operation has declined
owing to liquidity tightness. Secondly, the major international banks involved in these opera-
tions focus, above all, on reducing the exposure in their balance sheets, in the face of the dif-
ficulties of syndicating or placing financing tranches to which they had committed (pipeline
risk), having counted on easy subsequent distribution against a background of abundant li-
quidity and a high appetite for risk. In this respect, it should be stressed that In this respect, for
the Spanish institutions that have participated in this type of activity, the level of risk retained in
relation to these operations is relatively small compared with the total volume. Finally, in line
with the reappraisal of risk on international markets, banks are being more cautious in these
operations which, until recently, entail very high leverage and few guarantees for the lender
banks. In sum, the volume of activity in this segment is expected to moderate significantly,
particularly for very large-scale operations.
Private equity activity has
been adversely affected by
liquidity tightness and by the
diminished appetite for risk.
Private equity activity has
been adversely affected by
liquidity tightness and by the
diminished appetite for risk.
22. Private equity is understood to encompass those activities in which a group of investors acquires a company with the
aim of restructuring it, making it more profitable and selling it on subsequently so as to gain a return on their investment.
Many private equity activities are conducted by substantially increasing the indebtedness of the acquired company (lever-
aged buy-outs).

BANCO DE ESPAÑA 47 FINANCIAL STABILITY REPORT, NOVEMBER 2007
3 Structural elements of the financial system
The recent turbulence on international financial markets, the impact on the interbank market
and the response of central banks have highlighted the significance of certain structural as-
pects relating to the collateral policy of central banks. At national level, the potential tightening
of deposit institutions’ financing conditions may lead these entities to compete more fiercely
with other financial intermediaries to capture household and corporate saving. Changes in
taxation on financial products may play a considerable role in such competition. These two
matters are analysed in this Chapter, which is devoted to the analysis of structural elements of
the financial system with a potential impact on financial stability.
Central banks should perform the functions entrusted to them efficiently. It is well known that
efficiency in the implementation of monetary policy and in the management of payment sys-
tems requires an appropriate collateral (guarantees) policy. The dislocations in financial mar-
kets in the second half of 2007 have, moreover, highlighted how crucial this policy is in a situ-
ation of turbulence.
Against this background of financial market tensions, one of the defining characteristics of an
appropriate collateral policy has been seen to be its extensiveness. In other words, the set of
eligible assets should be sufficiently extensive as to allow the central bank to provide the nec-
essary liquidity, without undermining the solvency of its balance sheet in the process.
The validity of the foregoing statement becomes clear when bearing in mind how the collateral
framework at different central banks (the Eurosystem, the US Federal Reserve and the Bank of
England) has contributed to managing the turbulence in question. In the Eurosystem, the collat-
eral policy may be said to have been neutral, insofar as it has not influenced liquidity provision
procedures in any way. But this has not been the outcome in every case. To analyse the causes,
a comparative study of the collateral policy of these three central banks should be made.
The collateralisation framework of regular operations in the Eurosystem responds to a criterion
that is to some extent opposed to that followed by the US Federal Reserve and by the Bank
of England. While the assets backing ordinary liquidity injection operations are only govern-
ment and federal agency1 debt in the case of the Federal Reserve, or only government debt in
the case of Bank of England, in the Eurosystem the regular refinancing operations may be
guaranteed by a broad range of debt instruments, as will be described below.
The greater effective extensiveness of the Eurosystem’s collateral framework is also patent
when regard is had to the collateralisation used in the case of the marginal lending facility. In
this connection, it should be recalled that, although its use is penalised, the lending facility is
also an ordinary refinancing mechanism. In the Bank of England, resort to the lending facility is
collateralised as a regular operation, although, as stated, eligible assets are confined to gov-
ernment debt.
Further qualifications are needed when drawing comparisons with the US lending facility. While
the so-called “primary credit discount window” is a similar facility to the Eurosystem marginal
3.1 Institutions’ collateral
policy
An appropriate collateral
policy contributes to the
efficient performance of a
central bank’s tasks…
… with its extensiveness
being a defining
characteristic of such policy.
3.1 Institutions’ collateral
policy
An appropriate collateral
policy contributes to the
efficient performance of a
central bank’s tasks…
… with its extensiveness
being a defining
characteristic of such policy.
The Eurosystem’s collateral
framework maintains greater
effective extensiveness…
The Eurosystem’s collateral
framework maintains greater
effective extensiveness…
1. The term “federal agency debt” requires some clarification. It does not only include debt issued directly by fed-
eral agencies, but also the debt of specific private bodies operating under licence and with public objectives. These
include mortgage associations such as Fannie Mae and Freddie Mac.

BANCO DE ESPAÑA 48 FINANCIAL STABILITY REPORT, NOVEMBER 2007
lending facility, the “secondary credit discount window” is for emergency assistance. Coverage
of the credit risk resulting from both facilities is, as in the Eurosystem, through a broad spec-
trum of eligible assets. However, the persistence of a degree of stigma associated with resort
to “primary credit”, as though it were an emergency recourse, still marks a considerable differ-
ence with the Eurosystem framework.
The greater effective extensiveness of the Eurosystem’s collateral framework in normal condi-
tions, along with the lack of stigma associated with resort to ordinary financing mechanisms
(with penalty or not), have been decisive in allowing for comfortable management of market
tensions, for three reasons.
First, the scale of the (hypothetical) liquidity problems that would require resort to emergency
procedures should, all other things being equal, be greater in the Eurosystem. In other words,
a broad set of eligible assets in normal conditions enables the prevalence of the conditions of
normality to be prolonged.
Second, a wide-ranging criterion of eligibility in normal conditions presupposes that the col-
lateral management apparatus needed is available at all times. In this respect, it should be
noted that the counterpart to the formal flexibility that the collateralisation framework for the
Federal Reserve’s primary credit and emergency operations guarantees is the fact that certain
possible types of collateralisation have not been implemented for a long time.
Finally, mention should be made of the operational efficiency that ensues when an extensive
collateral policy allows for the simultaneous coverage both of the central bank’s credit expo-
sure attributable purely to financing operations and the exposure stemming from the operation
of the payment systems under its charge.
The extensiveness of the Eurosystem’s collateral framework is highlighted by the fact that the
volume of assets deposited in the Eurosystem during 2006 was, on average, around 10% of
eligible assets. Reinforcing this argument of formal sufficiency, close to 40% of what was de-
posited in 2006 was not actually used. At end-August 2007, unused collateral in Spain ac-
counted for almost 70% of the collateral deposited2.
Without detracting from the foregoing, it should be observed that the extensiveness of the
collateral framework cannot be unlimited. The need for specificity in discharging functions
precludes an extensive collateral framework from being synonymous with one governed by the
principle of universality. Specifically, the need to avoid disguised tax distortions and alterations
in price formation on markets, and to conform to the prevailing legal framework mean, inter
alia, that assets eligible as collateral should comprise a limited category.
The document entitled “The implementation of monetary policy in the euro area” outlines the
harmonised collateral framework in the Eurosystem since early 20073. This is not the place to
discuss it in detail. However, attention should be drawn to some of its main features. Specifi-
cally, assets accepted as collateral should be creditworthy unsubordinated debt instruments
in accordance with the provisions laid down in the Eurosystem credit assessment framework
… which while not
unlimited…
… which while not
unlimited…
2. This figure should be qualified as it is an aggregate and time-specific measure. However, there have been no collat-
eral restrictions to date either at the level of specific institutions or at any point in time. 3. The harmonised framework
will come fully into force in 2012. Until then there will be an adaptation period in which the various national central banks
shall adjust their previous practices. The collateral framework in force in Spain is regulated by Technical Application No.
1/2006 of the SLBE (Banco de España Settlement Service).

BANCO DE ESPAÑA 49 FINANCIAL STABILITY REPORT, NOVEMBER 2007
(ECAF). The extensiveness of the Eurosystem’s collateral policy is determined by the accept-
ability both of marketable and non-marketable assets, and of assets that meet certain mini-
mum credit standards, irrespective of whether such standards are set by rating agencies,
central bank internal validation systems, internal models of the counterparties themselves or
automated rating solutions.
Naturally, there are specific rules covering different operational, contractual and legal aspects
that outline in greater detail which assets are eligible or not, along with their actual capacity to
mobilise funds4. Thus, for instance, the Eurosystem does not accept individual liabilities, even
if they are mortgage-backed. This does not mean that the counterparties’ investments in this
category of assets cannot be discounted in the Eurosystem. The acceptability of covered
bonds and similar instruments, and that of asset-backed bonds, is a means for the rediscount-
ing of mortgage-backed securities. Nor does the Eurosystem accept collateral provided by
counterparties with close links to the issuer of the debt in question. This measure is a safe-
guard against potential situations of double default, whose (conditional) probability is obvi-
ously greater in situations involving close links.
Conversely, the collateral policy pursued by the Federal Reserve in its primary and secondary
discount window programs does not envisage exceptions such as those outlined above.
However, the immediate capacity to mobilise collateral proves more limited than that con-
tained in the regulations. An example of this occurred in late August when the New York Fed-
eral reserve, among other measures to tackle the sub-prime crisis, clarified the conditions for
the eligibility of ABCP provided by counterparties that were providers of the liquidity facility of
the vehicle in question.
Beyond possible differences of opinion between the Eurosystem and the Federal Reserve as
to what constitutes close links, the foregoing example highlights the advantages of a system
that is effectively extensive at all times. A wide-ranging collateral framework avoids two seri-
ous, practical difficulties of managing turbulent situations. First, it allows a situation of moral
hazard resulting from having to take decisions to extend the list of eligible assets in situations
of tension to be avoided. Further, it prevents the generation of spurious signals about the posi-
tion of institutions which, for whatever reason, find themselves having to resort to lending fa-
cilities. In sum, a sufficiently extensive and appropriately calibrated collateral framework is the
best alternative both for normal and turbulent times.
The entry into force of the new personal income tax legislation5 in January 2007 has entailed
far-reaching changes in the taxation of, and withholdings system for, financial instruments.
Among the main reforms enacted, mention should first be made of the replacement of the
concept of “special income”6 with that of “savings income”, a different and broader term which,
as can be seen in the accompanying table, covers all financial returns whatever the period over
which they have been generated. Further, the different forms of taxation on income from mov-
able capital and on all existing capital gains and losses on the basis of issuers have been
brought into line. In particular, the 40% reduction for income from movable capital generated
at over two years, and the 40% and 75% reductions for returns at over two and five years on
deferred capital insurance contracts if collection of the income is in the form of a single pay-
… allows for comfortable
management of situations of
tension, precluding the
moral hazard stemming
from taking decisions on the
extension of the collateral
list, and preventing the
generation of spurious
signals about the position of
institutions which, for
whatever reason, have to
resort to the lending
facilities.
3.2 Changes in the
taxation of financial
products
The new personal income
tax legislation has enacted
notable changes in the
taxation of, and withholdings
system for, financial
instruments…
4. The capacity to obtain refinancing charged to collateral is restricted by the size of the haircuts applied to the face
value of the collateralised asset. The size of this discount is determined by a combination of criteria which consider ex-
posure to risk in the event of enforcement of guarantees and the aim of neutrality in price formation on debt
markets. 5. Law 35/2006 of 28 November 2006 on Personal Income Tax and the partial amendment of the legislation
on Corporate and Non-Resident Income Tax and Wealth Tax (Official State Gazette of 29 November 2006). 6. The
concept was introduced into Law 40/1998 on personal income tax and other tax regulations.

BANCO DE ESPAÑA 50 FINANCIAL STABILITY REPORT, NOVEMBER 2007
ment, have been eliminated. The flat rate of 15% applied to special income is raised to 18%,
and this rate is used for savings income irrespective of the taxpayer’s income level. The Royal
Decree on payments on account7 has established a withholding of 18%, a 3 pp increase8.
As a result of all these changes, the dual tax system initiated in 1996 has been consolidated
while the taxation of saving has become much more neutral in respect of instruments, terms
and income levels. Accordingly, the current taxation of saving tends to foment greater compe-
tition among the issuers and managers of different financial instruments, strengthening the role
of the terms of risk and return, while minimising tax considerations.
Recent developments in financial flows suggest that these changes may have influenced
household portfolio decisions. Thus, since 2006 Q2 investment in this bank deposit sector
— in which the lack of neutrality significantly affected the assets in question — has gained
fresh momentum9.
… making the taxation of
saving more neutral in
respect of instruments,
terms and income levels.
… making the taxation of
saving more neutral in
respect of instruments,
terms and income levels.
7. Royal Decree 1576/2006 of 22 December 2006 amending personal income tax regulations and other rules relating to
payments on account. 8. For more details on this legislation and its effects, see the article (in Spanish only) by García-
Vaquero and Maza (2007): “El tratamiento de los instrumentos financieros en el nuevo IRPF”, Boletín Económico,
January. 9. Although the new law did not come into force until 2007, investment in time deposits taken out during 2006
and maturing in 2007 avails itself of the new tax arrangements.
FROM 2007
Long run
Less than 1 yearBetween 1 and 2
yearsMore than 2 years
Income
from
capital
Marginal rate
reduction 40% (a)
Capital gains
and lossesMarginal rate
Income
from
work (c)
Marginal rate
reduction 40%Marginal rate
Short run
BEFORE 2007
All maturities
TYPE
OF INCOME
Marginal rate
15%
18% (b)
Marginal rate
SAVINGS TAX REFORM TABLE 3.1
General income Special income Saving income
SOURCE: Banco de España.
a. In the case of insurance contracts, reductions may rise to 75 % if the investment
period exceeds five years. There are reduced allocation percentages for temporary
income and annuities.
b. In the case of temporary income and annuities, there are lower allocation
percentages than in 2006.
c. Pensions plans and similar. Contributions are tax-deductible while benefits are taxed
as income from work in the tax base.

BANCO DE ESPAÑA 51 FINANCIAL STABILITY REPORT, NOVEMBER 2007
Studies and reports REGULAR
Annual Report (in Spanish and English)
Economic Bulletin (quarterly) (the Spanish version is monthly)
Financial Stability Report (in Spanish and English) (half-yearly)
Memoria del Servicio de Reclamaciones (annual)
Mercado de Deuda Pública (annual)
Report on Banking Supervision in Spain (in Spanish and English) (annual)
Research Memorandum (in Spanish and English) (annual)
The Spanish Balance of Payments and International Investment Position (in Spanish and English) (annual)
NON-PERIODICAL
Central Balance Sheet Data Office: commissioned studies
Notas de Estabilidad Financiera
ECONOMIC STUDIES
55 ISABEL ARGIMÓN MAZA: El comportamiento del aho rro y su composición: evidencia empírica para al gu nos
países de la Unión Europea (1996).
56 JUAN AYUSO HUERTAS: Riesgo cambiario y ries go de tipo de interés bajo regímenes alternativos de tipo de
cambio (1996).
57 OLYMPIA BOVER, MANUEL ARELLANO AND SA MUEL BENTOLILA: Unemployment duration, ben efit duration,
and the business cycle (1996). (The Span ish original of this publication has the same num ber.)
58 JOSÉ MARÍN ARCAS: Stabilising effects of fiscal po li cy. Volumes I and II (1997). (The Spanish original of this
publication has the same number.)
59 JOSÉ LUIS ESCRIVÁ, IGNACIO FUENTES, FER NAN DO GUTIÉRREZ AND M.ª TERESA SASTRE: El sistema
bancario español ante la Unión Mo ne ta ria Eu ro pea (1997).
60 ANA BUISÁN AND ESTHER GORDO: El sector ex te rior en España (1997).
61 ÁNGEL ESTRADA, FRANCISCO DE CASTRO, IG NA CIO HERNANDO AND JAVIER VALLÉS: La in ver sión en
España (1997).
62 ENRIQUE ALBEROLA ILA: España en la Unión Mo ne ta ria. Una aproximación a sus costes y be ne fi cios (1998).
63 GABRIEL QUIRÓS (ed.): Mercado español de deu da pública. Volumes I and II (1998).
64 FERNANDO C. BALLABRIGA, LUIS JULIÁN ÁL VA REZ GONZÁLEZ AND JAVIER JAREÑO MO RA GO: A BVAR
macroeconometric model for the Spa nish eco nomy: methodology and results (2000). (The Spanish original of
this publication has the same num ber.)
65 ÁNGEL ESTRADA AND ANA BUISÁN: El gasto de las familias en España (1999).
66 ROBERTO BLANCO ESCOLAR: El mercado es pa ñol de renta variable. Análisis de la liquidez e in fluen cia del
mercado de derivados (1999).
67 JUAN AYUSO, IGNACIO FUENTES, JUAN PE ÑA LO SA AND FERNANDO RESTOY: El mercado mo ne ta rio
español en la Unión Monetaria (1999).
68 ISABEL ARGIMÓN, ÁNGEL LUIS GÓMEZ, PABLO HERNÁNDEZ DE COS AND FRANCISCO MARTÍ: El sector
de las Administraciones Públicas en Es pa ña (1999).
69 JAVIER ANDRÉS, IGNACIO HERNANDO AND J. DA VID LÓPEZ-SALIDO: Assessing the benefits of price
stability: the international experience (2000).
70 OLYMPIA BOVER AND MARIO IZQUIERDO: Qua li ty-adjusted prices: hedonic methods and im pli ca tio ns for
National Accounts (2001). (The Spanish ori gi nal of this publication has the same number.)
71 MARIO IZQUIERDO AND M.ª DE LOS LLANOS MA TEA: An approximation to biases in the mea su re ment of
Spanish macroeconomic variables de ri ved from pro duct quality changes (2001). (The Spa nish ori gi nal of this
publication has the same num ber.)
72 MARIO IZQUIERDO, OMAR LICANDRO AND AL BER TO MAYDEU: Car quality improvements and price indices
in Spain (2001). (The Spanish original of this publication has the same number.)
73 OLYMPIA BOVER AND PILAR VELILLA: Hedonic house prices without characteristics: the case of new
multiunit housing (2001). (The Spa nish ori gi nal of this pu bli ca tion has the same num ber.)
74 MARIO IZQUIERDO AND M.ª DE LOS LLANOS MA TEA: Hedonic prices for personal computers in Spain
during the 90s (2001). (The Spa nish ori gi nal of this pu bli ca tion has the same number.)
75 PABLO HERNÁNDEZ DE COS: Empresa pública, privatización y eficiencia (2004).
76 FRANCISCO DE CASTRO FERNÁNDEZ: Una evaluación macroeconométrica de la política fiscal en España
(2005).
BANCO DE ESPAÑA PUBLICATIONS
Note: The full list of each series is given in the Publications Catalogue.
All publications are available in electronic format, with the exception of statistical and miscellaneous publications and texts of the Human
Resources Development Division.

BANCO DE ESPAÑA 52 FINANCIAL STABILITY REPORT, NOVEMBER 2007
ECONOMIC HISTORY STUDIES
28 BEATRIZ CÁRCELES DE GEA: Fraude y administración fiscal en Castilla. La Comisión de Millones
(1632-1658): Poder fiscal y privilegio jurídico-político (1994).
29 PEDRO TEDDE AND CARLOS MARICHAL (eds.): La formación de los bancos centrales en España y Amé ri ca
Latina (siglos XIX y XX). Vol. I: España y Méxi co (1994).
30 PEDRO TEDDE AND CARLOS MARICHAL (eds.): La formación de los bancos centrales en España y Amé ri ca
Latina (siglos XIX y XX). Vol. II: Su ra mé ri ca y el Caribe (1994).
31 BEATRIZ CÁRCELES DE GEA: Reforma y fraude fis cal en el reinado de Carlos II. La Sala de Millones
(1658-1700) (1995).
32 SEBASTIÁN COLL AND JOSÉ IGNACIO FORTEA: Guía de fuentes cuantitativas para la historia eco nó mi ca de
España. Vol. I: Recursos y sectores pro duc ti vos (1995).
33 FERNANDO SERRANO MANGAS: Vellón y me ta les preciosos en la Corte del Rey de España (1618-1668) (1996).
34 ALBERTO SABIO ALCUTÉN: Los mercados in for ma les de crédito y tierra en una comunidad rural ara go ne sa
(1850-1930) (1996).
35 M.ª GUADALUPE CARRASCO GONZÁLEZ: Los ins tru men tos del comercio colonial en el Cádiz del si glo XVII
(1650-1700) (1996).
36 CARLOS ÁLVAREZ NOGAL: Los banqueros de Fe li pe IV y los metales preciosos americanos (1621-1665)
(1997).
37 EVA PARDOS MARTÍNEZ: La incidencia de la pro tec ción arancelaria en los mercados españoles (1870-1913)
(1998).
38 ELENA MARÍA GARCÍA GUERRA: Las acu ña cio nes de moneda de vellón durante el reinado de Fe li pe III (1999).
39 MIGUEL ÁNGEL BRINGAS GUTIÉRREZ: La pro duc ti vi dad de los factores en la agricultura española
(1752-1935) (2000).
40 ANA CRESPO SOLANA: El comercio marítimo en tre Ámsterdam y Cádiz (1713-1778) (2000).
41 LLUIS CASTAÑEDA PEIRÓN: El Banco de España (1874-1900): la red de sucursales y los nuevos ser vi cios
financieros (2001).
42 SEBASTIÁN COLL AND JOSÉ IGNACIO FORTEA: Guía de fuentes cuantitativas para la historia económica de
España. Vol. II: Finanzas y renta nacional (2002).
43 ELENA MARTÍNEZ RUIZ: El sector exterior durante la autarquía. Una reconstrucción de las balanzas de pagos
de España, 1940-1958. Revised edition (2003).
44 INÉS ROLDÁN DE MONTAUD: La banca de emisión en Cuba (1856-1898) (2004).
45 ALFONSO HERRANZ LONCÁN: La dotación de infraestructuras en España, 1844-1935 (2004).
46 MARGARITA EVA RODRÍGUEZ GARCÍA: Compañías privilegiadas de comercio con América y cambio político
(1706-1765) (2005).
47 MARÍA CONCEPCIÓN GARCÍA-IGLESIAS SOTO: Ventajas y riesgos del patrón oro para la economía española
(1850-1913) (2005).
48 JAVIER PUEYO SÁNCHEZ: El comportamiento de la gran banca en España, 1921-1974 (2006).
WORKING PAPERS
0626 CRISTINA BARCELÓ: A Q-model of labour demand.
0627 JOSEP M. VILARRUBIA: Neighborhood effects in economic growth.
0628 NUNO MARTINS AND ERNESTO VILLANUEVA: Does limited access to mortgage debt explain why young
adults live with their parents?
0629 LUIS J. ÁLVAREZ AND IGNACIO HERNANDO: Competition and price adjustment in the euro area.
0630 FRANCISCO ALONSO, ROBERTO BLANCO AND GONZALO RUBIO: Option-implied preferences adjustments,
density forecasts, and the equity risk premium.
0631 JAVIER ANDRÉS, PABLO BURRIEL AND ÁNGEL ESTRADA: Bemod: A DSGE model for the Spanish economy
and the rest of the euro area.
0632 JAMES COSTAIN AND MARCEL JANSEN: Employment fluctuations with downward wage rigidity: The role of
moral hazard.
0633 RUBÉN SEGURA-CAYUELA: Inefficient policies, inefficient institutions and trade.
0634 RICARDO GIMENO AND JUAN M. NAVE: Genetic algorithm estimation of interest rate term structure.
0636 AITOR ERCE-DOMÍNGUEZ: Using standstills to manage sovereign debt crises.
0637 ANTON NAKOV: Optimal and simple monetary policy rules with zero floor on the nominal interest rate.
0638 JOSÉ MANUEL CAMPA AND ÁNGEL GAVILÁN: Current accounts in the euro area: An intertemporal approach.
0639 FRANCISCO ALONSO, SANTIAGO FORTE AND JOSÉ MANUEL MARQUÉS: Punto de quiebra implícito en la
prima de credit default swaps. (The Spanish original of this publication has the same number.)
0701 PRAVEEN KUJAL AND JUAN RUIZ: Cost effectiveness of R&D and strategic trade policy.
0702 MARÍA J. NIETO AND LARRY D. WALL: Preconditions for a successful implementation of supervisors’ prompt
corrective action: Is there a case for a banking standard in the EU?
0703 PHILIP VERMEULEN, DANIEL DIAS, MAARTEN DOSSCHE, ERWAN GAUTIER, IGNACIO HERNANDO,
ROBERTO SABBATINI AND HARALD STAHL: Price setting in the euro area: Some stylised facts from individual
producer price data.
0704 ROBERTO BLANCO AND FERNANDO RESTOY: Have real interest rates really fallen that much in Spain?
0705 OLYMPIA BOVER AND JUAN F. JIMENO: House prices and employment reallocation: International evidence.
0706 ENRIQUE ALBEROLA AND JOSÉ M.ª SERENA: Global financial integration, monetary policy and reserve
accumulation. Assessing the limits in emerging economies.

BANCO DE ESPAÑA 53 FINANCIAL STABILITY REPORT, NOVEMBER 2007
0707 ÁNGEL LEÓN, JAVIER MENCÍA AND ENRIQUE SENTANA: Parametric properties of semi-nonparametric
distributions, with applications to option valuation.
0708 ENRIQUE ALBEROLA AND DANIEL NAVIA: Equilibrium exchange rates in the new EU members: external
imbalances vs. real convergence.
0709 GABRIEL JIMÉNEZ AND JAVIER MENCÍA: Modelling the distribution of credit losses with observable and latent
factors.
0710 JAVIER ANDRÉS, RAFAEL DOMÉNECH AND ANTONIO FATÁS: The stabilizing role of government size.
0711 ALFREDO MARTÍN-OLIVER, VICENTE SALAS-FUMÁS AND JESÚS SAURINA: Measurement of capital stock
and input services of Spanish banks.
0712 JESÚS SAURINA AND CARLOS TRUCHARTE: An assessment of Basel II procyclicality in mortgage portfolios.
0713 JOSÉ MANUEL CAMPA AND IGNACIO HERNANDO: The reaction by industry insiders to M&As in the
European financial industry.
0714 MARIO IZQUIERDO, JUAN F. JIMENO AND JUAN A. ROJAS: On the aggregate effects of immigration in
Spain.
0715 FABIO CANOVA AND LUCA SALA: Back to square one: identification issues in DSGE models.
0716 FERNANDO NIETO: The determinants of household credit in Spain.
0717 EVA ORTEGA, PABLO BURRIEL, JOSÉ LUIS FERNÁNDEZ, EVA FERRAZ AND SAMUEL HURTADO:
Actualización del modelo trimestral del Banco de España.
0718 JAVIER ANDRÉS AND FERNANDO RESTOY: Macroeconomic modelling in EMU: How relevant is the change
in regime?
0719 FABIO CANOVA, DAVID LÓPEZ-SALIDO AND CLAUDIO MICHELACCI: The labor market effects of technology
shocks.
0720 JUAN M. RUIZ AND JOSEP M. VILARRUBIA: The wise use of dummies in gravity models: Export potentials in
the Euromed region.
0721 CLAUDIA CANALS, XAVIER GABAIX, JOSEP M. VILARRUBIA AND DAVID WEINSTEIN: Trade patterns, trade
balances and idiosyncratic shocks.
0722 MARTÍN VALLCORBA AND JAVIER DELGADO: Determinantes de la morosidad bancaria en una economía
dolarizada. El caso uruguayo.
0723 ANTON NAKOV AND ANDREA PESCATORI: Inflation-output gap trade-off with a dominant oil supplier.
0724 JUAN AYUSO, JUAN F. JIMENO AND ERNESTO VILLANUEVA: The effects of the intoduction of tax incentives
on retirement savings.
0725 DONATO MASCIANDARO, MARÍA J. NIETO AND HENRIETTE PRAST: Financial governance of banking
supervision.
0726 LUIS GUTIÉRREZ DE ROZAS: Testing for competition in the Spanish banking industry: The Panzar-Rosse
approach revisited.
0727 LUCÍA CUADRO SÁEZ, MARCEL FRATZSCHER AND CHRISTIAN THIMANN: The transmission of emerging
market shocks to global equity markets.
0728 AGUSTÍN MARAVALL AND ANA DEL RÍO: Temporal aggregation, systematic sampling, and the Hodrick-
Prescott filter.
0729 LUIS J. ÁLVAREZ: What do micro price data tell us on the validity of the New Keynesian Phillips Curve?
0730 ALFREDO MARTÍN-OLIVER AND VICENTE SALAS-FUMÁS: How do intangible assets create economic value?
An application to banks.
0731 REBECA JIMÉNEZ-RODRÍGUEZ: The industrial impact of oil price shocks: Evidence from the industries of six
OECD countries.
OCCASIONAL PAPERS
0506 VÍCTOR GARCÍA-VAQUERO AND JORGE MARTÍNEZ: Fiscalidad de la vivienda en España.
0507 JAIME CARUANA: Monetary policy, financial stability and asset prices.
0601 JUAN F. JIMENO, JUAN A. ROJAS AND SERGIO PUENTE: Modelling the impact of aging on Social Security
expenditures.
0602 PABLO MARTÍN-ACEÑA: La Banque de France, la BRI et la création du Service des Études de la Banque
d’Espagne au début des années 1930.
0603 CRISTINA BARCELÓ: Imputation of the 2002 wave of the Spanish Survey of Household Finances (EFF).
0604 RAFAEL GÓMEZ AND PABLO HERNÁNDEZ DE COS: The importance of being mature: The effect of
demographic maturation on global per-capita income.
0605 JUAN RUIZ AND JOSEP VILARRUBIA: International recycling of petrodollars. (The Spanish original of this
publication has the same number.)
0606 ALICIA GARCÍA-HERRERO AND SERGIO GAVILÁ: Posible impacto de Basilea II en los países emergentes.
0607 ESTHER GORDO, JAVIER JAREÑO AND ALBERTO URTASUN: Radiografía del sector de servicios en España.
0608 JUAN AYUSO, ROBERTO BLANCO AND FERNANDO RESTOY: House prices and real interest rates in Spain.
0701 JOSÉ LUIS MALO DE MOLINA: Los principales rasgos y experiencias de la integración de la economía
española en la UEM.
0702 ISABEL ARGIMÓN, FRANCISCO DE CASTRO AND ÁNGEL LUIS GÓMEZ: Una simulación de los efectos de la
reforma del IRPF sobre la carga impositiva.
0703 YENER ALTUNBAŞ, ALPER KARA AND ADRIAN VAN RIXTEL: Corporate governance and corporate
ownership: The investment behaviour of Japanese institutional investors.
0704 ARTURO MACÍAS AND ÁLVARO NASH: Efectos de valoración en la posición de inversión internacional de
España.
0705 JUAN ÁNGEL GARCÍA AND ADRIAN VAN RIXTEL: Inflation-linked bonds from a central bank perspective.

BANCO DE ESPAÑA 54 FINANCIAL STABILITY REPORT, NOVEMBER 2007
MISCELLANEOUS PUBLICATIONS1
JUAN LUIS SÁNCHEZ-MORENO GÓMEZ: Circular 8/1990, de 7 de septiembre. Concordancias legales (1996). € 6.25.
RAMÓN SANTILLÁN: Memorias (1808-1856) (1996) (**).
BANCO DE ESPAÑA. SERVICIO DE ESTUDIOS (Ed.): La política monetaria y la inflación en España (1997) (*).
BANCO DE ESPAÑA: La Unión Monetaria Europea: cues tio nes fundamentales (1997). € 3.01.
TERESA TORTELLA: Los primeros billetes españoles: las «Cédulas» del Banco de San Carlos (1782-1829) (1997).
€ 28.13.
JOSÉ LUIS MALO DE MOLINA, JOSÉ VIÑALS AND FER NAN DO GUTIÉRREZ (Ed.): Monetary policy and in fla tion in
Spain (1998) (***).
VICTORIA PATXOT: Medio siglo del Registro de Bancos y Ban que ros (1947-1997) (1999). Book and disquette: € 5.31.
PEDRO TEDDE DE LORCA: El Banco de San Fernando (1829-1856) (1999) (*).
BANCO DE ESPAÑA (Ed.): Arquitectura y pintura del Con se jo de la Reserva Federal (2000). € 12.02.
PABLO MARTÍN ACEÑA: El Servicio de Estudios del Ban co de España (1930-2000) (2000). € 9.02.
TERESA TORTELLA: Una guía de fuentes sobre in ver sio nes extranjeras en España (1780-1914) (2000). € 9.38.
VICTORIA PATXOT AND ENRIQUE GIMÉNEZ-ARNAU: Ban que ros y bancos durante la vigencia de la Ley Cambó
(1922-1946) (2001). € 5.31.
BANCO DE ESPAÑA: El camino hacia el euro. El real, el escudo y la peseta (2001). € 45.
BANCO DE ESPAÑA: El Banco de España y la introducción del euro (2002). Free copy.
BANCO DE ESPAÑA: Spanish banknotes 1940-2001 (2004). 30 €. (In Spanish and English.)
NIGEL GLENDINNING AND JOSÉ MIGUEL MEDRANO: Goya y el Banco Nacional de San Carlos (2005). Bound
edition: € 30; paperback edition: € 22.
BANCO DE ESPAÑA. SERVICIO DE ESTUDIOS (Ed.): The analysis of the Spanish economy (2006) (*). (In Spanish and
English.)
BANCO DE ESPAÑA: Billetes españoles 1874-1939 (2005). € 30 €.
JOSÉ MARÍA VIÑUELA, PEDRO NAVASCUÉS Y RAFAEL MONEO: El Edificio del Banco de España (2006). 25 €.
BANCO DE ESPAÑA: 150 years in the history of the Bank of Spain, 1856-2006 (2006). 30 €. (In Spanish and English.)
BANCO DE ESPAÑA: Secretaría General. Legislación de Entidades de Crédito. 5.ª ed. (2006) (****).
Statistics Boletín de Operaciones (daily) (available only in electronic format on the website)
Boletín del Mercado de Deuda Pública (daily) (available only in electronic format on the website)
Boletín estadístico (monthly)
Central de Balances. Resultados anuales de las empresas no financieras (annual monograph)
Financial Accounts of the Spanish Economy (bilingual edition: Spanish and English) (annual and quarterly series2)
Financial legislation
and official registers
Circulares a entidades de crédito3
Circulares del Banco de España. Recopilación (four-monthly)
Registros de Entidades (annual) (available only in electronic format on the website)
Training BANCO DE ESPAÑA: Cálculo mercantil (con ejercicios resueltos).
PEDRO PEDRAJA GARCÍA: Contabilidad y análisis de balances en la banca (tomo I) (1999).
PEDRO PEDRAJA GARCÍA: Contabilidad y análisis de balances en la banca (tomo II) (1998).
JESÚS MARÍA RUIZ AMESTOY: Matemática financiera (2001).
JESÚS MARÍA RUIZ AMESTOY: Matemática financiera (ejercicios resueltos) (1994).
UBALDO NIETO DE ALBA: Matemática financiera y cálculo bancario.
LUIS A. HERNANDO ARENAS: Tesorería en moneda extranjera.
EUROPEAN CENTRAL BANK PUBLICATIONS
Spanish editions of:
Annual Report
Monthly Bulletin
Other publications
1. All publications are distributed by the Banco de España, except those indicated with (*), (**), (***) or (****), which are respectively distributed
by Alianza Editorial, Editorial Tecnos, Macmillan (London) and Thomson-Aranzadi. Prices include 4 % VAT. 2. A quarterly update of the tables
of this publication is also disseminated on the Internet. 3. Available only on the Banco de España website until it is included in the publication
Circulares del Banco de España. Recopilación.
Unidad de Publicaciones
Alcalá, 522; 28027 Madrid
Telephone +34 91 338 6363. Fax +34 91 338 6488
E-mail: [email protected]
www.bde.es