Embed Size (px)
Citation preview

CHANGES IN THE INTERNATIONAL INVESTOR BASE AND IMPLICATIONS FOR FINANCIAL STABILITY
Cross-border financial asset accumulation has tripled over the past decade. While some of this increase represents a con-
tinuation or resumption of trends that have been evident for some time, recent years have witnessed several new developments, notably the broadening of the investor base eager to hold international assets. Certain classes of inves-tors, such as private institutional investors from mature market (MM) economies and official institutions from emerging market (EM) econo-mies, have gained in importance in global finan-cial markets.
Analyzing changes in the international inves-tor base and investment allocation behavior is fundamental to understanding the buildup of strengths and weaknesses in international finan-cial markets. Decisions that key investors make about where to allocate their assets not only affect the prices of financial assets, but also have wide-ranging implications for economic perfor-mance and welfare in various countries. The size of these cross-border flows and the rapid pace of financial innovation have given rise to concerns about financial stability, because in the past, booms in cross-border financial investment were followed by crises. Even if greater stability can be expected in the longer term, the process of transformation and the specific conditions under which it occurs may temporarily generate additional vulnerabilities.
The objective of this chapter is to enhance understanding of the globalization and diversifi-cation of the investor base as well as the implica-tions of these trends. In particular, the following issues are addressed:
What have been the key changes in the inves-tor base for cross-border flows and investor behavior over the last decade?
How do these changes in the investor base and investor behavior affect the composition and volatility of capital flows and the pricing of financial assets?What are the key risks associated with these changes in the investor base and what are the factors that exacerbate or mitigate those risks? The chapter reviews evidence on the accu-
mulation of international financial assets and on the asset allocation behavior of insti-tutional investors, and on this basis assesses implications for cross-border capital flows and global financial stability. The most compre-hensive information available, especially for fast-growing portfolio investments, is used to analyze the key changes in investor behavior over the past decade. However, the complexi-ties of links and networks of investors, which have intensified with the globalization of capi-tal flows, along with the lack of information and data, make a comprehensive analysis a daunting task. This chapter concentrates on those forms of international capital flows that have achieved prominence over the past decade; it is expected that future Global Financial Stabil-ity Reports will examine specific issues in more depth.
The chapter identifies three key factors affecting the level and nature of cross-border financial flows: (1) the growth in assets under management of institutional investors; (2) changes in the asset allocation behavior of such investors, including a decline in home bias and increased investment in internation-ally oriented hedge funds; and (3) the rise of EM official sector and sovereign wealth funds as key players. In addition, traditional forms of cross-border asset accumulation such as bank lending and direct investment have regained momentum following the lull in the post-1990s crises period.
Note: This chapter was written by a team led by Ceyla Pazarbasioglu and Daniel Hardy.
63
IICHAPTER

CHAPTER II CHANGES IN THE INTERNATIONAL INVESTOR BASE AND IMPLICATIONS FOR FINANCIAL STABILITY
64
The diversity of assets, source countries, and investor types now involved in cross-border asset accumulation suggests that this form of global-ization should, on balance, support financial stability. However, the sheer size of flows raises concerns about the increasing exposures of both source countries and recipients. Further-more, investors have been encouraged by the generally benign global economic environment to venture into markets previously regarded as excessively risky. A deterioration in the eco-nomic environment may lead to unpleasant surprises.
The level of specificity in the information and data permit only broad policy recommenda-tions to be set forth—namely, policies to help policymakers continue to reap the benefits ofincreased cross-border asset accumulation and protect themselves against rapid reversals. Infor-mation that would permit more precise analysis and policy conclusions is not yet available. Thus, one observation is that better and more timely information concerning global financial flows is needed to identify if and how public policy may be able to play a larger role.
From the analysis, some basic policy con-clusions apply. Countries that wish to benefit from a global investor base have to continue to establish a track record of consistent and cred-ible macroeconomic policies. Vulnerabilities can be reduced by promoting the effective regula-tion and efficiency of local capital markets. In some cases, facilitating capital outflows by allow-ing domestic investors to better manage their risks may also help mitigate the effects of strong inflows. Careful communication by the official sector regarding its strategy for the allocation of international reserves is also needed.
The next two sections of this chapter discuss the magnitude of asset accumulation by key sets of investors and their investment allocation behavior. The chapter then turns to analyzing the implications for financial stability, taking into account the potential benefits as well as risks. The last section draws some conclusions and presents a corresponding set of policy implications.
Asset Accumulation and Implications forCross-Border Flows
Cross-Border Flows
The manifestation of financial globalization over the past decade can be seen in the growth of cross-border capital flows. Global cross-border flows—foreign purchases of equity and debt securities, cross-border lending and deposits, and foreign direct investment (FDI)—reached a record $6.4 trillion in 2005. The increase in cross-border capital flows is well beyond the scope attributable to cyclical behavior (Battelino, 2006): the ratio between global cross-border capital flows and world GDP since 1995 shows an upward trend, combined with business-cycle-related swings, breaking away from its previous behavior of mean reversion (Figure 2.1).
Both cyclical and structural factors have contributed to this trend. Part of the increase reflects “pull factors” such as robust and diverse growth opportunities and the opening of econo-mies, including financial sectors, to foreign investors. But “push factors” such as the low level of interest rates in many mature markets are also present. Demographic changes, changes in accounting and regulatory frameworks, and windfall gains accruing to commodity produc-ers have led to a rapid growth of assets under management and a sharp increase in demand for financial instruments. In some countries, particularly in emerging markets, the increase in demand has outpaced the availability of domes-tic assets, therefore contributing to heightened cross-border flows. These developments have been aided by technological advances that enable greater price transparency and a wider range of agents to participate in the global marketplace, as well as by the use of complex financial instruments that allow the unbundling and re-allocation of risk. Financial liberaliza-tion has also enabled or prompted institutional investors to diversify into new markets. With informational, technological, and regulatory barriers declining, the internationalization of asset allocation has gained traction. The opera-tion of these factors can be seen in the types of

assets that are exchanged internationally, the regional pattern of capital flows, and the types of investors who are now engaged in investing internationally.
All financial asset classes have exhibited strong growth in international flows. The most significant growth has been in portfolio debt flows and in cross-border banking, which together accounted for about three-quarters of total international capital flows (Figure 2.1).Cross-border investments in debt securities have surged, largely in sovereign debt and more recently into corporate debt, both in developed countries (mainly the United States) and EM countries. FDI has increased as well, but its share as a percentage of gross flows has fallen (Box 2.1).1
The banking sector remains a key interme-diary for the supply of cross-border capital (McGuire and Tarashev, 2006), although capital markets have gained ground as the preferred mode of such flows (see Chapter III). Total cross-border bank claims almost doubled from 2001 to end-2005, when they reached $17.6 trillion, driven mainly by European banks, fol-lowed by banks in the United States and Japan. Much of the total consists of intra-European money market transactions. Moreover, Bank for International Settlements (BIS) reporting banks have been large net recipients of deposits from EM countries, including oil exporters. Among EMs, emerging Europe has been the largest recipient of bank claims over the past several years. However, a clear trend seems to have emerged whereby the BIS reporting banks have moved away from their traditional lending business to become an important investor base in the securities market. These banks now hold a significant amount of outstanding govern-ment debt, mainly in triple-A rated sovereigns (with the exception of Italy and Japan), partly
1In the financial account of the balance of payment sta-tistics, all transactions are recorded on a net change basis. However, in this chapter, “gross” capital flows refer to either the credit (gross inflows) or debit (gross outflows) entry of such a transaction, while the “net” capital flows refers to their difference.
0
2
4
6
8
10
12
14
16
Banking and other flows1
Portfolio debt flowsPortfolio equity flowsForeign direct investment
0
2
4
6
8
10
12
14
16
0
1000
2000
3000
4000
5000
6000
7000
1980 83 86 89 92 95 98 2001 04
1980 83 86 89 92 95 98 2001 04
Percent of world GDP(right scale)
Figure 2.1. Total Global Cross-Border Inflows
Source: IMF staff calculations based on data from IMF, International Financial Statistics and World Economic Outlook.
1Other flows include derivative transactions.
Billions of U.S. dollars(left scale)
Total Flows
By Type of Flow(In percent of world GDP)
ASSET ACCUMULATION AND IMPLICATIONS FOR CROSS-BORDER FLOWS
65

CHAPTER II CHANGES IN THE INTERNATIONAL INVESTOR BASE AND IMPLICATIONS FOR FINANCIAL STABILITY
66
Global foreign direct investment has fluctu-ated over the past decade, with mature market FDI exhibiting greater variability than FDI to emerging markets (see first figure). The size and growth prospects of domestic markets are a large determinant of FDI inflows. The main source of FDI has been Europe, and EMs have increased substantially their FDI over the past three years.
Total FDI flows to EMs are estimated to have increased by about 5 percent in 2006, fueled by strong global growth, higher com-modity prices, continued improvements in the business and investment climate, perceptions of reduced risks in EMs, and more mergers and acquisitions in EMs. The largest increases in FDI to EMs in 2006 were to emerging Europe and the Middle East. Flows to Africa and Latin America are estimated to have remained stable, while those to Asia declined slightly. Globalization is now encompassing EM firms. Outward FDI from EMs has contin-ued to boom (see second figure). Some large FDI recipient EMs have become sources of outward FDI. For example, in 2006 Brazil’s outward FDI is estimated to have exceeded inward FDI (see IMF, 2006a; World Bank, 2006, Chapter 4).
To collect information on the allocation of foreign investment, the Association of Financial Professionals (AFP) and IMF staff conducted a survey that included 31 multinational corpora-tions. The responding companies are head-quartered in the Asia-Pacific region, Europe, Latin America, and North America, and are active in the construction, energy, manufactur-ing, retailing, telecommunications, and trans-portation sectors.
The survey asked about the motivation for FDI, the rate of return on it, and its alloca-tion and financing, as well as about infra-
structure issues. The responses indicated that FDI is part of globalization in the world economy, that it is procyclical, and that it has been buoyed by structural reforms that
Box 2.1. Foreign Direct Investment Flows
0
300
600
900
1200
1500
1996 98 2000 02 04 06
Source: IMF, World Economic Outlook.
Global FDI Inflows(In billions of U.S. dollars)
Total
To mature markets
To emerging markets
–5
0
5
10
15
20
25
1996 98 2000 02 04 06
Source: IMF, World Economic Outlook.
Emerging Markets: FDI Outflows byRegion(In billions of U.S. dollars)
Middle East and Africa
Emerging Europe
Latin America/Caribbean
DevelopingAsia andPacific
Note: The main author of this box is Paul Ross. The box is based on ongoing work of an IMF–World Bank-IFC Foreign Direct Investment Group (IMF, 2006a) and relies on a survey conducted by AFP (see www.afponline.org).

because these bonds can be used as collateral in other financial transactions. The net stock of debt securities held by BIS reporting banks has more than quadrupled over the past decade, which partly reflects increased exposure to local currency debt markets in the EM countries (IMF, 2006a).
Regarding portfolio capital flows, the main focus of this chapter, the following findings are especially pertinent:
The growth in assets under management of institutional investors (pension funds, insur-ance companies, and mutual funds), which increased from $21 trillion to $53 trillionbetween 1995 and 2005;Changes in the asset allocation behavior, most notably a decline in home bias and increased investments into alternative vehicles such as hedge funds; andThe growing importance of the official sector in asset management, in particular by EM offi-cial sector and sovereign wealth funds, manag-ing assets estimated to have totaled more than $6 trillion at end-2005.
Growth in Assets Under Management ofTraditional Investors
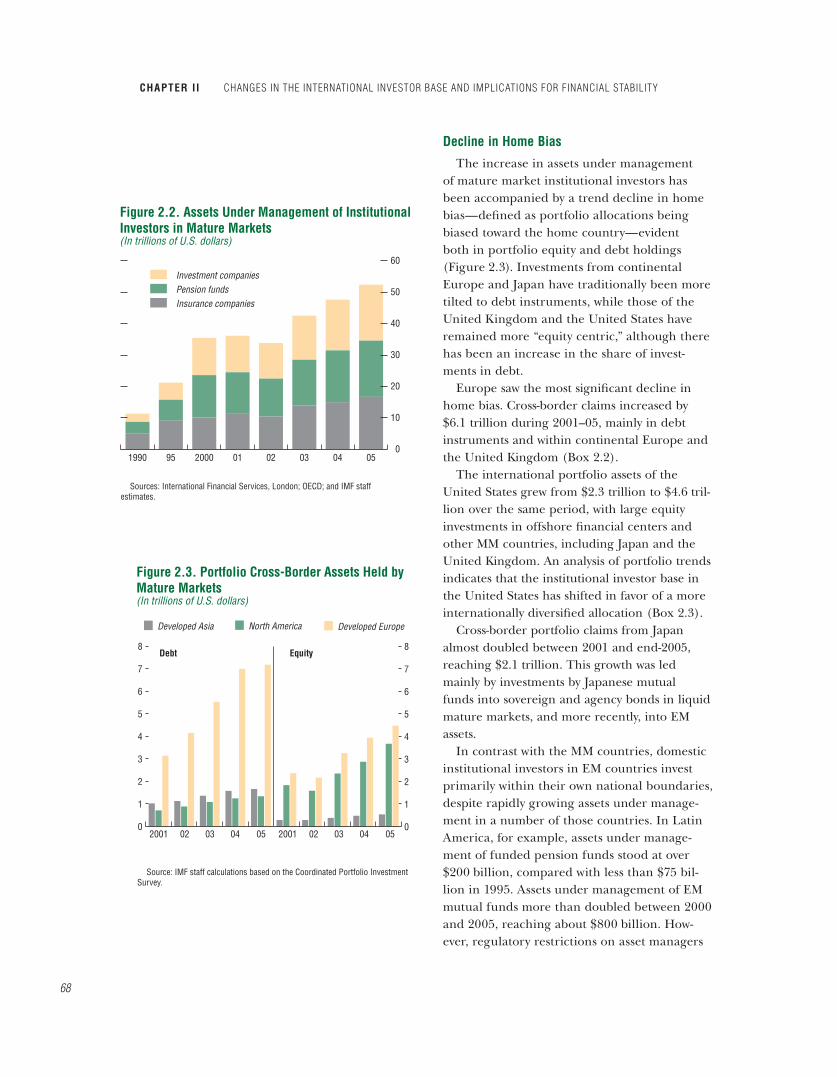
Assets under management of mature market institutional investors more than doubled over the past decade, reaching about $53 trillion
in 2005 (Figure 2.2).2 U.S. institutional inves-tors accounted for about half of the share and continental Europe over a quarter, followed by Japan and the United Kingdom. Within con-ventional investment management, pension fund assets managed by institutional investors have expanded significantly, especially in coun-tries such as the Netherlands, Switzerland, the United Kingdom, and the United States, where pension reforms through private pension plans were introduced at a relatively early stage. More recently, pension fund assets of several Euro-pean countries such as Norway and Spain have been growing rapidly. Mutual funds and insur-ance companies also constitute a sizable share of the investor base in Europe, Japan, and the United States.
The implication of this rapid growth in assets under management is that, even if the share of portfolios invested internationally had remained unchanged, the absolute stock of cross-border claims would have increased significantly, result-ing in a larger flow each year. The international role of these institutions has increased more than that, however, because they are increasingly willing to invest outside their respective home countries.
2Large nonbank institutional investors are comprised of pension funds, insurance companies, and mutual funds.
improve the investment climate in recipi-ent countries. Direct investment is aimed at establishing a solid market presence in faster growing markets (linked closely to world eco-nomic growth). Most companies considered cross-border investment in mature markets as similar in risk to investment in their home countries; EM investments were viewed as higher risk. Factors identified by investors as important in attracting FDI were low political risk, a moderate tax burden, and good investor protection.
The survey found that inward FDI flows are determined by growth prospects and in large part financed by the parent company. Profit and dividend remittances are primarily deter-mined by taxation and controls on remittances. Financial instruments are used to manage risks, but high costs associated with such instruments deter a more active use of hedging. These responses confirm earlier work on FDI, includ-ing findings that FDI is expected to be procycli-cal and flow to large and fast-growing markets with good investment climates.
ASSET ACCUMULATION AND IMPLICATIONS FOR CROSS-BORDER FLOWS
67
CHAPTER II CHANGES IN THE INTERNATIONAL INVESTOR BASE AND IMPLICATIONS FOR FINANCIAL STABILITY
68
Decline in Home Bias
The increase in assets under management of mature market institutional investors has been accompanied by a trend decline in home bias—defined as portfolio allocations being biased toward the home country—evident both in portfolio equity and debt holdings (Figure 2.3). Investments from continental Europe and Japan have traditionally been more tilted to debt instruments, while those of the United Kingdom and the United States have remained more “equity centric,” although there has been an increase in the share of invest-ments in debt.
Europe saw the most significant decline in home bias. Cross-border claims increased by $6.1 trillion during 2001–05, mainly in debt instruments and within continental Europe and the United Kingdom (Box 2.2).
The international portfolio assets of the United States grew from $2.3 trillion to $4.6 tril-lion over the same period, with large equity investments in offshore financial centers and other MM countries, including Japan and the United Kingdom. An analysis of portfolio trends indicates that the institutional investor base in the United States has shifted in favor of a more internationally diversified allocation (Box 2.3).
Cross-border portfolio claims from Japan almost doubled between 2001 and end-2005, reaching $2.1 trillion. This growth was led mainly by investments by Japanese mutual funds into sovereign and agency bonds in liquid mature markets, and more recently, into EM assets.
In contrast with the MM countries, domestic institutional investors in EM countries invest primarily within their own national boundaries, despite rapidly growing assets under manage-ment in a number of those countries. In Latin America, for example, assets under manage-ment of funded pension funds stood at over $200 billion, compared with less than $75 bil-lion in 1995. Assets under management of EM mutual funds more than doubled between 2000 and 2005, reaching about $800 billion. How-ever, regulatory restrictions on asset managers
Investment companies Pension funds Insurance companies
050403020120009519900
10
20
30
40
50
60
Sources: International Financial Services, London; OECD; and IMF staff estimates.
Figure 2.2. Assets Under Management of InstitutionalInvestors in Mature Markets(In trillions of U.S. dollars)
0
1
2
3
4
5
6
7
8
0
1
2
3
4
5
6
7
8
Developed EuropeNorth AmericaDeveloped Asia
2001 02 03 04 05 2001 02 03 04 05
Debt Equity
Source: IMF staff calculations based on the Coordinated Portfolio Investment Survey.
Figure 2.3. Portfolio Cross-Border Assets Held byMature Markets(In trillions of U.S. dollars)

The process of European integration has had the largest impact on capital flows. Developed Europe’s share in both global capital outflows and inflows jumped to around 70 percent by 2005 from 50 to 55 percent a decade earlier (see figure below). There seem to be three elements contributing to this phenomenon.
First, intra-European cross-border capital movements have surged, fueled by adoption of the euro as common currency and the removal of for-eign currency risk, regulatory harmonization, and the integration of markets for goods. About 50 per-cent of the cross-border capital flows originating from the euro area countries are redistributed among the countries themselves. There is consider-able empirical support for euro-area bias in bond portfolios, as European Monetary Union member countries disproportionately invest in one another relative to other country pairs (Lane, 2006).
Second, euro area countries’ and U.K. capital movement has been fueled by the increasing
importance of London as an international financial center. London effectively acts as a hub of the intra-European interbank market. According to the European Central Bank’s balance of payments statistics for the consolidated euro area, about one-half of the area’s cross-border capital outflows during 2005Q4–2006Q3 was directed to other European Union (EU) countries that do not belong to the euro area, with the United Kingdom accounting for 90 percent of it. U.K. investors are also turning to the euro market.
Third, western European banks and other finan-cial institutions have been providing large amounts of financing to emerging Europe in connection with the integration of those economies into Europe (see Chapter III).
The dominance of intra-European flows is likely to persist at least for a while, as EU integration is still widening and deepening. This may have ramifications on financial stability because the increased intra-European flows may lead to more rapid and severe transmission of adverse shocks among European countries.
Box 2.2. Shifting from Home Bias to “Intra-European” Bias?
–1000
0
1000
2000
3000
4000
5000
6000
7000Emerging markets
North America
Non-U.K. developed Europe
United Kingdom
Developed Asia
All
1995 97 99 2001 03
8%
20%
35%
21%
51%
8%
Developed AsiaNon-U.K. developed EuropeEmerging markets
United KingdomNorth America
16%4%
27%
10%
05
1996
2005
Regional Breakdown of Gross Outflows(In billions of U.S. dollars)
Source: IMF, International Financial Statistics.
Note: The authors of this box are Mangal Goswami and Jack Ree.
ASSET ACCUMULATION AND IMPLICATIONS FOR CROSS-BORDER FLOWS
69
CHAPTER II CHANGES IN THE INTERNATIONAL INVESTOR BASE AND IMPLICATIONS FOR FINANCIAL STABILITY
70
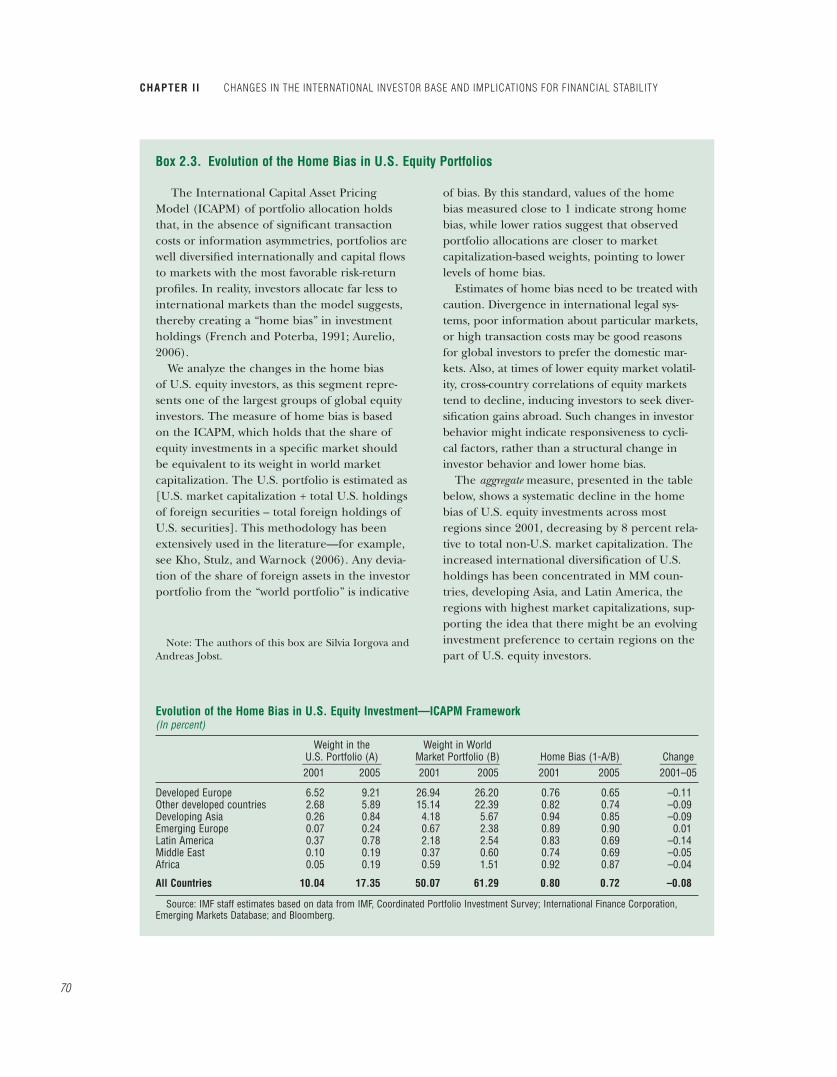
The International Capital Asset Pricing Model (ICAPM) of portfolio allocation holds that, in the absence of significant transaction costs or information asymmetries, portfolios are well diversified internationally and capital flows to markets with the most favorable risk-return profiles. In reality, investors allocate far less to international markets than the model suggests, thereby creating a “home bias” in investment holdings (French and Poterba, 1991; Aurelio, 2006).
We analyze the changes in the home bias of U.S. equity investors, as this segment repre-sents one of the largest groups of global equity investors. The measure of home bias is based on the ICAPM, which holds that the share of equity investments in a specific market should be equivalent to its weight in world market capitalization. The U.S. portfolio is estimated as [U.S. market capitalization + total U.S. holdings of foreign securities – total foreign holdings of U.S. securities]. This methodology has been extensively used in the literature—for example, see Kho, Stulz, and Warnock (2006). Any devia-tion of the share of foreign assets in the investor portfolio from the “world portfolio” is indicative
of bias. By this standard, values of the home bias measured close to 1 indicate strong home bias, while lower ratios suggest that observed portfolio allocations are closer to market capitalization-based weights, pointing to lower levels of home bias.
Estimates of home bias need to be treated with caution. Divergence in international legal sys-tems, poor information about particular markets, or high transaction costs may be good reasons for global investors to prefer the domestic mar-kets. Also, at times of lower equity market volatil-ity, cross-country correlations of equity markets tend to decline, inducing investors to seek diver-sification gains abroad. Such changes in investor behavior might indicate responsiveness to cycli-cal factors, rather than a structural change in investor behavior and lower home bias.
The aggregate measure, presented in the table below, shows a systematic decline in the home bias of U.S. equity investments across most regions since 2001, decreasing by 8 percent rela-tive to total non-U.S. market capitalization. The increased international diversification of U.S. holdings has been concentrated in MM coun-tries, developing Asia, and Latin America, the regions with highest market capitalizations, sup-porting the idea that there might be an evolving investment preference to certain regions on the part of U.S. equity investors.
Box 2.3. Evolution of the Home Bias in U.S. Equity Portfolios
Note: The authors of this box are Silvia Iorgova and Andreas Jobst.
Evolution of the Home Bias in U.S. Equity Investment—ICAPM Framework(In percent)
Weight in the Weight in World U.S. Portfolio (A) Market Portfolio (B) Home Bias (1-A/B) Change_______________ ________________ ________________ _______2001 2005 2001 2005 2001 2005 2001–05
Developed Europe 6.52 9.21 26.94 26.20 0.76 0.65 –0.11Other developed countries 2.68 5.89 15.14 22.39 0.82 0.74 –0.09Developing Asia 0.26 0.84 4.18 5.67 0.94 0.85 –0.09Emerging Europe 0.07 0.24 0.67 2.38 0.89 0.90 0.01Latin America 0.37 0.78 2.18 2.54 0.83 0.69 –0.14Middle East 0.10 0.19 0.37 0.60 0.74 0.69 –0.05Africa 0.05 0.19 0.59 1.51 0.92 0.87 –0.04
All Countries 10.04 17.35 50.07 61.29 0.80 0.72 –0.08
Source: IMF staff estimates based on data from IMF, Coordinated Portfolio Investment Survey; International Finance Corporation, Emerging Markets Database; and Bloomberg.

and pension funds, and the underdevelopment of their domestic insurance markets, have reduced the scope of EM countries to diversify their portfolios internationally (IMF, 2004; Chan-Lau, 2004).
Increased assets under management com-bined with the relaxation of regulatory restric-tions and technological advances have made it possible for more pension funds to diversify their portfolios internationally (Table 2.1). Pension fund investment in foreign markets has traditionally been hampered by regula-tions limiting or prohibiting investment abroad or by factors that encourage home bias more generally (such as asymmetry of information and greater transactions costs). Furthermore, initiating investment abroad and into new asset classes usually involves certain costs, creating a threshold effect: the investor must first become familiar with the behavior of prices for the new asset and how they relate to other items in the portfolio; trading mechanisms and relationships with trading partners need to be established; the regulatory environment of the new market must be investigated; and entry might require the completion of a licensing process. Some of these barriers have been overcome through regulatory liberalization and technological advances.
With both institutional investors, such as pen-sion funds, and individual investors looking to increase their foreign asset allocations, the asset management industry in turn has also become more geographically diversified. The increasing allocation to EM assets is another indication of the decline in home bias. Dedicated U.S. EM mutual funds have been growing rapidly, from $27 billion in late 2000 to about $230 billion as of mid-2006, albeit with some periods of volatil-ity. In an asset management survey of 175 global financial services executives, around two-thirds of the respondents said globalization would be the main profitability driver going forward (Deloitte Touche Tohmatsu, 2006). In Europe, for example, cross-border fund registration accounted for half of all funds in 2005, and in some countries, such as Germany, the number
of foreign funds available to investors exceeded that of domestic funds. The demand for for-eign assets is reflected in the league tables of the top-selling mutual funds in Europe in 2005 (Figure 2.4).
Hedge Fund Growth Driven byInstitutional Demand
Institutional investors are increasingly relying on hedge funds as a vehicle to achieve higher risk-adjusted returns, including through inter-national exposures. Lower returns from con-ventional investments have induced a change in the investment behavior of institutional inves-tors, making them more attracted to absolute return investments and leading them to actively seek “alpha”—the excess return on a particular
Table 2.1. Pension Fund Asset Allocation inSelected Countries(In percent of pension fund portfolios)
Equities Bonds_________________ _________________Inter- Inter-
Domestic national Domestic national Other
United States1994 41 7 42 1 91999 55 10 27 1 72005 48 15 32 1 4
Japan1994 24 6 55 6 91999 40 19 32 7 22005 30 18 24 13 15
United Kingdom1994 54 23 9 4 101999 51 24 13 4 82005 34 32 22 3 9
Netherlands1994 10 13 62 4 111999 12 38 22 19 92005 6 43 5 33 13
Australia1994 35 12 30 3 201999 39 16 22 3 202005 32 27 14 5 22
Canada1
1994 32 13 48 71999 34 17 45 142004 30 26 36 8
Spain1
1994 4 1 57 3 351999 11 14 40 13 222004 6 16 18 28 32
Sources: UBS Global Asset Management (2005); and OECD (2006a).1OECD (2006a).
ASSET ACCUMULATION AND IMPLICATIONS FOR CROSS-BORDER FLOWS
71

CHAPTER II CHANGES IN THE INTERNATIONAL INVESTOR BASE AND IMPLICATIONS FOR FINANCIAL STABILITY
72
asset.3 This shift has enabled investments in hedge funds and alternative assets to gradually enter mainstream portfolio allocations, through which asset managers gain access to more aggressive investment strategies such as the use of leverage (including through derivatives), short sales of securities, and exposures to new asset classes (e.g., commodities) and less liquid assets (e.g., private equity and real estate) in order to enhance the risk/return characteristics in their portfolios.4
Pension funds and funds of hedge funds have become increasingly important inves-tors in hedge funds (European Central Bank, 2006). According to market estimates, assets under management of the hedge fund industry, though small compared with other institutional investors, grew from $30 billion in 1990 to more than $1.4 trillion as of end-2005. The number of hedge funds (excluding funds of funds) multi-plied from only 530 in 1990 to more than 6,700 by 2005. Global institutional investors’ capital allocated to hedge funds was estimated at $360 billion as of end-2005, representing 30 percent of total hedge fund assets under management (Figure 2.5). U.S. institutional investment in hedge funds more than doubled to $136 billionfrom 2003 to 2005, much of which came from pension fund allocations (Bank of New York and Casey, Quirk and Associates, 2006). U.K. pen-sion funds increased their allocation to hedge funds from 2 percent of their portfolio in 2001 to almost 5 percent in 2004 (JPMorgan Fleming Asset Management, 2005).
Emergence of New Players––Emerging MarketOfficial Sector and Sovereign Wealth Funds
Gross official international reserves have increased dramatically in recent years, more
3For the period 1990–2005, the Equal Weighted Hedge Fund Index had a higher return (15.1 percent) and higher Sharpe ratio (1.58)—the ratio of returns to risk—than other stock and bond portfolio benchmarks (Center for International Securities and Derivatives Markets, 2006).
4Recent trends in the hedge fund industry and growth in private equity funds are examined in Annex 1.4 in Chapter I.
0
5
10
15
20
0
10
20
30
40
50
60
Top-Selling Mutual Funds by Sector in Europe in 2005(In billions of euros)
Foreign Asset Manager Share of Institutional MandatesOriginated in the Home Country(In percent)
Japa
n
United
Kingdo
m
Netherl
ands
Switzerl
and
Italy
German
yFra
nce
Scand
inavia
n
coun
tries
Europ
eGlob
al
North A
merica
Emerg
ing m
arkets Ind
ia
Mid/Small
cap
Europ
ean c
orpora
tes
Pacific
exclu
ding J
apan
Centra
l and
Easte
rn Eu
rope
Raw m
ateria
ls
and e
nergy
Figure 2.4. Globalization of the Asset Management Industry
Source: Van Steenis (2006).

Table 2.2. Accumulation of Official ForeignExchange Reserves of Selected Countries(In billions of U.S. dollars)
Level of Official Reserves1__________________
Country End-1999 End-2006 Change
China 158 1,068 910Japan 287 880 593Russia 8 296 288Korea2 74 234 160India 33 171 138Singapore 77 137 60Brazil 35 86 51Malaysia 31 82 51Algeria 5 78 73Mexico 32 76 44Turkey 23 61 38Libya 7 59 52Nigeria2 5 42 37Total 775 3,270 2,495
Memorandum:All countries, total reserves
(excluding gold)3 1,882 5,072 3,190All countries, total reserves
(including gold)3,4 2,163 5,624 3,461
Source: IMF, International Financial Statistics (IFS).1Excluding gold.2End-November 2006. 3Country coverage conforms with the IFS world table on total
reserves.4Including gold at market prices.
than doubling since 2002 to reach nearly $5 trillion by end-September 2006 (Table 2.2). Generally, countries with large current account surpluses have also been those with the largest accumulations. The sheer volume of foreign exchange reserves held by surplus countries, currently in excess of $3 trillion for develop-ing Asia and Japan, and another $700 billion in oil-exporting developing countries, has led to an unprecedented concentration of funds within the official sector. China’s reserves exceed $1 trillion.
More recently, the governments of commodity-producing countries, especially oil producers, have become large investors in financial instruments, in particular in bonds and equities. These investments are made by sovereign wealth funds directly or through the placement of funds with external invest-ment managers. Market estimates indicate that these funds manage over $1.4 trillion,
Individuals
Fund of funds
Pension funds
Corporations and institutions
Endowments and foundations
0
20
40
60
80
100
1996 98 2000 02 04
Source: Hennessee Group LLC.
Figure 2.5. Global Hedge Funds, Investor Base(In percent)
ASSET ACCUMULATION AND IMPLICATIONS FOR CROSS-BORDER FLOWS
73

CHAPTER II CHANGES IN THE INTERNATIONAL INVESTOR BASE AND IMPLICATIONS FOR FINANCIAL STABILITY
74
the bulk of which is in oil-related funds, with the remainder belonging to investment and public pension funds of export-oriented countries or non-oil commodity funds (Table 2.3).
As a result of these developments, the official sector has become a key player in cross-border asset allocation and has contributed to the financing of global imbalances. EM countries as a group are now a net supplier of capital to MM countries, largely mirroring the U.S. exter-nal financing gap, through portfolio debt flows (Figure 2.6). Importantly, this movement of capital from EMs to MMs is primarily channeled through central banks and sovereign wealth funds, mainly of oil exporters in the most recent period.
Data Constraints
More disaggregated data is needed to carry out further analysis of the asset allocation behav-ior of different types of investors and implica-tions on asset prices and volatility of capital flows. However, the statistics on international capital flows and positions are not comprehen-sive. For example, the Coordinated Portfolio Investment Survey (CPIS) data on cross-border portfolio investments are limited by the num-ber of countries and the spectrum of investors that participate in the survey. While this applies mainly to position data, the country cover-
age of the statistics has significantly improved in recent years (Box 2.4). Furthermore, the complexity and comingling of new financial instruments with traditional instruments and the intermediation nature of financial markets make it difficult to map ultimate capital flows to the investor base. As such, data may not always represent actual exposures, mainly because they could well reflect only one leg of the positions taken by a market participant that also takes an offsetting position through its access to the offshore derivatives and/or the nondeliverable forward market. Market participants indicate that a multitude of reverse trades and protection mechanisms complicate the identification of the ultimate investor in a certain asset.
Bearing in mind these caveats, the analysis in the next section uses the available data to dis-cern the asset allocation behavior of the investor base and its implications for asset prices and volatilities.
Asset Allocation Behavior andImplications for Asset Prices
Investment Strategies
Different types of investors—individuals, banks, insurance and pension funds, hedge funds, public sector institutions, etc.—have dif-ferent objectives and face varying constraints that also affect their investment allocation
Table 2.3. Top Sovereign Wealth Funds
Country Sovereign Wealth FundsAssets Under Management
Source(In billions of U.S. dollars)
United Arab Emirates1 Abu Dhabi Investment Authority 250–500 OilNorway Government Pension Fund 263 OilSingapore Government of Singapore Investment
Corporation>100 Non-commodity
Kuwait1 Kuwait Investment Authority 160–250 OilRussia Oil Stabilization Fund 89 Oil
Sovereign external assetsSaudi Arabian Monetary Agency and
government institutions 276 Oil
Sources: Norges Bank; Saudi Arabian Monetary Agency; Ministry of Finance of Russia; Government of Singapore Investment Corporation; Pacific Management Investment Company (PIMCO); and Toloui (2007).
1Based on market estimates (PIMCO).

decisions, including the regulatory environ-ment and their liability structures, time hori-zons, internal governance, and “investment cultures.” The frequency of strategic changes in asset allocation, in particular, varies sub-stantially across institutions. At one extreme, proprietary trading desks at banks (including investment banks) and certain hedge funds may focus on rapidly changing (sometimes within a single day) relative value strategies. In contrast, life insurance companies tend to implement more medium-to-long-term strategic asset allocation, usually reviewing such strate-gies on a semi-annual or annual basis. Similarly, defined-benefit pension funds typically con-duct a full asset and liability review only every one to three years, and generally rely more on external advice and expertise, such as that from investment advisory companies. For defined-contribution pension funds and investment companies, asset allocation processes and strat-egies can be very diverse, reflecting the specific investment needs and styles of the individual investor (e.g., benchmarking vs. absolute return focus).5
Central banks also have long horizons but are generally required to maintain high liquid-ity, and their investment policies are relatively conservative. Typically they hold investment-grade, short-term, liquid sovereign assets in major currencies. However, with the pace of reserve accumulation outpacing the issuance of short-term government bonds, reserve manag-ers are increasingly choosing to move outside of their “preferred habitat” (Figure 2.7). With a projected reduction in fiscal deficits, the sup-ply of government bonds in major currencies could further decelerate, with possible implica-tions for the sustainability of these trends. Thus, investment authorities are increasingly allocating reserve assets with risk-return considerations and diversifying into new asset classes—for example, away from their investments in U.S. Treasury securities into U.S. mortgage-backed securities,
5See previous issues of the Global Financial Stability Report (IMF, 2004, 2005a, and 2005b).
–800
–600
–400
–200
0
200
400
600
1974 77 80 83 86 89 92 95 98 2001 04
Source: IMF, World Economic Outlook database.Note: EM = emerging market; MM = mature market; C/A = current account.
Reserve building, as a capital outflow item, is shown as a negative entry.
Figure 2.6. Current Account, Capital Flows, andReserve Accumulation(In billions of U.S. dollars)
EM-Private capital flows
EM-C/A
EM-Reserves
MM-C/A
ASSET ALLOCATION BEHAVIOR AND IMPLICATIONS FOR ASSET PRICES
75

CHAPTER II CHANGES IN THE INTERNATIONAL INVESTOR BASE AND IMPLICATIONS FOR FINANCIAL STABILITY
76
U.S. agency debt, and other dollar-denominateddebt like high-grade corporate bonds and investment-grade sovereign external debt in EMs (Carver, 2006).
Sovereign wealth funds have more latitude in their investment policies than central banks. For example, the Norwegian Government Pen-sion Fund and the Government of Singapore Investment Corporation both operate as pro-fessional asset managers and invest in a wide set of mature and emerging market securities (more recently, other countries such as Korea have adopted a similar model). Estimates of oil exporters’ official asset accumulations of about $464 billion between 2003 and 2006 are barely reflected in reported purchases in U.S. securi-ties markets (Figure 2.8).6 Anecdotal evidence, however, suggests that oil exporters’ purchases of U.S. securities are intermediated by institu-tions in the United Kingdom and offshore centers.
Implications for Asset Prices
The increasing supply of international capital and the widening of the investor base have been reflected in, and are affected by, the pricing of financial assets. As the demand for international assets has expanded, the premia incorporated in their yield have tended to fall. The combination of rising volumes for many asset classes and fall-ing returns confirms that the major change has been in the demand for these assets, especially for fixed-income assets, rather than their supply. The effects of the broadening investor base on the volatility and pricing are illustrated with two specific asset classes: U.S. Treasury securities and EM bonds.
U.S. Treasury Securities
The share of U.S. Treasury securities held by foreigners has almost tripled over the past decade, and the acquisition by foreign official institutions of U.S. long-term securities (long-
6For an analysis on petrodollar recycling, see McGuire and Tarashev (2005).
0
5000
10000
15000
20000
25000
Global foreignexchange reserves
G-4 short-termgovernment bonds
All government bonds
G-4 governmentbonds(total)
1989 91 93 95 97 99 2001 03 05 Jun06
Sources: IMF, International Financial Statistics; and Bank for International Settlements, securities statistics, 2006.
Figure 2.7. Foreign Exchange Reserves and theShort-Term Government Bond Market(In billions of U.S. dollars)
BIS depositsless loans212 (45%)Long-term
U.S. agencies63 (14%)
Long-termU.S. corporates
29 (6%)
Net merger andacquisition
activity28 (6%)
U.S. equities26 (6%)
U.S. long-termtreasuries12 (3%)
Short-term U.S. assets(treasuries, agency)
94 (20%)
Figure 2.8. Leading Oil Exporters: Major AssetPurchases, 2002–06(In billions of U.S. dollars and in percent)
Source: Pacific Investment Management Company.Note: BIS = Bank for International Settlements.

term U.S. Treasury and U.S. government agency securities) has contributed significantly to this buildup (Table 2.4). The size and depth of U.S. financial markets makes them the primary arena
for such foreign investors, including central banks, and sovereign wealth funds.
The demand for U.S. Treasury bonds from non-U.S. official institutions, including sov-
As a high priority, the International Mon-etary Fund undertakes multilateral surveillance to analyze and monitor the growing financial linkages among economies and their external financial vulnerability from a market perspec-tive. Accordingly, the focus of the analytical framework is increasingly shifting to metrics of financial positions, which capture financial exposures to partner countries in a consistent manner. Several initiatives are under way in the IMF’s Statistics Department (STA) to meet these statistical needs.
In addition to balance of payments flows sta-tistics, the IMF has been encouraging countries to compile and disseminate international invest-ment position (IIP) data. From 37 countries in 1998, there are now more than 100 countriesthat report IIP statistics. Reporting on external positions was further promoted by the decision to include the IIP data as a prescribed category of the IMF Special Data Dissemination Standard as of December 31, 2001.
In the mid-1990s, STA launched the Coor-dinated Portfolio Investment Survey (CPIS), which provides bilateral information on countries’ holdings of portfolio investment securities—equities and debt securities—by partner country. The CPIS results also help countries that issued securities to identify the counterpart countries holding their securities.
In March 2006, the BIS, IMF, the Organiza-tion for Economic Cooperation and Develop-ment (OECD), and the World Bank jointly launched the Joint External Debt Hub (JEDH) to provide more information on external debt. The JEDH brings together countries’ exter-nal debt data (national data) with data from creditor/market sources, facilitating compari-
sons between the issuing and creditor countries.1
For example, the national data provide quarterly data (liabilities) by issuing countries, whereas, from a creditor perspective, the BIS Inter-national Banking Statistics provide quarterly information of countries’ bank claims on other countries, and the CPIS on countries’ holdings of debt and equity securities of other countries.
Moving forward, STA is investigating the feasi-bility of conducting a Coordinated Direct Invest-ment Survey for an end-2009 reference year. Like the CPIS, the survey is intended to provide harmonized partner country data that could be used to derive measures of a country’s foreign direct investment liabilities (i.e., equity and loans received from foreign direct investors) as well as similar data series on a country’s direct investment assets (i.e., equity and loans pro-vided to affiliated enterprises). The data from a Coordinated Direct Investment Survey, together with the data in the JEDH, would provide bilat-eral information on the most significant compo-nents of the IIP.
An important aspect of current and future efforts is the compilation of data according to common standards in order to ensure cross-sectoral consistency. The update to the Balanceof Payments Manual, currently under way, will expand on the standard components of the sectoral allocation of flows and positions. The four-sector breakdown in the current manual (namely, monetary authorities, general gov-ernment, banks, and other sectors) will be expanded to the full sector classification used in the System of National Accounts. Moreover, for the purposes of the standard components, the other sectors category is to be split into financial and nonfinancial sectors.
1See http://devdata.worldbank.org/sdmx/jedh/jedh_home.html.
Box 2.4. The Importance of Internationally Comparable Bilateral Statistics
Note: The authors of this box are Lucie Laliberté and John Motala of the IMF Statistics Department.
ASSET ALLOCATION BEHAVIOR AND IMPLICATIONS FOR ASSET PRICES
77

CHAPTER II CHANGES IN THE INTERNATIONAL INVESTOR BASE AND IMPLICATIONS FOR FINANCIAL STABILITY
78
ereign wealth funds, has been more stable than that from other investors (Figure 2.9; see also Chapter I). Furthermore, in recent years, foreign official investors seem to be leaning against the wind in this market, more specifi-cally, increasing U.S. dollar-denominated assets during periods of heightened selling pressure from private sector market participants. The monthly correlation between non-U.S. official and private net purchases of the long-term U.S. Treasury securities over the latest 36 and 24 months is –0.27 and –0.41, respectively, whereas over the entire 1996–2006 period it is estimated at 0.75.
The decline in the term premia of long-term bonds in the United States can partly be attributed to increased international demand, and to the investment pattern of EM central banks. Prima facie evidence of lower premia for holding long-term assets is observed in lower implied volatilities of government bond futures. Several empirical studies have shown that foreign inflows tend to have an economi-cally large and statistically significant impact on long-term interest rates, although estimates vary widely, ranging from 30 to 100 basis points (Table 2.5).
Emerging Market Bond and Credit Default Swap Spreads
Stronger inflows into EM external debt markets from MM economies have supported prices in this asset class (Table 2.6). Other contributing factors include improved eco-nomic performance of these EM countries, lower financial market volatility, a lower yield on MM sovereign assets, and perhaps the recent decline in net issuance of EM external debt in the context of an overall asset-liability management strategy (IMF, 2006a). A recent empirical study found that the flows from East Asia had a statistically significant impact on the decline in EM yield spreads between June 2004 and May 2005—a period during which East Asian reserves accumulation approached $400 billion (IMF, 2006b). However, the study did not find any discernible effect of oil-related buying of EM debt securities on their yield spreads.
Volume growth, especially of credit deriva-tive swaps (CDS) contracts with sovereign debt underlying them, has been strong, reflecting increased demand among investors for EM exposure. Since net issuance of external debt has declined substantially as EM countries
Table 2.4. Distribution of Foreign-Owned U.S. Long-Term Securities
Dec. Mar. June June June June Type of Security 1994 2000 2002 2003 2004 20051
Equity Total outstanding (in US$ billions) 7,767.0 24,703.0 17,904.0 17,941.0 20,779.0 22,041.0Foreign-owned (in percent) 5.1 6.9 7.8 8.7 9.3 9.7
Of which: Official institutions 0.4 0.4 0.5 0.6 0.6 0.8
Marketable U.S. Treasury Total outstanding (in US$ billions) 2,392.0 2,508.0 2,230.0 2,451.0 2,809.0 3,093.0Foreign-owned (in percent) 19.4 35.2 40.7 45.5 50.8 51.7
Of which: Official institutions 10.9 18.5 25.1 26.6 32.5 34.1
U.S. Agency Total outstanding (in US$ billions) 1,982.0 3,575.0 4,830.0 5,199.0 5,527.0 5,591.0Foreign-owned (in percent) 5.4 7.3 10.2 11.3 11.2 14.1
Of which: Official institutions 0.6 2.5 2.8 3.5 3.8 5.8
Corporate and Other Debt Total outstanding (in US$ billions) 3,556.0 5,713.0 7,205.0 7,852.0 8,384.0 8,858.0Foreign-owned (in percent) 7.8 12.3 15.7 15.7 17.4 19.5
Of which: Official institutions 0.1 0.2 0.2 0.3 0.5 0.7
Source: U.S. Treasury. 1The latest annual survey of the U.S. Treasury covering the distribution of foreign-owned U.S. securities through June 2006 was scheduled to
become available on March 30, 2007.

have turned to local currency debt to meet their financing needs (Turner, 2006), investors have met their EM exposure targets by selling protection on sovereign issuers and driving CDS spreads down. The term structure of CDS spreads has shifted downward as spreads have tightened regardless of maturity over the last three years (Figure 2.10).
Financial Stability ImplicationsThe issues addressed in this chapter that
center around the growth in cross-border capital flows and the widening of the investor base have implications for the stability of finan-cial institutions and markets, and economies more widely. This section reviews the channels whereby changes in the investor base and inves-tor behavior might have effects on financial and economic stability—be they desirable or undesirable—and marshals evidence to assess the balance of these effects. The discussion below is organized around two themes: first, the possible effects on recipient countries of cross-border flows; and second, the stability of finan-cial institutions themselves.
Implications for Recipient Countries
The potential benefits and risks for recipi-ents of international capital flows have been subject to extensive theoretical and empirical study (Edwards, 2001; Klein and Olivei, 1999; Rodrik, 1998). Under the right conditions, large inflows can contribute to consumption
Table 2.5. Estimates of the Effect of ReserveAccumulation on U.S. Treasury Yields(In basis points)
Merrill Lynch 30JPMorgan 30–50Goldman Sachs 40Eurosystem 65Hauner and Kumar 90Ben Bernanke and others 50–100
Sources: European Central Bank; Eurosystem; and Hauner and Kumar (2006).
0
5
10
15
20
25
30
35
40
45
1978 81
Total net non-U.S. purchasesNon-U.S. private investorsNon-U.S. official institutionsInternational and regional organizations
84 87 90 93 96 99 2002 05
Figure 2.9. Volatility of Net Cross-Border Purchasesof Long-Term U.S. Treasury Securities(In billions of U.S. dollars)
Source: IMF staff estimates based on U.S. Treasury Department, TreasuryInternational Capital System data.
Note: Volatility estimates based on conditional standard deviation (GARCH).
FINANCIAL STABILITY IMPLICATIONS
79

CHAPTER II CHANGES IN THE INTERNATIONAL INVESTOR BASE AND IMPLICATIONS FOR FINANCIAL STABILITY
80
smoothing, or to capital accumulation and, thus, growth and diversification of the local economy (Kose and others, 2006). Inflows can also be a conduit for institutional improve-ments that favor improved economic per-formance, for example, through technology transfer and better corporate governance and transparency. Yet, dependence on inflows implies vulnerability to a possible sudden stop or reversal (Froot, O’Connell, and Seasholes, 2001). Inflows may be associated with undesir-able domestic effects such as asset price bub-bles, dangerously rapid credit growth, inflation, and real currency appreciation—even though in many cases the underlying cause of large inflows and the associated negative develop-ments may be domestic distortions, which the inflows sustain at least temporarily.
Rapid cross-border asset accumulation among many countries might contribute to overall macroeconomic stability, but may also create vulnerabilities. The stabilizing influence is based on the diversity of investor behavior and on increased means to smooth consumption, investment, and financing. Nonetheless, the very size of world capital flows, documented in this chapter, prompts questions concern-
ing their role in transmitting, amplifying, and possibly triggering economic disturbances. The trend toward larger flows implies that even the world’s largest economies rely on the continued smooth functioning of international capital markets. This implies that a small shift in world demand for any given asset could send its price soaring or plunging, depending on the depth and liquidity of the market for that asset. Even a net capital exporter may be severely affected, either by a shift in world demand for its own assets, or because demand for foreign assets by its investors rises or falls abruptly. Furthermore, macroeconomic interlinkages may be reinforced: if, say, country A is heavily invested in the financing of country B’s real estate market, then a fall in housing prices in B and a rise in mortgage defaults could have a wealth effect in A. Each country may better insure itself against local disturbances, but each takes on exposure to shocks in other countries.
Volatility of Capital Flows
The volatility of net and gross capital flows has increased substantially over the past decade, both in MM countries and in some
Table 2.6. Determinants of Returns on Emerging Market External Debt
Dependent variable Change in the Emerging Market Bond Index Global composite index values (returns on EM external debt).
Explanatory variables Dedicated EM debt fund inflows; VIX (implied volatility index of the U.S. stock market ); economic risk rating (International Country Risk Guide), which includes inflation, ratios of budget balance to GDP, and current account to GDP (higher rating indicates improved economic health); and yield on 10-year U.S. Treasury bonds.
Estimation results Estimation method: Two-stage least squares using lags of explanatory variables as instruments; Newey-West HAC standard errors & covariance.
Sample 1998:1–2006:4, quarterly.
Variable Coefficient Std. Error t-Statistic Prob.
Flow to EM debt fund 0.149 0.062 2.361 0.020Change in VIX –0.969 0.289 –3.342 0.001
in economic risk 3.762 1.056 3.560 0.001 in U.S. T-bond yield –7.024 2.691 –2.609 0.011
Constant 0.916 0.857 1.070 0.288R-squared 0.333Adjusted R-squared 0.304Durbin-Watson statistic 2.185
Sources: IMF staff estimates based on AMG; Bloomberg L.L.; JPMorgan Chase & Co.; and countrydata.com.

EM countries (Figures 2.11 and 2.12).7 The increase is seen not only in absolute terms, but also relative to GDP. Mature market countries have seen a sharp rise in net flow volatility, as in the case of the United States, given the size of flows needed to finance its large cur-rent account deficit. However, the volatility of gross flows in and out of European countries is much higher, reflecting the integration of their financial markets. The United Kingdom and Singapore display especially high and rising volatility, consistent with their roles as financial centers.8
For emerging markets, volatility of outflows has generally increased, while the volatility of inflows has been mixed. In particular, volatil-ity of inflows is lower in those countries that witnessed strong capital inflows followed by a crisis during the 1990s (e.g., Brazil, Korea, and Mexico). While some countries (e.g., Thailand) have attempted to tighten controls on inflows of capital, others have taken measures to liberalize capital outflows (Table 2.7), build up reserves, and increase the flexibility of exchange rate movements (IMF, 2007).
The international reserves available to miti-gate the effects of fluctuating capital flows are now larger in both absolute and relative terms. Emerging market countries, which tradition-ally were most susceptible to sudden stops, have responded by reducing government borrowing abroad and accumulating foreign exchange reserves to act as buffers, which may also dis-courage speculative pressures and dampen volatility. Therefore, the rise in cross-border capital flow volatility, when scaled by foreign exchange reserves, exhibits a relatively more benign picture for most of these EM countries. In most cases, the ratio of the net capital flow
7This volatility in capital flows contrasts with relatively low volatility in financial market prices in the recent past; since 2001, there has been a secular decline in price volatilities across bonds, equities, and foreign exchange.
8The volatility of capital flows relative to GDP is even higher for Ireland, which is excluded from the figures in order to preserve the scale.
0
50
100
150
200
250
0
1
2
3
4
5
6
7
8
9
10
1-year 3-year 5-yearMaturity term
7-year 10-year
MM (end-2003; right scale)MM (end-2004; right scale)
MM (end-2005; right scale)MM (end-2006; right scale)
EM (end-2003;left scale)
EM (end-2005;left scale)
EM (end-2006;left scale)
EM (end-2004;left scale)
Sources: Bloomberg L.P.; and IMF staff estimates.Note: Year-end spreads for 1, 3, 5, 7, and 10-year CDS contracts on external
sovereign debt for emerging market (EM) and selected mature market (MM) countries. No CDS spreads of 7-year contracts were available at end-2003.
Figure 2.10. Term Structure of Sovereign CreditDefault Swap (CDS) Spreads, 2003–06(In basis points)
FINANCIAL STABILITY IMPLICATIONS
81

CHAPTER II CHANGES IN THE INTERNATIONAL INVESTOR BASE AND IMPLICATIONS FOR FINANCIAL STABILITY
82
1996–2005
1987–96
0 4 8 12 16
ArgentinaBrazil
ColombiaMexico
VenezuelaChina
IndonesiaKorea
MalaysiaThailand
Saudi ArabiaHungary
PolandTurkey
South AfricaCanada
United StatesAustria
DenmarkFrance
GermanyItaly
SpainUnited Kingdom
AustraliaJapan
Singapore
Source: IMF staff estimates based on data from IMF, International Financial Statistics and World Economic Outlook.
Note: Volatility is calculated as the standard deviation of the ratio of capital inflows to GDP over 10 years.
Figure 2.11. Volatility of Capital Inflows(In percent of flows to GDP)
Table 2.7. Liberalization of Capital Outflows:Recent Experiences of Selected Countries
Countries Measures Taken
Brazil(March 2005)
Ceiling lifted on overseas transfers by Brazilian nonfinancial enterprises for the purpose of direct investment; pre-authorization requirement eliminated for financial guarantees by Brazilian entities to their foreign subsidiaries.
Chile(May 2005)
Inward and outward transactions in the form of shares or equity were authorized.
China(April 2006)
Qualified Domestic Institutional Investor (QDII) Program launched, enabling domestic individuals and companies to hold overseas portfolio assets up to a government-determined aggregate quota. For example, the QDII Program allows commercial banks to sell financial products denominated in renminbi to domestic customers, and pool the funds to buy foreign exchange and invest in offshore fixed-income products within the predetermined quota.
Colombia(June 2006)
The Ministry of Finance lifted the requirement that portfolio investments not be liquidated within one year after the date of investment. This reversed a decree of late 2004 that was intended to discourage short-term capital flows.
Korea(January 2007)
Tax breaks and other incentives introduced to facilitate overseas portfolio investments by domestic institutional investors and banks; ceiling on speculative overseas real estate investment raised from $1 million to $3 million; various promotion measures introduced to facilitate overseas foreign direct investment (FDI) (for example, insurance schemes are to be launched or expanded to help hedge FDI-related risks, and the Export-Import Bank of Korea is to expand its overseas investment support capacities).
Malaysia(April 2005)
The threshold for investing abroad rose for institutional investors, including, for example, unit trust management companies, asset management companies, and insurance companies.
South Africa(March 2006)
The limit on investments abroad by resident individuals was more than doubled. The primary remaining restrictions comprise ceilings on portfolio outflows for institutional investors, prohibition of portfolio outflows by corporations, and ceilings on individuals’ offshore investments. The authorities plan to replace quantitative limits on institutional investors with prudential regulations as part of broader reforms of the long-term insurance and pension funds industries.
Source: National authorities.
0 4 8 12 16
1996–2005
1987–96
ArgentinaBrazil
ColombiaMexico
VenezuelaChina
IndonesiaKorea
MalaysiaThailand
Saudi ArabiaHungary
PolandTurkey
South AfricaCanada
United StatesAustria
DenmarkFrance
GermanyItaly
SpainUnited Kingdom
AustraliaJapan
Singapore
Source: IMF staff estimates based on data from IMF, International Financial Statistics and World Economic Outlook.
Note: Volatility is calculated as the standard deviation of the ratio of capital outflows to GDP over 10 years.
Figure 2.12. Volatility of Capital Outflows(In percent of flows to GDP)

volatility to the foreign exchange reserves showed a significant decline from 1996 to 2005 (Figure 2.13).
Diversity of the Investor Base
Greater diversity of investors should in prin-ciple improve stability over the longer term, but there may be downside risks in the near term (BIS Committee on the Global Financial System, 2007). A wider range of investors, represent-ing different types of institutions and different countries, are less likely to suffer simultane-ous, symmetric, or significant shocks that affect their overall willingness to hold foreign assets. If one set of investors suffers a negative shock or for some other reason decides to hold fewer international assets, a different set of investors is likely to take up the slack.
The prediction that a more diverse investor base will stabilize the supply of international capital relies on an assumption that the behav-ior of investors, and in particular that of addi-tions to the investor base, is heterogeneous. Total flows from a wider range of countries should be relatively more stable, provided that co-movements in macroeconomic variables remain limited. In some cases it is intuitive that possible shocks will have largely asymmetric effects on the supply of capital from different countries. For example, oil and commodity producers have in recent years built up large international asset positions, supported by high prices for their main exports. A decline in com-modity prices would reduce flows out of those countries.
Investment Strategies
The supply of international capital may over time be stabilized by the growing role of insti-tutional investors with long-term investment horizons. For example, pension funds and life insurance companies, particularly when contrib-utors have some years before retirement, should have the ability to absorb a greater degree of asset return volatility due to their relatively long time horizon. Hence, they may react differently in the case of market turbulence, and may be
0 10 20 30 40 50 60 70 80
Financial account volatility/reserves(Q1 1995 – Q4 1996)
Financial account volatility/reserves(Q1 2004 – Q4 2005)
VenezuelaMexico
EcuadorColombia
BrazilArgentina
TurkeyRussiaPoland
HungaryThailandMalaysia
IndonesiaIndia
ChinaSouth Africa
Source: IMF staff estimates based on data from IMF, International Financial Statistics.
Figure 2.13. Changes in Net Capital FlowVolatility versus Reserve Ratios
FINANCIAL STABILITY IMPLICATIONS
83

CHAPTER II CHANGES IN THE INTERNATIONAL INVESTOR BASE AND IMPLICATIONS FOR FINANCIAL STABILITY
84
prepared to ride out short-term fluctuations, thereby providing market liquidity at times when it is most needed.9
In contrast, other types of investors such as mutual funds and hedge funds can be subject to redemption pressures. If on-balance-sheet liquid-ity is insufficient to meet large redemptions, these institutions can only meet investors’ with-drawals with the forced sale of their securities, potentially affecting other funds and creating conditions favorable to a market crash. While large-scale redemptions appear to be rare in developed countries, they have occurred in EM countries. For instance, fears of a tightening of interest rates in the United States brought about a crisis in the mutual fund industry in Costa Rica (Carvajal, 2006).
Larger volumes of cross-border capital flows and the greater number of participants may cre-ate only the illusion of diversity if their behavior is highly synchronized—there may be more cows in the pasture, but they still move as a herd. Some asset management funds may be prone to momentum trading and herd behavior, which could turn them into sources of excess volatility, exacerbating the effect of negative shocks in the markets they operate in (see Annex 1.1 in Chap-ter I). Herd behavior can be induced by several factors. For instance, in the case of actively man-aged mutual funds, reputational issues related to the unobserved ability of mutual fund man-agers cause them to mimic each other’s invest-ment behavior (Goldstein, 2005; Scharfstein and Stein, 1990). In the case of indexed funds, especially in retail funds, there is evidence that investment decisions and capital flows in and out of these funds are subject to momentum-investment or positive-feedback investment strat-egies: they tend to buy recent winners and sell
9However, if pension fund shortfalls are marked-to-market and reported on the sponsor’s balance sheet, or result in a higher risk-based premium from a pension insurance scheme, the appetite to absorb volatility may be diminished. Similarly, the turnover of a pension fund’s assets may increase if the fund trustees allocate mandates to fund managers that entail frequent reporting against short-term benchmarks.
recent losers (Grinblatt, Titman, and Wermers, 1995).
Hedge funds have, in recent years, tended to broaden their investment strategies toward more international portfolios. While the established hedge funds (most of which are closed and thus do not accept new money) tend to have less pressure on performance and can withstand higher volatility of returns, the newer entrants are subject to significantly greater pressure on performance because of their shorter track record and greater reliance on funding from funds of funds. During the last few years, hedge fund returns have become more sensitive to a number of asset classes, suggesting that they are taking on more risk (see Box 1.4 in Chapter I).
The growth of assets under management of hedge funds and other leveraged institutions, and the diversity of their investment strategies, can enhance overall market efficiency through improved liquidity and price discovery. Mean-while, more competition for funds has increased the importance of risk management in the hedge fund industry. Further institutionaliza-tion of these firms can also infuse better risk management capabilities, fostering the resilience of the overall financial system. However, the ability of these institutions to lever up their bets during periods of low asset-return volatilities can magnify the potential impact during stress situations. Under pressure, leveraged investors are more likely to need to use the liquidity of the market than to be able to contribute to it. They may also bear substantial interest rate risk. There is a risk that other investors may pull back more than warranted given the uncertainty about overall market exposures to the lever-aged participants and the degree to which price changes are related to domestic fundamentals (Kodres and Pritzker, 2002). The impact can not only put the capital of these institutional investors at risk, but also spread to the broader credit markets and the financial system as large global financial institutions that act as the main conduit for leverage through their prime bro-kerage activities come under pressure to reduce exposure.

Role of Public Sector Financial Asset Holders
Some public sector institutions are now individually large players in world financial markets, which brings its own challenges. A single institution could make sudden portfolio adjustments that could have significant price effects on certain asset classes. Market rumors of such adjustments may lead to volatility, as previous announcements by central banks have shown. In some cases, assets may be shifted for political-strategic reasons rather than eco-nomic and financial reasons. Furthermore, if raw material and energy prices fall, while domestic absorptive capacity rises, countries may intentionally run down their funds and international reserves, reversing past outflows. Therefore, their stabilizing influence cannot be projected into the indefinite future, especially if there is a major turnaround in macroeconomic conditions.
In particular, there is a widely held concern that the buildup in international reserves in recent years could lead to instabilities in financial markets should the reserve holders decide to diversify the currency composition of their reserves (Galati and Woodbridge, 2006). For those countries that provide information about their currency breakdowns, the quarterly changes in reserve holdings (at the aggregate level) show very stable trends over time, with a gradual shift in favor of euros away from the dol-lar and yen.10 Developing countries hold close to 60 percent of their reserves in U.S. dollars, more or less unchanged since 2003, with the decline during 2000–03 dominated by cross-currency val-uation changes (Figure 2.14). As official reserves are invested in low-yielding foreign securities and are thus subject to the risk of a deprecation, there is a need for enhanced transparency and
10Information about the currency composition of reserves by country is not publicly available, but the IMF collects some information about the composition from its members and stores it in its highly confidential Cur-rency Composition of Official Foreign Exchange Reserves (COFER) database. The IMF publicly releases quarterly data on the currency composition at an aggregate level split by industrial and developing countries.
Developing countriesIndustrialized countries
0
10
20
30
40
50
60
70
80
1995 97 99 2001 03 05 Q32006
Source: IMF, Currency Composition of Official Foreign Exchange Reservesdatabase.
Figure 2.14. Share of U.S. Dollars in Reserves(In percent)
FINANCIAL STABILITY IMPLICATIONS
85

CHAPTER II CHANGES IN THE INTERNATIONAL INVESTOR BASE AND IMPLICATIONS FOR FINANCIAL STABILITY
86
accountability in the management of reserves, especially when they are sizable.
Cyclical versus Structural Factors
The recent expansion in the international investor base and the aggregate supply of invest-able funds has come during a period of unusu-ally benign macroeconomic conditions in many countries, and may indeed have contributed to these favorable developments. Most obvi-ously, flows out of countries currently benefit-ing from high oil and commodity prices are dependent on those strong export earnings, but there appears to be a strong cyclical ele-ment in all capital flows. Cyclical factors include high levels of global liquidity and low real and nominal interest rates for much of this decade, and consistently strong growth in many parts of the world. These factors have also influenced investor decisionmaking. One such example is the popularity of “carry trades” among a broad set of institutional investors as they deploy their capital from low-interest-rate countries to mar-kets where returns are higher (Chapter I).
Indeed, a recent study (Chadha and Nystedt, 2006) finds that the much talked about modera-tion of asset price volatility is largely cyclical, but that it also has structural elements endogenous to financial markets. These elements include (1) lower credit risk accompanied by corporate de-leveraging due to the business cycle recovery; (2) reversal of the elevated volatilities during the stock market bubble of the late 1990s; and (3) financial innovations such as the ability of
market participants to sell volatility. Nonetheless, the sharp pickup in average correlations across asset classes, as seen over the recent past, has historically (mid-1990s) proven to be a strong leading indicator of an eventual pickup in vola-tility in asset prices. Therefore, exogenous fac-tors such as an escalation of geopolitical risk, or the unwinding of large global imbalances, could shift the asset preferences of investors, leading to a ratcheting up of the risk premia on cross-border assets and higher volatility (Goldstein, 2005).
Volatility in international financial markets spiked in April–May 2006, mainly in reaction to inflation concerns in the United States, rais-ing fears of higher world interest rates. These concerns provoked a reassessment of prospects for many EM countries and a fall in the prices of many financial assets. This episode seems to suggest that investors are now more discrimi-nating across countries (at least after an initial period of generalized uncertainty) and that the diversity of investors has had a stabilizing effect. Those countries with relatively weak exter-nal positions, as indicated by a large current account deficit and comparatively low reserves (by current standards) ultimately suffered large depreciations in their currencies, higher risk premia on their external debt, and a broad mar-ket sell-off (Table 2.8). For those with a stronger external position, price falls were concentrated in certain markets, such as the equity market, where many of the countries had displayed large gains in the preceding period. Part of the expla-
Table 2.8. Performance of Selected Emerging Financial Markets, May 8–June 23, 2006
U.S. DollarExchange Rate Equity Index CDS 5-Year Spread1 EMBI Spread2 ELMI3
(in percent) (in percent) (in basis points) (in basis points) (in basis points)
Turkey –22.8 –25.1 181 139 –22Brazil –8.2 –16.1 69 42 –6Hungary –9.1 –23.7 20 8 –8Poland –8.4 –17.0 10 6 –8Indonesia –6.6 –13.0 65 32 –5South Africa –18.6 –6.1 36 35 . . .
Source: IMF staff estimates based on Bloomberg.1Based on the credit default swap (CDS) rate.2Emerging Market Bond Index.3Emerging Local Market Index.

nation appears to be that institutional investors, who were holding external debt, were prepared and able to endure the turbulence, whereas “fast money” investors, who were more concentrated in assets such as equity, were more skittish or had to liquidate their positions because the cost of leverage had risen.
Further analysis provides some evidence that while global factors are important determi-nants of cross-border capital flows, idiosyncratic country-specific factors also play a critical role. An econometric investigation found that the particular circumstances of each country are significant in determining capital outflows from that country (Box 2.5). Common world factors were also estimated to be significant.
Implications for Institutions
For investors, the ability to diversify their portfolios across borders should have a number of benefits in terms of stability (Davis, 2002; BIS Committee on the Global Financial System, 2007). Diversification expands the opportunities to earn more without taking on more risk, such as by allowing exposure to other economies whose cycles and demographic trends are less correlated.11 International diversification can provide exposure to industry sectors and finan-cial instruments (e.g., inflation-indexed bonds) that are underrepresented or nonexistent in the domestic market, or allow funds to reduce their exposure to domestic markets that are heavily concentrated by firm or industry. It has been shown that investors around the world are—rationally—making more use of international assets to obtain portfolio diversification benefits and higher returns.
Yet, many investors are not simply rebalanc-ing toward international exposures but are also taking on additional international risks. The risk-taking ability of the investor base is facilitated by the availability of credit from global banks, partly
11Indeed, given a company pension fund’s exposure to its local economy through its sponsor’s covenant, it may be optimal for the trustees to reduce domestic economy assets in favor of foreign ones.
Not ratedCBBaBaaAAaAaa
0
25
50
75
100
125
150
175
200
1990 92 94 96 98 2000 02 04 06
Sources: Standard & Poor’s; Thompson Financial; and Dealogic.
Figure 2.15. International Syndicated Loans to Emerging Market Corporates, by Credit Rating(In billions of U.S. dollars)
FINANCIAL STABILITY IMPLICATIONS
87

CHAPTER II CHANGES IN THE INTERNATIONAL INVESTOR BASE AND IMPLICATIONS FOR FINANCIAL STABILITY
88
through the use of off-balance-sheet mechanisms, and is also facilitated by risk models (e.g., value-at-risk [VaR] models) that are currently showing a lower probability of loss, mainly because of low historic volatility. However, the global financial system, particularly certain new credit risk trans-fer markets, has not yet been tested by a severe or sustained downturn in the presence of such large cross-border claims. Such a large downturn may invalidate the risk parameters used in VaR models, which tend to rely only on recent histori-cal data. Therefore, there is uncertainty about how institutions and markets would react when faced with more exacting strains.
Movement into New Asset Classes
Favorable macroeconomic and financial conditions and advancements in technology and financial innovation, as well as the very process of globalization of financial markets, may induce investors to take on new and little-understood risks. Sustained high economic growth in much of the world has been reflected in lower premia on risky assets, which has emboldened investors to venture down the “credit ladder” in search of higher returns. Those investors such as central banks that in the past invested only in very high-grade, high-liquidity assets are venturing into more remunerative but volatile assets (Carver, 2006). Pension and insurance funds that had concen-trated on blue chip equity and investment-grade securities are now placing some funds into what previously had been regarded as exotic assets, and are showing a willingness to take larger positions and even short positions (OECD, 2006b). The share of their portfolios in such investments is still small—though it may well increase further—but the absolute amounts are substantial given the growth in assets under management.
The market for EM corporate debt and syndi-cated loans illustrates these trends (Figures 2.15and 2.16). The average credit quality of traded nonsovereign debt securities and underwrit-ing standards of syndicated loans in many EM countries has declined. More and more
0
20
40
60
80
100
120
140Not ratedCBBaBaaAAaAaa
Sources: Standard & Poor’s; Thompson Financial; and Dealogic.Note: Annual emerging market issuance volume (1990–2006) of corporate
emerging market issuance of straight debt, floating rate notes, and medium-term notes.
Figure 2.16. International Emerging MarketCorporate Bond Issuance by Credit Rating(In billions of U.S. dollars)
1990 92 94 96 98 2000 02 04 06

noninvestment-grade issuers have taken advan-tage of current lower-risk premia that support credit at even lower spreads, or lower borrower quality at an unchanged cost of borrowing. The trend is apparent since the late 1990s, but seems to have accelerated recently. Over the last five years, the issuance of new noninvestment-grade or unrated EM corporate debt (bonds and loans) has almost tripled to more than $200 billion in 2006, and now represents 66 percent of the annual issuance volume. The decline in credit quality has been most pronounced for corporate bonds in Latin America and emerging Europe, where the shares of noninvestment-grade issues have increased to 61 percent (up from 47 percent in 2005) and 44 percent (up from 37 percent in 2005), respectively (see Chapter I).
These developments raise concerns about the ability and willingness of investors to assess risks based on experience accumulated during good times. There are theoretical arguments to suggest that investors will make less effort to research borrowers when conditions are favorable, and sharply tighten availability of credit when conditions become more difficult (Calvo and Mendoza, 2000). Furthermore, it has been argued that investors with more diversified portfolios will be less willing to bear the cost of careful, independent analysis, rely-ing more on information already contained in financial market prices. Hence, the amount of information contained in the related prices may decline.
The pace of financial sector innovation in recent years has created uncertainty over how agents will behave when faced with unfamiliar strains. Reportedly, some foreign investment has been flowing into speculative EM instruments, such as distressed debt and equity participations in housing schemes, whose potential risks from ill-defined dispute resolution mechanisms and structural intricacies are frequently obscure. Many institutions that are new to the inter-national investor base have little experience of how to cope with a more difficult trading environment.
In addition, the expansion of the supply of financing and the number of players in some smaller asset classes may increase the chances of a sudden drying up of liquidity if conditions deteriorate. So-called “crowded trades” can occur, where the convergence of investment strategies results in less diverse position taking. In these conditions, a combination of the high leverage of some investors and poor liquidity in certain markets could provoke a painful rever-sal of capital flows. Recent experience in the Brazilian local-currency-denominated govern-ment debt market illustrates the vulnerabilities (Box 2.6).
Spreading Risks Across a Broader Range of Investors
The broadening investor base may reduce systemic effects by spreading risks more widely, and by transferring them to institutions better able to manage them. In general, when risks are realized, the effects may be nonlinear (i.e., disproportionate for large shocks): a small nega-tive shock may be manageable without signifi-cant adjustment, but a large shock may prompt portfolio rebalancing or even significant losses. Hence, distributing risks across investors, as opposed to each being exposed to a small num-ber of large risks, reduces the chance that any one suffers a catastrophic hit. Self-reinforcing feedback and contagion effects should therefore be reduced. The diversification of the inves-tor base may contribute to the achievement of a more even distribution of risk holdings, and therefore reduce systemic vulnerability.
One consequence of this diversification of the investor base may be that the financial system is better able to absorb the failure of individual institutions or sovereign entities than in the past. The increasing depth of markets and the decreasing exposure to specific asset classes may mean that, even when a failure involves large sums of money, the survival of other institutions is not put in doubt. Furthermore, many healthy institutions are available to purchase assets of the failed institution without the need for a “fire sale.” For example, the recent collapse
FINANCIAL STABILITY IMPLICATIONS
89

CHAPTER II CHANGES IN THE INTERNATIONAL INVESTOR BASE AND IMPLICATIONS FOR FINANCIAL STABILITY
90
Capital outflows from a country are typically modeled as depending on the economic con-ditions within that country, conditions in the world economy, and, in particular, conditions in candidate recipient countries. An investiga-tion of the determinants of capital outflows reveals that both idiosyncratic national and global liquidity factors have been and remain very important in determining the supply of international investment from individual countries.1
For a large sample of 137 countries, the analysis below utilizes a simple technique to decompose fluctuations in capital outflows into respective components that can be attributed to worldwide annual factors (time dummies), to regional factors (regional group dummies), and to the type of capital flow (instrumental type dummies). A comparable approach to the estimation of common and regional factors in economic fluctuations is used in Bayoumi and Prasad (1997). The technique precludes the inclusion of country-specific economic factors to explain fluctuations. The dependent variable is the ratio of one of three types of capital outflow to world GDP.
The results suggest that the overall supply of cross-border capital has become more diverse and stable. The regional factors have been far more important than global factors since 1974. In the sub-period from 1996–2005, the regional factors still predominate, but the total predictive power (R2) is significantly higher than the sum of that attributable to identified factors in the subperiod from 1974–96. This change suggests that there has been some strengthening of the interaction between regional and global factors, which is in line with evidence on the synchroni-zation of business cycles between well-integrated regions (Imbs, 2004).
The analysis below attempts to quantify the sensitivity of capital outflows and their volatil-
Note: The author of this box is André Santos.1For related results, see Alfaro, Kalemli-Ozcan, and
Volosovych (2005); and de Santis and Lührmann (2006).
ity to changes in the state of global conditions and domestic economic performance. The table on the next page summarizes the sensi-tivity of FDI and portfolio outflows and their volatility accounted for by country-specific fac-tors such as GDP growth, credit-to-GDP ratios (a measure of financial development), and cap-ital account liberalization (defined in Quinn, 1997), as opposed to the share that could be attributed to identified global liquidity fac-tors, such as the growth rate of broad money over that of GDP and the short-term real interest rates in G-7 countries. For the results presented in the upper part of the table, the dependent variable is the ratio of capital out-flows (FDI and portfolio) to GDP. The sample covers 26 mature market economies for which data were available. In the lower part of the table, the dependent variable is a moving aver-age estimate of the standard deviation of the capital outflows-to-GDP ratio and the sample consists of 23 mature markets. To address endogeneity issues, the generalized method of moments estimation is used in the lower panel; the standard deviation over the next five years is regressed on the determinants of capital flows in the current year.2
Two main results are apparent. First, both country and global liquidity factors are impor-tant determinants of the direction and volatility of capital outflows. The direction of influence is generally in line with intuition. For example,
2For further details, see Bekaert, Harvey, and Lund-blad (2001 and 2006).
Box 2.5. Country, Regional, and Global Determinants of Capital Outflows
Panel Data: Predictive Power (R2) of Aggregate,Regional, and Type of Outflow Effects on CapitalOuflows in a Panel Data Regression, 1974–2005
Worldwide Regional TypeTotal Factor Factor Factor1
1974–20052 0.236 0.012 0.222 0.0001996–20052 0.170 0.002 0.095 0.000
Source: IMF.1Small negative contributions were set equal to zero.2The contribution in other periods were small and negative.

high GDP growth rates lead to larger savings and hence larger capital outflows and volatility on average. Second, variations in capital out-flows are mostly accounted for by the country-specific effects; the marginal improvement in
explanatory power from including global factors is limited. However, both domestic and global factors play an important role in determining the volatility of capital outflows, as shown in the lower panel.
Panel A. Fixed-Effects Estimation of the Determinants of Capital Outflows in 26 Mature Market Economies1
FDI/GDP2 Portfolio Flows/GDP2 Other Flows/GDP2______________________ ________________________ ______________________Model I II III I II III I II III
Domestic factorsChange in real GDP 17.50 21.88 26.80 40.88 44.33 46.57 50.72 63.96 73.57
(4.46) (4.50) (4.77) (3.31) (2.97) (2.71) (5.93) (6.19) (6.24)
Credit/GDP 2.48 2.54 2.81 7.97 8.35 10.64 3.99 3.21 5.49(5.97) (4.98) (4.91) (6.11) (5.34) (6.10) (4.42) (2.97) (4.59)
Quinn capital account openness 59.62 57.63 57.58 201.49 216.70 278.93 99.52 55.77 86.91indicator (5.60) (4.07) (3.46) (6.01) (4.98) (5.47) (4.29) (1.85) (2.49)
Global liquidity factorsShort-term real interest rate –7.15 –60.88 –50.83
in G-7 (–0.89) (–2.47) (–2.99)
Excess money supply (broad) 19.34 18.36 –8.30in G-7 (3.13) (0.97) (–0.64)
R2 0.46 0.45 0.46 0.35 0.39 0.42 0.47 0.50 0.53
Panel B. Generalized Method of Moments Estimation of the Determinants of the Standard Deviation of CapitalOutflows over Five Years in 23 Mature Market Economies3,4
FDI/GDP2 Portfolio Flows/GDP2 Other Flows/GDP2______________________ ________________________ ______________________Model I II III I II III I II III
Domestic factorsChange in real GDP –1.47 1.29 1.28 13.34 20.11 28.65 3.92 21.96 20.28 (–1.69) (1.31) (0.85) (5.34) (8.68) (9.65) (4.16) (11.01) (7.90)
Quinn capital account openness 47.59 46.92 47.28 72.42 80.27 93.86 47.01 45.44 58.32indicator (29.49) (14.20) (10.16) (24.11) (17.53) (21.14) (12.81) (7.58) (11.84)
Credit/GDP –0.60 0.03 –0.25 –0.21 –0.70 –0.78 0.52 1.63 0.78 (–4.09) (0.12) (–0.65) (–0.76) –(3.69) (–4.95) (2.37) (5.35) (2.07)
Global liquidity factorsShort-term real interest rate –20.99 –24.45 –18.14
in G-7 (–5.73) (–6.76) (–3.68)
Excess money supply (broad) 17.88 16.99 14.71in G-7 (4.67) (4.51) (3.63)
J-test statistics (significance levels) 0.96 0.99 0.99 0.64 0.99 0.99 0.04 0.99 0.99
Sources: IMF; and Quinn (1997).Note: t-statistics in parentheses.1Countries included in Panel A are Australia, Austria, Belgium, Canada, Denmark, Finland, France, Germany, Greece, Hong Kong SAR,
Iceland, Ireland, Italy, Japan, Korea, Luxembourg, Netherlands, New Zealand, Norway, Portugal, Spain, Singapore, Sweden, Switzerland, United Kingdom, and the United States.
2Variables scaled by 100.3Panel B includes all countries from Panel A except Belgium, Greece, and Luxembourg.4The standard deviation of capital outflows was computed using a five-year rolling window. See Bekaert, Harvey, and Lundblad (2001
and 2006).
FINANCIAL STABILITY IMPLICATIONS
91

CHAPTER II CHANGES IN THE INTERNATIONAL INVESTOR BASE AND IMPLICATIONS FOR FINANCIAL STABILITY
92
The episode in May–June 2006 when Brazil-ian financial markets suffered turbulence in the context of a worldwide reassessment of emerg-ing markets illustrates how foreign investors can be surprised by events. The search for yield and a limited knowledge of local conditions led investors to take positions that were unexpect-edly difficult to unwind when the environment became more difficult.
Since mid-2005, the Brazilian government has tried to reduce the country’s external vulnerability by retiring its external debt. Foreign investors seeking exposure to Brazil therefore had to resort to the domestic finan-cial markets, and in particular local-currency-denominated government bonds. Encouraged by a tax exemption granted on foreign invest-ment in local bond markets in February 2006, foreign financial institutions had allocated a cumulative R$52 billion to local-currency-denominated government bonds by end-March 2006, 47 percent higher than in March 2005. The long-dated inflation-linked government bonds—Series B National Treasury Notes (NTN-B)—were especially popular. Foreign financial institutions’ holdings of NTN-B bonds represented about 10 percent of the total issue by April 2006. As those institu-tions expanded their participation in the NTN-B bond market, bond prices increased by 18 percent in the month following the tax exemption.
When volatility increased in April–May 2006, foreign investors in NTN-B bonds were hit by an increase in domestic interest rates. Foreign investors rushed to unwind their long position in NTN-B bonds. Liquidity in secondary mar-kets for the bonds dried up as domestic pen-sion funds had already exited the market. As a result, prices of NTN-B bonds fell sharply; the inflation-linked bond index dropped 11 per-cent in May. As investors sought to reduce their
positions, the exchange rate depreciated by 13 percent, thus compounding losses. In addi-tion, trading in secondary markets fell by 49 percent between February and May 2006 (see figure). The shallowness and lack of liquidity in the secondary NTN-B bond market were thus important elements in the price sensitivity of these bonds.
The Brazilian national treasury stepped in to avoid further disruptions in government bond markets and carried out simultaneous buy-and-sell actions of NTN-B bonds in May 2006, thus providing liquidity to the market. In July 2006 the Brazilian central bank included NTN-B bonds in the pool of securities eligible for repo and reverse repo transactions with the central bank. The NTN-B bond market stabilized over the following months as con-cerns regarding the U.S. economic slowdown (the initial trigger for the market turbulence) subsided.
Box 2.6. Liquidity of Brazilian Inflation-Linked Instruments
Note: The authors of this box are Marcelo Carvalho and André Santos.
0
1
2
3
4
5
6
Buy-and-sell auctionsTrading volume in the secondary market
Jan Feb Mar Apr May Jun2006
Jul Aug Sep Oct Nov
Brazil: Trading Volume in the NTN-B BondSecondary Market and Buy-and-SellAuctions of NTN-B Bonds by the NationalTreasury(In billions of Brazilian reais)
Source: Brazilian National Treasury.Note: NTN-B = National treasury note, series B.

of the Amaranth hedge fund was dealt with quickly and smoothly, with hardly any concerns about a wider impact, whereas eight years ago a comparable case—Long-Term Capital Manage-ment (LTCM)—was viewed with great concern and prompted official involvement (BIS, 2006; Banque de France, 2006). However, the volun-tary rescue of Amaranth took place under very benign conditions in global financial markets, while LTCM came on the back of the Asian and Russian crises of the late 1990s.
Conclusions and Policy ImplicationsThe analysis in this chapter has shown that
the supply of international capital has expanded and has become more diverse along several dimensions. Not only are flows and stocks of cross-border claims much larger today than they were 10 years ago, but they have also increased relative to the volume of domestic economic activity and the size of financial markets. All asset classes have been affected. In particular, some types of assets that traditionally had been held almost exclusively domestically, such as EM local currency debt, are now actively traded internationally. Flows within the MM economies of Europe have become very large in the con-text of European integration and particularly the European Monetary Union.
The chapter has also stressed that, while the expanding investor base should on average lead to relatively stable and sustained capital flows, the increasing exposure of both source coun-tries and recipients brings its own challenges. Some past episodes of rapid growth in interna-tional capital flows have ended badly. Most such events had one dynamic in common: the conflu-ence of an abrupt increase in risk perception and the subsequent actions taken by financial institutions and investors to limit their expo-sure to losses (Geithner, 2006). The favorable circumstances in which this round of globaliza-tion has taken place, including high real growth rates and low nominal and real interest rates for much of the decade, offer limited guidance as to the robustness of the system under significant
and sustained stress. The rate of growth in capi-tal flows combined with persistent large global imbalances suggest that an abrupt correction cannot be ruled out (IMF, 2007).
While abrupt changes in risk perception are difficult to predict, countries can continue to address pockets of home-grown vulnerabilities and make themselves an attractive destination for long-term investment. Already, many EM countries have been receiving increased capital inflows, reflecting improved macroeconomic policies and successful structural reforms, but also due to the relatively low returns available domestically to MM investors, whose asset hold-ings have soared. However, regardless of the reason, these flows provide strong discipline on borrowing governments to continue to perform well and offer national authorities the opportu-nity to move ahead with reforms to make their financial systems more resilient. To this end, some EM countries have been implementing active management of liabilities to improve their debt structures and many have been accumulat-ing official reserves. These efforts should help insulate these countries from negative shocks to their balance of payments, suggesting that a potential adjustment may differ from that seen in past episodes.
Several EM countries have been implement-ing structural policies to ensure that they can benefit fully from the globalization of capital markets. Policies include targeted efforts to pro-mote deeper and more liquid capital markets. These efforts range from reforms in the legal, regulatory, and accounting systems consistent with international standards to changes in taxation. There is also considerable potential for enhancing cross-border compatibility in financial sector infrastructure and institutional development, and for supporting capital market integration. All these efforts will likely provide the expected growth benefits but also increase the attractiveness of these markets to a stable investor base.
However, it should be noted that these posi-tive developments can lead to further increases in the already high inflows to some EM coun-
CONCLUSIONS AND POLICY IMPLICATIONS
93

CHAPTER II CHANGES IN THE INTERNATIONAL INVESTOR BASE AND IMPLICATIONS FOR FINANCIAL STABILITY
94
tries, contributing further to asset price inflation and complicating the conduct of policies by the authorities. As discussed earlier in this chap-ter, liberalizing capital outflows—though not a panacea—would, in the context of the broader reform of the domestic institutional investor base, allow local investors to better manage their risks and could, at least partially, balance the effects of capital inflows. Correction of the underlying issue requires the development of well-functioning local capital markets and the promotion of longer-term savings. Efforts to establish funded pension schemes, for example, are thus of macroeconomic importance.
Emerging market countries have also become important sources of capital in international markets. As a group they have also become net suppliers of capital, especially to the United States, mainly through central bank reserve holdings or assets accumulated in sovereign wealth funds. Given the magnitude of investable funds in the hands of the official sector, care should be taken in communicating changes in investment strategies. While the official sector in each country has devised its own investment policy and accompanying strategy, market participants’ understandings of those policies—especially for the largest reserves holders—are often based on rumor. As a result, market speculation about the pace of diversifi-cation and shifts in official policies have been a source of sporadic exchange rate and interest rate volatility.
The chapter provides some evidence that financial risk-taking in EM local assets has also increased, which now creates pockets of vulner-abilities in some countries. Investors have been venturing into investments in which they have little experience and where credit quality is more questionable. Furthermore, the growing role of leveraged investors such as hedge funds may have introduced a propensity for asset prices to overshoot during good times, increas-ing the probability of downside risks when finan-cial conditions worsen.
Further work is needed to better understand the financial market trends that are driving
globalization—including, in particular, the rapid development of credit risk transfer instru-ments and institutions, including hedge funds. These instruments can contribute to stability and reduce market inefficiencies by providing market liquidity, and by transferring risk to a much wider variety of willing investors. How-ever, increased cross-border flows may result in increased unhedged currency mismatches on private sector balance sheets.
This underlines the need for the focus of prudential regulation and supervision to shift toward international risks conveyed through financial market instruments. These risks are often nontransparent because, for example, products cannot be looked at in isolation: an exposure may be bundled with any number of derivatives, insurance products, or currency hedges, and may often involve several jurisdic-tions. In addition, regulation and supervisory practices need to recognize the benefits of pre-serving the diversity of investor behavior, and care should be taken that ongoing reforms do not inadvertently cause the behavior of institu-tional investors to become more homogenous (IMF, 2005a).
While the current positive global environment makes dealing with a period of market stress seem remote, a comprehensive and system-wideapproach will need to account for the ongoing changes documented above. Market participants should appropriately bear the risks of their posi-tions while policymakers attempt to underpin the strength of the financial system at large. There are clear externalities, such as the provi-sion of liquidity under severe market stress, that may warrant public sector involvement, but at the risk of exacerbating moral hazard. The greater diversity of market participants may affect the appropriate policy response under such market stress—how to limit systemic spill-overs in a market dominated by domestic banks with short-term liabilities to the general public may differ from the actions needed when, say, international hedge funds or pension funds are major players. These issues are addressed in more detail in Chapter III.

Last but not least, the lack of comprehensive data and information makes an assessment of the benefits and risks of the expansion and deepening of the international investor base a daunting task. There is a need to devise mecha-nisms to deal with the considerable gaps in information concerning global financial flows to facilitate prudential oversight and effective surveillance by national authorities and better risk assessment by market participants. Several national authorities have put in place mecha-nisms to collect information to monitor capital flows by source countries and types of inves-tors. The IMF and other international financial institutions have taken some initiatives in this area, including several joint efforts discussed in this chapter. Some market participants are utilizing surveys and proprietary data to assess aggregate investment activities. However, further efforts are needed to obtain better information in order to facilitate more accurate and timely assessment of emerging strains and potential vulnerabilities.
ReferencesAlfaro, Laura, Sebnem Kalemli-Ozcan, and Vadym
Volosovych, 2005, “Capital Flows in a Globalized World: The Role of Policies and Institutions,” NBER Working Paper No. 11696 (Cambridge, Massachusetts: National Bureau of Economic Research).
Aurelio, Marcela M., 2006, “Going Global: The Chang-ing Pattern of U.S. Investment Abroad,” FederalReserve Bank of Kansas Economic Review (Third Quarter).
Bank for International Settlements (BIS), 2006, “The Recent Behavior of Financial Market Volatility,” BIS Paper No. 29 (Basel, Switzerland, August).
Bank for International Settlements (BIS) Commit-tee on the Global Financial System (CGFS), 2007, “Institutional Investors, Global Savings, and Asset Allocation,” CGFS Publication No. 27 (Basel, Swit-zerland, February).
Bank of New York, and Casey, Quirk & Associates, 2006, “Institutional Demand for Hedge Funds 2: A Global Perspective,” Thought Leadership Series White Paper (New York, October).
Banque de France, 2006, “Are Risk Transfer Mecha-nisms Sufficiently Robust?” Financial Stability Review No. 9 (Paris).
Battelino, Ric, 2006, “Regional Capital Flows,” address to the Sixth Asia-Pacific Economic Cooperation Conference, Future Economic Leaders Think Tank, Sydney, June 28.
Bayoumi, Tamim, and Eswar Prasad, 1997, “Currency Unions, Economic Fluctuations, and Adjustment: Some New Empirical Evidence,” Staff Papers,International Monetary Fund, Vol. 44 (March), pp. 36–58.
Bekaert, Geert, Campbell R. Harvey, and Christian Lundblad, 2001, “Does Financial Liberalization Spur Growth?” NBER Working Paper No. 8245 (Cambridge, Massachusetts: National Bureau of Economic Research).
———, 2006, “Growth Volatility and Financial Liber-alization,” Journal of International Money and Finance,Vol. 25 (April), pp. 370–403.
Calvo, Guillermo, and Enrique Mendoza, 2000, “Capital Markets Crises and Economic Collapse in Emerging Markets: An Informational-Frictions Approach,” American Economic Review, Papers and Proceedings, Vol. 90 (May), pp. 59–64.
Carvajal, Ana, 2006, “Regulatory Lessons from the Crisis of Costa Rica’s Mutual Fund Industry,” IMF Working Paper No. 06/288 (Washington: Interna-tional Monetary Fund).
Carver, Nick, 2006, “Trends in Reserve Management—2006 Survey Results,” in RBS Reserve Management Trends 2006, ed. by Robert Pringle and Nick Carver (London: Central Bank-ing Publications).
Center for International Securities and Derivatives Markets, 2006, “Benefits of Hedge Funds: 2006 Update” (Amherst, Massachusetts: CISDM Research Department, Isenberg School of Management, Uni-versity of Massachusetts).
Chadha, Bankim, and Jens Nystedt, 2006, “When and What Will Turn Vol Around?” Deutsche Bank Foreign Exchange Research, November 17 (unpub-lished; New York: Deutsche Bank).
Chan-Lau, Jorge Antonio, 2004, “Pension Funds and Emerging Markets,” IMF Working Paper No. 04/181 (Washington: International Monetary Fund).
Davis, E. Phillip, 2002, “Institutional Investors, Cor-porate Governance and the Performance of the Corporate Sector,” Economic Systems, Vol. 26, No. 3, pp. 203–29.
REFERENCES
95

CHAPTER II CHANGES IN THE INTERNATIONAL INVESTOR BASE AND IMPLICATIONS FOR FINANCIAL STABILITY
96
Deloitte Touche Tohmatsu, 2006, “Global Asset Management Industry Outlook: Integrating Strategy with Experience in a Changing World” (June).
De Santis, Roberto A., and Melanie Lührmann, 2006, “On the Determinants of External Imbalances and Net International Portfolio Flows: A Global Per-spective,” ECB Working Paper No. 651 (Frankfurt, Germany: European Central Bank, July).
Edwards, Sebastian, 2001, “Capital Mobility and Eco-nomic Performance: Are Emerging Economies Different?” NBER Working Papers Series No. 8076 (Cambridge, Massachusetts: National Bureau of Economic Research).
European Central Bank, 2006, “Hedge Funds: Devel-opments and Policy Implications,” ECB Monthly Bul-letin (January), pp. 63–76.
French, Kenneth R., and James M. Poterba, 1991, “Investor Diversification and International Equity Markets,” American Economic Review, Papers and Pro-ceedings, Vol. 81 (May), pp. 222–26.
Froot, Kenneth A., Paul G.J. O’Connell, and Mark S. Seasholes, 2001, “The Portfolio Flows of Interna-tional Investors,” Journal of Financial Economics, Vol. 59 (February), pp. 151–93.
Galati, Gabrieli, and Philip D. Woodbridge, 2006, “The Euro as a Reserve Currency: A Challenge to the Pre-Eminence of the US Dollar?” BIS Work-ing Paper No. 218 (Basel: Bank for International Settlements).
Geithner, Timothy F., 2006, “Hedge Funds and Derivatives and Their Implications for the Finan-cial System,” remarks at the Distinguished Lecture 2006, sponsored by the Hong Kong Monetary Authority and Hong Kong Association of Banks, Hong Kong SAR, September 15. Available via the Internet: http://www.newyorkfed.org/newsevents/speeches/2006/gei060914.html.
Goldstein, Morris, 2005, “What Might the Next Emerging-Market Financial Crisis Look Like?” IIE Working Paper No. 05-7 (Washington: Institute for International Economics, July). Available via the Internet: http://papers.ssrn.com/sol3/papers.cfm?abstract_id=771045.
Grinblatt, Mark, Sheridan Titman, and Russ Wermers, 1995, “Momentum Investment Strategies, Portfolio Performance, and Herding: A Study of Mutual Fund Behavior,” American Economic Review, Vol. 85 (December), pp. 1088–105.
Hauner, David, and Manmohan Kumar, 2006, “Fiscal Policy and Interest Rates: How Sustain-
able Is the ‘New Economy’?” IMF Working Paper No. 06/112 (Washington: International Monetary Fund).
Imbs, Jean, 2004, “Trade, Finance, Specialization and Synchronization,” Review of Economics and Statistics,Vol. 86 (August), pp. 723–34.
International Monetary Fund, 2004, Global Financial Stability Report, World Economic and Financial Sur-veys (Washington, September).
———, 2005a, Global Financial Stability Report, World Economic and Financial Surveys (Washington, April).
———, 2005b, Global Financial Stability Report, World Economic and Financial Surveys (Washington, September).
———, 2006a, Global Financial Stability Report, World Economic and Financial Surveys (Washington, April).
———, 2006b, World Economic Outlook, World Economic and Financial Surveys (Washington, April).
———, 2007, World Economic Outlook, World Eco-nomic and Financial Surveys (Washington, April, forthcoming).
JPMorgan Fleming Asset Management, 2005, “Asset Allocation: Manager Survey.”
Kho, Bong-Chan, René M. Stulz, and Francis E. Warnock, 2006, “Financial Globalization, Gov-ernance, and the Evolution of the Home Bias,” NBER Working Paper No. 12389 (Cambridge, Massachusetts: National Bureau of Economic Research).
Klein, Michael W., and Giovanni Olivei, 1999, “Capital Account Liberalization, Financial Depth and Eco-nomic Growth,” NBER Working Paper No. 7384 (Cambridge, Massachusetts: National Bureau of Economic Research).
Kodres, Laura E., and Matthew Pritsker, 2002, “A Rational Expectations Model of Financial Con-tagion,” The Journal of Finance, Vol. 57 (April), pp. 769–99.
Kose, M. Ayhan, Eswar Prasad, Kenneth Rogoff, and Shang-Jin Wei, 2006, “Financial Globalization: A Reappraisal,” IMF Working Paper No. 06/189 (Washington: International Monetary Fund).
Lane, Philip, 2006, “Global Bond Portfolios and EMU,” International Journal of Central Banking(June), pp. 1–23.
McGuire, Patrick, and Nikola Tarashev, 2005, “The International Banking Market,” BIS Quarterly Review(December), pp. 15–30.

———, 2006, “Tracking International Bank Flows,” BIS Quarterly Review (December), pp. 27–40.
Organization for Economic Cooperation and Develop-ment (OECD), 2006a, “Global Pension Statistics” (Paris, October).
———, 2006b, Pension Markets in Focus, No. 3 (Paris, October).
Quinn, Dennis, 1997, “The Correlates of Change in International Financial Regulation,” Ameri-can Political Science Review, Vol. 91 (September), pp. 531–51.
Rajan, Raghuram G., 2006, “Is There a Global Short-age of Fixed Assets?” Keynote speech at the G-30 meetings, New York, December 1.
Rodrik, Dani, 1998, “Who Needs Capital-Account Convertibility?” in Should the IMF Pursue Capital-Account Convertibility? Princeton Essays in Inter-national Finance No. 207 (Princeton, New Jersey: Princeton University Press).
Scharfstein, David, and Jeremy Stein, 1990, “Herd Behavior and Investment,” American Economic Review, Vol. 83 (June), pp. 465–79.
Toloui, Ramin, 2007, “Petrodollars, Asset Prices, and the Global Financial System” (New York: Pacific Investment Management Company, January).
Turner, Phillip, 2006, “Local Currency Bonds in Emerging Markets: What Are the Links with Finan-cial Stability,” paper prepared for the LACEA session on “The Development of Domestic Bond Markets: Achievements, Challenges, and Implica-tion for Financial Stability,” Bank for International Settlements, November.
UBS Global Asset Management, 2005, “Pension Fund Indicators 2005” (London).
———, 2006, “Pension Fund Indicators 2006,” (London).
Van Steenis, Huw, 2006, “On- and Off-Piste Trends in European Asset Management” (London: Morgan Stanley).
World Bank, 2006, “Financial Integration Among Developing Countries,” in Global Development Finance 2006: The Development Potential of Surging Capital Flows (Washington), Chapter 4.
REFERENCES
97