Embed Size (px)
Citation preview

FINANCIAL RESULTS: Q2 FY21
MUMBAI
5th November 2020
Aditya Birla Capital Limited
A Leading Financial Services Conglomerate
Investor Presentation

Copyrig
ht
Conte
nt
/ 2016
Aditya Birla Capital Limited
Figures in Rs Crore
Table of contents
2
1 | Overview Pg. 3 - 7
2 | Business-wise Performance Pg. 8 - 52
3 | Other Performance Updates Pg. 53 - 59
NOTE 1: The financials of Aditya Birla Capital Ltd are consolidated financials prepared based on Ind AS unless otherwise specifiedNOTE 2: The financial figures in this presentation have been rounded off to the nearest Rs 1 Crore
Copyrig
ht
Conte
nt
/ 2016
Aditya Birla Capital Limited
Figures in Rs Crore
Q2 FY21 | Key Highlights
3
✓
✓
✓
✓
✓
✓
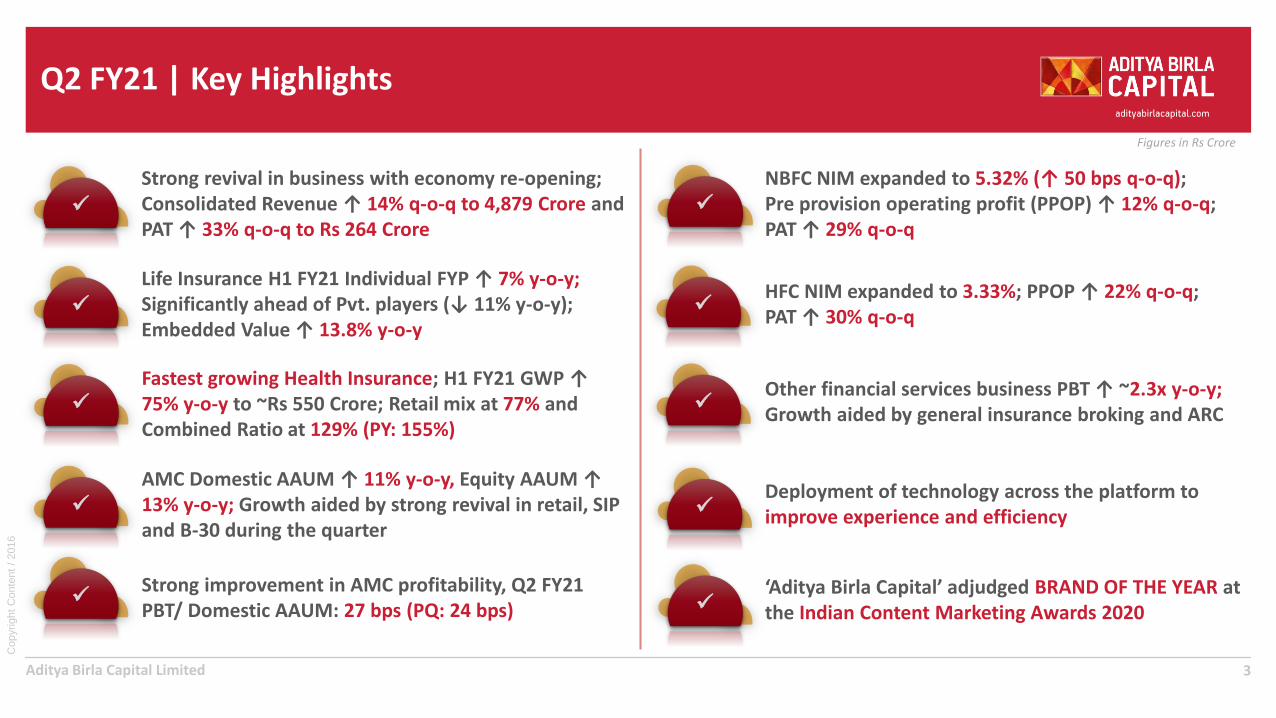
Strong revival in business with economy re-opening; Consolidated Revenue ↑ 14% q-o-q to 4,879 Crore and PAT ↑ 33% q-o-q to Rs 264 Crore
NBFC NIM expanded to 5.32% (↑ 50 bps q-o-q); Pre provision operating profit (PPOP) ↑ 12% q-o-q; PAT ↑ 29% q-o-q
Deployment of technology across the platform to improve experience and efficiency
‘Aditya Birla Capital’ adjudged BRAND OF THE YEAR at the Indian Content Marketing Awards 2020
✓
AMC Domestic AAUM ↑ 11% y-o-y, Equity AAUM ↑13% y-o-y; Growth aided by strong revival in retail, SIP and B-30 during the quarter
Life Insurance H1 FY21 Individual FYP ↑ 7% y-o-y;Significantly ahead of Pvt. players (↓ 11% y-o-y);Embedded Value ↑ 13.8% y-o-y
✓
Fastest growing Health Insurance; H1 FY21 GWP ↑ 75% y-o-y to ~Rs 550 Crore; Retail mix at 77% and Combined Ratio at 129% (PY: 155%)
✓ ✓
HFC NIM expanded to 3.33%; PPOP ↑ 22% q-o-q; PAT ↑ 30% q-o-q
Strong improvement in AMC profitability, Q2 FY21 PBT/ Domestic AAUM: 27 bps (PQ: 24 bps)
Other financial services business PBT ↑ ~2.3x y-o-y; Growth aided by general insurance broking and ARC

Copyrig
ht
Conte
nt
/ 2016
Aditya Birla Capital Limited
Figures in Rs Crore
Consolidated Financials
41 Consolidated segment revenue ; for Ind AS statutory reporting purpose Asset management and wellness business are not consolidated and included under equity accounting2 Includes ABCL standalone (ex-interest and brand expenses), Online Personal Finance, Private Equity, ARC, ABMM and other businesses3 Aditya Birla Sun Life AMC Ltd and Aditya Birla Wellness Pvt Ltd consolidated based on equity accounting under Ind AS, however considered as a part of segmental performance to show holistic financial performance4 Excluding Aditya Birla Health Insurance operating expenses given the business is scaling up and on path to break-even
Rev
en
ue
1
4,275 4,286 4,879
Q2 FY20 Q1 FY21 Q2 FY21
8,211 9,165
H1 FY20 H1 FY21
↑14% Y-o-Y | 14% Q-o-Q ↑12% Y-o-Y
256 198
264
Q2 FY20 Q1 FY21 Q2 FY21
Pro
fit
Aft
er
Tax
526 463
H1 FY20 H1 FY21
↑ 3% Y-o-Y | ↑ 33% Q-o-Q ↓ 12% Y-o-Y
▪ Opex optimisation is a key area of focus in our plans
▪ Aggregate (non-vol linked and excl. ABHI) Q2 FY21 Opex ↓ 8% Y-o-YOp
ex
Businesses Q1 FY21 Q2 FY20 Q2 FY21
NBFC 140 218 181
Asset Management 97 148 125
Life Insurance 17 34 23
Housing 28 28 36
General Insurance Broking 21 9 13
Stock & Securities Broking 4 3 4
ARC 6 4 7
Profitable Businesses PAT 313 444 390
Health Insurance (58) (70) (66)
Less: Interest Cost (0) (28) (0)
Less: Brand & Marketing (2) (10) (1)
Less: Others2/ Eliminations (18) (20) (9)
Less: Minority Interest (36) (60) (49)
Consolidated PAT3 198 256 264
Copyrig
ht
Conte
nt
/ 2016
Aditya Birla Capital Limited
Figures in Rs Crore
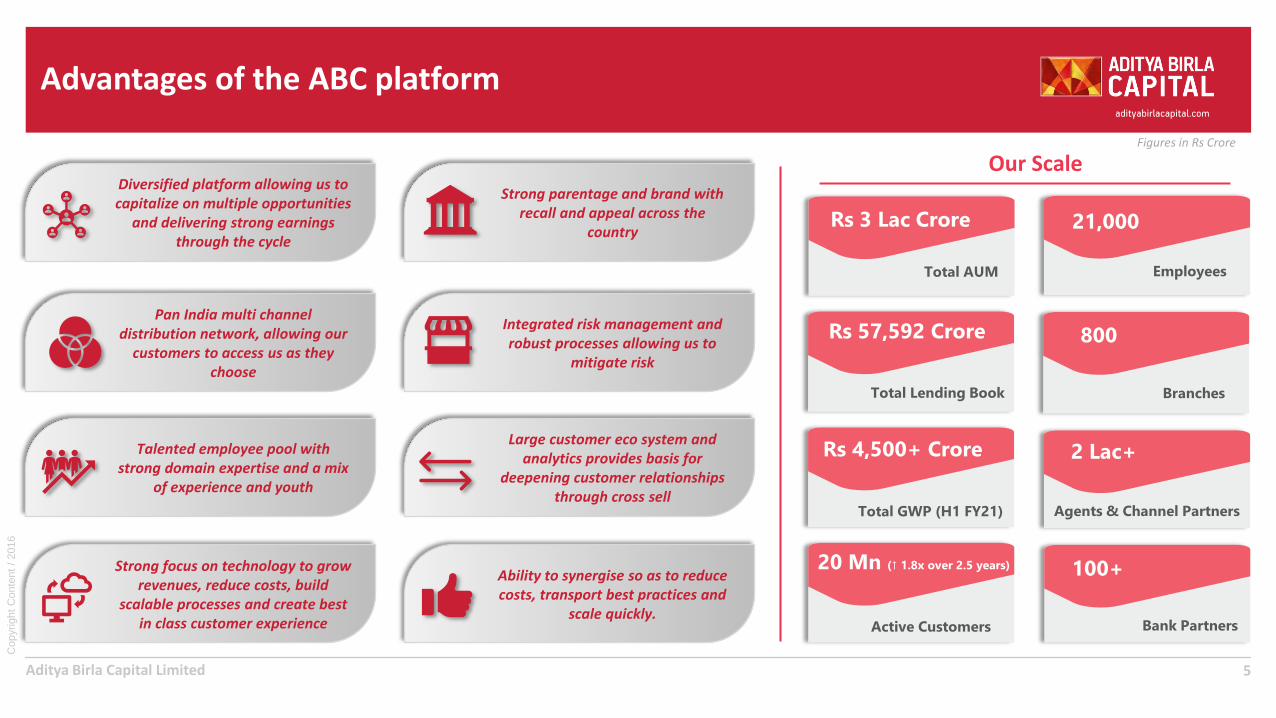
Diversified platform allowing us to capitalize on multiple opportunities
and delivering strong earnings through the cycle
Advantages of the ABC platform
5
Strong focus on technology to grow revenues, reduce costs, build
scalable processes and create best in class customer experience
Pan India multi channel distribution network, allowing our
customers to access us as they choose
Large customer eco system and analytics provides basis for
deepening customer relationships through cross sell
Integrated risk management and robust processes allowing us to
mitigate risk
Strong parentage and brand with recall and appeal across the
country
Talented employee pool with strong domain expertise and a mix
of experience and youth
Ability to synergise so as to reduce costs, transport best practices and
scale quickly.
Rs 4,500+ Crore
Total GWP (H1 FY21)
2 Lac+
Agents & Channel Partners
Rs 57,592 Crore
Total Lending Book
800
Branches
Rs 3 Lac Crore
Total AUM
21,000
Employees
Our Scale
20 Mn (↑ 1.8x over 2.5 years)
Active Customers
100+
Bank Partners
Copyrig
ht
Conte
nt
/ 2016
Aditya Birla Capital Limited
Figures in Rs Crore
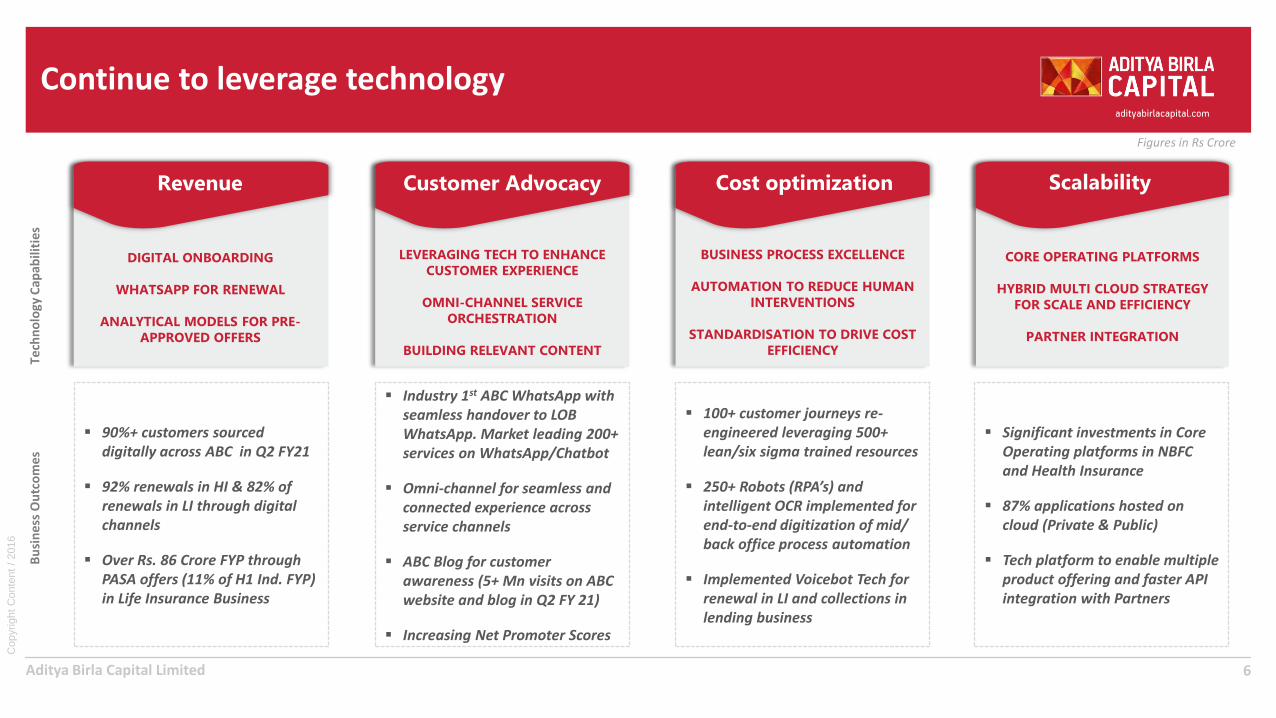
▪ Significant investments in Core Operating platforms in NBFC and Health Insurance
▪ 87% applications hosted on cloud (Private & Public)
▪ Tech platform to enable multiple product offering and faster API integration with Partners
▪ 100+ customer journeys re-engineered leveraging 500+ lean/six sigma trained resources
▪ 250+ Robots (RPA’s) and intelligent OCR implemented for end-to-end digitization of mid/ back office process automation
▪ Implemented Voicebot Tech for renewal in LI and collections in lending business
▪ Industry 1st ABC WhatsApp with seamless handover to LOB WhatsApp. Market leading 200+ services on WhatsApp/Chatbot
▪ Omni-channel for seamless and connected experience across service channels
▪ ABC Blog for customer awareness (5+ Mn visits on ABC website and blog in Q2 FY 21)
▪ Increasing Net Promoter Scores
▪ 90%+ customers sourced digitally across ABC in Q2 FY21
▪ 92% renewals in HI & 82% of renewals in LI through digital channels
▪ Over Rs. 86 Crore FYP through PASA offers (11% of H1 Ind. FYP) in Life Insurance Business
Continue to leverage technology
6
Revenue
DIGITAL ONBOARDING
WHATSAPP FOR RENEWAL
ANALYTICAL MODELS FOR PRE-
APPROVED OFFERS
Customer Advocacy
LEVERAGING TECH TO ENHANCE
CUSTOMER EXPERIENCE
OMNI-CHANNEL SERVICE
ORCHESTRATION
BUILDING RELEVANT CONTENT
Cost optimization
BUSINESS PROCESS EXCELLENCE
AUTOMATION TO REDUCE HUMAN
INTERVENTIONS
STANDARDISATION TO DRIVE COST
EFFICIENCY
Scalability
CORE OPERATING PLATFORMS
HYBRID MULTI CLOUD STRATEGY
FOR SCALE AND EFFICIENCY
PARTNER INTEGRATION
Tech
no
logy
Cap
abili
ties
Bu
sin
ess
Ou
tco
me
s

Copyrig
ht
Conte
nt
/ 2016
Aditya Birla Capital Limited
Figures in Rs Crore
Awards and Accolades
7
‘WhatsApp Enterprise Solutions for Business’ won in the Innovation category, Qualtech 2019 Thomson Reuters Lipper Awards – MENA Markets 2019 (across various fund categories)
ET BFSI Excellence Award 2019 for service and operational Excellence, 2019 Golden Peacock Award for Excellence in Corporate Governance 2019 - Institute of Directors, Delhi
Home Loans provider of the Year (Outlook Money Awards), 2019 – Gold (Affordable), Silver (Overall) FICCI Insurance Industry Awards 2020 for Comprehensive Maternal & Child healthcare (CSR Programs)
Asset Triple A Treasury, Trade, Supply Chain and Risk Management Awards 2019 Health Insurance Products and Service Innovation at the Patient Experience Conclave & Awards 2019
Brand of the Year
Indian Content Marketing Awards (ICMA) 2020
Winner of Lean Six Sigma Project
The Confederation of Indian Industry (CII) Award, 2020
FICCI CSR Award 2020
For Project Saksham aimed at holistic inclusive model for
differently abled children and youngsters
Best Social MediaBrand in India in Financial
Services
Sammies, 2019
Health Insurer of the Year
ET Now Business Leader of the Year Awards, 2019-20
Best Fund House for Investor Education
Asia Asset Management Best of the Best Awards, 2020
Other noteworthy awards for Aditya Birla Capital and its subsidiaries in 2019 & 2020

Aditya Birla Finance Limited
NBFC Business

Aditya Birla Capital Limited
Performance Summary | NBFC | Aditya Birla Finance
➢ Gross Disbursal of ~Rs 2,598 Crores (2x of Q1 FY21 | 64% of PY)
➢ Disbursements in Sep’20 bounces back to pre-CoVID levels
➢ Continued growth in target segments: Retail at 85% of Q4 FY20 | SME at 1.1x of Q4 FY20
Strong revival in disbursements
➢ Retail portfolio ↑ 16% y-o-y; Retail + SME + HNI Mix at 51.9% (PY: 50.5%)
➢ Focused approach towards reducing ATS across all segments
➢ Strategic right sizing in large/ mid corporate: Structured Finance: ↓ 42% y-o-y and Construction Finance: ↓ 18% y-o-y
Focus on Portfolio Rebalancing
➢ NIM at 5.32% (↑ 50 bps q-o-q | ↑ 17 bps y-o-y). Increase driven by:
➢ Portfolio rebalancing including growth in retail ➢ Higher fees due to revival in disbursements, and ➢ Active treasury management to reduce cost of funds
➢ Q2 FY21 CIR at 30.7% (PQ: 30.6%); Q2 FY21 PPOP: Rs 438 Crore (↑ 12% q-o-q)
Improving margins & Core Profitability
➢ Collection efficiency at 92% for Oct’20; Trending towards pre-CoVID levels
➢ Enhanced provision cover over Sep’19 (LY). PCR by stages:
➢ Stage 1: 0.61 % (↑ 1.9x y-o-y) | Stage 2: 9.81 % (↑ 1.9x y-o-y)
➢ Stage 3: 44.6% (PY: 33.0%) | Net Stage 3 Security cover: 1.9x (post provision)
➢ CoVID provision: Rs 139 Crore (33% of total stage 1 & 2 provision)
Quality of Book & Collections revival
➢ 82% customers onboarded digitally in Q2 FY21
➢ 100% salaried Personal Loans sourced, underwritten and disbursed digitally
➢ Video KYC enabled digital customer journeys deployed
➢ Chatbot & WhatsApp channel seen significant uplift during lockdown with ~ 1.8+ lakhs monthly customer-initiated interactions
Digital Adoption
➢ Dynamic treasury management helped optimise borrowing cost despite increased spreads for NBFCs and surplus liquidity (CoB ↓ 26 bps q-o-q |↓ 56 bps y-o-y)
➢ Raised LT borrowing of ~Rs 1,861 Crore in H1 FY21
➢ Comfortable capital adequacy with CRAR at ~21.6%
Liquidity and Balance Sheet Resilience
1 2
3 4
5 6
9

Copyrig
ht
Conte
nt
/ 2016
Aditya Birla Capital Limited
Figures in Rs Crore
Strong revival in disbursements with focus on target segments
10
SMEFocus on secured TL/ WCDL segment Broker Funding: ↓ 79% y-o-y | LRD: ↓ 11% y-o-y
RetailFocus on growing small ticket loan bookPersonal Loans: ↑ 16% y-o-y | Business Loans: ↑ 16% y-o-y
CorporateStrategic repayment/ pre-payment in large/ mid corporateStructured Finance: ↓ 42% y-o-y | Construction Finance: ↓ 18% y-o-y
HNI LAS: ↓ 54% y-o-y
Focusing new disbursement in target segmentsDisbursement trending back to pre-CoVID levels
Dis
bu
rsal
sLo
an B
oo
k M
ix
50.5% 50.3% 51.9%
46.8% 45.4% 43.4%
2.7% 4.4% 4.8%
Q2 FY20 Q1 FY21 Q2 FY21
SME + Retail + HNI Large + Mid Corporate Others
48,368 45,939 45,475
4,038
1,313
2,598
Q2 FY20 Q1 FY21 Q2 FY21
1,118 1,067 1,108
Jan'20 Feb'20 Sep'20
Gross Disbursal of ~Rs 2,598 Crores | 2x of Q1 FY21 | 64% of PY

Copyrig
ht
Conte
nt
/ 2016
Aditya Birla Capital Limited
Figures in Rs Crore
Building granularity across segments
11
28% 28%% Mix
20%16%% Mix 10% 8%% Mix
46% 43%% Mix
5 5ATS (Rs Crore) 66 58ATS (Rs Crore)
56ATS (Rs Lakhs) 49 40LAS ATS (Rs Crore)
SME
Ret
ail
Larg
e/
Mid
Co
rpo
rate
HN
I + O
the
rs
13,316 12,864Loan book 22,331 19,714Loan Book
7,845 9,060Loan book 4,876 3,838Loan Book
27%
19%
5
5
12,541
8,678
8%
45%
59
37
20,847
3,873
43% 45% 46%
22% 24% 25%2% 1% 1%
23% 21% 21%10% 9% 7%
Q 2 F Y 2 0 Q 1 F Y 2 1 Q 2 F Y 2 1
Supply Chain Finance
LRD
Broker Funding
LAP
TL/ WCDL
40% 40% 42%
5% 6%
53% 51% 48%
6% 4% 4%
Q 2 F Y 2 0 Q 1 F Y 2 1 Q 2 F Y 2 1
LAS
Unsecured (PIL-BIL)
Secured (PIL-BIL)
LAP
14% 14% 13%11% 7% 7%
32% 36% 38%
44% 42% 42%
Q 2 F Y 2 0 Q 1 F Y 2 1 Q 2 F Y 2 1
TL/ WCDL/ NCDs
Project Loan
Structured Finance
Construction Finance
74%48% 43%
26%52% 57%
Q 2 F Y 2 0 Q 1 F Y 2 1 Q 2 F Y 2 1
Treasury
LAS

Copyrig
ht
Conte
nt
/ 2016
Aditya Birla Capital Limited
Figures in Rs Crore
Increase in margins leading to improvement in PPOP
121 NIM including fee (net of DSA Expenses and Processing Cost) 2 Calculated basis % of average Loan Book
3 DSA commission and Processing cost netted off against Total Revenue, accordingly previous quarter financials are reinstated; Processing costs netted off against revenue in current year
NIM at 5.32% (↑ 50 bps q-o-q | ↑ 17 bps y-o-y)
PPOP ↑ 12% q-o-q | Bounces back near LY levels
5.14% 5.32%NIM1 %
3.71% 3.40%PPOP2 %
Optimised borrowing cost in a volatile interest rate environment
Maintained CIR
1.50% 1.66%Opex2,3 %
Net
Inte
rest
Inco
me
1,3
Co
st o
f B
orr
ow
ing
Co
st In
com
e R
atio
3P
PO
P
7.18% 6.82%CoF2%
4.82% 1.48%
6.51% 3.76%
4.92% 4.74%5.17%
0.22%0.08%
0.15%
Q2 FY20 Q1 FY21 Q2 FY21
Fee Income
Core NIM
8.24%7.94%
7.68%
Q2 FY20 Q1 FY21 Q2 FY21
451 392
438
Q2 FY20 Q1 FY21 Q2 FY21
28.8%30.6% 30.7%
Q2 FY20 Q1 FY21 Q2 FY21

Copyrig
ht
Conte
nt
/ 2016
Aditya Birla Capital Limited
Figures in Rs Crore
Enhanced provision cover across stages
131 Based on Hon’ble Supreme Court’s interim order of not classifying customers as NPA after 31 Aug, GNPA and NNPA stood at 3.47% & 1.92% respectively. Adjusted GNPA and NNPA stood at 3.54% & 1.96% resp.
Provisioning update for the quarter
▪ Incremental provisioning of Rs 39 Crores q-o-q on loan book under Stage 1 & 2 given the current environment
▪ Additionally, CoVID-19 provision of Rs 139 Crore; 31 bps of Loan Book, considering LGD/PD assumptions based on extensive stress-testing
Credit Cost
▪ Credit cost (ex-CoVID) % of AAUM at 1.67% (PQ: 1.33% | PY: 1.11%)
▪ Expecting ~50% resolution of Stage 3 book by end FY21
▪ Credit cost for H2 FY21 expected to be in 1.2% –1.3% range, depending on economic conditions
Stage 1 & 2 PCR from 0.52% (Q3 FY20) → 0.97% (Q2 FY21)
Stage 3 PCR from 28.9% (Q3 FY20) → 44.6% (Q2 FY21)
Q3 FY20 Q4 FY20
Figures in Rs Crores Stage 1 & 2 Stage 3 Stage 1 & 2 Stage 3
Loan Book 46,635 1,298 45,360 1,697
% Loan Book (Gross) 97.29%IL&FS Ex-IL&FS
96.39%IL&FS Ex-IL&FS
0.46% 2.26% 0.47% 3.15%
ECL Provision 243 376 316 566
Provision Coverage 0.52% 28.9% 0.70% 33.0%
% Loan Book (Net) 1.95% 2.40%
Q1 FY21 Q2 FY211
Stage 1 & 2 Stage 3 Stage 1 & 2 Stage 3
44,284 1,655 43,899 1,576
96.40%IL&FS Ex-IL&FS
96.53%IL&FS Ex-IL&FS
0.48% 3.13% 0.48% 2.98%
386 638 425 702
0.87% 38.60% 0.97% 44.55%
2.21% 1.92%
Collection efficiency
▪ Collection efficiency at 92% for Oct’20
▪ Trending towards pre-CoVID levels

Copyrig
ht
Conte
nt
/ 2016
Aditya Birla Capital Limited
Figures in Rs Crore
Adequate provisioning and security cover across segments
14
▪ ~80% of total loan book secured. Security Cover:
▪ Overall Loan Book: Security value of Rs 82,825 Crore Vs. overall loan book of Rs 45,475 Crore (Net Security Cover1 : 1.9x)
▪ Net Stage 3 Book: Security value of Rs 1,627 Crore Vs. Net Stage 3 assets of Rs 874 Crore (Net Security Cover1 : 1.9x)
▪ Additional 5% secured through CGTMSE guarantee scheme
▪ 75% of Existing MSME Unsecured Loans are covered under credit guarantee with SIDBI (CGTMSE Program)
Security cover and Guarantee Programs
1Net Security Cover = Security Value/ (GS3 – Provision)
Customer Segments GS3 Provision NS3 SecurityNet Security
Cover1
SME 177 70 107 212 2.0x
Retail - Secured 59 15 45 62 1.4x
Retail - Unsecured 45 25 20 - -
Large & Mid Corp. (Ex. IL&FS) 1,075 530 546 1,166 2.1x
Large & Mid Corp. (IL&FS) 219 63 156 187 1.2x
HNI & Others - - - - -
Total 1,576 702 874 1,627 1.9x
Copyrig
ht
Conte
nt
/ 2016
Aditya Birla Capital Limited
Figures in Rs Crore
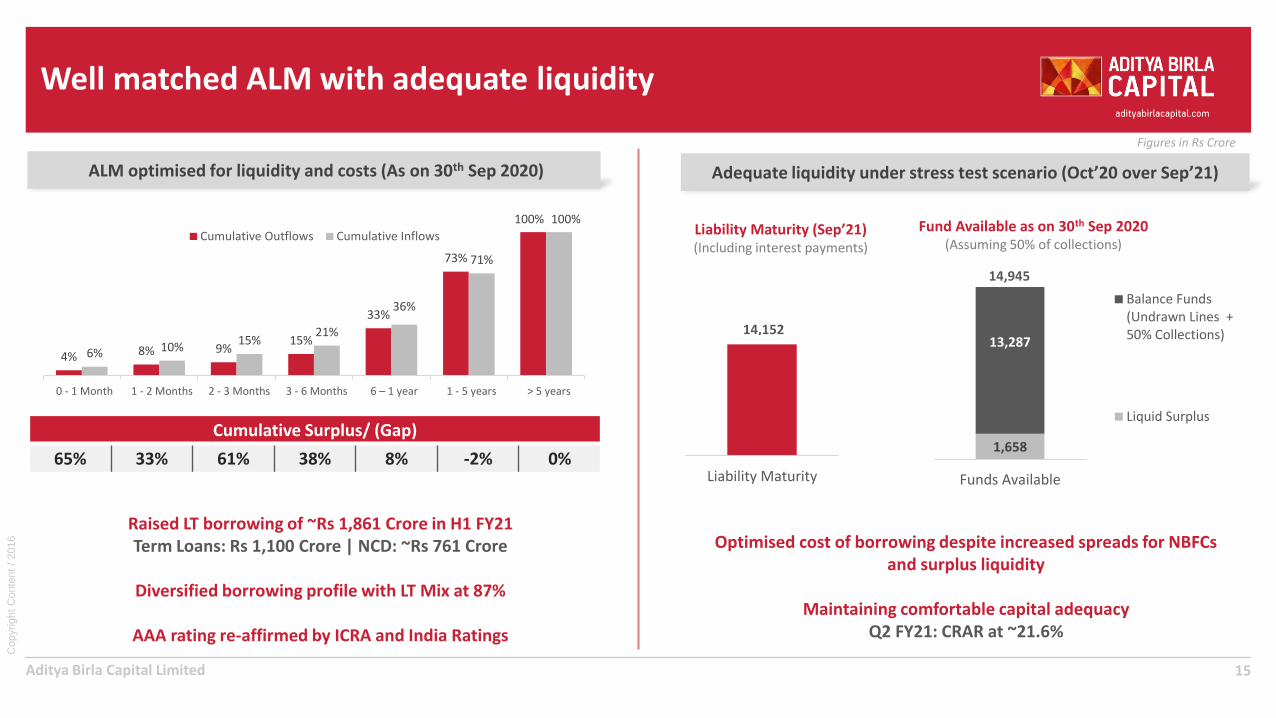
Well matched ALM with adequate liquidity
15
ALM optimised for liquidity and costs (As on 30th Sep 2020)
Cumulative Surplus/ (Gap)
65% 33% 61% 38% 8% -2% 0%
Adequate liquidity under stress test scenario (Oct’20 over Sep’21)
4% 8% 9%15%
33%
73%
100%
6% 10%15%
21%
36%
71%
100%
0 - 1 Month 1 - 2 Months 2 - 3 Months 3 - 6 Months 6 – 1 year 1 - 5 years > 5 years
Cumulative Outflows Cumulative Inflows
1,658
13,287
Funds Available
Balance Funds(Undrawn Lines +50% Collections)
Liquid Surplus
14,945
14,152
Liability Maturity
Liability Maturity (Sep’21)(Including interest payments)
Fund Available as on 30th Sep 2020(Assuming 50% of collections)
Optimised cost of borrowing despite increased spreads for NBFCs and surplus liquidity
Maintaining comfortable capital adequacyQ2 FY21: CRAR at ~21.6%
Raised LT borrowing of ~Rs 1,861 Crore in H1 FY21Term Loans: Rs 1,100 Crore | NCD: ~Rs 761 Crore
Diversified borrowing profile with LT Mix at 87%
AAA rating re-affirmed by ICRA and India Ratings
Copyrig
ht
Conte
nt
/ 2016
Aditya Birla Capital Limited
Figures in Rs Crore
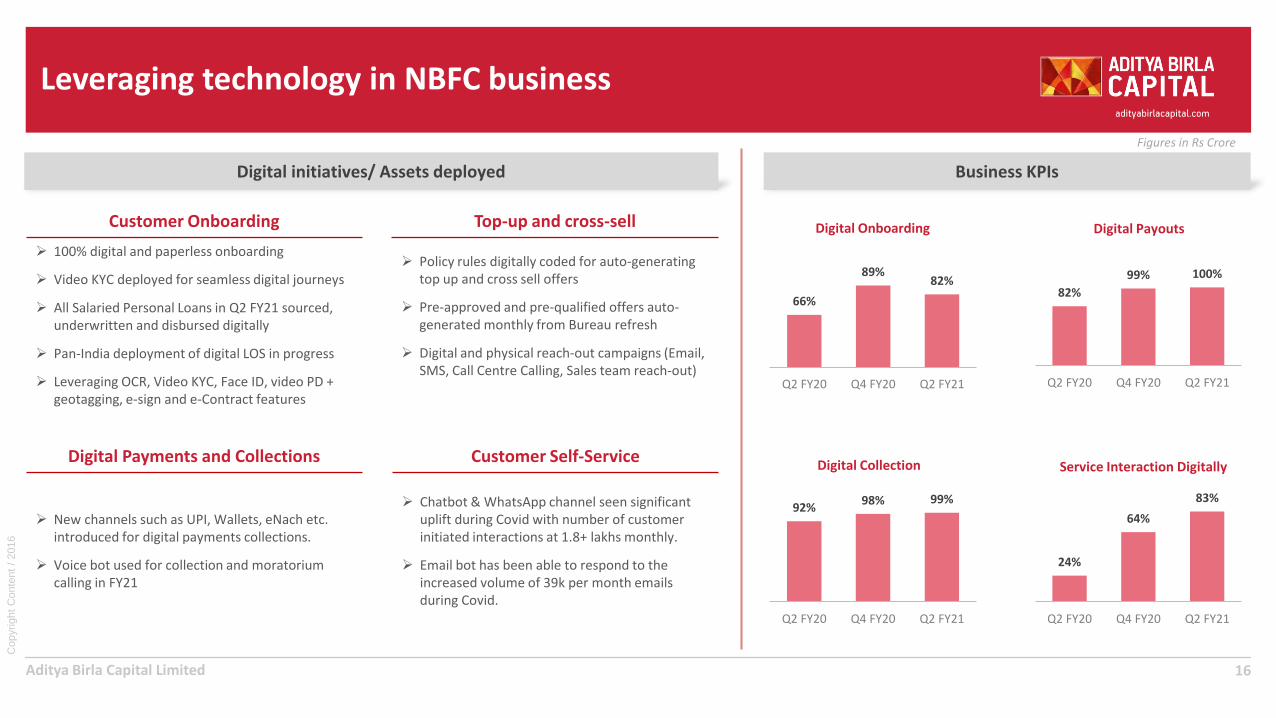
Leveraging technology in NBFC business
16
Customer Onboarding
➢ 100% digital and paperless onboarding
➢ Video KYC deployed for seamless digital journeys
➢ All Salaried Personal Loans in Q2 FY21 sourced, underwritten and disbursed digitally
➢ Pan-India deployment of digital LOS in progress
➢ Leveraging OCR, Video KYC, Face ID, video PD + geotagging, e-sign and e-Contract features
Digital initiatives/ Assets deployed Business KPIs
Top-up and cross-sell
➢ Policy rules digitally coded for auto-generating top up and cross sell offers
➢ Pre-approved and pre-qualified offers auto-generated monthly from Bureau refresh
➢ Digital and physical reach-out campaigns (Email, SMS, Call Centre Calling, Sales team reach-out)
Digital Payments and Collections
➢ New channels such as UPI, Wallets, eNach etc. introduced for digital payments collections.
➢ Voice bot used for collection and moratorium calling in FY21
Customer Self-Service
➢ Chatbot & WhatsApp channel seen significant uplift during Covid with number of customer initiated interactions at 1.8+ lakhs monthly.
➢ Email bot has been able to respond to the increased volume of 39k per month emails during Covid.
66%
89%82%
Q2 FY20 Q4 FY20 Q2 FY21
Digital Onboarding
82%
99% 100%
Q2 FY20 Q4 FY20 Q2 FY21
Digital Payouts
24%
64%
83%
Q2 FY20 Q4 FY20 Q2 FY21
Service Interaction Digitally
92%98% 99%
Q2 FY20 Q4 FY20 Q2 FY21
Digital Collection

Copyrig
ht
Conte
nt
/ 2016
Aditya Birla Capital Limited
Figures in Rs Crore
Key Financials – Aditya Birla Finance Limited
17Note 1: DSA commission netted off against Total Revenue, accordingly previous period financials are reinstated; NIM including fee (net of DSA Expenses); Processing costs netted off against revenue in current yearNote 2: Aditya Birla MyUniverse demerged transaction business into ABFL’s wealth business w.e.f. 1st January 2020; Prior period accounts not restated.
Quarter 1 Quarter 2 Figures in Rs Crore Half Year
FY 20-21 FY 19-20 FY 20-21 Key Performance Parameters
FY 19-20 FY 20-21
(CY) (PY) (CY) (PY) (CY)
45,939 48,368 45,475 Lending book 48,368 45,475
11.64% 12.32% 11.83% Average yield (Incl. Fee Income) 12.38% 11.74%
6.82% 7.18% 6.51% Interest cost / Avg. Lending book 7.18% 6.67%
4.82% 5.14% 5.32% Net Interest Margin (Incl. Fee Income) 5.19% 5.07%
565 634 632 Net Interest Income (Incl. Fee Income) 1,310 1,197
173 183 194 Opex 361 367
1.50% 1.50% 1.66% Opex / Avg. Lending book 1.46% 1.58%
30.6% 28.8% 30.7% Cost Income Ratio 27.6% 30.6%
204 134 194 Credit Provisioning 231 398
1.77% 1.11% 1.67% Credit Provisioning/ Avg. Lending book 0.93% 1.72%
189 317 244 Profit before tax 718 433
140 218 181 Profit after tax 481 322
8,196 7,890 8,379 Net worth 7,890 8,379

Aditya Birla Housing Finance Limited
Housing Finance Business

Aditya Birla Capital Limited
Performance Summary | Housing Finance | AB Housing Finance
➢ Focus on granular business continues
➢ Logins (Count) in Sep’20: 129% of PY | Q2FY21: 108% of PY
➢ Strong rebound in gross disbursals:
➢ Sept’20: ~100% of PY | Q2FY21: 72% of Q2 FY20 and 89% of Q4 FY20
Strong revival in disbursements
➢ Focused approach to build granular higher-yielding business:➢ HL ATS at Rs 29 Lacs ↓ 12% y-o-y ➢ Affordable new sourcing mix (HL + LAP) at 42% (PY: 34%)
➢ Affordable HL ↑ 33% y-o-y | ↑ 2.7x over 2 years
➢ Construction Finance ↓ 25% y-o-y
Focus on Portfolio Rebalancing
➢ Q2 FY21 NIM1 expanded to 3.33% (↑ 6 bps q-o-q & ↑ 42 bps y-o-y)
➢ Cost income ratio at 41.2% (↓ 4% q-o-q)
➢ Pre-provision operating profit at Rs 63 Crore (↑ 22% q-o-q)
➢ PAT grew by 30% q-o-q
Improving margins & Core Profitability
➢ Collection efficiency at 94% in Oct’20; Trending towards pre-CoVID levels
➢ GNPA and NNPA at 1.16% and 0.70% respectively
➢ Enhanced provision cover over Sep’19 (LY). PCR by stages:
➢ Stage 1: 0.48% (↑ 1.7x y-o-y) | Stage 2: 12.9% (↑ 5.6x y-o-y)➢ Stage 3: 37.0%1 (PY: 27.2%)
➢ CoVID provision of Rs 30 Crore (38% of total Stage 1 & 2 provision)
Quality of Book & Collections revival
➢ 84% of all files sourced digitally in Q2 FY21 (1.4x of Q1 FY21)
➢ Onboarded 38% of our total customers through ABC One ID portal
➢ Digitization of onboarding process has helped save on processing cost, reduce end-to end TAT as well as deliver improved customer experience
➢ WhatsApp gone Live on 29 Service Requests; Adoption level is 95%
Digital Adoption
➢ Dynamic treasury management helped optimise borrowing cost despite increased spreads for HFCs and surplus liquidity: CoB ↓ 57 bps y-o-y |↓ 15 bps q-o-q)
➢ Raised LT borrowing of ~Rs 850 Crore in H1 FY21
➢ Comfortable capital adequacy with CRAR at ~19.33%
Liquidity and Balance Sheet Resilience
1 2
3 4
5 6
19
Copyrig
ht
Conte
nt
/ 2016
Aditya Birla Capital Limited
Figures in Rs Crore
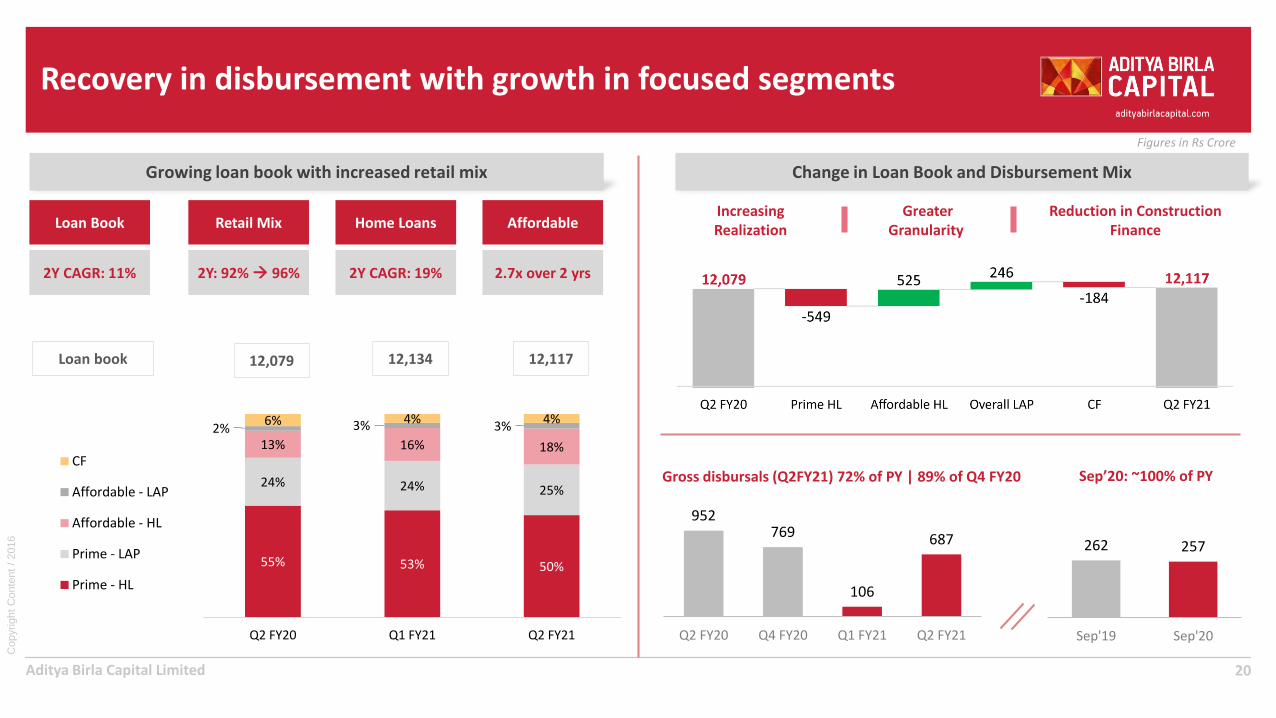
Recovery in disbursement with growth in focused segments
20
Change in Loan Book and Disbursement MixGrowing loan book with increased retail mix
55% 53% 50%
24% 24% 25%
13% 16% 18%
2% 3% 3%6% 4% 4%
Q2 FY20 Q1 FY21 Q2 FY21
CF
Affordable - LAP
Affordable - HL
Prime - LAP
Prime - HL
Retail Mix
2Y: 92% → 96%
Home Loans
2Y CAGR: 19%
Affordable
2.7x over 2 yrs
Loan Book
2Y CAGR: 11%
12,079 12,134Loan book
Increasing Realization
Greater Granularity
Reduction in Construction Finance
12,117
952769
106
687
Q2 FY20 Q4 FY20 Q1 FY21 Q2 FY21
262 257
Sep'19 Sep'20
Sep’20: ~100% of PY Gross disbursals (Q2FY21) 72% of PY | 89% of Q4 FY20

Copyrig
ht
Conte
nt
/ 2016
Aditya Birla Capital Limited
Figures in Rs Crore
Sourcing strategy
21
Focus on increasing reach and building retail granularityDiversified Geographic Mix (%)
Balanced distribution strategy
Tapping growth in smaller cities
Non-metro loan book mix at 47%
57 branches currently operational pan-India
Note: Metro cities includes Delhi-NCR, Mumbai-MMR, Kolkata, Chennai, Bangalore, Pune and Hyderabad
Ho
me
Lo
ans
Sou
rcin
gC
ust
om
er
Mix
Metros Non-Metros
Overall Home Loans Affordable Home LoansATS: Rs 29 Lacs (PY: Rs 33 Lacs)
Focus on affordable segment
29% 29% 29% 29%
19% 19% 19% 19%
13% 12% 12% 11%
39% 40% 41% 41%
Q2 FY20 Q4 FY20 Q1 FY21 Q2 FY21
North South East West
64% 63%
36% 37%
Q2 FY20 Q2 FY21
Non-Salaried Salaried
39% 37%
61% 63%
Q2 FY20 Q2 FY21
3,731 3,793
Q2 FY20 Q2 FY21
4,509 4,423
Q2 FY20 Q2 FY21

Copyrig
ht
Conte
nt
/ 2016
Aditya Birla Capital Limited
Figures in Rs Crore
Increase in core profits driven by margins and control on cost
22
1 NIM including fee (net of DSA Expenses) 2 % computed based on average Loan Book 3 DSA commission netted off against Total Revenue, accordingly previous period financials are reinstated
Pre-provision operating profit (PPOP) ↑ 22% q-o-q
Net
Inte
rest
Inco
me
1,3
Co
st o
f B
orr
ow
ing
Co
st In
com
e R
atio
PP
OP
2.91% 3.33%NIM1,3 %
1.76% 1.72%PPOP2 %
Optimised borrowing cost in a volatile interest rate environment
CIR ↓ 4% q-o-q
1.38% 1.45%Opex2 %
53 5263
Q2 FY20 Q1 FY21 Q2 FY21
44.0% 45.7% 41.2%
Q2 FY20 Q1 FY21 Q2 FY21
Margin improvement led by change in product mix NIM: ↑ 6 bps q-o-q & ↑ 42 bps y-o-y
84 84 93
Q2 FY20 Q1 FY21 Q2 FY21
8.43%8.01% 7.86%
Q2 FY20 Q1 FY21 Q2 FY21
7.54% 6.97%CoF % 7.16% 2.07%
1.45%3.27%

Copyrig
ht
Conte
nt
/ 2016
Aditya Birla Capital Limited
Figures in Rs Crore
Enhanced provision cover across stages
23
Affordable Loan Book
▪ ATS ~ Rs 14 Lacs
▪ 29% of Affordable Home Loans portfolio backed by IMGC and 48% eligible for PMAY subsidy
Construction Finance
▪ ATS on exposure: Rs 12 Crore | ATS on outstanding: Rs 8 Crore
▪ ~85% exposure to Bangalore, MMR, Pune, Surat, Ahmedabad and NCR
Credit Cost
▪ Overall CoVID-19 provision: Rs 30 Crore (25 bps of Loan Book)
▪ Security value of Rs 170 Crore against Net Stage 3 assets of Rs 85 Crore (2x security cover)
Q3 FY20 Q4 FY20 Q1 FY21 Q2 FY211
Figures in Rs Crores Stage 1 & 2 Stage 3 Stage 1 & 2 Stage 3 Stage 1 & 2 Stage 3 Stage 1 & 2 Stage 3
Loan Book 12,063 127 11,955 147 11,989 146 11,967 150
% of Loan Book (Gross) 98.96% 1.04% 98.79% 1.21% 98.80% 1.20% 98.76% 1.24%
ECL Provision 40 40 56 47 70 47 79 55
Provision Coverage 0.33% 31% 0.47% 32% 0.58% 32% 0.66% 37%
% of Loan Book (Net) 0.73% 0.82% 0.81% 0.78%
Stage 1 & 2 PCR from 0.33% (Q3 FY20) → 0.66% (Q2 FY21)
Stage 3 PCR from 31% (Q3 FY20) → 37% (Q2 FY21)
1 As per Hon’ble Supreme Court’s interim order of not classifying customers as NPA GNPA and NNPA stood at 1.16% & 0.70% respectively
Collection Efficiency
▪ Collection Efficiency at 94% in Oct’20
▪ Trending towards pre-CoVID levels

Copyrig
ht
Conte
nt
/ 2016
Aditya Birla Capital Limited
Figures in Rs Crore
Well matched ALM with adequate liquidity
24
ALM optimised for liquidity and costs (As on 30th September 2020) Adequate liquidity under stress test scenario (Oct’20 over Sep’21)
1% 3% 4% 8%
23%
89%100%
11% 15%24% 25% 29%
67%
100%
0-1 months 1-2 months 2-3 months 3-6 months 6-12 months 1-5 years > 5 years
Cumulative Outflows Cumulative Inflows
Maintaining comfortable capital adequacyQ2 FY21: CRAR at ~19.33% (Regulatory requirement: 14%)
Liability Maturity (Sep’21)(Including interest payments)
Fund Available as on 30th Sep 2020(Assuming 50% of collections)
Cumulative Surplus/ (Gap)
686% 333% 443% 234% 27% -24% 0%
Raised LT money of Rs 850 Crores in H1 FY21
Rs 850 Crores Long Term (Term Loan: Rs 400 Crores, NCD: Rs 450 Crores)
152
3,842
Funds Available
Balance Funds(Undrawn Lines +50% Collections)
Liquid Surplus
3,994
2,842
Liability Maturity

Copyrig
ht
Conte
nt
/ 2016
Aditya Birla Capital Limited
Figures in Rs Crore
Leveraging technology across customer journeys
25
Customer Onboarding
➢ Mobile App for Digital onboarding of customers leveraging e-Aadhaar, facial recognition, bureau integration, ITR & GST database integration.
➢ Processing time reduction with better credit decisioning capability through:
➢ Instant eligibility through in-built calculator➢ API assessment of financial eligibility➢ Video PD with geo-tagging option
Digital initiatives/ Assets deployed Business KPIs
Digital Collections
➢ Voice Bot for collections and moratorium calling 69% Promise to Pay
➢ Leveraging Collections App for Digital payment
➢ Deployed 2-way switch calling platform enabling In-House Collections for Sales Teams during WFH on moratorium & overdues collections follow-up
Digital Payments
➢ Use of Paytm, Bill desk & Virtual Accounts for payment has enabled faster reconciliation & real time account update.
➢ Part payment automation using RPA has reduced Overall TAT by 75%
Digital Servicing
➢ WhatsApp: Live on 29 Service Requests | 24 are STP | Adoption level is 95%.
➢ E-Bot efficiency increased from 84% to 90%.
➢ Google Assistant live on production environment; Marketing campaign in progress.
➢ Cust portal: Live on 62 service requests catering to 60% of overall service requests
84%
Q2 FY20 Q4 FY20 Q2 FY21
Customer Onboarding
28% 33%
65%
Q2 FY20 Q4 FY20 Q2 FY21
Digital Payouts
45%59%
70%
Q2 FY20 Q4 FY20 Q2 FY21
Digital Servicing
95% 95% 98%
Q2 FY20 Q4 FY20 Q2 FY21
Digital Collection
Mobile sourcing App launched in
Q1 FY21

Copyrig
ht
Conte
nt
/ 2016
Aditya Birla Capital Limited
Figures in Rs Crore
Value accretive growth
261 Based on monthly compounding of annualised RoE
9.43%
8.25%
10.56%
Q2 FY20 Q1 FY21 Q2 FY21
PAT Return on Assets Return on Equity1
28 28
36
Q2 FY20 Q1 FY21 Q2 FY21
RoA at 1.17% (PQ: 0.92%) RoE at 10.56% (PQ: 8.25%) PAT at Rs 36 Cr (PQ: 28 Cr)
0.92% 0.92%
1.17%
Q2 FY20 Q1 FY21 Q2 FY21

Copyrig
ht
Conte
nt
/ 2016
Aditya Birla Capital Limited
Figures in Rs Crore
Key Financials – Aditya Birla Housing Finance Limited
27Note: DSA commission netted off against Total Revenue, accordingly previous period financials are reinstated; NIM including fee (net of DSA Expenses)
Quarter 1 Quarter 2 Figures in Rs Crore Half Year
FY 20-21(CY)
FY 19-20 (PY)
FY 20-21 (CY)
Key Performance Parameters FY 19-20 (PY)
FY 20-21(CY)
12,134 12,079 12,117 Lending book 12,079 12,117
10.36% 10.36% 10.25% Average yield 10.42% 10.31%
7.16% 7.54% 6.97% Net Interest cost / Avg. Loan book 7.53% 7.07%
3.27% 2.91% 3.33% NIM (incl. Fee Income) 2.95% 3.30%
84 84 93 Net Interest Income 167 177
44 42 44 Opex 84 88
1.45% 1.38% 1.45% Opex/ Avg. Loan Book 1.43% 1.45%
45.7% 44.0% 41.2% Cost Income Ratio (%) 45.0% 43.3%
16 17 18 Credit Provisioning 29 34
0.54% 0.58% 0.58% Credit Provisioning/ Avg. Loan Book 0.49% 0.56%
36 36 45 Profit Before Tax 74 81
28 28 36 Profit After Tax 54 63
1,405 1,243 1,442 Net worth 1,243 1,442

Aditya Birla Sun Life AMC Limited
Asset Management Business

Aditya Birla Capital Limited
Performance Summary | Asset Management | ABSL Asset Management Co
➢ Overall Domestic AAUM at Rs. 2,38,674 Crore in Sep’20 (↑ ~11% q-o-q)
➢ Domestic Equity AAUM Rs. 82,179 Crore in Sep’20 (↑ ~13% q-o-q) with stable mix at 34%
➢ Net Sales market share improved q-o-q and y-o-y backed by strong investment performance
Strong revival in AUM
➢ Strong retail franchise with investor folio count at ~7.2 Mn; Fastest growing AMC in terms of folios with 5 years CAGR at 22% vs. Industry at 16%
➢ Maintained overall AAUM market share (Ex. ETF) at 9.4%
➢ SIP AUM ↑ 9% q-o-q | Maintained SIP Market share ~10%
➢ Maintained leadership in fixed income (Ex ETF); AAUM Market share at 10.8%
Maintaining Leadership and Market Share
➢ Retail AAUM at Rs 49,151 Crore in Sep’20 (↑ ~12% q-o-q)
➢ Continued traction in B-30 AAUM (↑ ~13% q-o-q)
➢ New SIP registrations ↑ 33% q-o-q; At ~80% of Q4 FY20 levels; SIP AUM % of Equity AUM increased from 38% (Mar’20) to 43% (Sep’20)
➢ ~1.40 Lacs new customers added in Q2 FY21
Building strong retail franchise
➢ PBT/ AAUM at 27 bps vs. 24 bps in Q1 FY21; Expect to maintain FY21 PBT/AAUM bps at current level
➢ Strong growth in Q2 PBT to Rs 164 Crore (↑ ~26% q-o-q)
➢ Focus on Opex with reduction of 11% y-o-y in H1 FY21
➢ Return on Equity at ~31% in H1 FY21
Strong Profitability
➢ Digital transactions account for ~91% of overall transactions
➢ 83% of new Folios created Digitally
➢ Omni-channel implementation: Inbound channels integrated for seamless and connected experience on investment journeys
➢ WhatsApp and Google Assistant for self-servicing (7 Lakh+ customer interactions)
Leveraging digital adoption
➢ Pan India presence with 300+ locations; 80,800+ IFA’s, 260+ National Distributors and 100+ bank partners
➢ Empaneled 850+ new IFAs in H1 FY21
➢ 349 digital investor education programs covering 48,000+ Investors in H1 FY21
➢ 290 distributor development program covering 32,300+ partners in H1 FY21
Investor & distributor engagement
1 2
3 4
5 6
29
Copyrig
ht
Conte
nt
/ 2016
Aditya Birla Capital Limited
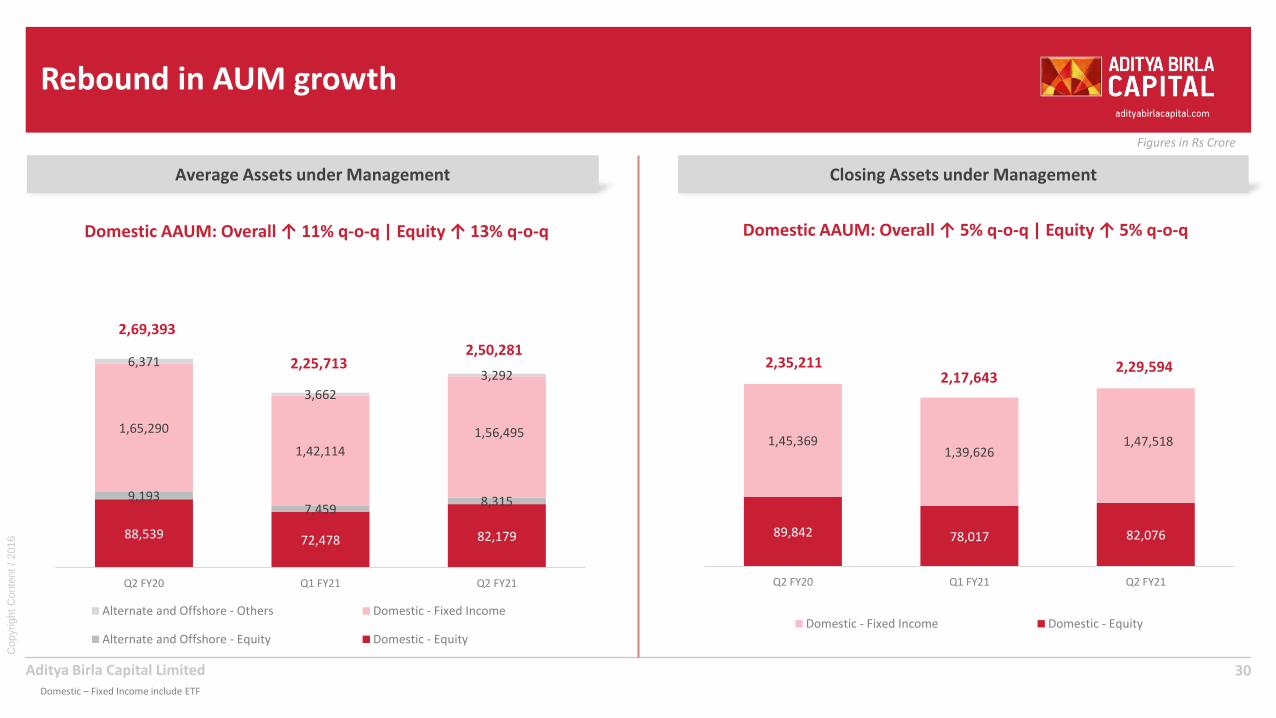
Rebound in AUM growth
30Domestic – Fixed Income include ETF
Average Assets under Management
88,539 72,478 82,179
9,1937,459
8,315
1,65,290
1,42,114
1,56,495
6,371
3,662
3,292
Q2 FY20 Q1 FY21 Q2 FY21
Alternate and Offshore - Others Domestic - Fixed Income
Alternate and Offshore - Equity Domestic - Equity
2,69,393
2,50,2812,25,713
Domestic AAUM: Overall ↑ 11% q-o-q | Equity ↑ 13% q-o-q
Closing Assets under Management
89,842 78,017 82,076
1,45,3691,39,626
1,47,518
Q2 FY20 Q1 FY21 Q2 FY21
Domestic - Fixed Income Domestic - Equity
2,17,6432,29,594
Domestic AAUM: Overall ↑ 5% q-o-q | Equity ↑ 5% q-o-q
2,35,211
Figures in Rs Crore

Copyrig
ht
Conte
nt
/ 2016
Aditya Birla Capital Limited
Focus on retailisation
31Source: AMFI
Retail + HNI AAUM at Rs 1+ Lakh Crore (5Y CAGR ~17%)
35,563 34,50239,114
Sep-19 Jun-20 Sep-20
190 bps improvement in B-30 AAUM mix
44,988 43,818 49,151
75,71358,888 62,194
Sep-19 Jun-20 Sep-20
HNI
Retail
1,02,706 1,11,345
Overall ↑ 8% q-o-q | Retail ↑ 12% q-o-q
B-3
0 A
AU
M
Re
tail
+ H
NI M
AA
UM
2nd highest gain in B-30 Market Share amongst Top 5 Players over 5 yrs
1,20,701
% o
f M
AA
UM 48.4% 45.7% 46.2%
Sep-19 Jun-20 Sep-20
↑ 10% y-o-y | ↑ 13% q-o-q
% o
f M
AA
UM
14.3%15.3%
16.2%
Sep-19 Jun-20 Sep-20
Figures in Rs CroreFigures in Rs Crore

Copyrig
ht
Conte
nt
/ 2016
Aditya Birla Capital Limited
Strong and sustained rebound in SIP
32
Strong revival in new SIP registrations
SIP
AU
M %
of
Equ
ity
AU
M
1,89,528
1,07,285 1,42,900
Q2 FY20 Q1 FY21 Q2 FY21
↑ 33% q-o-q | Registrations in Q2 FY21 at ~80% of Q4 FY20
32,070 31,96234,995
Sep-19 Jun-20 Sep-20
SIP AUM grew ~9% q-o-q
SIP AUM
SIP
AU
M
35.4%
40.9%42.6%
Sep-19 Jun-20 Sep-20
SIP AUM mix ↑ 7.3%
Tota
l SIP
Co
un
t (M
illio
ns)
Ne
w S
IP R
egis
trat
ion
Co
un
t
3.02.8 2.8
Sep-19 Jun-20 Sep-20
Figures in Rs Crore

Copyrig
ht
Conte
nt
/ 2016
Aditya Birla Capital Limited
Large and diversified distribution network
33
Continue to grow IFA share in equity sourcing
20% 19% 18%
47% 49% 50%
20% 20% 20%
13% 12% 12%
Q2 FY20 Q1 FY21 Q2 FY21
Bank
NationalDistributor
IFA
Direct
Investor Education and Distributor development
National Distributors 260+
Locations (>75% in B-30 cities)
300+ IFAs 80,800+
Banks 100+
▪ Conducted 349 digital investor education programs covering
48,000+ Investors
▪ Conducted 290 distributor development program covering
32,300+ channel partners
▪ Empanelled 850+ new IFAs in H1 FY21
▪ Digital asset awareness campaign to assist advisors to use digital
assets for transactions
▪ Conducted innovative campaigns and services with the objective
of spreading awareness among investors and providing support
to business partners

Copyrig
ht
Conte
nt
/ 2016
Aditya Birla Capital Limited
Leveraging technology
34
Customer Onboarding
➢ 83% of new Folios created Digitally
➢ API-fication of:
➢ Video KYC - Partners acquire new Customers with our APIs
➢ Purchase and Redemption- Many large partners using our APIs
Digital initiatives/ Assets deployed Business KPIs
Purchase Initiate Journey
➢ Omni Channel experience for investors on Website and WhatsApp for payment drop journey
➢ Easylink for recommending and facilitate purchase of funds to investors from distributors
➢ First in the industry to offer SIP e-OTM registration for automated SIP payments
Customer Retention
➢ Immediate and multiple Drop links reminders at set frequency to convert pending transactions into certainty
➢ Investors & Partners can invest in NFO via our digital platforms such as Fingo & Fingo Partner App, Investor & Partner Portal, ARN Hardcoded Links, Partner Easylink Platform, Chabot, WhatsApp, etc.
Customer Self-Service
➢ Introduced Systematic Corner, a dedicated section to manage all the systematic investments on the Investor Portal
➢ Innovative Servicing➢ Whatsapp and Google Assistant – for Key
transactions and A/C statement resp. 1.3 Lac opt-ins on Investor WhatsApp
➢ Online updation of Nominee, Bank A/C & Contact details
55%
76%83%
Q2 FY20 Q4 FY20 Q2 FY21
Digital Onboarding
74%90% 91%
Q2 FY20 Q4 FY20 Q2 FY21
Customer interactions on Digital Channels
88%99% 99%
Q2 FY20 Q4 FY20 Q2 FY21
% Digital Payments
87% 89% 89%
Q2 FY20 Q4 FY20 Q2 FY21
% Digital Distributor Onboarding

Copyrig
ht
Conte
nt
/ 2016
Aditya Birla Capital Limited
Key Financials – Aditya Birla Sun Life AMC Limited
351 Margin based on annualized earnings as % of Domestic AAUM
Quarter 1 Quarter 2 Quarter 2 Figures in Rs Crore Half Year
FY 20-21 (CY)
FY 19-20 (PY)
FY 20-21 (CY)
Key Performance Parameters FY 19-20 (PY)
FY 20-21 (CY)
2,14,592 2,53,828 2,38,674 Domestic AAUM 2,53,897 2,26,633
72,478 88,539 82,179 Domestic Equity AAUM 90,506 77,328
7,459 9,193 8,315 Alternate and Offshore Equity AAUM 9,471 7,887
79,937 97,732 90,494 Total Equity 99,977 85,215
259 323 291 Revenue 638 549
128 148 127 Costs 288 255
130 175 164 Profit Before Tax 351 294
24 bps 27 bps 27 bps Profit Before Tax (bps1) 28 bps 26 bps
97 148 125 Profit After Tax 265 223
Figures in Rs Crore

Aditya Birla Sun Life Insurance Limited
Life Insurance Business

Aditya Birla Capital Limited
Performance Summary | Life Insurance | ABSL Insurance Co
➢ Strong rebound in New Business Premium as economy re-opens
➢ Individual FYP ↑ 7% y-o-y in H1 FY21 (Private Players ↓ 11% y-o-y)
➢ Group NBP ↑ 78% y-o-y in H1 FY21 (Private Players ↑ 12% y-o-y)
➢ H1 Renewal premium ↑ 19% y-o-y with Digital collection ↑ 27% y-o-y
Strong rebound in business
➢ Continuous improvement in persistency over the years with 13th month persistency at 83.1% (↑ 200 bps y-o-y)
➢ Improved Opex to Premium Ratio down to 14.5% for H1 FY21 (PY: 20.1%)
➢ H1 FY21 Surrender Ratio at 4.5% (PY: 10.1%)
Improvement on all quality vectors
➢ Q2 FY21 Gross VNB Margin at 36% | Maintained Gross VNB Margins at 34.8% (H1 FY21) despite falling interest rates
➢ H1 FY21 Net VNB Margins ↑ 50 bps y-o-y to 1.6% (Q2 FY21: 6.4%). Expect year end with early double digit given the current trends.
➢ EV at Rs 5,727 Crore as on Sept’20 (↑ 13.8% y-o-y)
Improving Margins and Return on EV
➢ 95% Individual business sourced digitally in H1 FY21 with 80% Auto Pay
➢ Pre-Approved Sum Assured: PASA contributed to 11% of H1 FY21 FYP
➢ 15% incremental collections through “ZARA” renewal bot.
➢ Customer servicing through WhatsApp, Bots and Self-Service portals with monthly interactions of 2.5L+
Leveraging Digital and Analytics
➢ 95% of expected maturity benefits of guaranteed portfolio are hedged. Guarantees are regularly monitored, and products are repriced for adjustments in interest rate fluctuations
➢ Although we have seen increasing COVID-19 claims being reported in Q2, the overall claim experience is not adversely affected as of H1FY21. Additional claims provisions are made in view of COVID-19 basis estimates.
Risk Management
➢ Two new products launched on Non-Participating Platform; New Riders launched for ULIP products to improve margins
➢ New products contributed 20%+ of Q2 FY21 FYP
➢ Healthy Sourcing Mix through Proprietary and Partnership Channels, contribution of 43:57 respectively with controlled ULIPs
Product & Distribution
1 2
3 4
5 6
37

Copyrig
ht
Conte
nt
/ 2016
Aditya Birla Capital Limited
Figures in Rs Crore
Strong rebound in New Business Premium as economy re-opens
381 Individual FYP adjusted for 10% of single premium 2 Industry represents players (excluding LIC); FYP for Industry players: Source IRDAI
Individual FYP1 Group New Business Premium
577
693 744
H1 FY19 H1 FY20 H1 FY21
Private Players2 -11% Industry2 -7%
7% Y-o-Y in H1 FY21
1,049
679
1,210
H1 FY19 H1 FY20 H1 FY21
78% Y-o-Y in H1 FY21
Private Players2 12% Industry2 -2%

Copyrig
ht
Conte
nt
/ 2016
Aditya Birla Capital Limited
Figures in Rs Crore
Leveraging technology
39
Pre-Purchase
➢ Generated 5,00,000 Leads through LMS
➢ 2 Click customer journey being introduced for Bank Channels
➢ PASA campaigns contributed 11% to the total business
Digital initiatives/ Assets deployed Business KPIs
Customer On-boarding
➢ 95% New business sourced digitally
➢ Smart Prospecting tool with DIY Combos & AI based Digital training to go live in Q3.
➢ Mobile first platform for distributors & customers under development.
➢ LMS adoption in HDFC at 96%
Customer Retention/ Renewals
➢ Digital collection ↑ 27% y-o-y
➢ 15% incremental collections through “ZARA” renewal bot.
➢ 80% Auto pay adoption at onboarding stage in FY 21
➢ Contact less digital verification of customers with 33% adoption
Customer Self-Service
➢ Over 90% services available online
➢ WhatsApp & Chatbot have seen significant rise in adoption with total customer-initiated interactions crossing 2.5 lakh per month
85%91% 95%
Q2 20 Q4 20 Q2 21
Digital Onboarding
61%69% 71%
Q2 20 Q4 20 Q2 21
Self Service Ratio
71%84% 89%
Q2 20 Q4 20 Q2 21
Service Interaction Digitally
55% 60% 64%
Q2 20 Q4 20 Q2 21
Digital Renewal (by value)

Copyrig
ht
Conte
nt
/ 2016
Aditya Birla Capital Limited
Figures in Rs Crore
Multi channel distribution strategy
40
Sourcing Mix Channel Wise Highlights
54% 48% 43%
46% 52% 57%
H1 FY19 H1 FY20 H1 FY21
Partnerships Proprietary
30% 29%
68% 68%
3% 3%
H1 FY20 H1 FY21
Proprietary ChannelPartnership Channel
331 312
H1 FY20 H1 FY21
361 432
H1 FY20 H1 FY21
Bank Branches 10,000+
Cities 2,500+
Agents 85,000+Banca Tie-ups 8
26% 29%
63% 60%
11% 11%
H1 FY20 H1 FY21
Protection
Traditional
ULIP
Own Branches 370+
Incl. HDFC Bank, DCB, KVB, Indian Bank etc
Ind
. FY
PP
rod
uct
Mix

Copyrig
ht
Conte
nt
/ 2016
Aditya Birla Capital Limited
Figures in Rs Crore
Focus on value accretive product mix
41
39%28% 29%
23%
23%12%
30%42%
52%
8% 7% 6%
H1 FY19 H1 FY20 H1 FY21
Protection
Non-Par
Par
ULIP
Value Accretive Product Mix Products and Risk Management
▪ Product Strategy – Complete bouquet for all customer needs
➢ Child Plan and Flexi Assured launched on Non-Participating Platform with unique
propositions
➢ Revamp of Protection Product underway with healthy margins
➢ New Par Product launch in Q3 for addressing long term needs of customers
▪ Active Risk Mitigation Strategy
➢ 95% of expected maturity benefits of guaranteed portfolio are hedged
➢ Guarantees are regularly monitored and products are repriced for adjustments in
Interest Rate fluctuations
➢ A separate fund is created to manage the products where benefits are fully guaranteed
➢ Dedicated ALM strategies for each line of business
➢ Risk Appetite Framework to measure and monitor financial risks

Copyrig
ht
Conte
nt
/ 2016
Aditya Birla Capital Limited
Figures in Rs Crore
Improving quality of business
421 12month rolling block as per IRDAI 2 % figures in the chart denote Opex to Premium ratio
Renewal Premium
Y-o-Y Growth ~19%
1,397
1,661
1,984
H1 FY19 H1 FY20 H1 FY21
81%
66%
57%54%
47%
83%
70%
57%54%
51%
13thmonth
25thmonth
37thmonth
49thmonth
61stmonth
H1 FY20 H1 FY21
Persistency1 Controlled Opex2
539
617 578
H1 FY19 H1 FY20 H1 FY21
20.0% 14.5%17.5%
Reduction in opex to premium ratioImproving Persistency across cohorts

Copyrig
ht
Conte
nt
/ 2016
Aditya Birla Capital Limited
Figures in Rs Crore
Improvement in VNB Margins
431 Gross VNB is for Individual Life. 2 FY20 and FY21 Net VNB includes Group Risk business.
218
259 264
H1 FY19 H1 FY20 H1 FY21
36.3% 34.8%36.4%
Healthy Gross VNB margins despite falling interest rates
Q2 FY21 Gross VNB Margin at 36%
Net VNB better than PY given steadytopline and better expense management
Q2 FY21 Net VNB Margin at 6.4%
Margin
Gross VNB1 Net VNB2
-14
9 13
H1 FY19 H1 FY20 H1 FY21
1.1% 1.6%(2.3)%Margin
6.7% 6.0%8.0%G-Sec
Copyrig
ht
Conte
nt
/ 2016
Aditya Birla Capital Limited
Figures in Rs Crore
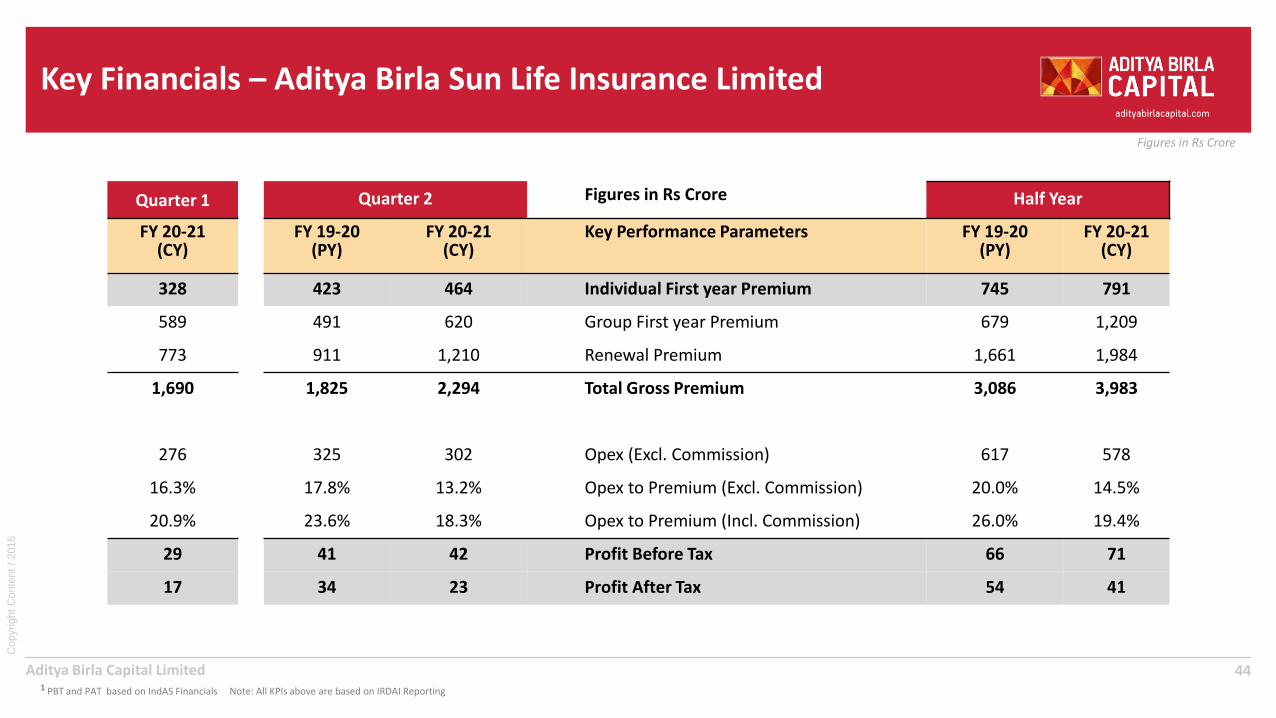
Key Financials – Aditya Birla Sun Life Insurance Limited
441 PBT and PAT based on IndAS Financials Note: All KPIs above are based on IRDAI Reporting
Quarter 1 Quarter 2 Figures in Rs Crore Half Year
FY 20-21 (CY)
FY 19-20(PY)
FY 20-21 (CY)
Key Performance Parameters FY 19-20(PY)
FY 20-21 (CY)
328 423 464 Individual First year Premium 745 791
589 491 620 Group First year Premium 679 1,209
773 911 1,210 Renewal Premium 1,661 1,984
1,690 1,825 2,294 Total Gross Premium 3,086 3,983
276 325 302 Opex (Excl. Commission) 617 578
16.3% 17.8% 13.2% Opex to Premium (Excl. Commission) 20.0% 14.5%
20.9% 23.6% 18.3% Opex to Premium (Incl. Commission) 26.0% 19.4%
29 41 42 Profit Before Tax 66 71
17 34 23 Profit After Tax 54 41

Aditya Birla Health Insurance Limited
Health Insurance Business

Aditya Birla Capital Limited
Performance Summary | Health Insurance | AB Health Insurance Co
➢ Fastest growing HI: H1 FY21 growth at 75% vs Industry: 17%, SAHI: 28%
➢ H1 Total GWP at Rs 550 Crore (LY: Rs 315 Crore)
➢ H1 Retail GWP at Rs 425 Crore; ↑ 2x of PY | Retail mix at 77% (PY: 68%)
➢ H1 Total Lives covered: 9.5 Mn (LY: 5.2 Mn)
Fastest growing Health Insurer
➢ Differentiated core offerings enabling market expansion incl. newer customer segments like younger customers, people with lifestyle conditions (Average customer age 5 years lower than industry)
➢ Health-data based Wellbeing Score to enable hyper-personalized engagement / health interventions leveraging health ecosystem
➢ Business outcomes: 20% higher retention, 6% lower claims ratio
Unique and Differentiated health first Business Model
➢ Strong growth in Banca with 14,000+ branches enabling access to diversified customer segments | Banca mix: 66% of retail (PY: 62%)
➢ Agency growth at 70%+ with branch network spanning 100+ locations
➢ 38+ digital partners covering 2 Mn.+ lives through 50+ contextual byte-sized products
Scaled & Diversified Digitally Enabled Distribution
➢ Digital acquisition & onboarding: increasing digital touchpoints in banks | 4-click journey | Digital Issuance: 98% vs 92% LY | Digital Renewals: 92% vs 66% LY
➢ Multi-lingual AI led Chatbot & WhatsApp self-servicing; WhatsApp self-servicing by 88% in H1 vs LY
➢ Analytics led savings through fraud detection engine for optimizing LR & persistency lift
Leveraging Digital, Data & Analytics
➢ Strong financial management: Combined Ratio to 129% (PY: 155%)
➢ Focus on Expense Management & Cost efficiencies | Controlled Loss Ratio inspiteof spike in CoVID claims in Sep’20: trends being monitored
➢ Estimated exit combined ratio for Q4 FY21 below 110% | On track for break-even by Q4 FY 21-22
Strong Financial Management
➢ Comprehensive Enterprise Risk Management leveraging ABC practices
➢ Information and Cyber Security Risk Management framework in line with Personal Data Protection (PDP) Bill given sensitivity of health data
➢ Health Risk Management: Holistic management covering Sourcing & benefit mgmt., Provider network mgmt. & Claims & Clinical Risk mgmt. including rigorous Fraud, Waste & Abuse framework
Risk Management
1 2
3 4
5 6
46

Copyrig
ht
Conte
nt
/ 2016
Aditya Birla Capital Limited
Business Outcomes
47GWP is as per ABHI Financials
1.2
5.2
9.5
H1 FY19 H1 FY20 H1 FY21
80.0%66.0%
56.0%
H1 FY19 H1 FY20 H1 FY21
GWP growth at 75% y-o-y with 2x retail growthRetail GWP grew 98% y-o-y (Retail Mix at 77%)
Holistic health risk managementRetail Claims Ratio at 44% (PY:44%)
Lives covered growth at 83% y-o-y6 Mn+ through rural & micro/ byte-sized products
Estimated exit combined ratio for Q4 FY21 below 110%Combined Ratio trending as per plan
180%155%
129%
H1 FY19 H1 FY20 H1 FY21
7.2x
62 100 125115
215
425
H1 FY19 H1 FY20 H1 FY21
Retail177
550
Group
315
3.1x
Rev
en
ue
Cla
ims
Rat
io
Live
s C
ove
red
(M
n)
Co
mb
ine
d R
atio

Copyrig
ht
Conte
nt
/ 2016
Aditya Birla Capital Limited
Unique & Differentiated Health First Model: Core offerings .. 1/2
48
Diversified product suite with health first offerings enabling market expansion
Comprehensive Product Range & Product InnovationProduct DifferentiatorsExpanding the Market
➢ Incentivized wellness
➢ Chronic Care Management
➢ Disease Risk Management
➢ Health ecosystem enabled Senior Citizen Plan
Younger & healthier customer(<35 years)
Current Industry Target(35-55 years)
Senior Citizen with lifestyle conditions(>55 years)
AB
HI’s effo
rt in exp
ansio
n
Existing market
➢ Indemnity/Fixed benefit, Top-up, 4-in-1 combo, Senior Citizen, Arogya Sanjeevani
Innovate to expand market
➢ Incentivized Wellness, Chronic Care, Global Health Cover, 1 Cr. Super Top-up
Digital
➢ 1-click contextual-byte size products
Contextual & Need based
➢ Corona Kavach, Corona Rakshak, Group CoVID, Disease & Partner specific

Copyrig
ht
Conte
nt
/ 2016
Aditya Birla Capital Limited
Health data based hyper-personalized engagement …2/2
491Attributable to Retail Indemnity customers Sample Micro Segments
✓ Health / Lifestyle coach
✓ Mental wellbeing
✓ 2nd opinion
✓ Doctor Network
✓ Online pharmacy & diagnostics
✓ Health chat-bot
✓ Nutrition
✓ Telemedicine
Very High Risk
High Risk
Medium Risk
Healthy
Critical condition
Hospitalization event
Chronic Condition
Health Data WellBeing Score
150+ health data points
Risk Stratification based hyper-personalized recommendation
Holistic health score
Dat
a So
urc
e:
35% 6%
Lower Claim ratio
20%
Higher retentionApp log-ins
Engagement Outcomes1
Disease Risk Management
➢ Profile & Policy Data
➢ Health / Wellness
➢ Claims / Servicing
Recommendations
Business outcomes
Low Risk✓ Healthcare at home
Health Ecosystem enabled through key partners for services like doctor on call, telemedicine, nutritionist, mental health helpline and others

Copyrig
ht
Conte
nt
/ 2016
Aditya Birla Capital Limited
Scaled-up and diversified digitally enabled distribution network
50
Div
ers
ific
atio
n
Diversified & scaled distribution and provider networkDiversified and scaled networkMulti-channel & Digitally enabled distribution
➢ Dedicated ABG focused channels showing good results
Banca % of retail GWPNon-metro GWP Active Bank Branches
Scal
e
➢ Agency:: Distribution network spanning 100+ branch locations with 34k+ agents | Leveraging ABC synergy for expanding agent base
➢ Bancassurance: 9 bank partners→ 14,000+ branches; Large banks contributing to 100%+ YoY in Banca GWP
Agency growth 70% YoY
Banca mix: 66% of retail (PY: 62%)
In ‘000
62% 66%
H1 FY20 H1 FY21
3.68.3
H1 FY20 H1 FY21
60% 63%
H1 FY20 H1 FY21
➢ Leveraging Digital partnerships: 38+ partners covering 2 Mn.+ lives
50+ byte-size and contextual products
H1 FY20 H1 FY21
Branch Locations 88 115
Agents 22,500+ 34,000+
Sales force 2,100+ 2,250+
Cities 1,250+ 2,300+
Hospitals 6,100+ 7,500+
➢ Rural & MFI* Partners: 35+ partners covering 4 Mn.+ lives
*MFI: Micro-Finance Institutions

Copyrig
ht
Conte
nt
/ 2016
Aditya Birla Capital Limited
Leveraging Digital, Data & Analytics in Health Insurance business
51*WA: WhatsApp
On-boarding / Selling
➢ Digital advisor onboarding portal: 100% onboarding
➢ Digital advisor training & engagement: 12k+ advisors trained digitally
➢ Increasing digital touchpoints across banks: 4-click journey live
Leveraging Digital assets and end-to-end digitally enabled journeys
Data enrichment & Analytics
➢ Customer data encompassing 360 degree view augmented through partnerships
➢ CLTV: Segmentation, Retention & Upsell
➢ Wellness: Analytics based journeys and engagement
➢ Analytics led savings through fraud detection engine for optimizing LR & persistency lift
Retention/ Renewals
➢ Omni-channel click-thru renewal journey including upsell
➢ Complete range of digital payment options
Engagement & Self-Service
➢ Multi-lingual AI Chat-bot & WhatsApp: 18+ services; WA* self-servicing 88% H1 FY21
➢ End-to-end digital claims journey | Cashless claims portal
Data & Analytics
92% 95% 98%
Q2 FY20 Q4 FY20 Q2 FY21
Digital Issuance
66% 67%
92%
Q2 FY20 Q4 FY20 Q2 FY21
Digital Renewal
Prospecting
➢ Sehat ki Nayi Aadat digital campaign: ActivLiving Blog (10 lac+ views)
➢ Rakho Pura Khayal 2.0 campaign (58 lac+ views)
➢ Personalized campaigns | Analytics led PASA campaigns
Business KPIs
Copyrig
ht
Conte
nt
/ 2016
Aditya Birla Capital Limited
Key Financials – Aditya Birla Health Insurance Limited
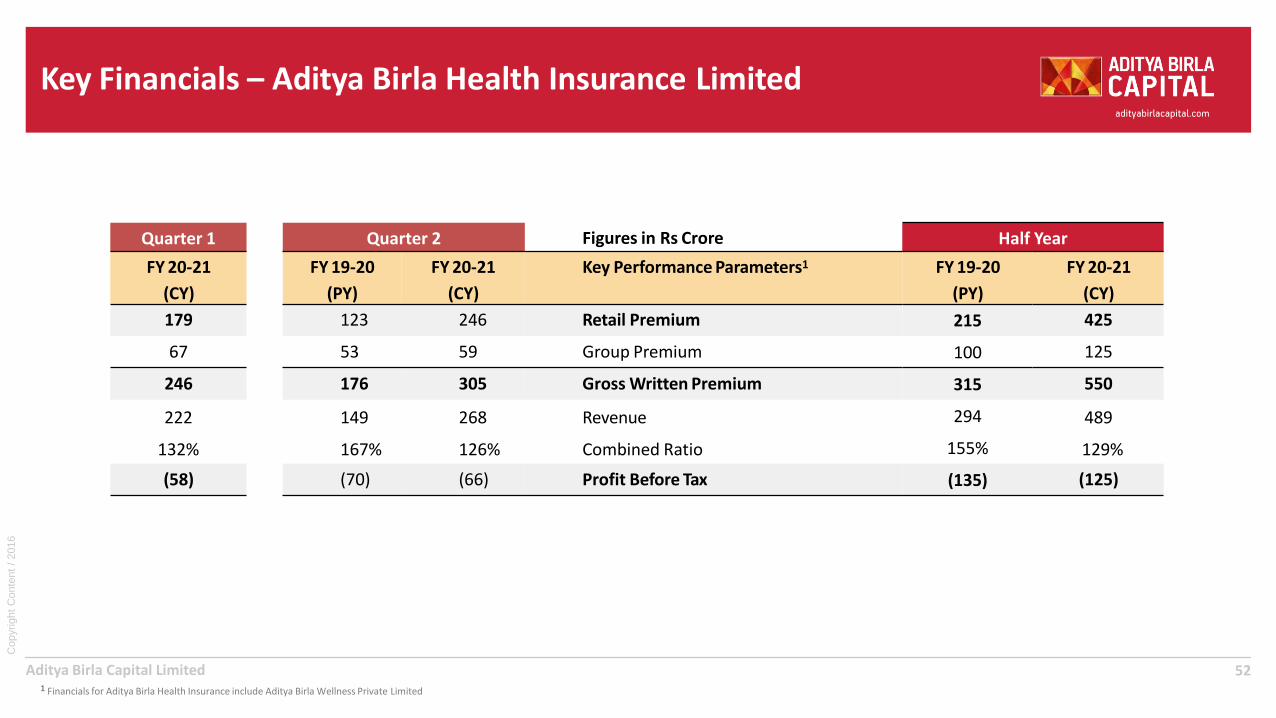
521 Financials for Aditya Birla Health Insurance include Aditya Birla Wellness Private Limited
Quarter 1 Quarter 2 Figures in Rs Crore Half Year
FY 20-21
(CY)
FY 19-20
(PY)
FY 20-21
(CY)
Key Performance Parameters1 FY 19-20
(PY)
FY 20-21
(CY)
179 123 246 Retail Premium 215 425
67 53 59 Group Premium 100 125
246 176 305 Gross Written Premium 315 550
222 149 268 Revenue 294 489
132% 167% 126% Combined Ratio 155% 129%
(58) (70) (66) Profit Before Tax (135) (125)

Other Performance Updates
Copyrig
ht
Conte
nt
/ 2016
Aditya Birla Capital Limited
Figures in Rs Crore
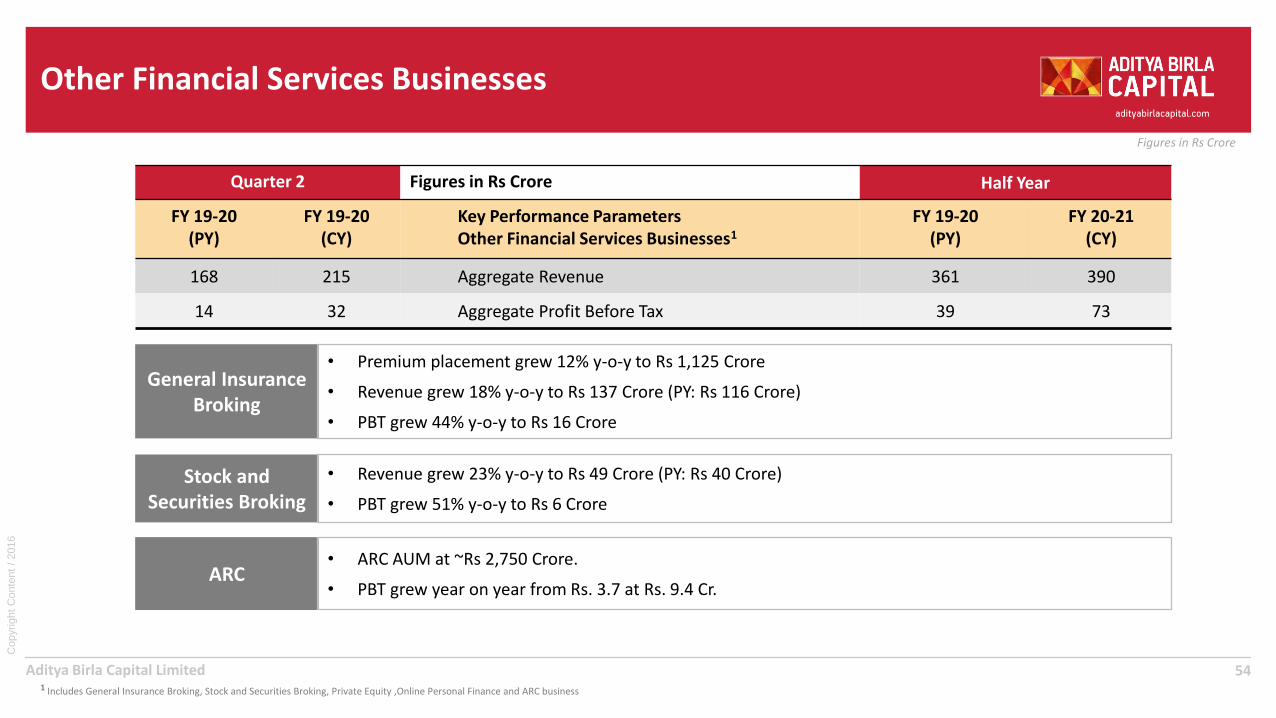
Other Financial Services Businesses
541 Includes General Insurance Broking, Stock and Securities Broking, Private Equity ,Online Personal Finance and ARC business
Quarter 2 Figures in Rs Crore Half Year
FY 19-20 (PY)
FY 19-20 (CY)
Key Performance ParametersOther Financial Services Businesses1
FY 19-20 (PY)
FY 20-21 (CY)
168 215 Aggregate Revenue 361 390
14 32 Aggregate Profit Before Tax 39 73
General Insurance Broking
• Premium placement grew 12% y-o-y to Rs 1,125 Crore
• Revenue grew 18% y-o-y to Rs 137 Crore (PY: Rs 116 Crore)
• PBT grew 44% y-o-y to Rs 16 Crore
Stock and Securities Broking
• Revenue grew 23% y-o-y to Rs 49 Crore (PY: Rs 40 Crore)
• PBT grew 51% y-o-y to Rs 6 Crore
ARC• ARC AUM at ~Rs 2,750 Crore.
• PBT grew year on year from Rs. 3.7 at Rs. 9.4 Cr.

Copyrig
ht
Conte
nt
/ 2016
Aditya Birla Capital Limited
Figures in Rs Crore
Ensuring employee wellbeing and nurturing talent
55
Learning
▪ Launched AI-enabled learning app encouraging ‘learning on-the-go’ and ‘peer-learning’.
▪ Set up digital technology centre for upskilling people and enhancing their capabilities
▪ 9+ Lac hours covering 84% employees of digital learning
Employee Engagement
Talent Development
Health and Safety
21,000 Employees
70% Millennials
26% women workforce
▪ Various initiatives like ABC annual health check up, Doctor on call, Desk Yoga, Online fitness sessions, Build your immunity etc., to keep the employee health and wellness as our key priority
▪ Launched several initiatives to keep employees and their families connected, engaged and stress free through various digital platforms during the lockdown
▪ Our talent development programmes are curated to develop leaders across all levels
▪ Over 3000 employees moved into new roles in the last 3 years
▪ 350+ employees from talent pool in middle management and above participated in development initiatives
▪ Identified Flu Prevention Managers across all regions to monitor and report on employee health
▪ Undertook regular communication around awareness and best practices with employees
▪ Implemented several learning and development initiatives during the lockdown to upskill employees
1 2 3 4

Copyrig
ht
Conte
nt
/ 2016
Aditya Birla Capital Limited
Figures in Rs Crore
4 focus areas of our CSR Mantra “Money for Good”
56
Healthcare
▪ 50,000+ mother have been the recipients of our comprehensive mother and child health care programmes
▪ Supported to revive underperforming 3 Govt. Primary Health Centres (PHC) and 10 Sub Centres benefited 1.2 lac+ patients in Rajasthan
▪ 5,000 senior citizens suffering from vision impairment screened at rural medical camps
EducationWomen
EmpowermentSports36 NGOs
Partners
37 Projects Implemented
Present in 13 states
2.25 Lac lives Impacted
▪ Project ‘Knowledge on Wheel’ Mumbai, provided mobile science labs to 52 Govt. schools, reaching 5K+ students
▪ Helped improve digital infrastructure and learning environment in 40 schools in UP, benefiting 20K+ students
▪ 1,014 students impacted through the “Childhood to Livelihood” Project
▪ Our 118 SHGs introduced 2,162 households into formalised banking.
▪ Trained 17K+ rural women in Karnataka in financial literacy, household budget planning, bank A/C opening etc.
▪ In MP, 3,204 small/ marginal women farmers have been benefitted through integrated land management & improved agriculture practices project
▪ Our partnership with GoSports Foundation to improve the performance of athletes has augmented the performance of 25 athletes at international level sporting events.
▪ These athletes have won 99 medals at national & international level.
▪ 3 athletes of this program have secured upcoming Olympic quota
1 2 3 4

Copyrig
ht
Conte
nt
/ 2016
Aditya Birla Capital Limited
Figures in Rs Crore
Consolidated Profit & Loss
57Aditya Birla Capital Limited
Quarter 1 Quarter 2 Figures in Rs Crore Half Year
FY 20-21 (CY)
FY 19-20 (PY)
FY 20-21 (CY)
Consolidated Profit & Loss FY 19-20 (PY)
FY 20-21 (CY)
4,028 3,952 4,589 Revenue 7,572 8,617
235 296 296 Profit Before Tax (before share of profit/(loss) of JVs 675 531
50 75 64 Add: Share of Profit/(loss) of associate and JVs 134 114
285 372 360 Profit Before Tax 809 644
98 129 107 Less: Provision for taxation 310 205
(11) (13) (12) Less: Minority Interest (27) (24)
198 256 264 Net Profit (after minority interest) 526 463
Aditya Birla Sun Life AMC Ltd and Aditya Birla Wellness Pvt Ltd consolidated based on equity accounting under Ind AS,

A financial services conglomerate meeting the
life time needs of its customers
CIN: L67120GJ2007PLC058890
Regd. Office: Indian Rayon Compound, Veraval – 362 266, Gujarat
Corporate Office: One Indiabulls Centre, Tower 1, Jupiter Mills Compound, 841,
Senapati Bapat Marg, Elphinstone Road, Mumbai – 400 013
Website: www.adityabirlacapital.com

Copyrig
ht
Conte
nt
/ 2016
Aditya Birla Capital Limited
Figures in Rs Crore
Disclaimer
59
The information contained in this presentation is provided by Aditya Birla Capital Limited (“ABCL or the Company”), formerly known as Aditya Birla Financial Services Limited, to you solely for your reference. Any reference hereinto "the Company" shall mean Aditya Birla Capital Limited, together with its subsidiaries / joint ventures/affiliates. This document is being given solely for your information and for your use and may not be retained by you andneither this presentation nor any part thereof shall be (i) used or relied upon by any other party or for any other purpose; (ii) copied, photocopied, duplicated or otherwise reproduced in any form or by any means; or (iii) re-circulated, redistributed, passed on, published in any media, website or otherwise disseminated, to any other person, in any form or manner, in part or as a whole, without the prior written consent of the Company. Thispresentation does not purport to be a complete description of the markets conditions or developments referred to in the material.
Although care has been taken to ensure that the information in this presentation is accurate, and that the opinions expressed are fair and reasonable, the information is subject to change without notice, its accuracy, fairness orcompleteness is not guaranteed and has not been independently verified and no express or implied warranty is made thereto. You must make your own assessment of the relevance, accuracy and adequacy of the informationcontained in this presentation and must make such independent investigation as you may consider necessary or appropriate for such purpose. Neither the Company nor any of its directors, officers, employees or affiliates nor anyother person assume any responsibility or liability for, the accuracy or completeness of, or any errors or omissions in, any information or opinions contained herein, and none of them accept any liability (in negligence, orotherwise) whatsoever for any loss howsoever arising from any use of this presentation or its contents or otherwise arising in connection therewith. Any unauthorised use, disclosure or public dissemination of informationcontained herein is prohibited. The distribution of this presentation in certain jurisdictions may be restricted by law. Accordingly, any persons in possession of the aforesaid should inform themselves about and observe suchrestrictions. Any failure to comply with these restrictions may constitute a violation of applicable securities laws.
The statements contained in this document speak only as at the date as of which they are made and it, should be understood that subsequent developments may affect the information contained herein. The Company expresslydisclaims any obligation or undertaking to supplement, amend or disseminate any updates or revisions to any statements contained herein to reflect any change in events, conditions or circumstances on which any suchstatements are based. By preparing this presentation, neither the Company nor its management undertakes any obligation to provide the recipient with access to any additional information or to update this presentation or anyadditional information or to correct any inaccuracies in any such information which may become apparent. This document is for informational purposes and private circulation only and does not constitute or form part of aprospectus, a statement in lieu of a prospectus, an offering circular, offering memorandum, an advertisement, and should not be construed as an offer to sell or issue or the solicitation of an offer or an offer document to buy oracquire or sell securities of the Company or any of its subsidiaries or affiliates under the Companies Act, 2013, the Securities and Exchange Board of India (Issue of Capital and Disclosure Requirements) Regulations, 2018, each asamended, or any applicable law in India or as an inducement to enter into investment activity. No part of this document should be considered as a recommendation that any investor should subscribe to or purchase securities ofthe Company or any of its subsidiaries or affiliates and should not form the basis of, or be relied on in connection with, any contract or commitment or investment decision whatsoever. This document is not financial, legal, tax,investment or other product advice.
The Company, its shareholders, representatives and advisors and their respective affiliates also reserves the right, without advance notice, to change the procedure or to terminate negotiations at any time prior to the entry into ofany binding contract for any potential transaction. This presentation contains statements of future expectations and other forward-looking statements which involve risks and uncertainties. These statements include descriptionsregarding the intent, belief or current expectations of the Company or its officers with respect to the consolidated results of operations and financial condition, and future events and plans of the Company. These statements canbe recognised by the use of words such as “expects,” “plans,” “will,” “estimates,” or words of similar meaning. Such forward-looking statements are not guarantees of future performance and involve risks and uncertainties andactual results, performances or events may differ from those in the forward-looking statements as a result of various factors, uncertainties and assumptions including but not limited to price fluctuations, actual demand, exchangerate fluctuations, competition, environmental risks, any change in legal, financial and regulatory frameworks, political risks and factors beyond the Company’s control. You are cautioned not to place undue reliance on theseforward looking statements, which are based on the current view of the management of the Company on future events. No assurance can be given that future events will occur, or that assumptions are correct. The Company doesnot assume any responsibility to amend, modify or revise any forward-looking statements, on the basis of any subsequent developments, information or events, or otherwise.