Embed Size (px)
Citation preview

FINANCIAL REPORT 30 NOVEMBER 20201ST HALF OF FISCAL YEAR 2020/2021

03 KEY PERFORMANCE INDICATORS
05 HELLA ON THE CAPITAL MARKET
07 INTERIM GROUP MANAGEMENT REPORT
07 Economic development
08 Industry development
09 Business development of the HELLA Group
15 Business development of the segments 21 Opportunity and risk report
21 Forecast report
23 CONDENSED INTERIM CONSOLIDATED FINANCIAL STATEMENTS 23 Consolidated income statement
24 Consolidated statement of comprehensive income 25 Consolidated statement of financial position 26 Consolidated statement of changes in equity 28 Consolidated cash flow statement
29 FURTHER INFORMATION
48 RESPONSIBILITY STATEMENT
CONTENTS

KEY PERFORMANCE INDICATORS
3 FINANCIAL REPORT FOR 1ST HALF OF FISCAL YEAR 2020/2021 KEY PERFORMANCE INDICATORS
* To ensure comparability of the results of operations between the fiscal year 2020/2021 and the prior year, the presentation of operating variables of both periods has been adjusted or restated. Additional information can be found in the condensed interim consolidated financial statements and the Further Notes section.
First half-year1 June to 30 November
2nd quarter1 September to 30 November
In € million 2020/2021 2019/2020 2020/2021 2019/2020
SalesChange compared to prior year
3,100-4%
3,239 -5%
1,7563%
1,711-2%
Adjusted earnings before interest and taxes (adjusted EBIT)Change compared to prior year
2696%
253-14%
21349%
142-12%
Earnings before interest and taxes (EBIT)Change compared to prior year
94-59%
230-57%
20975%
119-70%
Adjusted earnings before interest, taxes, depreciation and amortisation (adjusted EBITDA)Change compared to prior year
452-2%
462-3%
30824%
249-3%
Earnings before interest, taxes, depreciation and amortisation (EBITDA)Change compared to prior year
277-37%
439-39%
30535%
226-54%
Earnings for the periodChange compared to prior year
67-59%
162-63%
15481%
85-76%
Earnings per share (in €)Change compared to prior year
0.59-59%
1.45-64%
1.3881%
0.76-76%
Adjusted free cash flow from operating activitiesChange compared to prior year
-17-113%
12614%
224281%
5921%
Free cash flow from operating activitiesChange compared to prior year
-34-128%
121-18%
211288%
54-41%
Capital expendituresChange compared to prior year
2614%
2514%
1067%
998%
Research and development (R&D) expensesChange compared to prior year
297-10%
3305%
151-7%
1634%
First half-year1 June to 30 November
2nd quarter1 September to 30 November
2020/2021 2019/2020 2020/2021 2019/2020
EBIT margin 3.0% 7.0% 11.9% 6.8%Adjusted EBITDA margin 14.6% 14.3% 17.6% 14.6%EBITDA margin 8.9% 13.2% 17.4% 13.0%R&D expenses in relation to sales 9.6% 10.2% 8.6% 9.5%Capital expenditure in relation to sales 8.4% 7.7% 6.0% 5.8%
30 November 2020 31 May 2020
Net financial debt (in € million) 168 140Equity ratio 37.4% 37.0%Return on equity (last 12 months) -17.0% -20.5%Employees 35,754 36,311
First half-year1 June to 30 November
2nd quarter1 September to 30 November
2020/2021 2019/2020 2020/2021 2019/2020
Currency and portfolio-adjusted sales growth -2.5% -5.4% 4.7% -2.9%Currency and portfolio-adjusted sales (in € million) 3,158 3,239 1,791 1,711Adjusted EBIT margin 8.7% 7.8% 12.1% 8.3%

4 FINANCIAL REPORT FOR 1ST HALF OF FISCAL YEAR 2020/2021
Global production of passenger cars and light commercial vehicles falls 3.5% in the first half of fiscal year 2020/2021; decline is lower than anticipated at the beginning of the fiscal year
Currency and portfolio-adjusted consolidated sales decrease by 2.5% to € 3,158 million
Adjusted earnings before interest and taxes increase to € 269 million; adjusted EBIT margin improves to 8.7%
Positive reported EBIT comes to € 94 million taking account of one-off expenses for restructuring measures in Germany (€ 169 million); reported EBIT margin stands at 3.0%
Adjusted free cashflow from operating activities slightly negative (€ -17 million)
Sales in the Automotive segment fall by 4.3% to € 2,710 million
Aftermarket sales fall by 3.1% to € 241 million
Sales in the Special Applications segment hover at € 167 million, roughly the prior-year level
In the second quarter currency and portfolio-adjusted sales increase by 4.7% on account of the faster market recovery; adjusted EBIT improved to € 213 million; adjusted EBIT margin increases to 12.1%
Company outlook for current fiscal year raised

5 FINANCIAL REPORT FOR 1ST HALF OF FISCAL YEAR 2020/2021 HELLA ON THE CAPITAL MARKET
HELLA ON THE CAPITAL MARKET Catch-up effects, faster recovery of the global economy and successes in the development of vaccines have brought about a substantial capital market recovery
With a closing price of € 48.10, the HELLA share has roughly regained the level seen prior to the coronavirus pandemic
Development of capital markets
The capital markets performed very strongly over the first half of the HELLA fiscal year 2020/2021 (1 June to 30 November 2020). The MDAX index (hereinafter: "MDAX") increased by more than 15% over this period, while the shares of German automobile stocks, the DAXsector Automobile (hereinafter: "Prime Automo-tive") closed with a significant rise of around 40%. In the reporting period, the Prime Automotive in particular benefited from catch-up effects following the pandemic-related slumps in the spring of this calendar year, whereas MDAX shares were impacted to a significantly lesser extent by the consequences of the pandemic on account of its more diverse portfolio.
At the beginning of the first quarter, the passing of extensive economic stimulus measures, including subsidies for electro-mobility, and the expansive monetary policy by the European Central Bank (ECB) brought about significant price rises. After a subsequent, generally unstable development on the capital mar-
kets, the faster economic recovery, a perceptible upturn in the Chinese automotive market and successes in the development of a vaccine brought up the stock market towards the end of the quarter. The MDAX closed the quarter up around 8%, while the Prime Automotive ended the same period up nearly 16%.
The German stock market and the Prime Automotive in partic-ular performed very strongly again in the second quarter. While European capital markets were initially impacted by fears that the spread of the coronavirus pandemic might pick up speed again, positive effects came at the end of the quarter, however, from the prospects of success in the development of a vaccine. The Prime Automotive benefited in particular in this context. In addition, the outcome of the US presidential election in Novem-ber brought about rising stock prices. The MDAX closed the second quarter up around 7%, the Prime Automotive rose by just under 21%.
Initial stock market quotation 11 November 2014
Ticker symbol HLE
ISIN DE000A13SX22
SIN A13SX2
Share class No-par value ordinary bearer shares
Market segments Prime Standard (Frankfurt Stock Exchange) Regulated market (Luxembourg Stock Exchange)
Index MDAX
Nominal capital € 222,222,224
Number of shares issued 111,111,112 shares
Highest price in the first half-year € 49.60 per share
Lowest price in the first half-year € 35.00 per share
Average daily trading volume 134,385 shares
Average daily trading volume € 5.47 million
Closing price on 30 November 2020 € 48.10 per share
Market capitalization on 30 November 2020 € 5.34 billion
All trading information relates to XETRA.

6 FINANCIAL REPORT FOR 1ST HALF OF FISCAL YEAR 2020/2021 HELLA ON THE CAPITAL MARKET
HELLA SHARE Price performance during the reporting period compared to selected indices (indexed on 1 June 2020)
Liquidity of the HELLA share
The average daily XETRA trading volume in the reporting period was around 134,000, the equivalent of roughly € 5.5 million (prior year: around 181,000, approx. € 7.4 million). Alongside the lower average price for the share, the reduction in the share's liquidity is also attributable to a lower level of liquidity throughout the capital market following the very high volumes in the first half of the calendar year. With the number of issued shares remaining unchanged, the market capitalisation at the six-month reporting date came to € 5.34 billion (prior year: € 5.44 billion).
HELLA share with substantial recovery
The HELLA share closed the first half of the fiscal year at € 48.10, representing a significant gain of around 37%. This roughly corresponds to the price prevailing before the corona-virus pandemic and a development generally in line with the Prime Automotive benchmark index.
In the first quarter of the fiscal year, the HELLA share saw price gains of around 17%, which was essentially attributable to the positive economic news. This means that the HELLA share saw slightly better developments in the first quarter than the Prime Automotive index.
In the second quarter, the HELLA share continued its recovery with a further rise of 17%. A few days prior to the end of the quarter, the share also reached its previous all-year high of € 49.60. Over this period, positive analyst recommendations in the context of the Company's long-term strategic alignment, among other factors, allowed the share to clearly benefit from company and industry-specific news.
HELLAMDAX Prime Automotive
* 60% of the shares are subject to a pool agreement up until at least 2024
** According to the Deutsche Börse definition
SHAR
EHOL
DER STRUCTURE
60%Shareholder family (pool-bound)* 40%
Free float **
in %
60
70
120
110
80
90
29.05.2020 01.07.2020 01.08.2020 01.09.2020 01.10.2020 01.11.2020
130
140
150
160
170
100
30.11.2020

Economic development
According to IMF estimates, the global economy contracts by 4.4% in calendar year 2020
Substantial decline in gross domestic product in Germany, Europe and the USA; growth in China
Gradual recovery in the global economy in the second half of the calendar year
Over the first six months of the HELLA fiscal year 2020/2021 (1 June to 30 November 2020), the global economy remained overshadowed by the negative impact of the Covid-19 pandem-ic. In its October report, the International Monetary Fund (IMF) consequently assumes a decline in global gross domestic product (GDP) of 4.4% with the global economy already having experienced growth in the prior year that was slower than in any year since the beginning of the financial crisis in 2008.
The IMF's October report does, however, constitute a slight upward correction to its June forecast. At that point in time, the assumption made involved a contraction in the global economy of 4.9%. The adjustment became necessary specifically be-cause of improved economic developments in China as well as a faster economic recovery in Europe and the US following the end of the lockdowns in the second half of the calendar year that was supported by government aid programmes. However, the IMF's current assessment does not yet fully reflect the eco-nomic effect of the countermeasures introduced in some Euro-pean countries in the autumn with a view to once again con-taining the coronavirus pandemic. Consequently, it is likely that the recovery in the global economy weakened towards the end of the fiscal half-year or the calendar year.
In light of this, western economies initially underwent a sub-stantial decline, in particular in the second quarter of the calen-dar year 2020, and saw a partial recovery again in the third
INTERIM GROUP MANAGEMENT REPORT
7 FINANCIAL REPORT FOR 1ST HALF OF FISCAL YEAR 2020/2021 INTERIM GROUP MANAGEMENT REPORT
quarter. According to the Statistical Office of the European Union (Eurostat), eurozone GDP first experienced a significant drop in the second quarter of 14.7% compared to the same quarter of the prior year, whereas the decline in the third quar-ter stood at 4.3%. According to Destatis, Germany's Federal Statistical Office, German gross domestic product underwent a price-adjusted and calendar-adjusted slump in the second quarter of 11.7% in comparison to the same period of the prior year; in the third quarter it fell by 4.0%. According to the Bureau of Economic Analysis, US GDP initially contracted in the second quarter by 31.4% on an annualised basis until the first signs of an economic recovery became apparent from the second half of May onwards. The annualised GDP correspondingly im-proved by 33.1% in the third quarter.
The report published by the IMF states that China was the only economy that was not in recession in the calendar year 2020. Already in the second quarter of the calendar year 2020, the Chinese economy grew by 3.2% in comparison to the same period of the prior year, according to the Beijing Bureau of Sta-tistics; with an increase of 4.9%, economic growth in China continued to accelerate over the third quarter. In 2020, also the Chinese economy nevertheless fell behind the growth rates seen in prior years (2019: 6.1%).

Industry development
Negative economic environment impacts industry devel-opment in the first half of fiscal year 2020/2021
Global production of passenger cars and light commercial vehicles drops by 3.5% in the first half of the fiscal year according to IHS statistics; the decline in light vehicle production is smaller than anticipated at the beginning of the fiscal year (IHS outlook as at July 2020: -12.4%)
Strong growth in China; negative industry development in Europe as well as in North, Central and South America
In the second quarter of the fiscal year, global light vehi-cle production increased by 2.1%, after a decline of 9.3% had been forecast in July 2020
The macroeconomic environment being in decline in the first half of the HELLA fiscal year 2020/2021 also had a negative impact on the development of the global automotive indus-try. Consequently, the global production of passenger cars and light commercial vehicles fell by 3.5% to 42.4 million units according to statistics published by market research institution IHS in December (prior year: 44.0 million units). This means, however, that the decline in light vehicle produc-tion turned out to be significantly smaller than anticipated at the beginning of the fiscal year. In July 2020, IHS still as-sumed that the number of vehicles produced would fall by 12.4% in the half-year period. Supported by a faster econom-ic recovery, the production figures saw a significantly better development, particularly in the second quarter of the fiscal year, and rose by 2.1%, after a decline of 9.3% had been fore-cast by IHS in July.
In this context, the number of new passenger cars and light commercial vehicles manufactured in Europe excluding Ger-many over the half-year period fell by 7.3% to 7.3 million units (prior year: 7.9 million units); in the German market seen sep-arately, this figure fell by 8.6% to 2.2 million units (prior year: 2.4 million units). In the North, Central and South America re-gion, the production figures decreased by 7.5% to 9.1 million units (prior year: 9.9 million units) and in US market seen sep-arately this figure fell by 1.8% to 5.2 million units (prior year: 5.3 million units). With production figures of 23.8 million units, the market volume in the Asia/Pacific/Rest of World region stood at the prior-year level in the half-year period (prior year: 23.8 million units). The only significant market worldwide to see positive developments over the half-year period was China; the production figures increased substantially by 10.8% to 13.5 mil-lion units (prior year: 12.2 million units).
8 FINANCIAL REPORT FOR 1ST HALF OF FISCAL YEAR 2020/2021 INTERIM GROUP MANAGEMENT REPORT
Production of passenger cars and light commercial vehicles during the first half of fiscal year 2020/2021 and 2019/2020
in thousands of units First half-year 2020/2021
+/- First half-year 2019/2020
Europe excluding Germany 7,327 -7.3% 7,904
Germany 2,165 -8.6% 2,368
North, Central and South America 9,142 -7.5% 9,880
USA 5,175 -1.8% 5,270
Asia / Pacific / RoW 23,797 0.0% 23,808
China 13,507 +10.8% 12,186
Worldwide 42,431 -3.5% 43,959
Source: IHS Light Vehicle Production Forecast, December 2020

Currency and portfolio-adjusted consolidated sales de-creased over the first half of the fiscal year by 2.5% to € 3,158 million; adjusted for portfolio effects, sales fall by 4.3%, reported sales by 6.4%
Adjusted earnings before interest and taxes increase to € 269 million; adjusted EBIT margin rises to 8.7%
Profitability improves due to higher production volumes due to good industry development and cost management
Positive reported EBIT comes to € 94 million taking account of one-off expenses for restructuring measures in Germany (€ 169 million); reported EBIT margin stands at 3.0%
Adjusted free cashflow from operating activities slightly negative (€ -17 million)
In the second quarter of the fiscal year, currency and portfolio-adjusted sales increase by 4.7% on account of the faster market recovery; adjusted EBIT improved to € 213 million; adjusted EBIT margin increases to 12.1%
Results of operations
To ensure comparability of the results of operations between the fiscal year 2020/2021 and the prior-year period, the oper-ating variables of both periods have been adjusted or restated for the following effects:
In July 2020, HELLA introduced a long-term programme for the sustained improvement of competitiveness. Most of the corresponding one-off expenses required for these complete measures in Germany that include, among other things, a reduction in the number of administrative and de-velopment positions at the Lippstadt location by 900 before the end of the calendar year 2023 will be incurred in this fis-cal year. The expenses associated with this programme are presented in an adjusted form to improve comparability with the prior-year period in the results of operations below and are reported in the interim consolidated financial state-ments under administrative expenses and the Group's re-search and development expenses without reference to any specific segment.
Effective as of 31 December 2019, HELLA transferred the 50% share in the Behr Hella Service joint venture to its part-ner MAHLE. Up to this point in time, the sales generated and expenses incurred in the thermal management business had been part of the Aftermarket segment and of the Group. Con-sequently, the operating variables for fiscal year 2019/2020 have been adjusted for the relevant period – 1 June to 31 De-
cember 2019 – to take account of the sales and expenses of Behr Hella Service. Further details can be found in the Fur-ther Notes (chapter 9) of this financial report.
At the beginning of the fiscal year 2020/2021, HELLA reclas-sified Spanish production company MAESA by moving it into the Automotive reporting segment. Prior to that, the company (whose products include rear combination lamps and fog lamps for European original equipment manufacturers) had been part of the Special Applications segment. The income statements for the Automotive and Special Applications seg-ments have been adjusted accordingly for the prior year. This reclassification does not have any effect on the Group's re-sults of operations. Further details can be found in the Further Notes (chapter 9) of this financial report.
This adjusted consolidated income statement is shown in the following table. The reported operating variables can be found in the condensed interim consolidated financial state-ments. No adjustment has been made for the sale of the relay business in China effective as of 31 December 2019 due to the low value of these business activities. In the first half of the fiscal year 2019/2020, this business had generated sales of € 17 million.
During the first half of the fiscal year 2020/2021 (1 June to 30 November 2020), currency and portfolio-adjusted sales for the
9 FINANCIAL REPORT FOR 1ST HALF OF FISCAL YEAR 2020/2021 INTERIM GROUP MANAGEMENT REPORT
BUSINESS DEVELOPMENT OF THE HELLA GROUP

HELLA Group decreased in comparison to the prior year by 2.5% to € 3,158 million (prior year: € 3,239 million). Within this context, currency exchange rate effects had a negative impact on consolidated sales (1.8 percentage points; € 58 million); in addition, adjustments were made in respect of the sales gen-erated by Behr Hella Service in the prior year (2.1 percentage points; € 74 million). After taking account of these currency exchange rate and portfolio effects, reported consolidated sales fell by 6.4% to € 3,100 million (prior year: € 3,313 million).
Despite a still clearly negative industry environment initially having led to a drop in sales in the first quarter, HELLA's business development benefited from a faster than expected market recovery in the second quarter. Consequently, in the second quarter the sales of the HELLA Group adjusted for currency and portfolio effects increased by 4.7% to € 1,791 mil-lion (prior year: € 1,711 million) and, as reported, by 0.7% to € 1,756 million (prior year: € 1,743 million).
In terms of sales, all regions underwent negative developments over the reporting period. For instance, sales in Europe exclud-ing Germany declined over the first half of the year by 1.9% to € 900 million (prior year: € 917 million) and in Germany by 6.5% to € 978 million (prior year: € 1,046 million). In North, Central and South America, sales stood at € 680 million, a drop of 5.4% (prior year: € 719 million); in Asia/Pacific/Rest of World sales amounted to € 542 million, a fall of 2.6% (prior year: € 557 mil-lion). In the second quarter, the market recovery brought about a rise in sales of 5.3% in the Europe excluding Germany region, of 2.7% in Germany, and of 1.2% in Asia/Pacific/Rest of World. In North, Central and South America, sales in the second quar-ter seen separately remained at the prior-year level.
In the first half of the fiscal year, adjusted earnings before in-terest and taxes (adjusted EBIT) increased to € 269 million (prior year: € 253 million). The adjusted EBIT margin thus improved to 8.7% (prior year: 7.8%). The ongoing cost man-
10 FINANCIAL REPORT FOR 1ST HALF OF FISCAL YEAR 2020/2021 INTERIM GROUP MANAGEMENT REPORT
Reported sales of the HELLA Group for the first six months (in € million) and currency and portfolio-adjusted change compared to prior year (in %)
2018/2019 3,550 (+7.7%)
2019/2020 3,313 (-5.4%)
3,100 (-2.5%)2020/2021
Consolidated income statement First half-year1 June to 30 November
2nd quarter1 September to 30 November
in € million 2020/2021 +/- 2019/2020 2020/2021 +/- 2019/2020
Sales 3,100 -4.3% 3,239 1,756 +2.6% 1,711
Cost of sales -2,319 -2,395 -1,293 -1,269
Gross profit 781 -7.4% 844 463 +4.8% 441
Ratio of gross profit to sales 25.2% 26.1% 26.3% 25.8%
Research and development expenses -297 -330 -151 -163
Distribution expenses -156 -181 -83 -95
Administrative expenses -112 -116 -64 -62
Other income and expenses 34 11 31 3
Earnings from investments accounted for using the equity method 18 25 17 18
Other income from investments 0 0 0 0
Adjusted earnings before interest and taxes (adjusted EBIT) 269 +6.2% 253 213 +49.5% 142
Ratio of adjusted EBIT to sales 8.7% 7.8% 12.1% 8.3%
To ensure comparability of the results of operations between the fiscal year 2020/2021 and the prior year, the presentation of operating variables has been adjusted or restated. The reported figures can be found in the condensed interim consolidated financial statements; for additional information, please also refer to the Further Notes section contained in this financial report.

11 FINANCIAL REPORT FOR 1ST HALF OF FISCAL YEAR 2020/2021 INTERIM GROUP MANAGEMENT REPORT
agement measures were able to compensate for a lower gross profit margin in earnings before interest and taxes. In the second quarter the continuing cost management ap-proach and the faster market recovery in conjunction with the higher level of consolidated sales brought about an increase in earnings before interest and taxes to € 213 million (prior year: € 142 million). This means there was, in the second quarter, a substantial rise in the adjusted EBIT margin of 12.1% (prior year: 8.3%).
In the first six months, earnings before interest and taxes were adjusted for expenses associated with restructuring measures totalling € 175 million. These included, in particular, some one-off expenses that were incurred in Germany as part of the programme aimed at increasing competitiveness in the long term (€ 169 million). Taking account of these restructur-ing measures, the reported earnings before interest and taxes (EBIT) stood at € 94 million in the first half of the year (prior year: € 230 million); this corresponds to a reported EBIT mar-gin of 3.0% (prior year: 7.0%). Despite one-off expenses being incurred in Germany in the first quarter that lead to earnings before interest and taxes still being negative in that period, the half-year period seen as a whole closed with positive earn-ings before interest and taxes. The key factor behind this de-velopment is the substantial increase in profitability over the second quarter. In this context, the reported EBIT increased to € 209 million (prior year: € 119 million), the reported EBIT margin increased to 11.9% (prior year: 6.8%).
In the half-year period, the gross profit declined overall, falling to € 781 million (prior year: € 844 million). Accordingly, the gross profit margin decreased to 25.2% (prior year: 26.1%). This was due to the lower capacity utilisation as a consequence of the production volumes still at a reduced level over all. The gross profit improved to € 463 million in the second quarter (prior year: € 441 million) on account of business activities pick-ing up again. This corresponds to a gross profit margin of 26.3% (prior year: 25.8%).
Research and development expenses decreased to € 297 mil-lion (prior year: € 330 million) in the first six months of the current fiscal year; the R&D ratio (R&D expenses as a percent-age of sales) consequently stands at 9.6% (prior year: 10.2%). In light of the overall decline in the market environment, re-search and development activities over the reporting period were targeted in particular at serial development projects and production ramp-up activities. This cost management measure initially continued into the second quarter; further research and development activities resumed only towards the end of the quarter. Consequently, research and development expenses decreased in the second quarter to € 151 million (prior year: € 163 million). In relation to the higher figure for consolidated sales adjusted for portfolio effects, the R&D ratio fell to 8.6% (prior year: 9.5%).
Expenses for distribution and administration and the balance of other income and expenses decreased to € 234 million in the
Adjusted earnings before interest and taxes (adjusted EBIT; in € millions and as a % of portfolio-adjusted sales) for the first six months
2018/2019 296 (8.7%)
2019/2020 253 (7.8%)
269 (8.7%)2020/2021
Regional market coverage by customer
First half-year 2020/2021 First half-year 2019/2020
Absolute (in € million)
Relative (in %)
Absolute (in € million)
Relative (in %)
Europe excluding Germany 900 29% 917 28%
Germany 978 32% 1,046 32%
North, Central and South America 680 22% 719 22%
Asia / Pacific / RoW 542 17% 557 17%
Portfolio-adjusted consolidated sales 3,100 100% 3,239 100%

12 FINANCIAL REPORT FOR 1ST HALF OF FISCAL YEAR 2020/2021 INTERIM GROUP MANAGEMENT REPORT
reporting period (prior year: € 285 million) as a result of lever-aging cost savings potential. Consequently, when measured as a percentage of portfolio-adjusted sales, the ratio of these in-come and expense items was 7.5% (prior year: 8.8%). In the second quarter, there was a fall in these expenses, seen as a total, to € 116 million (prior year: € 154 million); the correspond-ing ratio consequently decreases to 6.6% (prior year: 9.0%). In addition to the ongoing, stringent cost control programme, this development essentially resulted from the reversal of an im-pairment recognized on a joint venture due to an improved business outlook totalling € 19 million.
At € 18 million, the joint venture's contribution to earnings in the half-year period was down on the prior-year level (prior year: € 25 million); this corresponds to a share in the Group's adjust-ed EBIT of 6.8% (prior year: 10.0%). The first quarter in particu-lar saw the negative industry environment having a negative impact on the business development of the joint venture. In the second quarter, the joint venture's effective EBIT stood at € 17 million, virtually at the prior-year level (prior year: € 18 mil-lion). The contribution to adjusted EBIT therefore comes to 7.9% (prior year: 12.5%).
The net financial result for the first half of the year stood at € -6 million (prior year: € -13 million) and at € -6 million for the second quarter (prior year: € -5 million).
Expenses relating to income taxes amount to € 21 million in the half-year period (prior year: € 55 million) and to € 49 million in the second quarter (prior year: € 29 million).
HELLA consequently closed the first half of the fiscal year 2020/2021 with earnings for the period totalling € 67 million (prior year: € 162 million) and the second quarter with earnings of € 154 million (prior year: € 85 million). Earnings per share consequently stood at € 0.59 in the first six months (prior year: € 1.45) and at € 1.38 in the second quarter (prior year: € 0.76).
Financial status
In the first six months of fiscal year 2020/2021, net cashflow from operating activities decreased by € 145 million in compar-ison to the same period of the prior year to € 227 million (prior year: € 372 million). This development is attributable to the lower earnings before income taxes (EBT) and a higher level of working capital as a consequence of all plants recommencing operations at the end of the production shutdowns in connec-tion with the global coronavirus pandemic. In the second quar-ter, net cashflow from operating activities rose by € 163 million to € 317 million (prior year: € 153 million), mainly due to a sig-
nificant increase in earnings and a lower level of working capi-tal that was positively impacted by the higher level of liabilities.
Cash investing activities excluding payments or cash receipts for the acquisition or sale of company shares or capital increas-es/repayments and securities amounted to € 261 million (prior year: € 251 million) in the half-year period and € 106 million (prior year: € 99 million) in the second quarter. These mainly included capital expenditures towards the long-term expansion of the worldwide development, administration and production network. HELLA also invested considerable sums in prod-uct-specific capital equipment and in booked SOP preparation projects. Capital expenditure as a percentage of the lower sales increased to 8.4% in the half-year (prior year: 7.7%) and 6.0% in the second quarter (prior year: 5.8%).
As part of the active management of the liquidity available to the Group, € 24 million was gained from securities in the re-porting period (prior year: outflow of €158 million) and € 136 million from securities in the second quarter (prior year: inflow of € 16 million). For liquidity management purposes, capital is usually invested in short-term securities or securi-ties with a liquid market so the funds can be made available for potential operating requirements at short notice.
In the first half year of fiscal year 2020/2021, adjusted free cashflow from operating activities decreased to € -17 million (prior year: € 126 million). In the second quarter, adjusted free cashflow from operating activities stood at € 224 million (prior year: € 59 million).
In the reporting period, the free cashflow from operating activ-ities has been adjusted for payments in connection with re-structuring measures and for portfolio adjustments for the dividend attributable to the period within the scope of the sale of the Behr Hella Service joint venture (€ 17 million) (prior year: € 5 million for payments for restructuring measures and port-folio adjustments in the context of the respective sales trans-actions relating to the Behr Hella Service and HSL Electronics Corporation joint ventures).
Correspondingly, the reported free cashflow from operating activities decreased to € -34 million in the half-year period (prior year: € 121 million) after taking account of these special effects but did, however, increase in the second quarter to € 211 million (prior year: € 54 million).
The liquidity portfolio consisting of cash and cash equivalents decreased in comparison to the end of the previous fiscal year 2019/2020 by € 400 million to € 802 million (31 May 2020: € 1,203 million). This was mainly due to the partial repayment of the syndicated loan amounting to € 350 million. Including
current financial assets, essentially comprising securities of € 435 million (31 May 2020: € 446 million), the available funds decreased to € 1,238 million (31 May 2020: € 1,648 million). On this basis, the Management Board is of the opinion that HELLA is able to satisfy its payment obligations.
Financial position
Compared to the balance sheet date in the previous fiscal year 2019/2020, total assets increased by € 21 million to € 5,714 mil-lion (31 May 2020: € 5,693 million). The equity ratio stood at 37.4% and was thus above the level on the balance sheet date of 31 May 2020 (37.0%). The equity ratio relative to total assets adjusted for liquidity comes to 47.8% (31 May 2020: 52.1%).
Current and non-current financial liabilities decreased by € 383 million to € 1,405 million (31 May 2020: € 1,788 million). Net financial debt as the balance of cash and current financial assets as well as current and non-current financial liabilities increased by a total of € 28 million to € 168 million (31 May 2020: € 140 million).
On 11 June 2020, Moody’s reaffirmed HELLA’s rating as Baa1 with a negative outlook. In March of this year, Moody’s an-nounced that it would be reviewing the corporate rating of HELLA and of 13 other European automotive suppliers in light of the wide range of market challenges to determine whether they should be downgraded.
Human Resources
At the six-month reporting date of 30 November 2020, HELLA had 35,754 permanent employees worldwide (prior year: 37,847). This corresponds to a decrease of 5.5% that was effect-ed in light of lower market volumes and related to all fields of activity and regions. Accordingly, the number of permanent employees in Europe excluding Germany fell by 1.5% to a head-count of 13,991 (prior year: headcount of 14,211) and in Germa-ny by 5.3% to a headcount of 9,213 (prior year: headcount of
9,731). In North, Central and South America, the headcount fell by 11.3% to 6,966 employees (prior year: 7,857 employees); in Asia/Pacific/Rest of World the headcount decreased by 7.7% to 5,584 employees (prior year: 6,048 employees).
Further events in the second quarter
BUSINESS WITH FRONT CAMERA SOFTWARE
HELLA announced at the end of September that it intended to sell the business with front camera software and the asso-ciated activities in the field of testing and validation to Car.Software Org, a wholly owned subsidiary of Volkswagen AG. A corresponding agreement has been signed by both compa-nies. In the event of a successful closing, the transaction will bring about income of approximately € 100 million before taxes . The business activities to be divested are allocated to HELLA Aglaia Mobile Vision GmbH, a wholly owned HELLA subsidiary with its registered office in Berlin. The transaction is still subject to approval by the responsible antitrust au-thorities and is expected to be closed in the first quarter of the calendar year 2021. The decision to exit the business with front camera software was made on the basis of stringent portfolio management. The disposal does not extend to the other business activities of HELLA Aglaia in the fields of en-ergy management, lighting control systems and people sensing.
GLOBAL SOFTWARE HOUSE
With a newly formed Global Software House, HELLA is con-tinuing to expand its global software expertise. The Global Software House is allocated to the specialist software sub-sidiary HELLA Aglaia. HELLA aims for the formation of the Global Software House to be the first step towards reducing the degree of complexity associated with software develop-ment. For instance, the new organisation unit is intended to harmonise development activities in the field of software throughout the Group and to define uniform cross-divisional process standards and methods. In a second step, the plans include advancing the Group's entry into new software-based business models by offering software as a standalone prod-uct – on a pay-per-use basis as one example.
ANNUAL GENERAL MEETING 2020
At this year's annual general meeting, which was held for the first time as a purely virtual annual general meeting, the shareholders of HELLA GmbH & Co. KGaA approved by vast majority all agenda items put to the vote. Among other
13 FINANCIAL REPORT FOR 1ST HALF OF FISCAL YEAR 2020/2021 INTERIM GROUP MANAGEMENT REPORT
Permanent employees in the HELLA Group (at 30 November)
2018 39,498 (-0.1%)
2019 37,847 (-4.2%)
35,754 (-5.5%)2020

things, they passed by 99 percent of the votes cast a resolution to suspend the dividend payment for the past fiscal year 2019/2020. Similarly, a resolution formally approving the ac-tions of the Management Board, the Shareholder Committee and the Supervisory Board was also passed by a vast majority. On account of the coronavirus pandemic, the annual general meeting was held as a virtual event without the shareholders being physically present. Some 500 shareholders and guests followed the annual general meeting online; all in all 86 per-cent of the voting capital with voting rights was represented.
DOUBLING OF PRODUCTION CAPACITIES IN LITHUANIA
HELLA continues to expand its electronics plant in Lithua-nia. The plant located in Kaunas Free Economic Zone start-ed production of various electronic components in August 2018. Currently, sensors, actuators and lighting electronic components are being manufactured at the site with a staff of 180 employees. In light of the ongoing rise in demand, the Lithuania site is to be continually extended over the next few years. HELLA is consequently investing in the long-term expansion of production capacity of an amount in the middling double-digit € millions; in this context, the plans are for headcount to rise to as many as 430 employ-ees. The first stage will initially involve doubling the plant's building footprint to a total of 22,000 square metres. The series production of further electronic components (from the field of energy management, for example) is scheduled for summer 2021.
CHANGE IN MEMBERSHIP OF THE MANAGEMENT BOARD
Effective as of 1 October 2020, Dr. Lea Corzilius (31) took over as Deputy Managing Director of the HR corporate function and at the same became a member of the HELLA Manage-ment Board in this role. Lea Corzilius has been working for
HELLA since 2017. As a member of the Executive Board for the Lighting business division, she was most recently re-sponsible for the global HR management of that business di-vision and the global HR analytics activities. Prior to her join-ing HELLA, she spent six years working at McKinsey busi-ness consultants; she completed her PhD in economics.
GROWTH MARKET FOR TWO AND THREE WHEELERS
Like no other in the world, the Indian mobility market is dominated by two and three wheelers. They make up more than 80 percent of all vehicles in India. Electric rickshaws have seen a strong upturn, especially in recent years. Esti-mates put their numbers at more than two million already and this figure is expected to continue to rise. With a view to serving the growth market for two and three wheelers in an even more targeted manner, lighting and electronics spe-cialist HELLA formed "HELLA eMobionics" in India as a new company in November 2020. In a first step, the newly formed subsidiary will make use of HELLA's existing pro-duction facilities in that country. HELLA has been operating in the market for two and three wheelers since 2017 al-ready. Its products primarily centre around Blue-tooth-based control units, motors, 48 volt motor controllers and voltage converters.
SUPPLY CHAIN
HELLA has acquired FWB Kunststofftechnik GmbH in Pirma-sens. FWB has been supplying HELLA with sophisticated plastic components for many years. FWB currently has around 180 employees and generates annual sales of ap-proximately € 20 million via its business activities in the areas of injection moulds, automation, plastic parts and assembly. Previously HELLA had already held a stake of roughly 25% in FWB. Through the complete acquisition, HELLA has safe-guarded its own supply chain in the long term and is further developing FWB as a stand-alone company.
14 FINANCIAL REPORT FOR 1ST HALF OF FISCAL YEAR 2020/2021 INTERIM GROUP MANAGEMENT REPORT

Business development of the segmentsAutomotive
Sales in the Automotive segment fall by 4.3% to € 2,710 million
Positive business development particularly in the second quarter due to faster market recovery
Earnings before interest and taxes increase to € 218 million; EBIT margin stands at 8.1%
Stringent cost management compensates for lower gross profit margin as a consequence of lower production volumes
In the second quarter, sales rose to € 1,540 million as a consequence of the market recovery; EBIT margin improves to 11.5%
During the first half of fiscal year 2020/2021, sales in the Auto-motive segment dropped by 4.3% to € 2,710 million (prior year: € 2,832 million). This means that, in terms of the reporting pe-riod seen as a whole, the segment's business development was still impacted by the overall decline in the industry environ-ment and the associated lower production volumes. In the second quarter, however, the Automotive segment benefited from the faster market recovery with the segment sales rising by 3.1% to € 1,540 million (prior year: € 1,493 million).
The Automotive segment's earnings before interest and taxes (EBIT) increased to € 218 million in the reporting period (prior year: € 211 million). The EBIT margin is therefore 8.1% (prior
year: 7.4%). While the gross profit margin in the Automotive segment was still in decline in the half-year period due to the lower level of capacity utilisation. This development was, how-ever, compensated for by savings in the field of distribution and administrative expenses. Particularly in the second quarter, the positive industry development, strict cost management and the reversal of an impairment of a joint venture due to an improved business outlook brought about a substantial improvement in profitability. For instance, earnings before interest and taxes increased to € 177 million in this period (prior year: € 118 mil-lion), meaning that the EBIT margin rose substantially to 11.5% (prior year: 7.9%).
15 FINANCIAL REPORT FOR 1ST HALF OF FISCAL YEAR 2020/2021 INTERIM GROUP MANAGEMENT REPORT

16 FINANCIAL REPORT FOR 1ST HALF OF FISCAL YEAR 2020/2021 INTERIM GROUP MANAGEMENT REPORT
Income statement for the Automotive segment
First half-year1 June to 30 November
2nd quarter1 September to 30 November
in € million 2020/2021 +/- 2019/2020 2020/2021 +/- 2019/2020
Sales with third-party entities 2,682 2,809 1,524 1,482
Intersegment sales 28 22 16 11
Segment sales 2,710 -4.3% 2,832 1,540 +3.1% 1,493
Cost of sales -2,103 -2,165 -1,176 -1,145
Gross profit 607 -9.0% 667 364 +4.4% 348
Ratio of gross profit to sales 22.4% 23.5% 23.6% 23.3%
Research and development expenses -279 -313 -141 -154
Distribution expenses -67 -85 -37 -45
Administrative expenses -89 -97 -52 -52
Other income and expenses 29 14 26 4Earnings from investments accounted for using the equity method 18 25 17 18
Other income from investments 0 0 0 0
Earnings before interest and taxes (EBIT) 218 +3.6% 211 177 +49.5% 118Earnings before interest and taxes in relation to segment sales (EBIT margin) 8.1% 7.4% 11.5% 7.9%

Aftermarket
Aftermarket sales fall by 3.1% to € 241 million Workshop business sees positive developments; lower sales caused by weaker spare parts business
Earnings before interest and taxes increase to € 29 million; EBIT margin improves to 11.9%
Profitability strengthened mainly as a result of higher gross profit margins as a consequence of product mix effects and cost management
In the second quarter, segment sales stand at the prior-year level (€ 132 million); EBIT margin increases to 13.8%
In the Aftermarket segment, sales declined by 3.1% to € 241 million in the first half of the fiscal year (prior year: € 249 million). The key factor behind this development was the ongoing lower demand in the independent aftermarket busi-ness caused by the Covid-19 pandemic. By contrast, the de-velopment of the workshop business was positive. Neverthe-less, sales development in the Aftermarket also improved, benefiting from a positive spare parts business in Eastern Europe as well as from a further increase in investment activ-ity by independent workshops. At € 132 million, sales in the second quarter consequently stood at the prior-year level (prior year: € 132 million).
In contrast, the Aftermarket segment improved in terms of earnings in the half-year period. Consequently, the segment's EBIT increased to € 29 million (prior year: € 25 million), corre-
sponding to an EBIT margin of 11.9% (prior year: 10.0%). Both in the first and second quarters, this development is attribut-able in particular to a higher gross profit margin, which saw an improvement due, among other factors, to a rise in the share of business with software licences in the area of workshops. In addition, EBIT is being buoyed by the strict cost management, especially in the area of distribution expenses. Earnings before interest and taxes rose to € 18 million in the second quarter in connection with the better sales development and simultane-ous cost management (prior year: € 14 million). The EBIT mar-gin thus improved to 13.8% (prior year: 10.5%).
17 FINANCIAL REPORT FOR 1ST HALF OF FISCAL YEAR 2020/2021 INTERIM GROUP MANAGEMENT REPORT
18 FINANCIAL REPORT FOR 1ST HALF OF FISCAL YEAR 2020/2021 INTERIM GROUP MANAGEMENT REPORT
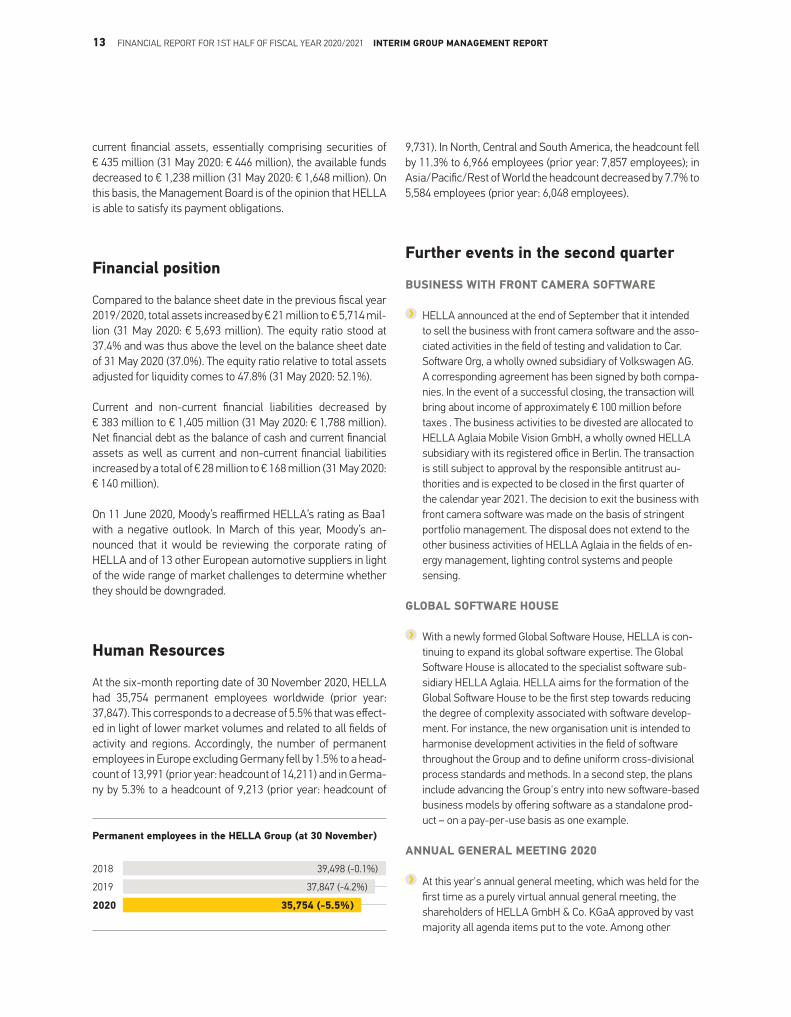
Income statement for the Aftermarket segment
First half-year1 June to 30 November
2nd quarter 1 September to 30 November
in € million 2020/2021 +/- 2019/2020 2020/2021 +/- 2019/2020
Sales with third-party entities 240 247 131 131
Intersegment sales 1 2 1 1
Segment sales 241 -3.1% 249 132 +0.1% 132
Cost of sales -133 -141 -73 -75
Gross profit 108 0.0% 108 59 +4.7% 56
Ratio of gross profit to sales 44.7% 43.3% 44.8% 42.8%
Research and development expenses -9 -9 -4 -4
Distribution expenses -62 -67 -32 -35
Administrative expenses -11 -12 -6 -5
Other income and expenses 3 5 1 2Earnings from investments accounted for using the equity method 0 0 0 0
Other income from investments 0 0 0 0
Earnings before interest and taxes (EBIT) 29 +15.2% 25 18 +31.0% 14Earnings before interest and taxes in relation to segment sales (EBIT margin) 11.9% 10.0% 13.8% 10.5%
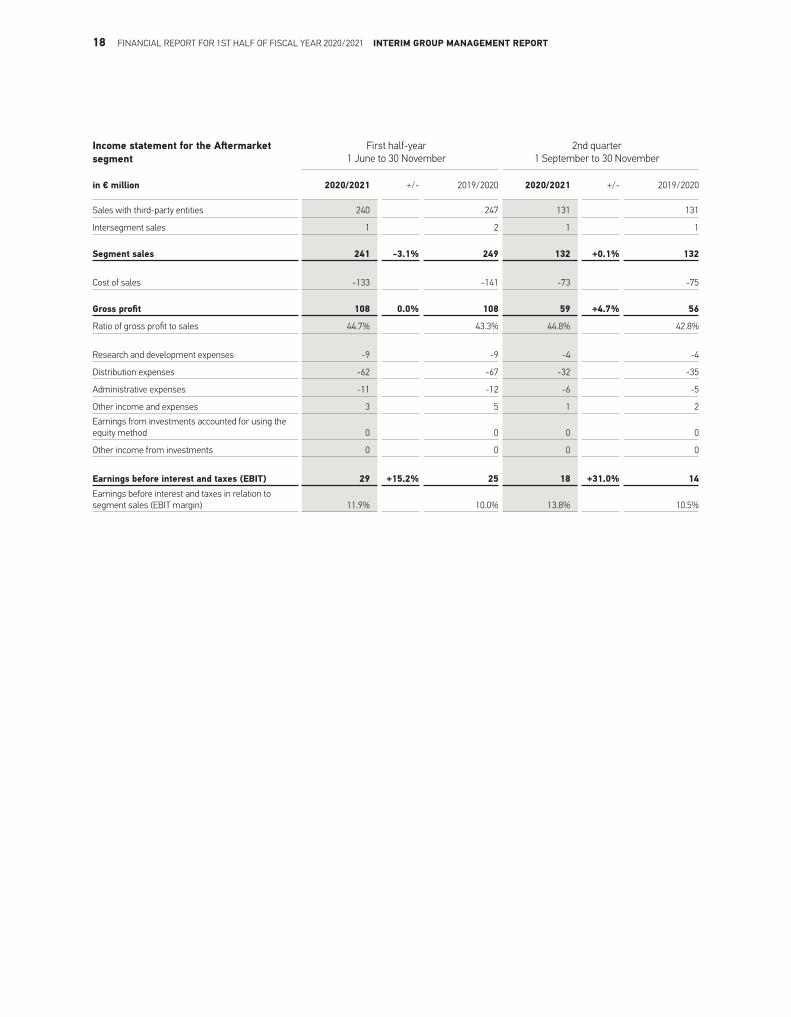
Special Applications
Sales in the Special Applications segment remain at € 167 million, roughly the prior-year level
Substantial sales growth especially in the business for agricultural machinery
EBIT drops slightly to € 19 million; EBIT margin conse-quently stands at 11.3%
Lower profitability due to product mix effects and lower business volumes is partially compensated for by cost savings
Sales in the Special Applications segment rise in the second quarter to € 92 million; EBIT margin improves significantly to 13.1%
In the first half of the fiscal year 2020/2021, the Special Appli-cations segment generated sales of € 167 million and is thus roughly at the prior-year level (prior year: € 168 million). This development was primarily brought about by sales from the business for agricultural machinery. Nevertheless, a market weakness in connection with the Covid-19 pandemic continued to be apparent in the other customer segments over the half-year period. In the second quarter, sales in the Special Applica-tions segment increased slightly to € 92 million due to the on-going good business development in the field of agriculture and due to the positive business with small car manufacturers (prior year: € 91 million).
The segment's earnings before interest and taxes decreased moderately to € 19 million in the reporting period (prior year: € 20 million), the EBIT margin consequently fell to 11.3% (prior
year: 11.9%). This decrease stemmed from a lower gross prof-it margin especially in the first quarter that can be attributed to a lower capacity utilisation, product mix effects and tool and project-related development costs. The second quarter saw an increase in the segment's profitability to € 12 million (prior year: € 11 million), meaning an increase in the EBIT margin to 13.1% (prior year: 12.3%). This development was brought about firstly by a higher gross profit margin in the second quarter in connec-tion with the improved business development and secondly by savings potential being leveraged.
19 FINANCIAL REPORT FOR 1ST HALF OF FISCAL YEAR 2020/2021 INTERIM GROUP MANAGEMENT REPORT

20 FINANCIAL REPORT FOR 1ST HALF OF FISCAL YEAR 2020/2021 INTERIM GROUP MANAGEMENT REPORT
Income statement for the Special Applications segment
First half-year1 June to 30 November
2nd quarter1 September to 30 November
in € million 2020/2021 +/- 2019/2020 2020/2021 +/- 2019/2020
Sales with third-party entities 164 164 90 89
Intersegment sales 3 4 2 2
Segment sales 167 -0.8% 168 92 +1.0% 91
Cost of sales -103 -100 -55 -54
Gross profit 64 -7.5% 69 37 +1.3% 36
Ratio of gross profit to sales 38.1% 40.8% 40.2% 40.1%
Research and development expenses -8 -8 -5 -4
Distribution expenses -26 -30 -14 -16
Administrative expenses -13 -12 -7 -6
Other income and expenses 2 1 1 1Earnings from investments accounted for using the equity method 0 0 0 0
Other income from investments 0 0 0 0
Earnings before interest and taxes (EBIT) 19 -5.8% 20 12 +7.5% 11Earnings before interest and taxes in relation to segment sales (EBIT margin) 11.3% 11.9% 13.1% 12.3%
OPPORTUNITY AND RISK REPORTIn the reporting period, the economic and industry development as well as the business development of HELLA has still been burdened by the effects of the global Covid-19 pandemic. The Corona pandemic also continues to lead to significantly in-creased uncertainties with regard to the development of the global economy, worldwide automotive production and HELLA's further business development. In this context, the further trajectory of the coronavirus pandemic continues to give rise to great risks due to the possibility of partial plant closures becoming necessary; over and above this, the risk of bottlenecks has risen in addition throughout the entire supply chain. This pertains in particular to risks relating to electronic components. In addition, there are no material changes in the first half of the fiscal year 2020/2021 in comparison to the an-nual report 2019/2020 published by HELLA in August of the prior year. Therefore, for details of the significant opportunities and risks, please refer to annual report 2019/2020.
Forecast report
The economic and industry outlook remains subject to great uncertainties in light of the dynamic development of the Covid-19 pandemic
For the calendar year 2021, the IMF assumes economic growth of 5.2%; consequences of further lockdown mea-sures are not reflected in the current forecast
According to IHS estimates, global light vehicle produc-tion is expected to increase by 11.5% in the fiscal year 2020/2021 after growth of 2.3% had been forecast at the beginning of the fiscal year
Company outlook raised for the current fiscal year de-spite the great market uncertainties prevailing in the second half of the year and risks arising from plant clo-sures and supply bottlenecks in light of the business de-velopment to date
Economic outlook
After the recession in the past calendar year 2020, the Interna-tional Monetary Fund (IMF) assumes growth in the global econ-omy of 5.2% for 2021 in its outlook published in October 2020.
If the economic growth comes about as anticipated, the glob-al gross domestic product would, according to IMF estimates, be 0.6% up on the level seen in the calendar year 2019. In its October report, the IMF does, however, point out the ongoing exceptionally high level of uncertainty in this base scenario associated with the Covid-19 pandemic. Consequently, global economic activity might well turn out to be weaker than ex-pected in the event that the spread of the coronavirus contin-ue to accelerate or progress in the development and distribu-tion of vaccines take longer than anticipated. Furthermore, the current IMF forecast does not take account of the negative impact on economic output as a consequence of lockdowns, curfews and contact restrictions that came into effect after publication of the current economic outlook, such as those in place in Germany. In addition to the Covid-19 pandemic, there are further uncertainties stemming from other restrictions on global trade, from geopolitical conflicts and the UK's with-drawal from the European Union and likewise from insolven-cies and liquidity squeezes.
In light of all this, the International Monetary Fund expects, as things stand, the gross domestic product in the eurozone to grow 5.2% and in Germany by 4.2% in the calendar year 2021. For the USA, the IMF forecasts an increase of 3.1%, for China it forecasts significant growth of 8.2%.
21 FINANCIAL REPORT FOR 1ST HALF OF FISCAL YEAR 2020/2021 INTERIM GROUP MANAGEMENT REPORT

Industry outlook
Supported by the macroeconomic development, the industry outlook for the full fiscal year 2020/2021 (1 June 2020 to 31 May 2021) has also been adjusted upwards again. On the basis of its forecast published in December, market research institution IHS correspondingly expects the current industry recovery to continue into the second half of the fiscal year and the number of new passenger vehicles and commercial vehicles manufac-tured to rise in total by 11.5% to 84.2 million units (prior year: 75.5 million units). At the beginning of the current fiscal year, IHS was still anticipating a lower growth of 2.3%. With this rate of growth, the forecast market volume for the global automo-tive industry is nevertheless still more than 10 million units down on the level seen in 2017 and 2018.
With regard to the regions, light vehicle production in Europe excluding Germany is currently expected to rise by 9.5% to 14.6 million units over the term of the current fiscal year 2020/2021 (prior year: 13.3 million units) and in Germany by 12.1% to 4.4 million units (prior year: 3.9 million units). For the North, Central and South America region, growth of 17.4% to 18.6 million units is currently anticipated (prior year: 15.9 mil-lion units); for the US market seen separately, growth of 23.0% to 10.6 million units is expected (prior year: 8.6 million units). With regard to the automotive market in Asia/Pacific/Rest of World, the current IHS forecast assumes an increase in light vehicle production of 9.8% to 46.6 million units (prior year: 42.5 million units). In this region, the Chinese market seen sep-arately is likely to see a faster rate of growth; as things stand, a rise in vehicle production of 17.2% to 25.7 million units can be expected (prior year: 21.9 million units).
22 FINANCIAL REPORT FOR 1ST HALF OF FISCAL YEAR 2020/2021 INTERIM GROUP MANAGEMENT REPORT
Company outlook
In light of the course of business to date and the current market outlook, HELLA increased its Company outlook for the current fiscal year 2020/2021 on 7 December 2020. The Company is now anticipating currency and portfolio-adjusted sales in the range of around € 6.1 billion to € 6.6 billion (prior year adjusted for Behr Hella Service: € 5.7 billion) and an adjusted EBIT mar-gin adjusted for restructuring measures and portfolio effects in the range of around 6.0% to 8.0% (prior year adjusted for Behr Hella Service: 4.0%). The income totalling around € 100 million before taxes that is expected from the sale of the camera soft-ware business to Volkswagen's Car.Software Org initiated in September should be added to this figure. Previously, currency and portfolio-adjusted sales between around € 5.6 billion and € 6.1 billion and an adjusted EBIT margin between around 4.0% and 6.0% had been expected.
Despite this increase in its forecast, HELLA continues to as-sume that the market environment will remain very volatile and subject to great uncertainties. Therefore, the Company's outlook is based on the assumption that there will be no mate-rial impact on HELLA's business as a result of possible plant closures due to prolonged Covid-19 lockdowns. Furthermore, the risks from potential bottlenecks in the global supply chains have increased additionally, especially with regard to the avail-ability of electronic components.
Expected production of passenger cars and light commercial vehicles during fiscal year 2020/2021 and compared to the prior year
in thousands of units 2020/2021 +/- 2019/2020
Europe excluding Germany 14,575 +9.5% 13,309
Germany 4,378 +12.1% 3,905
North, Central and South America 18,629 +17.4% 15,865
USA 10,635 +23.0% 8,648
Asia / Pacific / RoW 46,637 +9.8% 42,467
China 25,701 +17.2% 21,936
Worldwide 84,218 +11.5% 75,546
Source: IHS Light Vehicle Production Forecast, December 2020

Consolidated income statementof HELLA GmbH & Co. KGaA
CONDENSED INTERIM CONSOLIDATED FINANCIAL STATEMENTS
23 FINANCIAL REPORT FOR 1ST HALF OF FISCAL YEAR 2020/2021 CONDENSED INTERIM CONSOLIDATED FINANCIAL STATEMENTS
First half-year
1 June to 30 November2nd quarter
1 September to 30 November
€ thousand 2020/2021 2019/2020 2020/2021 2019/2020
Sales 3,100,358 3,312,999 1,756,003 1,743,179
Cost of sales -2,326,629 -2,480,562 -1,299,000 -1,318,529
Gross profit 773,729 832,437 457,003 424,651
Research and development expenses -438,392 -330,928 -152,550 -163,857
Distribution expenses -156,280 -190,005 -83,212 -99,273
Administrative expenses -137,416 -116,101 -60,393 -62,105
Other income and expenses 33,904 9,705 31,454 2,034
Earnings from investments accounted for using the equity method 18,182 25,260 16,746 17,838
Other income from investments 2 0 0 0
Earnings before interest and taxes (EBIT) 93,730 230,367 209,049 119,287
Financial income 17,953 10,114 11,268 2,768
Financial expenses -23,924 -22,938 -17,362 -7,747
Net financial result -5,970 -12,824 -6,094 -4,979
Earnings before income taxes (EBT) 87,760 217,543 202,954 114,308
Income taxes -21,238 -55,256 -49,115 -29,084
Earnings for the period 66,522 162,287 153,839 85,224
of which attributable:
to the owners of the parent company 65,634 161,605 153,312 84,796
to non-controlling interests 888 682 528 428
Basic earnings per share in € 0.59 1.45 1.38 0.76
Diluted earnings per share in € 0.59 1.45 1.38 0.76
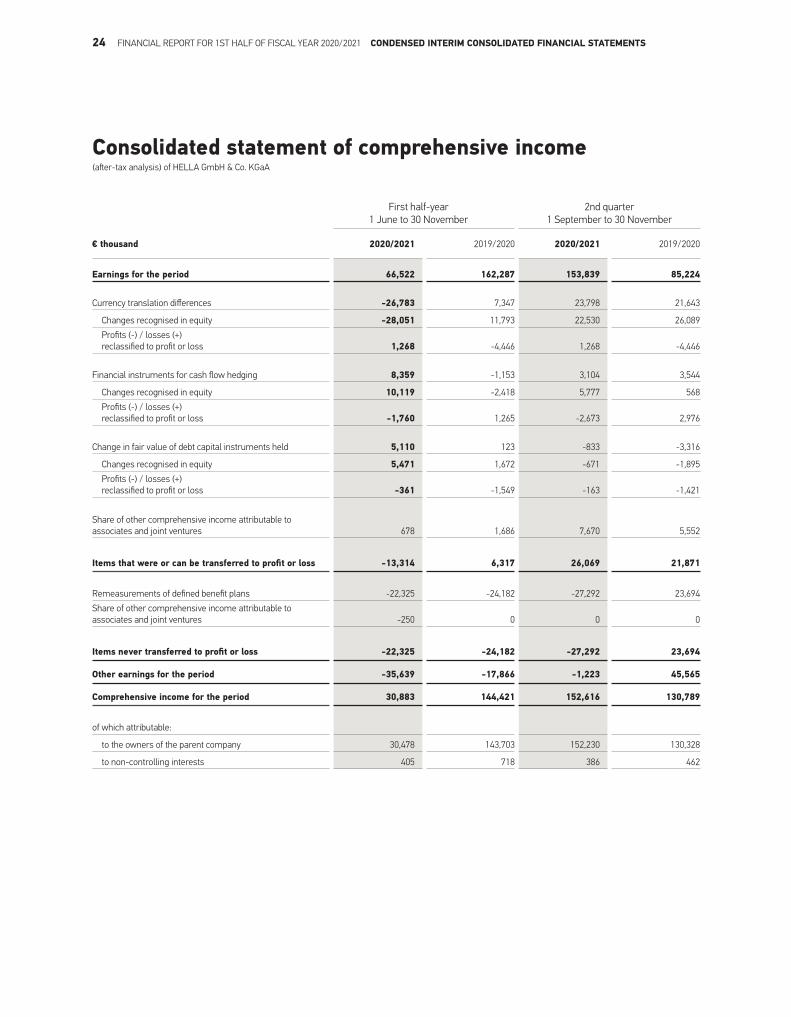
Consolidated statement of comprehensive income(after-tax analysis) of HELLA GmbH & Co. KGaA
24 FINANCIAL REPORT FOR 1ST HALF OF FISCAL YEAR 2020/2021 CONDENSED INTERIM CONSOLIDATED FINANCIAL STATEMENTS
First half-year1 June to 30 November
2nd quarter1 September to 30 November
€ thousand 2020/2021 2019/2020 2020/2021 2019/2020
Earnings for the period 66,522 162,287 153,839 85,224
Currency translation differences -26,783 7,347 23,798 21,643
Changes recognised in equity -28,051 11,793 22,530 26,089 Profits (-) / losses (+)
reclassified to profit or loss 1,268 -4,446 1,268 -4,446
Financial instruments for cash flow hedging 8,359 -1,153 3,104 3,544
Changes recognised in equity 10,119 -2,418 5,777 568 Profits (-) / losses (+)
reclassified to profit or loss -1,760 1,265 -2,673 2,976
Change in fair value of debt capital instruments held 5,110 123 -833 -3,316
Changes recognised in equity 5,471 1,672 -671 -1,895 Profits (-) / losses (+)
reclassified to profit or loss -361 -1,549 -163 -1,421
Share of other comprehensive income attributable to associates and joint ventures 678 1,686 7,670 5,552
Items that were or can be transferred to profit or loss -13,314 6,317 26,069 21,871
Remeasurements of defined benefit plans -22,325 -24,182 -27,292 23,694Share of other comprehensive income attributable to associates and joint ventures -250 0 0 0
Items never transferred to profit or loss -22,325 -24,182 -27,292 23,694
Other earnings for the period -35,639 -17,866 -1,223 45,565
Comprehensive income for the period 30,883 144,421 152,616 130,789
of which attributable:
to the owners of the parent company 30,478 143,703 152,230 130,328
to non-controlling interests 405 718 386 462
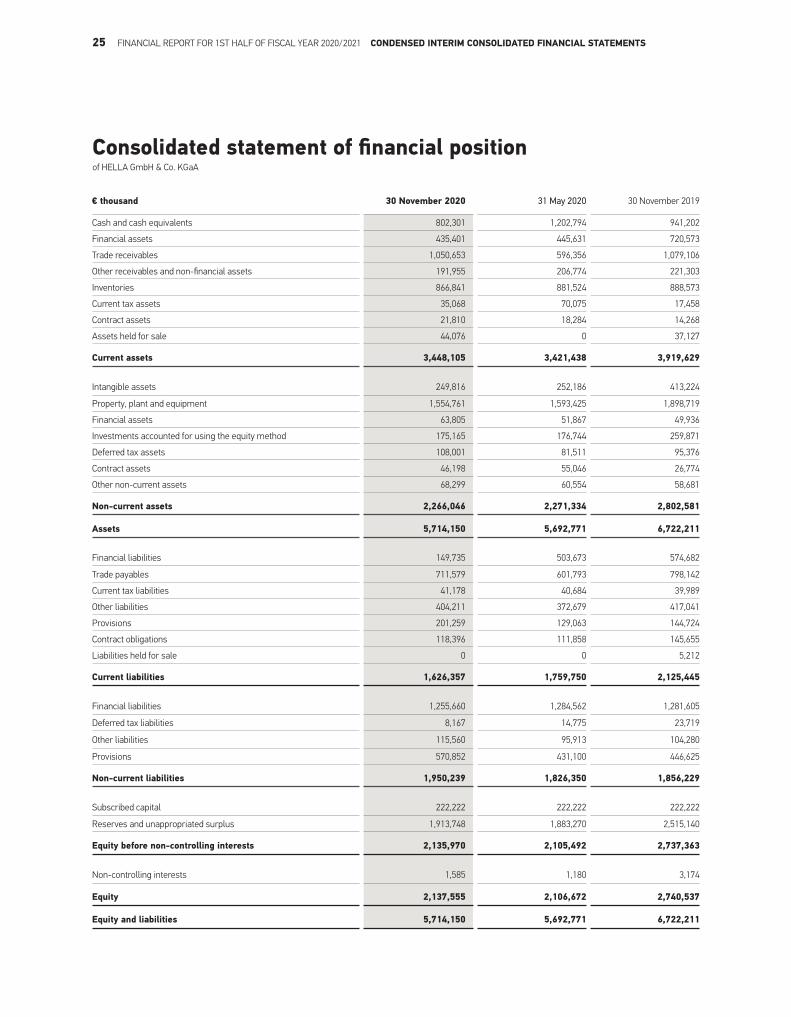
Consolidated statement of financial positionof HELLA GmbH & Co. KGaA
25 FINANCIAL REPORT FOR 1ST HALF OF FISCAL YEAR 2020/2021 CONDENSED INTERIM CONSOLIDATED FINANCIAL STATEMENTS
€ thousand 30 November 2020 31 May 2020 30 November 2019
Cash and cash equivalents 802,301 1,202,794 941,202
Financial assets 435,401 445,631 720,573
Trade receivables 1,050,653 596,356 1,079,106
Other receivables and non-financial assets 191,955 206,774 221,303
Inventories 866,841 881,524 888,573
Current tax assets 35,068 70,075 17,458
Contract assets 21,810 18,284 14,268
Assets held for sale 44,076 0 37,127
Current assets 3,448,105 3,421,438 3,919,629
Intangible assets 249,816 252,186 413,224
Property, plant and equipment 1,554,761 1,593,425 1,898,719
Financial assets 63,805 51,867 49,936
Investments accounted for using the equity method 175,165 176,744 259,871
Deferred tax assets 108,001 81,511 95,376
Contract assets 46,198 55,046 26,774
Other non-current assets 68,299 60,554 58,681
Non-current assets 2,266,046 2,271,334 2,802,581
Assets 5,714,150 5,692,771 6,722,211
Financial liabilities 149,735 503,673 574,682
Trade payables 711,579 601,793 798,142
Current tax liabilities 41,178 40,684 39,989
Other liabilities 404,211 372,679 417,041
Provisions 201,259 129,063 144,724
Contract obligations 118,396 111,858 145,655
Liabilities held for sale 0 0 5,212
Current liabilities 1,626,357 1,759,750 2,125,445
Financial liabilities 1,255,660 1,284,562 1,281,605
Deferred tax liabilities 8,167 14,775 23,719
Other liabilities 115,560 95,913 104,280
Provisions 570,852 431,100 446,625
Non-current liabilities 1,950,239 1,826,350 1,856,229
Subscribed capital 222,222 222,222 222,222
Reserves and unappropriated surplus 1,913,748 1,883,270 2,515,140
Equity before non-controlling interests 2,135,970 2,105,492 2,737,363
Non-controlling interests 1,585 1,180 3,174
Equity 2,137,555 2,106,672 2,740,537
Equity and liabilities 5,714,150 5,692,771 6,722,211

Consolidated statement of changes in equity
26 FINANCIAL REPORT FOR 1ST HALF OF FISCAL YEAR 2020/2021 CONDENSED INTERIM CONSOLIDATED FINANCIAL STATEMENTS
of HELLA GmbH & Co. KGaA
€ thousandSubscribed
capital Capital reserve
Reserve for currency translation
differences
Reserve for financial instruments for cash
flow hedging
Reserve for available-for-sale financial
instruments
As at: 01 June 2019 222,222 250,234 -54,197 -64,471 0
Earnings for the period 0 0 0 0 0
Other earnings for the period 0 0 7,311 -1,153 0
Comprehensive income for the period 0 0 7,311 -1,153 0
Distributions to shareholders 0 0 0 0 0
Disposal of non-controlling interests 0 0 0 0 0
Transactions with shareholders 0 0 0 0 0
As at: 30 November 2019 222,222 250,234 -46,886 -65,625 0
As at: 01 June 2020 222,222 250,234 -92,701 -66,797 0
Earnings for the period 0 0 0 0 0
Other earnings for the period 0 0 -26,300 8,359 0
Comprehensive income for the period 0 0 -26,300 8,359 0
Distributions to shareholders 0 0 0 0 0
Disposal of non-controlling interests 0 0 0 0 0
Transactions with shareholders 0 0 0 0 0
As at: 30 November 2020 222,222 250,234 -119,001 -58,438 0
See also Chapter 15 for notes on equity.
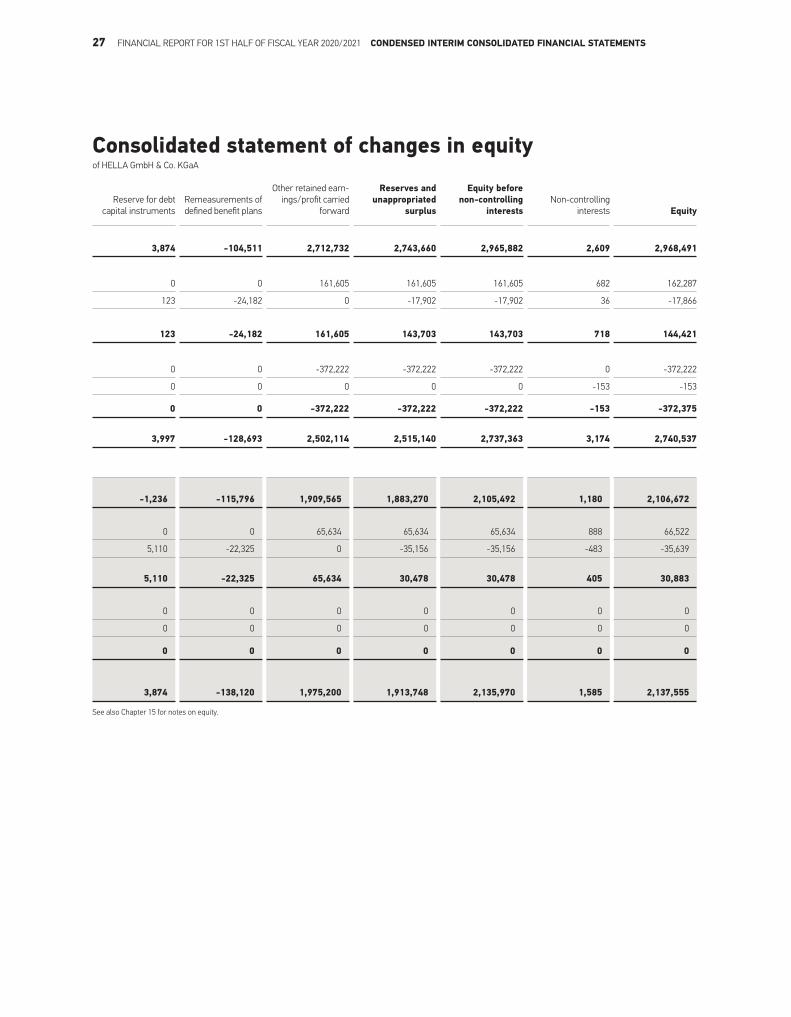
Consolidated statement of changes in equityof HELLA GmbH & Co. KGaA
27 FINANCIAL REPORT FOR 1ST HALF OF FISCAL YEAR 2020/2021 CONDENSED INTERIM CONSOLIDATED FINANCIAL STATEMENTS
Reserve for debt capital instruments
Remeasurements of defined benefit plans
Other retained earn-ings/profit carried
forward
Reserves and unappropriated
surplus
Equity before non-controlling
interestsNon-controlling
interests Equity
3,874 -104,511 2,712,732 2,743,660 2,965,882 2,609 2,968,491
0 0 161,605 161,605 161,605 682 162,287
123 -24,182 0 -17,902 -17,902 36 -17,866
123 -24,182 161,605 143,703 143,703 718 144,421
0 0 -372,222 -372,222 -372,222 0 -372,222
0 0 0 0 0 -153 -153
0 0 -372,222 -372,222 -372,222 -153 -372,375
3,997 -128,693 2,502,114 2,515,140 2,737,363 3,174 2,740,537
-1,236 -115,796 1,909,565 1,883,270 2,105,492 1,180 2,106,672
0 0 65,634 65,634 65,634 888 66,522
5,110 -22,325 0 -35,156 -35,156 -483 -35,639
5,110 -22,325 65,634 30,478 30,478 405 30,883
0 0 0 0 0 0 0
0 0 0 0 0 0 0
0 0 0 0 0 0 0
3,874 -138,120 1,975,200 1,913,748 2,135,970 1,585 2,137,555
See also Chapter 15 for notes on equity.

Consolidated cash flow statementof HELLA GmbH & Co. KGaA for the period from 1 June to 30 November
28 FINANCIAL REPORT FOR 1ST HALF OF FISCAL YEAR 2020/2021 CONDENSED INTERIM CONSOLIDATED FINANCIAL STATEMENTS
€ thousand 2020/2021 2019/2020
Earnings before income taxes (EBT) 87,760 217,543
+ Depreciation and amortisation 182,954 208,346
+ Change in provisions 178,069 14,295 - Other non-cash income and cash flows not attributable to operating activities -44,593 -7,368
+ Losses / profits from the sale of property, plant and equipment and intangible assets 462 1,811
+ Net financial result 5,970 12,824
- Change in trade receivables and other assets not attributable to investing or financing activities -443,699 -36,274
- Increase in inventories -1,613 -100,917
+ Change in trade payables and other liabilities not attributable to investing or financing activities 272,663 78,262
+ Tax refunds received 19,184 497
- Taxes paid -30,363 -41,986
+ Dividends received 647 24,938
= Net cash flow from operating activities 227,442 371,971
+ Cash receipts from the sale of intangible assets and property, plant and equipment 9,247 6,164
- Payments for the purchase of intangible assets and property, plant and equipment -270,377 -257,117
+ Cash receipts from the sale of subsidiaries less cash and cash equivalents 0 1,299+ Cash receipts from the sale of investments in joint ventures 4,955 0+ Repayments from loans granted to investments 0 3,429
- Payments for loans granted to investments -4,100 0
- Payments for capital increases in investments -8,223 -6,741
+ Cash proceeds from the sale of investments 0 22,006
- Payments for the acquisition of companies, less cash and cash equivalents -8,150 -548
+/- Net payments for the purchase and sale of securities 24,419 -157,758
+ Interest received 3,956 5,082
= Net cash flow from investing activities -248,272 -384,185
+ Cash receipts from the issuance of a bond 0 498,515
- Payments for the repayment of financial liabilities -369,809 -39,553
+ Cash receipts from changes in financial liabilities 2,285 1,490
- Interest paid -10,994 -11,345
- Dividends paid 0 -372,222
= Net cash flow from financing activities -378,517 76,885
= Net change in cash and cash equivalents -399,347 64,671
+ Cash and cash equivalents as at 1 June 1,202,794 876,763
- Cash and cash equivalents classified as held for sale 0 -971
-/+ Effect of exchange rate changes on cash and cash equivalents -1,146 739
= Cash and cash equivalents as at 30 November 802,301 941,202
See also chapter 16 for notes to the cash flow statement.
29 FINANCIAL REPORT FOR 1ST HALF OF FISCAL YEAR 2020/2021 FURTHER INFORMATION
the clarity of the presentation, items of the consolidated state-ment of financial position and consolidated income statement have been grouped together where this is appropriate and possible. Please note that where sums and percentages in the report have been rounded, differences may arise as a result of commercial rounding.
02 Scope of consolidation
In addition to HELLA GmbH & Co. KGaA, the scope of consoli-dation encompasses all significant domestic and foreign sub-sidiaries that are directly or indirectly controlled by HELLA. Ma-terial joint ventures are included in the consolidated financial statements using the equity method of accounting.
Three new entities were founded in the current fiscal year 2020/2021. The new company HELLA eMobionics Ltd., which was formed in India, is intended to develop product solutions for electric rickshaws, among other things. HELLA eMobionics was formed with a view to serving in an even more targeted manner the growth market for two and three wheelers that dominate road traffic in India. Two further companies were founded in China. HELLA and the MINTH Group have agreed to establish a joint venture. HELLA MINTH Jiaxing Automotive Parts Co. Ltd. is intended to pro-mote the development, manufacture and marketing of ra-domes and illuminated logos. On 25 February 2020, HELLA and the Chinese company Ever-grande New Energy Automobile signed an agreement to form another business entity. The plans are for the company emerg-ing from this agreement, HELLA Evergrande Automotive Bat-tery Management Systems (Shenzhen) Co., Ltd., to assume business operations in the Automotive segment.
01 Basic information
HELLA GmbH & Co. KGaA and its subsidiaries (collectively re-ferred to as the "Group") develop and manufacture lighting technology and electronics components and systems for the automotive industry. In addition to the development and man-ufacture of components, joint - venture companies produce complete vehicle modules and climate control systems. The Group's production and manufacturing sites are located across the globe; its most significant markets are in Europe, the USA and Asia, particularly China. In addition, HELLA has its own international sales network for all kinds of vehicle accessories.
The Company is a listed stock corporation, which was founded and is based in Lippstadt, Germany. The address of the Compa-ny's registered office is Rixbecker Str. 75, 59552 Lippstadt. HELLA GmbH & Co. KGaA is registered in Commercial Register B of Paderborn district court under number HRB 6857 and pre-pares the consolidated financial statements for the smallest and largest group of companies.
This interim report has been prepared as a condensed interim report in accordance with the requirements of the International Financial Reporting Standards (IFRS) applicable as at 30 No-vember 2020 and as adopted by the European Union. The inter-im report was created in accordance with IAS 34 Interim Finan-cial Reporting. The interim financial statements are accompa-nied by an interim management report. The comparative values of the prior year have been determined according to the same principles. The condensed interim consolidated financial statements and the interim group management report have neither been reviewed pursuant to Section 37w (5) WpHG nor audited in accordance with Section 317 HGB.
The interim financial statements are prepared in euros (€). Amounts are stated in thousands of euros (€ thousand). The interim financial statements are prepared using accounting policies and measurement methods that are applied consis-tently within the Group on the basis of amortised historical cost. This does not apply to assets that are available for sale and derivative financial instruments, which are measured at fair value. The consolidated income statement is prepared using the cost-of-sales method. The current/non-current dis-tinction is observed in the consolidated statement of financial position. The amounts stated under current assets and liabil-ities are for the most part due for settlement within twelve months. Accordingly, non-current items are mainly due for settlement in more than twelve months. In order to enhance
FURTHER INFORMATION
Number 30 Nov 2020 31 May 2020 30 Nov 2019
Fully consolidated companies 86 85 87Companies accounted for using the equity method 49 47 53

30 FINANCIAL REPORT FOR 1ST HALF OF FISCAL YEAR 2020/2021 FURTHER INFORMATION
03 Accounting policies and measurement methods
The accounting policies and measurement methods used in the interim report are the same as those used in the consolidated financial statements as at 31 May 2020. These accounting pol-icies and measurement methods were explained in the annual report 2019/2020.
Application of the other IFRS amendments that are mandato-ry as at 30 November 2020 does not materially influence the presentation of the condensed interim consolidated financial statements.
To simplify interim reporting, IAS 34.41 allows greater use of estimates and assumptions than in the annual financial state-ments, provided all material financial information that is rel-evant for understanding the net assets, financial position and results of operations is appropriately disclosed.
To calculate the income tax expense, the estimated effective income tax rate for the current fiscal year is taken into account when calculating the tax charge incurred during the year.
04 Currency translation
Currency translation differences arising from the conversion of earnings and balance sheet items of all Group companies
which have a functional currency deviating from the euro are reported within the currency translation differences reserves.
05 Adjustment of segment reporting
On 31 December 2019, HELLA completed its exit from the ther-mal management business, prior to which the associated sales and expenses had been part of the Aftermarket segment and Group figures. As a result of this decision, the thermal manage-ment business also ceased to be part of the Aftermarket seg-ment in its entirety as of that date. Consequently, no related
expense or income items have been included in the current reporting period. To ensure the ability to draw consistent com-parisons, the sales and expenses for the prior year have been adjusted in the Aftermarket segment figures and integrated into the Group reconciliation for sales and EBIT. This has not had any impact on the Group figures.
The exchange rates used to translate the main currencies for HELLA were as follows:
Average Reporting date
2020/2021 2019/2020 30 November 2020 31 May 2020 30 November 2019
€ 1 = US dollar 1.1657 1.1124 1.1980 1.1136 1.0982
€ 1 = Czech koruna 26.6326 25.6727 26.1920 26.9210 25.5150
€ 1 = Japanese yen 123.4298 119.9633 124.7900 119.2900 120.4300
€ 1 = Mexican peso 25.3068 21.5438 24.0499 24.5580 21.4483
€ 1 = Chinese renminbi 7.9950 7.7988 7.8798 7.8804 7.7172
€ 1 = South Korean won 1,365.2807 1,317.7832 1,326.0800 1363.7600 1,295.8100
€ 1 = Romanian leu 4.8534 4.7407 4.8732 4.8493 4.7823
€ 1 = Indian rupee 86.7350 78.4257 88.7322 83.4635 78.6875
31 FINANCIAL REPORT FOR 1ST HALF OF FISCAL YEAR 2020/2021 FURTHER INFORMATION
MAESA, a HELLA company in Spain, was integrated into the Automotive segment as of the beginning of the current report-ing period. Prior to that point, the production company (whose products include rear combination lamps and fog lamps for European original equipment manufacturers for both current and post series) had been part of the Special Applications seg-ment. MAESA has been a fully owned subsidiary of HELLA since 1967. The production company currently has approxi-mately 230 employees and generated sales of just under € 31 million in the last fiscal year. Its reclassification under a different segment is part of a strategic realignment. In order to ensure a transparent and comparable presentation over time, the prior-year figures for the Special Applications and Automo-tive segments have been adjusted accordingly. This has not had any impact on the Group figures.
06 Notable events
At the beginning of fiscal year 2020/2021, HELLA announced its intention to enhance the Company's competitive standing through a new strategy programme. This was developed against the backdrop of lowered market expectations, resulting in growing pressure from competitors and costs. The Company is also working on the basis of the Covid-19 pandemic's prog-ress and believes that market growth rates will remain moder-ate over the medium to long term as a result of this. As a pro-active way of adapting to the changing market environment, HELLA has approved a comprehensive and detailed package of measures, which have been communicated both internally and externally. The programme will entail structural changes with-in the global HELLA network. The measures – whose imple-mentation has already started in the first quarter – focus pri-marily on the German locations and affect the areas of man-agement and development in particular. The corresponding
restructuring expenses for this programme incurred in the re-porting period of € 168,952 thousand are stated in administra-tive expenses and the Group's research and development ex-penses without reference to any specific segment.
The Covid-19 pandemic that broke out at the beginning of the calendar year 2020 continues to impact the general economic environment. The pandemic itself and the resulting counter-measures put in place across the globe are having a negative impact on trade, affecting supply chains and reducing consum-er demand. The further trajectory of the Covid-19 pandemic increases the prevailing risks, specifically pertaining to any plant closures that may become necessary and bottlenecks along the entire supply chain. This applies in particular with risks relating to electronic components. HELLA continues to assume a permanent impairment of the recoverable amounts for the assets, as was already the case in the annual report for the period ending in May 2020. An assessment of the recover-able amounts takes into account material findings specifically on individual markets.
In September 2020, HELLA entered into agreements under which the business with front camera software and the asso-ciated activities in the field of testing and validation were trans-ferred to Car.Software Org, a wholly owned subsidiary of Volk-swagen AG. In the event of a successful closing, this transac-tion may generate income of a volume of around € 100 million. The business activities to be divested are allocated to HELLA Aglaia Mobile Vision GmbH, a wholly owned HELLA subsidiary with its registered office in Berlin. Under the disposal, around one half of the HELLA Aglaia is to be transferred to Car.Soft-ware Org, an entity formed by Volkswagen at the beginning of the year as a cross-brand unit for software development. The transaction is still subject to approval by the responsible anti-trust authorities and is expected to be closed in the first quar-ter of the calendar year 2021.

32 FINANCIAL REPORT FOR 1ST HALF OF FISCAL YEAR 2020/2021 FURTHER INFORMATION
07 Sales
Sales for the first half of fiscal year 2020/2021 amounted to € 3,100,358 thousand (prior year: € 3,312,999 thousand). Sales are attributable entirely to the sale of goods and performance of services.
Consolidated sales in the fiscal year 2019/2020 contain compo-nents of the thermal management business. These compo-nents ceased to be included following disposal of the business.
To ensure the ability to draw consistent comparisons with the current reporting period, the consolidated sales from the same
period of the prior year is presented in the following table fol-lowing adjustment for the share in sales from the thermal management business.
They can be classified as follows:
€ thousand 2020/2021 2019/2020
Sales from the sale of goods 2,985,510 3,155,052
Sales from the rendering of services 114,848 157,947
Total sales 3,100,358 3,312,999
Sales by region (based on the headquarters of HELLA's customers):
€ thousand 2020/2021 2019/2020
Germany 978,348 1,063,458
Europe excluding Germany 899,845 953,920
North, Central and South America 679,908 726,726
Asia / Pacific / RoW 542,257 568,896
Consolidated sales 3,100,358 3,312,999
Adjusted sales by region (based on the headquarters of HELLA's customers):
€ thousand 2019/2020as reported
2019/2020Adjustment
2019/2020adjusted
Germany 1,063,458 -17,278 1,046,180
Europe excluding Germany 953,920 -36,538 917,382
North, Central and South America 726,726 -8,097 718,629
Asia / Pacific / RoW 568,896 -12,034 556,862
Consolidated sales 3,312,999 -73,947 3,239,052

33 FINANCIAL REPORT FOR 1ST HALF OF FISCAL YEAR 2020/2021 FURTHER INFORMATION
08 Earnings per share
Basic earnings per share are calculated by dividing the share of earnings attributable to the shareholders of HELLA GmbH & Co. KGaA by the weighted average number of ordinary shares issued.
Basic earnings per share amounted to € 0.59 (prior year: € 1.45) and correspond to the diluted earnings.
of units 30 Nov 2020 30 Nov 2019
Weighted average number of shares in circulation during the period
Basic ordinary shares 111,111,112 111,111,112
Diluted ordinary shares 111,111,112 111,111,112
€ thousand 2020/2021 2019/2020
Share of profit attributable to owners of the parent company 65,634 161,605
€ 2020/2021 2019/2020
Basic earnings per share 0.59 1.45
Diluted earnings per share 0.59 1.45

34 FINANCIAL REPORT FOR 1ST HALF OF FISCAL YEAR 2020/2021 FURTHER INFORMATION
09 Adjustment of special effects in earnings before interest and taxes
The HELLA Group is managed by the Management Board through financial key performance indicators. The key perfor-mance indicators of adjusted sales growth and adjusted oper-ative operating result margin (adjusted EBIT margin) take on prominent importance compared to the other financial key performance indicators in the management of the HELLA Group. A major guideline in assessing the suitability of man-agement indicators is that they have to provide a transparent picture of operational performance. In this process, effects of a non-recurring or exceptional nature in type or size, referred to as special effects, can lead to distortions with regard to the EBIT margin, for example, and thus adversely affect the ability to assess the Company's performance.
Special effects essentially comprise income and expenses in connection with changes in the legal structure of the Group, site closures or restructuring measures.
For this reason, the adjusted EBIT margin has been defined as one of the most important key performance indicators for the steering of the Group's activities. The adjusted EBIT margin as a key performance indicator is not defined in the International Financial Reporting Standards. Rather, it is reported by the HELLA Group as additional information in its financial reporting because it is also used for internal management and because, from the Company's perspective, it presents the results of op-erations – adjusted for special circumstances or portfolio changes – in a more transparent form and facilitates a compar-ison over time.
In the current reporting period 2020/2021, the costs for the restructuring measures of € 175,325 thousand (prior year: € 23,008 thousand) have been adjusted in EBIT; this amount includes, among other things, the portions relating to the strat-egy programme launched in August (see Chapter 06).
The corresponding reconciliation statement for the first half year of fiscal year 2020/2021 is as follows:
€ thousand 2020/2021 as reported Adjustment
2020/2021 adjusted
Sales 3,100,358 0 3,100,358
Cost of sales -2,326,629 7,698 -2,318,930
Gross profit 773,729 7,698 781,427
Research and development expenses -438,392 141,800 -296,592
Distribution expenses -156,280 283 -155,997
Administrative expenses -137,416 25,544 -111,872
Other income and expenses 33,904 0 33,904
Earnings from investments accounted for using the equity method 18,182 0 18,182
Other income from investments 2 0 2
Earnings before interest and taxes (EBIT) 93,730 175,325 269,055

35 FINANCIAL REPORT FOR 1ST HALF OF FISCAL YEAR 2020/2021 FURTHER INFORMATION
10 Segment reporting
External segment reporting is based on internal reporting ("management approach"). Segment reporting is based solely on financial information used by the Company's decision mak-ers for the internal management of the Company and to make decisions regarding the allocation of resources and measure-ment of profitability.
THE HELLA GROUP'S BUSINESS ACTIVITIES ARE DIVIDED INTO THREE SEGMENTS: AUTOMOTIVE, AFTERMARKET AND SPECIAL APPLICATIONS:The Lighting business division and the Electronics business division are reported together in the Automotive segment. Both business divisions serve a similar customer base world-wide. Consequently, both segments are subject to broadly similar economic cycles and industry developments. In addi-tion, the individual products have comparable lifecycles. Orig-inal Equipment provides lighting and electronics components to automotive manufacturers and other tier-1 suppliers worldwide through an integrated distribution network. The product portfolio of the Lighting business division includes headlamps, signal lights, interior lights and lighting electron-ics. The Electronics business division focuses on the product areas of body electronics, energy management, driver assis-tance systems and components (for example sensors and
engine compartment actuators). The Automotive segment develops, produces and sells vehicle-specific solutions, and develops and brings to market technological innovations. The margins attainable within the segment are mainly dependent on the respective technology used and, to a lesser extent, on customers, regions and products.
The Aftermarket business segment produces and sells auto-motive parts and accessories, primarily in the areas of light-ing, electrics and electronics, as well as workshop solutions in the areas of diagnostics and calibration. Furthermore, wholesalers and workshops receive support for their busi-ness via a state-of-the-art and fast information and order system as well as via comprehensive services, such as ho-tlines, training, technical information, sales support and effi-cient logistics. Strategic focal points of the segment include the stronger alignment of the aftermarket business with the Company's original equipment expertise and the closer dove-tailing of original equipment expertise and workshop equip-ment expertise.
The Special Applications segment comprises original equip-ment for special-purpose vehicles such as buses, caravans, agricultural and construction machinery, municipal vehicles
HELLA completed its withdrawal from the thermal manage-ment business on 31 December 2019. Prior to this date, the associated sales and expenses were part of the Aftermarket segment. As a consequence of this decision and to ensure a consistent comparison with the reporting period, the associat-
ed components (sales of € 73,947 thousand and costs of € 69,880 thousand) are presented in the consolidated income statement after the corresponding adjustments have been made. In additions, adjustments were made in the prior year for restructuring expenses totalling € 27,075 thousand.
The corresponding reconciliation statement for the first half year of fiscal year 2019/2020 is as follows:
€ thousand 2019/2020 as reported Adjustment
2019/2020 adjusted
Sales 3,312,999 -73,947 3,239,052Cost of sales -2,480,562 85,356 -2,395,207
Gross profit 832,437 11,409 843,846
Research and development expenses -330,928 674 -330,254Distribution expenses -190,005 9,331 -180,674Administrative expenses -116,101 562 -115,539Other income and expenses 9,705 1,032 10,737Earnings from investments accounted for using the equity method 25,260 0 25,260Other income from investments 0 0 0
Earnings before interest and taxes (EBIT) 230,367 23,008 253,375

36 FINANCIAL REPORT FOR 1ST HALF OF FISCAL YEAR 2020/2021 FURTHER INFORMATION
and trailers. Technological competence is closely linked to the Automotive business, which means that the range of applica-tions in LED and electronic products can be expanded appro-priately and synergies leveraged at the same time.
All other Group segments are subordinate in terms of their economic significance and are therefore not segmented further. Their functions relate mainly to Group financing.
Sales as well as adjusted earnings before interest and taxes (EBIT) are the key performance indicators used to manage the business segments; assets and liabilities are not reported. The internal reporting applies the same accounting and measure-ment principles as the consolidated financial statements. Spe-cial items that are not included in the segment results are identified for the individual reporting periods. These special items are presented in the reconciliation table.
The segment information for the first six months (1 June to 30 November) of the fiscal years 2020/2021 and 2019/2020 is as follows:
Automotive Aftermarket Special Applications
€ thousand 2020/2021 2019/2020* 2020/2021 2019/2020* 2020/2021 2019/2020*
Sales with third-party entities 2,682,128 2,809,283 240,190 246,832 163,632 164,031
Intersegment sales 28,034 22,351 1,191 2,231 3,391 4,276
Segment sales 2,710,162 2,831,634 241,381 249,063 167,023 168,307
Cost of sales -2,103,333 -2,164,863 -133,461 -141,117 -103,409 -99,560
Gross profit 606,829 666,771 107,920 107,946 63,615 68,748
Research and development expenses -279,376 -313,026 -8,995 -9,098 -8,027 -8,112
Distribution expenses -67,340 -84,696 -62,429 -66,947 -26,093 -29,973
Administrative expenses -89,137 -97,139 -11,270 -11,909 -12,870 -12,082
Other income and expenses 29,453 13,982 3,230 4,559 2,191 1,402
Earnings from investments accounted for using the equity method 17,939 24,907 243 353 0 0
Other income from investments 0 0 2 0 0 0
Earnings before interest and taxes (EBIT) 218,368 210,799 28,700 24,905 18,816 19,982
Additions to property, plant and equipment and intangible assets 178,783 182,380 6,254 8,794 4,987 9,319
* The prior-year figures for the segments have been adjusted. Please refer to chapter 05 for further information.
Sales with external third parties for the first six months of fiscal years 2020 / 2021 and 2019 / 2020 are as follows:
Automotive Aftermarket Special Applications
€ thousand 2020/2021 2019/2020 2020/2021 2019/2020 2020/2021 2019/2020
Sales from the sale of goods 2,604,750 2,692,167 219,439 226,928 161,320 162,011
Sales from the rendering of services 77,378 117,116 20,751 19,904 2,311 2,021
Sales with third-party entities 2,682,128 2,809,283 240,190 246,832 163,632 164,031

37 FINANCIAL REPORT FOR 1ST HALF OF FISCAL YEAR 2020/2021 FURTHER INFORMATION
* The prior-year figures for the segments have been adjusted. Please refer to chapter 05 for further information.
The non-allocated earnings contain one-time effects not re-ported in the segments that have been adjusted for operation-al comparison purposes.
Reconciliation of the segment results with consolidated net profit:
€ thousand 2020/2021 2019/2020*
EBIT of the reporting segments 265,884 255,686
EBIT of other divisions 3,171 -2,311
EBIT of thermal management business 0 4,067
Unallocated income -175,325 -27,075
Consolidated EBIT 93,730 230,367
Net financial result -5,970 -12,824
Consolidated EBT 87,760 217,543
Sales reconciliation:
€ thousand 2020/2021 2019/2020
Total sales of the reporting segments 3,118,566 3,249,004
Sales in other divisions 35,914 43,019
Sales in thermal management business 0 73,947
Elimination of intersegment sales -54,122 -52,971
Consolidated sales 3,100,358 3,312,999

38 FINANCIAL REPORT FOR 1ST HALF OF FISCAL YEAR 2020/2021 FURTHER INFORMATION
The assets classified as held for sale as at 30 November 2020 contain the proportionate carrying amount of the Mando HELLA subgroup totalling € 41,772 thousand. In the reporting period, a write-up totalling € 18,897 thousand was recognized on this investment and disclosed within other income and expenses. The HELLA Group is examining various strategic options that might lead to the disposal of the shares in the joint venture and its subsidiaries.
Over and above this, assets totalling € 2,304 thousand are clas-sified as held for sale in connection with the sale of the business with camera software to Car.Software Org (see Chapter 06).
Within the scope of optimisation of the electronics portfolio, HELLA sold the relay business to Chinese relay manufacturer Hongfa in December 2019. As a result, the assets and liabili-ties of HELLA (Xiamen) Automotive Electronics Co., Ltd., a fully consolidated subsidiary, and some assets of HELLA (Xiamen) Electronic Device Co., Ltd., a fully consolidated sub-sidiary, were reclassified to held for sale in the statement of financial position.
12 Non-current assets held for sale
11 Other receivables and non-financial assets
€ thousand 30 November 2020 31 May 2020
Other current assets 11,282 24,544
Receivables from finance leases 18,740 18,223
Insurance receivables 15,299 23,537
Positive market value of currency hedges 15,568 8,542
Subtotal other financial assets 60,889 74,846
Advance payments for services 3,273 9,478
Advance payments for insurances 21,286 10,646
Advance payments for licences 14,124 6,299
Other advance payments 23,609 25,918
Receivables for partial retirement 613 577
Advance payments to employees 2,588 3,607
Other tax receivables 65,573 75,403
Total 191,955 206,774
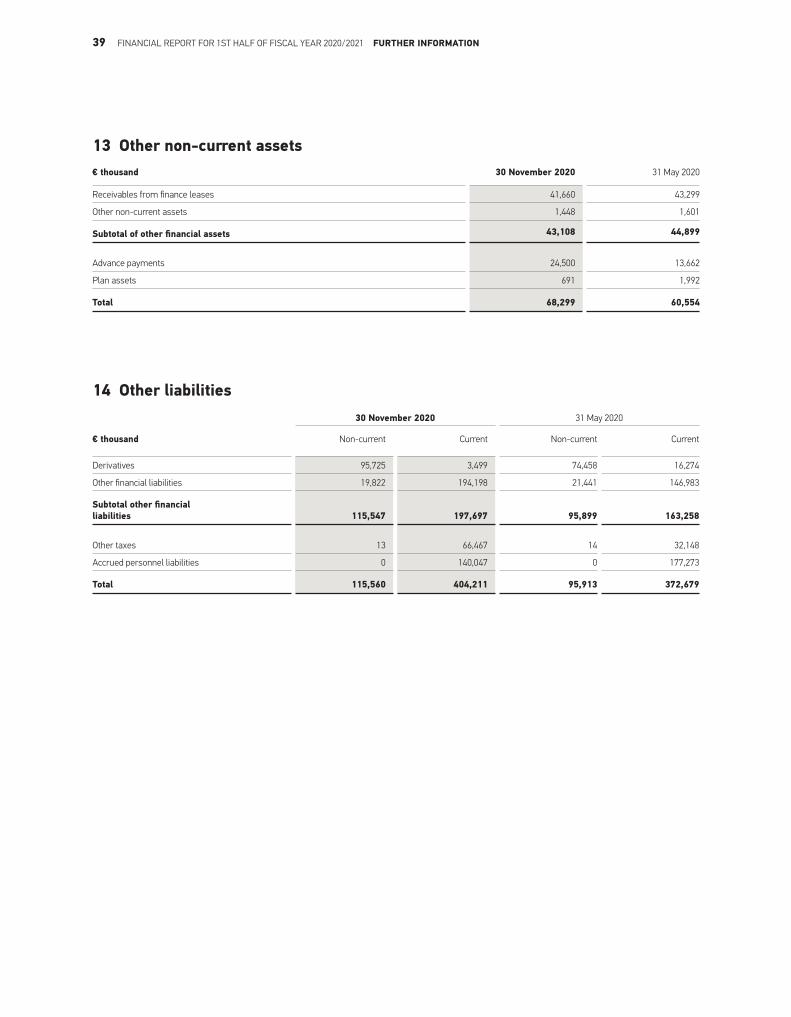
14 Other liabilities
13 Other non-current assets
39 FINANCIAL REPORT FOR 1ST HALF OF FISCAL YEAR 2020/2021 FURTHER INFORMATION
30 November 2020 31 May 2020
€ thousand Non-current Current Non-current Current
Derivatives 95,725 3,499 74,458 16,274
Other financial liabilities 19,822 194,198 21,441 146,983
Subtotal other financial liabilities 115,547 197,697 95,899 163,258
Other taxes 13 66,467 14 32,148
Accrued personnel liabilities 0 140,047 0 177,273
Total 115,560 404,211 95,913 372,679
€ thousand 30 November 2020 31 May 2020
Receivables from finance leases 41,660 43,299
Other non-current assets 1,448 1,601
Subtotal of other financial assets 43,108 44,899
Advance payments 24,500 13,662
Plan assets 691 1,992
Total 68,299 60,554

40 FINANCIAL REPORT FOR 1ST HALF OF FISCAL YEAR 2020/2021 FURTHER INFORMATION
15 Equity
On the liabilities side, nominal capital is recognised at its nomi-nal value under the "Subscribed capital" item. The nominal cap-ital amounts to € 222,222 thousand. The no-par value shares are issued to the bearer. All issued shares are fully paid up. Each share confers a right to vote and a right to dividends if distribu-tions are agreed.
In addition to “Other retained earnings/profit carried forward” and the capital reserve, “reserves and unappropriated surplus” include the differences stemming from the currency translation of the annual financial statements of foreign subsidiaries not recognised in the income statement and the impact arising from the measurement of derivative financial instruments acquired for hedging purposes also not recognised in the income state-ment, as well as the reserve for debt capital instruments (IFRS 9). Also included are the results from the remeasurement of defined benefit plans, recognised directly in equity. A detailed overview of the composition and changes in the results rec-ognised directly in equity is presented in the consolidated state-ment of changes in equity.
Actuarial losses after taxes of € 22,325 thousand were rec-ognised during the reporting period (prior year: losses after
taxes of € 24,182 thousand). The change in value of the defined benefit liabilities or of the assigned plan assets is attributable to calculation parameters and in particular the discount rate used here, which was 0.64% at the end of November 2020 (May 2020: 1.00%).
At the annual general meeting held on 25 September 2020 HELLA's shareholders passed a resolution to suspend the div-idend payment for the past fiscal year 2019/2020 (1 June 2019 to 31 May 2020). A dividend totalling € 372,222 thousand was distributed in the prior year.
The Group aims to maintain a strong equity base. The Group strives to strike a balance between a higher return on equity, which would be possible through greater external financing, and the advantages and security offered by a solid equity position. The Group is aiming for a ratio of less than 1.0 for net financial debt to earnings before interest, taxes, depreciation and amor-tisation (EBITDA) in the long term. The ratio was 0.4 on 30 No-vember 2020 (prior year: 0.2).
16 Notes to the cash flow statement
As at 31 May 2020, the cash funds comprise exclusively cash and cash equivalents.
Shares in FWB Kunststofftechnik GmbH, a company with its registered office in Pirmasens, were purchased in September 2020 for a purchase price of € 8,150 thousand. FWB has been supplying HELLA with sophisticated plastic components for many years. FWB currently has a workforce of around 180 em-ployees and generates annual sales of approximately € 20 mil-lion via its business activities in the areas of injection moulding tools, automation, plastic parts and assembly. HELLA already held a stake of 24.9% in FWB before this transaction. Through the acquisition, HELLA intends to safeguard its own supply chain in the long term and further develop FWB as a stand-alone company. Due to considerations of materiality, the com-pany was not fully consolidated in the Group.
In addition, a material portion (€ 350 million) of the loan facility drawn on in April 2020 was repaid in the reporting period and reported in payments in connection with the repayment of fi-nancial liabilities.
The presentation of interest received is adjusted for the present report. To date, these components were disclosed within net cash flow from financing activities. Interest received now being disclosed within investing activities creates a connection to securities and their cash flows which, from the Company's per-spective, constitutes a more appropriate allocation, this provid-ing more relevant and more reliable information on the Com-pany's cash flows. The change in cash and cash equivalents remains completely unaffected by this adjustment, however. This does not result in any changes to other reporting elements. The quantitative ef-fects on the reporting for the previous period are presented in the following table.

41 FINANCIAL REPORT FOR 1ST HALF OF FISCAL YEAR 2020/2021 FURTHER INFORMATION
€ thousand2019/2020 as reported Adjustments
2019/2020 adjusted
Earnings before income taxes (EBT) 217,543 0 217,543
+ Depreciation and amortisation 208,346 0 208,346
+ Change in provisions 14,295 0 14,295- Other non-cash income and cash flows not attributable to operating activities -7,368 0 -7,368
+ Losses / profits from the sale of property, plant and equipment and intangible assets 1,811 0 1,811
+ Net financial result 12,824 0 12,824
- Change in trade receivables and other assets not attributable to investing or financing activities -36,274 0 -36,274
- Increase in inventories -100,917 0 -100,917
+ Change in trade payables and other liabilities not attributable to investing or financing activities 78,262 0 78,262
+ Tax refunds received 497 0 497
- Taxes paid -41,986 0 -41,986
+ Dividends received 24,938 0 24,938
= Net cash flow from operating activities 371,971 0 371,971
+ Cash receipts from the sale of intangible assets and property, plant and equipment 6,164 0 6,164
- Payments for the purchase of intangible assets and property, plant and equipment -257,117 0 -257,117
+ Cash receipts from the sale of subsidiaries less cash and cash equivalents 1,299 0 1,299+ Repayments from loans granted to investments 3,429 0 3,429
- Payments for capital increases in investments -6,741 0 -6,741
+ Cash proceeds from the sale of investments 22,006 0 22,006
- Payments for the acquisition of companies, less cash and cash equivalents -548 0 -548- Net payments for the purchase and sale of securities -157,758 0 -157,758
+ Interest received 0 5,082 5,082
= Net cash flow from investing activities -389,267 5,082 -384,185
+ Cash receipts from the issuance of a bond 498,515 0 498,515
- Payments for the repayment of financial liabilities -39,553 0 -39,553
+ Cash receipts from changes in financial liabilities 1,490 0 1,490
+ Interest received 5,082 -5,082 0
- Interest paid -11,345 0 -11,345
- Dividends paid -372,222 0 -372,222
= Net cash flow from financing activities 81,967 -5,082 76,885
= Net change in cash and cash equivalents 64,671 0 64,671
+ Cash and cash equivalents as at 1 June 876,763 0 876,763
- Cash and cash equivalents classified as held for sale -971 0 -971
+ Effect of exchange rate changes on cash and cash equivalents 739 0 739
= Cash and cash equivalents as at 30 November 941,202 0 941,202
42 FINANCIAL REPORT FOR 1ST HALF OF FISCAL YEAR 2020/2021 FURTHER INFORMATION
17 Adjustment of special effects in cash flow
Adjusted free cashflow from operating activities was used as a performance indicator for internal HELLA Group management. Adjusted free cashflow from operating activities is a key perfor-mance indicator that is not defined in the International Financial Reporting Standards. Rather, it is reported by the HELLA Group as additional information in its financial reporting because it is also used for internal management and because, from the Company's perspective, it presents the cash flows from the operating activities – adjusted for special effects – in a more transparent form and facilitates a comparison over time.
Cash flow from operating activities after capital expenditure and cash inflows from the sale or liquidation of investments is used for this purpose and adjusted for non-recurring cash flows.
In this reporting period, free cashflow from operating activities is adjusted for payments made for restructuring measures amounting to € 12,115 thousand (prior year: € 6,753 thousand).
The shares in the Behr Hella Service joint venture were sold in the last fiscal year, which consequently means that in the cur-rent fiscal year there are no operating cash flows from the thermal management business contained in the cash flow statement. The prior year was correspondingly adjusted for portfolio effects to take account of operating components amounting to € -4,067 thousand. In the current fiscal year, the free cashflow from operating activities is adjusted to take ac-count of the dividend of € 4,955 thousand attributable to the period which was collected in the form of a subsequent pur-chase price adjustment.
The shares in HSL Electronics Corporation, a joint venture, were sold in the last fiscal year. The free cashflow from operating activities for the prior year is adjusted for the tax payments made in connection with the sale amounting to € 2,370 thou-sand.

43 FINANCIAL REPORT FOR 1ST HALF OF FISCAL YEAR 2020/2021 FURTHER INFORMATION
The performance of the adjusted free cash flow from operating activities for the first six months of fiscal year 2020/2021 is shown in the following table:
€ thousand2020/2021 as reported Adjustment
2020/2021 adjusted
Earnings before income taxes (EBT) 87,760 175,325 263,084
+ Depreciation and amortisation 182,954 0 182,954
+/- Change in provisions 178,069 -161,330 16,739
- Other non-cash income and cash flows not attributable to operating activities -44,593 0 -44,593
+/- Losses / profits from the sale of property, plant and equipment and intangible assets 462 0 462
+ Net financial result 5,970 0 5,970
+/- Change in trade receivables and other assets not attributable to investing or financing activities -443,699 0 -443,699
- Increase in inventories -1,613 0 -1,613
+/- Change in trade payables and other liabilities not attributable to investing or financing activities 272,663 -1,880 270,783
+ Tax refunds received 19,184 0 19,184
- Taxes paid -30,363 0 -30,363
+ Dividends received 647 4,955 5,602
= Net cash flow from operating activities 227,442 17,070 244,512
+ Cash receipts from the sale of intangible assets and property, plant and equipment 9,247 0 9,247
- Payments for the purchase of intangible assets and property, plant and equipment -270,377 0 -270,377
= Free cash flow from operating activities -33,687 17,070 -16,617

44 FINANCIAL REPORT FOR 1ST HALF OF FISCAL YEAR 2020/2021 FURTHER INFORMATION
18 Disclosures on financial instruments
The carrying amounts and fair values of classes of financial instruments and the carrying amounts in accordance with IFRS 9 measurement categories as at 30 November 2020 and 31 May 2020 are set out below.
The performance of the adjusted free cash flow from operating activities for the first six months of fiscal year 2019/2020 is shown in the following table:
€ thousand2019/2020 as reported Adjustment
2019/2020 adjusted
Earnings before income taxes (EBT) 217,543 23,008 240,550
+ Depreciation and amortisation 208,346 0 208,346
+/- Change in provisions 14,295 -19,425 -5,131
- Other non-cash income and cash flows not attributable to operating activities -7,368 0 -7,368
+/- Losses / profits from the sale of property, plant and equipment and intangible assets 1,811 0 1,811
+ Net financial result 12,824 0 12,824
+/- Change in trade receivables and other assets not attributable to investing or financing activities -36,274 0 -36,274
- Increase in inventories -100,917 0 -100,917
+/- Change in trade payables and other liabilities not attributable to investing or financing activities 78,262 -827 77,435
+ Tax refunds received 497 0 497
- Taxes paid -41,986 2,301 -39,685
+ Dividends received 24,938 0 24,938
= Net cash flow from operating activities 371,971 5,056 377,027
+ Cash receipts from the sale of intangible assets and property, plant and equipment 6,164 0 6,164
- Payments for the purchase of intangible assets and property, plant and equipment -257,117 0 -257,117
= Free cash flow from operating activities 121,017 5,056 126,074

45 FINANCIAL REPORT FOR 1ST HALF OF FISCAL YEAR 2020/2021 FURTHER INFORMATION
€ thousand
Measurement category
under IFRS 9
Carrying amount
30 Nov 2020
Fair value 30 Nov
2020
Carrying amount
31 May 2020Fair value
31 May 2020
Fair value hierarchy
Cash and cash equivalents Amortised cost 802,301 802,301 1,202,794 1,202,794
Trade receivables Amortised cost 1,050,653 1,050,653 596,356 596,356
Financial assets
Equity instruments FVPL 157,285 157,285 125,184 125,184 Level 1
Debt capital instruments FVOCI 263,271 263,271 305,897 305,897 Level 1
Loans Amortised cost 7,149 7,149 4,101 4,101
Other bank balances Amortised cost 7,696 7,696 10,448 10,448
Other financial assets
Derivatives used for hedging n.a. 14,988 14,988 4,761 4,761 Level 2
Derivatives not used for hedging FVPL 580 580 3,781 3,781 Level 2
Other receivables associated with financing activities Amortised cost 45,321 45,321 66,304 66,304
Current financial assets 2,349,244 2,349,244 2,319,626 2,319,626
Financial assets
Equity instruments FVPL 39,395 39,395 27,261 27,261 Level 3
Debt capital instruments FVPL 23,045 23,045 23,070 23,070 Level 2
Loans Amortised cost 1,317 1,317 1,481 1,481 Level 2
Other receivables associated with financing activities Amortised cost 48 48 55 55 Level 2
Other financial assets
Trade receivables Amortised cost 43,108 43,108 44,899 44,899 Level 2
Non-current financial assets 106,913 106,913 96,766 96,766
Financial assets 2,456,156 2,456,156 2,416,393 2,416,393
Financial liabilities
Financial liabilities to banks and bond Amortised cost 120,872 120,872 472,294 472,294
Trade payables Amortised cost 711,579 711,579 601,793 601,793
Other financial liabilities
Derivatives used for hedging n.a. 3,435 3,435 15,982 15,982 Level 2
Derivatives not used for hedging FVPL 64 64 292 292 Level 2
Other financial liabilities Amortised cost 194,198 194,198 146,983 146,983
Current financial liabilities 1,030,148 1,030,148 1,237,345 1,237,345
Financial liabilities
Financial liabilities to banks Amortised cost 256,647 319,289 273,882 333,007 Level 2
Bonds Amortised cost 894,079 920,910 898,312 865,231 Level 1
Other financial liabilities
Derivatives used for hedging n.a. 95,725 95,725 74,458 74,458 Level 2
Derivatives not used for hedging FVPL 0 0 0 0 Level 2
Other financial liabilities Amortised cost 19,822 19,822 21,441 21,441
Non-current financial liabilities 1,266,274 1,355,746 1,268,093 1,294,137
Financial liabilities 2,296,422 2,385,894 2,505,437 2,531,482

46 FINANCIAL REPORT FOR 1ST HALF OF FISCAL YEAR 2020/2021 FURTHER INFORMATION
Notes on the abbreviations used:FVPL: Fair Value through Profit or Loss.
FVOCI: Fair Value through Other Comprehensive Income, with reclassification to profit or loss.
Level 1: The valuation technique used for financial assets and financial liabilities measured at fair value depends on the avail-able inputs. If quoted prices can be accessed for identical assets in active markets, those prices are used to measure fair value.
Level 2: If this is not possible, fair value is measured using the fair values of comparable market transactions as well as finan-cial methods based on observable market data.
Level 3: Fair values not based on observable market data are measured using generally recognised financial modelling methods or observable achievable prices from recent qualified funding rounds while taking account of the entity's life and de-velopment cycle.
The Group reports possible transfers between different levels of the fair value hierarchy at the end of the reporting period in which the change occurred. As in the prior year, no transfers
were made between different levels of the fair value hierarchy during the current 2020/ 2021 reporting period. The carrying amounts of current financial instruments at the balance sheet date correspond to the market value owing to their short resid-ual term and the fact that they are recognised at market value.
Non-current financial instruments on the assets side are main-ly determined by the other investments, securities as cover assets for pension provisions and loans. The fair values of these shares of equity measured at acquisition costs could not be determined as no stock exchange or market prices were available. The long-term equity instruments are interests in other entities and non-consolidated affiliates, are recognised as FVPL and measured at cost because the fair values cannot be reliably determined.
19 Events after the balance sheet date
No events or developments occurred after the end of the fiscal half-year that could have led to a material change to the recog-nition or the valuation basis of individual assets or liabilities as at 30 November 2020 or that would have had to be reported.
€ thousand
Carrying amount
30 Nov 2020
Fair value
30 Nov 2020Carrying amount
31 May 2020Fair value
31 May 2020
Of which aggregated under IFRS 9 measurement categories:
Financial assets
FVPL 220,305 220,305 179,296 179,296
Amortised cost 1,957,592 1,957,592 1,926,439 1,926,439
FVOCI 263,271 263,271 305,897 305,897
Financial liabilities
Amortised cost 2,197,197 2,286,670 2,414,705 2,440,750
FVPL 64 64 292 292

47 FINANCIAL REPORT FOR 1ST HALF OF FISCAL YEAR 2020/2021 FURTHER INFORMATION
Hella Geschäftsführungsgesellschaft mbH
Lippstadt, 6 January 2021
The Managing General Partner of HELLA GmbH & Co. KGaA
Dr. Frank Huber
Bernard Schäferbarthold
Dr. Rolf Breidenbach(Chairman)
Björn Twiehaus
Dr. Lea Corzilius

48 FINANCIAL REPORT FOR 1ST HALF OF FISCAL YEAR 2020/2021
To the best of our knowledge, the interim consolidated financial statements give a true and fair view of the net assets, financial position and results of operations of the Group in accordance with applicable accounting principles and the interim Group management report includes a true and fair review of the de-velopment and performance of the business and the position of
the Group, together with a description of the principal opportu-nities and risks associated with the expected development of the Group.
Lippstadt, 6 January 2021
RESPONSIBILITY STATEMENT on the interim consolidated financial statements and interim Group management report of HELLA GmbH & Co. KGaA as at 30 November 2020
Dr. Frank Huber
Bernard Schäferbarthold
Dr. Rolf Breidenbach(Chairman)
Björn Twiehaus
Dr. Lea Corzilius

HELLA GmbH & Co. KGaARixbecker Straße 7559552 Lippstadt/GermanyTel. + 49 2941 38 - 0Fax + 49 2941 38 - 71 [email protected]
© HELLA GmbH & Co. KGaA, Lippstadt